
Submitted:
09 August 2025
Posted:
11 August 2025
You are already at the latest version
Abstract
This study investigates the behaviour of dense clayey and silty sands with kaolinite clay under static drained/undrained conditions at low confining stress. Conventional laboratory tests assessed the mixtures’ physical properties, but standard void ratio methods proved inadequate for silty sands with clay. Despite targeting 80% relative density, specimens exhibited loose sand behaviour in both drained and undrained tests. Analytical redefinition of minimum/maximum void ratios (based on sand-clay volumetric fractions) improved specimen reconstitution, yielding dense behaviour matching host sand performance. However, these methods are limited to non-expansive, low-plasticity clays. Void ratios in clayey silty sands depend on confining stress, drainage, saturation, clay content, and sand skeleton structure. Unlike pure sands, these mixtures experience variable void ratios due to clay phase changes under different saturation levels. A new evaluation method is needed, accounting for clay composition, saturation-dependent consistency, and initial sand skeleton configuration to accurately characterise these soils. The findings highlight the limitations of conventional approaches and stress the need for advanced frameworks to model complex soil behaviour in geotechnical applications.
Keywords:
silty sand
; kaolinite
; void ratio redefinition
; relative density
; static undrained test
; low confining stress
; specimen reconstitution
1. Introduction
The conventional understanding of soil behaviour generally focuses on the individual behaviour of coarse-grained, granular soils (sands and gravels) and fine-grained (fines), cohesive silts and clays. However, the monotonic behaviour of transitional, silty sands is still a subject of ongoing research [1,2,3,4,5,6,7]. It was shown that in silty sands, below the fines threshold content where the interparticle stress transfer should still be governed by sand skeleton structure, the fines affect both drained and undrained soil behaviour [1,8,9,10,11,12]. The fines interact with the sand skeleton structure by sticking to the sand grains’ surfaces, filling the existing pore spaces, and forming narrow “bridges” between the sand grains [13,14]. This affects silty sand behaviour differently, considering the variations in fines and sand particle sizes and shapes, mineral composition, sandy soil’s relative density, and outer conditions like governing effective stresses or draining conditions. The behaviour of granular soils is mostly influenced by their texture (particle size distribution and shape) and relative density [13,14]. In contrast, the behaviour of fine-grained soil is influenced by its structure, which is conditioned by clay mineral fabric (particles’ geometric arrangement) and interparticle forces. The interparticle shape and distribution of pores are mainly conditioned by clay mineralogy and the amount and angularity of the present silt fraction. Fine-grained fractions’ behaviour and strength depend on the soil’s consistency or firmness, conditioned with clay mineralogy, particle size distribution, and the corresponding Atterberg limits. Unlike granular soil, fine-grained soil’s characteristics vary significantly with the water content. Also, the gravels, sands, and silts are represented by equidimensional particles, while the clay particles are mostly shaped like plates, elongated flakes or needles. This effect influences the stress-related orientation of particles, causing different soil behaviour in different effective stress directions [14].
1.1. Research Overview
The present research focuses on silty sand soil behaviour under static drained and undrained conditions and low confining stress, using the reconstituted specimens artificially made with uniform quartz sand and kaolinite silt as fines fraction. Silty sand mixtures are reconstituted for monotonic compression tests in the triaxial apparatus. Taking undisturbed samples for the triaxial shear tests is complicated in relatively cohesionless sandy soils, and the silty sand specimens are usually reconstituted using representative natural soil sediments or artificial mixtures. Soil reconstitution enables the specimen’s relative density control, while in the artificial mixtures, it additionally enables control over particle sizes and shapes, fines content, and specimen mineral composition. Soil mixtures tested within the present research are evaluated as granular materials (sands) since they were reconstituted below the fines threshold content [15,16,17]. Determination of silty sand soils’ physical-mechanical properties is challenging due to the differences in the sand and fines characteristics and their mixtures’ characteristics deviation from the conventional soil mechanics. Existing research [18,19] used the identical soil mixtures as within the present research and implemented standard laboratory tests [20,21] to determine the mixtures’ minimum and maximum void ratios, which were later used in physical modelling. However, existing standards limit the testing to silty sand mixtures with non-plastic fines and free-draining conditions. Contrary to these limitations, kaolinite clay exhibits plasticity, while its hydrophilic properties contradict free-draining properties. Therefore, standard methods should be inapplicable for determining the minimum and maximum void ratios of silty sands with clay minerals. To evaluate the validity of previously determined void ratios [18,19], the mixtures’ physical characteristics were determined with laboratory tests, implementing some existing modifications and recommendations [1,22] for otherwise conventional sandy soil characteristics determination methods. The equivalent void ratio and relative density [15,16] for mixtures tested were also evaluated within this research. Alternatively, the existing suggestions for the analytical redefinition of the mixtures’ minimum and maximum void ratios [23,24] were used to reconstitute another set of specimens for testing. Both sets were tested in monotonic compression, and the data obtained were correlated and evaluated. Special focus was given to the physical-mechanical properties of the reconstituted specimens and their response to drained and undrained, strain-controlled shearing.
1.2. Void Ratio and Relative Density for Sands
Phase or volumetric relations represent an idealised and simplified interaction between the solids (soil), fluids (usually water) and gas (usually air) within a given specimen. Any arbitrary volume of sandy soil will consist of both solids and pores, with the pores being filled with water, air or both. Phase relations within an arbitrary specimen are graphically presented in Figure 1, with mass and volume ratios for individual media within a soil (solid, fluid, gas).
Phase relations define the void ratio, representing the important physical-mechanical soil parameter that defines the specimen volume change and relative density of the granular soil. The void ratio dependence on water content and saturation degree is expressed with (1).
where: e stands for global void ratio, is the degree of saturation, w is the water content, and is the specific gravity of solids.
General control within reconstituted granular material (sand) can be achieved with a targeted relative density () as a relative position between the minimum and maximum void ratios (the densest and loosest possible soil states, respectively) (2).
where: is the relative density, e is the specimen’s void ratio (global void ratio), is the specimen’s minimum void ratio, and is the specimen’s maximum void ratio.
With the known total volume and specific gravity of the reconstituted specimen, one can easily determine the sand fraction mass for a given water content using the conventional phase relations. Sand parameters like minimum and maximum void ratios and specific gravity can be obtained by conducting simple laboratory tests [14,25]. The targeted sand specimen’s density has a firm theoretical and practical background and can also be evaluated by comparing it with the existing research on similar sandy soils.
1.3. Equivalent Void Ratio and Relative Density for Silty Sands
Previous studies [1,2] indicate that a portion of fines in silty sands tends to fill the voids in the sand skeleton structure, consequently lowering the overall void ratio of the soil mixture. On the other hand, a portion of fines also forms “bridges” between sand grains, actively participating in soils’ structural force transfer, separating sand grains and increasing the host sand’s void ratio [15]. The effect of fines content on silty sands’ void ratio variations is schematically presented in Figure 2 and Figure 3.
According to [1], within fine sand and silt regions with non-spherical particles, friction, adhesion, and bridging between the fine particles form structures controlled by interparticle forces. Increasing angularity enhances the particle bridging effects and produces higher void ratios than equivalent spheres. Van der Waals attraction and double-layer repulsion in clay minerals and aggregates compete with gravitational forces to control the packing mechanisms and arrangements. These forces are dependent on the distance between the particles and are further enhanced in water, where the buoyed particles may pack more loosely than under dry conditions. Previous research [16,26] suggested analytical approaches to solve these issues, which continue to be successfully implemented for the silty sand relative density approximation [7,17,27]. The skeleton void ratio given by Equation (3) [2] and the equivalent void ratio by Equation (4) [15,16,26] were introduced as an approximation of the void ratio of silty sands at low fines content.
where is the skeleton void ratio, is the fines content, and e is the global void ratio.
where: is the equivalent void ratio, b is the embedding coefficient.
The embedding coefficient (b) represents the fines fraction participating in the granular force structure. Theoretically, if (b=0), all the fines are inactive as they fill the host sand pore spaces. Alternatively, (b=1) indicates that all the fines participate in the granular force structure. It should be noted that additional research [3,28] pointed out the dependency of the (b) coefficient value on the fine content and state of the mixture. This also indicates the possible dynamic changes in the b coefficient value with changes in the silty sands’ relative density and governing confining stresses. The determination of the (b) coefficient and fines threshold was given by Equations (5) and Equation (9), respectively.
where is the particle size ratio, r is the ..., k is the ..., is the size of the particle at 10% passing from sand distribution and is the size of the particle at 50% passing from silt distribution.
where and for .
However, the equivalent void ratio determination method with the embedding coefficient given by [16] presented in Equations (5) and (9) was calibrated on the non-plastic, semi-spherical silty sand specimens. The specimens tested within the present research consisted of subangular uniform sand and platy kaolinite clay particles. Additionally, the value of the particle size ratio () was 46, which falls beyond the applicable range for the and values given in Equation (9). For these reasons, the existing equivalent void ratio method proved inapplicable for mixtures tested within the present research.
1.4. Alternative Void Ratios
As mentioned, it was shown that the fines influence the sands’ void ratios, conventionally determined with standardised testing procedures and phase relations [2,29,30]. An analytical approach to redefine the silty sands’ minimum and maximum void ratios has been introduced [23,24] and evaluated by researchers [24,31]. To determine the minimum void ratio for various silty sand mixtures in the sand grain packing structure domain, the analytical approach uses the mixtures’ volume content of sand and fines individually, with their corresponding minimum void ratios in a simple relation by Equation (10).
where: is the redefined minimum void ratio of the mixture; is the minimum void ratio of the sand fraction; is the minimum void ratio of the fines fraction; is the volume content of the sand fraction; is the volume content of the fines fraction; a is the filling coefficient.
In contrast to the embedding coefficient (b), the filling coefficient (a) represents the fines fraction filling the sand skeleton pore spaces. If () all the fines are inactive as they fill the host sand pore spaces, while () indicates that all the fines participate in the granular force structure. The predictions for a coefficient values were calculated and experimentally evaluated for various sand-silt mixtures [23] . The condition corresponds to the limiting case where the size of small particles is much smaller than the size of large particles. This relation is schematically shown and described in the microstructure and soil behaviour framework [15] as case I, Figure 3, with the given condition of mean particle sizes of sand and fines for spherical particles, and . For comparison, the mean particle size ratio for the mixtures tested within the present research was . Regarding the particle sphericity or angularity, it was shown that angular particles enhance the particle bridging on the void ratios of clean sand with non-spherical particles and consequently tend to produce higher void ratios than equivalent spheres [29], which can schematically be represented as cases II and III, Figure 3.
Considering the linear relationship between the and , an Equation (11) for the redefined maximum void ratio was also given by [24].
This analytical method was used within the present research to determine an alternative minimum and maximum void ratios for the silty sand mixtures. Using the alternative void ratios, the mixtures were further reconstituted and tested.
2. Methodology
The soil mixtures’ characteristics and parameters are essential to establish solid control over the tests. These can be determined by simple laboratory tests combined with existing theoretical relations. To reevaluate the mixtures’ previously determined void ratios [18,19], the conventional laboratory tests [20,21] were performed, incorporating some existing modifications and recommendations [22,29]. Additional mixtures were reconstituted using the analytically determined alternative void ratios (Chang et al., 2015, 2016). Reconstituted specimens were tested in monotonic compression, and the data obtained were correlated with existing research and evaluated.
2.1. Silty Sand Mixtures
2.2. Physical Properties Determination
2.2.1. Specific Gravity, Granulometric Analysis
The soil mixtures’ specific gravity and granulometric analysis were adopted from the existing research data [32,33]. The previous research data are briefly described below. The conventional pycnometer technique [35] and the combined sieve and hydrometer analysis [36] were used to determine the silty sands’ specific gravity and particle size distribution, respectively. The particle size distribution results obtained for the SK10 and SK15 mixtures with host sand and kaolinite are presented in Figure 4 and the existing results from previous research are presented in Table 2.
2.2.2. Conventional Minimum and Maximum Void Ratio Determination
Both minimum and maximum void ratios of sands are used with the soil’s phase relations to define the soil mass amount needed to achieve the targeted density within a given volume. By implementing some existing modifications and suggestions to conventional laboratory tests [22,29], an attempt was made to determine the mixtures’ minimum and maximum void ratios. The host sand void ratios’ values were adopted from previous research [37]. According to the existing research, using cylindrical molds of different volumes that ranged from 31 to 2000 for minimum and maximum void ratios determination produced consistent void ratio values. The alternative cylindrical mold with a volume of 196.35 , a height of 10 cm, and 50 mm in diameter was used to determine the minimum and maximum void ratio. The rest of the determination process was conducted according to [22,29]. For the maximum void ratio determination, the dry soil of constant mass was poured from zero height through a funnel into a cylindrical mold. After careful soil surface levelling, the height difference between the soil surface and the top of the cylindrical mold was measured with the caliper. Similarly, for the minimum void ratio determination, the dry soil of constant mass was poured into a cylindrical mold and densified. The densification process included 1000 strikes with an 80 g wooden handle, 2 cm in diameter. Strikes were done perpendicularly at the four sides of the cylindrical mold at its base. In other words, the soil was densified with 4 sets of strikes, with 250 strikes per set, turning the cylindrical mold by 90° after each set. Again, the height difference between the soil surface and the top of the cylindrical mold was measured with the caliper. The height difference enabled the calculation of the minimum and maximum void ratio using “phase relations”. As mentioned, the existing standards limit the testing to silty sand mixtures with non-plastic fines and free-draining conditions, and should be inapplicable for silty sands with clay minerals. These tests were performed within the present research to evaluate the validity of void ratios used in previous research [18,19]. The plastic and liquid limits were used to determine the minimum and maximum void ratio of the kaolinite (SK100) specimen. The liquid limit represents the highest void ratio and water content in the clay fraction at which the soil behaves as a solid. The shrinkage limit theoretically represents the lowest clay volume in fully saturated conditions. Existing researchers [38,39] have determined that the shrinkage limit approximates the plastic limit for kaolinite samples. Additionally, according to [40], the plastic limit is the result of either cavitation or air entry, resulting in the water phase ceasing to act as a continuum within the soil thread. For these reasons, the plastic limit value was used to define the minimum void ratio of kaolinite used in mixtures. The kaolinite plastic and liquid limits were adopted from the existing research [32,33] and presented in Table 2).
2.2.3. Alternative Minimum and Maximum Void Ratio Determination
The alternative minimum void ratios for the SK10 and SK15 mixtures were analytically determined using Equation (10), [23]. The determination procedure involved the calculation of the individual sand and fines fractions’ volume contents and their corresponding minimum and maximum void ratios. Since the mixtures’ void ratios could not be validated experimentally, a different approach was used to determine the representative filling coefficient (a). Based on the existing test data [23], the filling coefficients (a) are fitted by a power function of particle size ratio , Equation (14). The limiting cases are given with at , and at .
where p is the fit parameter.
The best-fit curve with the corresponding p-value was obtained using the complete available data set. With the obtained a coefficient and corresponding minimum void ratio, the maximum void ratio could be obtained using the obtained parameters and with Equations (11), (12), and (13) [24]. Specimens reconstituted this way were further evaluated with the triaxial test results and correlated with the conventionally reconstituted specimens’ test results.
2.3. Monotonic Compression
2.3.1. Triaxial Testing System
The silty sand mixtures drained and undrained static behaviour was tested with an automated triaxial system. Triaxial tests were performed at the University of Rijeka, Faculty of Civil Engineering’s Geotechnical Laboratory. The triaxial system, shown in Figure 5, is manufactured by Wyckeham Farrance, Controls Group, and equipped with a computer-controlled system for easy test performance [41]. The triaxial testing system used in this study included a (Figure 5(a)) loading frame, a triaxial cell that can withstand pressures up to (Figure 5(b)), and a submerged-type load cell (Figure 5(c)) for precise force measurement under saturated conditions. The triaxial system uses transducers to measure cell (Figure 5(d)) , pore (Figure 5(e)), and back pressures (Figure 5(f)) during the saturation, consolidation, and shear phases. The vertical linear variable displacement transducer (LVDT) (Figure 5(g)) measured the vertical displacement during the test. Volumetric change was monitored with the volume change device (Figure 5(h)). Membrane corrections were incorporated into the analysis [42,43].
2.3.2. Sample Preparation Method
Two sets of silty sand mixtures with changing fines content were reconstituted at 80% relative density for triaxial testing. The first set, including the host sand, was reconstituted using void ratios determined by conventional methods and recommendations used for sands and silty sands [22,29] . Another set of SK10 and SK15 mixtures was reconstituted using analytically determined alternative void ratios [23,24]. Test results were correlated and evaluated. For easier evaluation, the mixtures reconstituted using conventional determination methods will be referred to as "A-mixtures", and the mixtures reconstituted using alternative void ratios will be referred to as "B-mixtures". The specimens were reconstituted within a latex membrane in a cylindrical mold of 50 mm in diameter and 100 mm in height Figure 5. The undercompaction method [45] was used. This moist tamping method ensures continuous density throughout the sample size and reduces particle segregation, thus providing repeatable and comparable test results. Undercompaction degree of 5% was implemented in the specimen preparation. The soil mixtures were reconstituted at targeted water content and compacted in 10 layers of the same mass. The height of each layer was controlled with a standard laboratory caliper.
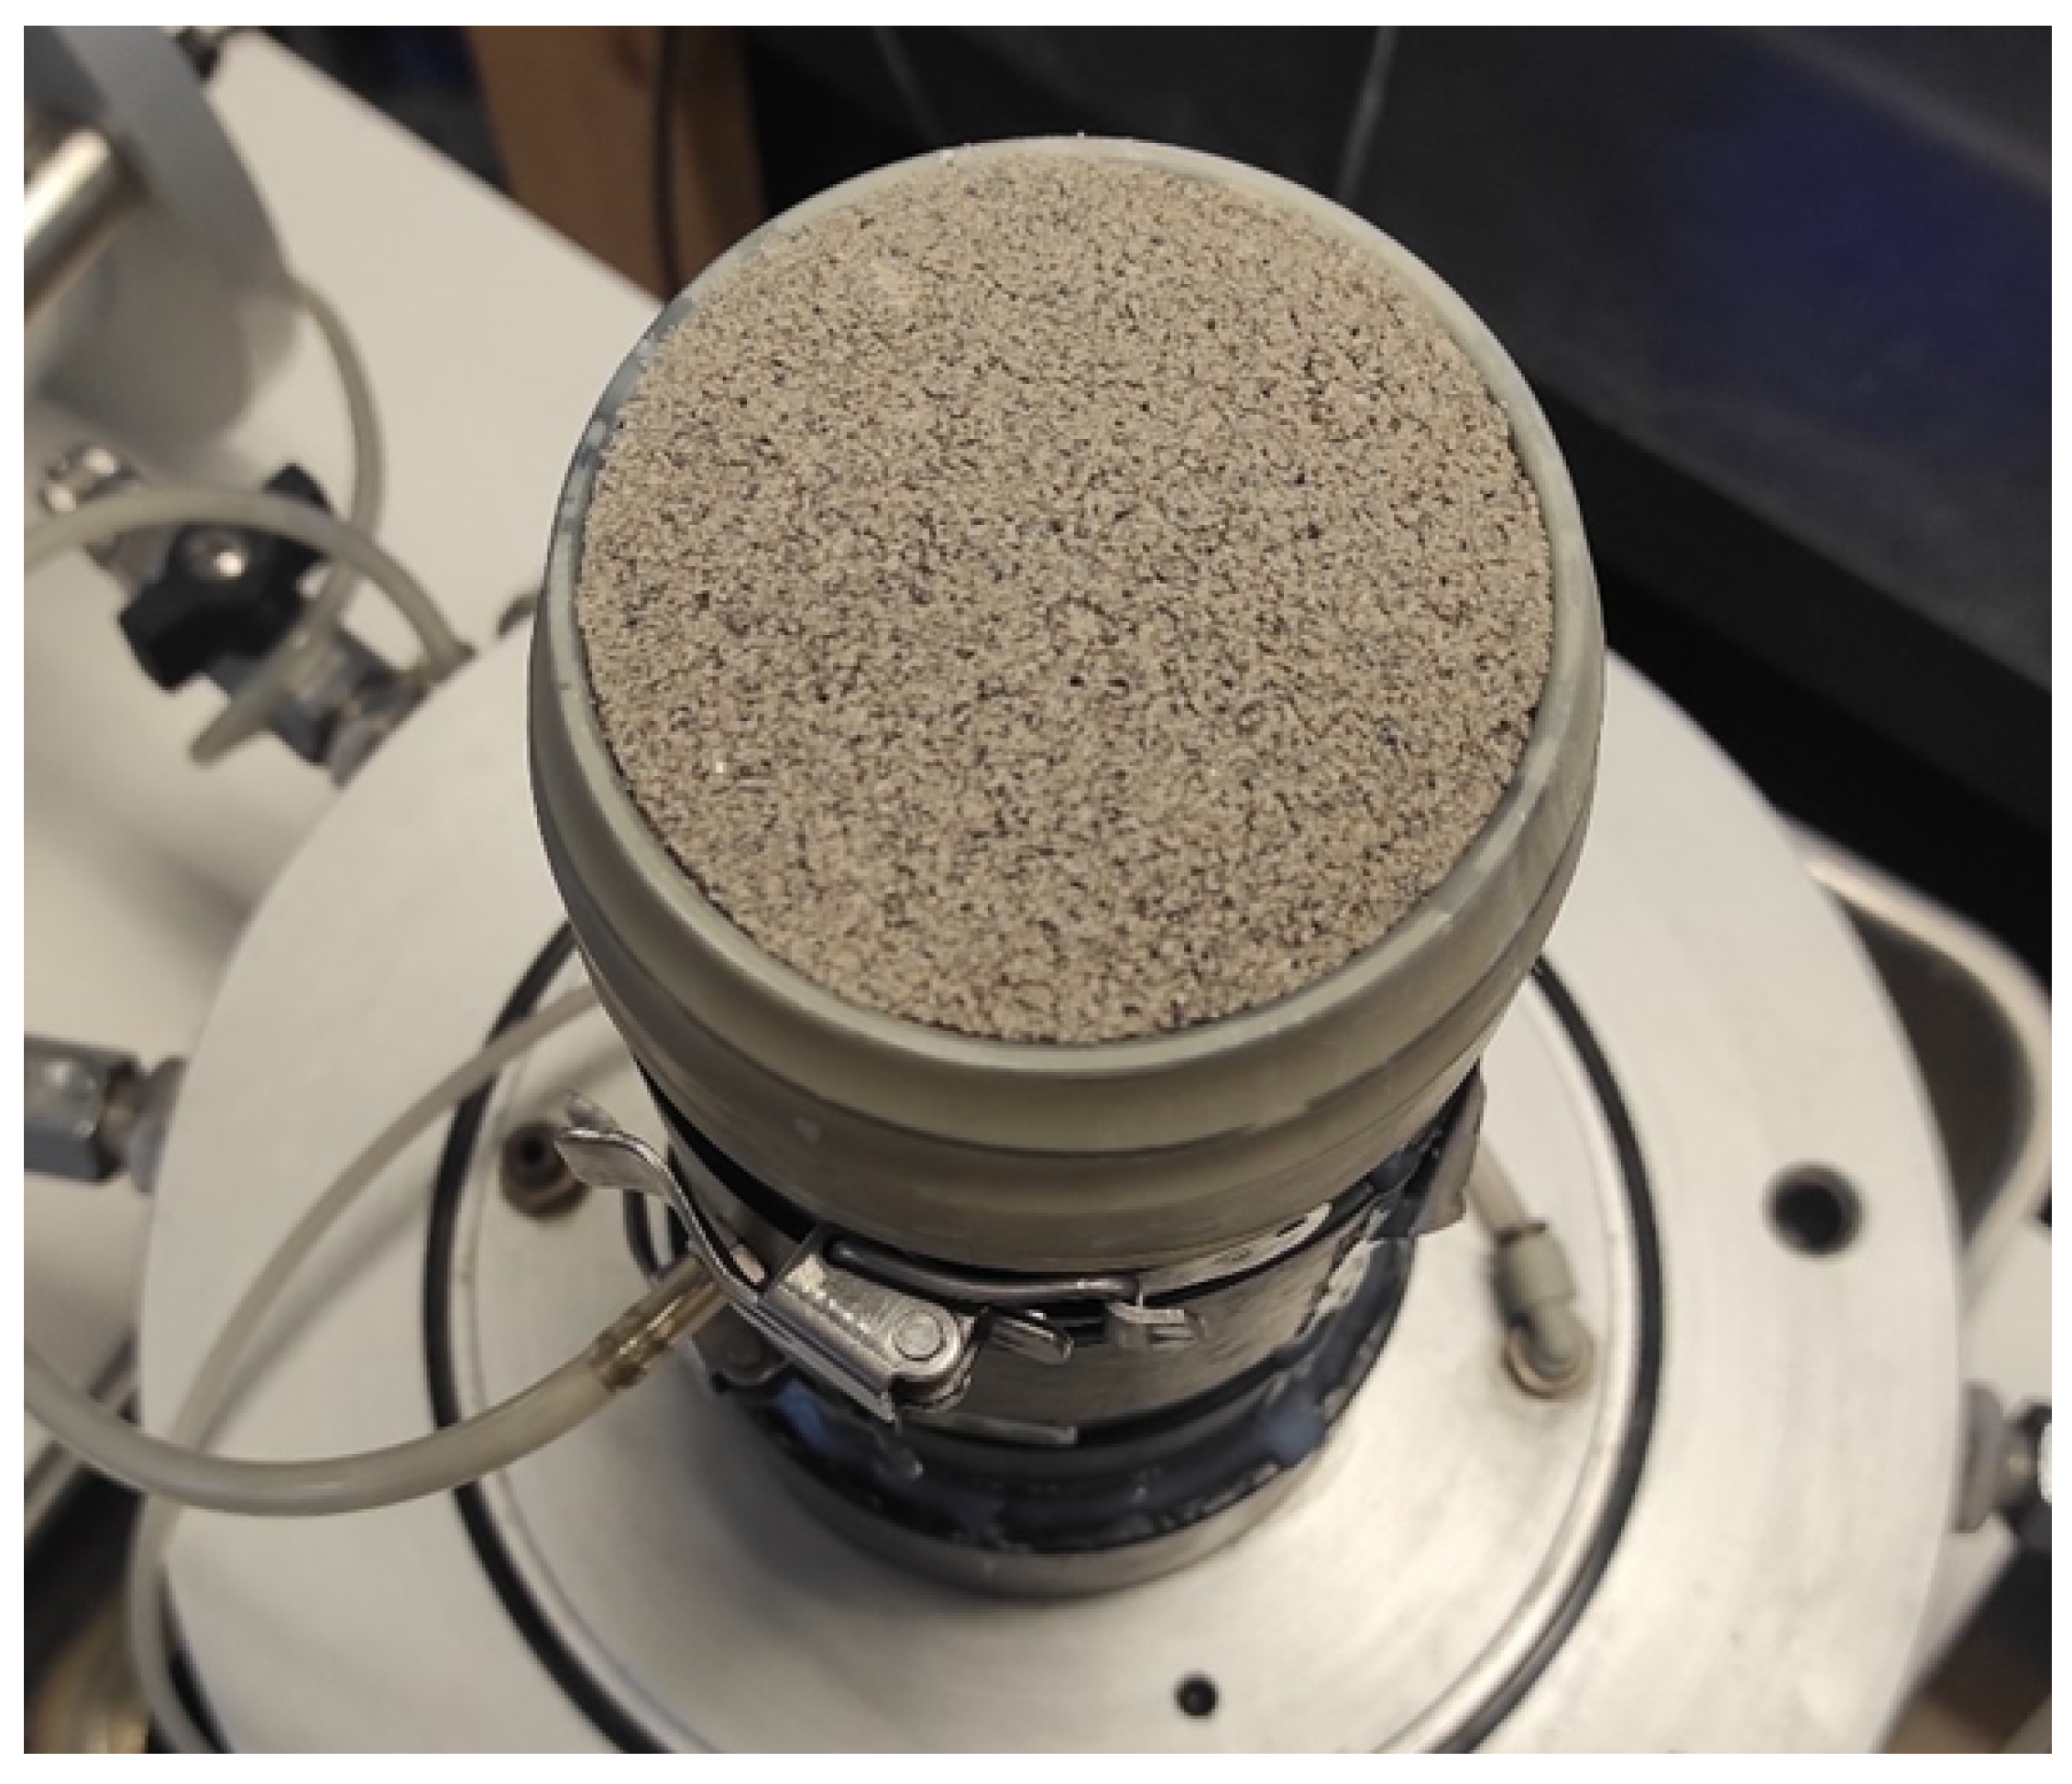
Figure 6.
Prepared sample for monotonic triaxial test
2.3.3. Triaxial Testing Program
The reconstituted specimens were tested with the triaxial compression test in drained and undrained conditions, under two different initial confining stresses, 25 and 50 kPa. All tests were performed as strain-controll tests. The triaxial testing program is summarised in Table 3.
Before the start of the tests, the reconstituted specimens were saturated in three steps: percolation with , percolation with de-aired water. Saturation was perforemd in the back pressure increments. By utilising lower values of back pressure, specimens were subjected to the flow for 15-30 min according to the existing suggestions [41]. After the percolation with , specimens were percolated with de-aired water until the water visibly started to be pushed out of the specimens. The saturation was performed in several stages by successive increases of cell and back pressure increments. The degree of saturation was monitored with Skempton’s B coefficient [42,46]. After reaching Skempton’s B coefficient value B=0.99 the sample is considered fully saturated and can be consolidated. For all tests performed, the isotropic consolidation was performed in a single stage since the targeted effective stresses of 25 and 50 kPa represent low confining stresses, with low resulting hydraulic gradients during consolidation. The technique of slow drainage valve opening was used here as in other research by authors [41,47,48] to reduce the effect of the unfavourable increase in hydraulic gradient during saturation and consolidation. As mentioned, the reconstituted specimens were tested with the triaxial compression test in drained and undrained conditions, under two different initial confining stresses: 25 and 50 kPa. Strain-controlled tests were performed to evaluate the tested silty sands’ drained and undrained behaviour at constant relative density but different initial confining stresses. The monotonic shearing (compression) stage was performed at a 4% per hour axial strain rate.
3. Results and Discussion
3.1. Conventional Minimum and Maximum Void Ratio
The cylindrical mold with a volume of , a height of , and in diameter, was used to determine the minimum and maximum void ratio of the host sand and "A-mixtures" tested. The determination procedure was conducted according to [22,29]. The plastic and liquid limits were used with existing relations Equation 1 to determine the minimum and maximum void ratio of the kaolinite (SK100) specimen. The host sand (SK0) void ratios’ values were adopted from previous research [37]. Conventionally determined minimum () and maximum () void ratios for tested soils are presented in Table 4.
A visible segregation of kaolinite particles was present while performing the minimum void ratio determination tests on the A-mixtures. During the densification process, kaolinite particles began to surface through the soil mixture and cover the top layer in the testing mold. This is caused by electrostatically charged large area surfaces of platy kaolinite particles, which overcome the gravitational forces in the process. The dry testing condition enables free movement of the microscopically small kaolinite particles, and vibration causes the kaolinite particles’ large and negatively charged surfaces to come in contact and repel each other. Within the laterally confined mold and continuously densified sand fraction, the kaolinite particles that overcome gravitational forces gradually segregate upwards to the specimen’s surface. Observations on using the conventional tests [20,21] for silty sands with clay minerals relate well to the inapplicability of these testing procedures for such mixtures, even within the sand-dominated soil structure. This also implies the mis-calculated targeted relative density within the present and the existing research [18,19].
3.2. Alternative Minimum and Maximum Void Ratios
The existing analytical approach [23,24] was used to redefine the mixtures’ minimum and maximum void ratios. The minimum void ratio is obtained by determining the mixture’s specific parameters a and p using the Equation 14. Since the mixtures’ void ratio values could not be physically determined (as previously discussed with the conventional determination method for minimum and maximum void ratio), the complete available data set [23] was used to obtain the best-fit curve with the corresponding p parameter and a coefficient Figure 7.
With the obtained p parameter, the a coefficient, and the corresponding minimum void ratio, the maximum void ratio Equation (11) was obtained using the parameters Equation (12) and Equation (13), [24]. The values of determinated B-mixtures parameters used for alternative void ratios determination are presented with Table 5.
The value of the filling coefficient , approximates the limiting case condition with all the fines filling the host sand pore spaces, and none participating in the mixture’s structure. This condition can also be identified as the intergranular [2] or the skeleton [3] void ratio. It relates well to case I condition Figure 3, with the mean particle sizes of sand and fines for spherical particles, and ,15], and to the filling coefficient’s power trend relation to a particle size ratio Figure 7. The obtained alternative (B-mixtures) void ratios are presented and compared to the conventionally determined (A-mixtures) void ratios are presented in Table 6.
It can be observed that the alternative void ratio values are significantly lower than the conventionally determined ones. Moreover, the specimen’s maximum void ratio was higher in value than the conventionally determined minimum void ratio. Regardless, both sets of mixtures were successfully reconstituted and further tested.
3.3. Sample Preparation
Since this research evaluates existing recommendations on silty sands’ physical characteristics determination, additional observations on the sample reconstitution process and visible characteristics are given. Compared to the host sand specimen, significantly less effort was made to densify the A-mixtures reconstituted at 80% relative density. Minimum to no compaction effort was applied to the lowest undercompacted layers. The reconstituted specimens physically appeared loose and were susceptible to deformation during the preparation for the triaxial test. A-mixtures also exhibited numerous macropores during the saturation stage, which is characteristic of loose specimens. In contrast, slightly more effort was made to densify the B-mixtures reconstituted at 80% relative density than the host sand specimen. The reconstituted B-mixtures physically appeared dense, exhibiting no macropores, and were also stable during the preparation for the triaxial test. An increase in the fines content causes an increase in the densification effort, indicating a possible increase in the relative density of reconstituted specimens with increasing fines content. Observations on reconstituted dense silty sands’ appearance and preparation process relate better to the physical characteristics defined with the alternative minimum and maximum void ratios than those determined by conventional methods for sands.
3.4. Physical Characteristics of Clayey and Silty Sands with Clay Minerals
New findings regarding the clay minerals’ influence on silty and clayey sands below the fines threshold are based on observational and experimental data from this research. Clay particles in dense, saturated, and isotropically confined silty sands will likely get crushed or slip between the sand grains in the sand skeleton pore spaces. The mechanism for such particle migration below the fines threshold is highly dependent on the saturation level and relative density, with clay minerals absorbing various amounts of water that infiltrate the available pore spaces. The clay mineral’s hydrophilic property will ensure the complete absorption of the free pore water within the sand skeleton. Additionally, the volume change with increasing saturation should be considered with expansive clays. Due to the differences in sand to clay particle shapes, sizes and material hardness, the crushing and rearranging of clay particles can occur in relatively dry specimens. In partly or fully saturated specimens, the water content will govern the behaviour of the clay fraction. With increasing water content, the clay will go from plastic and paste-like behaviour up to the liquid limit water content, to slip or flow beyond the liquid limit water content [49]. The slip and flow mechanisms are especially unfavourable in drained conditions, since they cause selective particle migration (internal erosion or suffusion) and loss of specimen homogeneity. In contrast, within unsaturated mixtures (below the clay fractions’ liquid limit water content), the angular clay particles can enhance the particle bridging and consequently tend to produce higher void ratios than equivalent spheres [29], schematically presented as case III Figure 3, [15]. The void ratios of silty sand mixtures with clay minerals appear to be highly dependent on the governing confining stresses, draining conditions, saturation degree, clay mineral composition and volume fraction, and the configuration of the sand skeleton. Unlike pure sands with well-defined and stable structure, silty sands with clay minerals will be subjected to varying void ratios caused by the clay’s fraction phase transformation at different saturation degrees. Due to the clay fractions’ slip or flow-like behaviour, the particle bridging is improbable above the clay fractions’ liquid limit water content. This also implies that below the fines threshold, soil structure presented with cases II and III Figure 3 will gradually collapse to case I with increasing saturation degree, due to the loss of clay cohesive forces and its inability to form stable bridges between the sand grains. Considering the present research with triaxial tests on fully saturated soil specimens, the analytically determined alternative void ratios with the skeleton void ratio approximation relate well to the case I condition, and the corresponding observations given. The observations also indicate that the conventional and analytical determination methods for silty sands with clay minerals do not provide exact or credible minimum and maximum void ratio values, as is obtainable for clean sands.
3.5. Drained Compression Tests
A total of 10 drained monotonic compression tests were performed on two types of SK10 and SK15 mixtures and the host sand (SK0) specimens. Each specimen was reconstituted at 80% relative density and isotropically consolidated to two varying initial confining stresses (25 and 50 kPa). After the saturation and consolidation stages, specimens were subjected to drained compression at a 4% axial strain rate per hour. The quantitative results of the drained compression tests are summarised in Table 7.
For A-mixtures reconstituted using conventional methods for sands, the deviatoric stress to axial strain relation diagram Figure 8(a) indicates a constant increase in deviatoric stress with increasing axial strain. The critical state was reached at approximately 15% axial strain for the specimen and 20% axial strain for the specimen. At 50 kPa initial confining stress, the responded with a lower peak deviatoric stress than the . The volumetric response to axial strain Figure 8(b) was relatively consistent for all initial confining stresses. At approximately 15% axial strain, a constant volumetric strain of 2.3% for the and 3.0% for the , was reached.
The peak deviatoric stress was reached within 2-4% of axial strain for the host sand and B-mixtures reconstituted using alternative void ratios Figure 8(a). At higher axial strains, the deviatoric stress begins to drop to a critical state value at approximately 30% axial strain. The specimens exhibited a slightly higher deviatoric stress increase than the host sand and specimens at 25 and 50 kPa initial confining stresses. The also exhibited a slightly higher deviatoric stress increase than the host sand at 25 kPa initial confining stress, while at the 50 kPa initial confining stress, the and host sand showed similar deviatoric stress to axial strain relation. The host sand and B-mixtures initially undergo compression in the early stages of axial loading, enlarged part of Figure 8(b). The highest positive volumetric strain of 0.3% at 2% axial strain is recorded for the host sand tested at 50 kPa confining stress. The B-mixtures initially exhibited smaller volumetric strain than the host sand at 50 kPa confining stress. After initial compression, the volumetric strain begins to drop with an increased negative value at higher axial strains as the specimens undergo constant dilation Figure 8(b). The specimens at 25 and 50 kPa initial confining stresses resulted in the highest negative volumetric strain. The host sand and specimens show similar dilative behavior, which increases at lower confining stress. The deviatoric stress and effective stress ratio response to the axial strain graphically represents the loose behavior for A-mixtures and dense behavior for the host sand and B-mixtures. A constant positive volumetric strain for the A-mixtures indicates compression, a characteristic of loose sand specimens. The host sand and B-mixtures exhibited initial compression at very low axial strains and dilation with decreasing negative volumetric strain at higher axial strains, which is characteristic of medium-dense and dense sand specimens.
Figure 9 shows the complete stress paths from performed drained tests, while peak and critical state values are presented in Figure 10 The A-mixtures’ peak deviatoric stress values are positioned lower in the plane than those of the host sand and B-mixtures Figure 9 and Figure 10, resulting in a lower inclination of the projected critical state lines (CSL) (Figure 10 and Table 7). An increase in the CSL angle with an increase in fines content can be observed with B-mixtures.
For A-mixtures, deviatoric stress and volumetric strain response to axial strain in drained conditions correlate well with the lower CSL position than the host sand’s CSL, defining samples reconstituted at a looser state than the host sand. Since the specimens tested were fully saturated, the water content surpassed the clay fraction’s liquid limit. With consequential loss of cohesive forces, the unfavourable slip and flow mechanisms will govern the specimen’s clay fraction in drained conditions, with the potential of selective particle migration (internal erosion or suffusion) and loss of specimen homogeneity. Regarding the B-mixtures, a small change in soil behaviour with a change in fines content could be attributed to the specimen’s varying relative density due to the inaccurately analytically determined void ratios, to the changing clay consistency at different saturation degrees, or the potential structural rearrangement of the clay fraction during the test (loss of specimen homogeneity).
3.6. Undrained Compression Tests
A total of 10 undrained monotonic compression tests were performed on two types of SK10 and SK15 mixtures and the host sand (SK0) specimens. Each specimen was reconstituted at 80% relative density and isotropically consolidated to two varying initial confining stresses (25 and 50 kPa). After the saturation and consolidation stages, specimens were subjected to undrained compression at a 4% axial strain rate per hour. The quantitative values of the undrained compression tests are summarized in Table 8.
For A-mixtures, the peak deviatoric stress, ranging between 10 and 25 kPa, was reached at 0.3% axial strain Figure 11. After reaching the peak value, the deviatoric stress decreases to 0 with a further increase in axial strain at approximately 3% axial strain for A-mixtures tested at 10 and 25 kPa and at approximately 5% axial strain at 50 kPa. The pore water pressure changes to axial strain relation diagram Figure 11 shows an increase in the positive pore pressure with increasing axial strain to an approximately constant value at 2-3% axial strain. The pore water pressure increase appears unaffected by the fines content.
The peak deviatoric stress was reached within 7-15% of axial strain for the host sand and B-mixtures Figure 11(a). With increasing axial strains, the deviatoric stress gradually declines. The host sand and B-mixtures initially show a positive pore water pressure change (Fig.9d) in the early stages of axial loading (up to 1% axial strain). The initial pore water pressure increase is unaffected by the fines content. With increasing axial strain, the pore water pressure changes drop to a constant negative value at approximately 7-25% axial strain Figure 11(b). The decrease in the rate and value of pore water pressure is affected by the fines content but is unaffected by changing confining stresses. The higher the fines content, the higher the increase in negative pore pressure. The peak deviatoric stress achieved with A-mixtures was significantly smaller than that achieved with host sand and B-mixtures. This relates well to the deviatoric stress to axial strain response, which graphically represents the loose behaviour for A-mixtures and dense behaviour for the host sand and B-mixtures. Deviatoric stress rapidly drops to zero value with increasing axial strain for A-mixtures, indicating a complete liquefaction of the specimens. The change in pore water pressure with increasing axial strain indicates constant compression for A-mixtures, a characteristic of loose sand specimens. The initial pore water pressure increase, followed by a decrease to a constant negative value with increasing axial strain for the host sand and B-mixtures, indicates an initial compression followed by dilation, a characteristic of dense and mid-dense sands. Again, a good relation with the deviatoric stress to axial strain response, graphically representing the loose behaviour for A-mixtures and dense behaviour for the host sand and B-mixtures. Both A-mixtures develop similar stress-paths during undrained shearing at low initial confining stresses Figure 12, and a full liquefaction effect can be observed. The A-mixtures’ undrained steady state lines (SSL) exhibit a smaller inclination in the p’-q plane than those of the host sand and B-mixtures. For the A-mixtures, the undrained instability state lines (ISL) are projected through the measured peak deviatoric stress values according to [50], (Figure 13).
For host sand and B-mixtures tested at 50 kPa initial confining stress, the peak q and p’ values increase with an increase in fines content. At the 25 kPa initial confining stress, the specimen reaches higher values of q and p’ than the host sand, and the reaches similar values to those of the host sand. The A-mixtures’ deviatoric stress and pore water pressure response to small axial strains in undrained conditions indicate complete liquefaction and loose samples’ behaviour. This correlates well with the determined SSL and ISL linear trend, in contrast to the B-mixtures’ CSL. As mentioned, with consequential loss of cohesive forces due to full saturation of the specimens, the unfavourable slip and flow mechanisms will govern the specimen’s clay fraction in undrained conditions. Regarding the B-mixtures, a small change in soil behaviour with a change in fines content could be attributed to the specimen’s varying relative density due to the inaccurately determined void ratios, or the changing clay consistency at different saturation degrees.
4. Conclusions
The present research summaries the experimental and observational findings of the clay minerals’ influence on the reconstitution process and drained and undrained static behaviour of silty and clayey sands. Several concluding remarks can be drawn concerning the void ratio determination suggestions and the effect of clay mineral fines on the silty sands’ void ratios. Additionally, the clay mineral influence on the silty sand’s drained and undrained static behavior is validated with experimental data and further elaborated.
4.1. Physical Characteristics of Clayey and Silty Sands with Clay Minerals
The clay particles will likely be subjected to the crushing or slip/flow mechanism in dense, isotropically confined, and saturated silty sand conditions. With increasing water content, the clay will go from plastic and paste-like behaviour up to the liquid limit water content, to slip or flow beyond the liquid limit water content [49]. The slip and flow mechanisms are especially unfavourable in drained conditions, since they cause selective particle migration (internal erosion or suffusion) and loss of specimen homogeneity. The potential loss of specimen homogeneity can negatively affect the experimental results, which should be considered when choosing the test type. Within unsaturated mixtures (below the clay fractions’ liquid limit water content), the angular clay particles can enhance the particle bridging and consequently tend to produce higher void ratios than equivalent spheres [29], schematically presented as case III Figure 3, [15]. Due to the clay fractions’ slip or flow-like behaviour, the particle bridging is improbable above the clay fractions’ liquid limit water content. This also implies that below the fines threshold, soil structure presented with cases II and III Figure 3 will gradually collapse to case I with increasing saturation degree, due to the loss of clay cohesive forces and its inability to form stable bridges between the sand grains. The void ratios of silty sand mixtures with clay minerals appear to be highly dependent on the governing confining stresses, draining conditions, saturation degree, clay mineral composition and volume fraction, and the configuration of the sand skeleton. Unlike pure sands with well-defined and stable structure, silty sands with clay minerals will be subjected to varying void ratios caused by the clay’s fraction phase transformation at different saturation degrees. Additionally, the volume change with increasing saturation should be considered with expansive clays.
4.2. Void Ratios Determination Methods
The observed clay particle segregation when using the conventional determination methods [20,21] with existing recommendations [22,29] for A-mixtures relate well to the inapplicability of these testing procedures for silty sands with clay minerals, even within the sand-dominated soil structure. This also implies the miscalculated targeted relative density within the present and the existing research [18,19]. The reconstituted specimens physically appeared loose and were susceptible to deformation during the preparation for the triaxial test. A-mixtures also exhibited numerous macropores during the saturation stage, a characteristic of loose specimens. The analytically determined void ratios for B-mixtures approximate the limiting case condition with all the fines filling the host sand pore spaces, and none participating in the mixture’s structure. This condition can also be identified as the intergranular [2] or the skeleton [3] void ratio. It relates well to case I condition Figure 3, with the mean particle sizes of sand and fines for spherical particles, and [15], and to the filling coefficient’s power trend relation to a particle size ratio Figure 8. The reconstituted B-mixtures physically appeared dense, exhibiting no macro-pores, and were also stable during the preparation for the triaxial test. An increase in the fines content causes an increase in the densification effort, indicating a possible increase in the relative density of reconstituted specimens with increasing fines content. The conventional void ratio determination methods appear inapplicable to properly define the physical characteristics of silty sands with clay minerals. Compared to the host sand, the analytical method relates well to the appearance and preparation process, and the triaxial experimental data, indicating the dense sand behavior for silty sands with clay minerals. However, due to the varying characteristics of clay minerals, the existing determination methods for silty sands with clay minerals do not provide exact minimum and maximum void ratio values, as is obtainable for clean sands with conventional methods. The analytical methods [2,23,24] can be applied to redefine the void ratios of silty sands with clay minerals for the specimen reconstitution process and further approximation of the soil behavior in various experiments. The potential deviation from the “real” relative density should be considered when comparing the soil behavior with less significant testing condition differences. The analytical methods are based on the volumetric fractions of sand grains and clay particles, and should only be applied to non-expansive and low plasticity clay. To properly define the varying void ratio of the clayey and the silty sands with clay minerals, a new method should be developed that considers the clay mineral composition and fraction, saturation degree and changing clay consistency, and the primary configuration of the sand skeleton.
4.3. Drained Compression Tests
For A-mixtures, deviatoric stress and volumetric strain response to axial strain in drained conditions correlate well with the lower CSL position than the B-mixtures and the host sand’s CSL, defining samples reconstituted at a loose state. The host sand and B-mixtures deviatoric stress and volumetric strain response to axial strain in drained conditions indicate a dense behavior. Since the specimens tested were fully saturated, the water content surpassed the clay fraction’s liquid limit. With consequential loss of cohesive forces, the unfavorable slip and flow mechanisms will govern the specimen’s clay fraction in drained conditions, with the potential of selective particle migration (internal erosion or suffusion) and loss of specimen homogeneity. Regarding the B-mixtures, a small change in soil behavior with a change in fines content could be attributed to the specimen’s varying relative density due to the inaccurately analytically determined void ratios, to the changing clay consistency at different saturation degrees, or the potential structural rearrangement of the clay fraction during the test (loss of specimen homogeneity).
4.4. Undrained Compression Tests
The deviatoric stress to axial strain response represents the loose behavior for A-mixtures and dense behavior for the host sand and B-mixtures. The A-mixtures’ deviatoric stress and pore water pressure response to small axial strains in undrained conditions indicate complete liquefaction and loose samples’ behavior. This correlates well with the determined SSL and ISL linear trend, in contrast to the B-mixtures’ CSL. With consequential loss of cohesive forces due to full saturation of the specimens, the unfavorable slip and flow mechanisms will govern the specimen’s clay fraction in undrained conditions. Regarding the B-mixtures, a small change in soil behavior with a change in fines content could be attributed to the specimen’s varying relative density due to the inaccurately determined void ratios, or the changing clay consistency at different saturation degrees.
Author Contributions
`Conceptualization, D.M. and V.J.; methodology, D.M.; validation, V.J.; formal analysis, D.M.; investigation, D.M.; data curation, D.M.; writing—original draft preparation, D.M.; writing—review and editing, V.J.; visualization, D.M. and V.J.; supervision, V.J. All authors have read and agreed to the published version of the manuscript.
Informed Consent Statement
“Not applicable”.
Acknowledgments
I The tests were conducted in the Geotechnical Laboratory at the Faculty of Civil Engineering, University of Rijeka, within the Project Research Infrastructure for Campus-based Laboratories at the University of Rijeka, (RC.2.2.06-0001) funded by Ministry of Science, Education and Sports of the Republic of Croatia. This project has been co-funded by the European Fund for Regional Development (ERDF); this support is gratefully acknowledged. The research was funded by the University of Rijeka, Croatia through the project “Physical and laboratory tests of interparticle behavior of sand and clay mixtures at low overburden stresses" (uniri-iskusni-tehnic-23- 183 212). The help of a former graduate students from the Faculty of Civil Engineering, University of Rijeka, Croatia, Martina Turković and Duje Katalinić in conducting several cyclic tests is sincerely appreciated.
Conflicts of Interest
“The authors declare no conflicts of interest.”
Abbreviations
The following abbreviations are used in this manuscript:
| CSL | Critical State Line |
| SSL | Steady State Line |
| ISL | Instability State Line |
| LVDT | Linear variable differential transducers |
References
- Lade, P.; Chaney, R.; Demars, K.; Liggio, C.; Yamamuro, J. Effects of Non-Plastic Fines on Minimum and Maximum Void Ratios of Sand. Geotechnical Testing Journal 1998, 21, 336. [Google Scholar] [CrossRef]
- Thevanayagam, S. Effect of Fines and Confining Stress on Undrained Shear Strength of Silty Sands. Journal of Geotechnical and Geoenvironmental Engineering 1998, 124, 479–491. [Google Scholar] [CrossRef]
- Yang, J.; Wei, L.M.; Dai, B.B. State Variables for Silty Sands: Global Void Ratio or Skeleton Void Ratio? Soils and Foundations 2015, 55, 99–111. [Google Scholar] [CrossRef]
- Phan, V.T.A.; Hsiao, D.H. Undrained Behavior and Shear Strength of Clean Sand Containing Low-Plastic Fines. IOP Conference Series: Earth and Environmental Science 2018, 143, 12020. [Google Scholar] [CrossRef]
- Rabbi, A.T.M.Z.; Rahman, M.M.; Cameron, D.A. The Relation between the State Indices and the Characteristic Features of Undrained Behaviour of Silty Sand. Soils and Foundations 2019, 59, 801–813. [Google Scholar] [CrossRef]
- Othman, B.A.; Marto, A.; Uzuoka, R.; Ueda, K.; Satar, M.H.M. Liquefaction Resistance of Sand-Kaolin Mixtures: Effect of Sand Sizes. IOP Conference Series: Earth and Environmental Science 2022, 1103, 12026. [Google Scholar] [CrossRef]
- Tafili, M.; Knittel, L.; Gauger, V.; Wichtmann, T.; Stutz, H.H. Experimental Study on Monotonic to High-Cyclic Behaviour of Sand-Silt Mixtures. Acta Geotechnica 2023. [Google Scholar] [CrossRef]
- Derakhshandi, M.; Rathje, E.M.; Hazirbaba, K.; Mirhosseini, S.M. The Effect of Plastic Fines on the Pore Pressure Generation Characteristics of Saturated Sands. Soil Dynamics and Earthquake Engineering 2008, 28, 376–386. [Google Scholar] [CrossRef]
- Lade, P.V.; Yamamuro, J.A.; Liggio, C.D.J. Effects of Fines Content on Void Ratio, Compressibility, and Static Liquefaction of Silty Sand. Geomechanics and Engineering 2009, 1, 1–15. [Google Scholar] [CrossRef]
- Monkul, M.M.; Yamamuro, J.A. Influence of silt size and content on liquefaction behavior of sands. Canadian Geotechnical Journal 2011, 48, 931–942. [Google Scholar] [CrossRef]
- Yang, J.; Wei, L.M. Collapse of Loose Sand with the Addition of Fines: The Role of Particle Shape. Géotechnique 2012, 62, 1111–1125. [Google Scholar] [CrossRef]
- Sarkar, D.; Goudarzy, M.; König, D.; Wichtmann, T. Influence of particle shape and size on the threshold fines content and the limit index void ratios of sands containing non-plastic fines. Soils and Foundations 2020, 60, 621–633. [Google Scholar] [CrossRef]
- Mitchell, J.K.; Soga, K. Fundamentals of Soil Behavior, 3. ed ed.; Wiley, 2005.
- Holtz, R.D.; Kovacs, W.D.; Sheahan, T.C. An Introduction to Geotechnical Engineering; Pearson, 2011.
- Thevanayagam, S.; Martin, G.R. Liquefaction in silty soils—screening and remediation issues. Soil Dynamics and Earthquake Engineering 2002, 22, 1035–1042. [Google Scholar] [CrossRef]
- Rahman, M.M.; Lo, S.R.; Gnanendran, C.T. On Equivalent Granular Void Ratio and Steady State Behaviour of Loose Sand with Fines. Canadian Geotechnical Journal 2008, 45, 1439–1456. [Google Scholar] [CrossRef]
- Rahman, M.M.; Lo, S.R. Undrained Behavior of Sand-Fines Mixtures and Their State Parameter. Journal of Geotechnical and Geoenvironmental Engineering 2014, 140, 4014036. [Google Scholar] [CrossRef]
- Prodan, M.V.; Peranić, J.; Pajalić, S.; Jagodnik, V.; Čeh, N.; Željko Arbanas. Mechanism of Rainfall Induced Landslides in Small-Scale Models Built of Different Materials 2022.
- Željko Arbanas.; Peranić, J.; Jagodnik, V.; Prodan, M.V.; Čeh, N., Remedial Measures Impact on Slope Stability and Landslide Occurrence in Small-Scale Slope Physical Model in 1 g Conditions. In Progress in Landslide Research and Technology, Volume 2 Issue 2, 2023; Alcántara-Ayala, I.; Željko Arbanas.; Huntley, D.; Konagai, K.; Arbanas, S.M.; Mikoš, M.; Ramesh, M.V.; Sassa, K.; Sassa, S.; Tang, H.; et al., Eds.; Springer Nature Switzerland, 2023; pp. 197–220. [CrossRef]
- D4253-16, A. Test {Methods} for {Maximum} {Index} {Density} and {Unit} {Weight} of {Soils} {Using} a {Vibratory} {Table}; ASTM International, 2016.
- D4254-16, A. Standard {Test} {Methods} for {Minimum} {Index} {Density} and {Unit} {Weight} of {Soils} and {Calculation} of {Relative} {Density}; ASTM International, 2016.
- Mijic, Z.; Bray, J.D.; Riemer, M.F.; Cubrinovski, M.; Rees, S.D. Test Method for Minimum and Maximum Densities of Small Quantities of Soil. Soils and Foundations 2021, 61, 533–540. [Google Scholar] [CrossRef]
- Chang, C.S.; Wang, J.Y.; Ge, L. Modeling of Minimum Void Ratio for Sand–Silt Mixtures. Engineering Geology 2015, 196, 293–304. [Google Scholar] [CrossRef]
- Chang, C.S.; Wang, J.Y.; Ge, L. Maximum and Minimum Void Ratios for Sand-Silt Mixtures. Engineering Geology 2016, 211, 7–18. [Google Scholar] [CrossRef]
- Sivakugan, N.; Das, B.M. Geotechnical Engineering: A Practical Problem Solving Approach; J. Ross Pub, 2010.
- Rahman, M.M.; Lo, S.R. Predicting the Onset of Static Liquefaction of Loose Sand with Fines. Journal of Geotechnical and Geoenvironmental Engineering 2012, 138, 1037–1041. [Google Scholar] [CrossRef]
- Goudarzy, M.; Sarkar, D.; Lieske, W.; Wichtmann, T. Influence of plastic fines content on the liquefaction susceptibility of sands: monotonic loading. Acta Geotechnica 2022, 17, 1719–1737. [Google Scholar] [CrossRef]
- Gobbi, S.; Reiffsteck, P.; Lenti, L.; d’Avila, M.P.S.; Semblat, J.F. Liquefaction triggering in silty sands: effects of non-plastic fines and mixture-packing conditions. Acta Geotechnica 2022, 17, 391–410. [Google Scholar] [CrossRef]
- Lade, P.V.; Liggio, C.D.; Yamamuro, J.A. Effects of Non-Plastic Fines on Minimum and Maximum Void Ratios of Sand. Geotechnical Testing Journal 1998, 21, 336–347. [Google Scholar] [CrossRef]
- Thevanayagam, S.; Mohan, S. Intergranular State Variables and Stress–Strain Behaviour of Silty Sands. Géotechnique 2000, 50, 1–23. [Google Scholar] [CrossRef]
- Polito, C.P. Models for Estimating Coefficients for the Prediction of Maximum and Minimum Index Void Ratios for Mixtures of Sand and Non-Plastic Silt. Technical report, Engineering, 2023. [CrossRef]
- Marušić, D.; Jagodnik, V. Determination of the Atterberg Limits Using a Fall Cone Device on Low Plasticity Silty Sands. Rudarsko-geološko-naftni zbornik 2023, 38, 133–145. [Google Scholar] [CrossRef]
- Marušić, D.; Jagodnik, V. Atterberg Limits Determination and Soil Classification Using Fall Cone Device on the Silty Sands and Sandy Silts. International Journal of Geotechnical Engineering 2025, 19, 78–87. [Google Scholar] [CrossRef]
- Jagodnik, V.; Marušić, D. Jagodnik, V.; Marušić, D.; Željko Arbanas.; Čeh, N.; Peranić, J.; Prodan, M.V., Fines Content Influence on the Dynamic Slope Behavior in Small-Scale Physical Models; 2024; pp. 219–224. [CrossRef]
- D854-14, A. Standard Test Methods for Specific Gravity of Soil Solids by Water Pycnometer. Technical report, ASTM, 2014.
- 17892-4:2016, H.R.S.C.E.N.I. Geotehničko istraživanje i ispitivanje – Laboratorijsko ispitivanje tla – 4. dio: Određivanje granulometrijskog sastava. Technical report, 2016.
- Jagodnik, V.; Željko Arbanas. Cyclic Behaviour of Uniform Sand in Drained and Undrained Conditions at Low Confining Stress in Small-Scale Landslide Model. Sustainability 2022, 14, 12797. [CrossRef]
- Sridharan, A.; Nagaraj, H.; Prakash, K. Determination of the Plasticity Index from Flow Index. Geotechnical Testing Journal 1999, 22, 175–181. [Google Scholar] [CrossRef]
- Fleureau, J.M.; Verbrugge, J.C.; Huergo, P.J.; Correia, A.G.; Kheirbek-Saoud, S. Aspects of the behaviour of compacted clayey soils on drying and wetting paths. Canadian Geotechnical Journal 2002, 39, 1341–1357. [Google Scholar] [CrossRef]
- Haigh, S.K.; Vardanega, P.J.; Bolton, M.D. The Plastic Limit of Clays. Géotechnique 2013, 63, 435–440. [Google Scholar] [CrossRef]
- Jagodnik, V.; Kraus, I.; Ivanda, S.; Željko Arbanas. Behaviour of Uniform Drava River Sand in Drained ConditionA Critical State Approach. Applied Sciences 2020, 10, 5733. [CrossRef]
- Lade, P.V. Triaxial Testing of Soils; Wiley, 2016. [CrossRef]
- D7181-20, A. Standard Test Method for Consolidated Drained Triaxial Compression Test for Soils, 2020.
- D4767-11, A. Standard Test Method for Consolidated Undrained Triaxial Compression Test for Cohesive Soils, 2020.
- Ladd, R.S. Preparing Test Specimens Using Undercompaction. GEOTECHNICAL TESTING JOURNAL 1978.
- Skempton, A.W. The Pore–Pressure Coefficients A and B. Géotechnique 1954, 4, 143–147. [Google Scholar] [CrossRef]
- Jagodnik, V.; Mušić, N.; Bošnjak, I.; Marušić, D. Sand and sand-kaoline mixtures cyclic properties under low confining stress (in review). In Proceedings of the The Third Croatian Conference on Earthquake Engineering (3CroCEE), 2025.
- Jagodnik, V.; Sulovsky, T. Degradation of fully saturated uniform sand subjected to small-strain undrained cyclic shearing. Journal of Rock Mechanics and Geotechnical Engineering 2025. [Google Scholar] [CrossRef]
- Andrade, F.; Al-Qureshi, H.; Hotza, D. Measuring the plasticity of clays: A review. Applied Clay Science 2011, 51, 1–7. [Google Scholar] [CrossRef]
- Murthy, T.G.; Loukidis, D.; Carraro, J.A.H.; Prezzi, M.; Salgado, R. Undrained Monotonic Response of Clean and Silty Sands. Géotechnique 2007, 57, 273–288. [Google Scholar] [CrossRef]
Figure 1.
Phase relations schematic diagram – adopted from [14].
Figure 1.
Phase relations schematic diagram – adopted from [14].
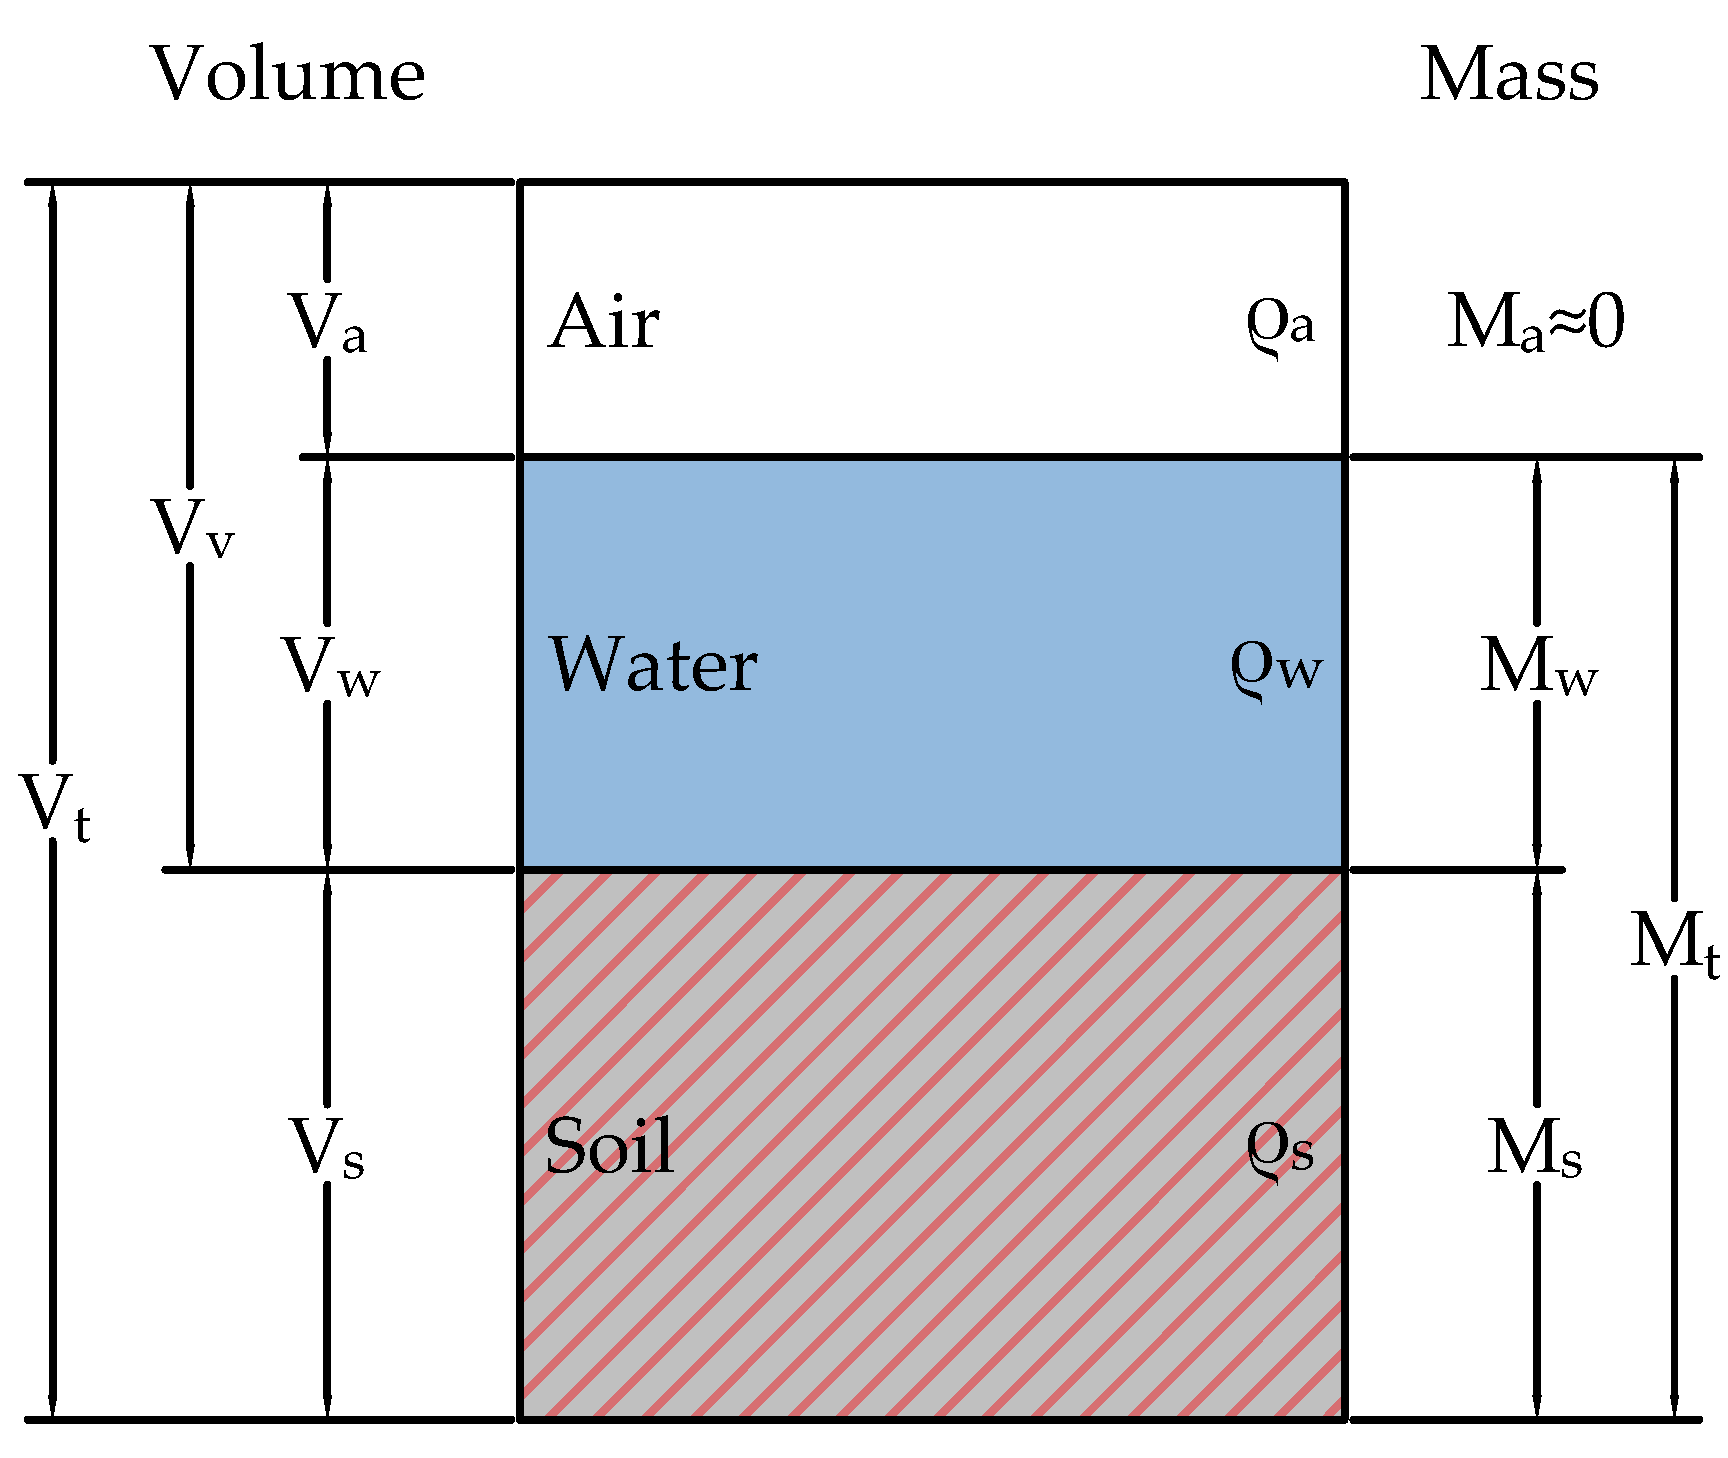
Figure 2.
Schematic diagram of a theoretical variation of minimum void ratio in binary packings with % fines – adopted and modified from [1].
Figure 2.
Schematic diagram of a theoretical variation of minimum void ratio in binary packings with % fines – adopted and modified from [1].
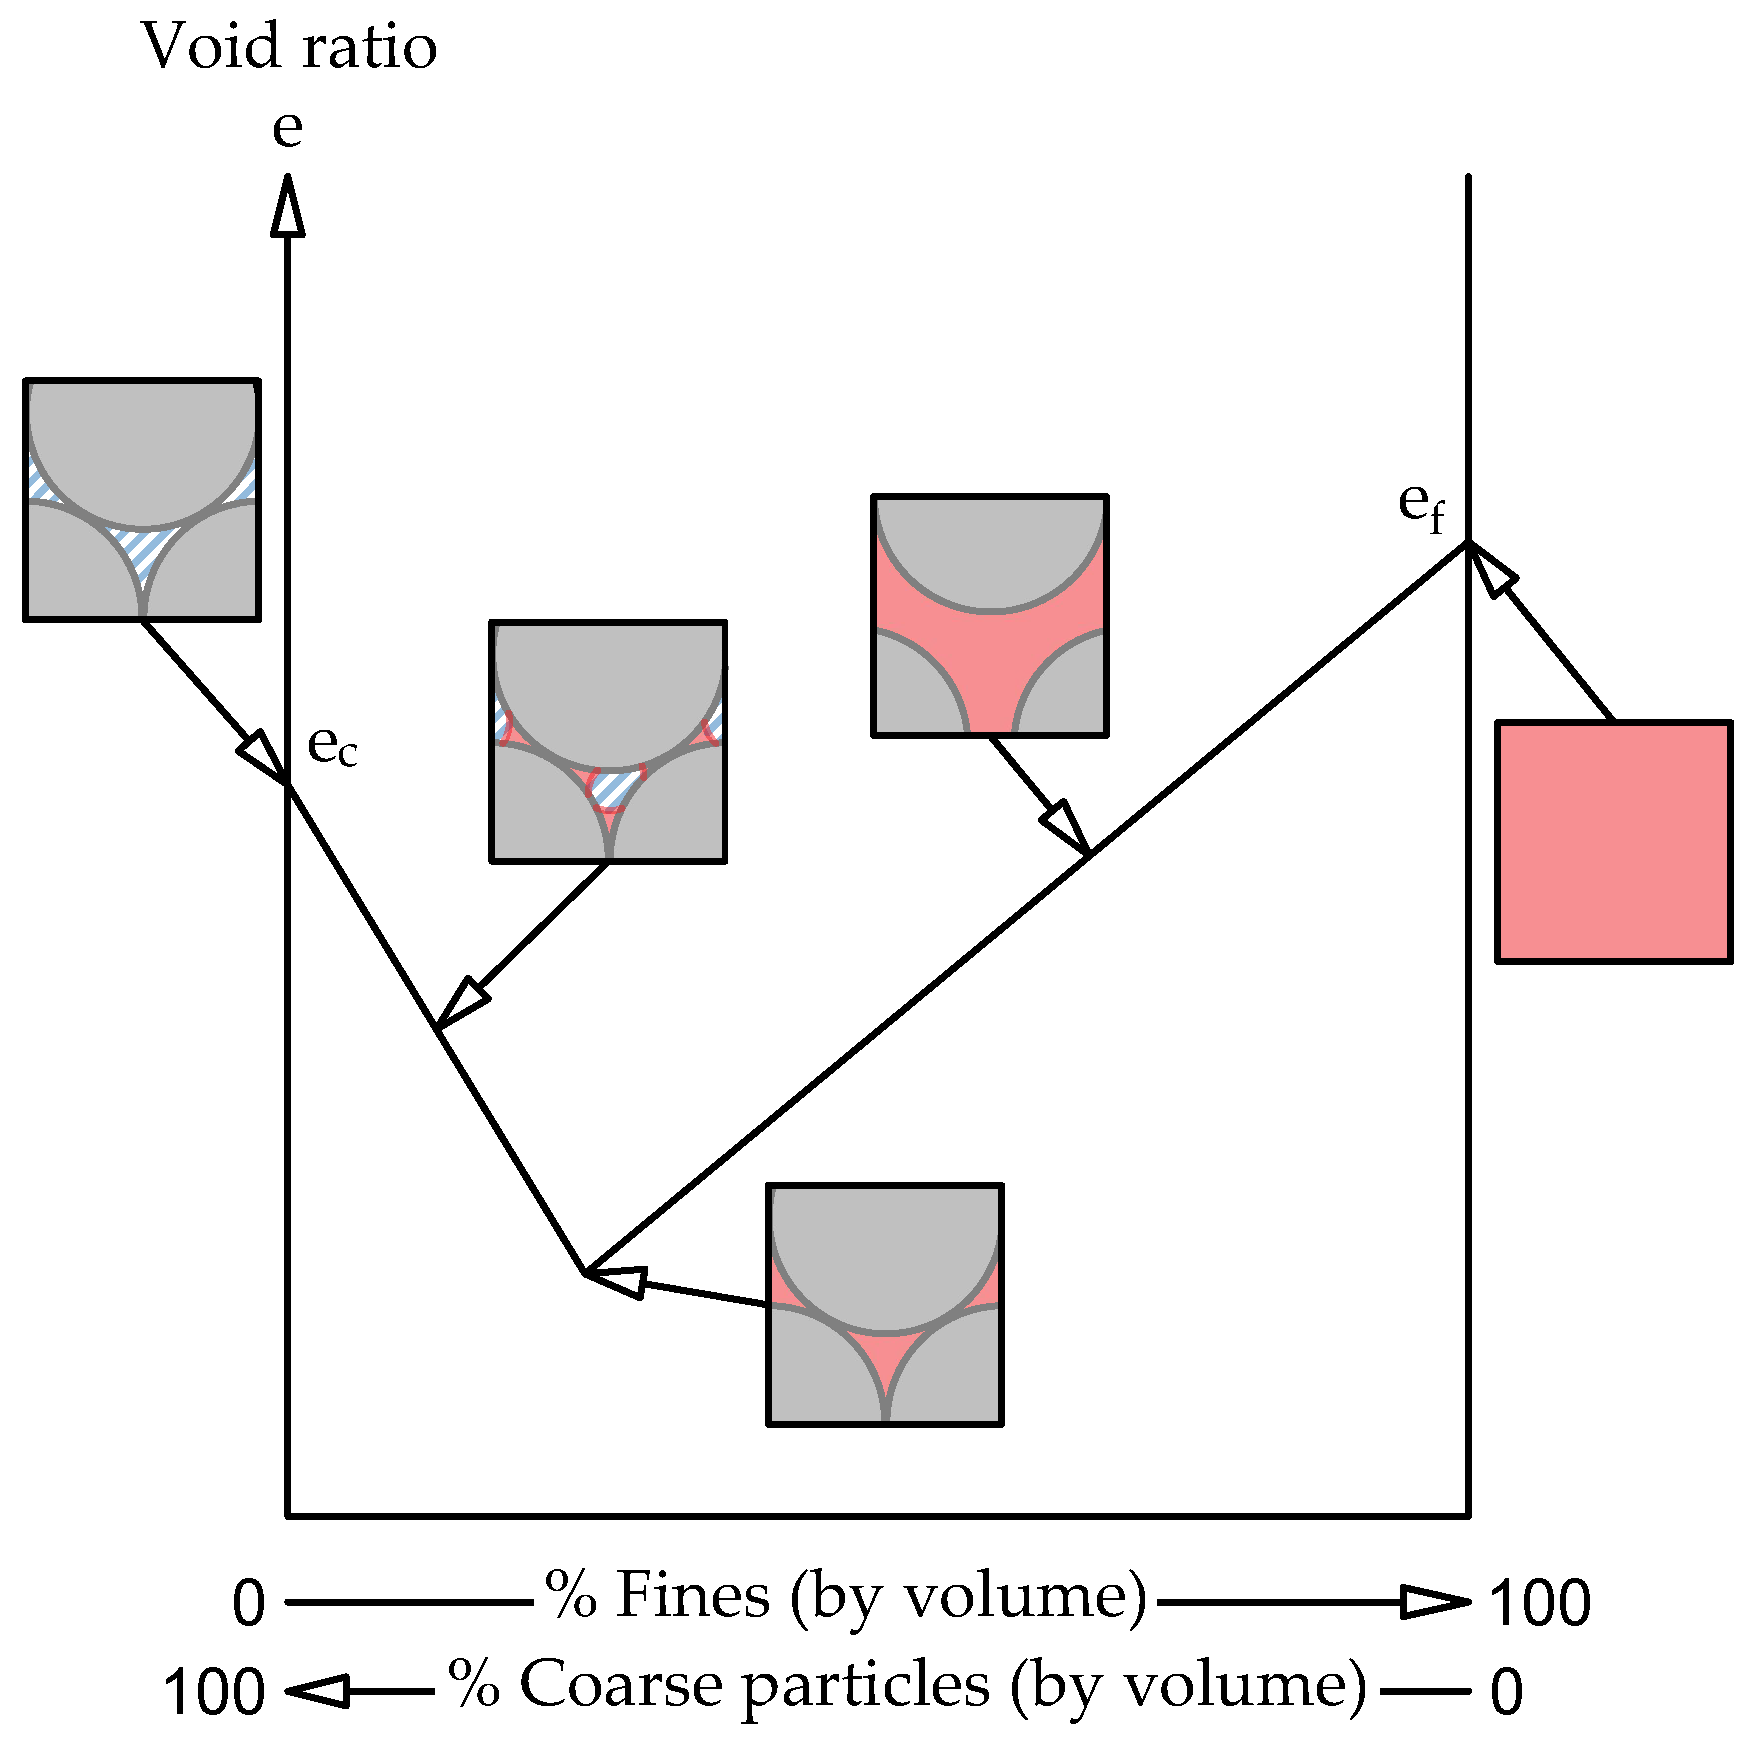
Figure 3.
Intergranular soil mix classification for coarse-grain soil mix – adopted and modified from [15].
Figure 3.
Intergranular soil mix classification for coarse-grain soil mix – adopted and modified from [15].
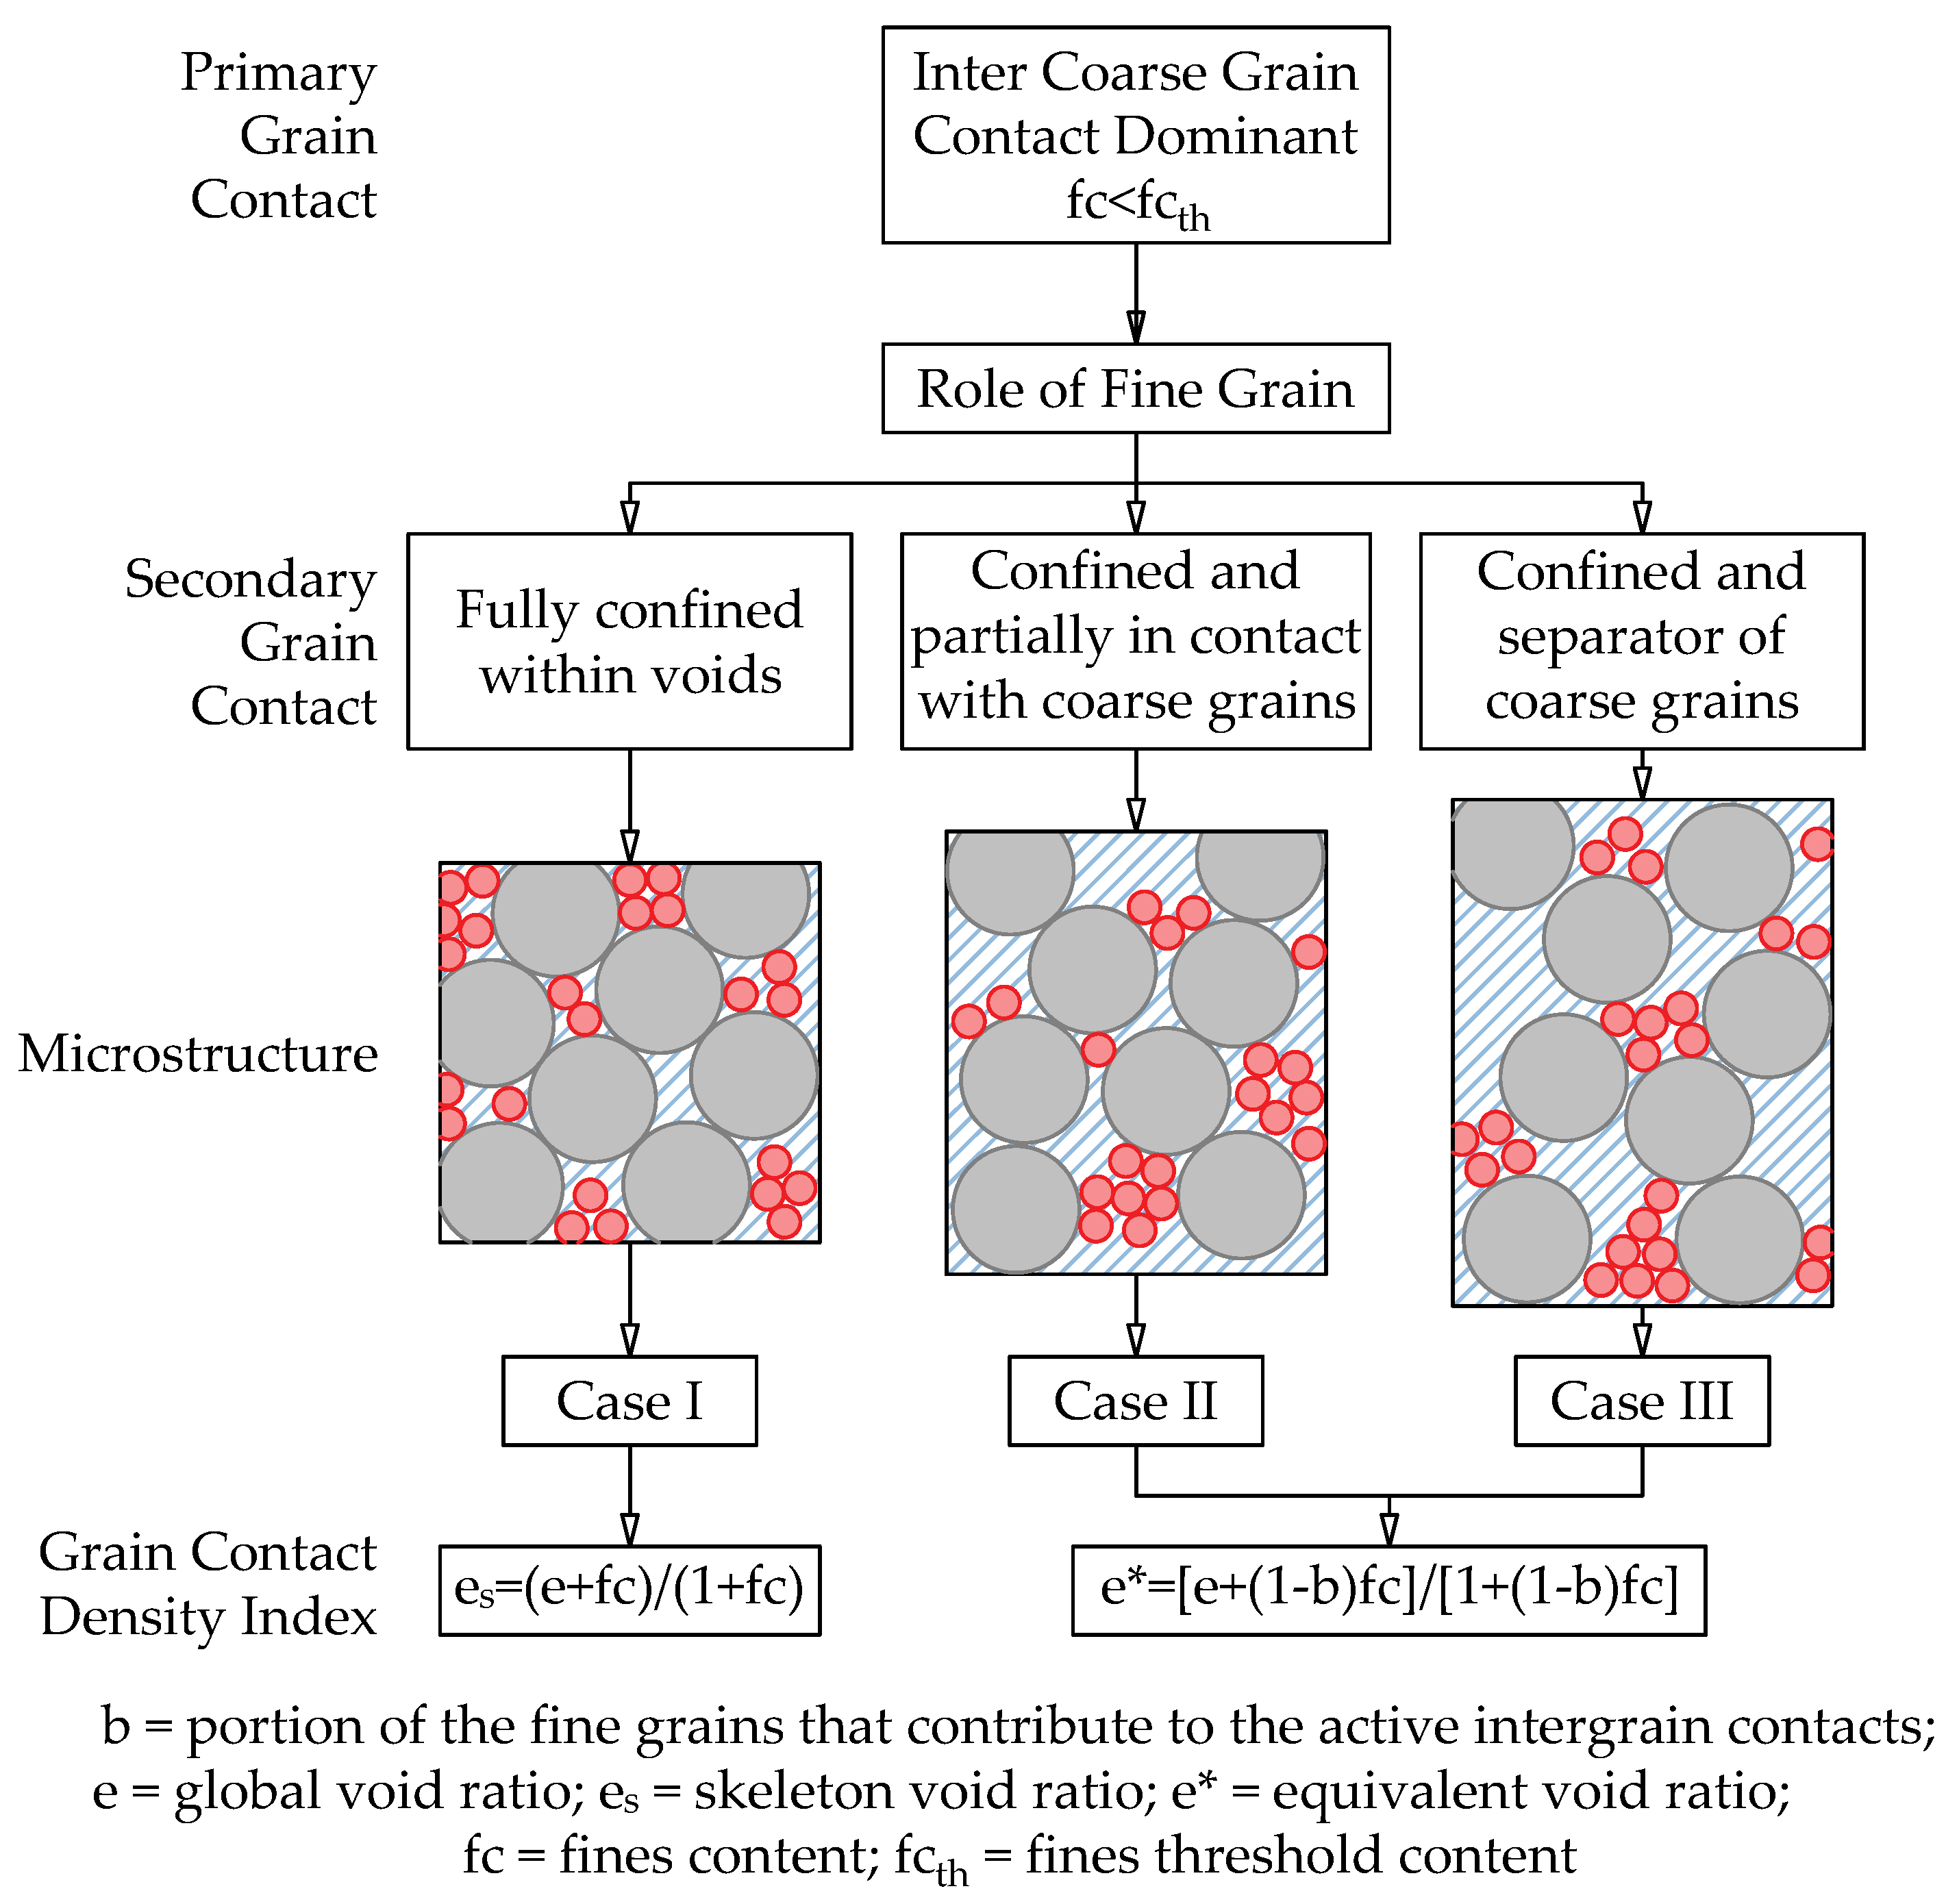
Figure 4.
Particle size distribution of tested soil specimens.
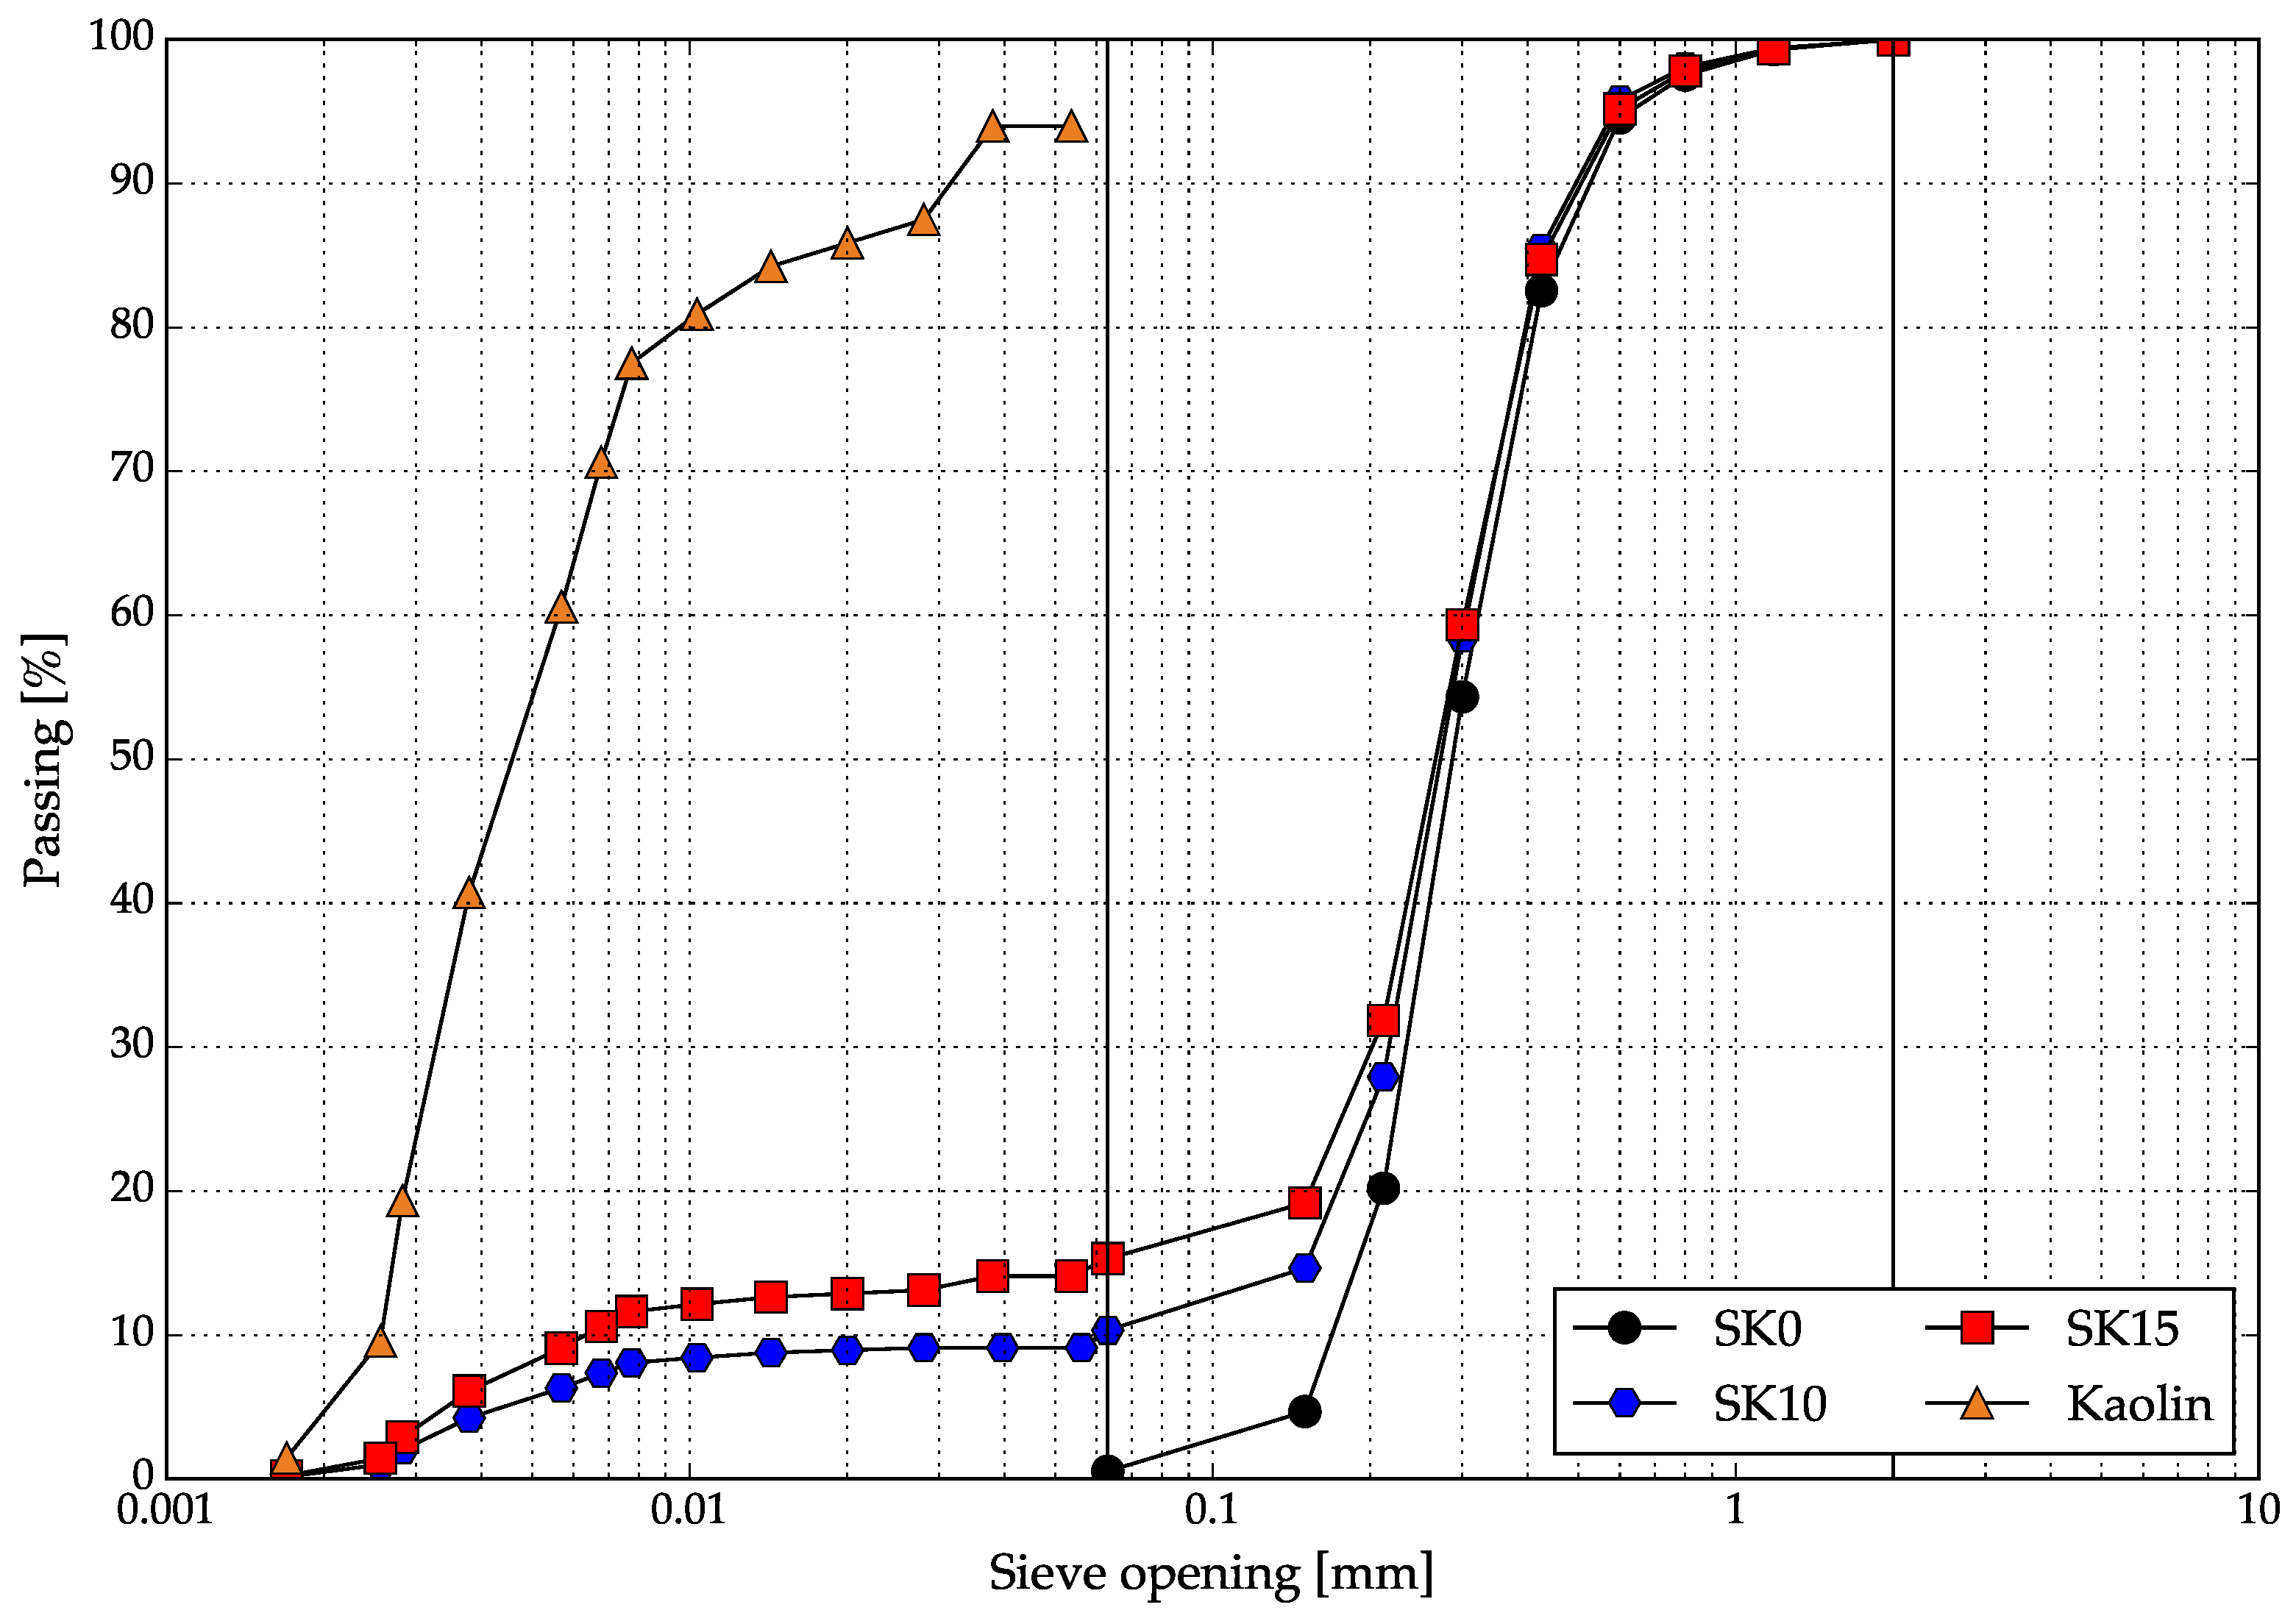
Figure 5.
Triaxial system used: (a) Triaxial frame, (b) Triaxial cell, (c) Submerged load cell, (d) Cell pressure transducer (e) Pore water pressure transducer, (f) Back pressure transducer, (g) LVDT and (h) Volume change device.
Figure 5.
Triaxial system used: (a) Triaxial frame, (b) Triaxial cell, (c) Submerged load cell, (d) Cell pressure transducer (e) Pore water pressure transducer, (f) Back pressure transducer, (g) LVDT and (h) Volume change device.
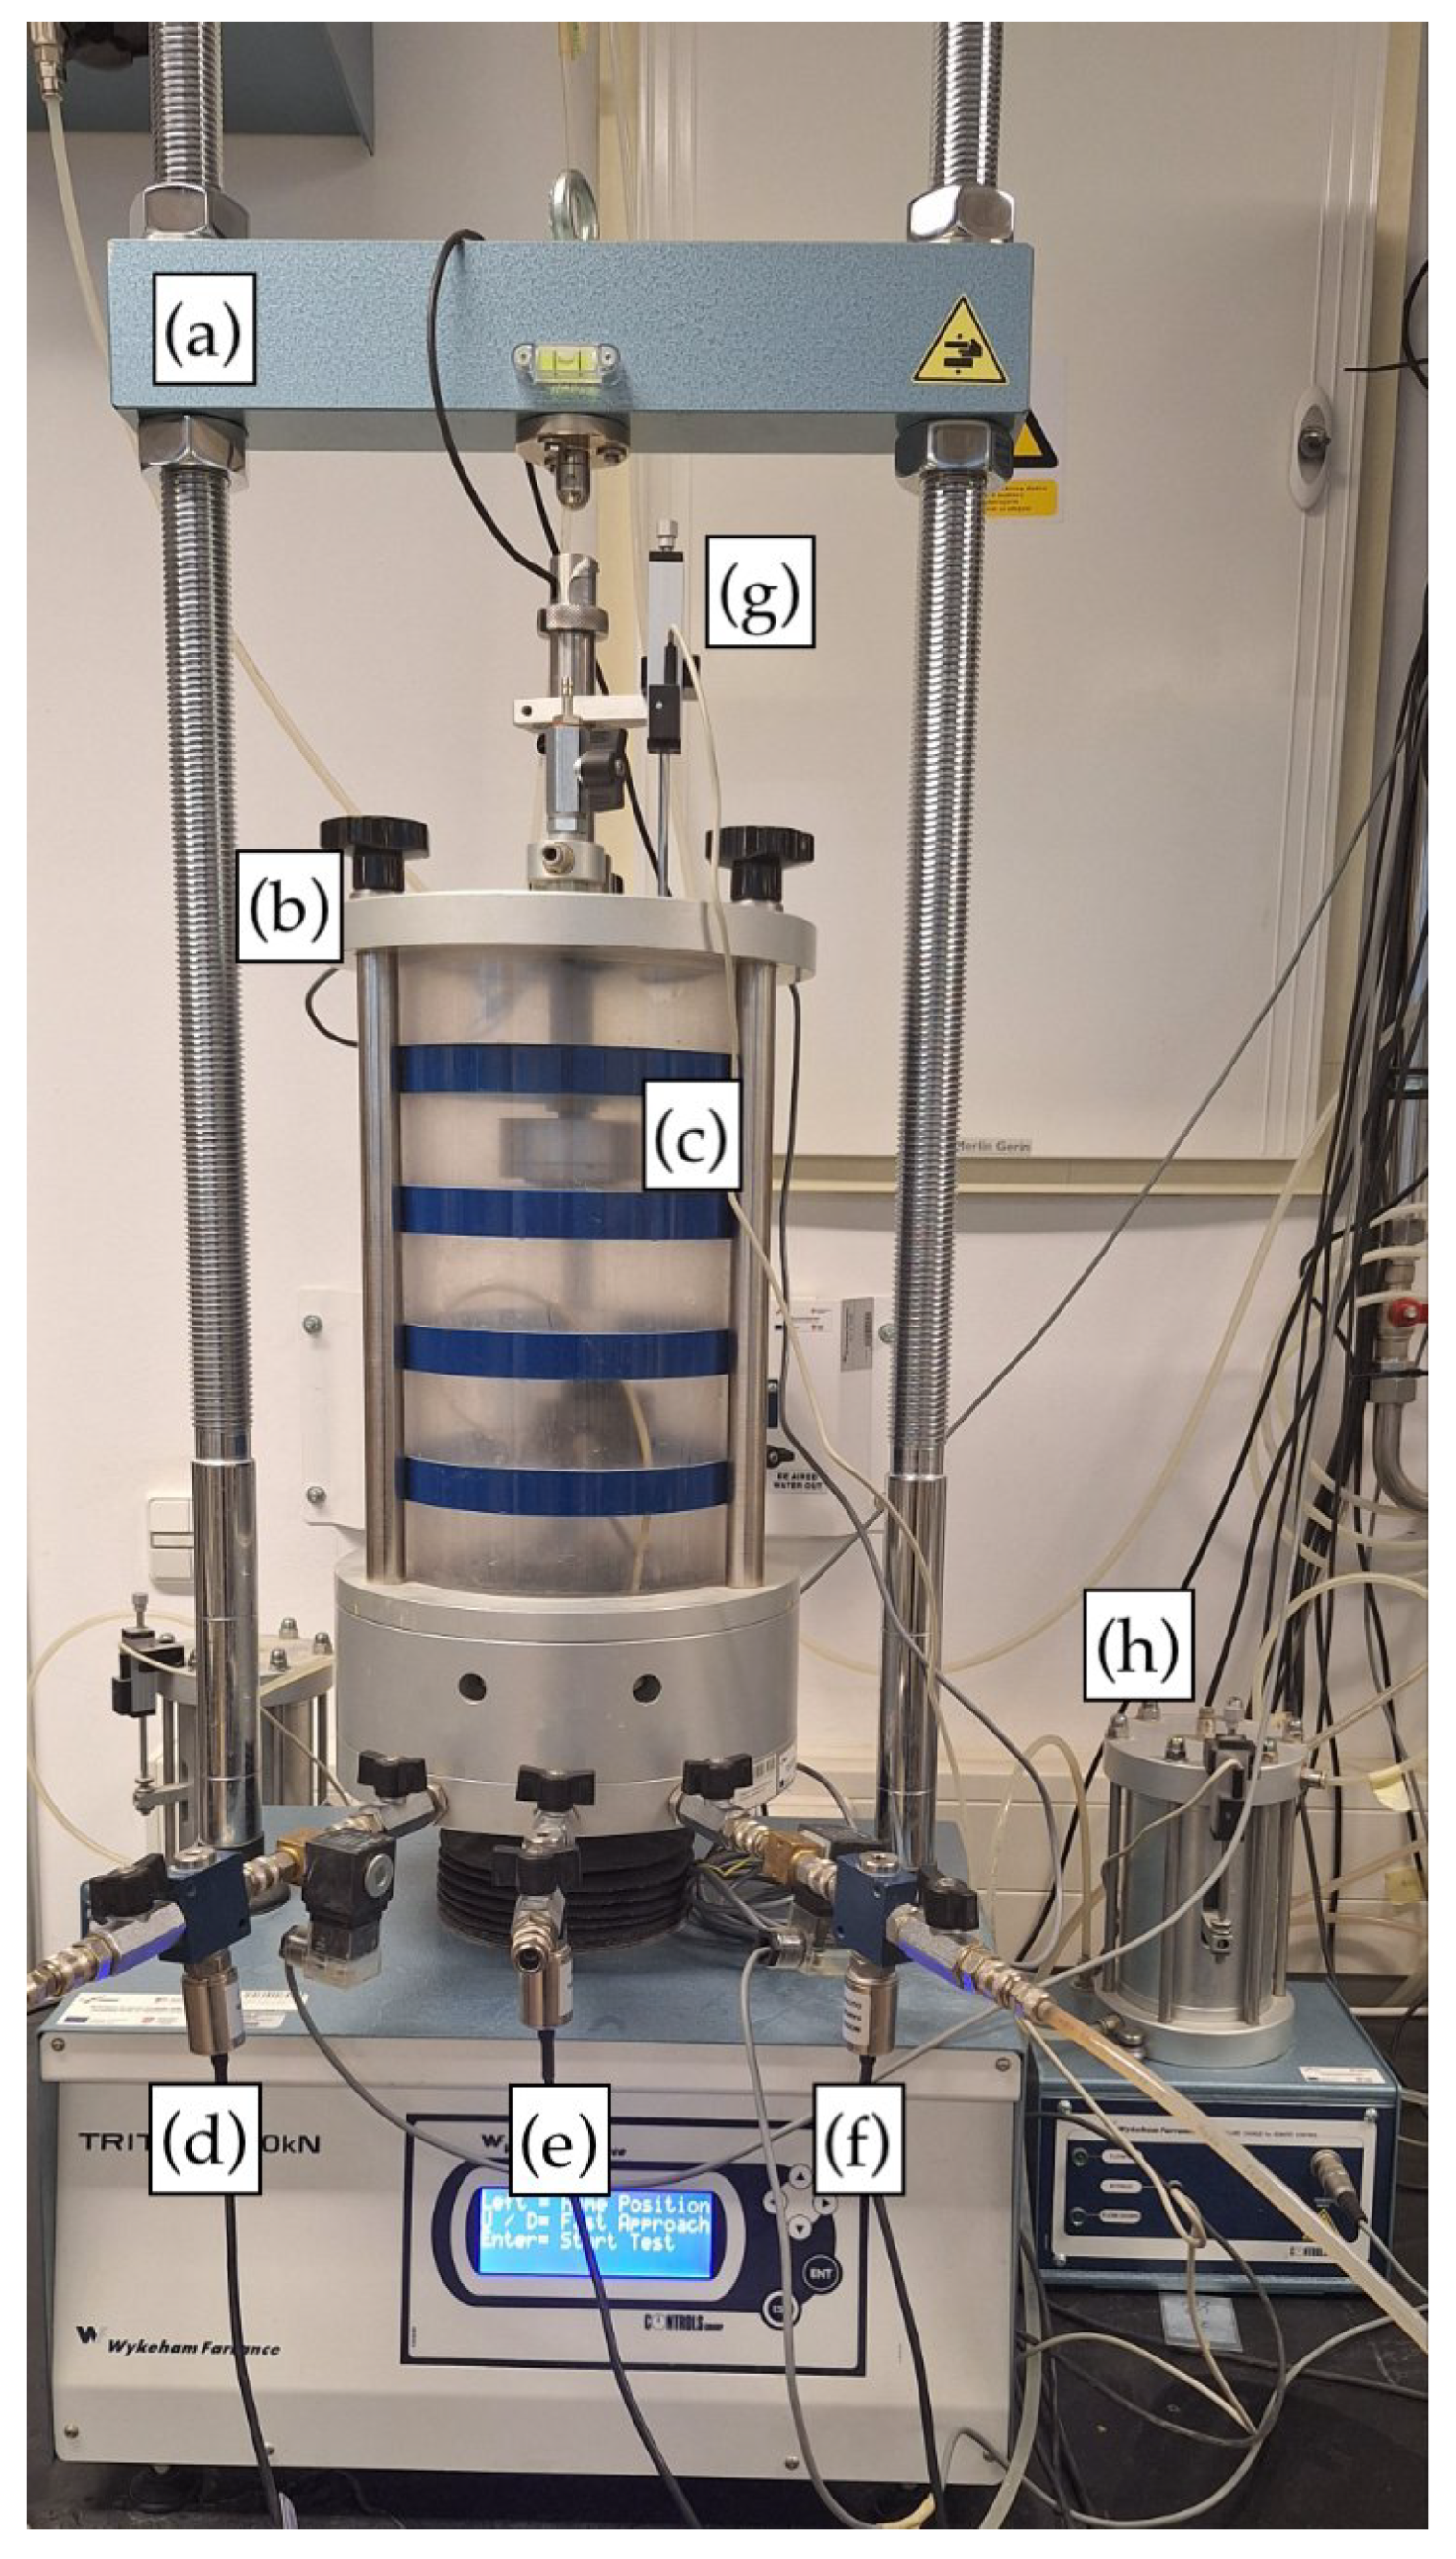
Figure 7.
The filling coefficient a relation to a particle size ratio , and computed best-fit power trend, [23].
Figure 7.
The filling coefficient a relation to a particle size ratio , and computed best-fit power trend, [23].
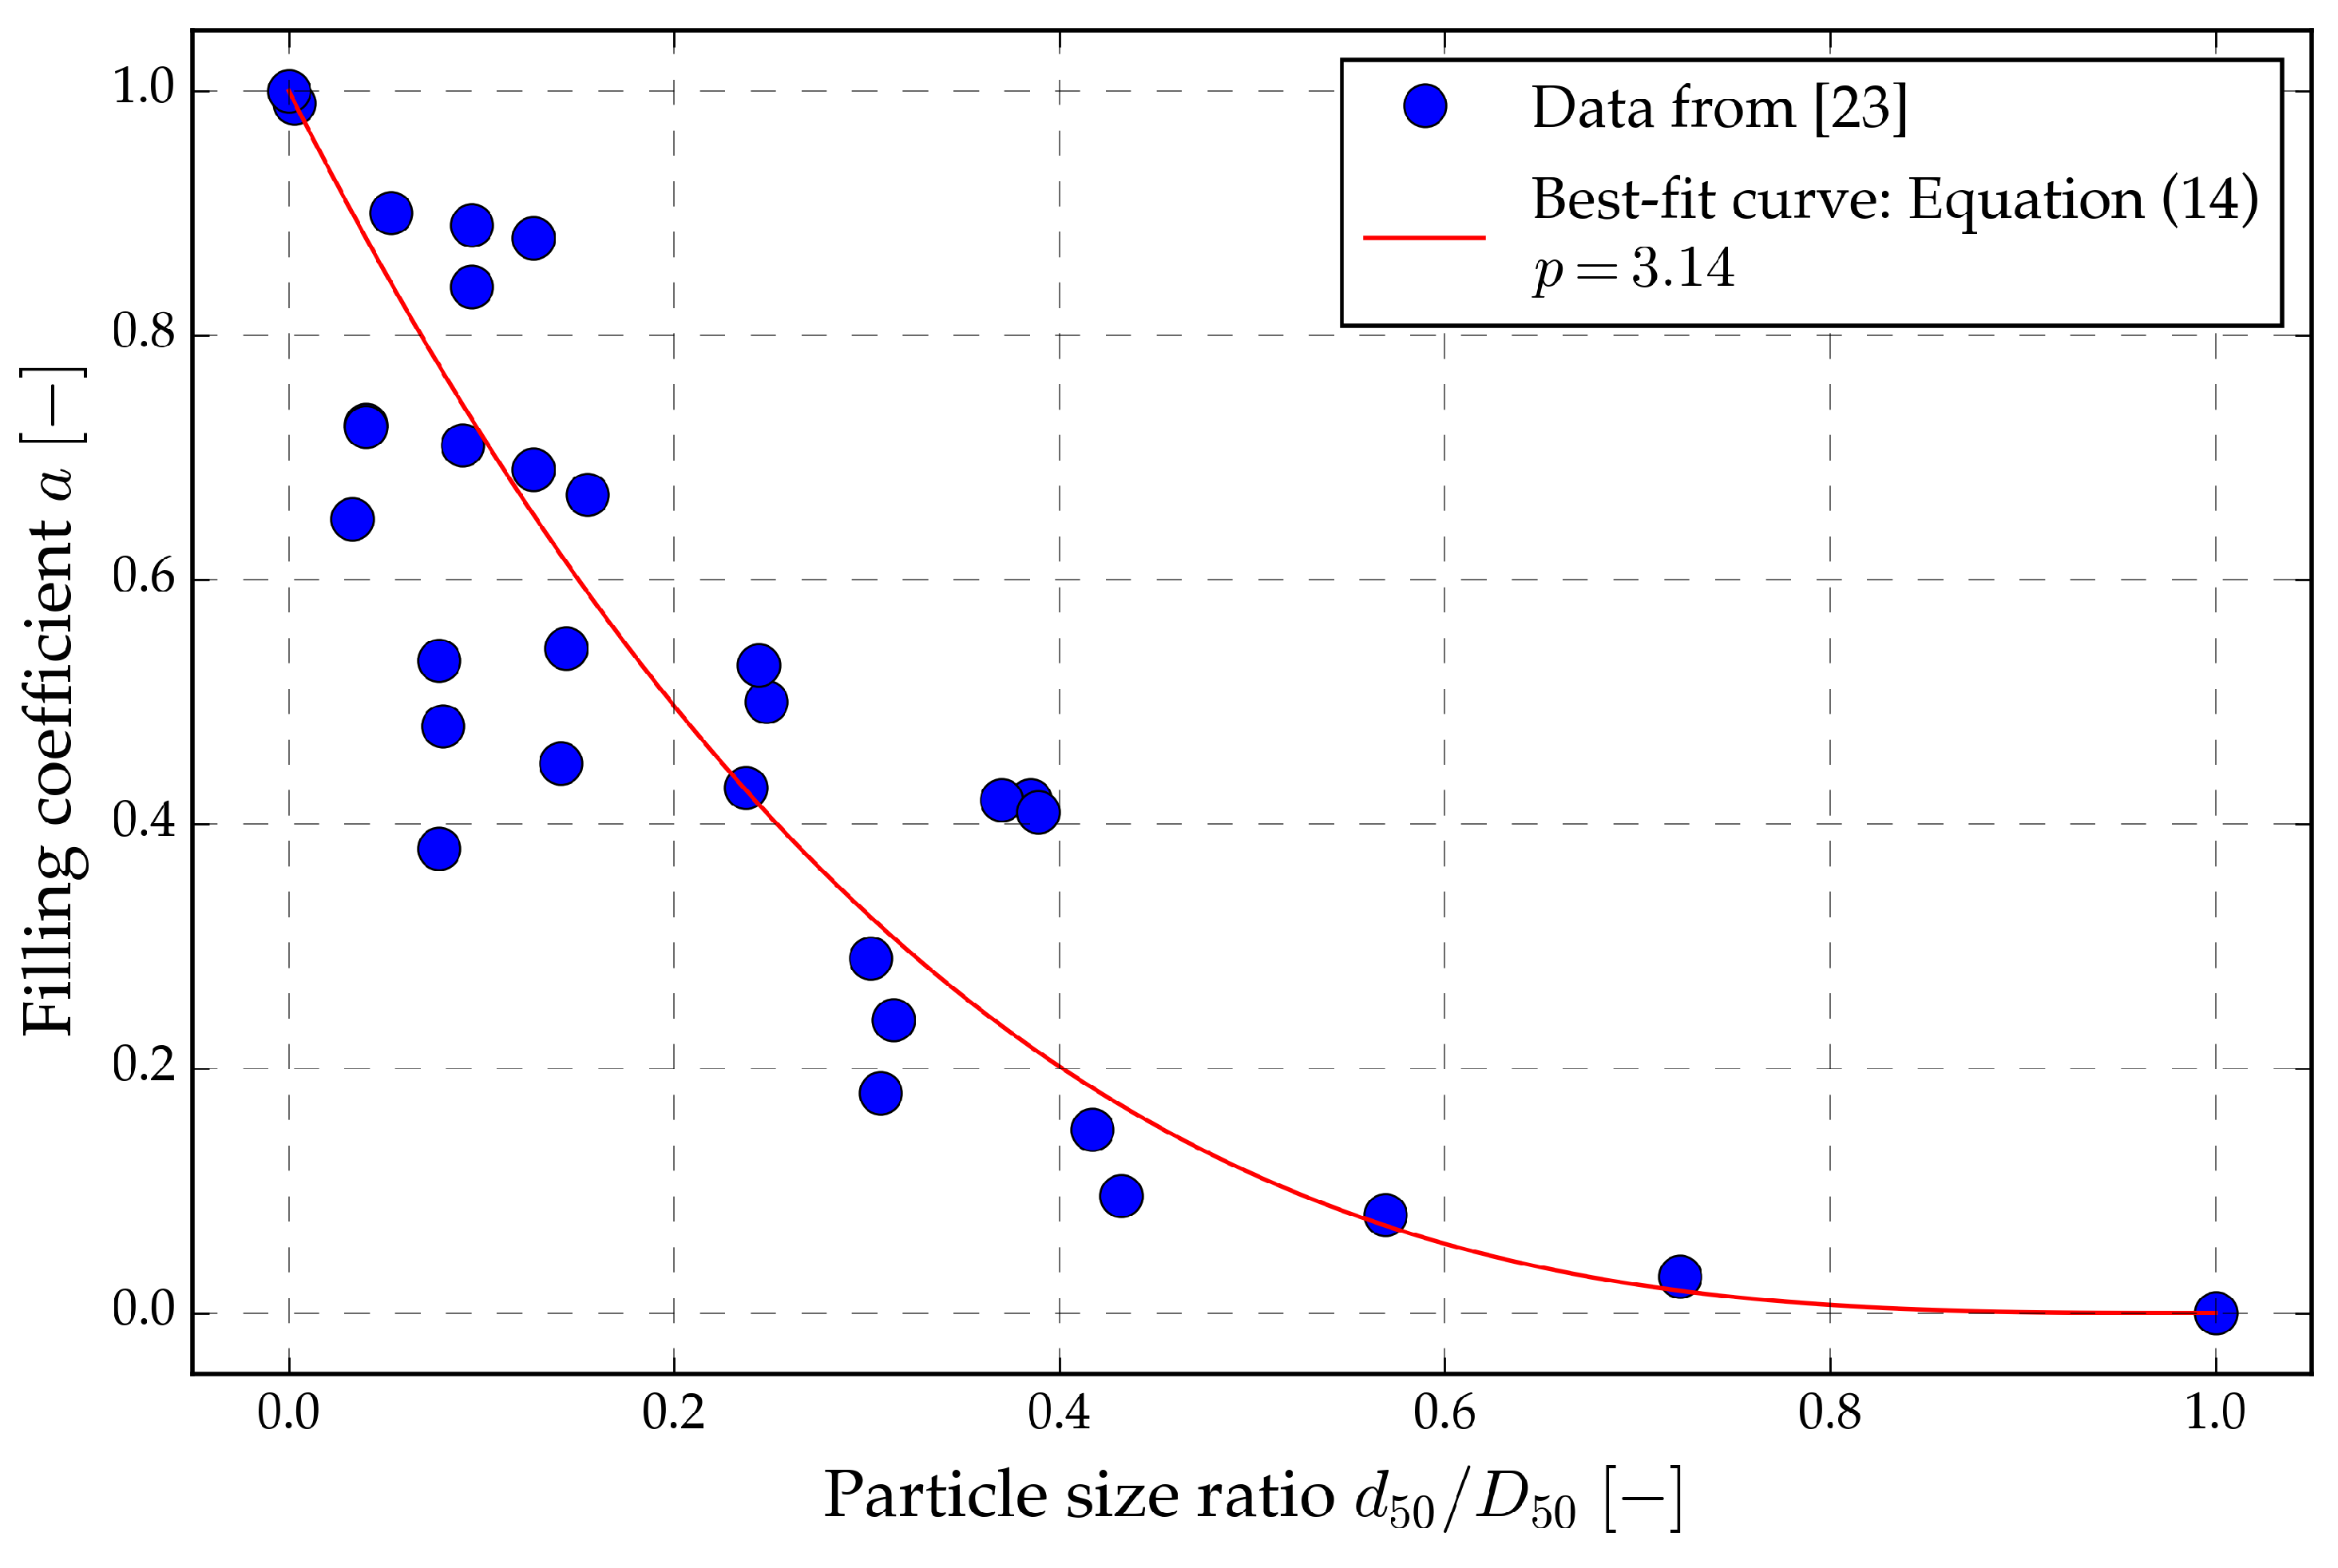
Figure 8.
Results of a drained tests: (a) stress-strain curves and (b) volumetric strain vs axial strain.
Figure 8.
Results of a drained tests: (a) stress-strain curves and (b) volumetric strain vs axial strain.
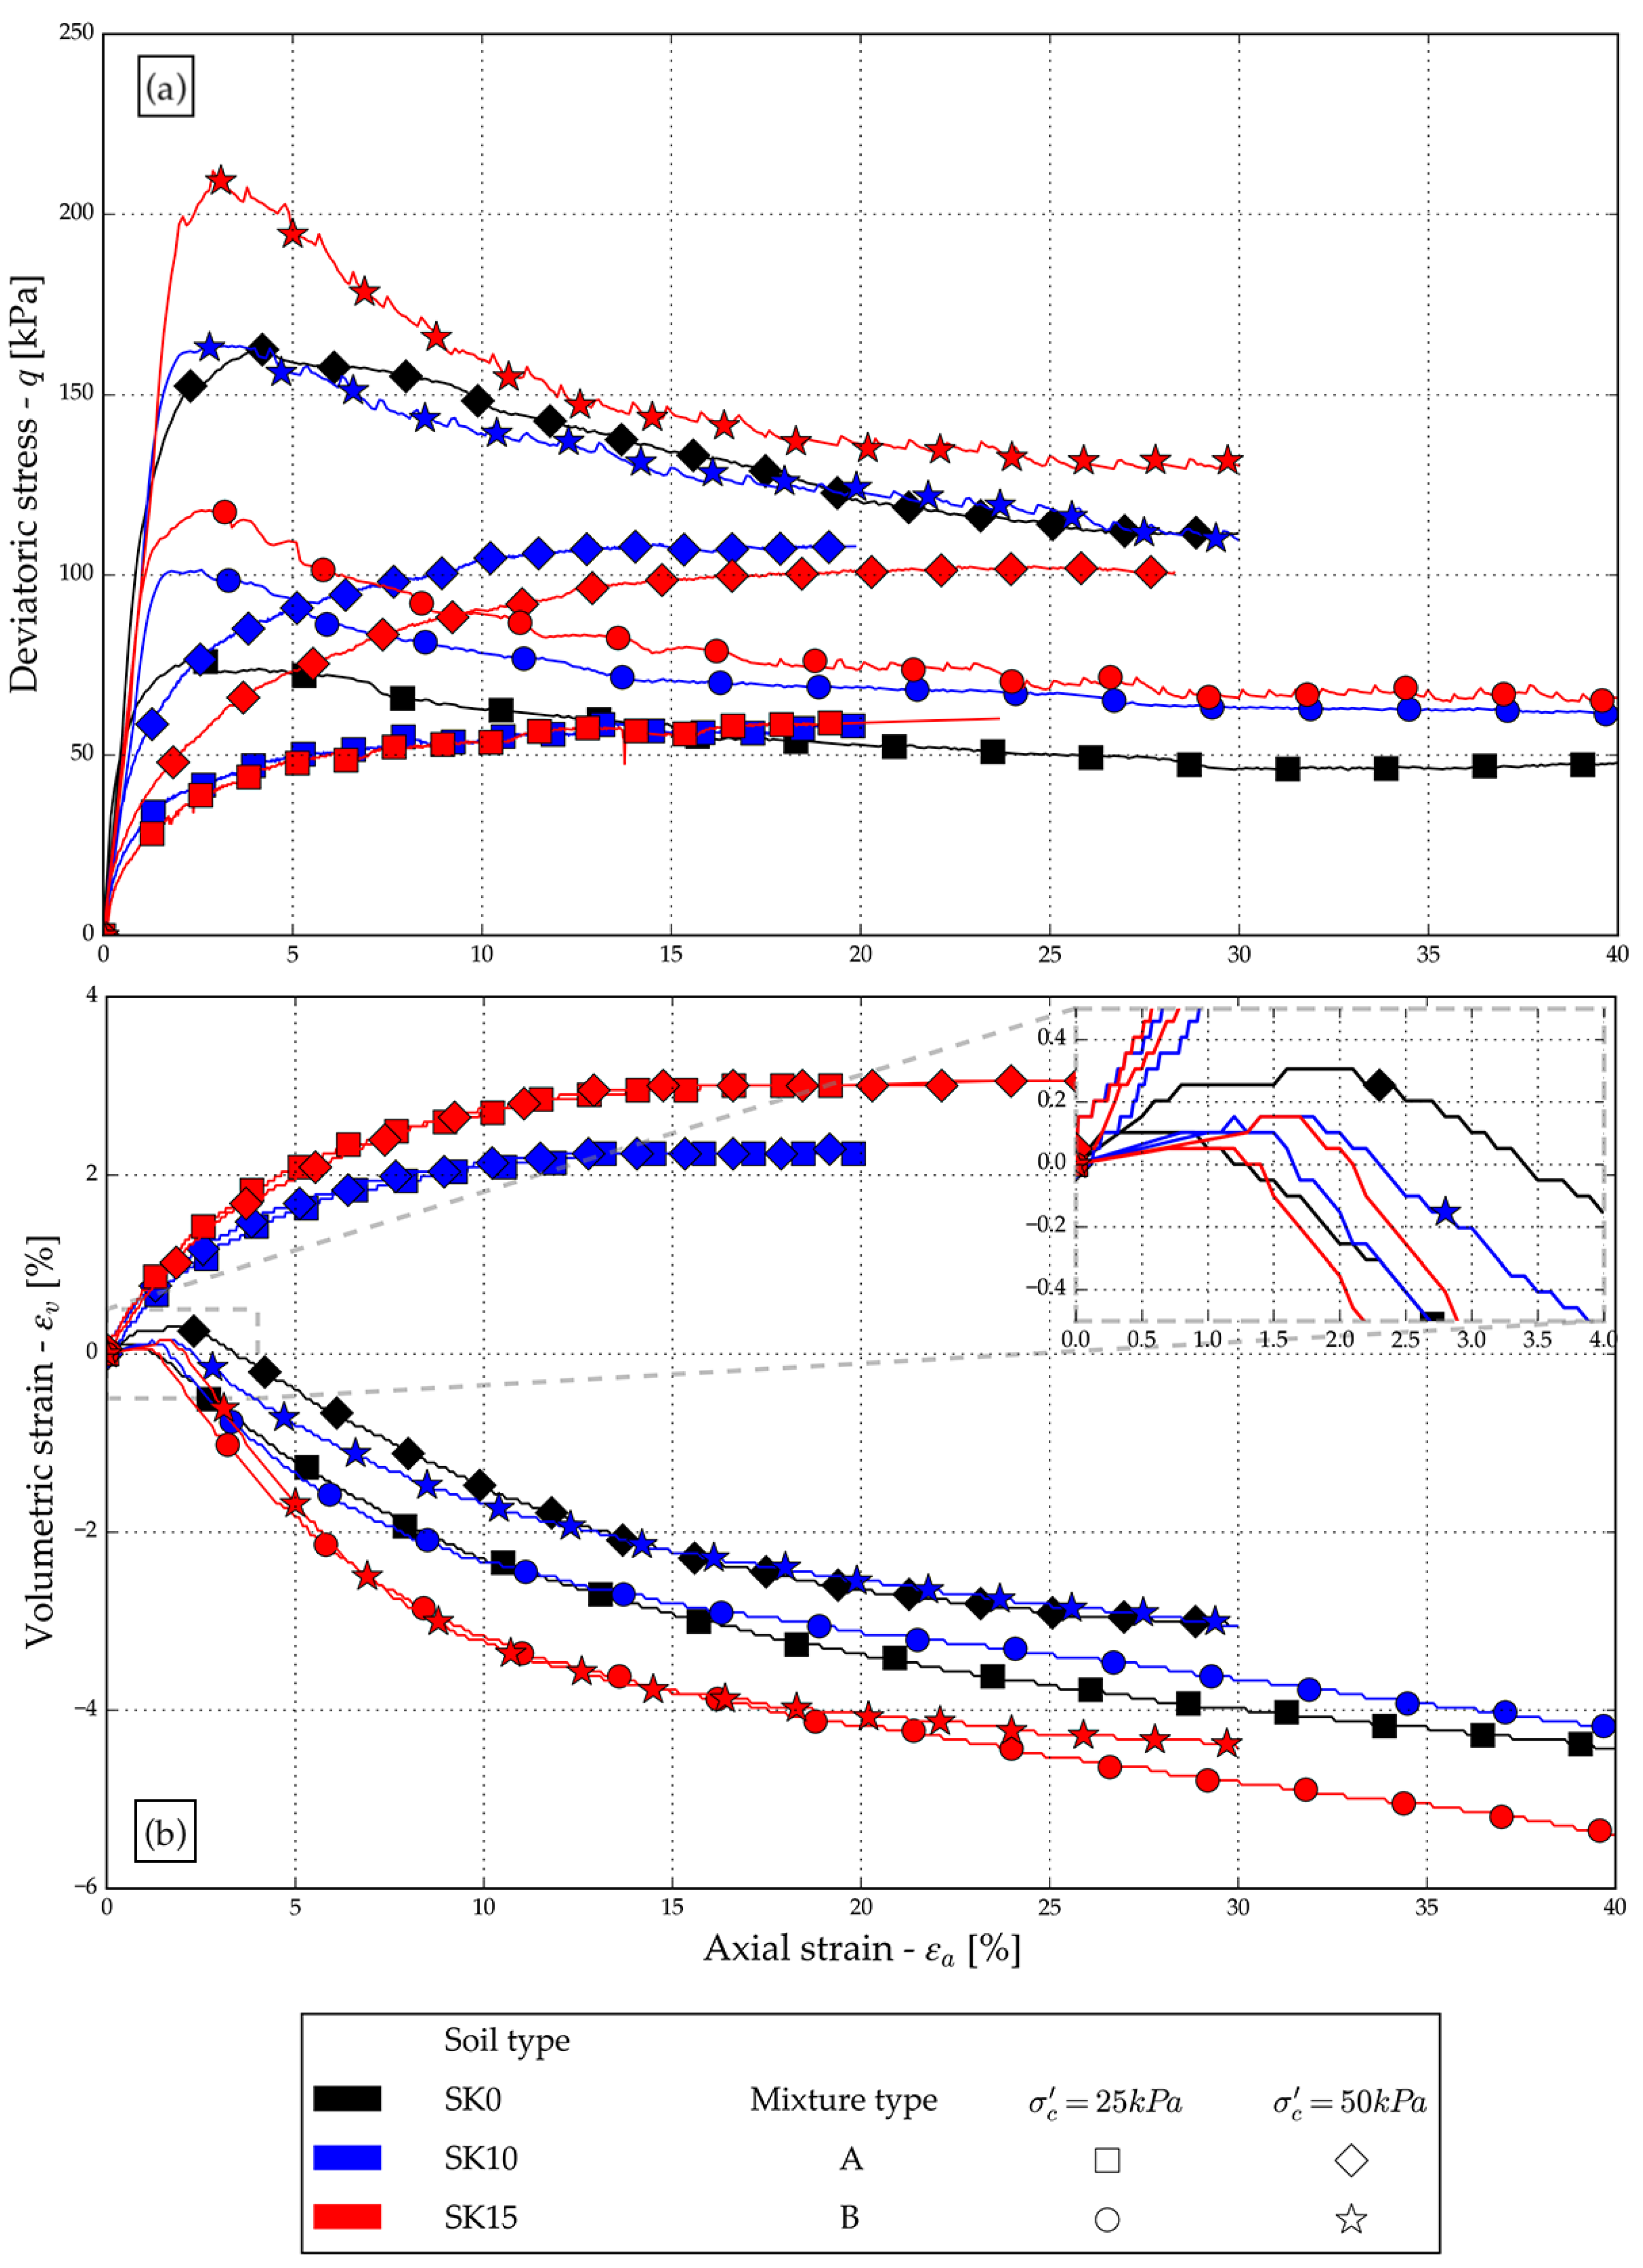
Figure 9.
Drained stress-path presentation of the tested mixtures compared with the determined critical state line for each specimen type.
Figure 9.
Drained stress-path presentation of the tested mixtures compared with the determined critical state line for each specimen type.
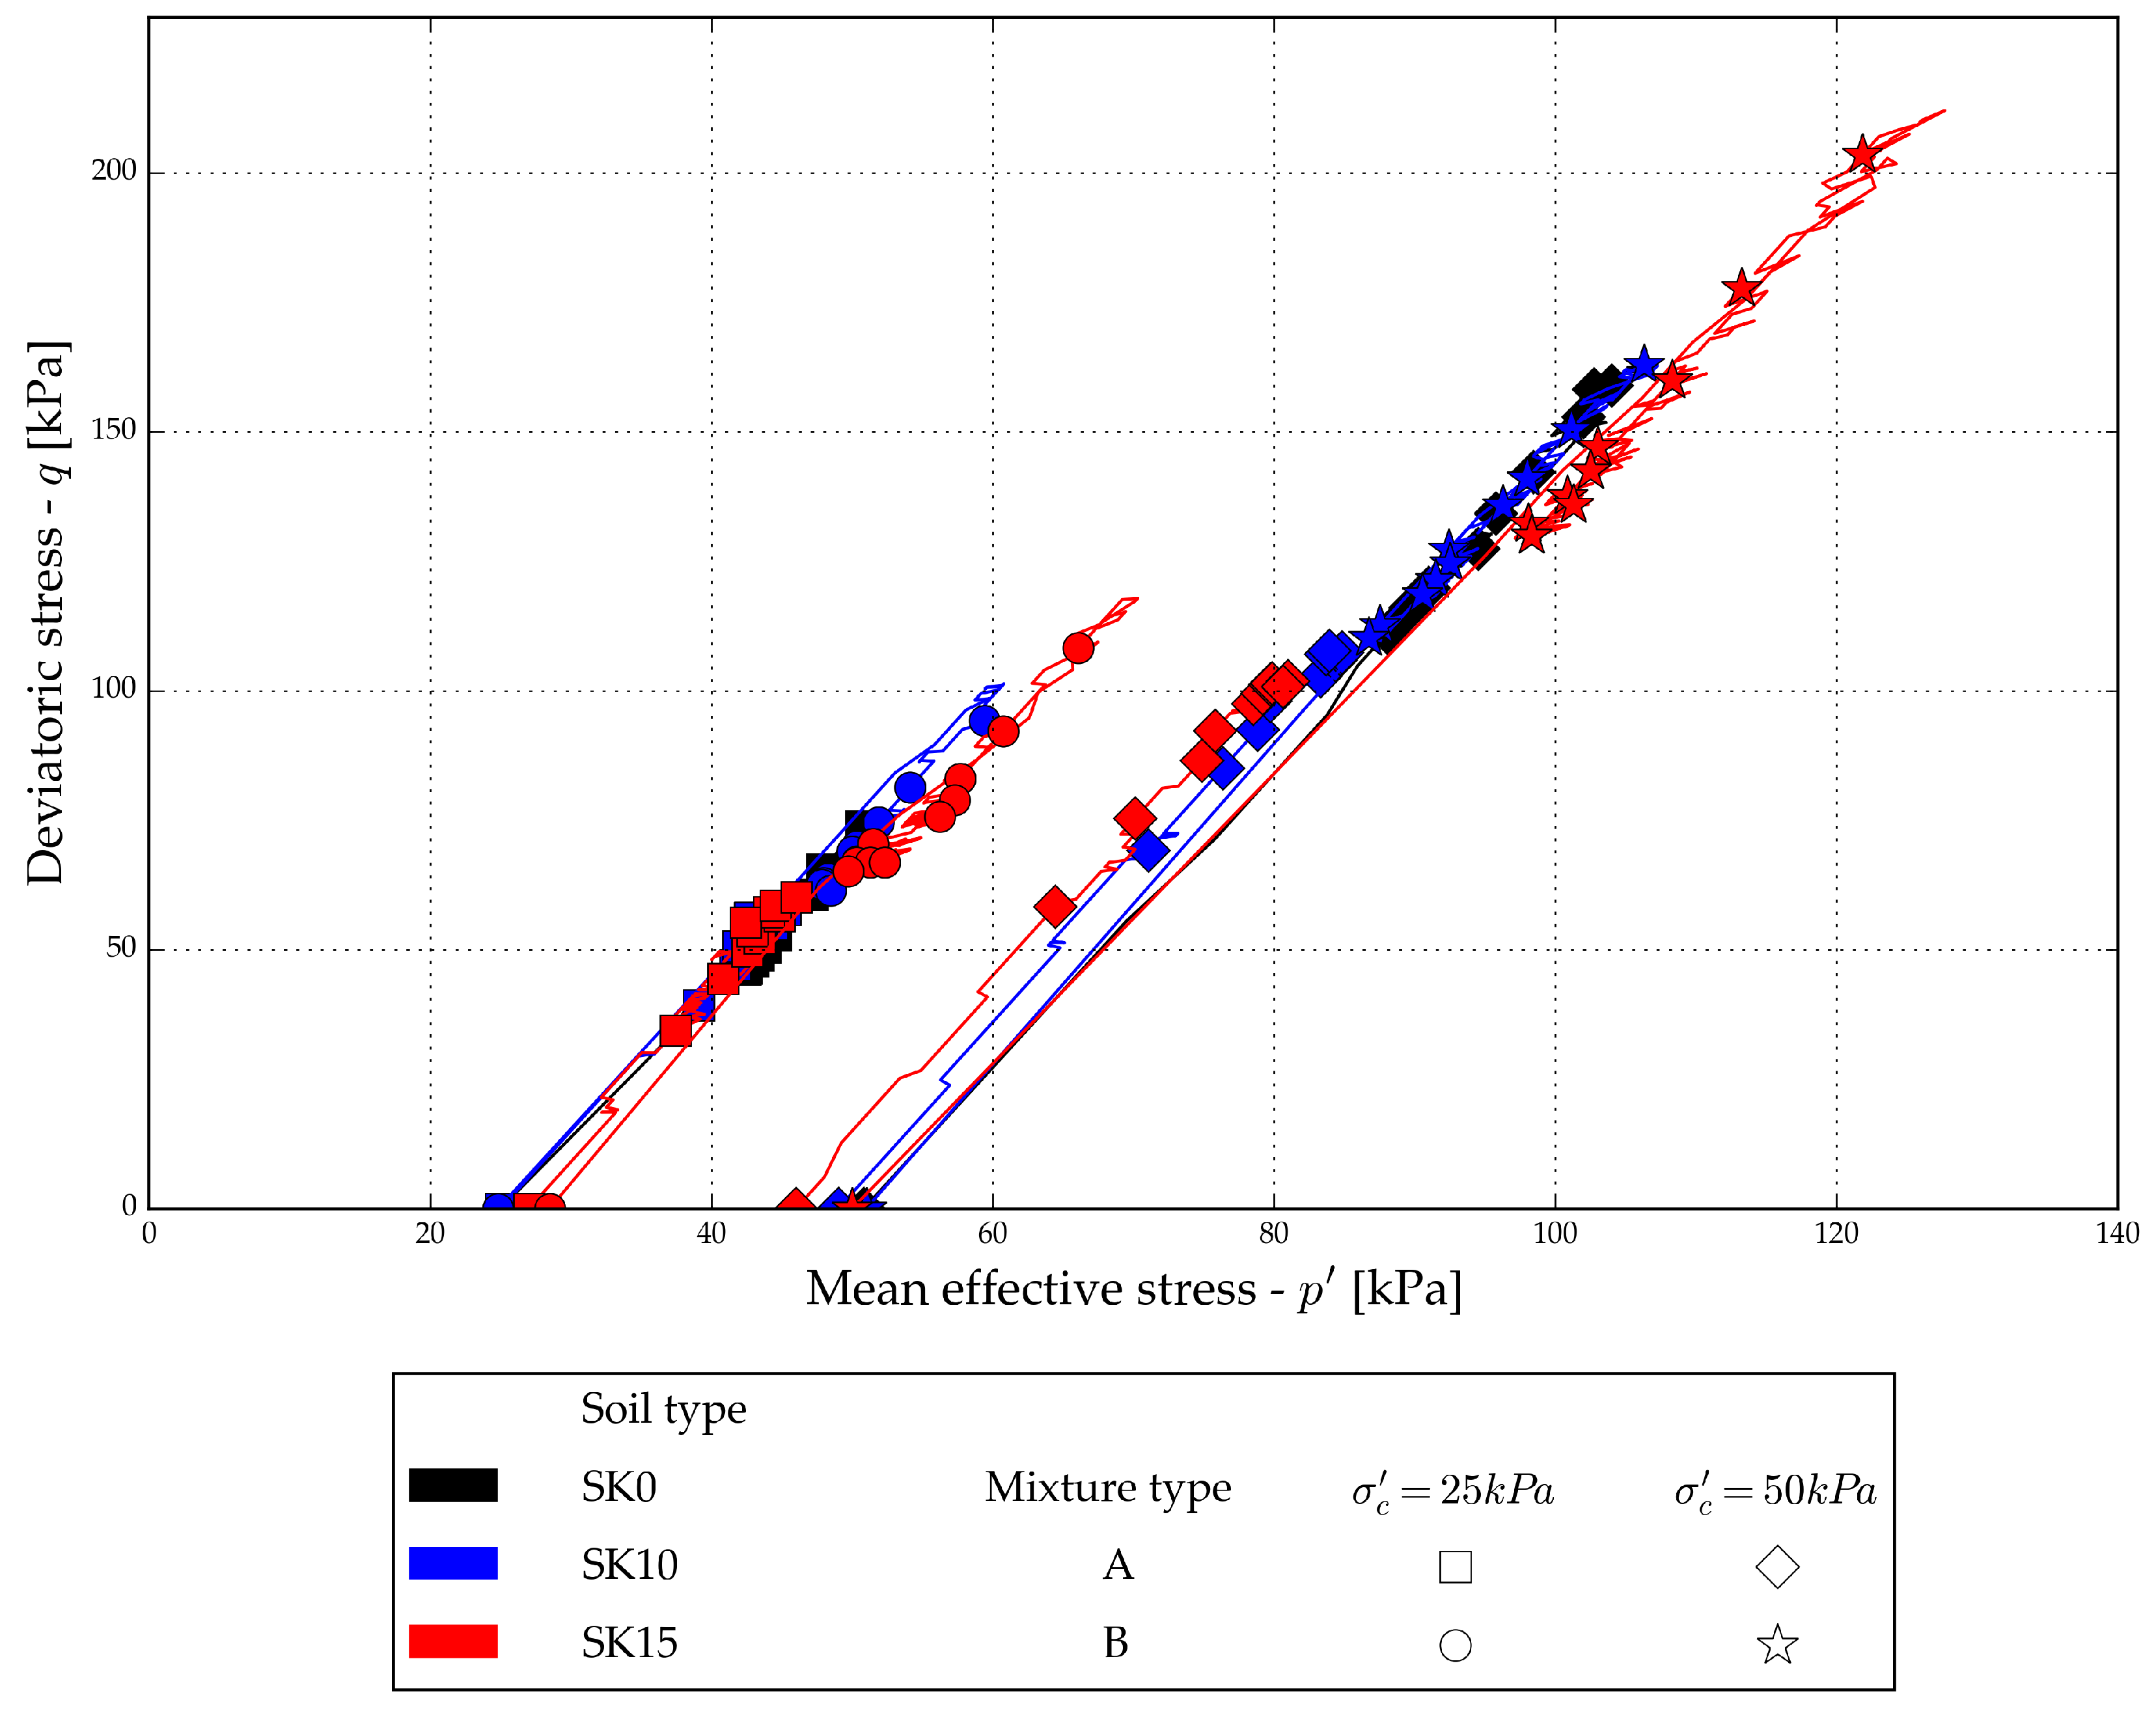
Figure 10.
Peak and critical state values with assumed peak and critical lines.
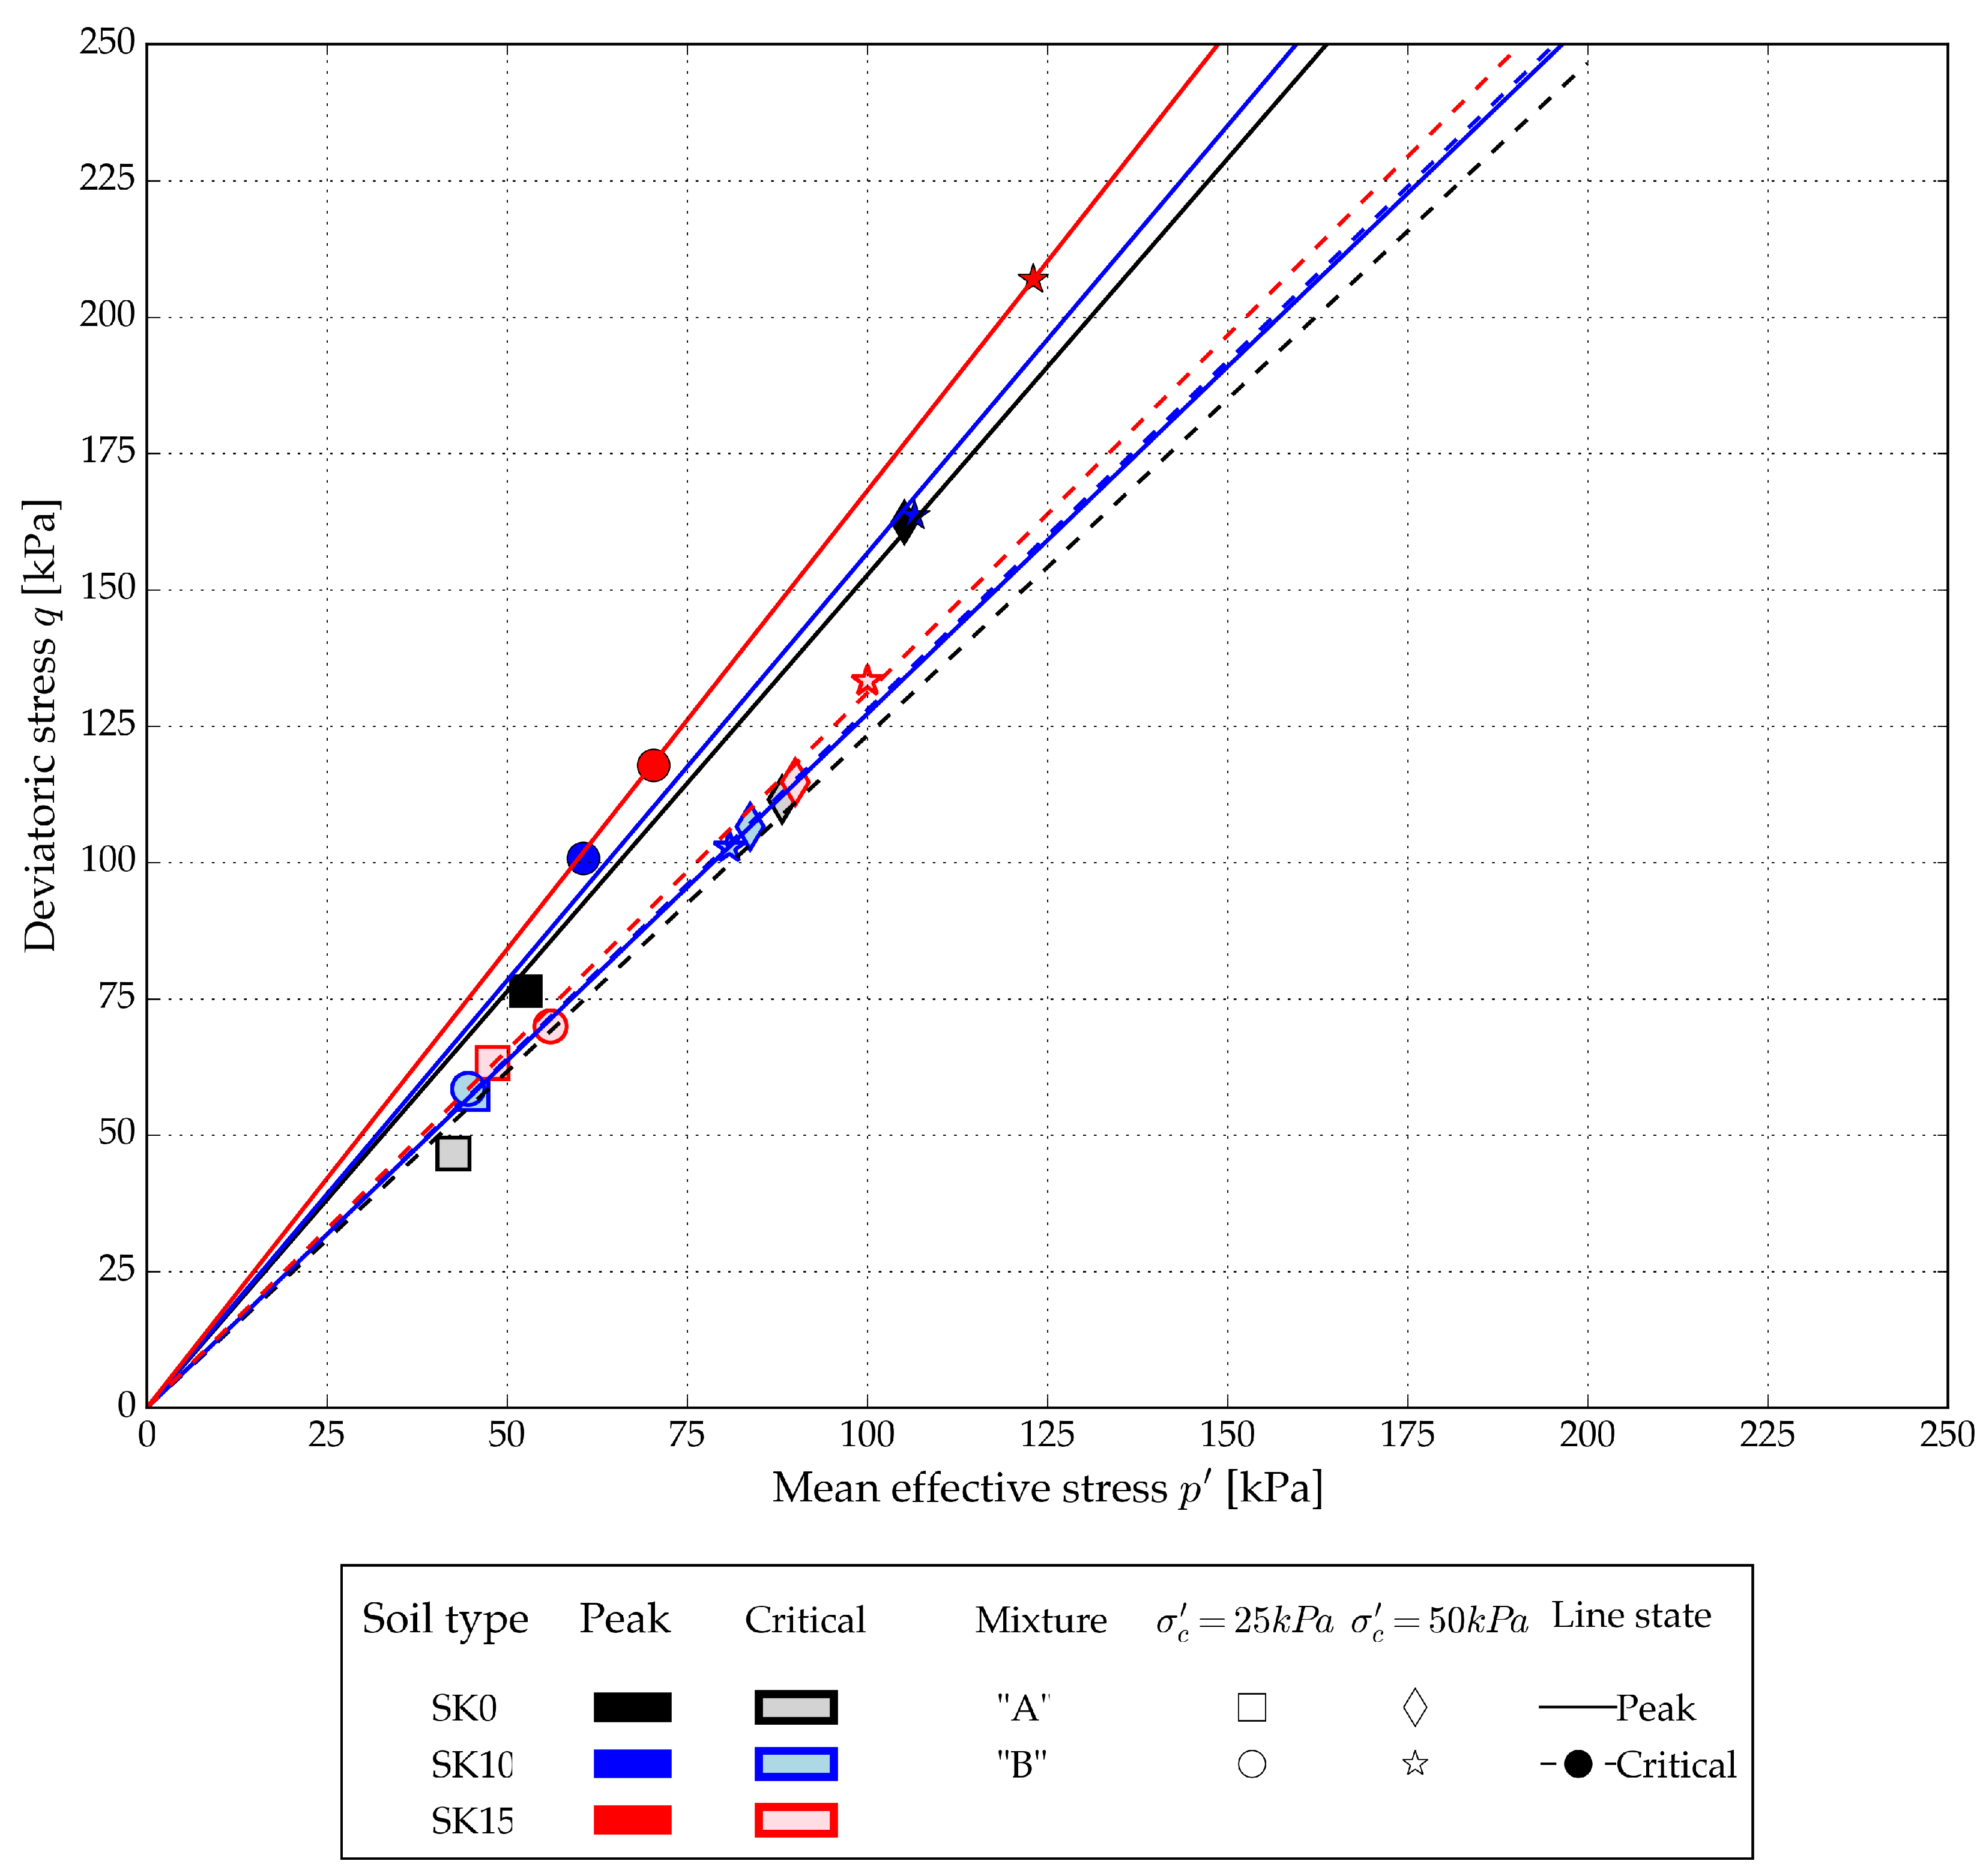
Figure 11.
Results of a drained tests: (a) stress-strain curves and (b) volumetric strain vs axial strain.
Figure 11.
Results of a drained tests: (a) stress-strain curves and (b) volumetric strain vs axial strain.
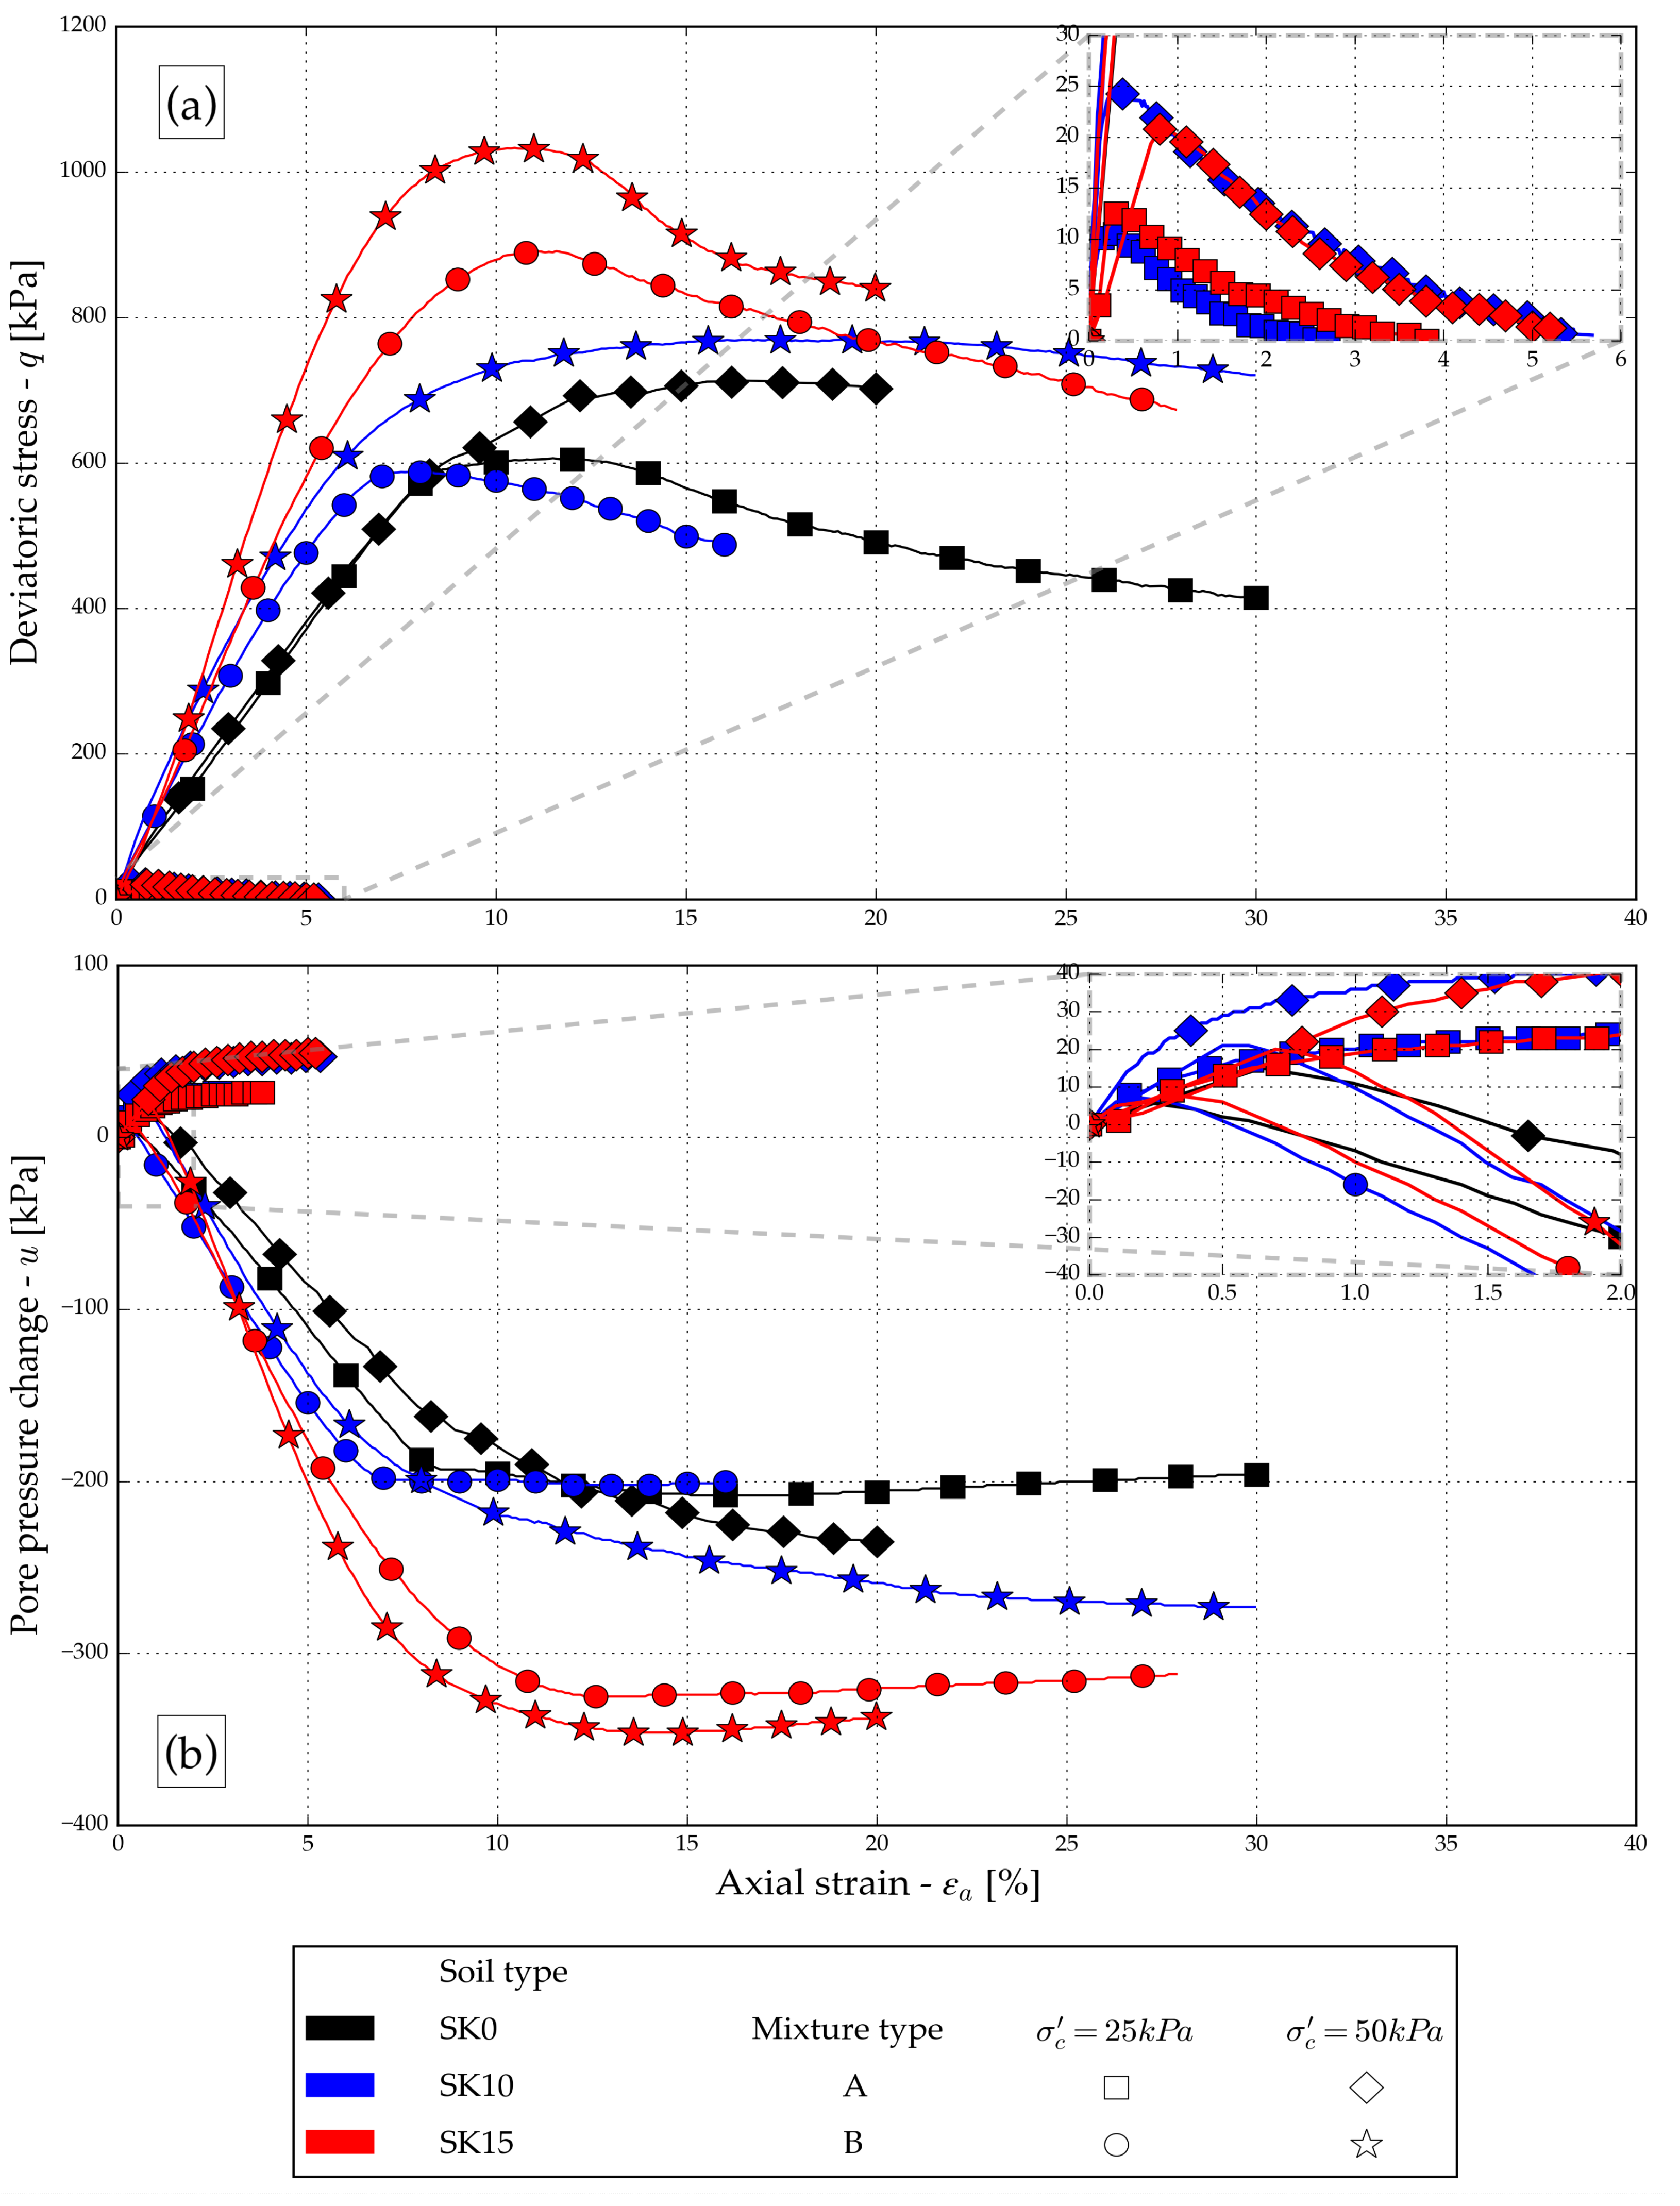
Figure 12.
Undrained stress-path presentation of the tested mixtures compared with the determined steady state line for each specimen type.
Figure 12.
Undrained stress-path presentation of the tested mixtures compared with the determined steady state line for each specimen type.
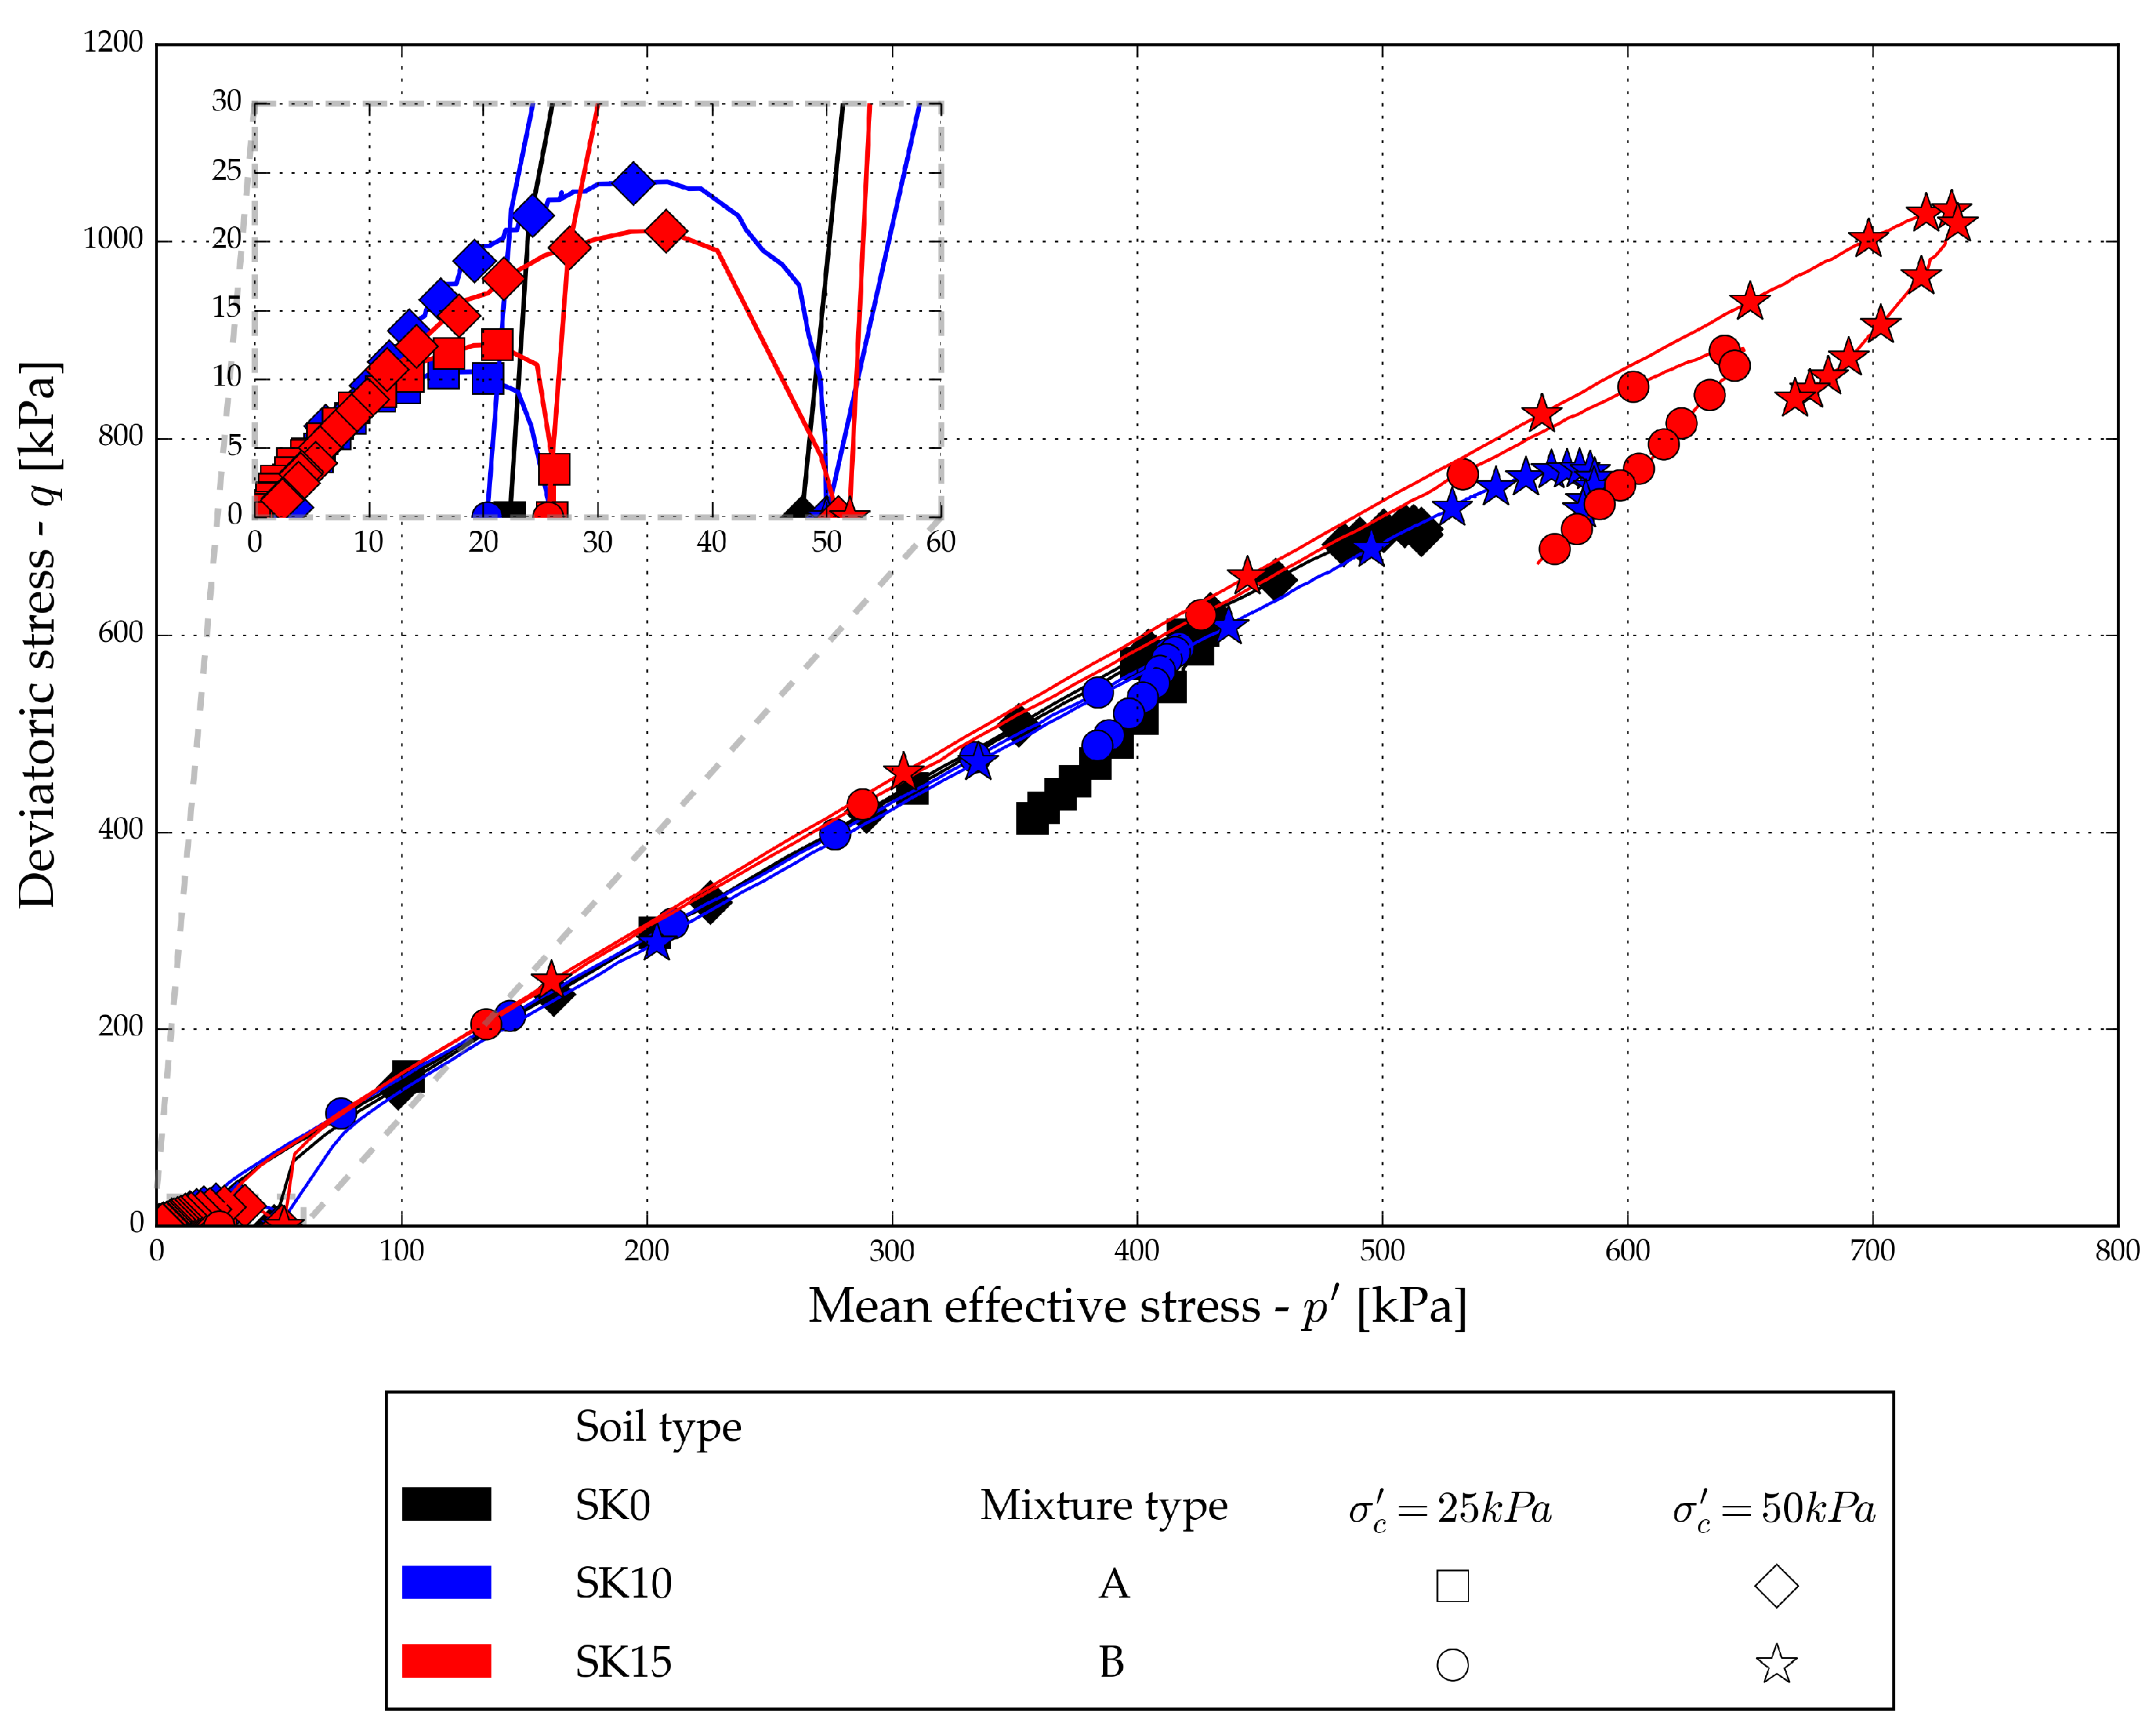
Figure 13.
Ultimate state and steady state values with assumed ultimate and steady state lines.
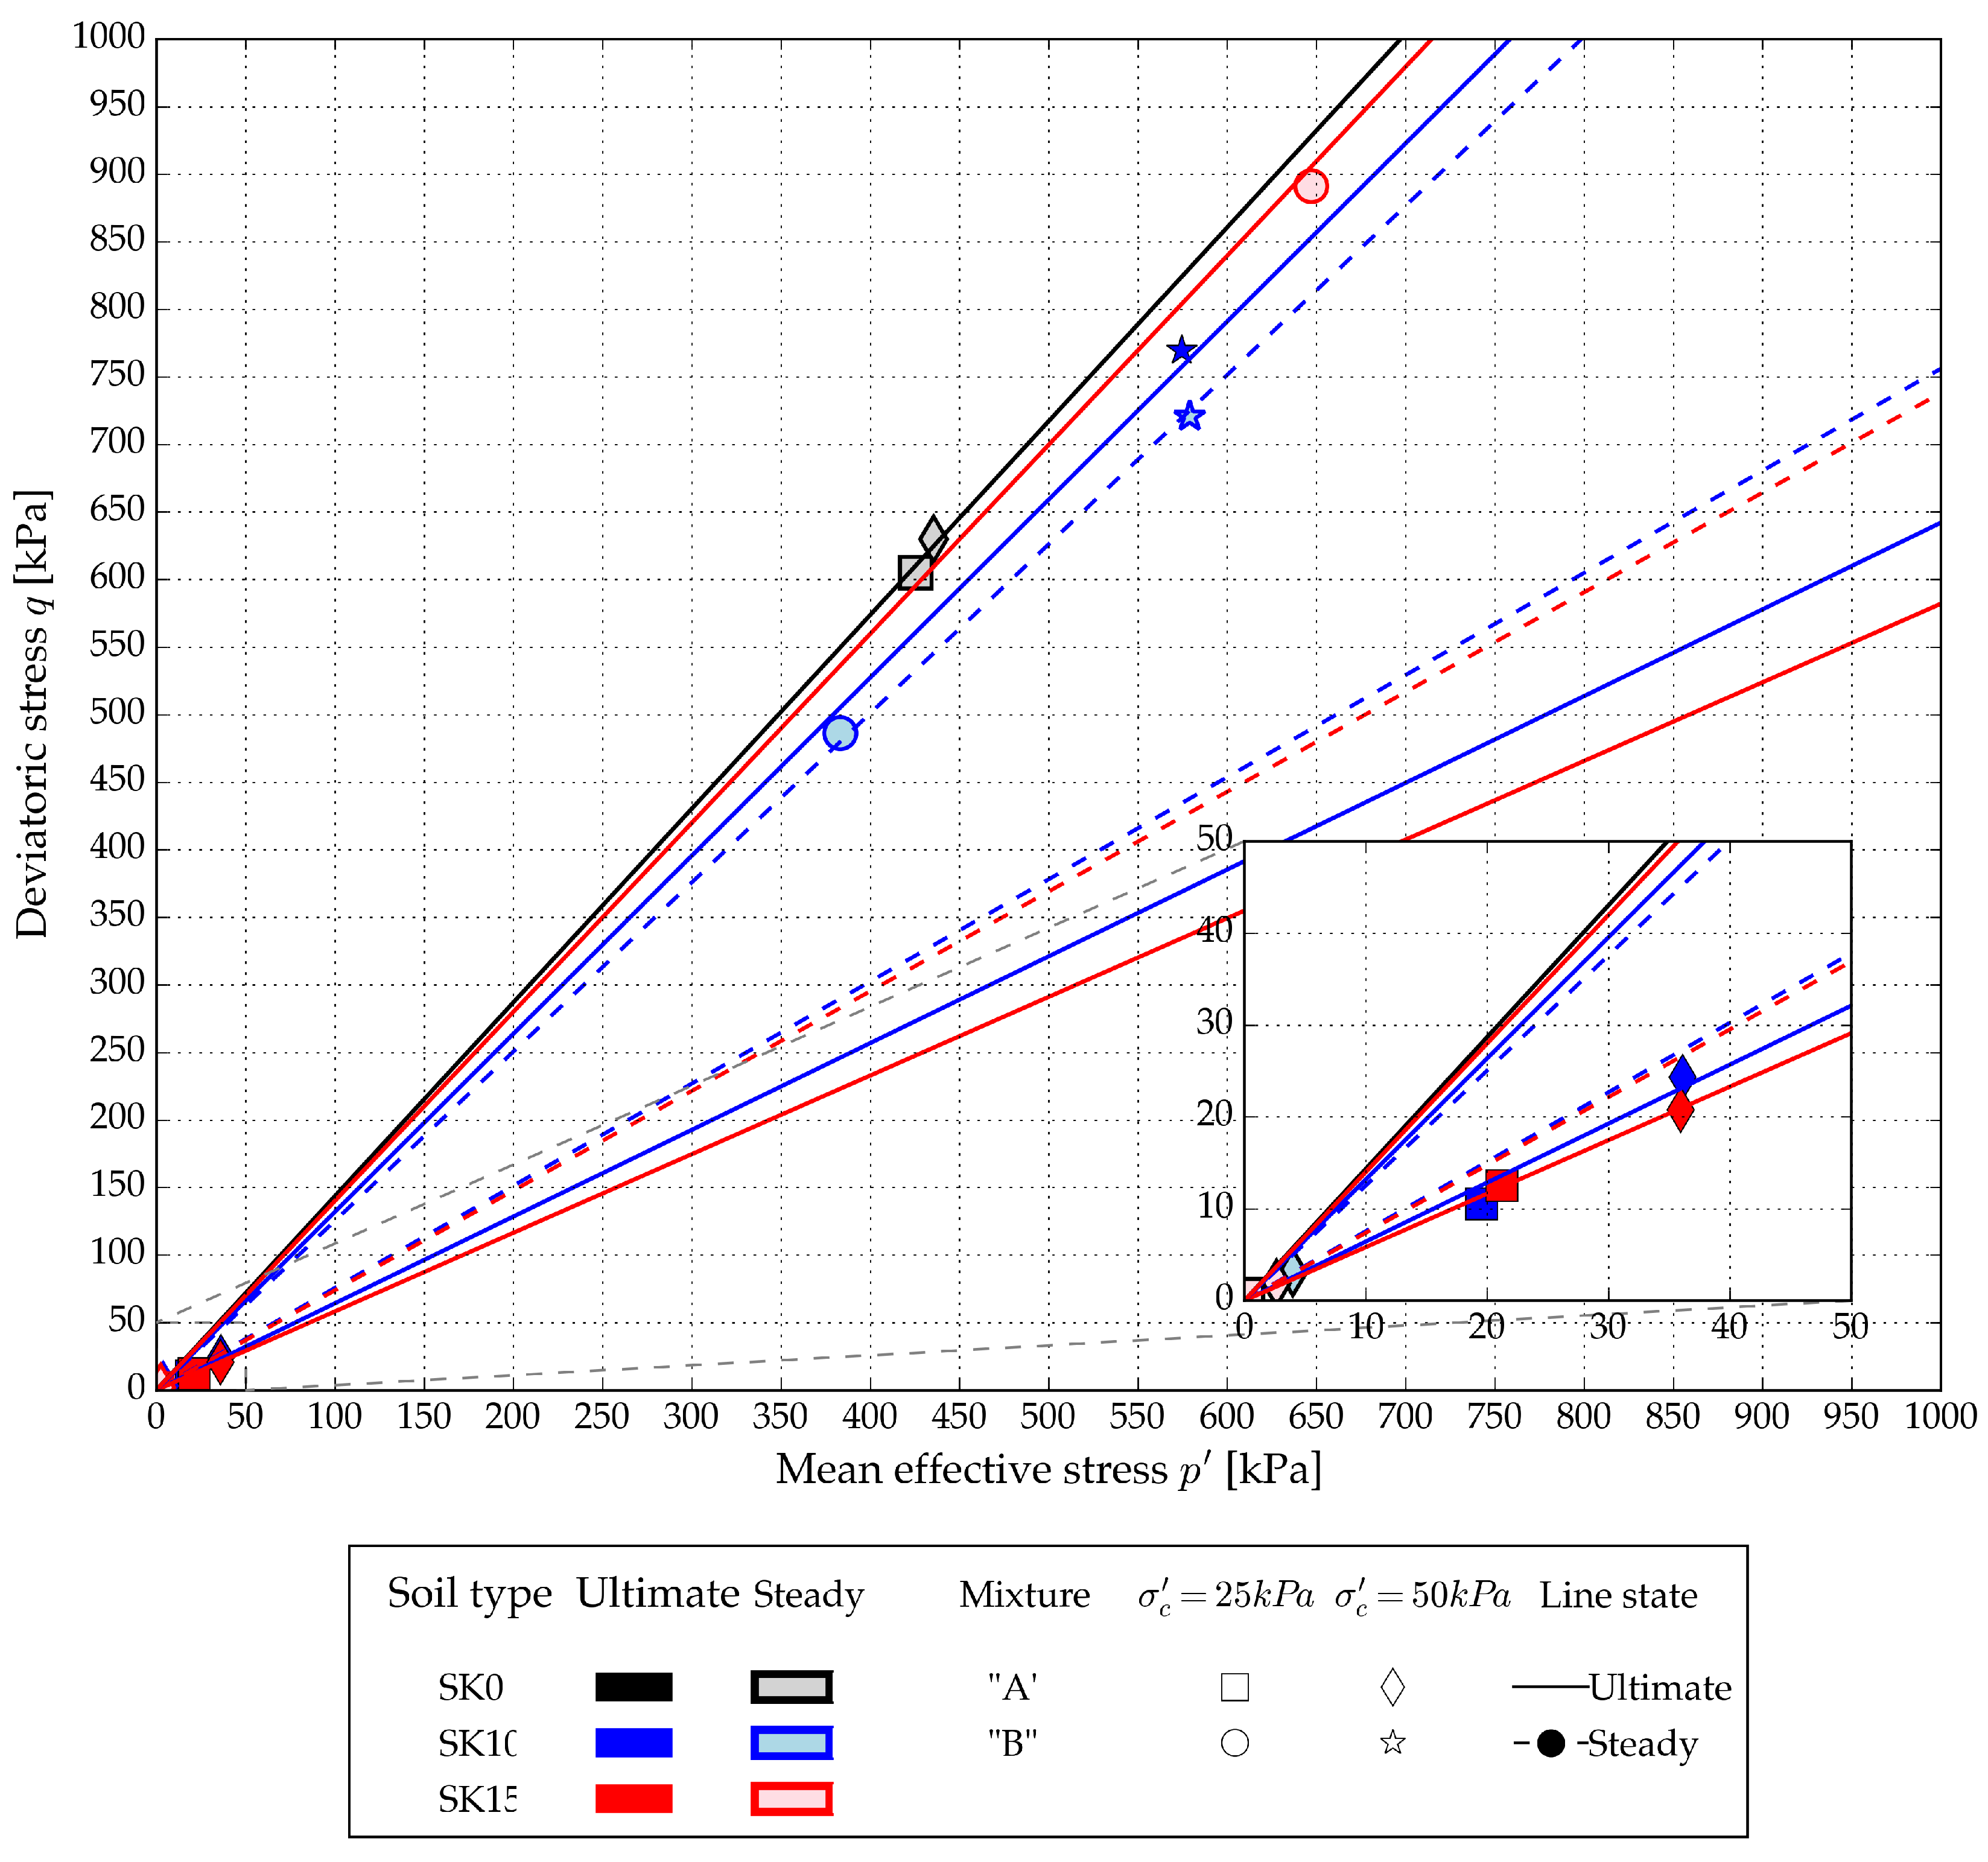

Table 1.
Tested specimens’ kaolinite (K) and sand (S) content.
| Soil type | Sand (S) [%] | Kaolinite (K) [%] |
|---|---|---|
| Modland (SK0) | 100 | 0 |
| SK10 | 90 | 10 |
| SK15 | 85 | 15 |
| Kaolinite (SK100) | 0 | 100 |
Table 2.
Tested soil specimens’ physical properties.
| Soil Type | Specific Gravity () | (mm) | (mm) | (mm) | Liquid Limit (%) | Plastic Limit (%) |
|---|---|---|---|---|---|---|
| SK0 | 2.70 | 0.1713 | 0.2888 | N/A | N/A | N/A |
| SK10 | 2.69 | 0.0535 | 0.2757 | N/A | N/A | N/A |
| SK15 | 2.67 | 0.0063 | 0.2701 | N/A | N/A | N/A |
| SK100 | 2.60 | 0.0026 | 0.0047 | 0.0047 | 53 | 30 |
Table 3.
Tested soil specimens’ physical properties
| Test ID | Soil Type | Mixture Type | Relative Density | Effective Mean Confining Stress | Test Type |
|---|---|---|---|---|---|
| 050_SK0_DR_EFF25 | SK0 | N/A | 80 | 25 | CID |
| 041_SK0_DR_EFF50 | SK0 | N/A | 80 | 50 | CID |
| 015_SK10_A_DR_EFF25 | SK10 | A | 80 | 25 | CID |
| 021_SK10_A_DR_EFF50 | SK10 | A | 80 | 50 | CID |
| 018_SK15_A_DR_EFF25 | SK15 | A | 80 | 25 | CID |
| 012_SK15_A_DR_EFF50 | SK15 | A | 80 | 50 | CID |
| 049_SK10_B_DR_EFF25 | SK10 | B | 80 | 25 | CID |
| 046_SK10_B_DR_EFF50 | SK10 | B | 80 | 50 | CID |
| 048_SK15_B_DR_EFF25 | SK15 | B | 80 | 25 | CID |
| 047_SK15_B_DR_EFF50 | SK15 | B | 80 | 50 | CID |
| 042_SK0_UND_EFF25 | SK0 | N/A | 80 | 25 | CIU |
| 015_SK0_UND_EFF50 | SK0 | N/A | 80 | 50 | CIU |
| 016_SK10_A_UND_EFF25 | SK10 | A | 80 | 25 | CIU |
| 020_SK10_A_UND_EFF50 | SK10 | A | 80 | 50 | CIU |
| 007_SK15_A_UND_EFF25 | SK15 | A | 80 | 25 | CIU |
| 054_SK15_A_UND_EFF50 | SK15 | A | 80 | 50 | CIU |
| 043_SK10_B_UND_EFF25 | SK10 | B | 80 | 25 | CIU |
| 035_SK10_B_UND_EFF50 | SK10 | B | 80 | 50 | CIU |
| 044_SK15_B_UND_EFF25 | SK15 | B | 80 | 25 | CIU |
| 045_SK15_B_UND_EFF50 | SK15 | B | 80 | 50 | CIU |
A – reconstituted using void ratios determined with conventional methods for sands (A-mixtures). B – reconstituted using analytically determined alternative void ratios (B-mixtures). CID - Consolidated Isotropically Drained. CIU - Consolidated Isotropically Undrained.
Table 4.
Conventionally determined minimum () and maximum ()void ratios.
| Specimen Type | Minimum Void Ratio | Maximum Void Ratio |
|---|---|---|
| SK0 | 0.641 | 0.911 |
| SK10 | 0.596 | 1.022 |
| SK15 | 0.640 | 1.128 |
| SK100 | 0.780 | 1.378 |
Table 5.
Determined B-mixtures parameters used for alternative void ratios determination.
| Filling Coefficient | Mean Grain Size Ratio | Power Fit Parameter p | Filling Constant | Filling Constant |
|---|---|---|---|---|
| 0.957 | 0.014 | 3.14 | 1.151 | 0.173 |
Table 6.
SK10 and SK15 alternative void ratios (B-mixtures) comparison with the ones obtained with conventional methods (A-mixtures).
Table 6.
SK10 and SK15 alternative void ratios (B-mixtures) comparison with the ones obtained with conventional methods (A-mixtures).
| Soil Type | Void Ratio | B - Mixtures | A - Mixture |
|---|---|---|---|
| SK10 | 0.479 | 0.596 | |
| 0.725 | 1.022 | ||
| SK15 | 0.399 | 0.64 | |
| 0.632 | 1.128 |
Table 7.
Summary of specimens with relative density of 80%, initial conditions and critical state values.
Table 7.
Summary of specimens with relative density of 80%, initial conditions and critical state values.
| Initial Conditions | Peak State Values | Critical State Values | ||||
|---|---|---|---|---|---|---|
| Test ID | Initial void ratio [-] | Confining mean effective stress [kPa] | Stress ratio at peak [-] | Void ratio at critical state [-] | Stress ratio at critical state [-] | Mean effective stress at critical state [kPa] |
| 050_SK0_DR_EFF25 | 0.695 | 25 | 1.454 | 0.693 | 1.096 | 42.55 |
| 041_SK0_DR_EFF50 | 0.695 | 50 | 1.545 | 0.690 | 1.265 | 88.17 |
| 015_SK10_A_DR_EFF25 | 0.681 | 25 | 1.274 | 0.652 | 1.274 | 45.19 |
| 021_SK10_A_DR_EFF50 | 0.681 | 50 | 1.272 | 0.652 | 1.272 | 83.78 |
| 018_SK15_A_DR_EFF25 | 0.738 | 25 | 1.318 | 0.705 | 1.318 | 48.00 |
| 012_SK15_A_DR_EFF50 | 0.738 | 50 | 1.275 | 0.705 | 1.275 | 90.00 |
| 049_SK10_B_DR_EFF25 | 0.522 | 25 | 1.663 | 0.519 | 1.313 | 44.59 |
| 046_SK10_B_DR_EFF50 | 0.522 | 50 | 1.536 | 0.519 | 1.270 | 80.89 |
| 048_SK15_B_DR_EFF25 | 0.436 | 25 | 1.677 | 0.435 | 1.250 | 56.00 |
| 047_SK15_B_DR_EFF50 | 0.436 | 50 | 1.683 | 0.434 | 1.333 | 100.00 |
Table 8.
Summary of undrained tests with initial conditions, undrained instability state and steady state values.
Table 8.
Summary of undrained tests with initial conditions, undrained instability state and steady state values.
| Initial Condition | Undrained Instability State | Steady State | ||||
|---|---|---|---|---|---|---|
| Test ID | Void ratio [-] | Confining mean effective stress [kPa] | Mean effective stress [kPa] | Deviatoric stress [kPa] | Mean effective stress [kPa] | Deviatoric stress [kPa] |
| 042_SK0_UND_EFF25 | 0.695 | 25 | 425.68 | 605.05 | 425.68 | 605.05 |
| 015_SK0_UND_EFF50 | 0.695 | 50 | 435.49 | 630.03 | 435.49 | 630.03 |
| 016_SK10_A_UND_EFF25 | 0.681 | 25 | 19.52 | 10.56 | 0.05 | 0.16 |
| 020_SK10_A_UND_EFF50 | 0.681 | 50 | 36.11 | 24.23 | 4.01 | 3.03 |
| 007_SK15_A_UND_EFF25 | 0.738 | 25 | 21.17 | 12.52 | 0.22 | 0.65 |
| 054_SK15_A_UND_EFF50 | 0.738 | 50 | 35.93 | 20.79 | 2.63 | 1.9 |
| 043_SK10_B_UND_EFF25 | 0.522 | 25 | 383.14 | 486.42 | 383.14 | 486.42 |
| 035_SK10_B_UND_EFF50 | 0.522 | 50 | 574.56 | 769.69 | 579.28 | 720.83 |
| 044_SK15_B_UND_EFF25 | 0.436 | 25 | 647.11 | 891.32 | 647.11 | 891.32 |
| 045_SK15_B_UND_EFF50 | 0.436 | 50 | 729.41 | 1033.24 | 729.41 | 1033.24 |
Disclaimer/Publisher’s Note: The statements, opinions and data contained in all publications are solely those of the individual author(s) and contributor(s) and not of MDPI and/or the editor(s). MDPI and/or the editor(s) disclaim responsibility for any injury to people or property resulting from any ideas, methods, instructions or products referred to in the content. |
© 2025 by the authors. Licensee MDPI, Basel, Switzerland. This article is an open access article distributed under the terms and conditions of the Creative Commons Attribution (CC BY) license (http://creativecommons.org/licenses/by/4.0/).
Copyright: This open access article is published under a Creative Commons CC BY 4.0 license, which permit the free download, distribution, and reuse, provided that the author and preprint are cited in any reuse.


