
Submitted:
06 August 2025
Posted:
11 August 2025
You are already at the latest version
Abstract
Background/Objectives: Nuchal translucency (NT) measurement is an established first-trimester screening tool for chromosomal abnormalities. However, standardized risk assessment models are only validated for fetuses with a crown-rump length (CRL) between 45 and 84 mm. This study investigates the clinical significance of increased NT in fetuses with a CRL between 35 and 45 mm. Methods: This retrospective study analyzed 208 singleton pregnancies with a CRL <; 45 mm and an NT ≥ 2.5 mm, examined at two tertiary prenatal centers between 2008 and 2024. Data on chromosomal findings, structural anomalies, and pregnancy outcomes were collected through follow-up. Statistical analyses included univariate, bivariate, and ROC curve analysis to determine optimal NT cut-off values for predicting adverse outcomes. Results: Chromosomal abnormalities were present in 67/208 cases (32.2%), with trisomy 18 being the most frequent. Malformations were detected in 46.7% of cases with available follow-up. The optimal NT cut-off for predicting an abnormal karyotype was 3.89 mm (sensitivity 79.1%, specificity 55.3%). Among fetuses with NT ≥ 5.5 mm, the rate of adverse outcomes reached 83.7%. Notably, 29.9% of chromosomal abnormalities would not have been detected by NIPT alone. Overall, the presence of increased NT—even below the standard CRL threshold—was associated with a significantly elevated risk of genetic and structural abnormalities as well as adverse pregnancy outcomes. Conclusions: NT measurement in fetuses with CRL < 45 mm provides clinically relevant prognostic information. Elevated NT in this early gestational window is significantly associated with chromosomal anomalies, structural defects, and poor pregnancy outcomes. Reliance on NIPT alone in this cohort may miss a substantial proportion of abnormal cases. Early NT assessment should prompt comprehensive diagnostic evaluation and genetic counseling, even when CRL is below 45 mm.
Keywords:
nuchal translucency
; pregnancy outcome
; risk assessment
; miscarriage
1. Introduction
Nuchal translucency measurement for risk calculation of chromosomal abnormalities is an established procedure. However, risk calculation is only possible with a fetal crown-rump length of 45mm to 84mm. Due to the German maternity guidelines, the first ultrasound screening takes place between the 9th and 11th week of pregnancy. Therefore, there are repeatedly pregnant women whose fetuses show increased nuchal translucency and for whom no risk calculation can be performed due to a CRL < 45mm. In this study, we have evaluated the outcome in cases of increased NT and a CRL between 35mm and 45mm. Nuchal translucency is defined as the maximum thickness of the subcutaneous translucent space between the skin and soft tissue overlying the cervical spine at the back of the fetal neck, observed during an ultrasound examination in the first trimester. Elevated NT measurements have been correlated with chromosomal and congenital abnormalities [1,2]. Vigilant assessment is critical for fetuses exhibiting increased nuchal translucency, especially when coupled with other abnormalities [3].
The observation of increased nuchal translucency in first-trimester fetuses, particularly those with a crown-rump length of 45 mm or less, presents a diagnostic and management challenge in prenatal care, necessitating a comprehensive evaluation to ascertain potential underlying etiologies and inform subsequent clinical decisions [4]. Increased nuchal translucency, identified through ultrasound, has been associated with a spectrum of fetal aneuploidies, structural anomalies, and genetic syndromes [5]. While nuchal translucency measurement is a routine component of first-trimester screening for chromosomal abnormalities, its interpretation in fetuses with a crown-rump length less than 45 mm requires careful consideration due to the limitations of established risk calculation models. Nuchal translucency screening is used in the first trimester to identify pregnancies at high risk for chromosomal abnormalities such as Down syndrome [6]. Early identification of increased nuchal translucency allows for timely parental counseling, comprehensive diagnostic evaluation, and informed decision-making regarding pregnancy management.
2. Materials and Methods
2.1. Study Design and Patient Selection, Data Collection and Analysis
The present work is a retrospective study. Data were collected from two tertiary referral centers. The patients presented themselves at their own request for first-trimester screening or were referred by their gynecologist. The data refer to cases that were examined in the period from February 2008 to February 2024. The datasets were created using the program VIEWPOINT (GE Healthcare, Solingen, Germany) or ASTRAIA (Nexus/Astraia, Ismaning, Germany). The indications for the examination were the exclusion of conspicuous nuchal translucency or fetal pathology, advanced maternal age, maternal anxiety, family history and pregnancies with genetic or structural abnormalities. Inclusion criteria for data collection were singleton pregnancy, CRL 4.5mm and NT ≥ 2.5mm. The study population consists of 208 cases that met these inclusion criteria. All data were stored in two computer-aided databases, Astraia and Viewpoint. Information about the outcome of the pregnancy was provided by the gynecologists, the maternity clinics, or the patients. The nuchal translucency (NT) was measured according to the guidelines of the Fetal Medicine Foundation (FMF), based on the gestational week and crown-rump length (CRL) [7]. A detailed ultrasound examination was performed on all fetuses to identify other structural anomalies. All ultrasound examinations were performed by qualified DEGUM II or DEGUM III certified examiners (Deutsche Gesellschaft für Ultraschall in der Medizin, DEGUM). All patients underwent genetic counseling with the option for invasive diagnostic testing (chorionic villus sampling or amniocentesis). Karyotype was determined through invasive diagnostic testing, NIPT testing, a combination of the two, or genetic examination of the aborted material.
2.2. Statistical Analysis - Data Distribution:
The collected data were initially documented in a Microsoft Excel. After collection, it was anonymized and encrypted for storage. The Excel spreadsheet listed the maternal age, CRL, NT, the name of the examiner, the gestational age, the karyotyping or results of the fetal genetic examination, the outcome, the presence of malformations, the induced abortion, and the occurrence of a miscarriage or intra uterine fetale demise (IUFD).
Data were analyzed using IBM SPSS Statistics 27.
2.2.1. Univariate Analysis:
In the descriptive analysis of the independent variables, a single characteristic is examined in isolation. This is necessary to identify potential errors in data collection. Furthermore, it allows evaluating the usability of the data for further bivariate and multivariate analyses. The analysis of the independent variables includes the calculation of the mean and standard deviation.
2.2.2. Bivariate Analysis:
Bivariate analysis, which is the statistical analysis of two variables, can determine whether a dependency exists between these two variables. The variables can be either quantitative or qualitative types.
The common bivariate analysis methods include Pearson’s χ2 test, the exact Fisher test, the t-test, the U-test, and the correlation table. The application of these procedures helps determine the relationship between the variables.
For the analysis of qualitative independent characteristics, the Pearson’s χ2 test is used. This compares the observed and expected frequencies. If the extended frequency for a qualitative independent characteristic is less than 5, the Fisher exact test is used. For the analysis of quantitative independent variables with a normal distribution, the t-test is used. This helps verify whether the mean values of the two groups are equal or unequal. For quantitative independent variables without a normal distribution, the U-test is applied. Here, the target variable is converted into ranks. Subsequently, a rank sum is formed for each group and compared with the expected rank sum. This fact is used to make a more accurate statement about outliers through the U-test.
To test whether a variable is normally distributed, the Kolmogorov-Smirnov test and the Shapiro-Wilk test are used. In this case, the Shapiro-Wilk test is particularly informative, as it proves the normal distribution even for smaller sample sizes. This test examines the distribution of the quotient of two estimates, one being the square of the smallest error estimate for the increase of a regression line in the quantile-quantile plot and the sample variance. To be able to assume a normal distribution, these two estimates should be close together and thus the ratio should be 1.
Additionally, the ROC curve is created, which uses the AUC to determine the optimum sensitivity and specificity. This can be used to calculate the cut-off value for a quantitative constant variable.
All p-values are results of two-sided tests. A p-value below the significance level of p<0.05 was considered significant. The correlation table shows the pairwise correlation of several independent variables. This is performed before the multivariate analysis to exclude a dependency between independent variables, which are then incorporated into the regression model.
3. Results
3.1. Age Distribution:
The cohort displayed a wide range of ages. The youngest patient was 19 years old and the oldest was 49 years old. The mean age of the patient population was 32 years. The majority of cases, at 29.3%, were in the age group between 31 and 35 years. The age groups under 20 years and over 45 years each represented a small percentage of 2.4% and 0.5%, respectively.
3.2. Crown-Rump-Length:
At the time of the examination, the crown-rump length ranged from 23.2 to 44.9 mm, with a mean of 39.95 mm. The majority of fetuses had a crown-rump length between 40.0 and 44.9 mm.
3.3. Nuchal Translucency:
The average nuchal translucency thickness was 4.4 mm. The range was between 2.5 and 9.11 mm. The nuchal translucency was between 2.50 and 3.49 mm with 30.3%, between 3.50 and 4.49 mm with 30.3%, between 4.50 and 5.49 mm with 17.3%, and greater than or equal to 5.50 mm with 22.1%.
3.4. Karyotype:
Of the 208 cases examined, 67 had chromosomal abnormalities. 94 fetuses showed no abnormalities. For the remaining 47, the karyotype was not determined or it is unknown whether a genetic examination was performed. Among the chromosomally abnormal children, 32 had trisomy 18, 13 had monosomy X, 11 had trisomy 21, 4 had trisomy 13, and 7 had other chromosomal anomalies (Table 1, Table 2, Table 3).
3.5. Malformations:
In 122 cases, complete information on a malformation was available. In 57 cases, a malformation was present, and in 65 cases, it was not. The cut-off value of the NT with the highest specificity and sensitivity is 3.905 mm. At this cut-off value, the sensitivity is 68.4% and the specificity is 69.2% (Table 2).
3.6. Malformations and/or Karyotype:
Complete information on malformations and/or karyotype was available for 150 cases. In 100 cases, one or both parameters were abnormal, and in 50 cases, both were known to be normal. In 58 cases, both parameters were missing or one parameter was normal and the other was missing. In 100 cases, a malformation and/or an abnormal karyotype was present, and in 50 cases, it was not. The cut-off value of the NT with the highest specificity and sensitivity is 3.595 mm. At this cut-off value, the sensitivity is 78.0% and the specificity is 52.0%.
3.7. Karyotype:
Complete information on the karyotype was available for 161 cases. Among the mentioned cases, 94 showed a normal karyotype and 67 had an abnormal karyotype. The best cut-off value is 3.89 mm. At this cut-off value, the sensitivity is 79.1% and the specificity is 55.3% (Figure 1).
3.8. Pregnancy Outcome:
The outcome is known for 164 cases. The term “negative outcome” refers to cases with a miscarriage, an INR, an IUFD, or postnatal death within the first 3 months after birth. In 74 cases, there was a positive outcome, and in 90 cases, there was not (Table 4). The cut-off value of the NT with the highest specificity and sensitivity is 3.890 mm. At this cut-off value, the sensitivity is 74.4% and the specificity is 68.9% (Figure 2).
3.9. Negative Outcomes and/or Abnormal Karyotype and/or Malformations:
For 178 cases, the information on a malformation and/or abnormal karyotype and/or negative outcome was complete. In 104 cases, at least one of the above-mentioned abnormalities was present, and in 74 cases, it was not. The best cut-off value is 3.89. At this cut-off value, the sensitivity is 76.0% and the specificity is 68.9%.
3.10. NIPT:
NIPT, which has been a statutory health insurance benefit in Germany since 2022, is used to identify trisomies 13, 18, and 21. Table 5 presents the chromosomal abnormalities that are not recognized by the NIPT.
4. Discussion
Our data show that an increased nuchal translucency is also associated with an elevated probability of an adverse outcome in fetuses with a CRL < 4.5 mm. The likelihood of a malformation and/or an abnormal karyotype increases from 24.0% for NT between 2.5 mm - 3.89 mm to 76.0% for NT equal to or greater than 3.89 mm. Furthermore, we were able to demonstrate that if only NIPT were performed, only 54% of cases with an adverse outcome and/or malformation and/or abnormal karyotype would have been diagnosed. The guidelines state that NT measurement should be performed as part of first-trimester screening, with a CRL between 45 mm-84 mm. These thresholds have been modified several times by the Nicolaides group until a specific time interval was finally defined in 2012. The frequency of chromosomal anomalies was mainly investigated for NT values between 45 mm and 84 mm [8,9,10]. The question arose whether assessment in earlier weeks of pregnancy and shorter crown-rump length can have equivalent diagnostic accuracy. Our data show that the majority of pregnancies with an increased NT > 2.5 mm have a poor prognosis. Of 178 cases where the information on a malformation and/or abnormal karyotype and/or negative outcome was complete, it was found that in 104 cases at least one of the abnormalities was present. In cases with an NT > 5.5 mm, the probability of a poor prognosis is 83.7%.
Pandya et al. showed that the more widespread the nuchal translucency, the higher the risk of chromosomal abnormalities [11]. In this study, where NT was measured in fetuses between 10 and 14 weeks of gestation, the observed number of trisomies 13, 18, and 21 in fetuses with a NT of 3 mm, 4 mm, 5 mm, and > 6 mm was approximately 3 times, 18 times, 28 times, and 36 times higher than the corresponding number expected based on maternal age.
Given that a significantly increased nuchal translucency is a risk factor for the presence of malformations or chromosomal anomalies, it was to be expected that this would be similar in our study. While in the groups with NT 2.50-3.49 mm and 3.50-4.49 mm the karyotype was abnormal in 25.6% and 31.4% respectively, in the groups with NT 4.50-5.49 mm and > 5.50 mm it was 51.6% and 66.7% respectively.
In our study, the karyotype could be determined in 161 cases. 94 cases showed a normal karyotype, while 67 cases had an abnormal karyotype (41.6%). These values are similar to the data from Lugthart et al., where the proportion of fetuses with a normal karyotype was 54.2% [12]. In the study by Grande et al., the proportion of fetuses with an abnormal karyotype was only 7.2% [13]. This is explained by stricter inclusion criteria in both our study model and the Lugthart study model, which, in addition to a CRL < 4.5 mm, also included NT as an inclusion criterion.
Our findings align with literature regarding the prevalence of certain chromosomal anomalies, trisomies 13, 18, and 21, with trisomy 18 being the most common. The most frequently detected trisomy in pregnancy is trisomy 21, while in our study as well as in the studies by Lugthart and Grande trisomy 18 was most common [12,13]. One possible explanation could be that some fetuses with trisomy 18 had already miscarried by the time of the actual first-trimester screening later in pregnancy, thereby lowering the observed prevalence.
In our study, the most significant cut-off value for detecting the abnormal karyotype was 3.89 mm. In fact, 20.9% of cases with an abnormal karyotype had an NT of less than 3.89 mm. This is a high percentage, but the Brandi study with a cut-off of 3.5 mm, the most common cut-off for further genetic tests, showed that 23.4% of embryos with anomalies had an NT of less than 3.5 mm.
Our study demonstrated that 29.9% of fetuses had chromosomal abnormalities that would not have been detected by NIPT. This deserves particular emphasis, as the increasing adoption of NIPT as a first-line screening tool must not overshadow the importance of the early fetal anomaly scan in combination with expert genetic counseling and diagnostic evaluation in cases of abnormal findings.
Numerous studies have shown that an increased NT is associated not only with an increased risk of chromosomal anomalies, but also with an increased risk of malformations, even when the karyotype is normal [14,15,16,17]. In our study, complete information on a malformation was available in 122 cases. In 57 cases, a malformation was diagnosed. In 33 cases with malformations, the NT was > 4.5 mm.
Notably, the risk of an adverse outcome was significantly higher when NT exceeded 4.5 mm, with 55.6% of cases with an adverse outcome in this group. Spataro et al. found that in fetuses with an NT of ≥ 3.5 mm and a normal karyotype, the rate of adverse outcome was directly correlated with the NT width [18]. In summary, the data indicate a direct association between the NT and pregnancy outcome, irrespective of the presence of genetic anomalies.
Bergsch et al. observed that the ‘Radiant’ image enhancement mode in modern ultrasound systems significantly increases measured NT values. These recent advancements in ultrasound imaging highlight the need to reevaluate existing NT reference charts. As the debate continues over appropriate NT cutoff values—whether 3.0 mm, 3.5 mm, or the 99th percentile—such technological factors must be considered, particularly since these thresholds closely correspond to those used in current first-trimester screening protocols [19].
The results of this study demonstrate the clinical utility of NT measurement even when the crown-rump length is less than 45 mm, suggesting that elevated NT measurements at early gestational stages are indicative of potential adverse outcomes. The management of patients presenting with an elevated NT at an early gestational age, specifically prior to 11 weeks, can be difficult as studies have proven that an initial increase in NT followed by normalization is a common finding [20,21]. In counseling expectant parents, it is essential to emphasize that, despite the potential for structural or genetic abnormalities that may be diagnosed at a later stage, the likelihood of delivering a healthy child remains a realistic possibility. Performing NIPT in this particular patient group does not provide additional benefit, as the detectable spectrum of conditions remains too limited, at least with currently available regulations.
5. Conclusions
Our study demonstrates that NT measurements in fetuses with CRL measurements below 45 mm mm have predictive value for future outcomes. The presence of elevated NT in this population strongly indicates chromosomal abnormalities and structural malformations and adverse pregnancy outcomes. The study results show that NT measurement delivers critical early diagnostic information despite current risk modeling restrictions for this specific CRL range. The use of genomic screening without anatomical imaging would result in a significant clinical risk because it would miss nearly one-third of all abnormalities. The detection of an increased NT at any gestational age before 11 weeks requires complete evaluation through expert ultrasound and genetic counseling and invasive diagnostic procedures when necessary. The management of NT measurements equal to or greater than 3.5 mm in fetuses with CRL less than 45 mm should follow the same diagnostic approach as standard CRL range measurements until new prospective data establishes alternative thresholds. The optimal prenatal care for this population requires early fetal medicine unit referrals together with first-trimester anatomical scans and genetic counselling.
Author Contributions
Conceptualization, P.K., M.P., and J.D.; formal analysis, M.P.; investigation, P.K., M.P. and J.D.; data curation, M.P. and P.K.; resources, H.D.; writing—original draft preparation, P.K., M.P. and J.D; writing—review and editing, P.K., and J.D.; visualization, M.P.; supervision, J.D. All authors have read and agreed to the published version of the manuscript.
Funding
This research received no external funding.
Informed Consent Statement
Informed consent was obtained from all subjects involved in the study.
Data Availability Statement
The research data from this study can be requested from the authors.
Conflicts of Interest
The authors declare no conflicts of interest.
Abbreviations
The following abbreviations are used in this manuscript:
| DEGUM | Deutsche Gesellschaft für Ultraschall in der Medizin |
| NT | Nuchal translucency |
| CRL | Crown rump length |
References
- Nicolaides, K.H.; Azar, G.B.; Byrne, D.; Mansur, C.A.; Marks, K. Fetal nuchal translucency: ultrasound screening for chromosomal defects in first trimester of pregnancy. BMJ 1992, 304, 867. [Google Scholar] [CrossRef] [PubMed]
- Abuhamad, A. Technical Aspects of Nuchal Translucency Measurement. Seminars in Perinatology 2005, 29, 376. [Google Scholar] [CrossRef]
- Huang, W. Abnormal first-trimester fetal nuchal translucency and Cornelia De Lange syndrome. Obstetrics and Gynecology 2002, 99, 956. [Google Scholar] [CrossRef]
- Berger, A. What is fetal nuchal translucency? BMJ 1999, 318, 81. [Google Scholar] [CrossRef]
- Brady, A.F.; Pandya, P.; Yüksel, B.; Greenough, A.; Patton, M.A.; Nicolaides, K.H. Outcome of chromosomally normal livebirths with increased fetal nuchal translucency at 10-14 weeks’ gestation. Journal of Medical Genetics 1998, 35, 222. [Google Scholar] [CrossRef]
- Malone, F.D.; Ralston, S.J.; D’Alton, M.E. Increased Nuchal Translucency and Fetal Chromosomal Defects. New England Journal of Medicine 1998, 338, 1228. [Google Scholar] [CrossRef]
- Nicolaides, K.H. Nuchal translucency and other first-trimester sonographic markers of chromosomal abnormalities. Am J Obstet Gynecol 2004, 191, 45–67. [Google Scholar] [CrossRef] [PubMed]
- Kagan, K.O.; Anderson, J.M.; Anwandter, G.; Neksasova, K.; Nicolaides, K.H. Screening for triploidy by the risk algorithms for trisomies 21, 18 and 13 at 11 weeks to 13 weeks and 6 days of gestation. Prenat Diagn 2008, 28, 1209–1213. [Google Scholar] [CrossRef] [PubMed]
- Nicolaides, K.H.; Spencer, K.; Avgidou, K.; Faiola, S.; Falcon, O. Multicenter study of first-trimester screening for trisomy 21 in 75 821 pregnancies: results and estimation of the potential impact of individual risk-orientated two-stage first-trimester screening. Ultrasound Obstet Gynecol 2005, 25, 221–226. [Google Scholar] [CrossRef]
- Kagan, K.O.; Wright, D.; Valencia, C.; Maiz, N.; Nicolaides, K.H. Screening for trisomies 21, 18 and 13 by maternal age, fetal nuchal translucency, fetal heart rate, free β-hCG and pregnancy-associated plasma protein-A. Hum Reprod 2008, 23, 1968–1975. [Google Scholar] [CrossRef]
- Pandya, P.P.; Kondylios, A.; Hilbert, L.; Snijders, R.J.; Nicolaides, K.H. Chromosomal defects and outcome in 1015 fetuses with increased nuchal translucency. Ultrasound Obstet Gynecol. 1995, 5, 15–19. [Google Scholar] [CrossRef] [PubMed]
- Lugthart, M.A.; Bet, B.B.; Elsman, F.; van de Kamp, K.; de Bakker, B.S.; Linskens, I.H.; van Maarle, M.C.; van Leeuwen, E.; Pajkrt, E. Increased nuchal translucency before 11 weeks of gestation: Reason for referral? Prenat Diagn. 2021, 41, 1685–1693. [Google Scholar] [CrossRef] [PubMed]
- Grande, M.; Solernou, R.; Ferrer, L.; et al. Is nuchaltranslucency a useful aneuploidy marker in fetuses with crown-rump length of 28-44mm? Ultrasound Obstetr Gynecol. 2014, 43, 520–524. [Google Scholar] [CrossRef] [PubMed]
- Syngelaki, A.; Hammami, A.; Bower, S.; et al. Diagnosis of fetal non-chromosomal abnormalities on routine ultrasound examination at 11-13weeks’ gestation. Ultrasound Obstetr Gynecol. 2019, 54, 468–476. [Google Scholar] [CrossRef]
- Bilardo, C.M.; Pajkrt, E.; de Graaf, I.; et al. Outcome of fetuses with enlarged nuchal translucency and normal karyotype. Ultrasound Obstetr Gynecol. 1998, 11, 401–406. [Google Scholar] [CrossRef]
- Souka, A.P.; Von Kaisenberg, C.S.; Hyett, J.A.; et al. Increased nuchal translucency with normal karyotype. Am J Obstetrics Gynecol. 2005, 192, 1005–1021. [Google Scholar] [CrossRef]
- Lithner, C.U.; Kublickas, M.; Ek, S. Pregnancy outcome for fetuses with increased nuchal translucency but normal karyotype. J Med Screen. 2016, 23, 1–6. [Google Scholar] [CrossRef]
- Spataro, E.; Cordisco, A.; Luchi, C.; Filardi, G.R.; Masini, G.; Pasquini, L. Increased nuchal translucency with normal karyotype and genomic microarray analysis: A multicenter observational study. Int J Gynaecol Obstet. 2023, 161, 1040–1045. [Google Scholar] [CrossRef]
- Bergsch, A.; Degenhardt, J.; Stressig, R.; Dudwiesus, H.; Graupner, O.; Ritgen, J. The ‘Radiant Effect’: Recent Sonographic Image-Enhancing Technique and Its Impact on Nuchal Translucency Measurements. J. Clin. Med 2024, 13, 3625. [Google Scholar] [CrossRef]
- Müller, M.A.; Pajkrt, E.; Bleker, O.P.; Bonsel, G.J.; Bilardo, C.M. Disappearance of enlarged nuchal translucency before 14 weeks’ gestation: relationship withchromosomal abnormalities and pregnancy outcome. Ultrasound Obstetr Gynecol. 2004, 24, 169–174. [Google Scholar] [CrossRef]
- Zoppi, M.A.; Ibba, R.M.; Floris, M.; et al. Changes in nuchal translucency thickness in normal and abnormal karyotype fetuses. BJOG 2003, 110, 584–588. [Google Scholar] [CrossRef] [PubMed]
Figure 1.
NT demonstrated strong predictive value for chromosomal abnormalities, with the prevalence of abnormal karyotypes increasing from 20.9% in fetuses with NT < 3.89 mm to 79.1% in those with NT ≥ 3.89 mm.
Figure 1.
NT demonstrated strong predictive value for chromosomal abnormalities, with the prevalence of abnormal karyotypes increasing from 20.9% in fetuses with NT < 3.89 mm to 79.1% in those with NT ≥ 3.89 mm.
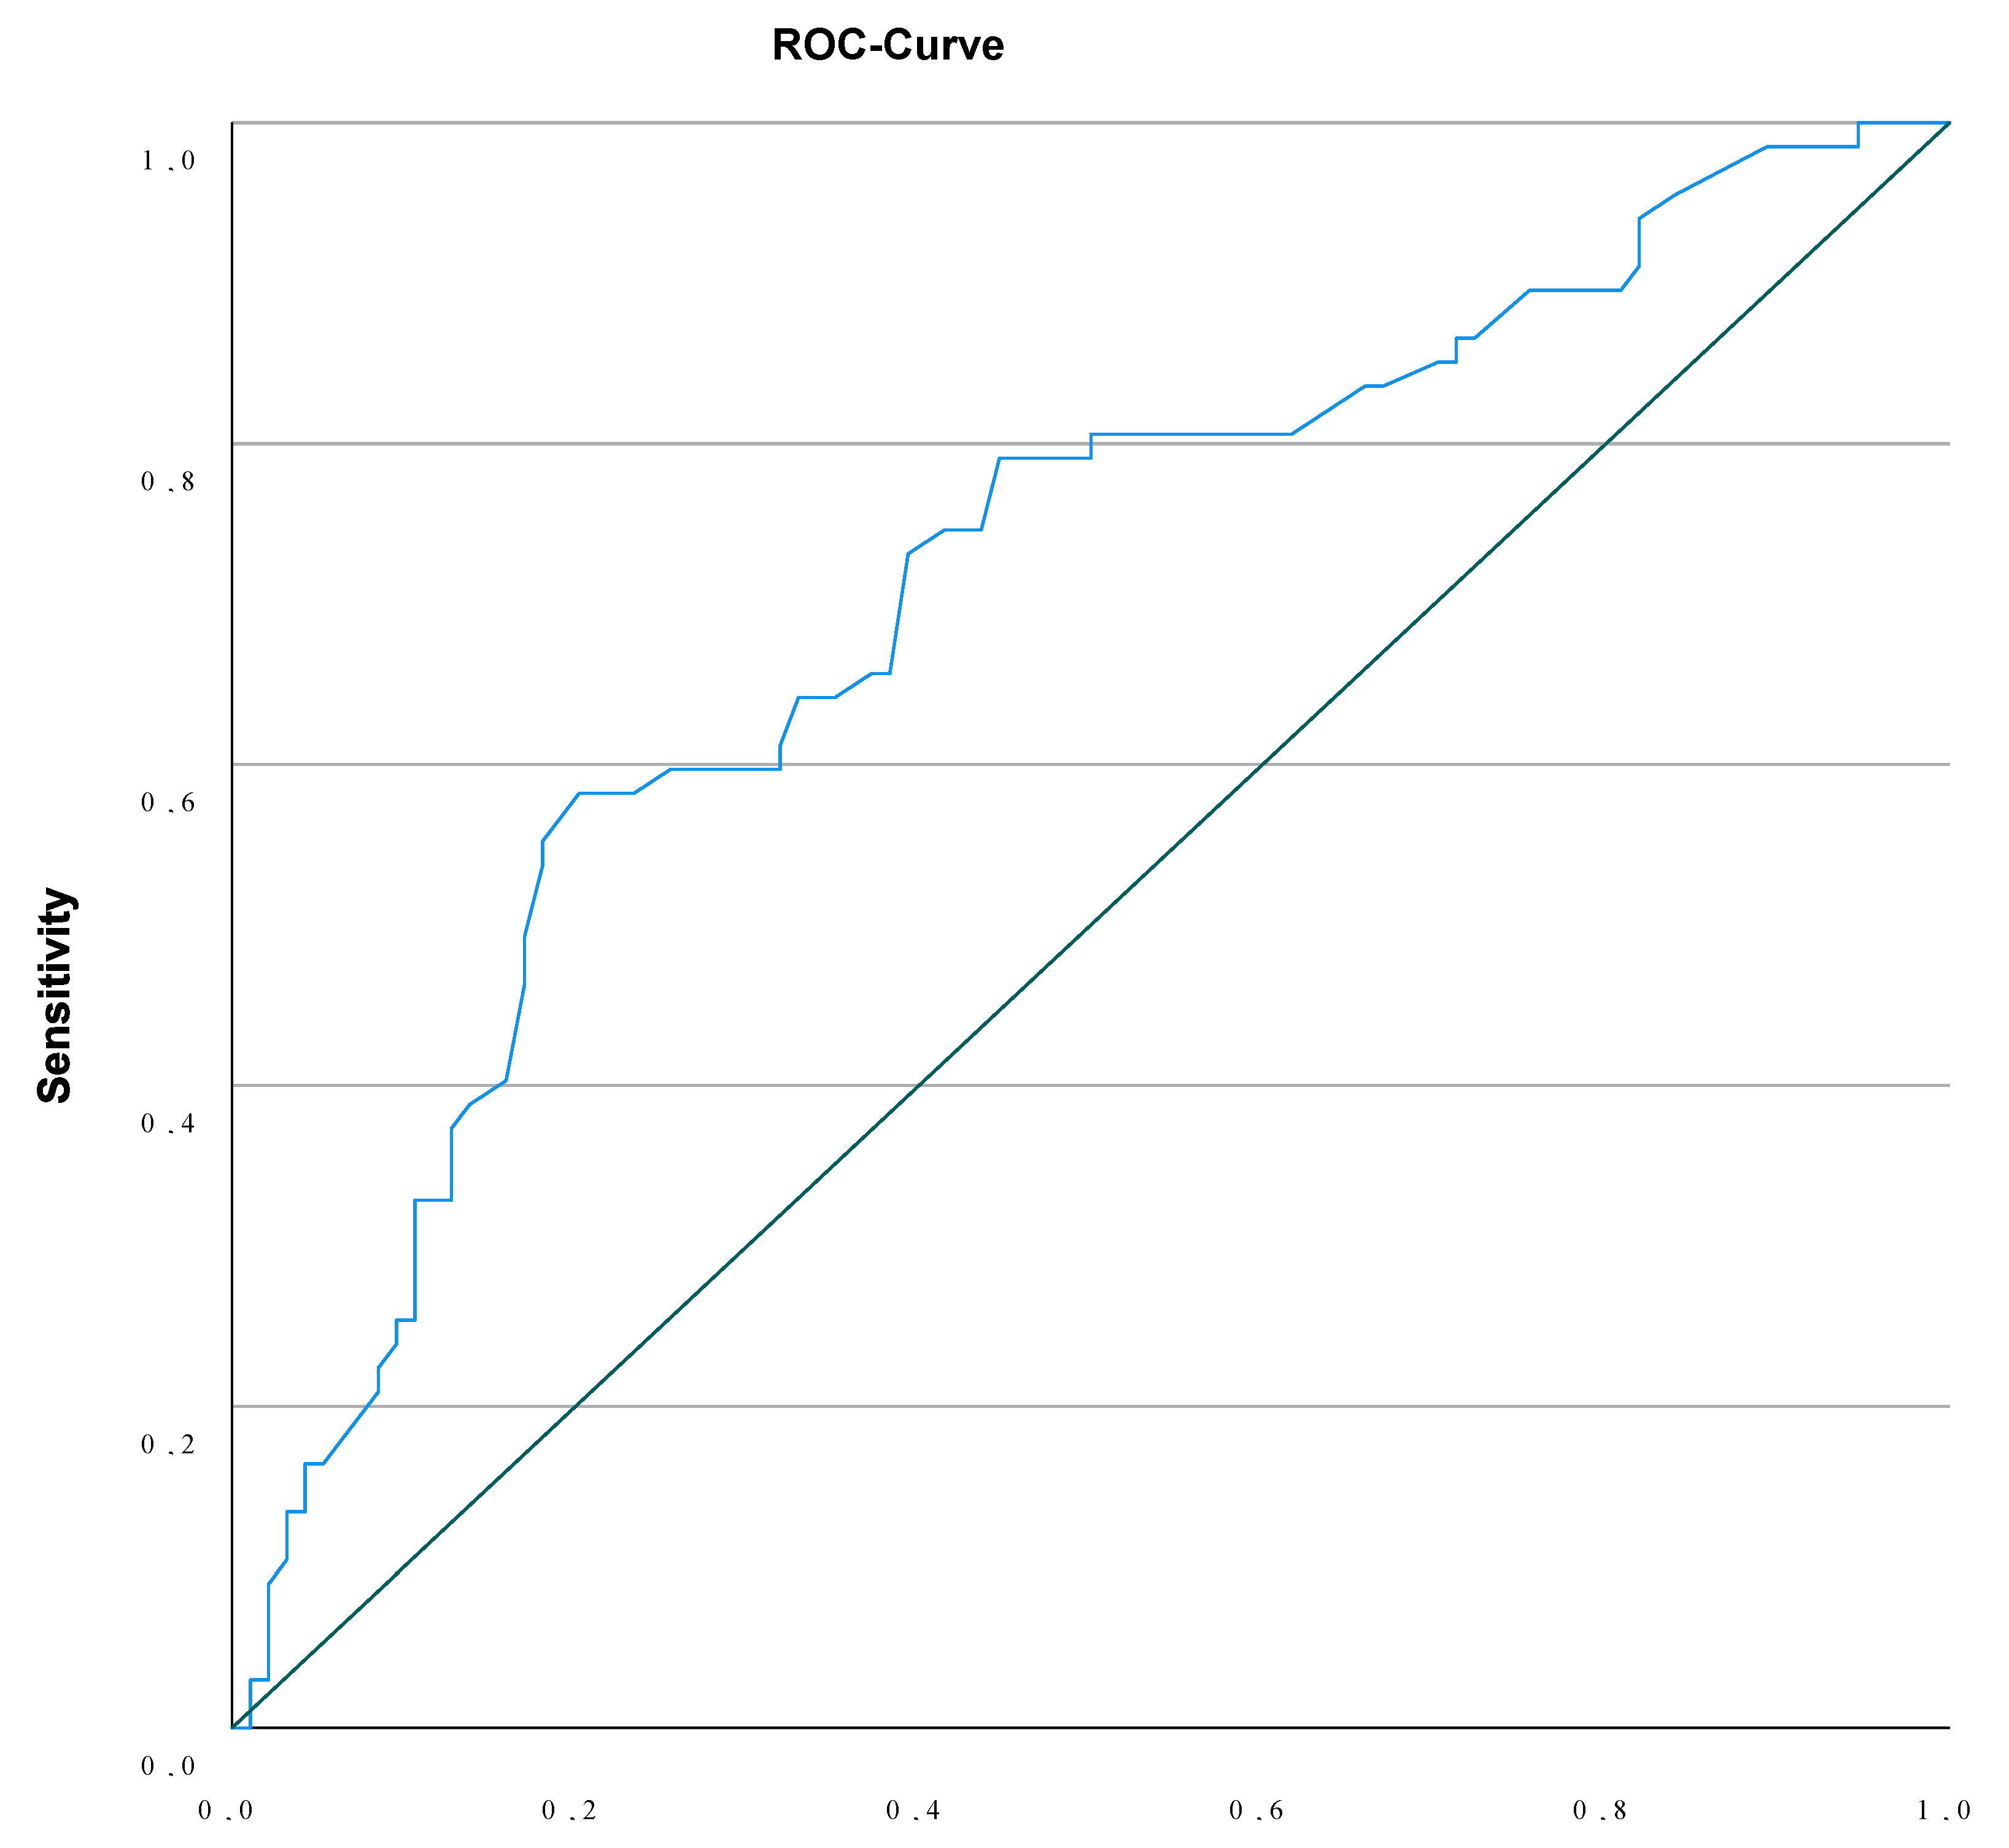
Figure 2.
Nuchal translucency (NT) is a predictor of adverse outcome, with risk increasing from 25.6% to 74.4% across NT categories.
Figure 2.
Nuchal translucency (NT) is a predictor of adverse outcome, with risk increasing from 25.6% to 74.4% across NT categories.
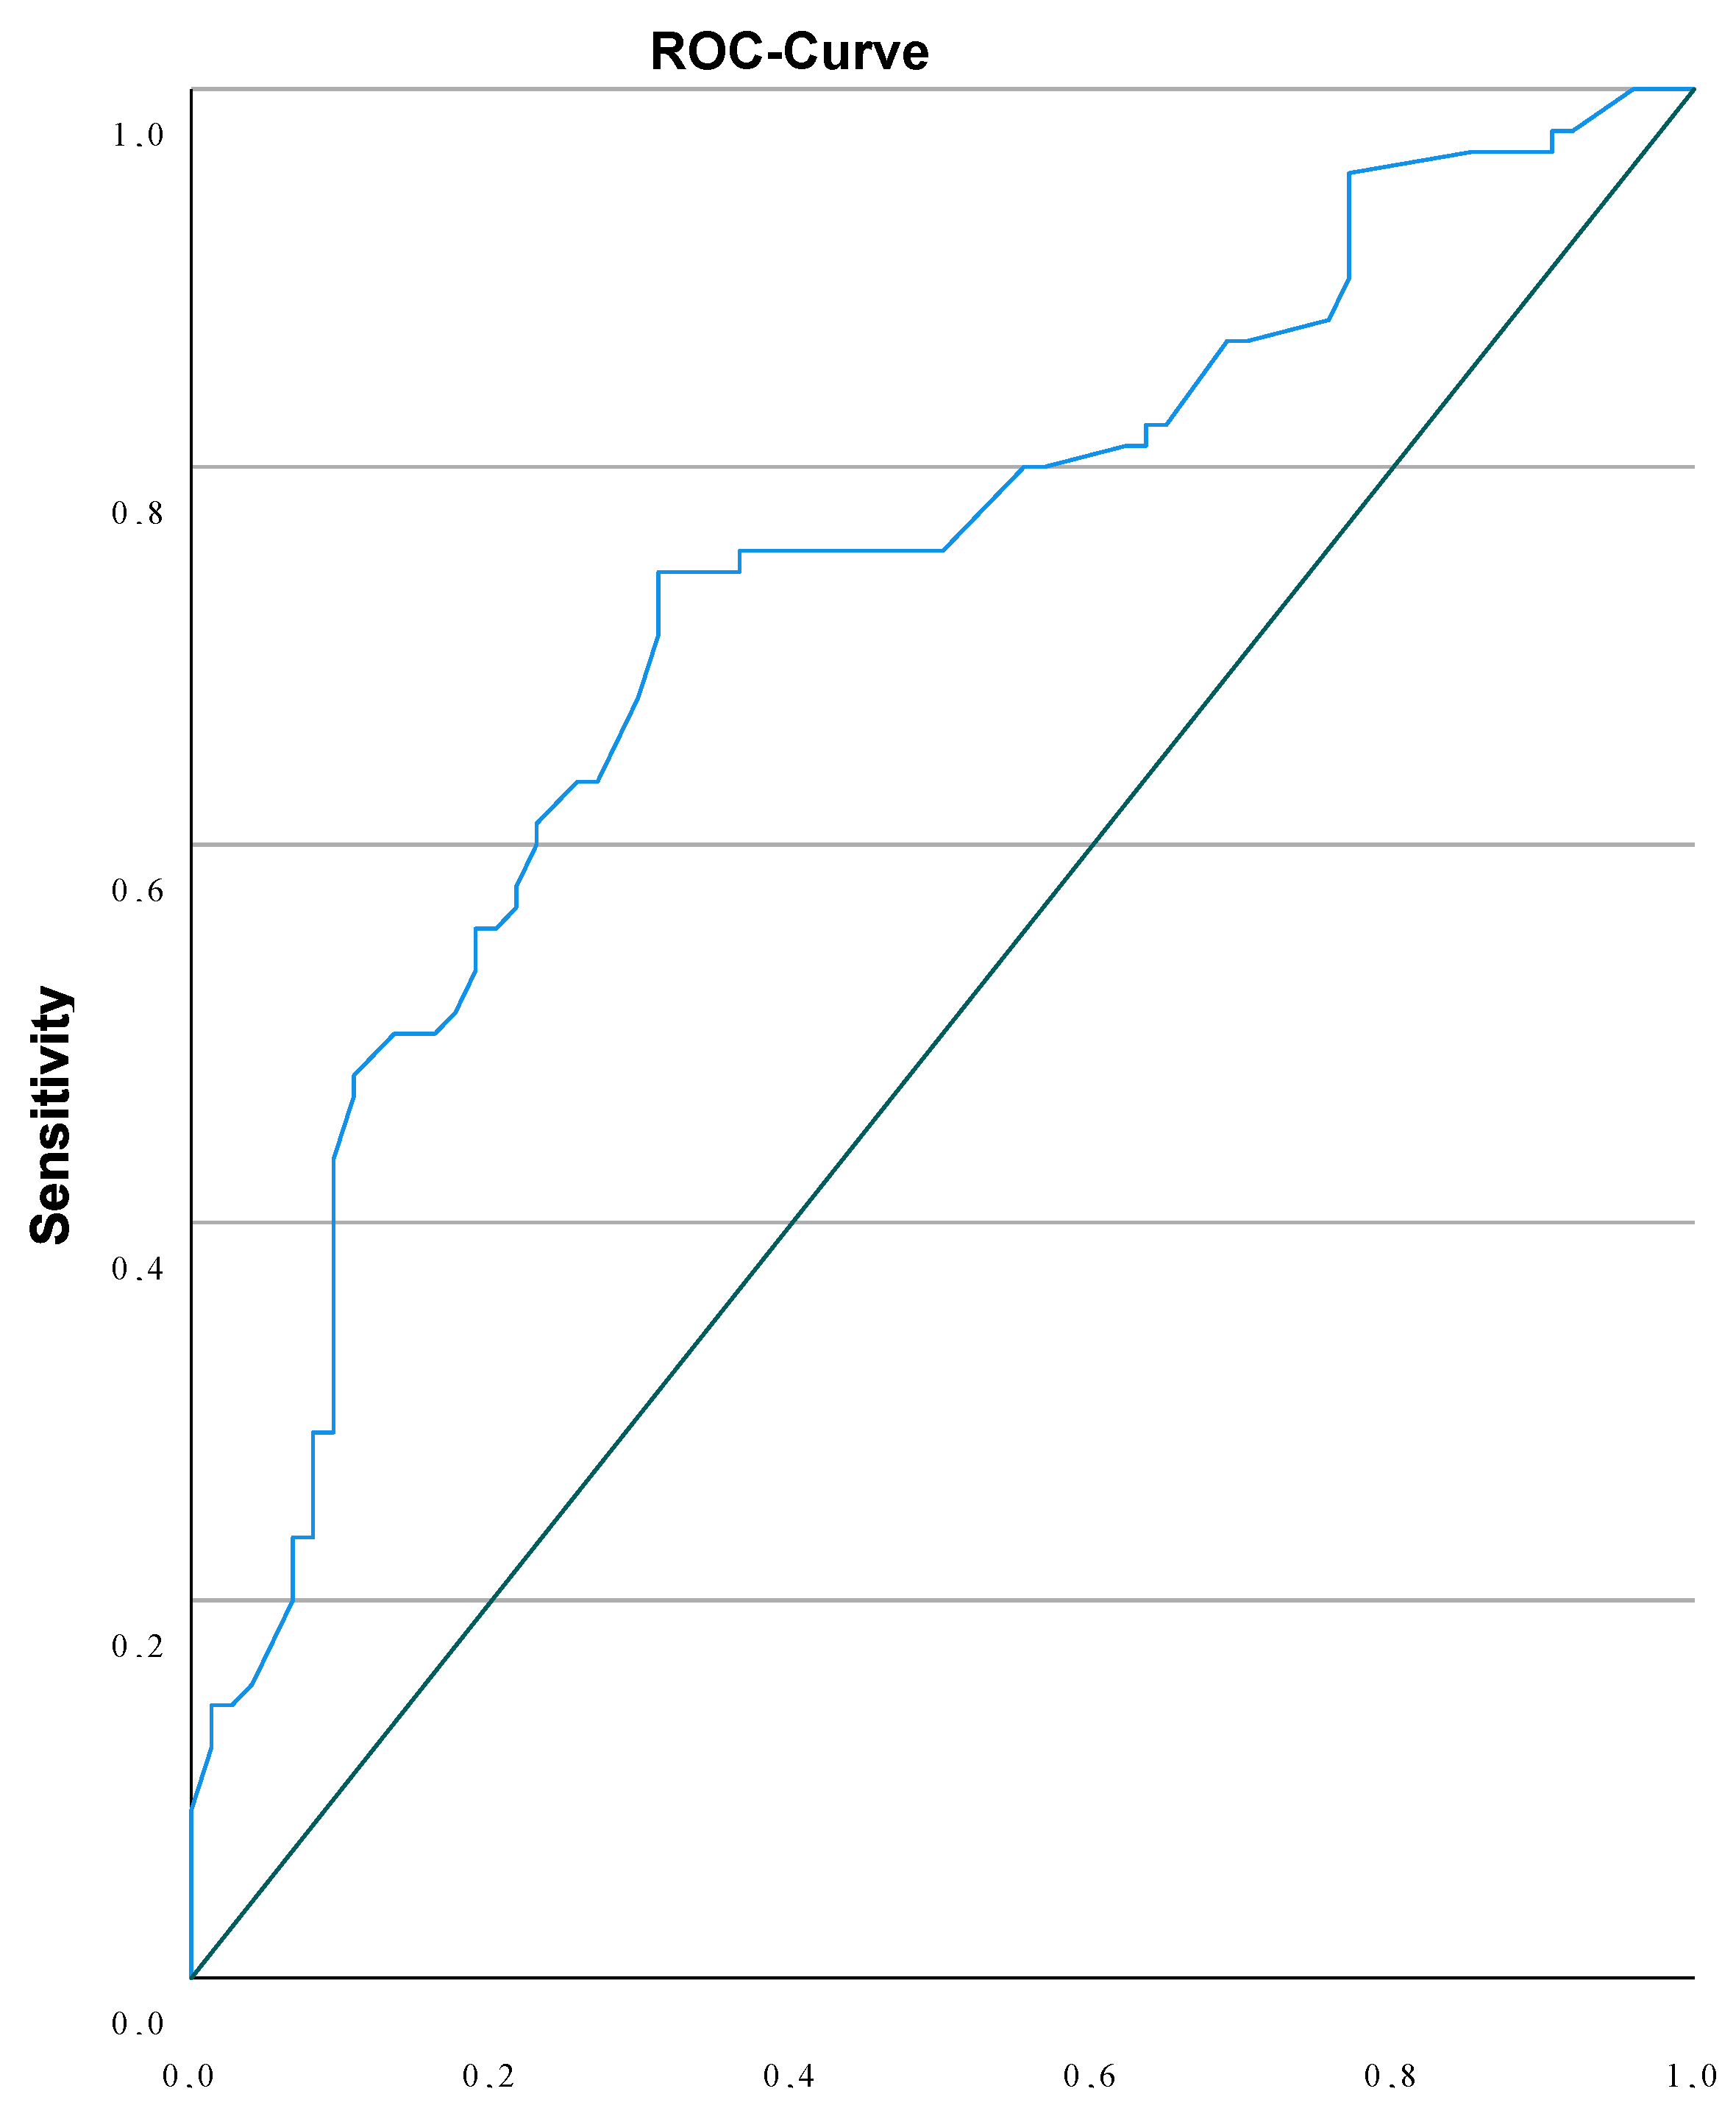

Table 1.
Study Characteristics.
| Parameter | Mean (SD) / % | |
|---|---|---|
| CRL | 39.95 (3.47) | |
| NT | 4.40 (1.4) | |
| Gestational Age (days) | 76.45(4.65) | |
| NT | 2.50-3.49mm | 63 (30.3%) |
| 3.50-4.49mm | 63 (30.3%) | |
| 4.50-5.49mm | 36 (17.3%) | |
| ≥ 5.50mm | 46 (22.1%) | |
| Karyotype | Missing | 47 (22.6%) |
| Normal | 94 (45.2%) | |
| Trisomy 18 | 32 (15.4%) | |
| Trisomy 13 | 4 (1.9%) | |
| Trisomy 21 | 11 (5.3%) | |
| Monosomy | 13 (6.3%) | |
| Structural chromosomal abnormality | 3 (1.4%) | |
| Triploidy | 3 (1.4%) | |
| Trisomy 9 | 1 (0.5%) | |
| Invasive Testing and/or NIPT | No | 45 (21.6%) |
| CVS | 150 (72.1%) | |
| Amniocentesis | 2 (1.0%) | |
| NIPT | 4 (1.9%) | |
| Unknown | 6 (2.9%) | |
| CVS and Amniocentesis | 1 (0.5%) | |
| Aneuploidy | No | 94 (45.2%) |
| Yes | 64 (30.8%) | |
| Unknown/Missing | 50 (24.0%) | |
| Termination of Pregnancy | No | 106 (51.0%) |
| Yes | 56 (26.9%) | |
| Unknown/Missing | 46 (22.1%) | |
| Malformation | No | 65 (31.3%) |
| Yes | 57 (27.4%) | |
| Unknown/Missing | 86 (41.3%) | |
| Cardiac Anomalies | No | 68 (32.7%) |
| Yes | 36 (17.3%) | |
| Unknown/Missing | 104 (50%) | |
| Abnormal soft markers beyond other than NT | No | 96 (46.2%) |
| Yes | 74 (35.6%) | |
| Unknown/Missing | 38 (18.3%) |
Table 2.
NT and Chromosomal Aberrations.
| NT | Normal Karyotype |
Trisomy 18 | Trisomy 13 | Trisomy 21 | Monosomy | Structural Chromosomale Anaomalies | Triploidy | Trisomy 9 |
|---|---|---|---|---|---|---|---|---|
| 2.50-3.49mm | 32 (74.4%) |
4 (9.3%) |
1 (2.3%) |
3 (6.9%) |
2 (4.7%) |
0(0.0%) | 0(0.0%) | 1 (2.3%) |
| 3.50-4.49mm | 35 (68.6%) |
5 (9.8%) |
1 (2.0%) |
6 (11.8%) |
0(0.0%) | 2 (3.9%) |
2 (3.9%) |
0(0.0%) |
| 4.50-5.49mm | 15 (48.4%) |
12 (38.7%) |
0(0.0%) | 0(0.0%) | 3 (9.7%) |
1 (3.2%) |
0(0.0%) | 0(0.0%) |
| ≥ 5.50mm |
12 (33.3%) |
11 (30.5%) |
2 (5.6%) |
2 (5.6%) |
8 (22.2%) |
0(0.0%) | 1 (2.8%) |
0(0.0%) |
| Total | 94 (58.4%) |
32 (19.9%) |
4 (2.5%) |
11 (6.8%) |
13 (8.1%) |
3 (1.9%) |
3 (1.9%) |
1 (0.6%) |
Table 3.
NT and Malformation/Aneuploidy.
| Malformation and/or Aneuploidy | NT < 3.595mm | NT ≥ 3.595mm | Chi-square P<0.000 |
Table 4.
NT and Adverse Outcome.
| Adverse Outcome | NT < 3.89mm | NT ≥ 3.89mm | Chi-square P<0.001 |
| 25.6% | 74.4% |
Table 5.
Aneuploidy Missed By NIPT.
| Not detected by NIPT | |
|---|---|
| Monosomy X | 13 (19.4%) |
| Structural Chromosomale Defects | 3 (4.5%) |
| Triploidy | 3 (4.5%) |
| Trisomy 9 | 1 (1.5%) |
Disclaimer/Publisher’s Note: The statements, opinions and data contained in all publications are solely those of the individual author(s) and contributor(s) and not of MDPI and/or the editor(s). MDPI and/or the editor(s) disclaim responsibility for any injury to people or property resulting from any ideas, methods, instructions or products referred to in the content. |
© 2025 by the authors. Licensee MDPI, Basel, Switzerland. This article is an open access article distributed under the terms and conditions of the Creative Commons Attribution (CC BY) license (http://creativecommons.org/licenses/by/4.0/).
Copyright: This open access article is published under a Creative Commons CC BY 4.0 license, which permit the free download, distribution, and reuse, provided that the author and preprint are cited in any reuse.


