
Submitted:
03 August 2025
Posted:
05 August 2025
You are already at the latest version
Abstract
Cost and time overruns are the critical challenges for construction projects. The consequences can extend beyond just monetary losses, causing project delays and even project cancellation, with repercussions for various stakeholders potentially impacting the broader economy. The study aims to analyse quantitatively the cost and time overruns in public building projects in Dire Dawa city over the past 17 years. Long year’s quantitative cost and duration data for 99 public building projects were collected from different documents including contractual agreement, schedules, and financial records available from clients, contractors, and consultants. The data were analysed using descriptive statistics, Mann Kendall trend analysis, and Sen Slope estimation method. The findings revealed that over the period 2008 -2024, about 45.5 % of projects experienced both cost and time overruns, 12.2% experienced only cost overruns, and 32.2% experienced only time overruns. About 90% of the major public projects have experienced either cost or time overruns in the study area over the period. The remaining 10 % of projects were completed ahead of schedule and at lower cost than the plan. As to the extent of overruns, on average, projects exceeded their budgets by 20.7%. Around 50% of the projects experienced cost overruns of 16.5% or less. Similarly, projects delayed from planned schedule by an average of 229.1%. Around half of the projects experienced time overruns of 267% or less. The trend analysis revealed the percentage change in time over runs have showed no statistically significantly trend in the period (2008–2024). However, that percentage change in cost over runs have showed statistically significantly increasing trend in the period at a rate of 200% per year. It is clear that the prevalence and magnitude of time and cost overruns are generally significant and the temporal patterns of change in overruns are generally negative. It can be concluded that public project management efficiency with regard to cost and time management has not only been generally poor but also remained at unimproved for duration and either declining or unimproved for cost over the different periods despite efforts being put in to place in the industry. Therefore, it is required to identify site specific interventions in the planning, design, and implementation phases and implement the interventions to ensure more efficient public project management.
Keywords:
cost over runs
; time over runs
; Mann Kendal
; sen slope
; trend
; Dire Dawa
; Ethiopia
1. Introduction
Construction projects, in general, and public construction projects, in particular, are crucial to enhancing infrastructure, and ensuring socio-economic development and meeting societal needs. To this end, it is paramount importance to ensure that the projects are completed at required performance. Projects are required to be properly planned, and effectively and efficiently implemented. The performance is required to be monitored and evaluated during or after implementation.
Performance of construction project is affected by a number of factors at different stages of construction. These factors can be broadly divided in to client, contractor, consultant related factors, and external factors [1]. Therefore, the performance of construction projects can be assessed at different levels using different indicators. The indicators measuring the performance of clients, the contractors, or external bodies could be used. For instance, performance indicators measuring the financial capacity, capacity and experience, material supply capacity, management capacities including planning, scheduling, quality control, communication competencies, safety and risk management , resources management of the contractor, as well as labour and input material market and the existing technologies in the market can be used to assess the intermediate performance of projects. The overall performance of construction project is often assessed by three critical indicators: cost, time, and quality of construction.
A number of studies have been carried out to assess the causes, effects, and /or mitigation of cost and time over runs in construction projects across locations across the world and in Ethiopia. Some have studied causes for cost and/or time overruns [2,3,4,5,6], some others have studied both causes and effects for cost and/or time overruns[7,8,9,10,11,12], and still few others have studied causes, effects, and mitigations for cost and/or time overruns [eg.[1]] .Whereas some studies focused on quantifying the overruns themselves [eg. [6]] or analysing their trends [eg.[13]]. The studies have focused in different types of projects. Some focused on private construction projects, others focused on public or private projects public [1,2,3,4,6,8,10,12] while few others focus on both public and private construction projects [eg.[7]]. The focus areas with respect to type of infrastructure are also different, some covering the construction industry as whole[5,7,9,10,11,14], while others cover structures in specific subsectors, building /housing construction [4,7], roads construction [2,3,6,12], water infrastructure [1,8] , or more than any two of them [eg.[15]] . Nearly all of the above studies have employed similar methodologies, collecting data using a questionnaire with 5 or 7 points-Likert scale and analysing the data mostly using methods such as frequency index, relative importance index, Severity index, and ranking analysis, or in few cases using methods such as hypothesis testing [eg.[11]].
Understanding the general condition and the prevailing trends of cost overrun and schedule delays based on actual project data are crucial to decision making in construction project management. This is because the information regarding the general condition and the magnitudes and pattern of changes in cost and time over runs over time helps policy makers, construction authorities, planners, contractors, clients, and professionals to understand the status and pattern of overruns and make decision making regarding the required responses. However, there are only few studies carried out to assess quantitatively the general conditions or the trend of cost and time overruns based on actual project data for construction projects. Mutairi [13] have collected numerical historical cost and time data and analysed percentage changes and temporal trend of time over runs for oil and gas projects in Kuwait. Melaku et al. [15] have collected numerical historical cost and time data and analysed percentage changes in cost and time over runs for selected building construction projects in Ethiopia. This study is the first of its kind for the study area for intensive analysis of numerical historical cost and time delay data and providing important insights. However, the temporal trend of the cost and time over run were not covered in this study.
It can be noted that there are already large number of studies focusing on the causes and effects in construction sector. It is clear that the cause, effects, and mitigation of cost and time over runs are well studied. In addition, Melaku et al. [15] assessed general conditions of the cost and time over run for construction projects in Ethiopia. However, the temporal patterns and rate of the changes in the overruns in Ethiopia in general and for the study area in particular are generally absent. Therefore, this study is the first of its kind in to the study area and to Ethiopia for quantitatively assess the overall status as well as temporal trend cost overrun and delay for public construction projects. This is because, in addition the general condition of cost over run and time over run in the study area, information regarding the temporal variability of time and cost over runs in the study is very important for better understanding of the progress of the industry.
2. Materials and Methods
Description of the Study Area
The city of Dire Dawa is located at 515 km away from the capital Addis Ababa on the highway road from Addis Ababa to Djibouti. It is geographically located at a latitude of 9o 36’ N and longitude of 41o52’E, in the eastern Ethiopia. The city is situated in the Dire Dawa administrative region (Figure 1) which consists of more than 38 rural districts in addition to the city proper (Figure 2). According to the GIS files obtained from online archive of the Ethiopian Space Science and Geospatial Institute (SSGI) (http://ethionsdi.gov.et), Dire Dawa administrative region covers a geographic area of 130,000 hectares, out of which 6928.2 hectares is within the city boundary. The total area of the administration is also reported as130, 000 hectares (DDAEPA, 2019). However, some other sources have reported the area to be 128,802 hectares [16]. The number and geographic size of districts in the city area have not been the same over the history of the region. The most recent zonation includes nine districts (Figure 2). The city is the second populous city in Ethiopia next to Addis Ababa with a population of around 479,000.
Topographically, Dire Dawa city is situated in the lowland areas at the back of the mountains in southern side with land surface slowing down towards the north at moderate slope. Thus, the land surface is generally moderately sloping facing to the north but the average elevation is 1,276 meters above sea level. There are large amount of hard rock and sand available on surface. The climate of Dire Dawa city is hot and dry semi - arid climate [16]. The Dire Dawa City is traditionally known as commercial and industrial centre. Cement factories are among historically comment industrial plants in the city. Politically, the city is under the leadership of a chartered administration named Dire Dawa Administration (DDCA). This makes the city as one of the two chartered cities in Ethiopia, along with Addis Ababa. Similar to other cities in Africa and Ethiopia, rapid urbanization is going on in the city. Local and national Private contractors have emerged came to play in the construction industry following the implementation of national free market economic policy since 1991. Associated with the prevailing natural and man-made situations, the construction projects have been expanding.
3. Methodology
Data Collection
In this study, major public construction projects owned by various federal and regional government bodies completed between 2008 and 2024 in the Dire Dawa City Administration were considered in this study. All Public building projects completed in the last 15 years with at a cost of 0.5M birr and above but with available record of cost and duration data were considered. Government construction offices and contractors were consulate to provide list of projects they have completed in the city over the time. The list was used as reference. For respective projects, archival data were collected from direct sources, including construction contracts agreement, procurement document, schedules, financial reports, and handover documents. These project documents were obtained from government agencies, Dire Dawa City Administration Construction Offices, regulatory bodies, Dire Dawa housing development agencies, consultants, contractors, and municipal offices within Dire Dawa Administration. The data collected from each project’s records included the project start or commencement date, contract cost (ETB), actual or final cost (ETB), contract duration (in days), and actual completion date. To ensure the accuracy, completeness, and consistency of the information, only signed and stamped documents were refereed.
Data Analysis
To assess the general condition of cost and time overruns for the public projects, descriptive analysis were carried out. Accordingly, based on project cost and duration data, the projects with overruns were identified, percentages of cost and time over runs relative to contract were estimated, and summary statistics were calculated for some statistical parameters. The percentage changes in cost and time overruns were calculated for each project and contractor over time comparing respective data for the plan and built. Analytical techniques for delay estimation in construction contract, such as the as-planned versus as-built technique, are based on the available factual matrix and simple mathematical variance calculations based on start dates, finish dates and duration variances[17]. For fully completed projects, this analysis is relevant. The percentage changes in cost and time overruns were used to effectively minimize the effect of factors such as scope of project and inflation over time, making the data comparable over time. However, the factors such inflation could influence the percentage change in time and cost overruns during the period of construction.
To analyze the trends of cost and time overruns, the data for Projects experiencing over run were first separated from the data to generate annual time series data for each cost and time overrun. The time series data for the percentage changes were generated by averaging the values for different projects in each year. The time series data were then analyzed for the temporal trends using Non-parametric trend analysis known as Mann Kendal (MK) trend analysis and the rate of changes were estimated using the Sen Slope estimator. The MK trend analysis method widely used in trend analysis in different disciplines. The advantages of this test over others such as linear regression is that the data does not need to be normally distributed. In addition, the test is not affected by outliers and missing data. The MK test is a two- tail test based on the following hypotheses:
- ➢ Null Hypothesis (H0): There is no monotonic trend in the time series
- ➢ Alternative hypothesis (HA): There is a monotonic trend in the time series
The decision for the two-tail test is made by comparing the computed Z with critical values. The null hypothesis is rejected when the absolute value of computed Z is greater than the critical values or p-value is less than the selected significance level (α = 0.05 or 0.1).
Furthermore, when the null hypothesis is rejected, the direction of trends is upward for positive z-value and the direction of trends is downward for negative Z-value [18].
The Sen Slope estimator was used to estimate the rate of change in climatic variable. For Sen Slope, firstly, all sets of slopes (dk) are computed using each pair of Xi and Xj using Equation (1). Then, the Sen Slope (β1) is calculated as the median of all slopes, dk, using Equation (2) [19]. Each set of slopes (dk) is calculated by
The Sen Slope (β1) is calculated by
Where i and j are indices for values of the variable X, for all 1 ≤ i < j ≤ n.
In this study, all data analysis were carried out using statistical software package R version 4.3.1.
4. Results and Discussion
Descriptive Analysis
Public construction projects completed at a cost of 0.5M birr and above in the period between 2008 and 2024 in the Dire Dawa city were initially target. Unfortunately, obtaining data for various projects was not feasible due to circumstances such as unavailability of records and the office’s reluctance to share information. Therefore, the study was based on data from 99 major public construction projects with available record of cost and duration data completed at a cost of 0.5M birr and above in the period between 2008 and 2024 in the Dire Dawa city. The actual cost of these projects varies from 510,389 to 712, 972,596 Ethiopian birr with mean actual cost of 28,927,467 Ethiopian birr. The actual project duration of these projects varies from 16 to 3215 days with mean actual cost of 670 days. These projects include new construction as well as maintenance and renovation projects for government offices, educational buildings, health centres, commercial buildings, and residential buildings (shown Figure 1).
Among these 99 completed public building projects in the period between 2008 and 2024, about 32 projects (32.32% of the projects) experienced time overrun alone, around 12 projects (12.2% of the projects) experienced cost overrun alone, 45 projects (45.45 % of the projects) experienced both time and cost overrun, and the remaining 10 projects (10% of the projects) experienced none of time and cost overrun (shown in pie chart, Figure 2). About 89 projects (90% of the projects) have experienced either cost or time overruns.
Analysing the time and cost data for the projects independently, it is found that 77 projects (78% of the projects) experienced time overruns whereas 57 projects (58% of the projects) experienced cost overruns. That means 45 projects experiencing both time and cost overrun accounts for 58.4 % of the project projects experiencing time overruns and 78.8 % of projects experiencing cost overruns.
Summary statistics carried out for time series cost and time over runs data. The minimum, mean, maximum percentage change in cost overrun across the years are found as 0.3%, 20.7%, and 59.4%, respectively. The 1st quarter, median, 3rd quarter in percentage change in cost overrun are 10%, 16.5% and 28 %, respectively. Melaku et al. [15] have found minimum, mean, maximum percentage change in cost overrun for building projects of 2%, 35%, and 248%, respectively. Similarly, minimum, mean, maximum percentage change in time overrun across the years are 21.7 %, 229.1%, and 430.5%, respectively. The 1st quarter, median, 3rd quarter in percentage change in time overrun are 92%, 267% and 330 %, respectively. Melaku et al. [15] have found minimum, mean, maximum percentage change in time overrun for building projects of 9%, 143%, and 802%, respectively. The prevailing time and cost overrun for public projects in the study area can generally be considered high.
Trend and Rate of Changes in Percentage Cost Over Runs
The annual time series time and cost data corresponding to project showing over run (77 projects (for time overruns and 57 projects for cost overruns) were analysed for trend and rate of change. The result of the analysis for time series time overrun data (Table 1) shows that there is no significant trend in percentage change of time over run over the periods (2008 -2024, 2008 -2016, and 2017 -2024). This means, the timeliness in completion of projects in the study area has showed no consistent improvement or decline over the periods; it remained unchanged. The prevailing time overruns are already identified as significant and problematic based on descriptive statistical analysis. This implies that efforts that have been put in place at national and regional level by different stakeholders to improve timeliness of project completion have not brought the improvement in timeliness of project completion in the study area over the three periods. Figure 3 shows the plot for the time series data of percentage change in time over run.
The result of the analysis for time series cost overrun data (Table 2) shows that there is significant increasing trend in percentage change of cost over run over the period (2008-2024). This means cost overrun is consistently worsening for public construction projects in the study area over the entire period (2008- 2024).
However, there are no significant trend in percentage cost overrun in the other two periods (2008 -2016 and 2017 -2024). In this period, percentage change in cost overrun has been increasing at a rate of 200% per year. This rate of change is not increase in cost, but increase in cost overruns. In addition, the effect of factors such as inflation prevailing in the period outside project completion duration (like across the period of trend analysis) is minimal. The results imply that efforts that have been put in place at national and regional level by different stakeholders to improve cost efficiency of project completion have failed to bring improvement over the three periods. Moreover, looking at the condition over the entire period, (2008-2024) it has not been possible to stop aggravation of the problem in the study area. These indicate the effectiveness and efficiencies in budgeting, cost estimation, project cost monitoring and control, and financial management practices have generally been declining but have been remained unchanged during the shorter time periods. Figure 4 shows the plots of the time series data and trend line for time series cost overrun data.
Overall, there is a need to make serious investigation on the causes. However, given the fact that varieties of efforts have been made over the period nationally and regionally, making visible improvement in input, resources, skill and technology, and project management, the authors, based on field observation and experience in the construction industry in Ethiopia, would like to emphasise the need assess the effect of prevailing specific conditions such as the levels of and professional commitment and ethics, and corruption and associated political commitment to address associated problems.
Summary, Conclusions, and Recommendations
The findings revealed that over the period 2008 -2024, about 45.5 % of projects experienced both cost and time overruns, 12.2% experienced only cost overruns, and 32.2% experienced only time overruns. About 90% of the major public projects have experienced either cost or time overruns in the study area over the period (20008 to 2024). The remaining 10 % of projects were completed ahead of schedule and at lower cost than the plan. The percentage of projects showing time over run out of projects experiencing cost overrun, 78%, is much higher than the percentage of projects showing cost over out projects experiencing time overrun, 58%, indicating most cost overruns are linked to time over run, but not all time over runs leads to cost overrun.
As to the extent of overruns, on average, projects exceeded their budgets by 20.7%. Around 50% of the projects experienced cost overruns of 16.5% or less. Similarly, projects delayed from planned schedule by an average of 229.1%. Around half of the projects experienced time overruns of 267% or less. It can be noted that the public construction projects completed during the study period over the study area have experienced significant time and cost over runs. It can be inferred that the public project management efficiency with respect to cost and duration of projects in the study area has been poor.
As to the trends, percentage change of time over run showed no significant trend over the three periods (2008 -2024, 2008 -2016, and 2017 -2024). Whereas percentage change of cost over run showed significant increasing trend at a rate of 200% per year over the period 2008 -2024.
However, percentage change of cost over run showed no significant trend over the other periods 2008 -2016, and 2017 -2024. Overall, the timeliness in completion of projects in the study area has showed no consistent improvement or decline over the periods; it remained unchanged. On the other hand, the effectiveness and efficiencies in budgeting, cost estimation, project cost monitoring and control, and financial management practices have either been generally declining over the long period despites it remained unchanged during the shorter time periods. Therefore, for the study area, it can be concluded that the public project management efficiency has remained unimproved for timelines of project completion and declined or at best remained unimproved for cost of projects over time despite the efforts by different stakeholder over the years. Therefore, it is required to identify site specific interventions in the planning, design, and implementation phases and implement the interventions to ensure more efficient public project management. To this end, it is recommended to carry out further studies to identify the critical intuitional, political, and socio economic factors and required intervention measures based on objective methodologies and work hard for implementation to ensure healthier and progressive construction industry.
Funding
No government or private funding support was available to this research.
Conflicts of Interest
There is no conflict of interest with regard to publication of this research manuscript
References
- L. G. Berihu, B. Grum, Z. Tariku, and B. A. Abebe, “Causes, Effects, and Mitigation Measures of Time and Cost Overruns in Water Supply Projects: Case of Tigrai Region, Northern Ethiopia,” Advances in Civil Engineering, vol. 2023, pp. 1–19, May 2023. [CrossRef]
- A.O. Daoud, M. El Hefnawy, and H. Wefki, “Investigation of critical factors affecting cost overruns and delays in Egyptian mega construction projects,” Alexandria Engineering Journal, vol. 83, pp. 326–334, Nov. 2023. [CrossRef]
- Y. F. Kassa, “Determinants of Infrastructure Project Delays and Cost Escalations: The Cases of Federal Road and Railway Construction Projects in Ethiopia,” vol. 63, no. 1, 2020.
- A.M. Kuhil and N. Seifu, “Causes of Delay in Public Building Construction Projects: A Case of Addis Abeba Administration, Ethiopia,” AJMS, vol. 8, no. 2, pp. 4–9, May 2019. [CrossRef]
- G. Taye, “Simulation Modeling of Cost Overrun in Construction Project in Ethiopia,” IJRTE, vol. 8, no. 4, pp. 12685–12691, Nov. 2019. [CrossRef]
- A. Shiferaw Belachew, “Causes of Cost Overrun in Federal Road Projects of Ethiopia in Case of Southern District,” AJCE, vol. 5, no. 1, p. 27, 2017. [CrossRef]
- N. S. Dusso and T. W. Bayeh, “The Causes and Effects of Delay of Building Construction in Ethiopia, Southern Nation Nationalities of People Region in Gurage Zone (Case of Wolkite Town),” CER, Jan. 2020. [CrossRef]
- S. Getaneh and M. Kansal, “Pandemic Construction Delay and Cost Overrun Analysis in Water Resource Project,” vol. 12, 2022.
- T. Gebrehiwet and H. Luo, “Analysis of Delay Impact on Construction Project Based on RII and Correlation Coefficient: Empirical Study,” Procedia Engineering, vol. 196, pp. 366–374, 2017. [CrossRef]
- A.A. Seman, H. M. S. Ahmed, A. Ahmed, and A. A. Haso, “Causes and Effects of Project Delay in Public Construction Projects in Ethiopia,” In Review, preprint, Mar. 2023. [CrossRef]
- R. Susanti, “Cost overrun and time delay of construction project in Indonesia,” J. Phys.: Conf. Ser., vol. 1444, no. 1, p. 012050, Jan. 2020. [CrossRef]
- A.T. Tessema, G. A. Alene, and N. M. Wolelaw, “Evaluating Delay Factors on Road Construction Projects in Ethiopia Using Relative Importance Index Method,” vol. 13, no. 01, 2023.
- S. A. Mutairi, “Analysis of Delays during Initial Phase of Construction Projects and Mitigation Measures,” International Journal of Economics and Management Engineering, vol. 11, no. 3, 2017.
- A. Narayan Shete and V., D. Kothawade, “An Analysis of Cost Overruns and Time Overruns of Construction Projects in India,” IJETT, vol. 41, no. 1, pp. 33–36, Nov. 2016. [CrossRef]
- S. Melaku Belay, S. Tilahun, M. Yehualaw, J. Matos, H. Sousa, and E. T. Workneh, “Analysis of Cost Overrun and Schedule Delays of Infrastructure Projects in Low Income Economies: Case Studies in Ethiopia,” Advances in Civil Engineering, vol. 2021, pp. 1–15, Nov. 2021. [CrossRef]
- Dire Dawa City Administration, “DireDawa_GHG Emissions Inventory Report V8.pdf,” Dire Dawa, 2022. Accessed: Dec. 04, 2024. [Online]. Available: https://www.epa.gov.et/images/PDF/Climatechange/DireDawa_GHG%20Emissions%20Inventory%20Report%20V8.pdf.
- P. J. Keane and A. F. Caletka, “Delay Analysis in Construction Contracts”.
- L. Ye, J. Zhou, X. Zeng, and M. Tayyab, “Hydrological Mann-Kendal Multivariate Trends Analysis in the Upper Yangtze River Basin,” Journal of Geoscience and Environment Protection, vol. 03, no. 10, pp. 34–39, 2015. [CrossRef]
- T. Pohlert, “Trend: Non-Parametric Trend Tests and Change-Point Detection,” The R Project for Statistical Computing, Vienna, Austria, Jul. 2018. Accessed: Mar. 04, 2019. [Online]. Available: https://CRAN.R-project.org/package=trend.
Figure 1.
Dire Dawa Administration –region .
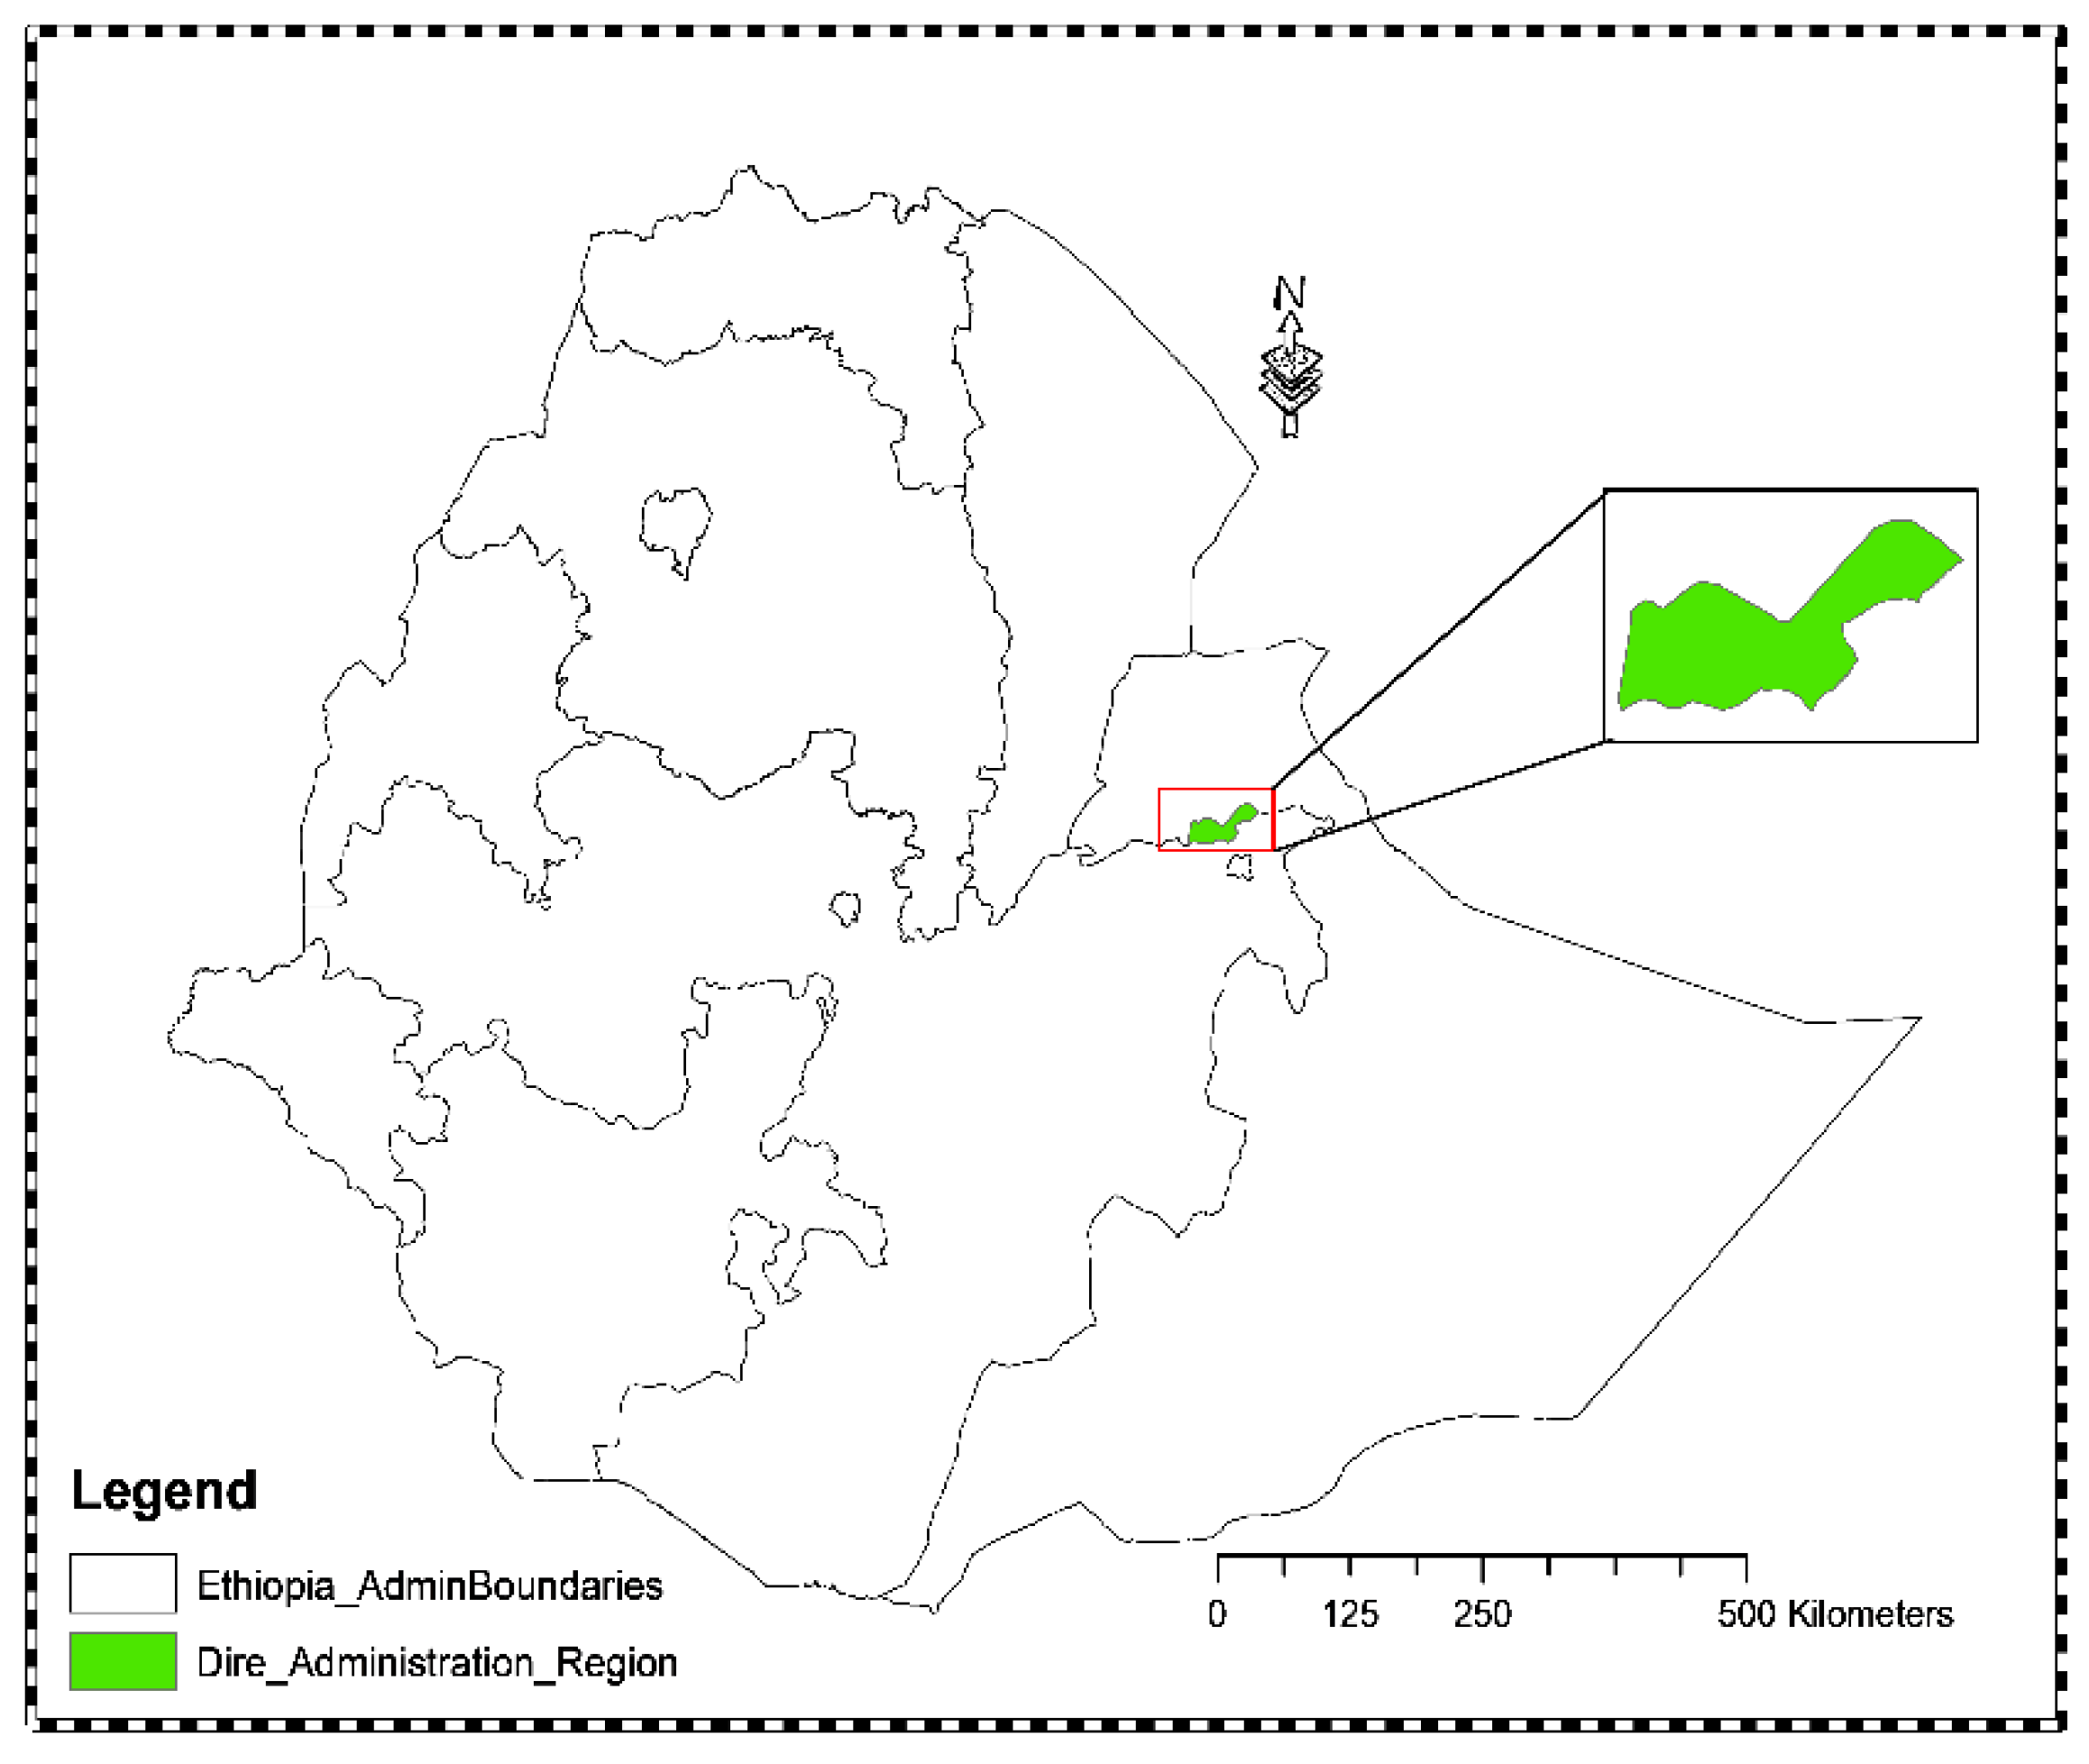
Figure 2.
Dire Dawa city and its districts.
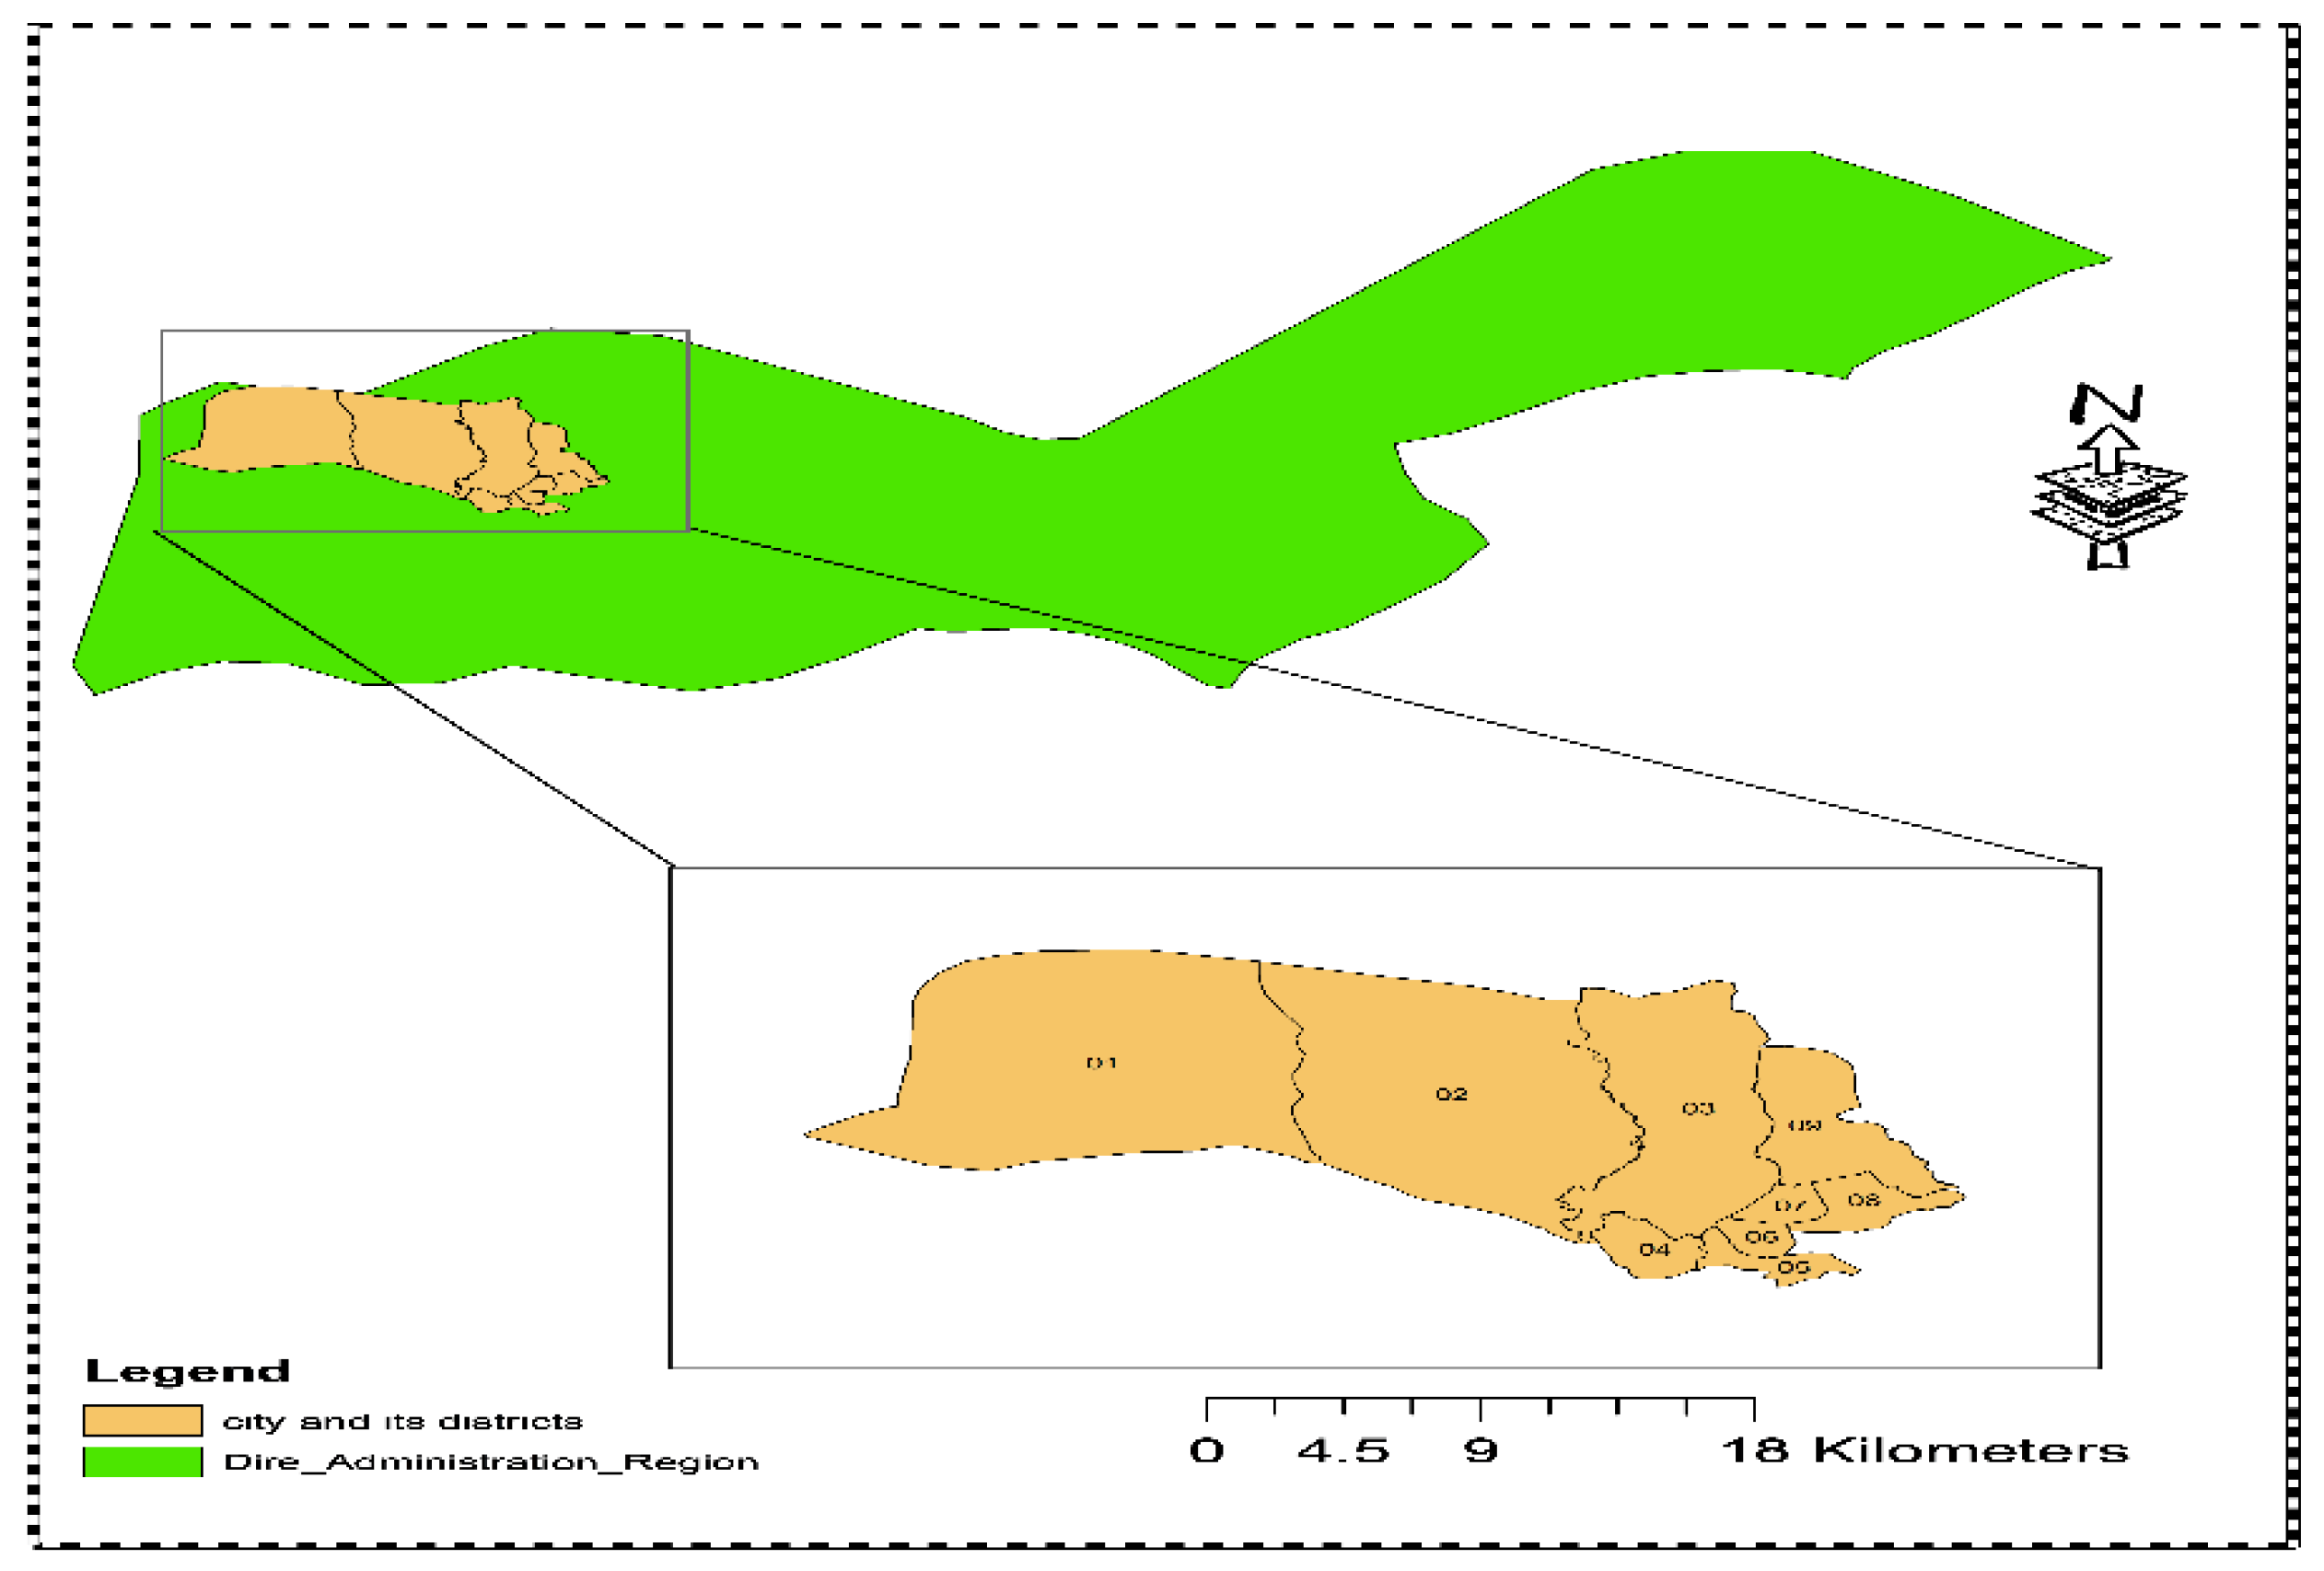
Figure 1.
The percentage composition of the public projects under the study.
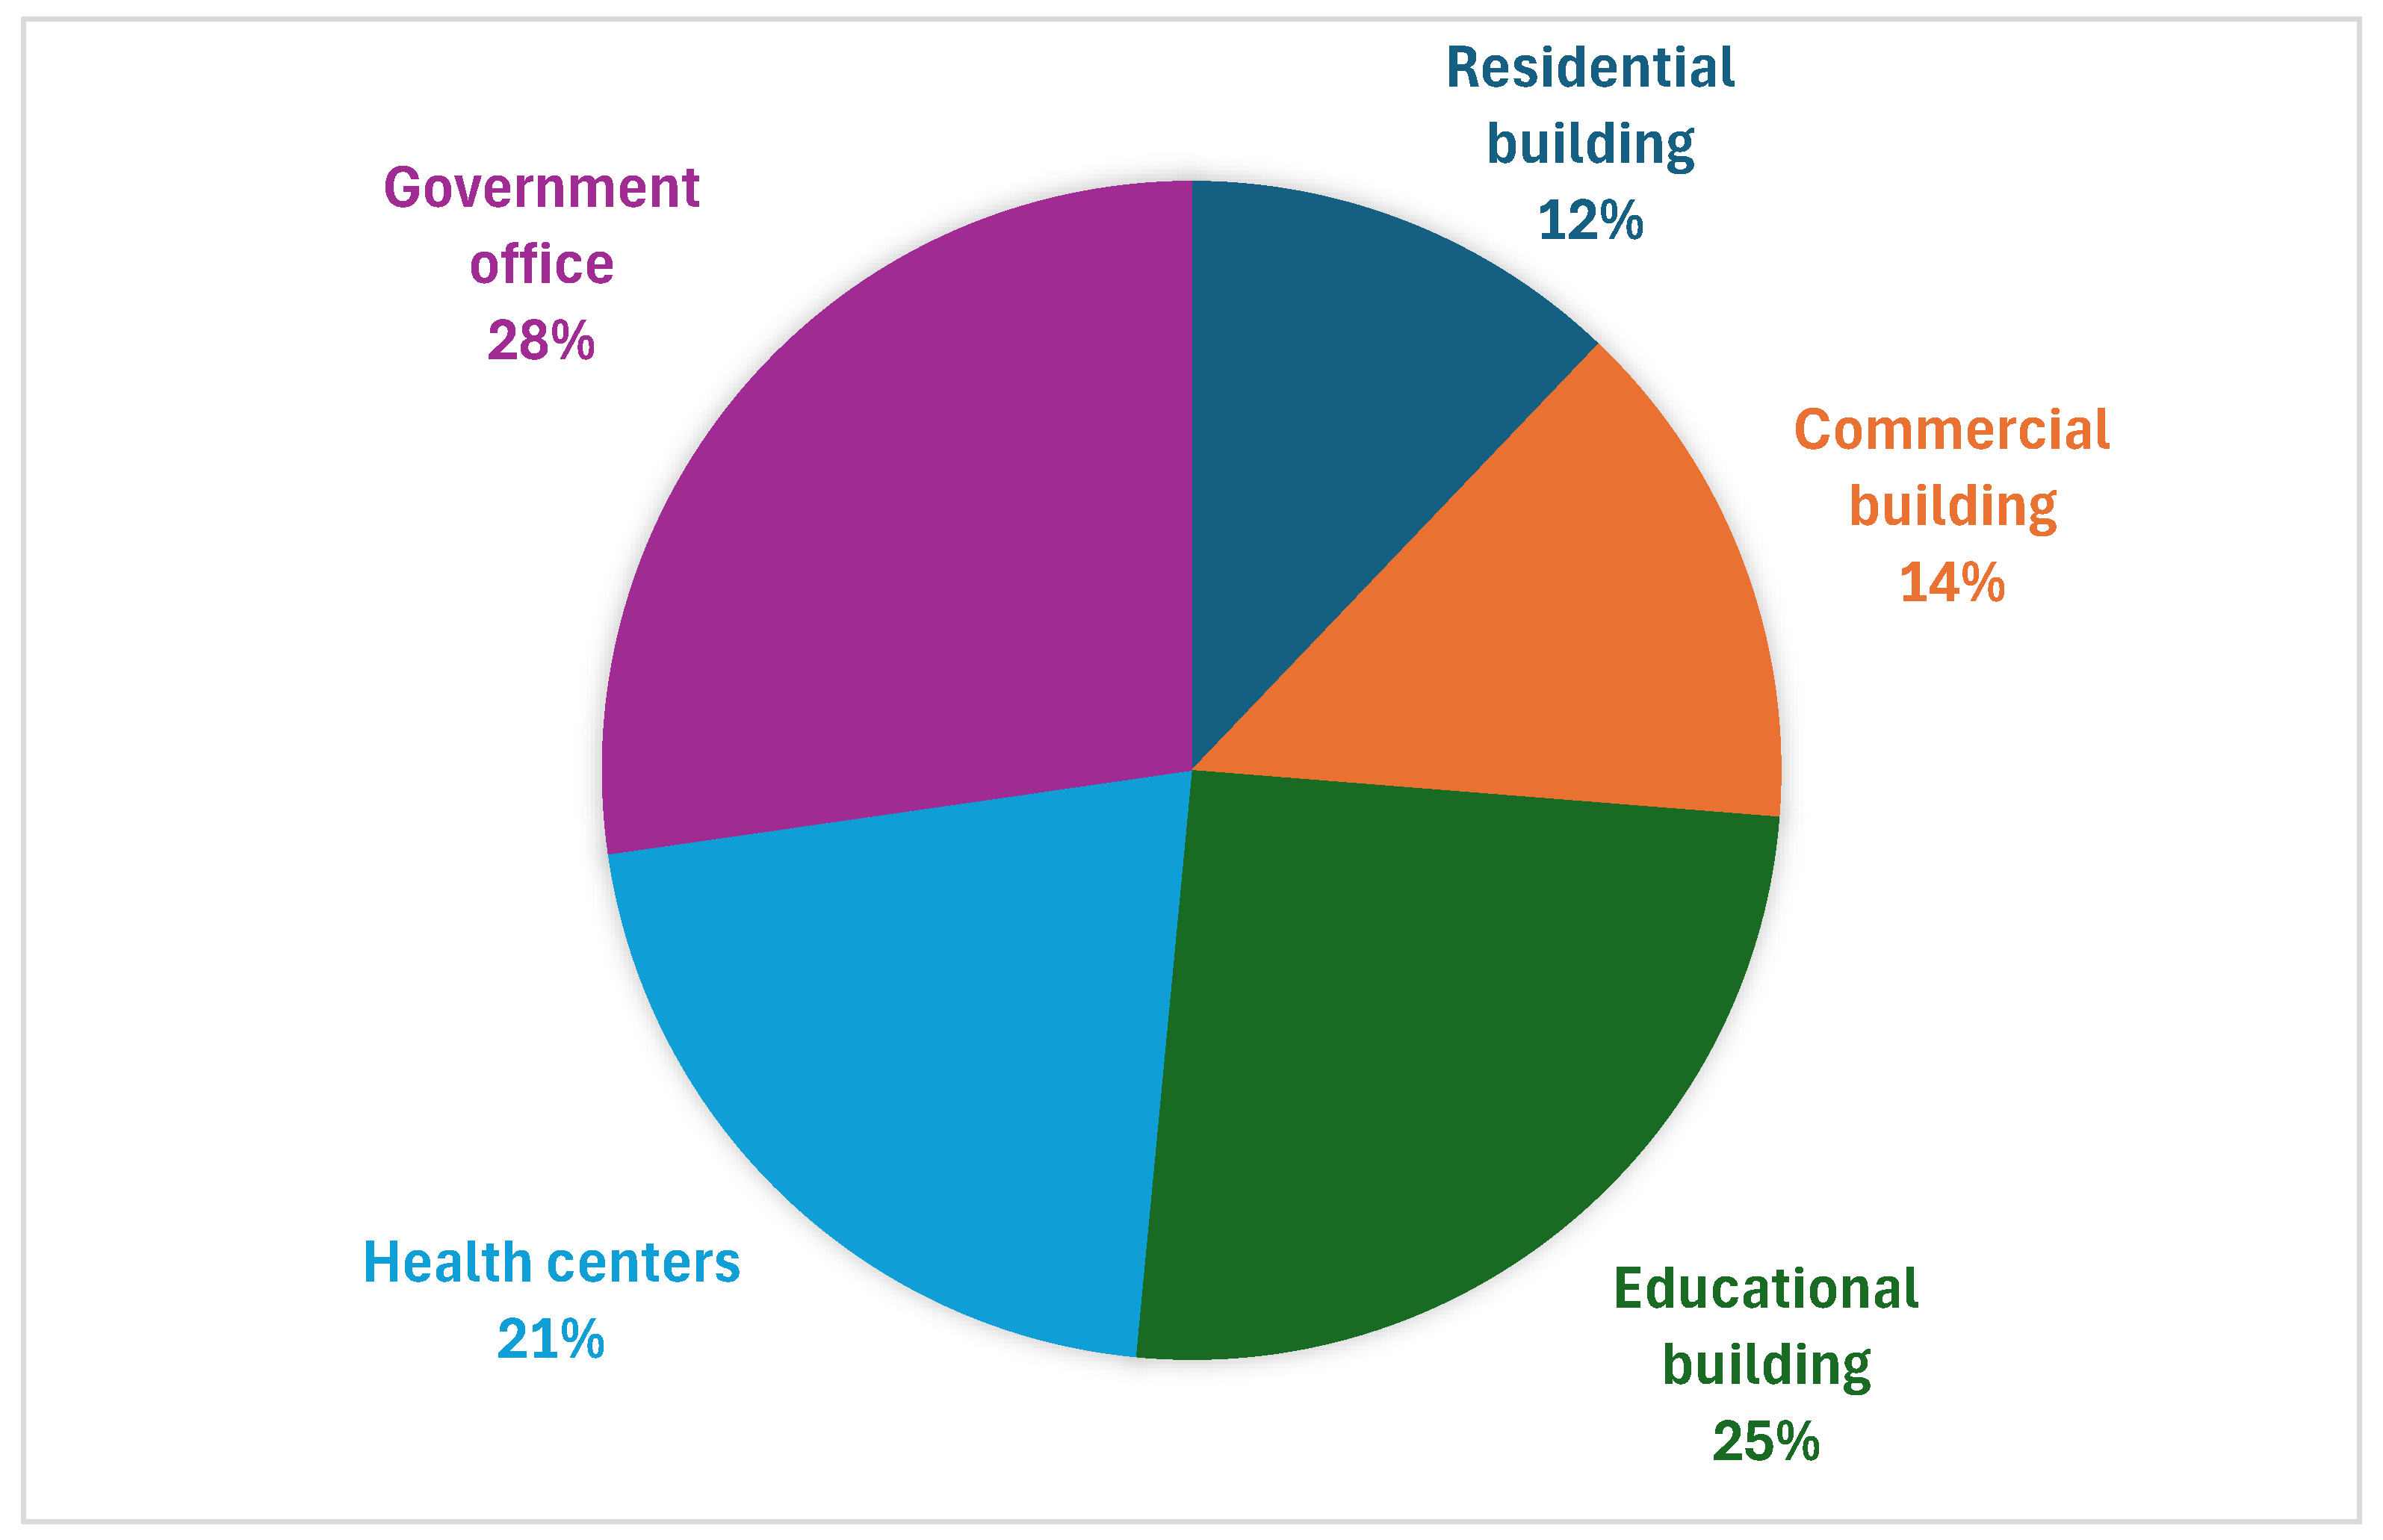
Figure 2.
The percentage composition of projects with overruns and non-overruns.
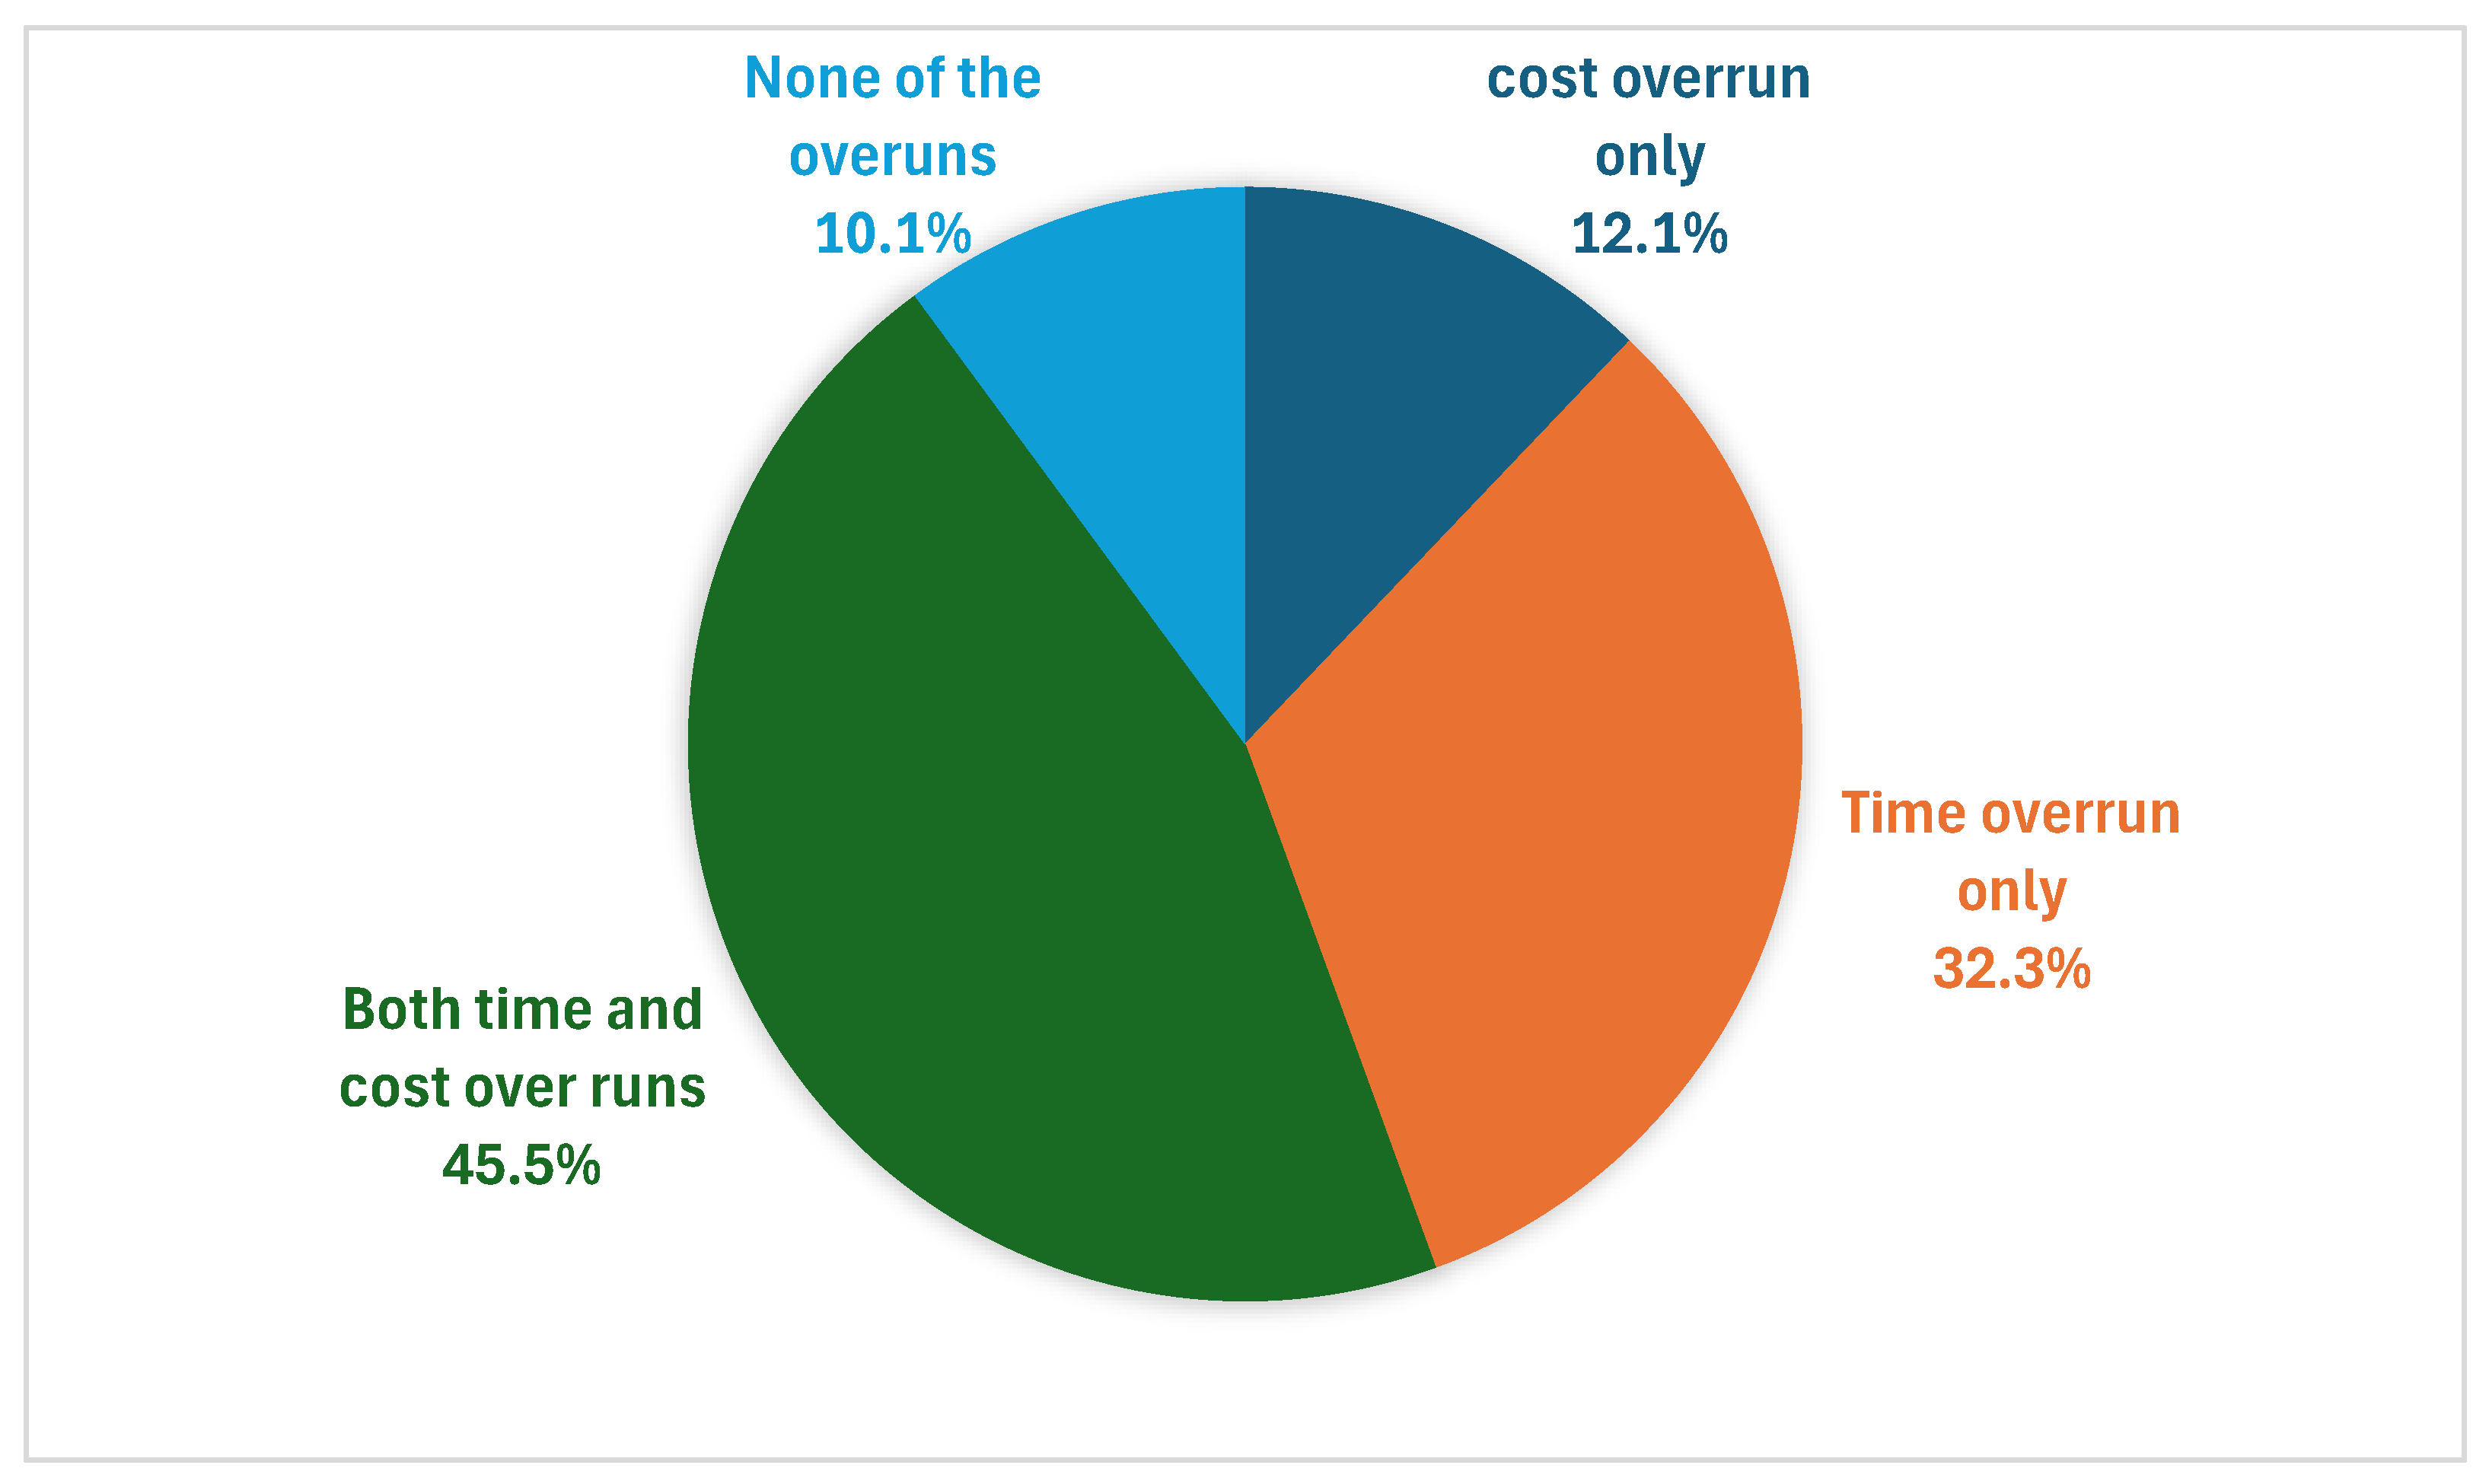
Figure 3.
Plot for the time series data of percentage change in time over run.
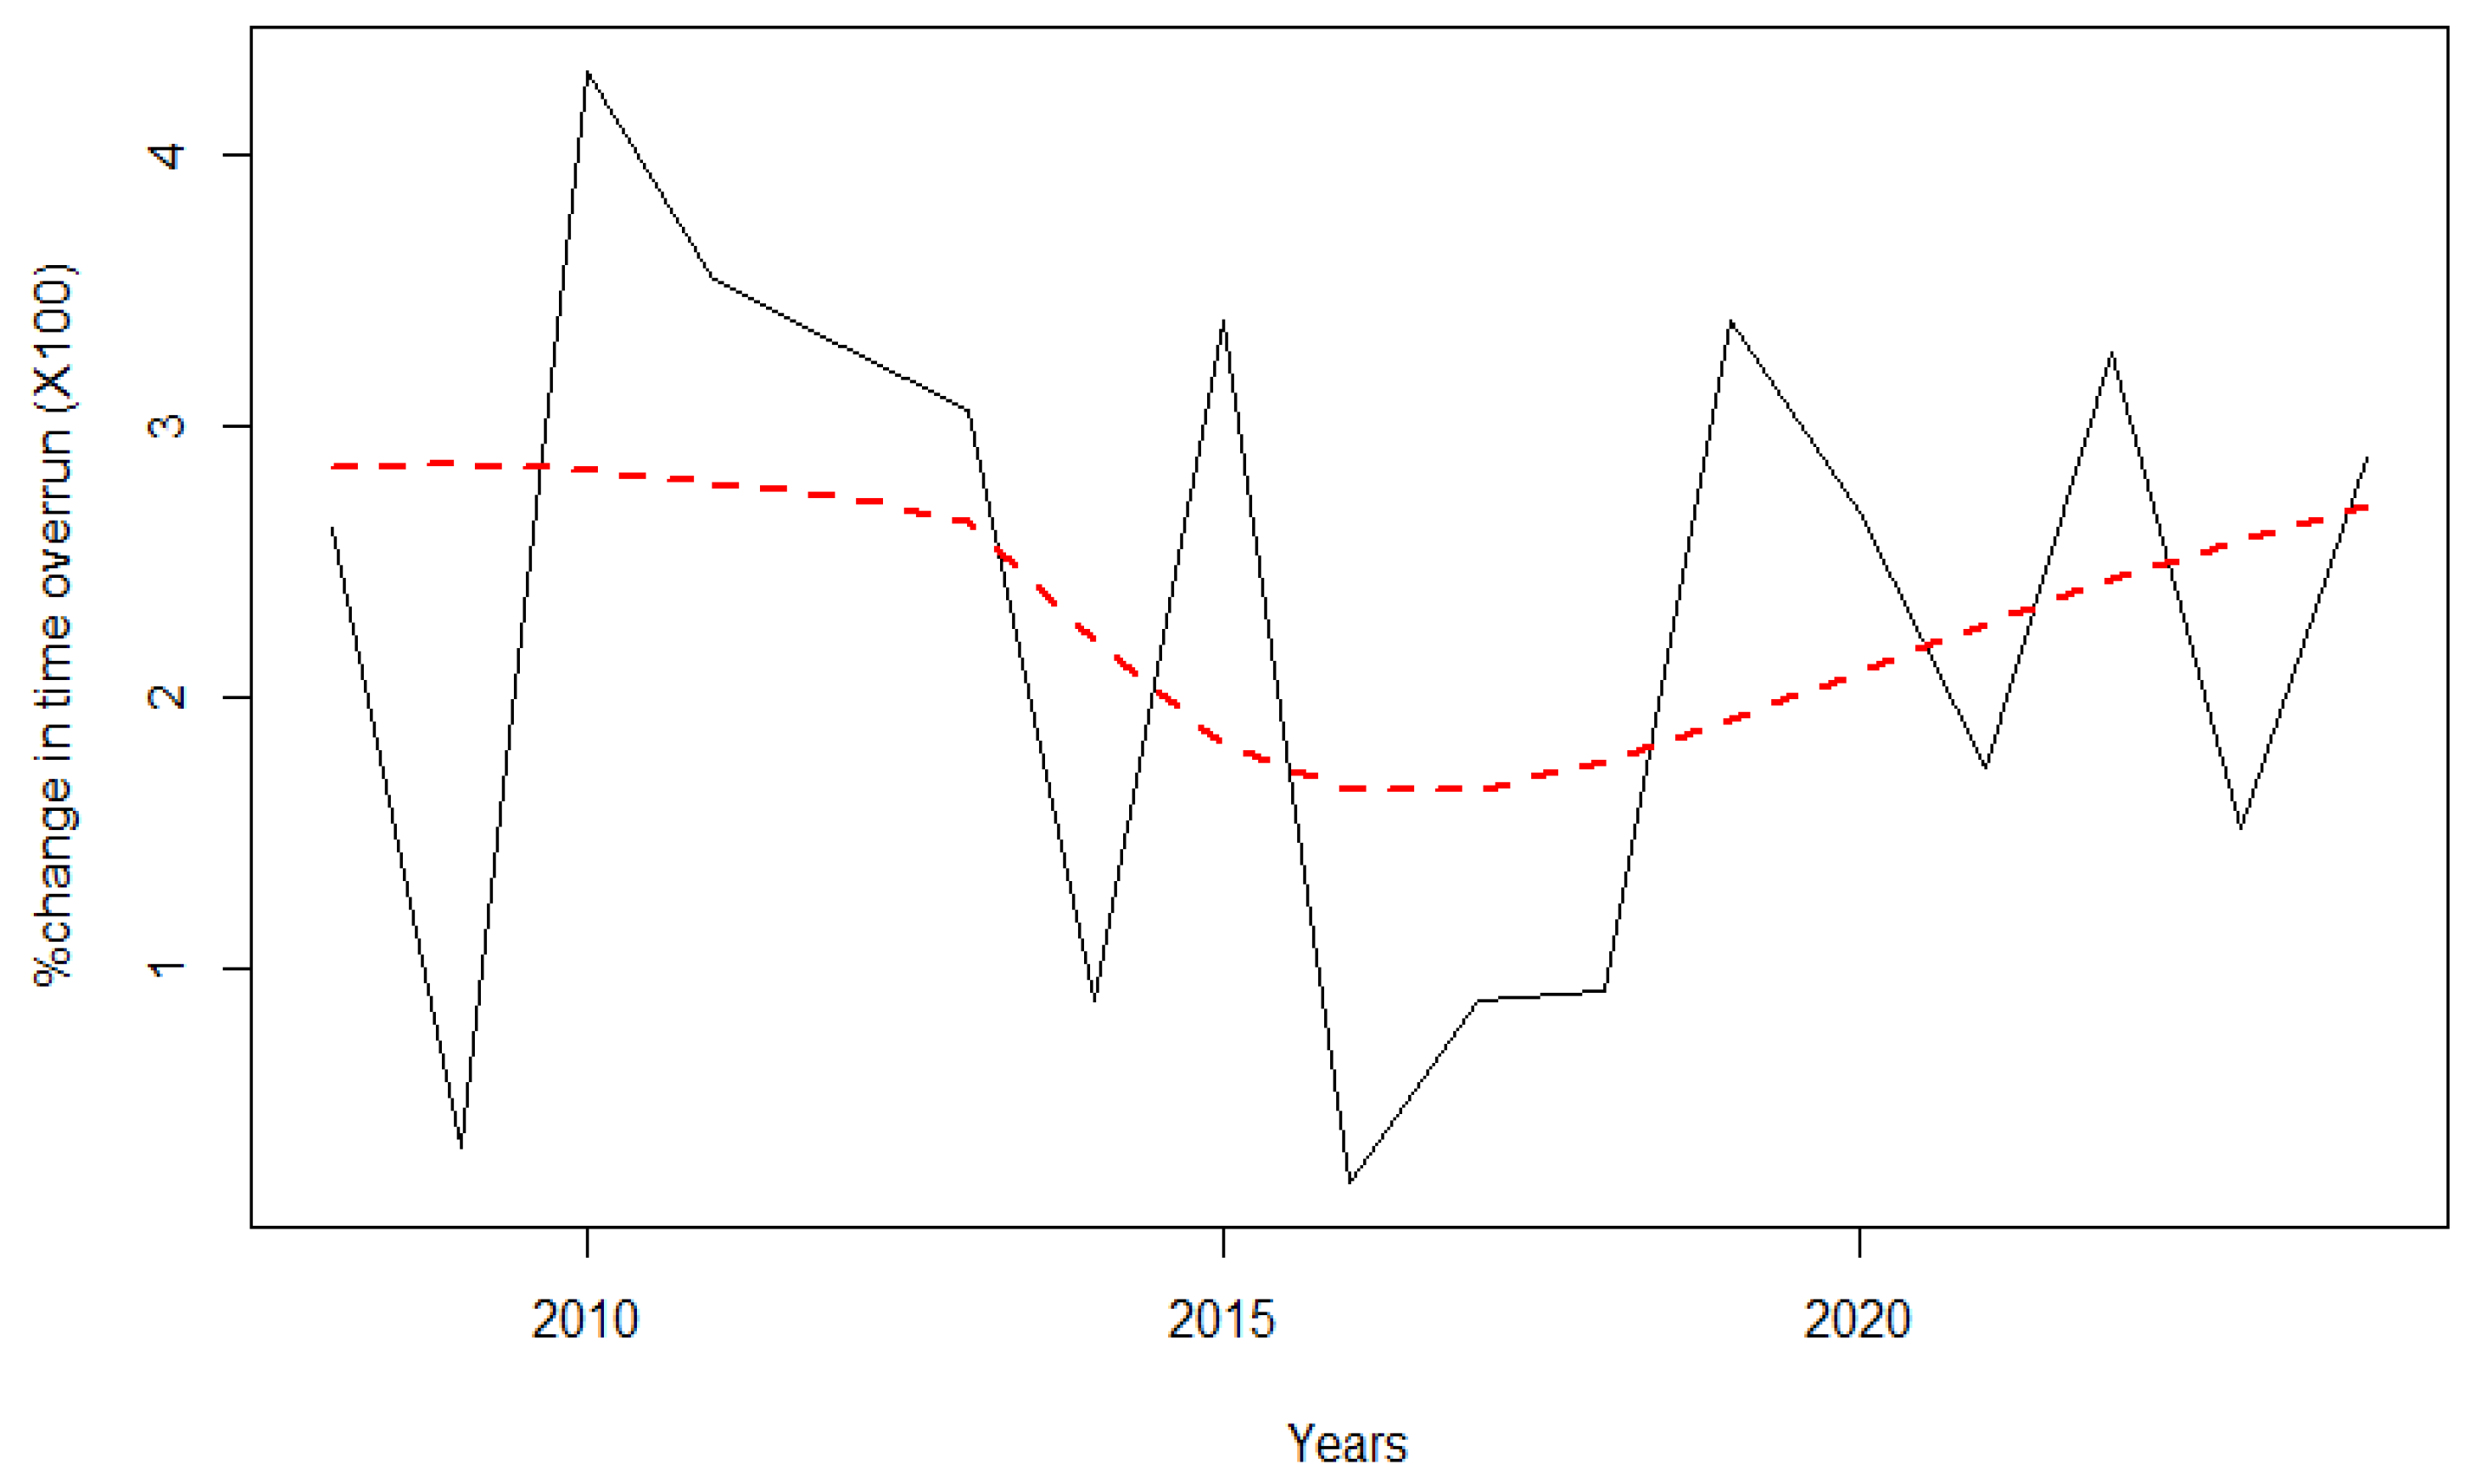
Figure 4.
plot for the time series data of percentage change in cost over run.
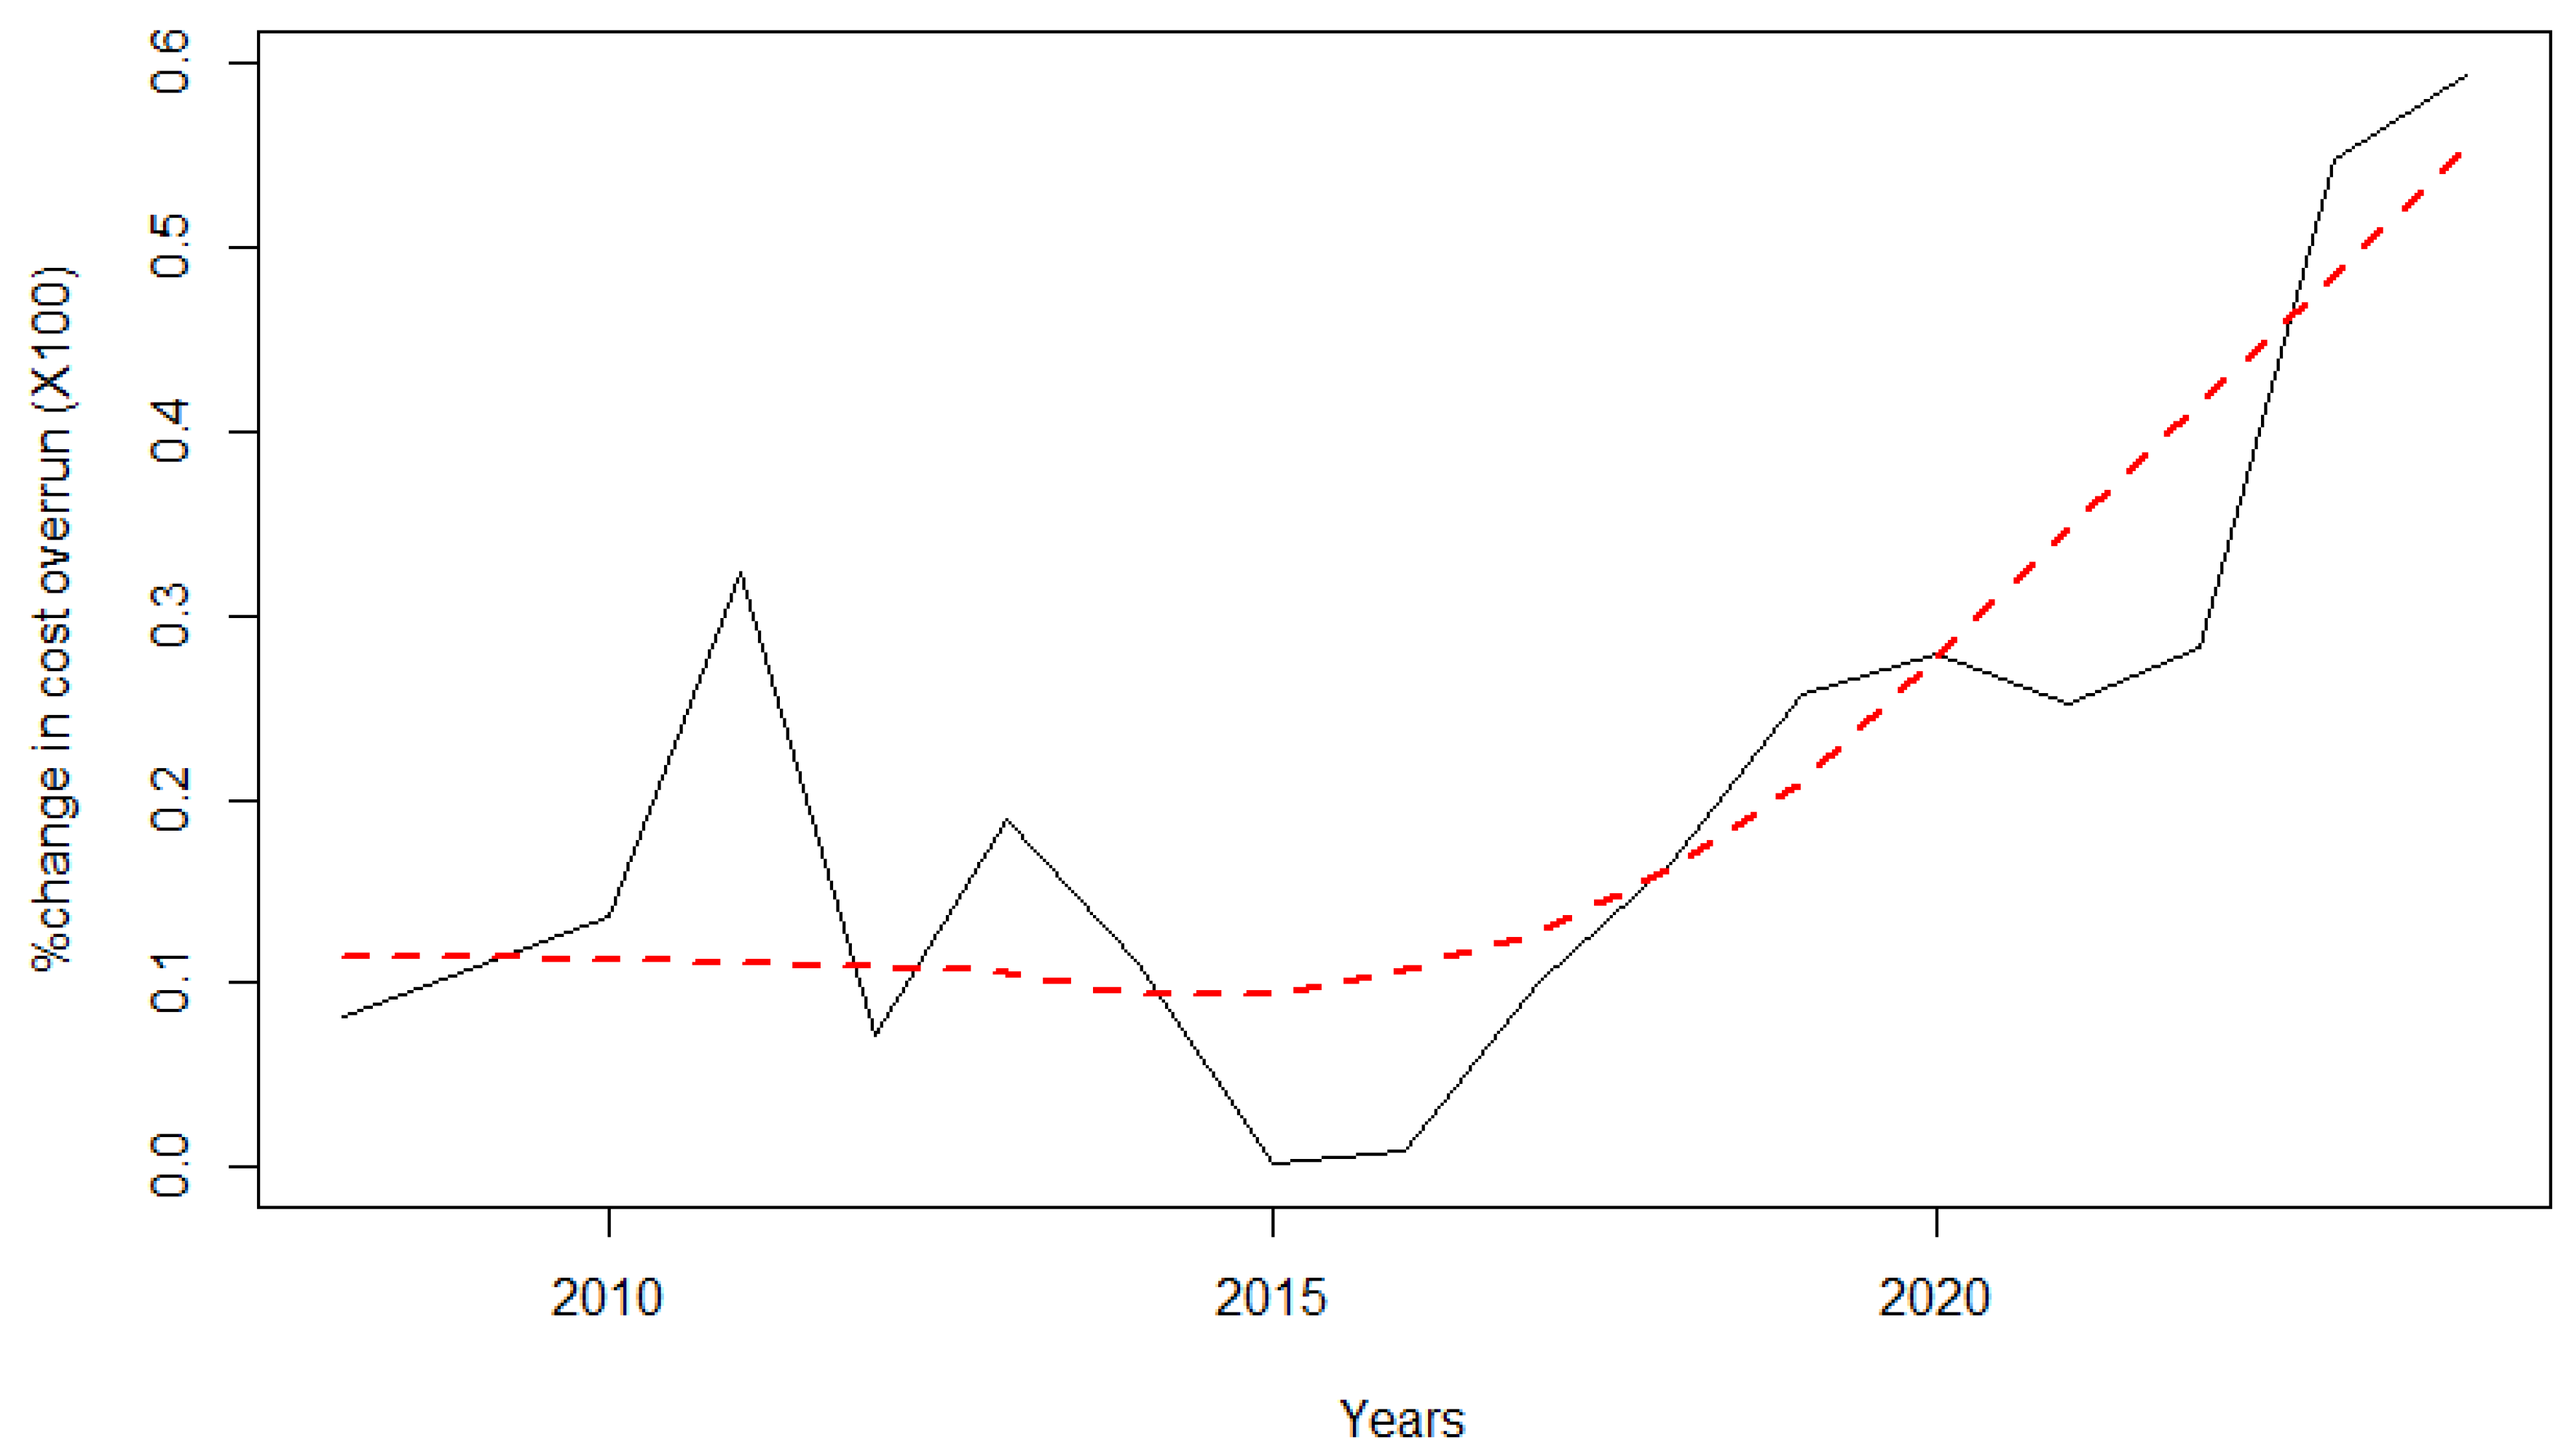

Table 1.
Trend and rate percentage time over runs.
| Time Series | Z | P-Value | Sen Slope (%/Year) |
|---|---|---|---|
| 2008 -2024 | -0.45 | 0.651 | - |
| 2008 -2016 | -0.73 | 0.465 | - |
| 2017 -2024 | 0 | 1 | - |
Note: Z and P values.
Table 2.
Trend and rate percentage cost over runs.
| Time Series | Z | P-Value | Sen Slope (%/Year) |
|---|---|---|---|
| 2008 -2024 | 2.68 | 0.007 | 200 |
| 2008 -2016 | -0.73 | 0.465 | - |
| 2017 -2024 | -0.12 | 0.902 | - |
Note: Z and P values.
Disclaimer/Publisher’s Note: The statements, opinions and data contained in all publications are solely those of the individual author(s) and contributor(s) and not of MDPI and/or the editor(s). MDPI and/or the editor(s) disclaim responsibility for any injury to people or property resulting from any ideas, methods, instructions or products referred to in the content. |
© 2025 by the authors. Licensee MDPI, Basel, Switzerland. This article is an open access article distributed under the terms and conditions of the Creative Commons Attribution (CC BY) license (http://creativecommons.org/licenses/by/4.0/).
Copyright: This open access article is published under a Creative Commons CC BY 4.0 license, which permit the free download, distribution, and reuse, provided that the author and preprint are cited in any reuse.


