
Submitted:
31 July 2025
Posted:
04 August 2025
You are already at the latest version
Abstract
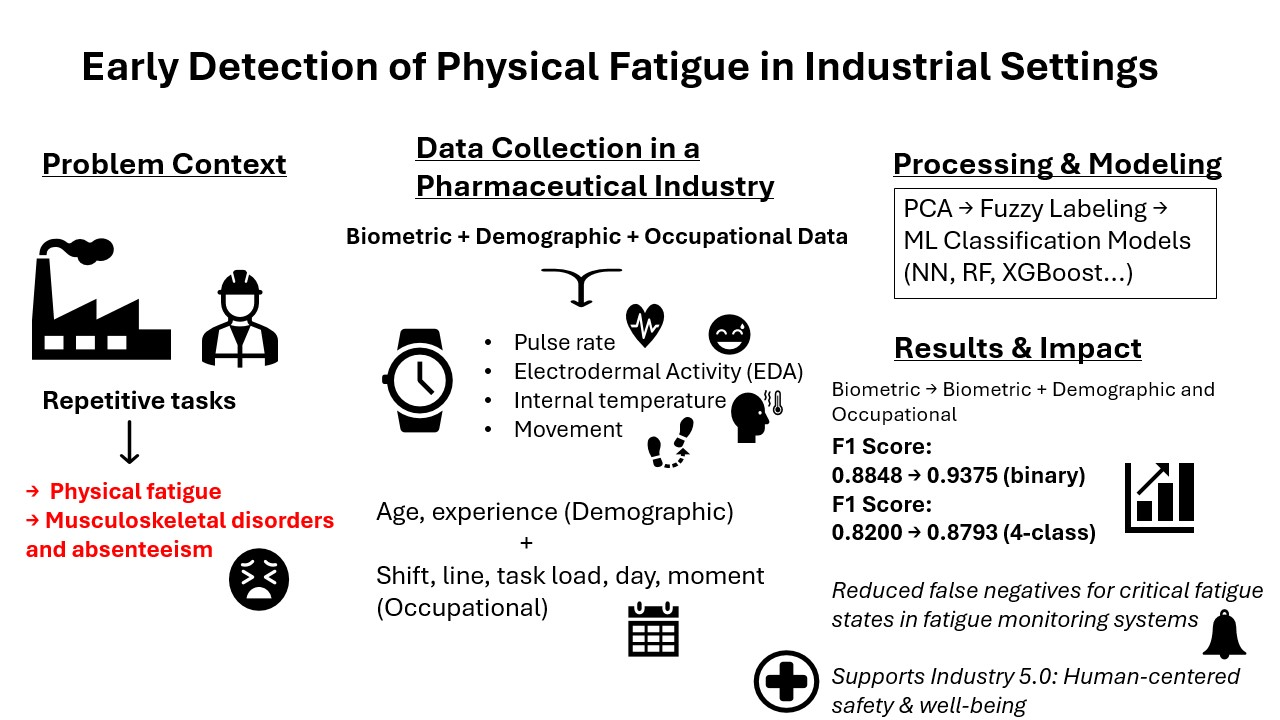
Physical fatigue in repetitive production lines contributes to musculoskeletal disorders and absenteeism. This study investigates a pharmaceutical packaging environment where workers frequently perform repetitive tasks. Biometric data—pulse rate, internal temperature, electrodermal activity, and movement—were collected using smartwatches, alongside demographic (age, experience) and occupational factors (task load, line, shift, timing) Principal Component Analysis was applied to reduce dimensionality and extract key features. A fuzzy logic-based labeling method, adapted from prior controlled studies, was used to assign fatigue levels (binary and four-class) in a non-intrusive and objective way. These labeled datasets trained various machine learning models to classify physical fatigue states. The results demonstrate that incorporating demographic and occupational context (external features) alongside biometric data significantly enhances classification performance. In the binary classification task, the F1 score increased from 0.8848 (biometric data only) to 0.9375 with the addition of external features. Similarly, in the four-level classification, the F1 score improved from 0.8200 to 0.8793 when external features were combined with biometric inputs. Feature importance analysis identified motion-related metrics as the most influential predictors, while confusion matrix results showed a clear reduction in false negatives for critical fatigue states. This work introduces a scalable, human-centered system for early physical fatigue detection in industrial settings, supporting safety, performance, and well-being in line with Industry 5.0 principles.
Keywords:
workplace fatigue
; musculoskeletal disorders (MSDs)
; physiological monitoring
; machine learning classification
; fuzzy logic
; real-time alert system
; human performance
; Industry 5.0
1. Introduction
Industry 4.0 integrates advanced technologies such as the Internet of Things (IoT), artificial intelligence (AI), and robotics to enhance industrial automation and efficiency [1]. These technologies have significantly improved production processes, optimizing workflows and reducing operational costs. However, despite these advancements, human workers remain a critical component of industrial systems [2]. Traditional quality-focused approaches often overlook human factors, such as worker fatigue and ergonomics, which are essential for maintaining safety and productivity in industrial environments [3]. Neglecting these factors has been linked to increased accidents, a higher risk of injuries, and potential quality issues in production [4]. In response, the emerging Industry 5.0 framework emphasizes a human-centered approach, blending human creativity with smart automation to prioritize worker well-being, operational performance, and sustainability [5,6].
Physical fatigue is a widespread concern in industries involving repetitive tasks such as packaging, lifting, pushing, and assembly-line work [7]. Over time, fatigue contributes to exhaustion, increased human errors, and workplace accidents [8]. It also impairs cognitive and motor functions, elevating the risk of incidents such as slips, falls, and injuries [9]. Prolonged exposure to fatigue not only affects worker performance but also leads to long-term health issues, including chronic fatigue syndrome (CFS), musculoskeletal disorders (MSDs), and weakened immune function [10,11].
The global prevalence of MSDs underscores the critical need for effective workplace prevention strategies. According to the World Health Organization, approximately 1.71 billion people worldwide are affected by MSDs, making them the leading contributor to disability globally [12]. Among these disorders, carpal tunnel syndrome (CTS), linked to repetitive hand movements, has been identified as a major occupational health concern [13]. In Colombia, MSDs have been a significant concern in occupational health. According to a study analyzing data from 2009 to 2013, 88% of reported occupational diseases were MSDs [14]. Notably, women are disproportionately affected, with a prevalence ratio of eight-to-one compared to men [15]. The most impacted age group is 41 to 60 years, but an increasing number of cases have been reported among younger workers aged 16 to 25 in recent years [15]. Studies have also identified that workers in the packaging area of pharmaceutical production lines are the most affected by ergonomic risk factors, with 69.8% of operators in the hand/wrist conditioning area reporting pain-related symptoms [16]. These findings underscore the urgent need for improved fatigue monitoring and prevention strategies.
Despite its impact, fatigue assessment remains challenging due to its subjective nature, as it is influenced by individual health conditions, job demands, and personal circumstances [17]. Traditional subjective fatigue evaluation methods, such as self-reported questionnaires, are widely used but often suffer from bias and variability [18]. A more objective approach involves physiological measurements linked to the sympathetic nervous system (SNS), such as heart activity, blood parameters, and electrodermal responses, which provide quantifiable fatigue indicators [19]. When a person engages in physically demanding tasks, the SNS responds by increasing heart rate, elevating sweat gland activity (reflected in electrodermal activity), and altering thermoregulation, among other responses. These physiological markers are not only objective indicators of fatigue accumulation but also align with well-established theoretical models linking fatigue to homeostatic imbalances and autonomic stress regulation, positioning them as reliable alternatives to subjective self-assessment. Recent advances in wearable and wireless sensor technologies now make it possible to monitor these signals in real-time, non-intrusively, and continuously, making them particularly well-suited for dynamic industrial environments where early fatigue detection is critical for safety and performance [20].
However, many existing fatigue classification models primarily rely on biometric data or subjective assessments, overlooking critical occupational and demographic factors that significantly influence physical fatigue. This gap can lead to less accurate and less generalizable models, limiting their effectiveness in real-world industrial settings. To address this, our study proposes an integrated approach that combines biometric data with demographic and occupational factors. This comprehensive model aims to enhance fatigue detection accuracy, reduce bias, and improve the robustness of physical fatigue classification in industrial contexts.
This study focuses on a pharmaceutical packaging area in a company in Colombia, where workers perform repetitive upper limb movements as part of their daily tasks. These movements involve short work cycles that require repeated muscle exertion, engaging muscle groups, bones, joints, tendons, ligaments, and nerves. Over time, this repetitive strain can lead to MSD-related complications. In this context, we analyzed biometric data collected via smartwatches, including electrodermal activity (EDA), internal temperature, and pulse rate, to monitor physiological responses associated with physical fatigue and motion data. Additionally, demographic factors such as age and work experience, task-related factors like physical load (measured by the number of drugs packed per box), and operational variables such as production line location, day of the week, work shift, and shift timing were considered. Although ambient temperature, noise, and humidity were not included as input features in the classification model, these environmental conditions were objectively monitored using an IoT-based sensor system installed in the packaging area. The data confirmed that conditions remained stable and compliant with Colombian occupational standards for pharmaceutical packaging environments.
The remainder of this paper is structured as follows. Section 2 identifies critical gaps in the literature, emphasizing the common reliance on biometric signals without considering demographic and occupational factors, and highlights the limitations of subjective labeling methods, which can introduce bias and reduce model generalizability. Section 3 describes the data collection campaign and the data analysis process, including principal component analysis (PCA) and fuzzy logic techniques before the machine learning (ML) classification algorithms. Section 4 presents the results for binary and four-level physical fatigue classification, followed by Section 5, which discusses these findings. Finally, Section 6 provides the conclusion of this study and outlines potential directions for future work.
2. State of the Art in Physical Fatigue Detection
Physical fatigue detection has become a critical area of research in recent years, driven by the need to improve worker safety. Numerous studies have investigated various methods for detecting physical fatigue, with a particular emphasis on biometric data. Table 1 summarizes some of the most influential studies in this field, including their participants, metrics, labeling methods, fatigue levels, best algorithms, and performance outcomes.
Several key approaches have emerged in recent years, each focusing on different biometric signals and machine learning algorithms for fatigue classification. For example, [23] used HRV metrics to classify physical fatigue among 15 construction workers, achieving F1 score of 0.935 using Random Forest (RF) algorithms. This study emphasized the use of ECG, respiration frequency, and skin temperature, relying heavily on biometric data without integrating demographic or occupational factors. Similarly, [24] included 24 firefighters and used a combination of heart rate (HR), breathing rate (BR), core temperature and personal characteristics for fatigue classification, achieving F1 score of 0.88 with XGBoost. [25] investigated plantar pressure and 3-axis acceleration among 10 construction workers, achieving F1 score of 0.8346 using Random Forest. The study utilized wearable insole devices but did not incorporate demographic or occupational data, which could significantly influence fatigue levels. [26] included 80 participants and used HRV metrics combined with Borg-20 scale assessments, achieving F1 score of 0.801 with LightGBM. [27] used motion capture data from 8 healthy runners, achieving F1 score of 0.905 with Random Forest. This study included a wide range of kinematic features but lacked demographic context, which could affect the generalizability of its findings. The study [28] used wearable sensors to classify physical fatigue in 22 participants performing a one-hour pick-and-place task. Using heart data, the Support Vector Machine achieved F1 score of 0.96. [29] used IMU and HR data from 14 students with prior experience performing manual activities and local employees, achieving 95.7% accuracy with Random Forest. They established a framework for selecting key features and evaluating subjective measures, demonstrating that demographic factors significantly affect physical fatigue detection, highlighting the importance of integrating these elements for more accurate fatigue modeling. [30] focused on HR data from 8 participants, achieving 90.36% accuracy using Neural Networks. This study highlighted the potential of entropy-based metrics but lacked a comprehensive consideration of demographic or occupational variables. [31] included 24 participants and used a combination of IMUs and HR monitors, achieving 87.9% accuracy with Random Forest. This approach effectively captured biomechanical data but did not consider broader workplace context or experience. [32] In this study, 15 participants performed a 180-minute manual task. Using IMU data, various models were tested for physical fatigue detection. The best results were achieved by Neural Networks and SVM, both with an F1-score of 0.90.
Most current research focuses just on biometric signals without including important contextual elements such as demographic and occupational data. Our work suggests a more all-encompassing strategy including biometric, demographic, and occupational data to overcome these constraints and increase fatigue classification accuracy. Our approach seeks to lower the bias connected with simply biometric methods and provide a stronger, context-aware fatigue detection model by including elements such age, work experience, task type, production line location, and shift timing. This integration is expected to improve the generalizability of fatigue classification systems, so increasing their effectiveness in real-world industrial environments where individual worker traits and task variability greatly affect fatigue degrees.
Additionally, these machine learning techniques are supervised methods, which require labeled data for training. However, many existing approaches rely on subjective self-reports, such as the Borg-20 scale [33] (ranging from 6, “no exertion at all,” to 20, “maximal exertion”), to label fatigue levels. These methods are often intrusive, requiring participants to rate their fatigue in the middle of their work, which can disrupt workflows and introduce variability. This reliance on subjective assessments can also introduce bias and limit the generalizability of the resulting models, reducing their practical effectiveness in real-world industrial settings. To overcome this limitation, our approach employs a fuzzy logic-based data labeling method, adapted from previous work [34], offering a non-intrusive, consistent, and objective framework for fatigue classification. This reduces reliance on self-reports and improves model robustness for deployment in real operational environments.
In the following section, the methodology used for data collection and analysis is explained in detail.
3. Materials and Methods
This section is divided into two main parts. The first part describes the data collection campaign, including the types of data collected and the conditions under which they were obtained. The second part outlines the methodology used to analyze the collected data, detailing the steps followed to develop a predictive model for physical fatigue.
3.1. Data Collection Campaign
The data collection campaign was conducted in a pharmaceutical company, specifically in the packaging area, where operators perform highly repetitive tasks, including inspecting, packaging, and sealing drugs ranging from 1, 10, to 100 items, as well as handling larger trays. These tasks require sustained fine motor control, high precision, and continuous visual focus, often involving rapid hand movements and repetitive gripping, making this an ideal environment for evaluating physical fatigue.
With 43 participants (42 females, aged 19 to 53 years, mean age 32.2 years), this study surpasses the sample sizes of many previous works, including [23] (15), [24] (24), [25] (10), [27] (8), [28] (22), [29] (14), [30] (8), [31] (24) and [32] (15), which achieved high performance despite smaller samples. This gender distribution also reflects the actual workforce composition, where approximately 80 operators include only 3 to 4 men, making this sample contextually appropriate.
Prior to participation, all 43 operators provided informed consent, confirming that they did not have any injuries or medical conditions that would prevent them from carrying out their usual work. Participants were informed that they could withdraw from the study at any time without any consequences for their employment. No financial compensation was provided. The study was approved by the Ethics Committee of the Universidad de América (Colombia) and adhered to the ethical principles of the Declaration of Helsinki (Protocol No. 002-2024).
Each participant contributed data twice per shift — once during the first part of the shift (before the scheduled 40-minute break) and once during the second part (after the break) — to capture fatigue progression within a typical work cycle. This timing reflects operational constraints and was designed to detect variations in physiological responses due to accumulated task load, while minimizing interference with production routines. During each session, participants wore an Empatica EmbracePlus smartwatch for 20 minutes to capture biometric data relevant to physical fatigue analysis [21,22]. The smartwatch recorded pulse rate (bpm) to measure heart rate in beats per minute, skin temperature (°C) to monitor peripheral temperature changes, and electrodermal activity (EDA, μS) to assess autonomic nervous system activity and physiological arousal [21,22]. Additionally, movement-related data included accelerometer readings (standard deviation of G-forces), representing movement intensity and variability, step count, and activity count, which quantified overall motion throughout the recording period.
In addition to biometric data, demographic and occupational factors were incorporated into the dataset to enhance the predictive model for physical fatigue. The demographic factors included age and work experience in the packaging area. The occupational factors encompassed physical load, referring to the number of pharmaceutical products packed per box (1, 10, 100, or long trays), and operational conditions, which considered the moment or timing of data collection specifically distinguishing between measurements taken at the start (first two hours) and end (last two hours) of the work shift, the day of the week (Monday to Friday), the work shift (three 8-hour shifts: 06:30–14:30, 14:30–22:30, and 22:30–06:30), and the production line location, where data were collected from four different scenarios: Plant 4, Line 2; Plant 4, Line 3; Plant 4, Line 4; and Plant 8, all of which involved the same packaging activity.
Once the dataset was collected, an initial baseline period at the start of each recording session was removed to eliminate artifacts related to device setup. The cleaned dataset, consisting of 2,306 samples with 13 features, was then prepared for further analysis, following the methodology outlined in the next section.
3.2. Data Analysis Techniques
This subsection describes the data analysis methods used to preprocess and analyze the collected dataset. The analysis framework consisted of three key steps: reducing dimensionality with PCA, labeling the data using fuzzy logic based on a previous study [34], and applying ML classification algorithms to develop a predictive model for physical fatigue.
3.2.1. Principal Component Analysis for Feature Extraction
PCA was used in this study not just to reduce dimensionality, but to address multicollinearity and redundancy among variables. Preliminary analysis showed inter-correlations that could affect model robustness and interpretability. PCA helped transform correlated variables into orthogonal components, improving model clarity and stability. To ensure methodological soundness, only components with eigenvalues >1 were retained, and the cumulative explained variance was guaranteed at an acceptable level.
After extracting the Principal Components (PCs) from both internal (biometric data) and external (demographic and occupational factors) datasets, a Promax rotation with Kaiser Normalization was applied [34,35]. This approach was adopted to improve physical interpretability by ensuring that the extracted components correspond to meaningful physiological and work-related variables while simplifying the data structure, reducing redundancy, and enhancing the clarity of factor loadings [34,35]. Promax, an oblique rotation technique, allows for correlations between factors - an appropriate choice given that biometric responses and occupational characteristics likely interact in influencing fatigue. The transformed components were then used in the subsequent fuzzy logic classification step to assign fatigue levels before training the ML classification models.
3.2.2. Fuzzy Logic-Based Data Labeling for Physical Fatigue Classification
To address the research gap related to the subjectivity and intrusiveness of self-assessment methods for fatigue labeling, this study uses a fuzzy logic-based data labeling approach. This method, based on earlier work [21,22], assigns each sample a degree of membership to either the fatigue or non-fatigue group, rather than making a strict binary classification. This provides a more flexible and realistic representation of physical fatigue, capturing gradual transitions between fatigue states that conventional approaches often miss.
The fuzzy logic approach [36] relies on probability density functions (PDFs) and cumulative distribution functions (CDFs) derived from a previous dataset [37] collected in a controlled fitness setup designed to simulate industrial tasks. In this earlier study, participants performed physically demanding activities such as pushing, pulling, lifting, picking up, tugging, and bending, selected to replicate the physical workload typically encountered in industrial environments [21,22]. These tasks were conducted in a controlled fitness setting designed to simulate real-world conditions in a safe and repeatable manner, emphasizing repetitive and monotonous task execution. The nature of these activities closely resembles those observed in pharmaceutical packing lines, particularly in the case study involving manual operations under time and precision constraints. Physiological data were continuously recorded using Empatica EmbracePlus smartwatches, which monitored four key indicators linked to physical fatigue: pulse rate (PR), electrodermal activity (EDA), skin temperature, and movement data. These parameters were chosen due to their strong association with activation of the sympathetic nervous system, providing objective insights into levels of physical exertion. To complement the physiological measurements, participants also self-reported their perceived exertion using the Borg Rating of Perceived Exertion (RPE) scale (ranging from 6 to 20), which served as subjective ground truth labels for training machine learning models aimed at classifying physical fatigue levels.
By applying these pre-established PDFs and CDFs, this approach calculates fuzzy probability coefficients for each sample in the current dataset, creating a more objective and consistent framework for fatigue classification. This method significantly reduces the subjectivity and potential bias introduced by traditional self-reports, providing a more accurate representation of physical fatigue in real-world industrial contexts.
To ensure consistency, the same normalization method used in the previous study was applied before implementing the fuzzy logic classifier. The decision to adopt the (μ, σ) parameters from [37] was based on three key justifications. First, the tasks simulated in the controlled fitness setup were designed to resemble industrial operations like those observed in the pharmaceutical packaging environment. Second, biometric data were collected using the same wearable device (Empatica EmbracePlus), ensuring consistency in signal acquisition. Third, both datasets underwent Principal Component Analysis (PCA), and the same physiological patterns were identified in the first internal principal component (IPC1), validating the correspondence between the two settings. These parallels allowed us to confidently apply the established PDFs/CDFs to the real-world dataset. Nevertheless, future applications will benefit from recalibrating fuzzy parameters using larger real-world datasets to improve task-specific accuracy. Specifically, Z-score normalization was used:
where x represents the raw data value, µ is the mean, and σ the standard deviation of the original dataset. The same µ and σ values from the previous dataset were applied to the new dataset to ensure scale consistency and allow the fuzzy classifier to correctly map the new data onto the pre-established fatigue and non-fatigue distributions.
Once the data was normalized, we compute the fuzzy membership values for each sample xi using the pre-fitted PDF and CDF functions for the fatigue and non-fatigue states:
These membership values indicate how strongly each data point is associated with either the fatigue or non-fatigue group. For the final labeling, two classification approaches were implemented: binary classification and multiclass classification with four levels. In the binary approach, samples were assigned to fatigue or non-fatigue groups based on the crossover point of the membership functions. In contrast, the four-level classification introduced intermediate fatigue states, categorizing samples into pure non-fatigue, higher non-fatigue, higher fatigue, and pure fatigue states, based on their degree of belonging to each group.
3.2.3. Machine Learning Classification Algorithms for Physical Fatigue Prediction
After applying the preliminary analysis, we obtained a reduced dataset consisting of principal components derived from biometric data (internal factors) and demographic and occupational factors (external factors), along with the fatigue labels generated through fuzzy logic analysis. We subsequently applied various machine learning classification algorithms to evaluate their performance in both binary and four-level fatigue classification tasks. The decision to implement a four-level fatigue classification was driven by the need for a more granular and proactive assessment of physical fatigue, enabling earlier identification of fatigue symptoms before reaching critical levels - an essential consideration for maintaining safety in industrial environments. This multi-level classification approach is supported by previous studies [23,24,25], which have shown that distinguishing between multiple fatigue levels not only captures a broader range of fatigue intensities but also contributes to more actionable insights for fatigue management.
The analysis evaluated the weighted F1 score for each classifier and feature set - considering both binary and four-class fatigue classification - using a 5-fold cross-validation process. The weighted F1 score was chosen to address the challenges posed by class imbalance, as it provides a more balanced evaluation by accounting for both precision and recall across all classes while adjusting for their relative frequencies. Unlike accuracy, which can appear deceptively high when the model favors the majority class, the weighted F1 score offers a more reliable measure of performance, especially in imbalanced scenarios where correctly identifying minority class instances is critical. To prevent data leakage between training and testing sets, cross-validation was stratified by individual participants, ensuring that all data from a given participant appeared exclusively in either the training or testing set within each fold. This approach preserved the independence of the evaluation process and prevented the model from learning participant-specific patterns that could bias the results. Overfitting was further monitored and controlled through several strategies. Hyperparameter tuning for each classifier was conducted within the cross-validation framework, using either grid search or manual tuning based on the average cross-validation performance. For models prone to overfitting, such as Neural Networks and tree-based ensembles, regularization techniques were applied: L2 regularization for Neural Networks, and parameter constraints such as maximum tree depth, reduced learning rates, and early stopping (where applicable) for XGBoost and Gradient Boosting. Additionally, to further mitigate imbalance effects, SMOTE (Synthetic Minority Over-sampling Technique) was applied to generate synthetic samples for underrepresented classes, enhancing the robustness of the training data. The analysis also compared two feature configurations: one using only internal factors (biometric data), and another combining both external (demographic and occupational) and internal factors, to evaluate the potential performance improvement gained by incorporating contextual information.
Based on insights from the literature review on physical fatigue prediction using wearable devices in industrial settings [23,24,25,26,27,28,29,30,31,32], a set of machine learning algorithms was selected for evaluation. These included Neural Networks (NN), Random Forest, XGBoost, Gradient Boosting, K-Nearest Neighbors (KNN), Support Vector Machine (SVM), and Logistic Regression - all of which have demonstrated competitive performance in prior fatigue detection studies. For each classification task, the weighted F1 score was used as the primary performance metric. The results present the F1 scores of the four best-performing models, along with the best hyperparameter configurations identified through tuning. To assess the statistical significance and robustness of the F1 scores, a bootstrapping technique was applied without setting a fixed seed during resampling. This involved resampling the training data with replacement, retraining the model on each resampled dataset, and evaluating it on the original test set. The process was repeated 1,000 times, producing a distribution of F1 scores from which the 95% confidence interval was computed.
4. Results
This section presents the main findings, following the same sequence of the data analysis techniques described earlier. First, we outline the results of PCA, highlighting the extracted components from biometric, demographic, and occupational factors. Next, we present the fuzzy logic classification results, detailing the assigned fatigue levels based on the membership functions. Finally, we evaluate the performance of ML classification algorithms, comparing their effectiveness in predicting binary (two-level) and multiclass (four-level) physical fatigue states. The evaluation is conducted in two stages: first, using only internal data, and then with a combined approach that integrates both external data (demographic and occupational factors) and internal biometric signals to assess their impact on classification performance.
4.1. PCA Results
After extracting the PCs from both internal (biometric data) and external (demographic and occupational factors) datasets, the Promax rotation with Kaiser Normalization was applied to enhance interpretability. For biometric data (internal factors), two principal components were retained based on the Kaiser criterion (eigenvalues > 1), explaining a total of 62.81% of the variance:
- ◦
- IPC1 (internal principal component 1) had an eigenvalue of 2.566, explained 42.77% of the variance, and was primarily associated with physiological responses, including EDA (0.703), pulse rate (0.711), and skin temperature (0.505) (Table 2).
- ◦
- IPC2 (internal principal component 2) had an eigenvalue of 1.202, contributed an additional 20.03% of the variance, and was associated with motion-related metrics such as accelerometer data (0.867), step count (0.918), and activity count (0.863) (Table 2).
This analysis resulted in distinct components that grouped variables based on their underlying relationships, aligning with previously published findings [34,35].
For external factors (demographic and occupational data), four principal components were retained based on the Kaiser criterion (eigenvalues > 1), together explaining a cumulative 85.21% of the total variance:
- ◦
- EPC1 (external principal component 1) had an eigenvalue of 2.489 and explained 35.56% of the total variance. It reflects work-related process factors, including shift (0.734), production line (0.929), and number of products (0.811) (Table 3) which are likely to contribute to workplace fatigue through operational demands and task complexity.
- ◦
- EPC2 (external principal component 2) had an eigenvalue of 1.356 and explained 19.37% of the variance. It captures personal attributes, specifically age (0.955) and experience (0.845) (Table 3) forming a demographic dimension linked to worker characteristics and potentially influencing fatigue susceptibility.
- ◦
- EPC3 (external principal component 3) had an eigenvalue of 1.113 and explained 15.89% of the variance. It is dominated by the variable day of the week (0.968) (Table 3) and while it represents a single-variable component, it was retained due to its contribution to the cumulative variance.
- ◦
- EPC4 (external principal component 4) had an eigenvalue of 1.007 and explained 14.39% of the variance. It is associated primarily with the moment of measurement (0.997) (Table 3). Despite being driven by a single variable, it was also retained to preserve the comprehensive variance structure.
Promax has been adopted here with the capability of involving correlations between factors. Compared with orthogonal methods like Varimax that may oversimplify the relationship, it seems to be more reasonable to apply oblique techniques given that biometric responses and occupational characteristics likely interact in influencing fatigue. To verify robustness, Oblimin rotation was also tested as another oblique rotation technique and yielded highly consistent results with Promax. Although minor differences in loading magnitudes were observed, the overall factor structure and model performance remained stable across both methods.
According to Table 2 and 3, the original 13-dimensional feature set was effectively reduced to a 6-dimensional feature set through Principal Component Analysis (PCA), consisting of 2 components derived from biometric variables (explaining 62.81% of the variance) and 4 components from external variables (explaining 85.21%). This transformation addressed multicollinearity and produced structured, interpretable inputs for the fatigue classification model [38]. The difference between the internal and external variable reduction shows a stronger multicollinearity within biometric data and more independence exhibited by external variables. Moreover, the factor loading explored through the Promax rotation technique enhances the interpretability of extracted components, where significant variables were highly focused. This helps to interpret the physical meaning of each PC, like physiological response-related PC (IPC1), motion metric-related PC (IPC2), work process-related PC (EPC1), etc. Such information is meaningful to reflect the hidden latent variables of physical fatigue for a comprehensive understanding. Noticeably, EPC3 and EPC4 are largely dominated by a single variable, with ‘Day’ and ‘Moment’ respectively. This result stresses the unique variance contributed by these two variables, which is not shared with other variables. Thus, it is recommended to explore the contribution of them in a relatively separate way in the sequent modeling section.
This finding is consistent with our initial hypothesis: in pharmaceutical industry contexts, external factors - due to the complexity of tasks, demographic and occupational characteristics - may provide essential and distinct information that complements biometric signals. Therefore, incorporating external variables helps to construct a more reliable physical fatigue classification model, rather than relying solely on biometric data.
4.2. Fuzzy Logic-Based Label Classifier Results
To label the fatigue level of monitored data at each time, the established fuzzy logic classifier from our previous work has been adopted [34]. Specifically, all internal factors contribute to calculating the membership degree through their explored factor loadings (Table 4). The same normalization method from the previous study was applied to ensure consistency in data scaling (equation (1)). Being aligned to the equation (2), the fuzzy logic approach computed membership degrees for each sample with the detailed parameters provided by equation (3), determining its probability of belonging to either the fatigue or non-fatigue category. Based on these probabilities, labels were assigned using binary classification (fatigue vs. non-fatigue) and four-level classification, where fatigue was categorized into progressive intensity levels.
The first membership function plot (Figure 1(a)) illustrates the probability distribution for fatigue classification based on IPC1. A threshold was set at the intersection of the non-fatigue and fatigue states, enabling binary classification. The corresponding histogram (Figure 1(b)) shows the distribution of samples, indicating a higher frequency of non-fatigue cases compared to fatigue cases.
To enhance classification granularity, the second membership function plot (Figure 2(a)) introduces a four-level fatigue classification based on progressive membership values: Pure Non-Fatigue, Higher Non-Fatigue, Higher Fatigue, and Pure Fatigue. The histogram of the four-class labels (Figure 2(b)) shows an imbalanced distribution of fatigue states, with a higher frequency of Higher Non-Fatigue cases compared to the other categories. This indicates that while the classification differentiates between subtle fatigue levels, the distribution of samples across the four categories is not uniform.
These labeled fatigue states serve as training targets for the next stage, where ML classification models will be implemented to predict physical fatigue. As previously explained, SMOTE was used to address class imbalance, and F1-weighted scoring was employed to ensure fair performance comparison across both binary and multi-level classification settings.
4.3. Machine Learning Classification Algorithms Results
In this section, we present the results of ML classification algorithms applied to predict binary (fatigue vs. non-fatigue) and four-level physical fatigue states, defined as pure non-fatigue, higher non-fatigue, higher fatigue, and pure fatigue states. The analysis was conducted using two feature configurations: one considering only internal data, consisting of the principal components IPC1 and IPC2, and another integrating both external and internal data, incorporating EPC1, EPC2, EPC3, and EPC4 along with the internal components. The results are structured into two subsections, each evaluating the impact of these feature sets on classification performance. To assess the model effectiveness, the F1-weighted score is reported, as it is particularly well-suited for this study given the imbalanced nature of the dataset, especially in the multi-class configuration. For brevity, "F1 score" hereafter refers to the F1-weighted score. The evaluation focused on the four top-performing classification algorithms.
4.3.1. Internal Features
For binary classification, among the evaluated classifiers, the top four models based on F1-weighted score were the NN, SVM, XGBoost, and Logistic Regression (Table 5). The NN achieved the highest test F1 score of 0.8848, with a 95% confidence interval ranging from 0.904 to 0.919. Its best performance was obtained using a tanh activation function, a low regularization strength (alpha = 0.0001), and a single hidden layer with 100 neurons. The SVM followed with an F1 score of 0.8798 and a confidence interval of 0.895 to 0.911, performing best with a radial basis function kernel and a regularization parameter of 1. XGBoost achieved an F1 score of 0.8785, with a confidence interval of 0.878 to 0.910, and was optimized with a learning rate of 0.05, a maximum tree depth of 3, and 200 boosting rounds. Lastly, Logistic Regression performed reliably with a test F1 score of 0.8782 and a confidence interval of 0.904 to 0.914.
Feature importance is reported exclusively for XGBoost, as it consistently ranked among the top-performing models and, thanks to its tree-based structure, provides reliable and easily interpretable measures of feature relevance. In contrast, feature importance was not reported for NN due to their complex and non-linear architecture, which does not offer direct or transparent feature contribution metrics. Similarly, SVMs rely on kernel transformations that obscure the direct influence of individual features, making interpretation difficult. Although Logistic Regression provides model coefficients, these are not directly comparable to the feature importance scores generated by tree-based models. The XGBoost analysis showed that IPC2 had a significantly higher importance (0.7331) than IPC1 (0.2669), highlighting IPC2’s stronger influence on the fatigue classification task.
For the four-level physical fatigue classification the four best-performing models in terms of F1-weighted score were XGBoost, NN, RF, and Logistic Regression (Table 6). XGBoost achieved the highest F1 score of 0.8232, with a 95% confidence interval ranging from 0.773 to 0.815. This model performed best using a learning rate of 0.1, a maximum tree depth of 3, and 200 boosting rounds. The NN followed closely with an F1 score of 0.8200 and a confidence interval of 0.811 to 0.832, using the ReLU activation function, a regularization strength of 0.0001, and a two-layer architecture with 100 and 50 neurons, respectively. Random Forest achieved a comparable F1 score of 0.8195, with a confidence interval between 0.788 and 0.826, tuned with a maximum depth of 10 and 200 trees. Logistic Regression performed reliably with an F1 score of 0.8179 and a confidence interval from 0.805 to 0.826. Feature importance was examined for the tree-based models, XGBoost and RF, as both provide interpretable measures of feature relevance. For XGBoost, IPC2 had a higher contribution (0.7718) compared to IPC1 (0.2282), while RF showed a similar trend with IPC2 (0.7366), contributing more than IPC1 (0.2634).
Figure 3 presents the normalized confusion matrix for the four-level physical fatigue classification using just the internal features as predictors and the XGBoost algorithm. The matrix illustrates the model’s ability to correctly classify instances across the four fatigue states: Pure Non-Fatigue, Higher Non-Fatigue, Higher Fatigue, and Pure Fatigue. The diagonal elements represent the true positive rates for each class, indicating classification accuracy per category. The model achieved the highest accuracy in identifying the Pure Non-Fatigue state with 94%, followed by Pure Fatigue at 85%. Both intermediate classes, Higher Non-Fatigue and Higher Fatigue, showed balanced but lower accuracies of 77% each. These results highlight the model’s strong performance in distinguishing between distinct fatigue levels, particularly at the extreme ends of the fatigue spectrum.
4.3.2. Internal + External Features
The inclusion of external features derived from demographic and occupational factors (EPC1, EPC2, EPC3, EPC4) alongside internal factors significantly improved classification performance across all models.
For binary classification, the four top-performing classifiers based on F1-weighted score were the NN, RF, XGBoost, and Gradient Boosting (Table 7). The NN achieved the highest test F1 score of 0.9375, with a 95% confidence interval between 0.930 and 0.953, using the ReLU activation function, a regularization strength of 0.0001, and two hidden layers with 100 and 50 neurons. The RF followed closely with an F1 score of 0.9294 and a 95% confidence interval of 0.920 to 0.950, tuned with a maximum tree depth of 10 and 100 estimators. XGBoost reached an F1 score of 0.9242, with a confidence interval from 0.921 to 0.948, using a learning rate of 0.1, a maximum depth of 5, and 200 estimators. Gradient Boosting also performed strongly, with an F1 score of 0.9163 and a confidence interval between 0.911 and 0.937, optimized with a learning rate of 0.1 and 200 boosting rounds.
Feature importance was examined for the tree-based models, Random Forest (RF) and XGBoost, to assess the relative impact of internal and external features. In both models, IPC2 was the most influential feature, with importance scores of 0.5922 for RF and 0.5517 for XGBoost. IPC1 followed with smaller yet significant contributions of 0.2062 and 0.1564, respectively. Among the external features, EPC1 and EPC2 showed moderate importance, ranging from approximately 0.0512 to 0.0793 across both models. Contextual variables such as Moment and Day contributed to a lesser extent but still had noticeable influence, with importance values varying between 0.0196 and 0.0921. These findings indicate that while the inclusion of external features enhanced overall classification performance, the internal components (particularly IPC2) remained the dominant factors guiding the models’ decisions.
For four-level classification, the top four models based on weighted F1 score were the NN, RF, XGBoost, and Gradient Boosting (Table 8). The NN achieved the highest F1 score of 0.8793, with a 95% confidence interval ranging from 0.847 to 0.880. This model was configured with a tanh activation function, a low regularization strength (alpha = 0.0001), and two hidden layers with 100 and 50 neurons. The Random Forest followed closely, with an F1 score of 0.8693 and the confidence interval ranging from 0.842 to 0.878, using a maximum depth of 10 and 200 estimators. XGBoost performed strongly as well, achieving an F1 score of 0.8620 and a confidence interval of 0.825 to 0.864, with a learning rate of 0.1, maximum depth of 5, and 200 boosting rounds. Gradient Boosting delivered an F1 score of 0.8530, with a confidence interval from 0.817 to 0.857, using the same learning rate and number of estimators as XGBoost.
Feature importance analysis for XGBoost and RF provided insights into the relative contribution of internal and external features in this multi-class task. In both models, IPC2 remained the most influential feature, with importance scores of 0.5580 for XGBoost and 0.5800 for RF. IPC1 showed a lower but still relevant contribution (0.1547 for XGBoost and 0.2140 for RF). Regarding external features, EPC1 and EPC2, along with contextual variables such as Moment and Day, showed moderate importance levels. Notably, XGBoost assigned slightly higher importance to Day (0.0843) and EPC2 (0.0828), suggesting that some external factors contributed meaningfully to model performance in the four-class fatigue classification.
Figure 4 shows the normalized confusion matrix for the four-level physical fatigue classification obtained using the NN model with both internal and external features. The matrix demonstrates improved classification accuracy across all fatigue states compared to the previous model that used only internal features. The model achieved its highest accuracy in identifying Pure Non-Fatigue instances at 96%, followed by Higher Non-Fatigue at 87%, Higher Fatigue at 82%, and Pure Fatigue at 88%. These results represent a notable improvement, especially for the intermediate fatigue states, where accuracy increased by approximately 10 percentage points compared to the internal-features-only confusion matrix. Another important improvement related to the real-time physical fatigue alert system is the enhanced reliability in detecting Pure Fatigue states. With internal features only, the model correctly identified Pure Fatigue 85% of the time; however, it misclassified 12% of instances as Higher Fatigue and 3% as Higher Non-Fatigue—the latter being a non-fatigue status, which could compromise alert effectiveness. In contrast, when external contextual information was included, Pure Fatigue was predicted correctly 88% of the time, with the remaining 12% predicted as Higher Fatigue—a misclassification still within the fatigue spectrum.
While accuracy is reported for the best-performing algorithm in each task, it should be interpreted with caution due to the imbalanced nature of the original dataset. In the binary classification task, the Neural Network achieved an accuracy of 91% using only internal features, which increased to 95.3% when both internal and external features were included. For the four-level classification task, overall accuracy reached 82.4% using XGBoost with internal features alone and improved to 87.9% when the Neural Network was used with the combined internal and external feature set.
5. Discussion
The integration of external features—specifically demographic and occupational factors (EPC1, EPC2, EPC3, EPC4)—alongside internal components significantly enhanced model performance in both binary and multi-class (four-level) fatigue classification tasks. These external variables provided additional contextual information that helped the models better capture individual differences in fatigue expression, ultimately leading to improved predictive performance and greater model stability, as evidenced by the narrower 95% confidence intervals. In almost all cases, the test F1 scores fell within or very close to the center of their respective intervals, indicating consistent and reliable model performance across resampled training sets. For instance, in the binary classification using only internal features, the Neural Network had an F1 score of 0.8848, but an interval ranging from 0.904 to 0.919, which did not fully contain the score. However, with the addition of external features, the F1 improved to 0.9375 and the interval to 0.930–0.953, showing both improved accuracy and reduced variability. In the binary classification task, the best-performing model, the Neural Network, improved its F1 score from 0.8848 (using only internal features) to 0.9375 when external features were included—an increase of over 5 percentage points. For the four-level classification task, the best model using only internal features was XGBoost, which achieved an F1 score of 0.8232. However, when external features were added, the Neural Network became the top performer with an F1 score of 0.8793, demonstrating a substantial performance gain of more than 5.6 percentage points. These results highlight the importance of integrating external factors into fatigue prediction models, as they not only enrich the data representation, improving generalization and interpretability in real-world industrial or occupational settings, but also significantly boost classification effectiveness, especially in more complex, multi-class scenarios.
Feature importance analysis revealed that among the internal components, IPC2—associated with motion-related metrics—was the most influential predictor across all models and classification tasks, followed by IPC1, which reflected physiological responses. Regarding external features, EPC1 and EPC2, along with contextual variables such as Moment and Day, showed moderate importance levels. These findings indicate that while the inclusion of external features enhanced overall classification performance, the internal components—particularly IPC2—remained the dominant factors guiding the models’ decisions. This improved feature representation translated directly into better classification outcomes, as evidenced by the confusion matrix results. Notably, classification accuracy for intermediate fatigue states (e.g., Higher Non-Fatigue and Higher Fatigue) increased by approximately 10 percentage points when external features were included. Furthermore, the system’s reliability in detecting Pure Fatigue states improved significantly: with internal features alone, 3% of Pure Fatigue instances were misclassified as Higher Non-Fatigue—a non-fatigue state that could result in a missed alert. In contrast, the model with combined features eliminated such misclassifications, classifying the remaining 12% as Higher Fatigue—still within the fatigue spectrum. This shift strengthens the effectiveness of the real-time fatigue alert system, reducing false negatives and improving the precision of safety interventions.
When compared to previous studies, our models achieve performance that is comparable to, and in some cases exceeds, existing fatigue classification approaches. Reported F1 scores in the literature vary depending on the number of fatigue levels modeled. For two-level (binary) classification, F1 scores typically range from 0.90 to 0.96 [28,32], with reported accuracies between 87.9% and 95.7% [29,30,31]. In our study, the Neural Network achieved an F1-weighted score of 0.9375 and an accuracy of 95.3%, placing it at the upper end of this range, and outperforming several methods that used only physiological or motion data. For three- and four-level classification, F1 scores in previous works range more widely, from 0.801 [26] to 0.935 [23], though the highest scores typically come from models using HRV without contextual information. Notably, our model achieved an F1-weighted score of 0.8793 in the four-level classification task, outperforming [25] (F1 = 0.8346), which also targeted four fatigue levels but relied only on plantar pressure and acceleration data. These results demonstrate that our integration of both internal physiological measures and external contextual features—including demographic and occupational data—not only achieves state-of-the-art performance but also improves interpretability and relevance for real-world industrial applications.
An additional strength of this study lies in the use of a fuzzy logic-based labeling method, originally developed in a controlled fitness setup [21,22], where monotonous and repetitive tasks were simulated—closely resembling those in the present case study. Although widely used, subjective tools such as the Borg-20 scale come with important limitations—especially in real-world industrial settings. Workers may unintentionally underreport or exaggerate their fatigue due to social pressures, fear of judgment, or simply not fully understanding the scale [39,40]. What’s more, how a person rates their effort can vary from one day to the next, even if their physical state hasn't changed much [41]. These methods also require workers to pause and report how they feel, which can disrupt their flow and affect the accuracy of the data. Another challenge is the lack of standardization—what feels like a "15 – hard" effort to one person might only be a "12 – moderate" to someone else [42]. By contrast, the fuzzy logic approach used in this study relies on physiological markers objectively linked to sympathetic nervous system activation and avoids these issues by enabling continuous, non-intrusive, and more replicable labeling.
6. Conclusions
In the context of Industry 5.0, where the human is placed at the center of system design and intelligent collaboration between humans and machines is emphasized, this study presents a foundational step toward the deployment of a real-time physical fatigue monitoring and alert system in industrial settings (Figure 5). By combining wearable biometric sensors (e.g., smartwatches) with contextual workplace data, the system can continuously assess an operator’s fatigue level and categorize it into one of four states: Pure Non-Fatigue, Higher Non-Fatigue, Higher Fatigue, and Pure Fatigue. To support immediate decision-making, the system can be configured to issue personalized alerts when workers reach higher fatigue levels (levels 3 and 4). For example, a worker in “Higher Fatigue” might receive a visual or haptic notification encouraging a brief recovery period, while a "Pure Fatigue" classification could automatically notify a supervisor, triggering further assessment or reassignment of duties. This type of closed-loop monitoring promotes safety, reduces the risk of injuries, and supports long-term worker health. Additionally, the fuzzy logic-based labeling method, adapted from a controlled setup, removes the need for subjective self-reports, offering a more objective and scalable solution. Crucially, adding contextual features not only improved classification performance but also reduced false negatives, especially in the critical Pure Fatigue state. With biometric data alone, some cases were misclassified as Higher Non-Fatigue, risking missed alerts. Including demographic and task-related variables ensured all misclassifications stayed within the fatigue spectrum, enhancing the system’s reliability and safety.
Future applications of this approach include extending its use to other sectors, such as heavy industry and high-demand operational settings, where physical fatigue is influenced not only by physiological and task-related factors but also by environmental conditions such as noise, temperature, or lighting. Although ambient factors like temperature, noise, and humidity weren’t included directly in our fatigue classification model, they were carefully monitored throughout the data collection process to ensure the environment stayed stable. That said, it’s worth recognizing that these conditions can still play a role in how fatigue develops. For example, working in excessive heat or constant noise has been shown to raise physiological stress and reduce focus or performance. In our case, all environmental readings remained well within the safety standards for pharmaceutical packaging facilities in Colombia, which helped limit their potential impact on the results. Still, in more variable or less controlled work environments, these factors could interact with both biometric signals and work conditions in meaningful ways—so they’re important to consider in future studies looking to expand the model’s reach. The model is well-suited to incorporate these additional variables, thanks to the use of Principal Component Analysis (PCA) in the preprocessing stage. PCA facilitates the integration of new features by identifying inter-correlations and minimizing redundancy, ensuring that the model remains efficient and interpretable even as the input space grows. This makes the approach highly adaptable for future, more comprehensive fatigue monitoring systems across diverse industrial environments. As future implementations generate larger and more diverse datasets across different industries, the opportunity to re-estimate and adapt the fuzzy logic-based labeling model will become more feasible. We acknowledge a current limitation in the direct transfer of fuzzy logic parameters, which were originally developed in a controlled fitness setting. Due to potential differences in data scale and distribution, these parameters may not perfectly align with those of new industrial datasets. To address this, we recommend that future applications include parameter re-calibration based on task-specific or sector-specific data. This will improve the adaptability and precision of the fuzzy classification approach, ensuring more accurate fatigue detection across diverse industrial domains.
Author Contributions
Conceptualization, C.A.M; methodology, C.A.M., H.S; software, C.A.M., H.S. and J.S.P.; validation, C.A.M., H.S. and J.S.P.; formal analysis, C.A.M., H.S. and J.S.P.; investigation, C.A.M; resources, M.D.; data curation, C.A.M., H.S. and J.S.P.; writing—original draft preparation, C.A.M; writing—review and editing, C.A.M., H.S., J.S.P.. and M.D.; visualization, J.S.P.; supervision, M.D. and J.S.P.; project administration, M.D; funding acquisition, M.D. All authors have read and agreed to the published version of the manuscript.
Funding
This work is funded by the CISC project, which is part of the grant H2020-MSCA-ITN-2020 grant agreement no. 955901.
Institutional Review Board Statement
The study was conducted in accordance with the Declaration of Helsinki and approved by the Ethics Committee of Universidad de América (Colombia) (protocol code 002-2024 June 2024).
Informed Consent Statement
Informed consent was obtained from all subjects involved in the study.
Data Availability Statement
The anonymized data files from the earlier study conducted in a fitness setup to simulate industrial tasks, which were used for fuzzy logic labeling, are available in the Zenodo repository: https://doi.org/10.5281/zenodo.13906740. Additionally, the anonymized dataset collected from the pharmaceutical case study, which was used for these classification models, is accessible at: https://doi.org/10.5281/zenodo.14891916.
Acknowledgments
The authors express their gratitude to Anyela Jineth Mateus and Catalina Nicholls from the pharmaceutical company and Monica Camargo Salinas and Nasli Yuceti Miranda Arandia from the Universidad de América for their invaluable support and collaboration throughout this research.
Conflicts of Interest
The authors declare no conflicts of interest.
Abbreviations
The following abbreviations are used in this manuscript:
| AI | Artificial Intelligence |
| BR | Breathing Rate |
| CDFs | Cumulative Distribution Functions |
| CFS | Chronic Fatigue Syndrome |
| CTS | Carpal Tunnel Syndrome |
| EDA | Electrodermal Activity |
| EPC1 | External Principal Component 1 |
| EPC2 | External Principal Component 2 |
| EPC3 | External Principal Component 3 |
| EPC4 | External Principal Component 4 |
| HR | Heart Rate |
| HRV | Heart Rate Variability |
| IMU | Inertial Measurement Unit |
| IoT | Internet of Things |
| IPC1 | Internal Principal Component 1 |
| IPC2 | Internal Principal Component 2 |
| KNN | K-Nearest Neighbors |
| ML | Machine Learning |
| MSDs | Musculoskeletal Disorders |
| NN | Neural Network |
| PCA | Principal Component Analysis |
| PDFs | Probability Density Functions |
| PCs | Principal Components |
| RF | Random Forest |
| RPE | Rating of Perceived Exertion |
| SVM | Support Vector Machine |
| SMOTE | Synthetic Minority Over-sampling Technique |
| SNS | Sympathetic Nervous System |
| Temp. | Temperature |
| XGBoost | eXtreme Gradient Boosting |
| 3D | Three-Dimensional |
| LightGBM | Light Gradient Boosting Machine |
References
- Ahmmed, M.S.; Isanaka, S.P.; Liou, F. Promoting Synergies to Improve Manufacturing Efficiency in Industrial Material Processing: A Systematic Review of Industry 4.0 and AI. Machines 2024, 12, 681. [CrossRef]
- Mital, A.; Pennathur, A. Advanced technologies and humans in manufacturing workplaces: An interdependent relationship. Int. J. Ind. Ergon. 2004, 33, 295–313.
- Trstenjak, M.; Benešova, A.; Opetuk, T.; Cajner, H. Human Factors and Ergonomics in Industry 5.0—A Systematic Literature Review. Appl. Sci. 2025, 15, 2123. [CrossRef]
- Breese, M. "The Effect of Human Factors and Leadership on Safety." Chem. Eng. Prog. 2024, 120, 44–49.
- Verma, D. "Industry 5.0: A Human-Centric and Sustainable Approach to Industrial Development." Int. J. Soc. Relevance Concern 2024, 12, 17–21.
- Ruiz-de-la-Torre-Acha, A.; Guevara-Ramirez, W.; Río-Belver, R.M.; Borregan-Alvarado, J. "Industry 5.0: The Road to Sustainability." In Towards a Smart, Resilient and Sustainable Industry; Springer: Cham, Switzerland, 2023; pp. 247–257.
- Panneerselvam, S.; Kumar, A.S.; Subramanian, C. "Physical Challenges in Assembly Line Production Systems from Ergonomics Point of View – Review." J. Ind. Mech. 2023, 8, 24–43.
- Sieber, W.; Chen, G.; Krueger, G.; Lincoln, J.; Menéndez, C.; O’Connor, M. Research Gaps and Needs for Preventing Worker Fatigue in the Transportation and Utilities Industries. Am. J. Ind. Med. 2022, 65(11), 857–866. [CrossRef]
- Parijat, P.; Lockhart, T.E. Effects of Lower Extremity Muscle Fatigue on the Outcomes of Slip-Induced Falls. Ergonomics 2009, 51(12), 1873–1884. [CrossRef]
- Fukuda, K. The Chronic Fatigue Syndrome: A Comprehensive Approach to Its Definition and Study. Ann. Intern. Med. 1994, 121(12), 953. [CrossRef]
- Andersen, J.H.; Haahr, J.P.; Frost, P. Risk Factors for More Severe Regional Musculoskeletal Symptoms: A Two-Year Prospective Study of a General Population. Arthritis Rheum. 2007, 56(4), 1355–1364.
- World Health Organization (WHO). Musculoskeletal Conditions. WHO Fact Sheets, 2023. Available online: https://www.who.int/news-room/fact-sheets/detail/musculoskeletal-conditions.
- Szabo, R.M. Carpal Tunnel Syndrome as a Repetitive Motion Disorder. Clin. Orthop. Relat. Res. 1998, 351, 78–89. [PMID: 9646750].
- Guzmán-Velasco, A.; Diago-Franco, J.L. Coexistence of Musculoskeletal Disorders in the Upper Body of Labor Origin. Duazary 2019, 16(2), 193–203. [CrossRef]
- Quiroga, S.; Largo, J.F.; Rodriguez, F.; Sánchez, V. Carpal Tunnel Syndrome Diagnosis and Prevention System. Universidad de los Andes, Bogotá, Colombia, 2022. Available online: https://repositorio.uniandes.edu.co/server/api/core/bitstreams/1f81ae44-9cf2-4954-9089-cff1fee3ff4d/content.
- Ferrerosa, B.; López, J.; Reyes, E.G.; Bravo, M. Painful Musculoskeletal Symptoms and Ergonomic Risk in Upper Limbs in Workers of a Cosmetics Company. Rev. Colomb. Salud Ocup. 2015, 5(3), 26–30. https://dialnet.unirioja.es/descarga/articulo/7890185.pdf.
- Bazazan, A.; Noman, Y.; Norouzi, H.; Maleki-Ghahfarokhi, A.; Sarbakhsh, P.; Dianat, I. Physical and Psychological Job Demands and Fatigue Experience Among Offshore Workers. Heliyon 2023, 9(6), e16178.
- Gawron, V. Overview of Self-Reported Measures of Fatigue. Int. J. Aviat. Psychol. 2016, 26(3–4), 120–131. [CrossRef]
- Valenza, G.; Citi, L.; Saul, J.P.; Barbieri, R. Measures of Sympathetic and Parasympathetic Autonomic Outflow from Heartbeat Dynamics. J. Appl. Physiol. 2018, 125(1), 19–39. [CrossRef]
- Moon, J.; Ju, B.-K. Wearable Sensors for Healthcare of Industrial Workers: A Scoping Review. Electronics 2024, 13, 3849. [CrossRef]
- Albarrán Morillo, C.; Demichela, M. A Data-Driven Framework to Model Physical Fatigue in Industrial Environments Using Wearable Technologies. Neuroergonomics and Cognitive Engineering 2023, 160–168. [CrossRef]
- Albarrán Morillo, C.; Demichela, M. Exploring the Impact of Repetitive Exercise on Physical Fatigue: A Study of Industrial Task Simulation in a Controlled Fitness Setting. Chem. Eng. Trans. 2023, 99, 167–172. [CrossRef]
- Anwer, S.; Li, H.; Umer, W.; Antwi-Afari, M. F.; Mehmood, I.; Yu, Y.; Haas, C.; Wong, A. Y. L. "Identification and Classification of Physical Fatigue in Construction Workers Using Linear and Nonlinear Heart Rate Variability Measurements." J. Constr. Eng. Manag. 2023, 149 (7). [CrossRef]
- Bustos, D.; Cardoso, F.; Rios, M.; Vaz, M.; Guedes, J.; Costa, J. T.; Baptista, J. S.; Fernandes, R. J. "Machine Learning Approach to Model Physical Fatigue during Incremental Exercise among Firefighters." Sensors 2022, 23 (1), 194. [CrossRef]
- Antwi-Afari, M. F.; Anwer, S.; Umer, W.; Mi, H.-Y.; Yu, Y.; Moon, S.; Hossain, Md. U. "Machine Learning-Based Identification and Classification of Physical Fatigue Levels: A Novel Method Based on a Wearable Insole Device." Int. J. Ind. Ergon. 2022, 93, 103404. [CrossRef]
- Ni, Z.; Sun, F.; Li, Y. "Heart Rate Variability-Based Subjective Physical Fatigue Assessment." Sensors 2022, 22 (9), 3199. [CrossRef]
- Marotta, L.; Buurke, J. H.; Van Beijnum, B.-J. F.; Reenalda, J. "Towards Machine Learning-Based Detection of Running-Induced Fatigue in Real-World Scenarios: Evaluation of IMU Sensor Configurations to Reduce Intrusiveness." Sensors 2021, 21 (10), 3451. [CrossRef]
- Nagahanumaiah, L.; Singh, S.; Heard, J. Diagnostic Human Fatigue Classification Using Wearable Sensors for Intelligent Systems. Proceedings of the 17th Annual System of Systems Engineering Conference (SOSE) 2022, 424–429.
- Lambay, A.; Liu, Y.; Ji, Z.; Morgan, P. Effects of Demographic Factors for Fatigue Detection in Manufacturing. IFAC-PapersOnLine 2022, 55(2), 528–533.
- Nasirzadeh, F.; Mir, M.; Hussain, S.; Darbandy, M.T.; Khosravi, A.; Nahavandi, S.; Aisbett, B. Physical Fatigue Detection Using Entropy Analysis of Heart Rate Signals. Sustainability 2020, 12.
- Sedighi Maman, Z.; Chen, Y.J.; Baghdadi, A.; Lombardo, S.; Cavuoto, L.A.; Megahed, F.M. A Data Analytic Framework for Physical Fatigue Management Using Wearable Sensors. Expert Syst. Appl. 2020, 155, 113405.
- Narteni, S.; Orani, V.; Cambiaso, E.; Rucco, M.; Mongelli, M. On the Intersection of Explainable and Reliable AI for Physical Fatigue Prediction. IEEE Access 2022, 10.
- Borg, G.A.V. Psychophysical bases of perceived exertion. Med. Sci. Sports Exerc. 1982, 14(5), 377–381. [CrossRef]
- Shi, H.; Albarrán Morillo, C.; Baldissone, G.; Demichela, M. The Design of the Principal Component Analysis (PCA)-Based Fuzzy Logic Classifier on Physical Fatigue in Process Industries. Chem. Eng. Trans. 2024, 111, 189–194. [CrossRef]
- Albarrán Morillo, C.; Shi, H.; Baldissone, G.; Demichela, M. Customizing a Weighted Scale for Precision in Fatigue Assessment within the Process Industry. Chem. Eng. Trans. 2024, 111, 193–198. [CrossRef]
- Mendel, J.M. Fuzzy Logic Systems for Engineering: A Tutorial. Proceedings of the IEEE, 1995, 83(3), 345–377.
- Albarrán Morillo, C.; Demichela, M.; Jawla, D.; Kelleher, J.D. Wearable Technology and Machine Learning for Assessing Physical Fatigue in Industry 4.0. Hum. Factors Wearable Technol. 2024, 141, 28–36. [CrossRef]
- Vaillant, A.G.; Sagrilo, L. On the Use of Dimension-Reduction Methods in Fatigue Analysis of Flexible Risers Subjected to Bimodal Seas. J. Offshore Mech. Arct. Eng. 2024, 147(3), 1–61. [CrossRef]
- Gawron, V. Overview of Self-Reported Measures of Fatigue. Int. J. Aviat. Psychol. 2016, 26, 120–131. [CrossRef]
- Bazazan, A.; Noman, Y.; Norouzi, H.; Maleki-Ghahfarokhi, A.; Sarbakhsh, P.; Dianat, I. Physical and Psychological Job Demands and Fatigue Experience Among Offshore Workers. Heliyon 2023, 9, e16178.
- Parijat, P.; Lockhart, T.E. Effects of Lower Extremity Muscle Fatigue on the Outcomes of Slip-Induced Falls. Ergonomics 2009, 51, 1873–1884. [CrossRef]
- Valenza, G.; Citi, L.; Saul, J.P.; Barbieri, R. Measures of Sympathetic and Parasympathetic Autonomic Outflow from Heartbeat Dynamics. J. Appl. Physiol. 2018, 125, 19–39. [CrossRef]
Figure 1.
Fuzzy logic-based labeling for binary classification. (a) Membership function for binary fatigue classification based on IPC1. (b) Histogram of physical fatigue label distribution for binary classification.
Figure 1.
Fuzzy logic-based labeling for binary classification. (a) Membership function for binary fatigue classification based on IPC1. (b) Histogram of physical fatigue label distribution for binary classification.
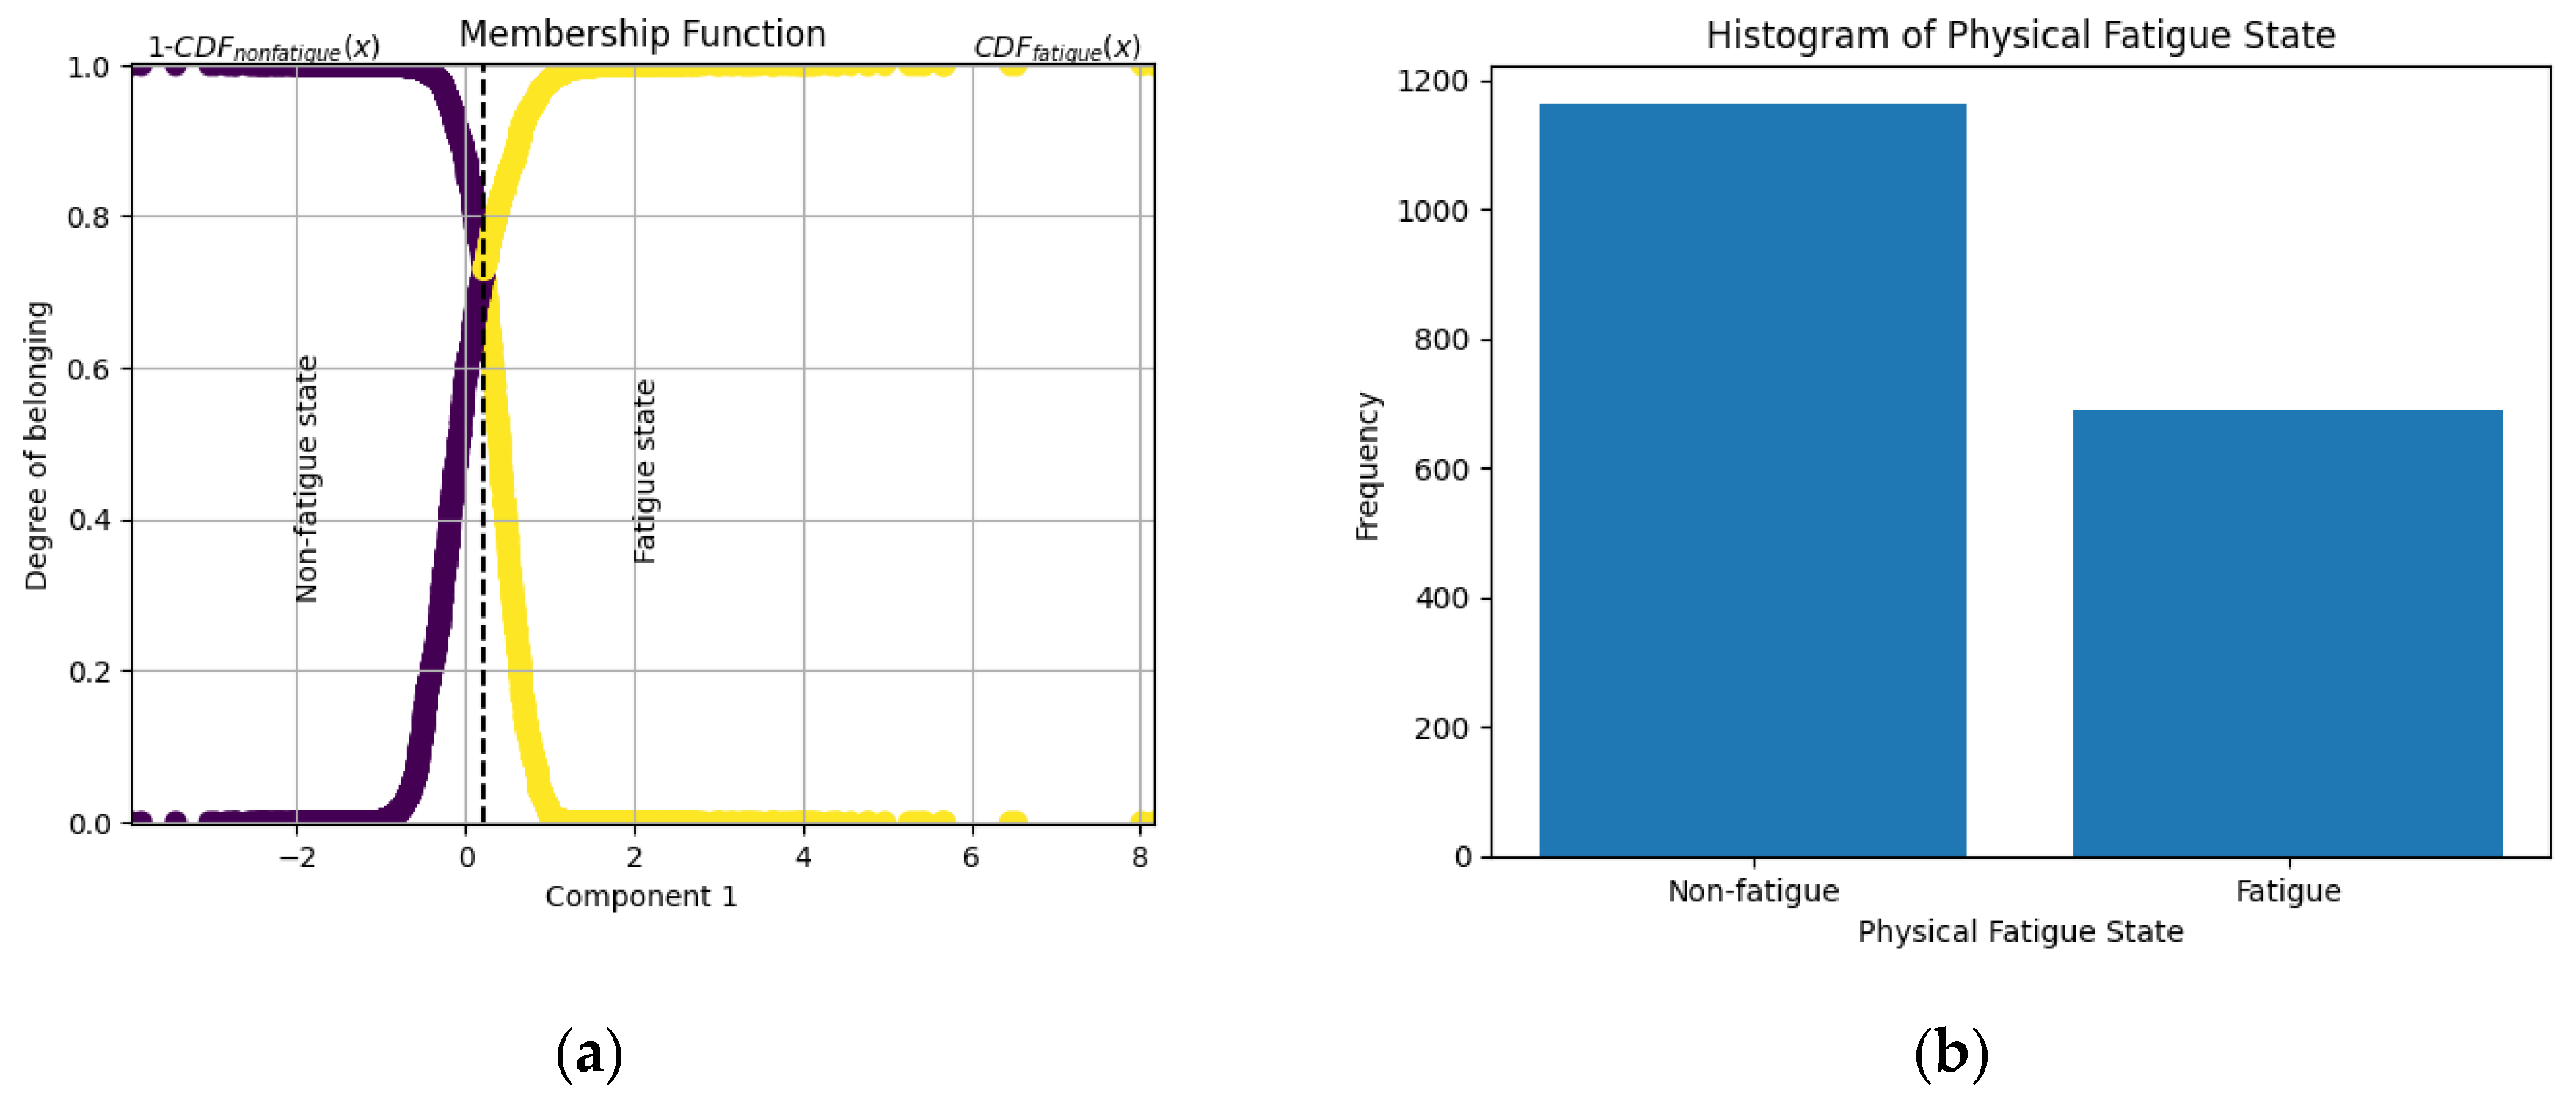
Figure 2.
Fuzzy logic-based labeling for four-level classification. (a) Membership function for four-level fatigue classification based on IPC1. (b) Histogram of physical fatigue label distribution for four-level classification.
Figure 2.
Fuzzy logic-based labeling for four-level classification. (a) Membership function for four-level fatigue classification based on IPC1. (b) Histogram of physical fatigue label distribution for four-level classification.
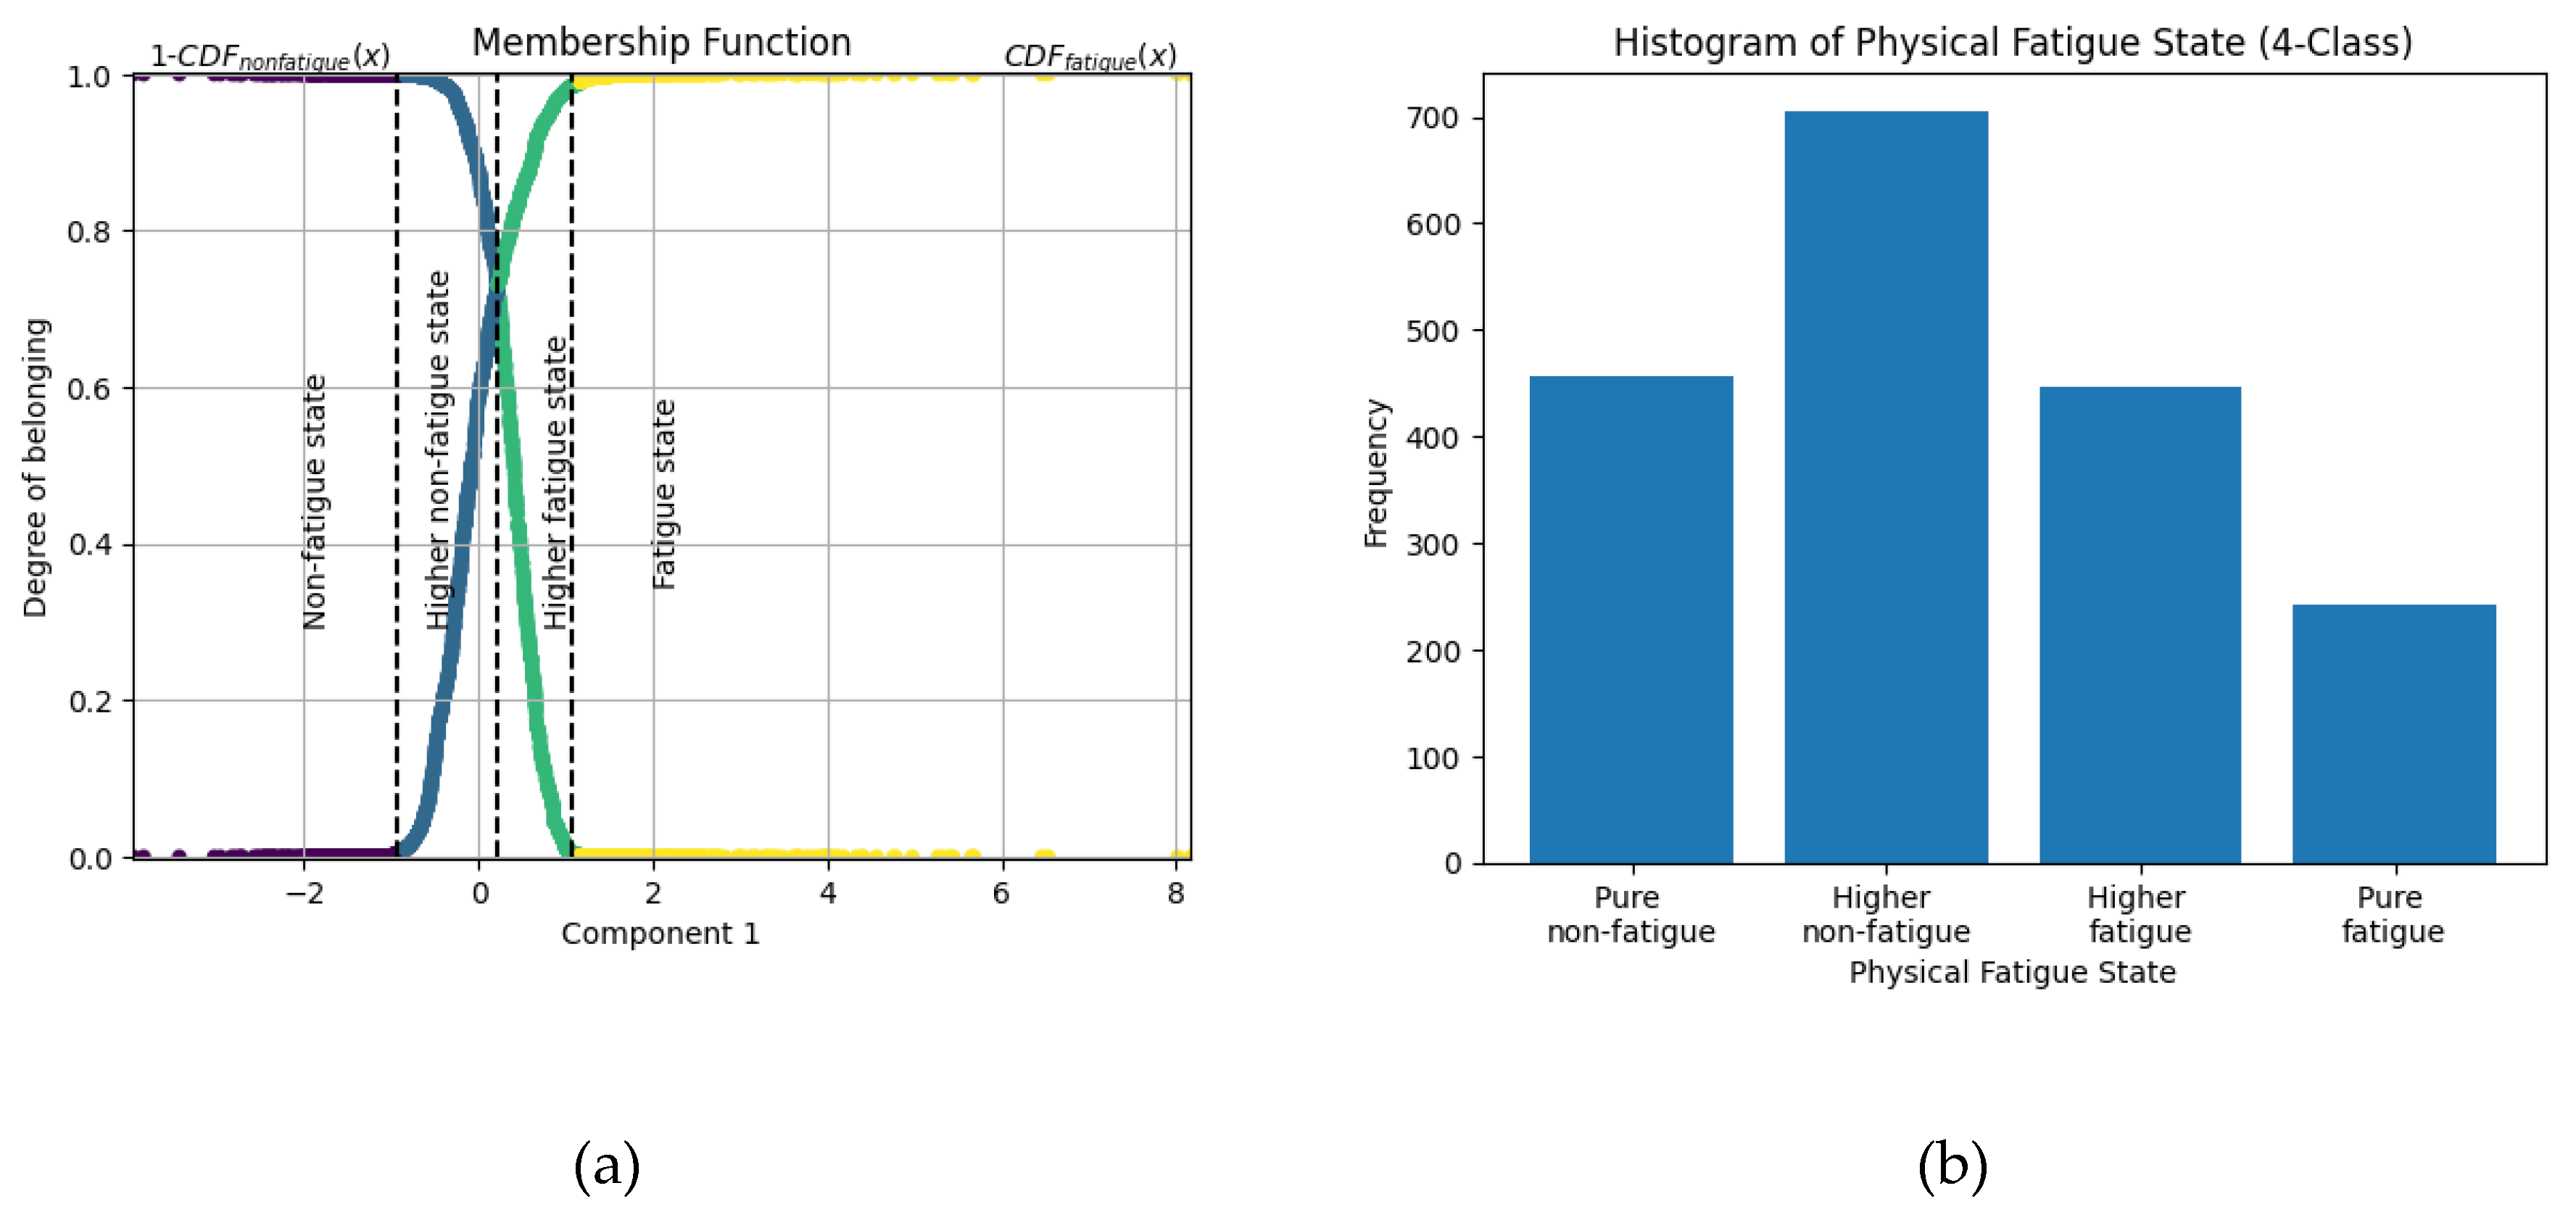
Figure 3.
Normalized confusion matrix for the four-level physical fatigue classification obtained for the XGBoost algorithm. Diagonal values indicate the proportion of correctly classified instances per fatigue state: Pure Non-Fatigue (0.94), Higher Non-Fatigue (0.77), Higher Fatigue (0.77), and Pure Fatigue (0.85).
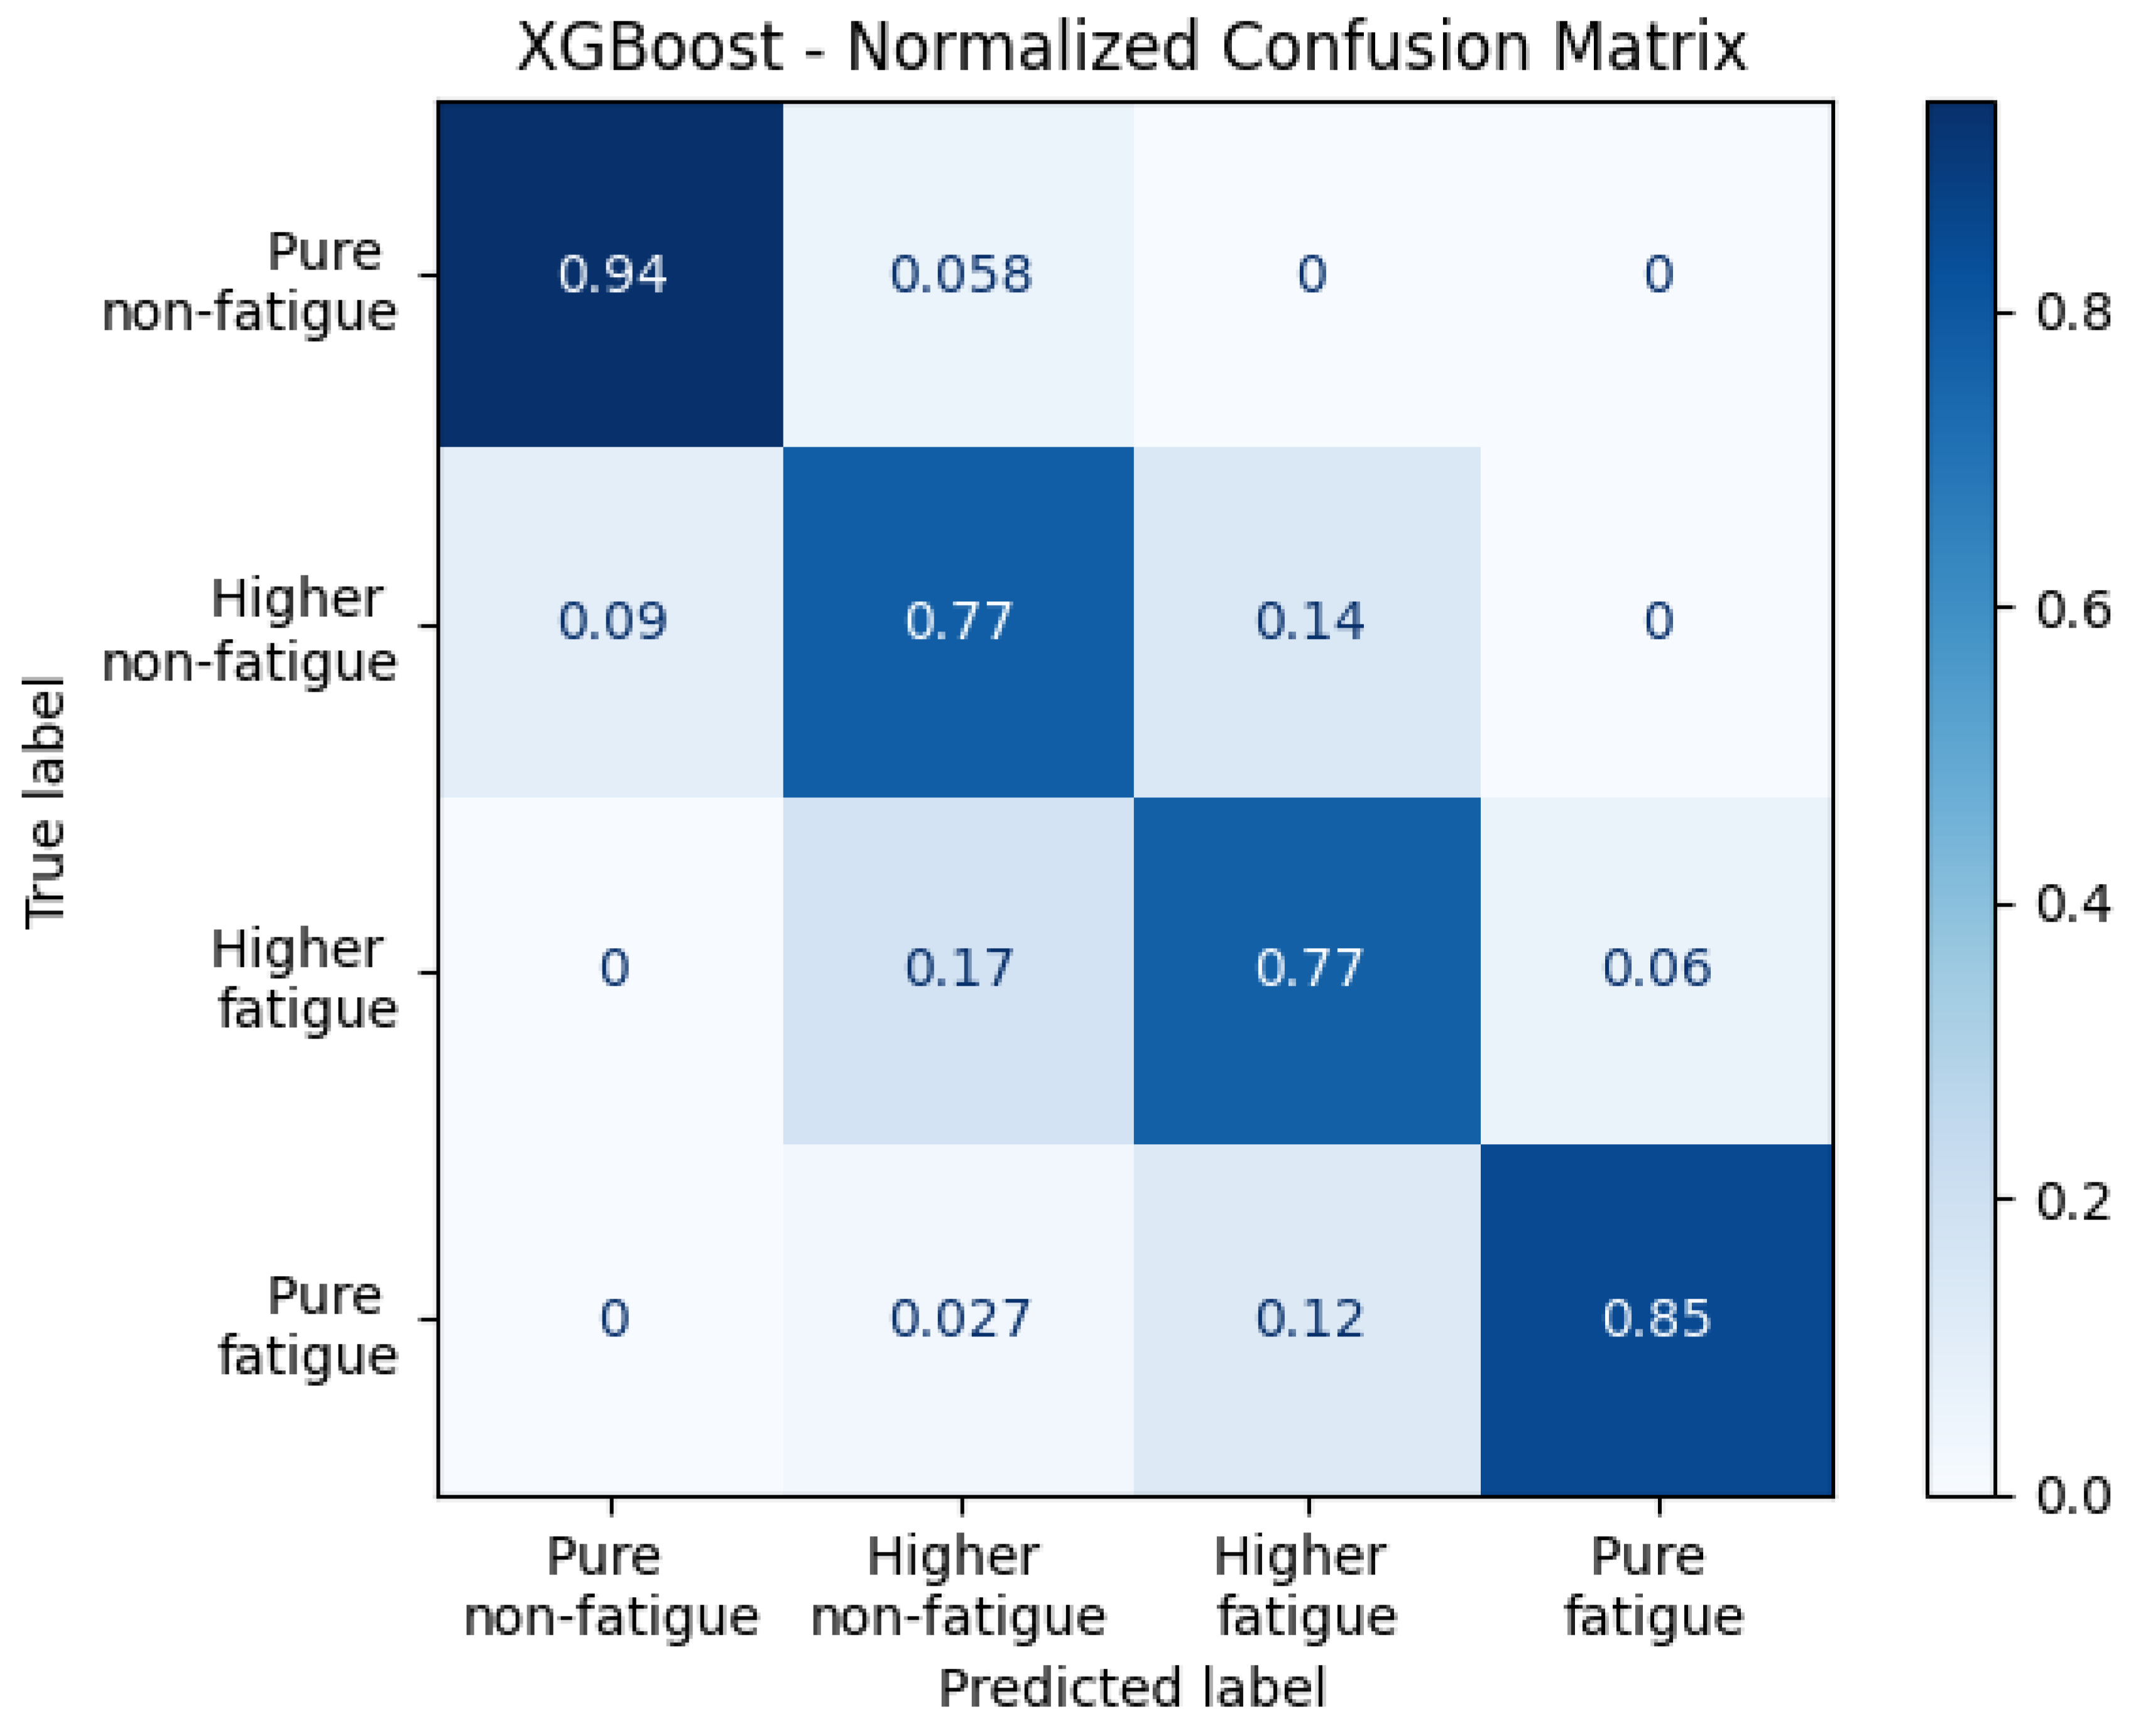
Figure 4.
Normalized confusion matrix for the four-level physical fatigue classification using a NN with combined internal and external features. Diagonal values indicate the proportion of correctly classified instances per fatigue state: Pure Non-Fatigue (0.96), Higher Non-Fatigue (0.87), Higher Fatigue (0.82), and Pure Fatigue (0.88). Classification accuracy improved across all classes compared to the internal-features-only model.

Figure 5.
Real-time physical fatigue monitoring and alert system.
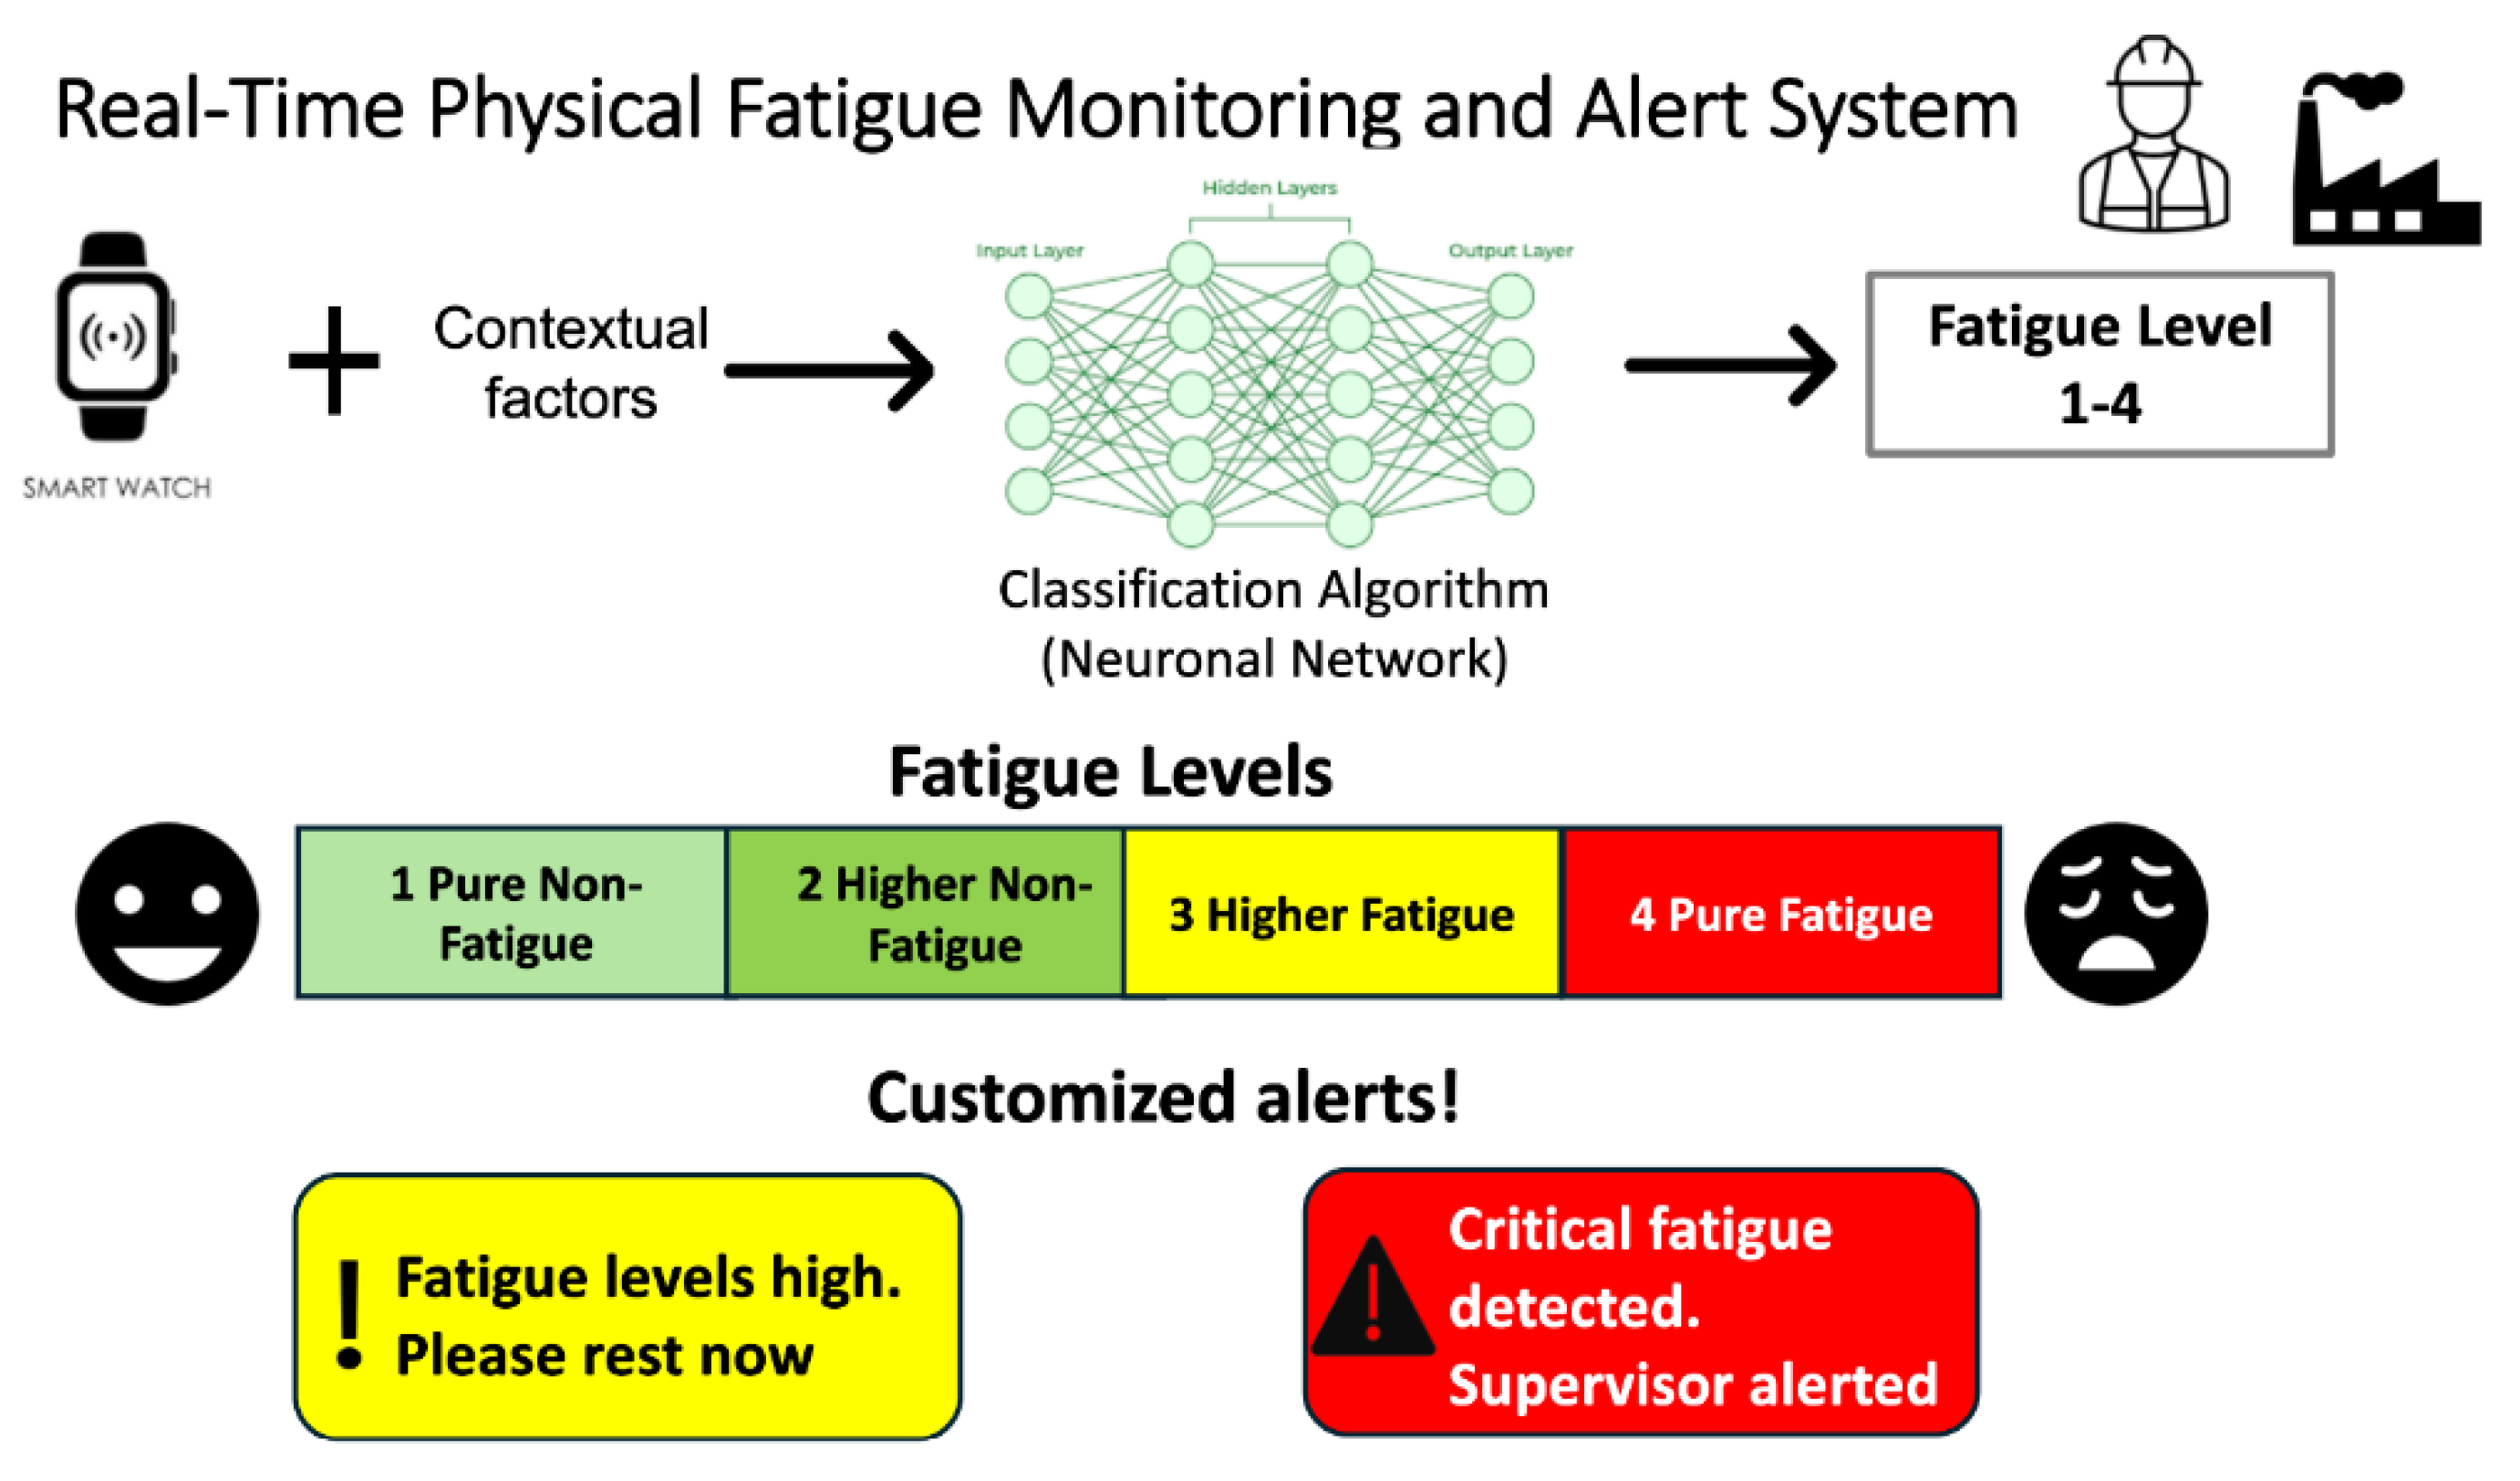

Table 1.
Overview of fatigue detection methods, algorithms, and performance.
| Study | Participants (n) | Metrics | Labeling Method | Fatigue levels | Best Algorithm | Performance |
| [23] | 15 | HRV | Borg-20 scale | 4 | RF | 0.935 F1 |
| [24] | 24 | HR, BR, temp., personal characteristics | Borg-20 scale | 4 | XGBoost | 0.88 F1 |
| [25] | 10 | Plantar pressure, 3-axis acceleration | Borg-20 scale | 4 | RF | 0.8346 F1 |
| [26] | 80 | HRV | Borg-20 scale | 3 | LightGBM | 0.801 F1 |
| [27] | 8 | Motion capture | Borg-20 scale | 3 | RF | 0.905 F1 |
| [28] | 22 | HRV | Borg-20 scale | 2 | SVM | 0.96 F1 |
| [29] | 14 | IMU and HR | Self-reported | 2 | RF | 95.7% accuracy |
| [30] | 8 | HR | Borg-20 scale |
2 | NN | 90.36% accuracy |
| [31] | 24 | IMUs and HR | Borg-20 scale | 2 | RF | 87.9% accuracy |
| [32] | 15 | IMUs and HR | Borg-20 scale | 2 | SVM NN |
0.90 F1 |
HRV - Heart Rate Variability, HR - Heart Rate, BR - Breathing Rate, Temp. - Temperature, IMU - Inertial Measurement Unit, 3D - Three-Dimensional, RF - Random Forest, NN - Neural Network, LightGBM - Light Gradient Boosting Machine, XGBoost - eXtreme Gradient Boosting, SVM- Support Vector Machine.
Table 2.
Principal component matrix with factor loadings for biometric data (internal factors).
| Variable | Principal | Component | |
| 1 | 2 | ||
| EDA | 0.703 | ||
| Pulse rate | 0.711 | ||
| Temperature | 0.505 | ||
| Accelerometer | 0.867 | ||
| Step count | 0.918 | ||
| Activity count | 0.863 |
Factor loadings with an absolute value <0.5 are not indicated in the table.
Table 3.
Principal component matrix with factor loadings for demographic and occupational data (external factors).
Table 3.
Principal component matrix with factor loadings for demographic and occupational data (external factors).
| Variable | Principal | Component | |||
| 1 | 2 | 3 | 4 | ||
| Moment | 0.997 | ||||
| Shift | 0.734 | ||||
| Production line | 0.929 | ||||
| Day | 0.968 | ||||
| Number of products | 0.811 | ||||
| Age | 0.955 | ||||
| Experience | 0.845 |
Factor loadings with an absolute value <0.5 are not indicated in the table.
Table 4.
Factor loading of each variable in the established fuzzy logic classifier.
| Variable | Factor Loading |
| Electrodermal activity | 0.456 |
| Pulse rate | 0.657 |
| Skin temperature | -0.212 |
| Accelerometer data | 0.833 |
| Step counts | 0.852 |
| Activity counts | 0.892 |
Table 5.
F1-weighted scores for binary fatigue classification using internal features.
| Algorithm | F1-weighted |
| NN | 0.8848 |
| SVM | 0.8798 |
| XGBoost | 0.8785 |
| Logistic Regression | 0.8782 |
Table 6.
F1-weighted scores for four-level fatigue classification using internal features.
| Algorithm | F1-Weighted |
| XGBoost | 0.8232 |
| NN | 0.8200 |
| RF | 0.8195 |
| Logistic Regression | 0.8179 |
Table 7.
F1-weighted scores for binary fatigue classification using external and internal features.
| Algorithm | F1-Weighted |
| NN | 0.9375 |
| RF | 0.9294 |
| XGBoost | 0.9242 |
| Gradient Boosting | 0.9163 |
Table 8.
F1-weighted scores for four-level fatigue classification using external and internal features.
Table 8.
F1-weighted scores for four-level fatigue classification using external and internal features.
| Algorithm | F1-weighted |
| NN | 0.8793 |
| RF | 0.8693 |
| XGBoost | 0.8620 |
| Gradient Boosting | 0.8530 |
Disclaimer/Publisher’s Note: The statements, opinions and data contained in all publications are solely those of the individual author(s) and contributor(s) and not of MDPI and/or the editor(s). MDPI and/or the editor(s) disclaim responsibility for any injury to people or property resulting from any ideas, methods, instructions or products referred to in the content. |
© 2025 by the authors. Licensee MDPI, Basel, Switzerland. This article is an open access article distributed under the terms and conditions of the Creative Commons Attribution (CC BY) license (http://creativecommons.org/licenses/by/4.0/).
Copyright: This open access article is published under a Creative Commons CC BY 4.0 license, which permit the free download, distribution, and reuse, provided that the author and preprint are cited in any reuse.


