
Submitted:
31 July 2025
Posted:
01 August 2025
You are already at the latest version
Abstract
Organophosphorus pesticides (OPs) pose significant environmental and health risks due to their widespread use and toxicity, primarily by inhibiting acetylcholinesterase. Traditional detections are often slow and costly, highlighting the urgent need for advanced, sensitive, and accessible technologies. This study developed a highly sensitive electrochemical cholinesterase inhibiting biosensor for OP pesticides, utilizing Ti3C2TX MXene Quantum Dots (MQDs), which was synthesized via a hydrothermal method. The biosensor's performance was characterized using electrochemical impedance spectroscopy, differential pulse voltammetry (DPV), and cyclic voltammetry. DPV proved to be the optimal technique, exhibiting an ultralow detection limit of 1×1E−17 M and a wide linear range (1E−14−1E−8 M) for chlorpyrifos (a model OP). The biosensor demonstrated high selectivity for OPs (chlorpyrifos, acephate, glyphosate) over a non-target pyrethroid (permethrin), confirmed by distinct electrochemical signatures and compared to in vitro cholinergic activity assays in bean beetle homogenates. The enhanced performance is attributed to the high surface-to-volume ratio, quantum confinement effects, and superior conductivity of the MQDs, as well as the robust enzyme immobilization facilitated by glutaraldehyde cross-linking and a chitosan matrix. This work presents a promising platform for rapid, sensitive, and selective detection of OP pesticides, with potential applications in environmental monitoring and public health protection.

Keywords:
Ti3C2Tx MXene
; electrochemical biosensor
; quantum dots
; cholinesterase inhibitor
; organophosphorus pesticides
1. Introduction
Organophosphorus pesticides (OPs) are extensively used globally in agriculture and various other sectors, posing significant environmental and health risks due to their widespread presence and inherent toxicity to both non-target organisms and humans [1,2]. These compounds exert harmful effects primarily by inhibiting acetylcholinesterase (AChE), an enzyme crucial for nervous system function, leading to an excessive accumulation of acetylcholine and subsequent neurological overstimulation. This disruption can manifest in acute symptoms ranging from neurological impairments to respiratory failure and even death, with chronic low-level exposure also raising concerns for long-term health. Timely intervention and proactive monitoring are critical to prevent irreversible neurological damage, respiratory failure, and death, while also reducing the global public health burden of these exposures [3,4,5]. Conventional laboratory methods, such as High-Performance Liquid Chromatography (HPLC) or Gas Chromatography (GC) coupled with Mass Spectrometry (MS), are widely recognized for their high accuracy and specificity in pesticide detection. However, these established techniques often come with considerable operational costs, demand extensive and time-consuming sample preparation, complex for rapid, on-site detection, and necessitate the expertise of highly skilled personnel[6,7,8]. Biosensors offer a complementary approach to conventional laboratory-based techniques by simplifying or eliminating complex sample preparation steps, thereby addressing some of the inherent limitations of traditional methods[6,9,10,11]. This underscores an urgent imperative for developing advanced, sensitive, and accessible detection technologies to effectively manage these widespread contaminants and protect public health and the environment[12,13,14,15].
Electrochemical biosensors present a highly promising alternative to conventional analytical methods for pesticide detection, offering significant advantages such as cost-effectiveness, portability, rapid response times, and minimal sample preparation, making them ideal for on-site and in-situ applications[6,7,16,17]. For cholinesterase inhibitor pesticides, the primary detection mechanism relies on enzyme inhibition, where AChE biosensors quantify the degree of enzyme inhibition, which directly correlates with pesticide concentration. While biosensor technology faces challenges such as matrix interference and surface fouling, the integration of advanced nanomaterials, including carbon nanotubes, gold nanoparticles, and quantum dots, has revolutionized their performance, substantially improving sensitivity, selectivity, stability, and suitability for real-world analysis[18,19,20].
MXenes, an emerging class of two-dimensional transition metal carbides, nitrides, and carbonitrides, are particularly promising for developing high-sensitivity, high-stability, and multifunctional biosensors due to their unique layered structure and outstanding electrochemical properties[21,22,23,24,25,26,27,28]. Among these, Ti3C2Tx MXenes derived from MAX phases through selective etching stand out as the most extensively studied, exhibiting exceptional electrical conductivity, a large specific surface area, and tunable surface functional groups (e.g., -O, -F, -OH). The high conductivity accelerates electron transfer kinetics, the expansive surface area enables high-density bioreceptor immobilization, and the tunable functional groups allow precise bio-conjugation, making them ideal as immobilization matrices for enzymes[26,29,30,31].
Notably, Ti3C2Tx MXene quantum dots (MQDs) inherit and enhance these advantages through powerful quantum confinement effects, exhibiting unparalleled surface-to-volume ratios, abundant active edge atoms, superior photostability, biocompatibility, and dispersibility, making them ideal for biosensing[32,33,34]. This atomic-level tunability, combined with rapid electron transfer, positions MXenes and MQDs as transformative materials for next-generation biosensors, overcoming the limitations of conventional nanomaterials in sensitivity, selectivity, and functionalization, pushing the detection limits beyond traditional materials[33,35].
In this work, Ti3C2TX MQDs were synthesized by a hydrothermal method and characterized by atomic force microscopy (AFM), scanning electron microscopy (SEM), X-ray diffraction (XRD), UV-Vis absorption and photoluminescence. An electrochemical cholinesterase inhibiting biosensor was developed based on the synthesized Ti3C2TX MQDs for detection of OP pesticides. The sensor performance was validated by electrochemical impedance spectroscopy (EIS), differential pulse voltammetry (DPV), and cyclic voltammetry (CV). We demonstrated enhanced performance of the MQD-based biosensor to monitor cholinergic activity of chlorpyrifos, acephate, and glyphosate over a non-target pyrethroid (permethrin), compared with cholinergic activity assays in bean beetle homogenates. This biosensor was expected to provide rapid, highly sensitive detection for these widespread contaminants and to protect public health and the environment.
2. Materials and Methods
2.1. Chemicals and Reagents
AChE from electrophorus electricus (500 units), acetylthiocholine iodide (ACTI), chitosan (CS), 50% glutaraldehyde (GA), chlorpyrifos (CPS), acephate (ACE), glyphosate (GLY), permethrin (PERM), 5,5′-Dithiobis(2-nitrobenzoic acid) (DTNB), bovine serum albumin (BSA), titanium aluminum carbide MAX phase, sodium hydroxide (NaOH), and glacial acetic acid (HAc) were obtained from Sigma-Aldrich (St. Louis, MO, USA). All other chemicals, including lithium fluoride (LiF, ≥99.98% purity), hydrochloric acid (HCl, 37%, ACS reagent grade), dibasic sodium phosphate (Na2HPO4), monobasic sodium phosphate (NaH2PO4), and all the solvents were purchased from Fisher Scientific.
2.2. Characterization
The synthesized MXene sheets and MQDs were thoroughly characterized using a range of analytical techniques. XRD was conducted on a Rigaku diffractometer Miniflex 600 X-ray diffractometer (Rigaku Corporation, Tokyo, JP) equipped with a Cu Kα line (λ =1.540 Å) radiation source (40 kV, 15 mA), scanning over a 2θ range of 5° to 60° at a scan rate of 1°/min and a step size of 0.02°.
SEM images were acquired using a JEOL Field Emission SEM (FESEM) (JEOL, MA, USA) operated at 20 kV. A magnification of 3500× was used to investigate the surface morphology of the samples.
Topographic images of tapping mode AFM were taken using a Keysight 5500 Atomic Force Microscope (Keysight Technologies, Inc., Colorado Springs, CO, USA) with a resolution of 512 points×512 lines and a scanning rate of 1 line/s. A Bruker’s Sharp Nitride Lever probe, SNL-10, with a normal frequency 65 kHz and a normal spring constant of 0.35 N/m was used in the scanning (Bruker AFM Probes, Camarillo, CA, USA).The data were processed using the Gwyddion 2.56 software to extract the topographical features and analyze the distributions of the grain characteristics.
UV-Vis absorption and photoluminescence (emission) spectra were recorded using a Horiba Duetta UV-Vis spectrometer (HORIBA Instruments, NJ, USA). Measurements were carried out in a quartz cuvette over the wavelength range of 300-750 nm under ambient conditions. Baseline correction was performed using deionized (DI) water as the blank solvent, and all spectra were acquired with appropriate resolution and integration time settings.
Time-resolved photoluminescence (PL) measurements of Ti3C2Tx MQDs were carried out using a LifeSpec II, F980 spectrometer (Edinburgh Instruments Ltd., Livingston, UK), equipped with a 400 nm diode laser excitation source (pulse width: 500 ns, repetition rate: 1 MHz). The average PL lifetimes were extracted by fitting the decay curves using a multi-exponential model with tail fitting, employing a nonlinear least-squares fitting algorithm.
2.3. Electrochemical Measurement
The electrochemical system and electrodes were obtained from CH Instruments, TX, USA: EIS, DPV, and CV measurements were performed by CHI 760E Electrochemical Workstation with three-electrodes system: The biosensor was built on CHI104 3 mm diameter Glassy Carbon electrode was used as the working electrode, CHI 111 saturated Ag/AgCl as the reference electrode, and CHI115 Platinum Wire as the counter electrode.
EIS was performed by the following parameters: Technique, IMP-AC Impedance. Initial potential, 0.5 V. Frequency, 1-100,000 Hz. Amplitude, 5mV. The obtained Nyquist plots were fitted by EIS Spectrum Analyser to estimate the correct charge-transfer resistance.
DPV was performed by the following parameters: Initial potential, -0.2 V. Final potential, 1 V. Potential Increment, 4 mV. Amplitude, 50 mV. Pulse width, 50 ms. Pulse Period, 500 ms. Pulse width, 50 ms.
CV was performed by the following parameters: Initial potential, -0.2 V. Final Potential, 1 V. San Rate, 25 mV/s.
2.4. Preparation of Solutions
LiF/HCl etching solution: In a polyethylene container, 1.6 g LiF was added to 20 mL of 9 M HCl in polyethylene container (resistant to HF corrosion). The mixture was stirred continuously at 40°C for 30 minutes under nitrogen purge until LiF fully dissolved.
Phosphate-buffered saline (PBS, pH ~7.4): (a). Dissolve 27.6 g NaH₂PO₄·H₂O in 1 L distilled water to prepare Solution A (0.2 M NaH₂PO₄). (b). Dissolve 53.65 g Na₂HPO₄·7H₂O in 1 L distilled water to prepare Solution B (0.2 M Na₂HPO₄). (c). Mix 195 mL Solution A and 805 mL Solution B, adding 8.5 g NaCl to prepare 0.1 M PBS (pH ~7.4). (d). Adjust the pH to 7.4 with a 1 M NaOH solution. (e). Adjust the final volume to 1 L with distilled water. PBS was further used as the supporting electrolyte in the measurement of electrochemical biosensor characterization.
HAc solution (1%): HAc solution (1%) was prepared by water-diluting glacial acetic acid, which was obtained from Sigma-Aldrich.
AChE solution: AChE from Electrophorus electricus (500 units) was defrosted in an ice bath over a 30-minute interval, and the entire 30 μL sample was diluted in 1 mL of the PBS buffer. The prepared solution was stored in refrigerator at 2-8 °C up to 1 week.
BSA solution: BSA purified 10% solution was diluted 10 times with PBS. The 1% BSA was used to stabilize AChE during reactions, enhancing signals of the prepared biosensor. BSA solution. A 1% BSA solution should be stored at 2-8 °C in refrigerator to best preserve its stability and prevent microbiological activity. The solution should be kept in a tightly closed container and protected from light. Before use, check that the solution is clear and free of particulates or flocculent material; any color change or cloudiness may indicate deterioration.
CS solution (0.2% w/v, pH 6.0): A 0.2% CS solution was meticulously prepared by combining 0.2 g of dry powdered CS with 100 mL of a 1% acetic acid solution. The 1% acetic acid solution was developed by diluting 1 mL of glacial acetic acid to a final volume of 100 mL in a volumetric flask. CS solution was stored in tightly closed containers between 2-8 °C in refrigerator. For best results, always protect the solution from light and avoid repeated freeze-thaw cycles.
GA solution (2.5%): Freshly prepare 2.5 % GA solution by mixing 1 mL of 50% GA with 19 mL of PBS buffer to prepare for the enzyme cross-linking and immobilization.
Preparation of OPs and the control solutions:1mM stock solutions of the selected OPs (CPS, ACE, GLY) and the control, PERM, were first prepared in ethanol. Working solutions of different concentrations were diluted from the stock solutions with PBS solutions. Ensure the final concentration ethanol in the assay does not exceed 0.01% to avoid interference with AChE activity. All the solutions should be protected from light and stored at -20°C until use to prevent degradation.
2.5. Synthesis of Ti3C2TX MXene 2D Sheets and MQDs
Ti3C2TX MXene 2D Sheets: The LiF/HCl etching method was employed to synthesize Ti3C2TX MXene 2D sheets [36,37]. Specifically, 2.9 g of LiF powder was dissolved in 100 mL of HCl in a Nalgene wide-mouth bottle. This mixture was placed in an oil bath to maintain a uniform temperature. After allowing the etchant solution to stabilize for 10 minutes, 1 g of Ti3AlC2 MAX phase was slowly added to the solution. The temperature was then raised to 70 °C, and the reaction was allowed to proceed for 7 days. Following etching, the temperature was reduced, and the mixture was subjected to sequential washing initially with HCl, followed by deionized (DI) water until the pH of the supernatant reached approximately 6. The resulting material was then dried in an oven at 60 °C for 24 hours. The dried Ti3C2TX MXene powder was subsequently used for the synthesis of Ti3C2TX MQDs.
MQDs: A hydrothermal method was employed for the synthesis of QDs[38,39]. Exfoliated Ti3C2TX MXene 2D sheets were first dispersed in 10 mL of deionized (DI) water. Ammonia was then added dropwise while continuously monitoring the pH until it reached 10. The resulting dispersion was transferred into a Teflon-lined stainless-steel autoclave and heated at 100 °C for 6 hours in an oven. After the hydrothermal treatment, the product was allowed to cool to room temperature. The resulting suspension was centrifuged, and the supernatant, which appeared yellowish, was carefully decanted. This solution was further purified via vacuum filtration using a membrane filter with a pore size of 0.02 µm. The filtered QD solution was then characterized and subsequently used in the fabrication of an electrochemical biosensor.
2.6. Preparation of Ti3C2TX MQD-Based Electrochemical Biosensor
2.6.1. GCE Pretreatment
GCE Cleaning: To ensure the GCE is free of contaminants, the GCE was first rinsed thoroughly with distilled water, followed by methanol, then the electrode was gently wiped dry with a clean, lint-free lab tissue.
Polishing the GCE: A nylon polishing pad was placed onto a flat glass plate. The pad was moistened with distilled water. 0.3 µm alumina suspension was then dropped onto the wet pad. The GCE was placed face down on the pad and polished using a figure-eight motion for 2 minutes. Gentle but consistent pressure was applied to avoid damaging the electrode surface. During this process, the GCE was rotated 90° periodically to ensure even wear across the surface. A mirror-like surface was achieved after this polishing was finished. To remove all remaining particles, a final cleaning and drying was processed after polishing: The electrode was sonicated in distilled water, methanol, or acetone for up to 5 minutes, then rinsed again and allowed the air dry at room temperature.
Electrochemical Activation: CV scan in 0.1 M H2SO4 was performed by scanning the potential between -0.5 V and +1.5 V at a rate of 100 mV/s for 20 cycles. This process generated oxygen-containing surface functional groups (OxSFGs) on the GCE, which can enhance adsorption and electron transfer. After the activation, the electrode was rinsed with DI water and dried under nitrogen.
Important Precautions: The pretreated GCE surface should not be touched with hands or sharp objects. Overheating or excessive pressure should be avoided during polishing, as this may damage the electrode.
2.6.2. Ti3C2TX MQD-Based Electrochemical Biosensor Prepared on the Electrochemical activated GCE surface
MQD Anchoring on GCE: MQD was mixed with CS solution (0.2% w/v, pH 6.0) to create a composite suspension. Drop-cast the metal oxide-CS composite onto the freshly activated GCE surface and allow it to dry at room temperature.
Immobilization of AChE: AChE was immobilized on the MQD-anchored GC surface by following steps: (a). AChE solution was mixed with BSA (AChE 15 mg/mL, BSA, 0.9%), which was used as a stabilizer and spacer molecule. (b). AChE/BSA was mixed with freshly prepared GA in 2:1 to facilitate crosslinking and immobilization onto the MQDs surface. (c). Drop-cast the AChE/BSA/GA solution onto the MQDs-anchored GCE surface and incubate for 2 hours to allow immobilization. (d). Rinse the electrode gently with PBS to remove unbound enzyme. F. Store the prepared biosensor at 4°C when not in use.
3. Results and Discussion
3.1. Mechanism of Ti3C2TX MQDs-Based Electrochemical Cholinesterase Inhibiting Biosensor for OP Pesticides
Figure 1 illustrates the comprehensive mechanism of the MQDs-based electrochemical AChE biosensor designed for the detection of OP pesticides. The fabrication of this biosensor involves a precise sequence of steps. First, GCE surface was meticulously cleaned and then electrochemically activated. This activation process enhanced the electrode’s surface area and improved electron transfer kinetics, creating an optimal foundation for subsequent modifications.
Next, MQDs were anchored onto the electrochemically activated GCE surface using CS. CS, a biocompatible biopolymer, acts as a stable matrix, facilitating the uniform dispersion and robust immobilization of the MQDs, which are crucial for enhancing electron transfer and signal amplification, and especially, preventing the peeling of MQDs from the sensor surface directly ensures the long-term stability and reliable performance of the prepared biosensor[40].
Then, AChE and BSA were co-crosslinked onto the MQDs-modified surface using GA. This crosslinking created a stable, three-dimensional network that firmly entrapped the AChE enzyme, preventing its leaching and preserving its catalytic activity, while BSA provided a protective and biocompatible microenvironment[41].
Finally, the detection mechanism relies on the catalytic activity of the immobilized AChE. In the absence of OP, AChE efficiently hydrolyzed ACTI into electroactive thiocholine (TCI). The resulting TCI produced a strong electrochemical signal, measured by DPV, EIS or CV. When the biosensor was exposed to OPs, these compounds inhibited the activity of AChE. This inhibition led to a reduced production of TCI, which in turn caused a quantifiable decrease in the DPV signal, allowing for the sensitive and precise determination of pesticide concentration.
3.2. Synthesis and Characterization of Ti₃C₂TX MXene and Ti₃C₂TX MQDs
Figure 2a provides a schematic overview of the preparation process for Ti3C2TX MXene and Ti3C2TX MQDs. We began with the Ti₃AlC₂ MAX phase, which was etched using the LiF/HCl method to synthesize Ti3C2Tx MXene. The resulting MXene was first characterized by XRD, as shown in Figure 2b. The XRD pattern displays a distinct peak near 9°, indicating successful etching of the MAX phase. Additionally, the SEM image (Figure 2c) reveals a layered sheet-like structure, further confirming the formation of MXene sheets. These sheets were then exfoliated and processed to prepare MQDs. The topography image of AFM in Figure 2d displayed the nanoscale dimensions of the particles (height: 1.1–10.8 nm; mean: 6.4 nm), following into the QD range. This was further confirmed by the inset line profile of the produced MQDs which are below 10 nm, validating the successful formation of MQDs. Optical properties, UV-Vis absorbance and PL emission spectra were recorded. Figure 2e reveals that the MQDs have absorbance in the range of 300 to 450 nm and emission between 350-650 nm. Figure 2f presents the PL decay profile of MQDs solution which fits a biexponential model with lifetimes τ1= 1.98 ns and τ2= 8.37 ns and corresponding amplitudes A1 = 735 and A2 = 259, respectively. The calculated average lifetime (τavg) is approximately 5.8 ns. The τ1 with higher amplitude dominant radiative recombination of excitons or shallow trap states, while the slower component τ2 is attributed to trap-assisted recombination via defects or functional groups[42].
3.3. Analytical Performance of Electrochemical Cholinesterase Inhibiting Biosensor for OP Pesticides
The integration of MQDs with AChE yielded a highly sensitive electrochemical biosensor for OP detection. A widely used OP insecticide, CPS, was tested as the model inhibitor for the following reasons: First, its significant health and environmental impact, including neurotoxicity and genotoxicity, underscores the critical need for effective detection methods, making it a highly relevant target for study[43,44]. Second, its extensive global application in agriculture and pest control, leading to its frequent presence as an environmental contaminant[45]. Especially, the chemical structure of CPS is representative of the phosphorothioate class of OP insecticides, and it is a potent AChE inhibitor, binding to and phosphorylating the enzyme, which forms the core detection principle for these biosensors. After the biosensor was exposed to CPS for 10 min, the inhibition to AChE caused the dramatic increase of the charge transfer resistance in EIS, decrease of the anodic peak of TCI in DPV and CV, and decrease of cathodic peak in CV, compared to that without pesticide inhibition. The biosensor was thus characterized using EIS, DPV, and CV, with each technique providing complementary insights into the detection mechanism, sensitivity, and stability (Figure 3).
3.3.1. EIS Analysis
Figure 3a presents Nyquist plots illustrating the EIS response of the AChE-based biosensor upon exposure to varying concentrations of CPS. Each curve consists of a semicircular portion followed by a linear segment. The diameter of the semicircle, corresponding to the charge transfer resistance (Rct), increases progressively with rising CPS concentrations. This indicates that as more CPS molecules inhibit AChE activity on the electrode surface, the electron transfer becomes increasingly hindered, resulting in higher impedance. The curves demonstrate clear separation, confirming that the biosensor responds sensitively and discriminatively to different CPS concentrations, with larger semicircles reflecting greater inhibition.
Interestingly, the EIS results show a pronounced difference between the blank sample (0 M OPs) and all other CPS concentrations, highlighted by the smallest semicircle in the Nyquist plot for the blank. This significant change indicates that, in the absence of CPS compounds, the AChE enzyme retains full catalytic activity, facilitating rapid electron transfer between the electroactive species and the electrode surface. As soon as CPS are introduced, even at very low concentrations, they inhibit AChE by phosphorylating the active site serine residue, dramatically reducing enzymatic activity. This inhibition impairs the hydrolysis of the substrate and disrupts redox reactions, thereby increasing Rct. The sharp increase in Rct after exposure to even trace levels of CPS underscores the biosensor’s high sensitivity and effective signal transduction, making it especially suitable for early detection of CPS contamination.
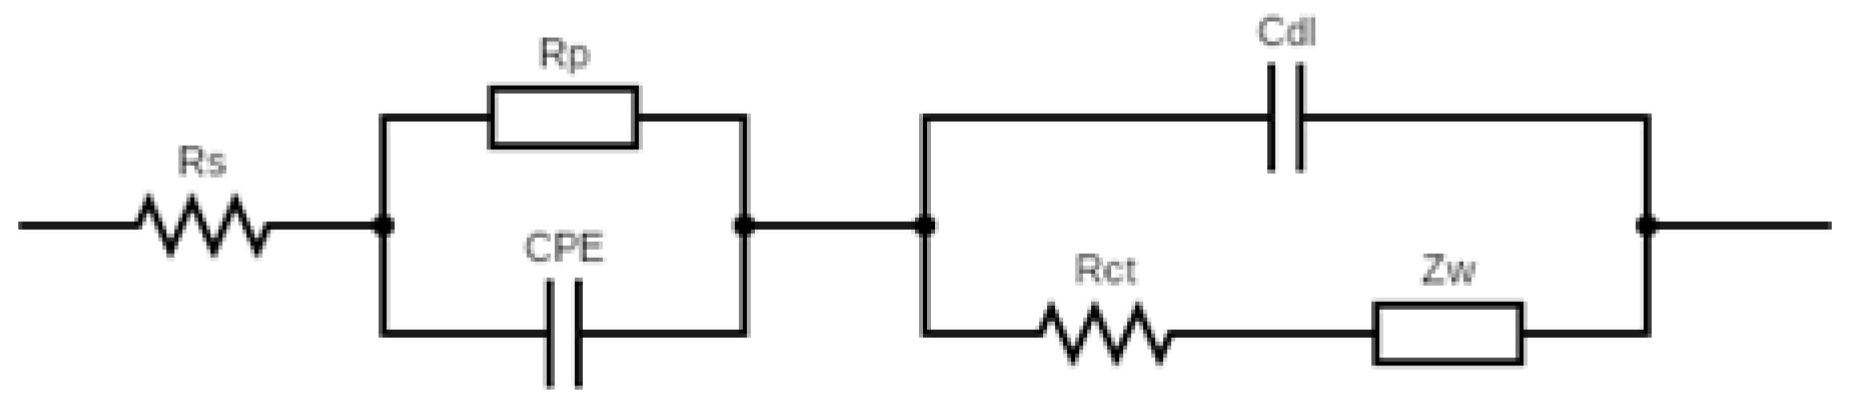
Reliable Rct values were quantified by fitting impedance spectra to an equivalent circuit model (Figure A1). To normalize electrode-to-electrode variations, the relative change in charge-transfer resistance was calculated as,
where Rct and Rct0 represent the charge transfer resistance in the presence of and absence of the inhibitor, respectively.
Figure 3b demonstrates a robust linear relationship (R2=0.99) between the normalized impedance change (and the logarithm of CPS concentration, log[CPS], across a linear dynamic range of 10−14-10−9 M), a very high sensitivity and range for CPS determination.
3.3.2. DPV Analysis
DPV measurements (Figure 3c) revealed a distinct decrease of the oxidation peak current as CPS concentrations increased, resulting from reduced electroactive product (TCI) generation upon AChE inhibition. Figure 3d demonstrated a strong linear correlation between peak current and log[CPS] (R2=0.99) across a broader range (10−14 -10−8 M) compared to the results of EIS, with an exceptionally low detection limit of 1×10⁻¹⁷ M. The narrower linear range of EIS techniques likely arises from saturation effects at high CPS concentrations around 10-8 M, where complete AChE inhibition limits further resistance changes. DPV outperformed EIS and CV (Figure 3e & S2) in sensitivity and linear range due to its pulse-based design, which minimizes non-Faradaic currents (e.g., capacitive background) and amplifies Faradaic signals, thereby substantially enhancing the signal-to-noise ratio of the measurement[46]. This enhanced signal-to-noise ratios, especially at ultralow concentrations. The visual clarity of the DPV peaks observed in the presented graphs, characterized by sharp peaks and a relatively flat baseline, provided direct empirical evidence of DPV’s effectiveness in enhancing signal quality. This clean signal is paramount for accurate and reliable quantification of enzyme inhibition, especially when attempting to detect subtle changes induced by low concentrations of inhibitors.
3.3.3. CV Analysis
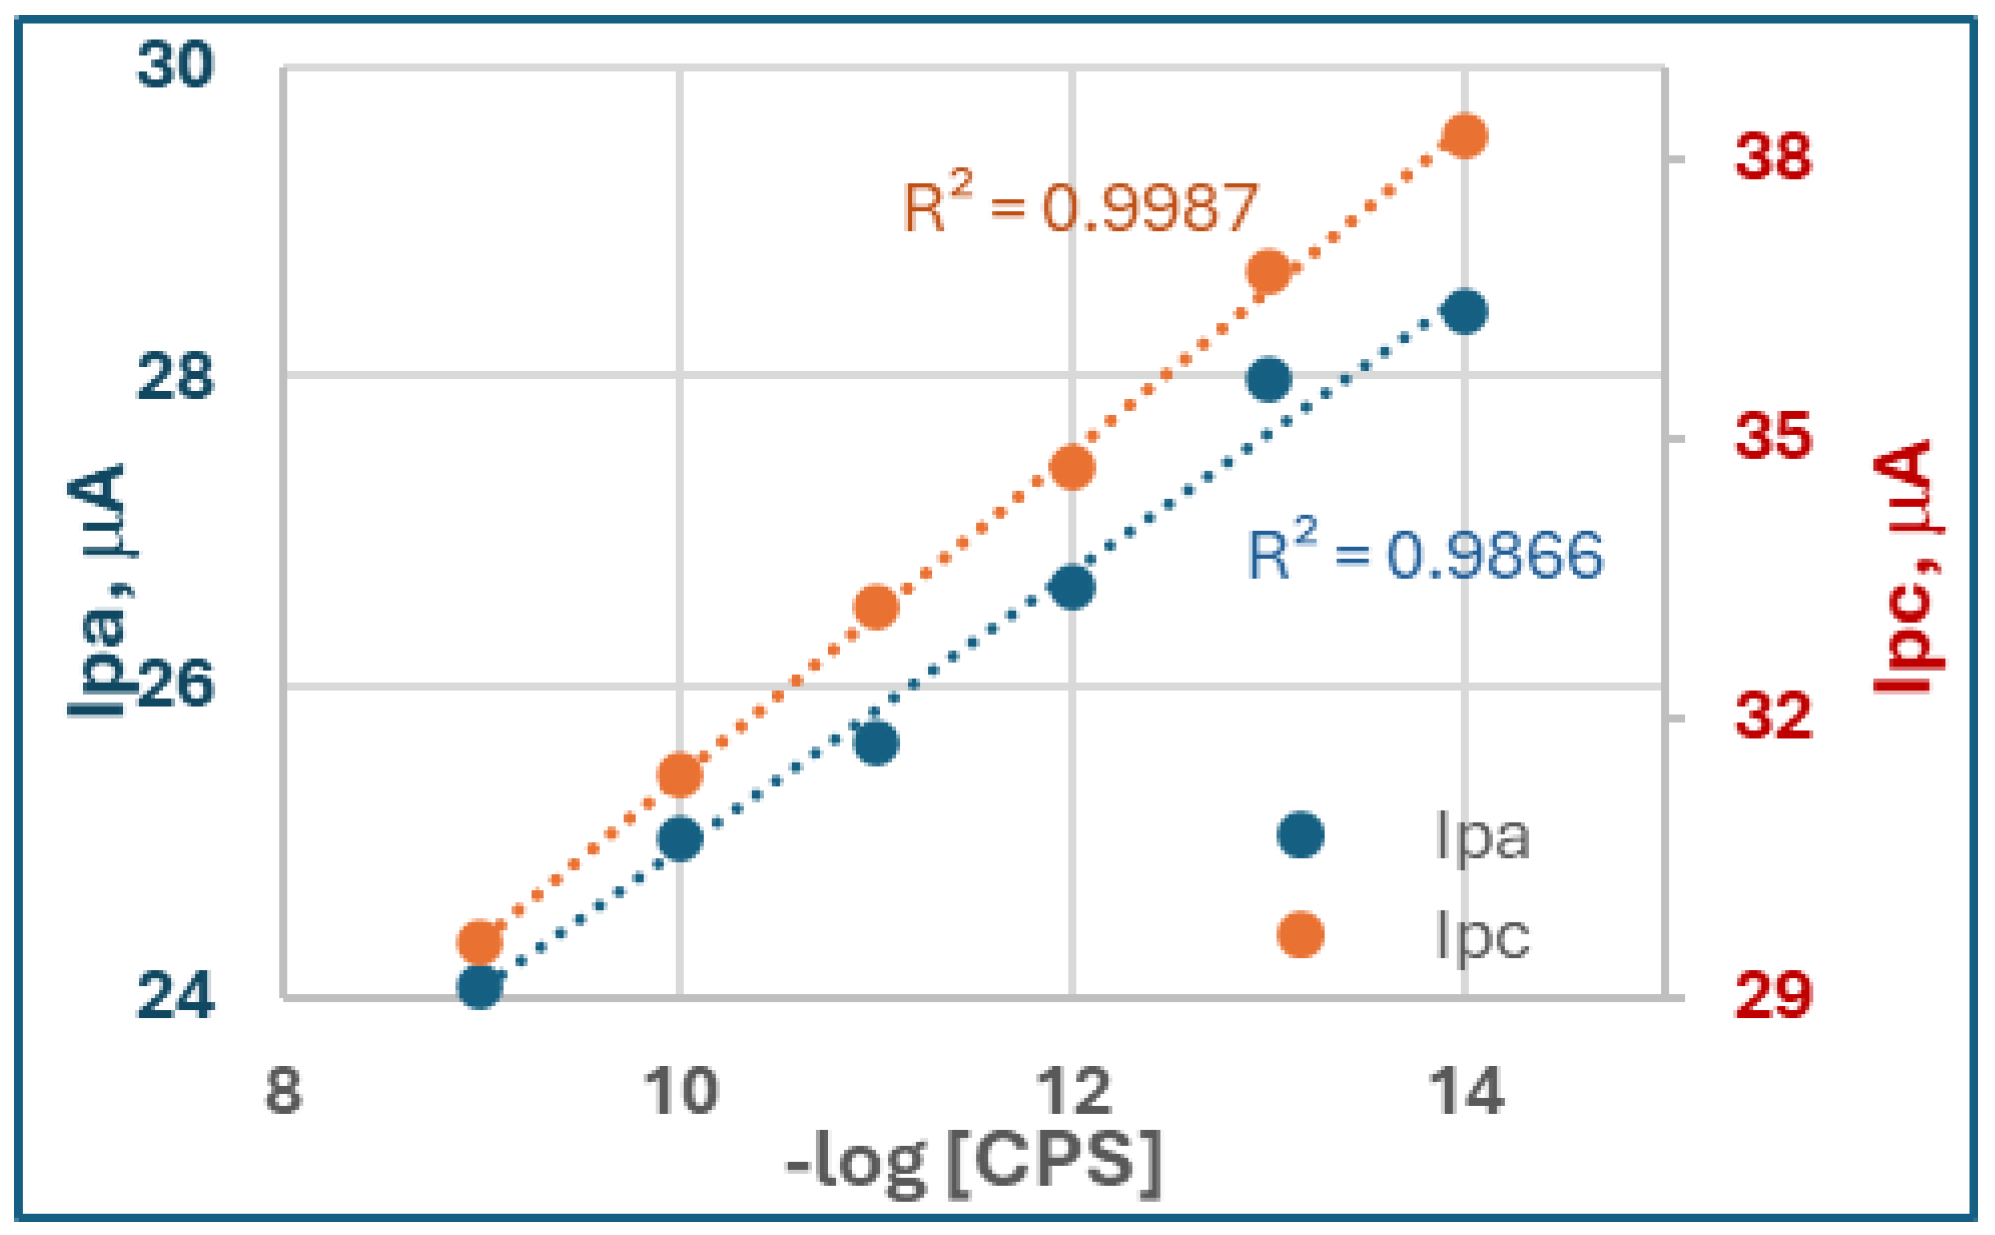
CV scans (Figure 3e) showed decreasing anodic (Ipa) and cathodic peak currents (Ipc) with higher CPS concentrations. While both Ipa and Ipc exhibited linear dependence on log[CPS] (Figure A2), Ipc displayed superior sensitivity (R2=0.999) compared to Ipa (R2=0.987). This anomaly probably arises from the reaction mechanism: Ipa corresponds to the oxidation of TCI (the enzymatic product), which is susceptible to interference from oxygen or electrode fouling, reducing reproducibility. On the other hand, Ipc reflects the reduction of disulfide bonds (e.g., oxidized dithiothreitol, ODTT), a process less affected by background noise. The cleaner cathodic baseline and reversible redox behavior of thiol groups yield higher precision and sensitivity for Ipc. The linear dynamic range was found to be 10−14 -10−9 M, comparable to the EIS results.
Comparing the three techniques, DPV seems to be the optimal choice for quantitative CPS detection due to its unmatched detection limit (10−17 M), wide linear range, and resistance to non-Faradaic interference. CV provides mechanistic insights but suffers from higher signal variability, while EIS is limited by saturation at high concentrations. EIS measurement is typically slower than DPV and CV, which is another characteristic to be considered. However, by using normalized charge-transfer resistance (EIS may reduce the variations in sensitivity between different biosensors raised from electrode fabrication inconsistencies.
In comparison with other nanomaterials-based OP electrochemical biosensors reported in literature, our MQD-based OP biosensor showed enhanced performance for OP detection[14,17,47,48,49] . The superior performance of the Ti₃C₂Tx MQD-based biosensor is attributed to the integration of nanoscale engineering, robust enzyme immobilization, and optimized electrode interfaces. This design leverages several structural and material advantages, such as, 1). High surface-to-volume ratio: MQDs (Mean diameter, 6.4 nm) provide a much larger surface area compared to MXene nanosheets, offering abundant sites for enzyme (AChE/BSA) immobilization and enhancing catalytic efficiency. 2). Quantum confinement and edge-rich surfaces: MQDs expose more catalytically active edge sites, which improve electron transfer and electrochemical signal quality, a critical feature for sensitive detection. 3). Superior conductivity: The ultra-small size of MQDs facilitates rapid electron shuttling between the enzyme and the electrode, increasing the biosensor’s sensitivity to OP compounds[50].
In brief, the MQD-AChE electrochemical biosensor is a promising platform for fast OP detection, combining exceptional sensitivity, broad linearity. DPV is the preferred technique for ultra trace analysis with minimized interference from non-Faradaic currents. In the meantime, Ipc in CV offers a reliable alternative for mechanistic studies.
The MQD-AChE Biosensor Offered Operational Stability for OP Detection
The biosensor showed a good stability, less than 3.5% relative variance of its initial DPV response after 31 minutes of continuous operation at fixed CPS concentrations (Figure 3f). In contrast, we developed an OP biosensor based on Ti3C2TX MXene nanosheets using the identical fabrication procedure. This MXene-based inhibition biosensor also exhibited a detection range of 10⁻¹⁴ to 10⁻⁸ M for CPS. However, it demonstrated suboptimal linearity (R² < 0.90), and a much lower analytical sensitivity due to the high standard deviation. And the sensor suffered from rapid delamination of the MXene layers from GCE surface.
The superior sensing stability fisrt benefits from the design for stabilization and biocompatibility: 1). Strong Enzyme Anchoring: GA cross-linking covalently stabilizes AChE-BSA complexes, preventing enzyme leaching and denaturation while maintaining bioactivity[51,52]. 2).BSA as a protective layer: BSA acts as a spacer and protective layer, reducing enzyme denaturation and enhancing stability[41]. 3).CS Matrix: CS disperses MQDs evenly and provides amino groups for cross-linking, combining biocompatibility with high conductivity for efficient signal amplification[40].
Electrochemical activation of GCE also optimized the electrode surface. Electrooxidation treatment in H2SO4 solution generates carboxylic/carbonyl groups on GCE surface, which improved hydrophilicity and adhesion for the MQD-CS composite, leading to more stable and uniform coatings[53].
More importantly, unlike larger MXene sheets, MQDs do not aggregate in CS, ensuring even coatings and consistent electron transfer. Thinner MQD films maintain a robust interface with the GCE, minimizing delamination during repeated electrochemical cycling[50]. In addition, MQDs form less dense films, allowing the substrates ACTI to diffuse rapidly to AChE’s active sites, improving sensitivity and detection speed[54].
The combined use of electrochemically activated GCE, MQD-CS matrix, and cross-linked AChE/BSA results in a biosensor with exceptional sensitivity and stability. The quantum confinement effects and edge-rich surfaces of MQDs are particularly effective for enzyme coupling and signal transduction, making this approach superior to biosensors based on larger MXene structures or other nanomaterials.
Nevertheless, this research has used drop-casting method to prepare the biosensor. This may cause inconsistencies in electrode fabrication, due to manual deposition variability, coffee-ring effect[55], and enzyme activity loss due to repeated use or washing, indicating weak attachment and inconsistent enzyme activity. We have noticed the inconstancy of the sensor signal and absolute electrode resistance variation between different batches of biosensors. However, there is not significant difference in linear range and detection limits. Future work will test inkjet printing method to achieve more uniform enzyme deposition, leading to higher reproducibility and superior electrochemical performance compared to traditional drop-casted electrodes[56].
3.3.5. The MQD-AChE Biosensor Applies to Other Cholinesterase Inhibiting OP Pesticides
In addition to CPS, two other OPs (ACE and GLY), and a pyrethroid negative control, PERM, were also tested by the MQD-based biosensor (Figure 4). DPV analysis demonstrated distinct responses to OPs versus non-target neurotoxins. Although they are weaker than CPS, both ACE and GLY induced significant concentration-dependent suppression of the oxidation peak current at ∼0.65 V, corresponding to TCI oxidation. ACE exhibited the suppression response (21% at 1 nM; 37% at 2 nM) and GLY (7% at 10 nM; 14% at 20 nM), with GLY showing additional peak broadening. In stark contrast, PERM, a pyrethroid negative control, produced negligible signal changes (<5% at 1-2 nM) without peak shifts, confirming its lack of AChE inhibition. OP compounds collectively generated >5-fold higher current suppression than PERM, highlighting the biosensor’s selectivity for AChE inhibitors.
Not surprisingly, the biosensor’s selectivity arises from the specific biochemical interaction between OPs and AChE. CPS, ACE, and GLY irreversibly phosphorylate AChE’s catalytic serine residue, inhibiting enzymatic hydrolysis of ACTI and reducing electroactive TCI production[45]. This directly suppresses the DPV oxidation current proportionally to OP concentration and inhibition kinetics. Conversely, PERM’s null response validates its non-cholinergic mechanism (sodium channel modulation), eliminating false positives.
The distinct electrochemical signatures, sharp suppression for high-affinity CPS versus broadening for GLY, further enable differentiation of OP subclasses. CPS and ACE are both organophosphate insecticides that directly inhibit AChE by phosphorylating the enzyme’s active site, leading to the accumulation of acetylcholine and overstimulation of cholinergic pathways; however, CPS is generally more potent due to its rapid conversion to the highly active CPS oxon, whereas ACE is considered a weak inhibitor of AChE, which greater insecticidal potency and mammalian toxicity are largely due to its metabolic activation to methamidophos [45,57,58]. GLY, in contrast, is not an organophosphate herbicide that does not efficiently bind or inhibit AChE at biologically relevant concentrations, showing only weak and reversible inhibition at high concentration levels, and its neurotoxic effects are mainly attributed to oxidative stress rather than cholinergic disruption[59,60,61]. The P-C bond in GLY is much more stable and less prone to hydrolysis than the P-O-C bonds in CPS and ACE. This difference is largely responsible for why GLY is a much weak cholinesterase inhibitor compared to many organophosphate insecticides. PERM, a pyrethroid insecticide, targets voltage-gated sodium channels and causes neuronal hyperexcitation; while it can indirectly influence cholinergic activity by disrupting calcium signaling and neurotransmitter release, it does not directly inhibit AChE except at very high doses or in combination with other neurotoxicants[62,63]. Thus, the different inhibition effects on cholinergic activity among these compounds are primarily due to their distinct chemical structures, mechanisms of action, and molecular affinities for AChE, with CPS and ACE exerting direct inhibition, and GLY and PERM showing minimal or only indirect effects. By excluding pyrethroids while detecting diverse OPs, the biosensor offers a reliable screening tool for environmental OP contamination with 5-minute response times and nM to sub-fM sensitivity.
3.4. Application of MQD-Based OP Biosensor to Monitor In Vitro Cholinergic Activity for Bean Beetles
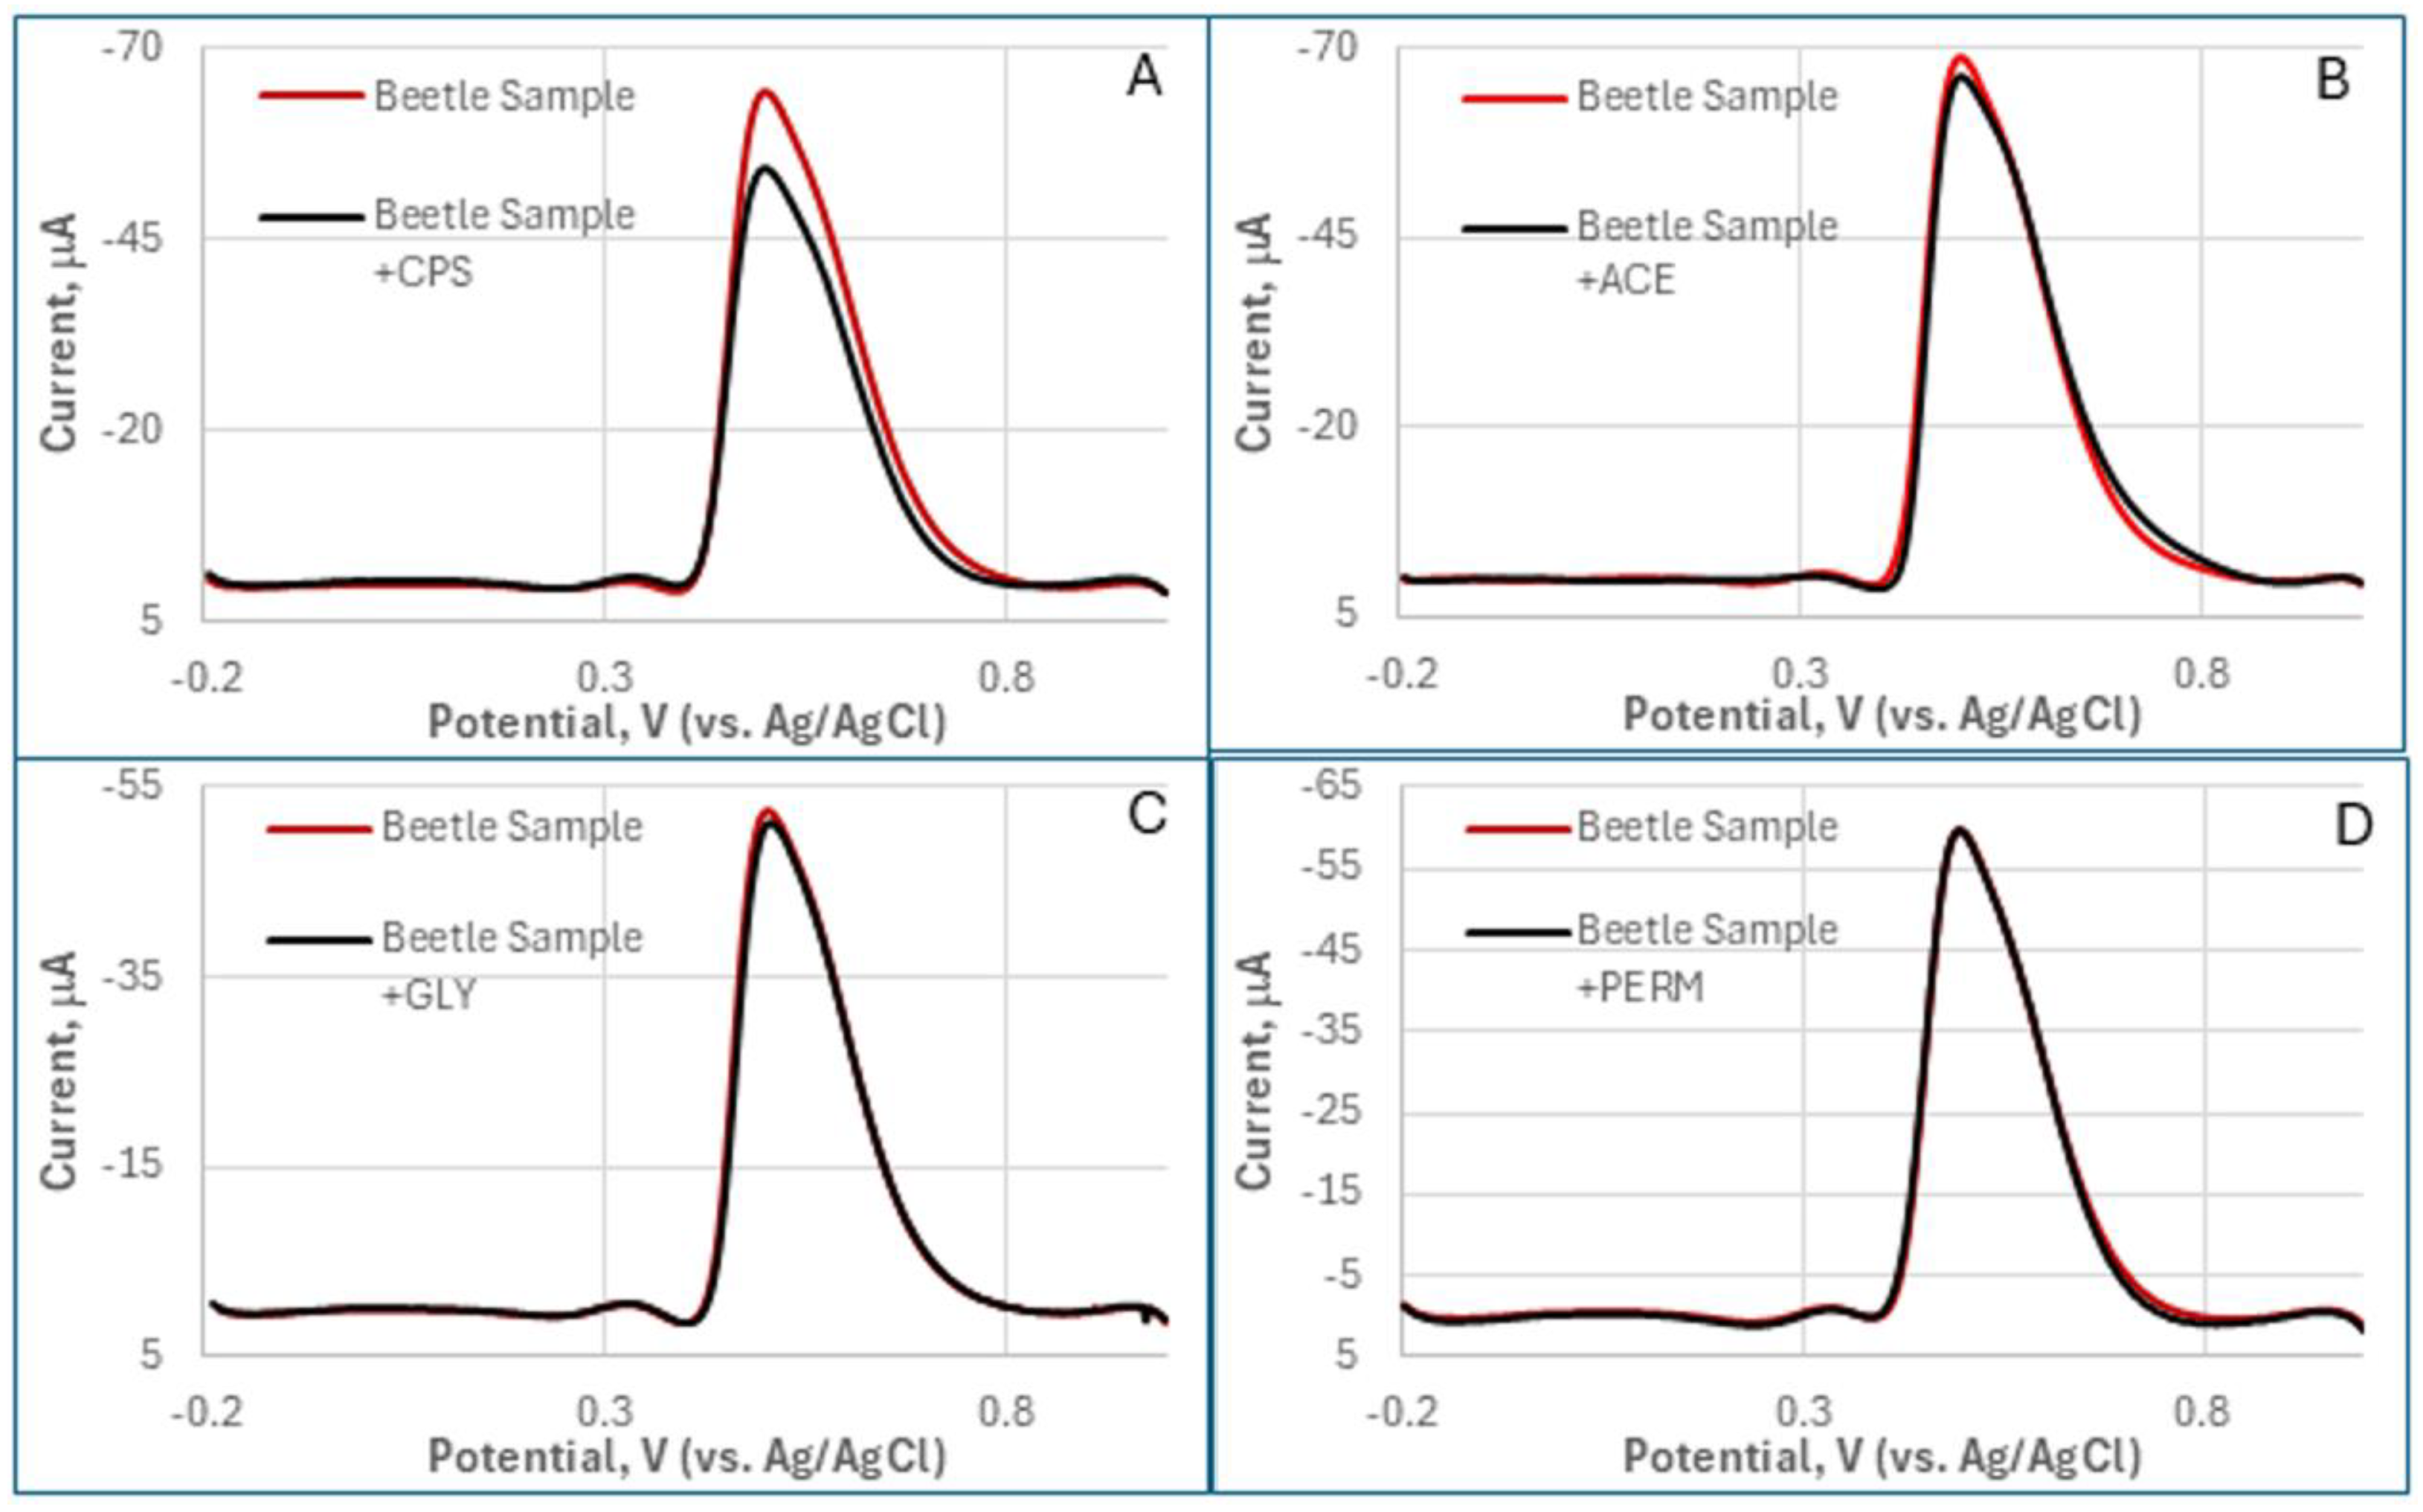
The MQD-based OP biosensor was employed to assess the cholinergic inhibitory effects of the above four distinct pesticides (CPS, ACE, GLY, and PERM) on AChE activity within Callosobruchus maculatus (bean beetle) homogenates. Analyzing complex biological matrices like insect homogenates necessitates careful consideration of matrix effects[64]. Endogenous compounds, including natural metabolites, lipids, and proteins, can interfere with enzymatic activity or signal generation, potentially leading to deviations from results obtained in buffered solutions. While a discernible matrix effect on biosensor sensitivity was noted in comparison to the earlier test in PBS buffer (Section 3.3), distinct DPV responses were obtained for each pesticide (Figure B1). The magnitude of current decrease, indicative of AChE inhibition, was highest for CPS, became weaker for ACE, and extremely lowest for GLY, and an undetectable change for PERM (the control).
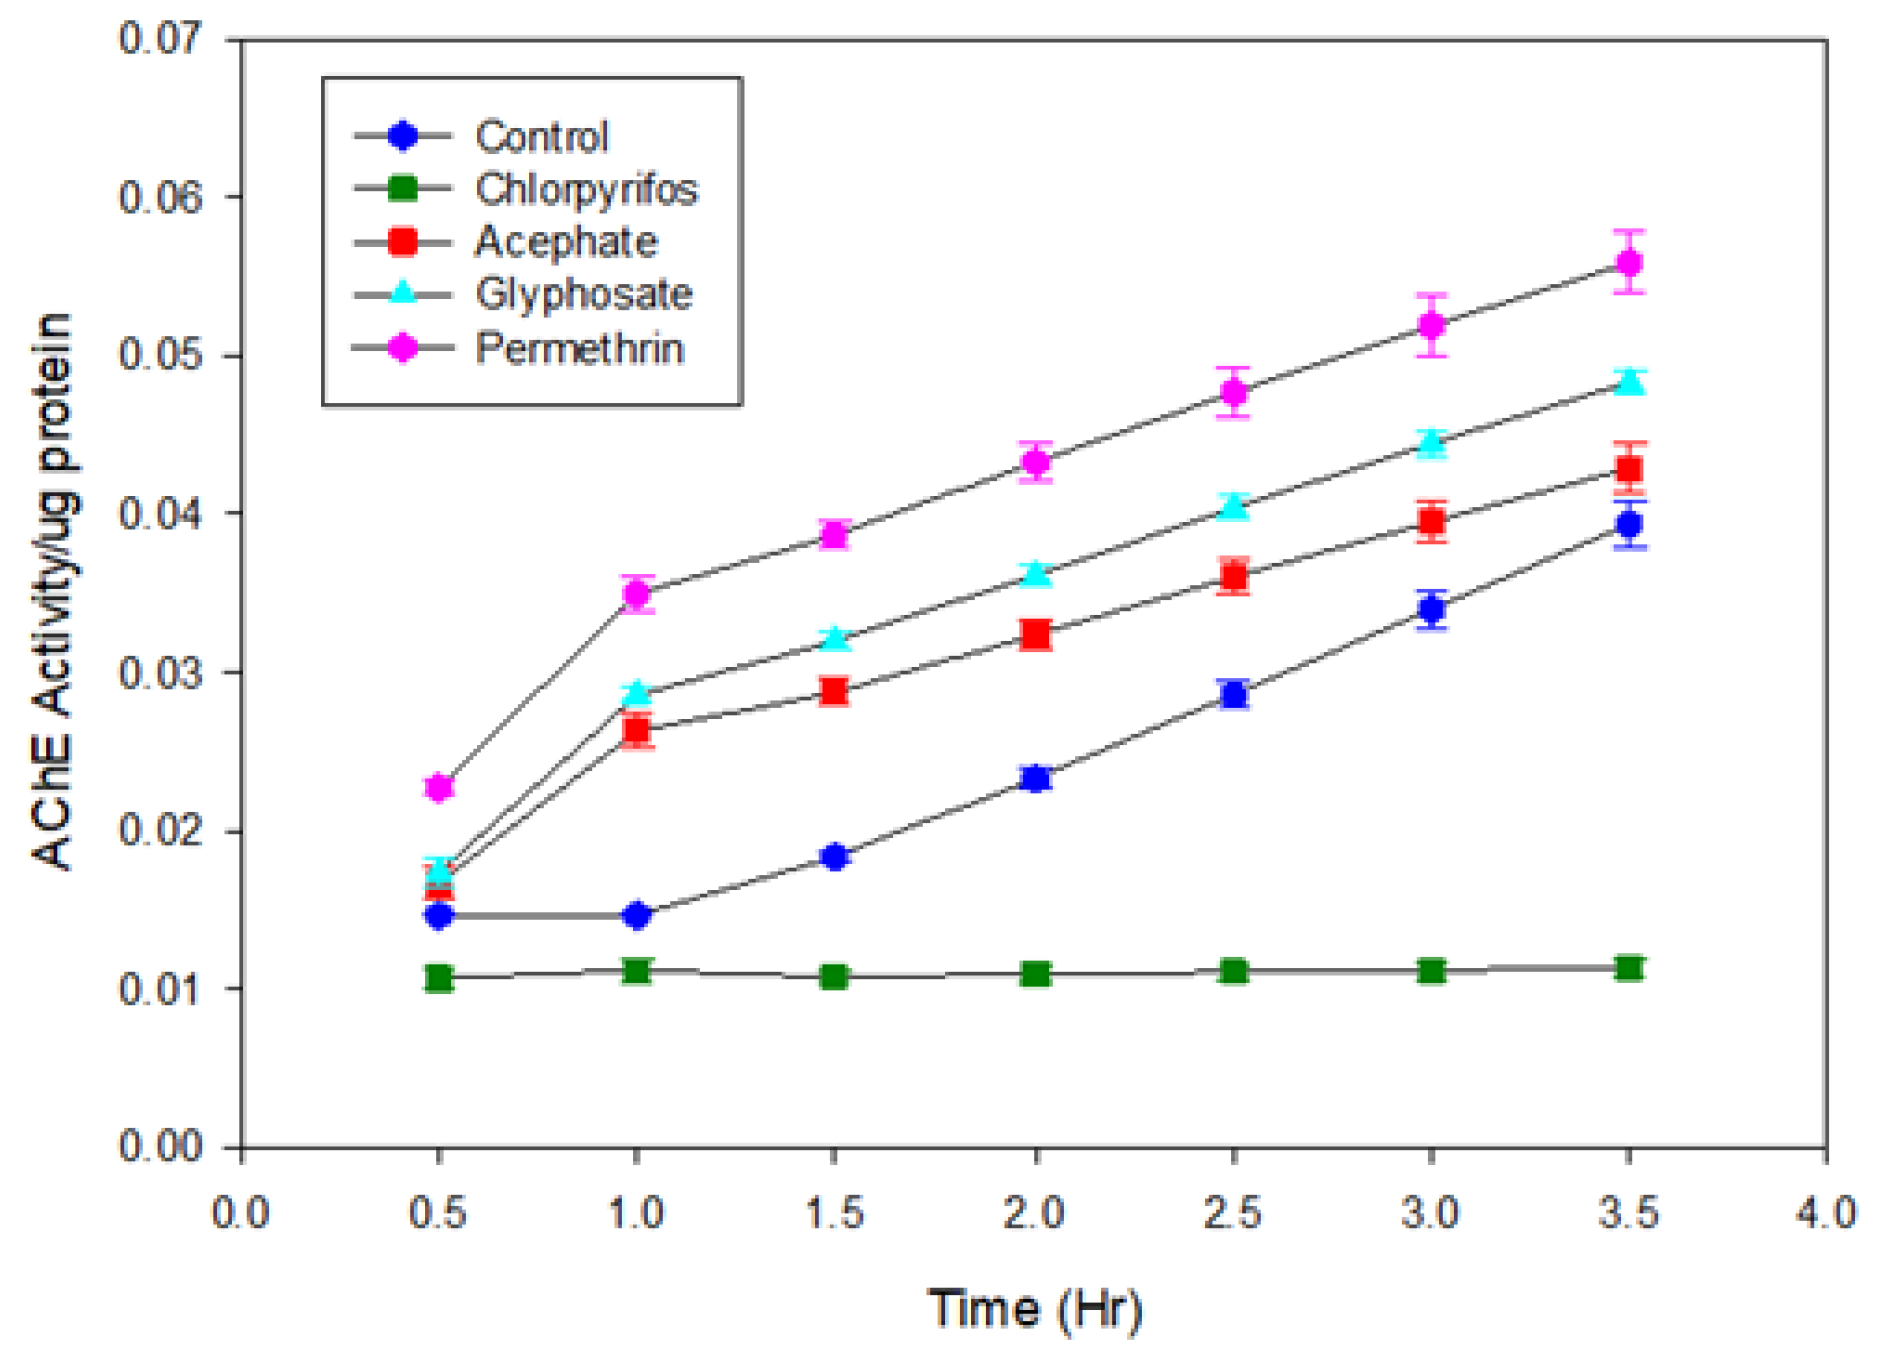
For comparative analysis, the conventional Ellman colorimetric assay was utilized to evaluate cholinergic activity in bean beetle homogenates. As depicted in Figure B2, the Ellman assay results demonstrate the impact of CPS, ACE, GLY, and PERM on cholinergic activity over a 3.5-hour period. The negative control group (untreated beetles) exhibited a steady, moderate increase in activity, representing baseline cholinergic function. In contrast, the CPS treatment group showed minimal to no increase in activity throughout the assay, maintaining near-zero values, which signifies potent inhibition of cholinergic activity, showing a strong consistency for CPS between the MQD-based biosensor and the conventional Ellman method.
The ACE group did not demonstrate a significant reduction in activity compared to the negative control in Ellman colorimetric assay. While ACE is known to inhibit acetylcholinesterase, it is a weak and reversible inhibitor and must be metabolized to methamidophos to increase inhibition. The short incubation time might have been a factor in the activation of ACE [65]. Conversely, both GLY and PERM treatments resulted in elevated activity levels relative to the negative control, with PERM eliciting the highest increase among all treatments. GLY-treated samples also displayed elevated activity, albeit slightly less pronounced than PERM. These results showed the challenge to Ellman colorimetric assay for the detection of weaker inhibitors at low concentrations (60 µg/mL in this experiment).
In contrast, the observed current changes in the biosensor correlate directly with AChE activity, highlighting the potential applicability of this biosensor in biological samples. The MQD-based OP biosensor presents several notable advantages over the conventional Ellman method. These include enhanced sensitivity and lower detection limits, reduced sample preparation, and faster response times. It can be used for both strong and weak inhibition at very low concentrations. Furthermore, its portability and suitability for field deployment offer a significant advantage over the Ellman method, which typically necessitates laboratory infrastructure and a spectrophotometer. As an electrochemical biosensor, it directly converts the biochemical event (TCI oxidation) into a quantifiable electrical signal, facilitating seamless integration with digital systems for data processing and analysis. Future investigations will focus on refining the biosensor’s performance to enhance sensitivity and selectivity across a broader spectrum of complex real-world matrices, including diverse insect species, various agricultural products, and environmental water samples. Comprehensive understanding and mitigation of matrix effects and synergistic inhibitions are critical for ensuring robust biosensor performance[66].
4. Conclusions
An electrochemical biosensor for the detection of OPs was successfully developed using a composite of AChE/CS/Ti3C2TX MQDs, which enabled effective immobilization of the AChE enzyme. The development of the Ti3C2TX MQD-based electrochemical biosensor for OP pesticide detection represents a significant advancement in environmental monitoring and biological sample analysis. The meticulous fabrication process, involving the electrochemical activation of a GCE surface, stable immobilization of MQDs with CS, and co-crosslinking of AChE and BSA, yielded a robust and highly sensitive platform. Comparative analysis of electrochemical techniques demonstrated that DPV is the optimal method for quantitative OP detection with this biosensor, offering an unmatched detection limit of 1×10⁻¹⁷ M for CPS, a wide linear range (10−14−10−8 M), and superior resistance to non-Faradaic interference. While CV provided valuable mechanistic insights, and EIS offered insights into charge transfer resistance, DPV’s enhanced signal-to-noise ratio proved critical for ultra-trace analysis.
The superior performance and operational stability of the MQD-AChE biosensor are attributed to the unique properties of the MQDs, including their high surface-to-volume ratio, quantum confinement effects, edge-rich surfaces, and excellent conductivity, which facilitate efficient enzyme immobilization and electron transfer. The design also benefits from strong enzyme anchoring via GA cross-linking, the protective role of BSA, and the biocompatible and conductive CS matrix. The use of electrochemically activated GCE further contributes to stable and uniform coatings, minimizing delamination issues observed with larger MXene sheets.
Crucially, the biosensor demonstrated excellent selectivity for AChE-inhibiting OPs (CPS, ACE, and GLY) over non-cholinergic neurotoxins like PERM, providing a reliable screening tool with rapid response times and high sensitivity. Its successful application in monitoring in vitro cholinergic activity in bean beetle homogenates, with results strongly correlating with the conventional Ellman method, underscores its potential for real-world biological sample analysis.
Future efforts will focus on improving the consistency of biosensor fabrication, potentially through inkjet printing methods, to enhance reproducibility. The promising attributes of this MQD-based biosensor, including its enhanced sensitivity, lower detection limits, reduced sample preparation, faster response times, and portability, position it as a highly valuable tool for comprehensive understanding and mitigation of OP contamination in diverse complex matrices.
Author Contributions
Conceptualization, S.H.; methodology, S.H., S.C. and N.M.; validation, N. M., J. W., C. F. C., J.F. and S. H.; investigation, J. W., J.F., C. F. C., and N. M.; resources, S.H., B.G., and S.C.; data curation, S.H., N.M., and S.C.; writing—original draft preparation, S. H. and N.M.; writing—review and editing, S.H., N.M., B.G. and S.C.; supervision, S.H., B.G. and S.C.; project administration, S.H. and B.G.; funding acquisition, B.G. and S.H. All authors have read and agreed to the published version of the manuscript.
Funding
This research was funded by DOE BES DE-SC0024611.
Institutional Review Board Statement
Not applicable.
Informed Consent Statement
Not applicable.
Data Availability Statement
The data are contained within the article.
Conflicts of Interest
The authors declare no conflicts of interest.
Appendix A. EIS Simulation and CV analysis
Appendix A.1. Circuit for EIS Simulation
Figure A1.
The equivalent circuit of the MQD-based OP biosensor for the EIS simulation.
Appendix A.2. Data Analysis of CV
Figure A2.
CPS Concentrations responsible to the anodic peak current (Ipa, Blue) and Cathodic peak current (Ipc, Orange) in CV curves.
Figure A2.
CPS Concentrations responsible to the anodic peak current (Ipa, Blue) and Cathodic peak current (Ipc, Orange) in CV curves.
Appendix B. MQD-Based OP Biosensor to Monitor In Vitro Cholinergic Activity for Bean Beetles
The cholinergic inhibitory effects of chlorpyrifos (CPS), acephate (ACE), glyphosate (GLY), and permethrin (PERM) on acetylcholinesterase (AChE) activity in bean beetle (Callosobruchus maculatus) homogenates were tested using the MQD-based biosensor and compared to in vitro colorimetric assay based on the Ellman method.
Appendix B.1. Cholinergic Activity monitored by MQD-Based electrochemical Biosensor
1 mL homogenized beetle sample was first mixed with 9 mL of PBS and 1 mM of ATI. Differential pulse voltammetry (DPV) data was collected before and after adding 1nM pesticides (CPS, ACE, GLY, and PERM) for 10 min (Figure A3).
Figure A3.
DPV responses of the MQD-based OP biosensor in homogenized beetle sample solution showed the distinctive inhibition effect for OPs (A: CPS, B: ACE, and C: GLY) compared to the control (D: PERM).
Figure A3.
DPV responses of the MQD-based OP biosensor in homogenized beetle sample solution showed the distinctive inhibition effect for OPs (A: CPS, B: ACE, and C: GLY) compared to the control (D: PERM).
Appendix B.2. In Vitro Cholinergic Activity Assay in Bean Beetles
At least 10 adult bean beetles per treatment group were sacrificed and homogenized in 1 mL of ice-cold phosphate buffer (0.1M, pH 6.8), followed by centrifugation (15,000 × g, 5 min) to obtain enzyme-containing supernatants with protein concentrations standardized to 0.5–1.0 mg/mL. Pesticides (CPS, ACE, GLY, and PERM) and the negative control (deionized water) were tested by pre-incubating 50 μL of homogenate with 50 μL of pesticide solution (Final OP concentration: 60 μg/mL) for 30 minutes at 30°C, after which a master mix containing phosphate buffer and 5,5’-dithiobis-(2-nitrobenzoic acid) (DTNB) (0.45 mM) was added. The reaction was initiated with acetylthiocholine iodide (ACTI, 1.0 mM) in 96-well plates (total volume: 200 μL), and AChE activity was measured spectrophotometrically at 412 nm over 3.5 hours.
BSA Standard: Before running the assays, a standard Bovine Serum Albumin (BSA) was used to determine total protein in each sample. Total protein was determined using a modified Bradford assay. This standard protein assay involved using BSA as the standard. For each sample, approximately 10-20uL of sample supernatant was used to measure protein content. The Tecan Infinite 200 Pro Multimode Microplate Reader was used to measure absorbance at 595 nm. The amount of absorbance was proportional to the amount of protein present in the sample.
Activity was calculated using the thiocholine extinction coefficient and normalized to protein content, revealing pesticide-specific inhibitory effects compared to the negative control (Figure A4).
Figure A4.
In Vitro Cholinergic Activity Assay of CPS (green), ACE (red), GLY (cyan), PERM (magenta), and the negative control (blue)in homogenate of Bean Beetles.
Figure A4.
In Vitro Cholinergic Activity Assay of CPS (green), ACE (red), GLY (cyan), PERM (magenta), and the negative control (blue)in homogenate of Bean Beetles.
References
- Colovic, M.B.; Krstic, D.Z.; Lazarevic-Pasti, T.D.; Bondzic, A.M.; Vasic, V.M. Acetylcholinesterase inhibitors: pharmacology and toxicology. Curr. Neuropharmacol. 2013, 11, 315–335. [Google Scholar] [CrossRef]
- Kim, K.; Tsay, O.G.; Atwood, D.A.; Churchill, D.G. Destruction and Detection of Chemical Warfare Agents. Chem. Rev. (Washington, DC, U. S.) 2011, 111, 5345–5403. [Google Scholar] [CrossRef]
- Barzyk, T.M.; Wilson, S.; Wilson, A. Community, state, and federal approaches to cumulative risk assessment: challenges and opportunities for integration. Int J Environ Res Public Health 2015, 12, 4546–4571. [Google Scholar] [CrossRef] [PubMed]
- Dorandeu, F.; Singer, C.; Chatfield, S.; Chilcott, R.P.; Hall, J. Exposure to organophosphorus compounds: best practice in managing timely, effective emergency responses. Eur J Emerg Med 2023, 30, 402–407. [Google Scholar] [CrossRef] [PubMed]
- Maanaki, H.; Xu, T.; Chen, G.; Du, X.; Wang, J. Development of integrated smartphone/resistive biosensor for on-site rapid environmental monitoring of organophosphate pesticides in food and water. Biosens. Bioelectron.: X 2023, 15, 100402. [Google Scholar] [CrossRef] [PubMed]
- Pundir, C.S.; Malik, A.; Preety. Bio-sensing of organophosphorus pesticides: A review. Biosens. Bioelectron. 2019, 140, 111348. [Google Scholar] [CrossRef] [PubMed]
- Uniyal, S.; Sharma, R.K. Technological advancement in electrochemical biosensor based detection of Organophosphate pesticide chlorpyrifos in the environment: A review of status and prospects. Biosensors and Bioelectronics 2018, 116, 37–50. [Google Scholar] [CrossRef]
- Lu, D.; Wang, J.; Wang, L.; Du, D.; Smith, J.; Liao, H.; Qian, W.; Timchalk, C.; Lin, Y. Nanoparticle-based disposable electrochemical immunosensor for simple and sensitive diagnosis of exposure to organophosphorus pesticides and nerve agents. 2010; p. a332/331.
- Karube, I.; Nomura, Y. Enzyme sensors for environmental analysis. J. Mol. Catal. B: Enzym. 2000, 10, 177–181. [Google Scholar] [CrossRef]
- Mulchandani, A.; Chen, W.; Mulchandani, P.; Wang, J.; Rogers, K.R. Biosensors for direct determination of organophosphate pesticides. Biosens. Bioelectron. 2001, 16, 225–230. [Google Scholar] [CrossRef]
- Liu, G.; Lin, Y. Biosensor Based on Self-Assembling Acetylcholinesterase on Carbon Nanotubes for Flow Injection/Amperometric Detection of Organophosphate Pesticides and Nerve Agents. Anal. Chem. 2006, 78, 835–843. [Google Scholar] [CrossRef]
- Dhull, V.; Gahlaut, A.; Hooda, V. Nanomaterials based biosensors for the detection of organophosphate compounds: a review. Int. J. Environ. Anal. Chem. 2023, 103, 4200–4224. [Google Scholar] [CrossRef]
- Gu, C.; Ji, S.; Chen, Z.; Yang, W.; Deng, Y.; Zhao, M.; Huang, W.; Yang, W.; Xu, W. Enrichment-catalytic synergistically enhanced electrochemiluminescence sensors based on IRMOF-3/CdTe for ultrasensitive detection of organophosphorus pesticides. Biosens. Bioelectron. 2025, 279, 117398. [Google Scholar] [CrossRef]
- Yadav, J.; Hooda, V.; Chauhan, N. AChE inhibition sensing through SiO2 and GQDs interface on screen-printed electrode for malathion detection. Process Biochem. (Oxford, U. K.) 2025, 153, 238–247. [Google Scholar] [CrossRef]
- Han, S.; Zhu, M.; Yuan, Z.; Li, X. A methylene blue-mediated enzyme electrode for the determination of trace mercury(II), mercury(I), methylmercury, and mercury–glutathione complex. Biosensors and Bioelectronics 2001, 16, 9–16. [Google Scholar] [CrossRef]
- Mishra, R.K.; Hubble, L.J.; Martin, A.; Kumar, R.; Barfidokht, A.; Kim, J.; Musameh, M.M.; Kyratzis, I.L.; Wang, J. Wearable Flexible and Stretchable Glove Biosensor for On-Site Detection of Organophosphorus Chemical Threats. ACS Sens. 2017, 2, 553–561. [Google Scholar] [CrossRef] [PubMed]
- Maanaki, H.; Bussiere, L.; Smirnov, A.; Du, X.; Sun, Y.; Arcury, T.A.; Summers, P.; Butler, L.; Pope, C.; Jensen, A.; et al. An Integrated Nanosensor/Smartphone Platform for Point-of-Care Biomonitoring of Human Exposure to Pesticides. Anal. Chem. (Washington, DC, U. S.) 2025, 97, 9701–9712. [Google Scholar] [CrossRef]
- Singh, A.P.; Balayan, S.; Hooda, V.; Sarin, R.K.; Chauhan, N. Nano-interface driven electrochemical sensor for pesticides detection based on the acetylcholinesterase enzyme inhibition. Int. J. Biol. Macromol. 2020, 164, 3943–3952. [Google Scholar] [CrossRef]
- Viswanathan, S.; Radecka, H.; Radecki, J. Electrochemical biosensor for pesticides based on acetylcholinesterase immobilized on polyaniline deposited on vertically assembled carbon nanotubes wrapped with ssDNA. Biosens. Bioelectron. 2009, 24, 2772–2777. [Google Scholar] [CrossRef]
- Lin, Y.; Yantasee, W.; Wang, J. Carbon nanotubes (CNTs) for the development of electrochemical biosensors. Front. Biosci. 2005, 10, 492–505. [Google Scholar] [CrossRef]
- Anasori, B.; Lukatskaya, M.R.; Gogotsi, Y. 2D metal carbides and nitrides (MXenes) for energy storage. Nat. Rev. Mater. 2017, 2, 16098. [Google Scholar] [CrossRef]
- Kalambate, P.K.; Gadhari, N.S.; Li, X.; Rao, Z.; Navale, S.T.; Shen, Y.; Patil, V.R.; Huang, Y. Recent advances in MXene-based electrochemical sensors and biosensors. TrAC, Trends Anal. Chem. 2019, 120, 115643. [Google Scholar] [CrossRef]
- Ding, R.; Li, Z.; Xiong, Y.; Wu, W.; Yang, Q.; Hou, X. Electrochemical (Bio)Sensors for the Detection of Organophosphorus Pesticides Based on Nanomaterial-Modified Electrodes: A Review. Crit. Rev. Anal. Chem. 2023, 53, 1766–1791. [Google Scholar] [CrossRef]
- Jiang, W.; Li, Z.; Yang, Q.; Hou, X. Integration of Metallic Nanomaterials and Recognition Elements for the Specifically Monitoring of Pesticides in Electrochemical Sensing. Crit. Rev. Anal. Chem. 2024, 54, 2636–2657. [Google Scholar] [CrossRef] [PubMed]
- Wang, F.; Zhu, Y.; Qian, L.; Yin, Y.; Yuan, Z.; Dai, Y.; Zhang, T.; Yang, D.; Qiu, F. Lamellar Ti3C2 MXene composite decorated with platinum-doped MoS2 nanosheets as electrochemical sensing functional platform for highly sensitive analysis of organophosphorus pesticides. Food Chem. 2024, 459, 140379. [Google Scholar] [CrossRef]
- Garcia, A.S.; Locke, A.K.; Core, B.D.; Gautam, B.R.; Autrey, D.E.; Han, S. Electrochemical Amyloid β Immunosensor Based on Ti3C2Tx MXene Nanosheets. Microscopy and Microanalysis 2024, 30, ozae044.459. [Google Scholar] [CrossRef]
- Djire, A.; Zhang, H.; Liu, J.; Miller, E.M.; Neale, N.R. Electrocatalytic and Optoelectronic Characteristics of the Two-Dimensional Titanium Nitride Ti4N3Tx MXene. ACS Appl. Mater. Interfaces 2019, 11, 11812–11823. [Google Scholar] [CrossRef] [PubMed]
- Johnson, D.; Pranada, E.; Yoo, R.; Uwadiunor, E.; Ngozichukwu, B.; Djire, A. Review and Perspective on Transition Metal Electrocatalysts Toward Carbon-Neutral Energy. Energy Fuels 2023, 37, 1545–1576. [Google Scholar] [CrossRef]
- Khan, R.; Andreescu, S. MXenes-Based Bioanalytical Sensors: Design, Characterization, and Applications. Sensors (Basel) 2020, 20. [Google Scholar] [CrossRef] [PubMed]
- Jiang, Y.; Zhang, X.; Pei, L.; Yue, S.; Ma, L.; Zhou, L.; Huang, Z.; He, Y.; Gao, J. Silver nanoparticles modified two-dimensional transition metal carbides as nanocarriers to fabricate acetycholinesterase-based electrochemical biosensor. Chem. Eng. J. (Amsterdam, Neth.) 2018, 339, 547–556. [Google Scholar] [CrossRef]
- Wang, B.; Li, Y.; Shu, W.; Zhang, J.; Yang, L. Acetylcholinesterase electrochemical biosensors with graphene-Au nanoparticles-Ti3C2Tx modified for detection of organophosphate pesticides. Mol. Cryst. Liq. Cryst. 2022, 733, 52–60. [Google Scholar] [CrossRef]
- Feng, X.; Han, G.; Cai, J.; Wang, X. Au@Carbon quantum Dots-MXene nanocomposite as an electrochemical sensor for sensitive detection of nitrite. J. Colloid Interface Sci. 2022, 607, 1313–1322. [Google Scholar] [CrossRef]
- Wan, M.; Jimu, A.; Yang, H.; Zhou, J.; Dai, X.; Zheng, Y.; Ou, J.; Yang, Y.; Liu, J.; Wang, L. MXene quantum dots enhanced 3D-printed electrochemical sensor for the highly sensitive detection of dopamine. Microchem. J. 2023, 184, 108180. [Google Scholar] [CrossRef]
- Li, Z.; Wang, Z.; Nie, Y.; Wang, P.; Ma, Q. A novel GSH-capping MXene QD-based ECL biosensor for the detection of miRNA221 in triple-negative breast cancer tumor. Chem. Eng. J. (Amsterdam, Neth.) 2022, 448, 137636. [Google Scholar] [CrossRef]
- Wang, L.; Zhang, N.; Li, Y.; Kong, W.; Gou, J.; Zhang, Y.; Wang, L.-N.; Yu, G.; Zhang, P.; Cheng, H.; et al. Mechanism of Nitrogen-Doped Ti3C2 Quantum Dots for Free-Radical Scavenging and the Ultrasensitive H2O2 Detection Performance. ACS Appl. Mater. Interfaces 2021, 13, 42442–42450. [Google Scholar] [CrossRef]
- Liu, F.; Zhou, A.; Chen, J.; Jia, J.; Zhou, W.; Wang, L.; Hu, Q. Preparation of Ti3C2 and Ti2C MXenes by fluoride salts etching and methane adsorptive properties. Appl. Surf. Sci. 2017, 416, 781–789. [Google Scholar] [CrossRef]
- Zhang, T.; Pan, L.; Tang, H.; Du, F.; Guo, Y.; Qiu, T.; Yang, J. Synthesis of two-dimensional Ti3C2Tx MXene using HCl+LiF etchant: Enhanced exfoliation and delamination. J. Alloys Compd. 2017, 695, 818–826. [Google Scholar] [CrossRef]
- Xu, Q.; Yang, W.; Wen, Y.; Liu, S.; Liu, Z.; Ong, W.-J.; Li, N. Hydrochromic full-color MXene quantum dots through hydrogen bonding toward ultrahigh-efficiency white light-emitting diodes. Applied Materials Today 2019, 16, 90–101. [Google Scholar] [CrossRef]
- Rahman, U.U.; Humayun, M.; Ghani, U.; Usman, M.; Ullah, H.; Khan, A.; El-Metwaly, N.M. MXenes as Emerging Materials: Synthesis, Properties, and Applications. Molecules 2022, 27. [Google Scholar] [CrossRef]
- Suginta, W.; Khunkaewla, P.; Schulte, A. Electrochemical Biosensor Applications of Polysaccharides Chitin and Chitosan. Chem. Rev. (Washington, DC, U. S.) 2013, 113, 5458–5479. [Google Scholar] [CrossRef]
- Sassolas, A.; Blum, L.J.; Leca-Bouvier, B.D. Immobilization strategies to develop enzymatic biosensors. Biotechnology Advances 2012, 30, 489–511. [Google Scholar] [CrossRef]
- Guan, Q.; Ma, J.; Yang, W.; Zhang, R.; Zhang, X.; Dong, X.; Fan, Y.; Cai, L.; Cao, Y.; Zhang, Y.; et al. Highly fluorescent Ti(3)C(2) MXene quantum dots for macrophage labeling and Cu(2+) ion sensing. Nanoscale 2019, 11, 14123–14133. [Google Scholar] [CrossRef]
- Wolejko, E.; Lozowicka, B.; Jablonska-Trypuc, A.; Pietruszynska, M.; Wydro, U. Chlorpyrifos Occurrence and Toxicological Risk Assessment: A Review. Int. J. Environ. Res. Public Health 2022, 19, 12209. [Google Scholar] [CrossRef]
- Landrigan, P.J.; Claudio, L.; Markowitz, S.B.; Berkowitz, G.S.; Brenner, B.L.; Romero, H.; Wetmur, J.G.; Matte, T.D.; Gore, A.C.; Godbold, J.H.; et al. Pesticides and inner-city children: exposures, risks, and prevention. Environ. Health Perspect. Suppl. 1999, 107, 431–437. [Google Scholar] [CrossRef] [PubMed]
- Sidhu, G.K.; Singh, S.; Kumar, V.; Dhanjal, D.S.; Datta, S.; Singh, J. Toxicity, monitoring and biodegradation of organophosphate pesticides: A review. Crit. Rev. Environ. Sci. Technol. 2019, 49, 1135–1187. [Google Scholar] [CrossRef]
- Bard, A.J.; Faulkner, L.R. Electrochemical Methods: Fundamentals and Applications; Wiley: 1980.
- Dube, A.; Malode, S.J.; Ali Alshehri, M.; Shetti, N.P. Recent advances in the development of electrochemical sensors for detecting pesticides. J. Ind. Eng. Chem. (Amsterdam, Neth.) 2025, 144, 77–99. [Google Scholar] [CrossRef]
- Ulker, E.; Zabitler, D.; Turan, K.; Tig, G.A. Electrochemical Detection of Pesticides. ACS Symp. Ser. 2025, 1496, 181–207. [Google Scholar] [CrossRef]
- Tan, X.; Yu, C.; Tang, J.; Wu, W.; Yang, Q.; Hou, X. Progress in Nanomaterials-Based Enzyme and Aptamer Biosensor for the Detection of Organophosphorus Pesticides. Crit. Rev. Anal. Chem. 2024, 54, 247–268. [Google Scholar] [CrossRef]
- Ali, A.; Majhi, S.M.; Siddig, L.A.; Deshmukh, A.H.; Wen, H.; Qamhieh, N.N.; Greish, Y.E.; Mahmoud, S.T. Recent Advancements in MXene-Based Biosensors for Health and Environmental Applications—A Review. Biosensors 2024, 14. [Google Scholar] [CrossRef] [PubMed]
- Mohd Razib, M.S.; Latip, W.; Abdul Rashid, J.I.; Knight, V.F.; Wan Yunus, W.M.Z.; Ong, K.K.; Mohd Kasim, N.A.; Mohd Noor, S.A. An Enzyme-Based Biosensor for the Detection of Organophosphate Compounds Using Mutant Phosphotriesterase Immobilized onto Reduced Graphene Oxide. Journal of Chemistry 2021, 2021, 2231089. [Google Scholar] [CrossRef]
- López-Gallego, F.; Betancor, L.; Mateo, C.; Hidalgo, A.; Alonso-Morales, N.; Dellamora-Ortiz, G.; Guisán, J.M.; Fernández-Lafuente, R. Enzyme stabilization by glutaraldehyde crosslinking of adsorbed proteins on aminated supports. J Biotechnol 2005, 119, 70–75. [Google Scholar] [CrossRef]
- Dekanski, A.; Stevanovic, J.; Stevanovic, R.; Nikolic, B.Z.; Jovanovic, V.M. Glassy carbon electrodes. I. Characterization and electrochemical activation. Carbon 2001, 39, 1195–1205. [Google Scholar] [CrossRef]
- Mahmoudi, E.; Fakhri, H.; Hajian, A.; Afkhami, A.; Bagheri, H. High-performance electrochemical enzyme sensor for organophosphate pesticide detection using modified metal-organic framework sensing platforms. Bioelectrochemistry 2019, 130, 107348. [Google Scholar] [CrossRef]
- Kalita, N.; Gogoi, S.; Minteer, S.D.; Goswami, P. Advances in Bioelectrode Design for Developing Electrochemical Biosensors. ACS Meas Sci Au 2023, 3, 404–433. [Google Scholar] [CrossRef]
- Hondred, J.A.; Breger, J.C.; Alves, N.J.; Trammell, S.A.; Walper, S.A.; Medintz, I.L.; Claussen, J.C. Printed Graphene Electrochemical Biosensors Fabricated by Inkjet Maskless Lithography for Rapid and Sensitive Detection of Organophosphates. ACS Appl. Mater. Interfaces 2018, 10, 11125–11134. [Google Scholar] [CrossRef]
- Mahajna, M.; Quistad, G.B.; Casida, J.E. Acephate insecticide toxicity: safety conferred by inhibition of the bioactivating carboxyamidase by the metabolite methamidophos. Chem Res Toxicol 1997, 10, 64–69. [Google Scholar] [CrossRef]
- Hussain, M.A.; Mohamad, R.B.; Oloffs, P.C. Studies on the toxicity, metabolism, and anticholinesterase properties of acephate and methamidophos. J Environ Sci Health B 1985, 20, 129–147. [Google Scholar] [CrossRef]
- Larsen, K.E.; Lifschitz, A.L.; Lanusse, C.E.; Virkel, G.L. The herbicide glyphosate is a weak inhibitor of acetylcholinesterase in rats. Environmental Toxicology and Pharmacology 2016, 45, 41–44. [Google Scholar] [CrossRef]
- Milić, M.; Žunec, S.; Micek, V.; Kašuba, V.; Mikolić, A.; Lovaković, B.T.; Semren, T.; Pavičić, I.; Čermak, A.M.M.; Pizent, A.; et al. Oxidative stress, cholinesterase activity, and DNA damage in the liver, whole blood, and plasma of Wistar rats following a 28-day exposure to glyphosate. Arh Hig Rada Toksikol 2018, 69, 154–168. [Google Scholar] [CrossRef] [PubMed]
- Kolić, D.; Pehar, V.; Kovarik, Z. Environmental exposure to glyphosate does not inhibit human acetylcholinesterase and butyrylcholinesterase. Arh Hig Rada Toksikol 2024, 75, 76–80. [Google Scholar] [CrossRef]
- Yan, Y.; Yang, Y.; You, J.; Yang, G.; Xu, Y.; Huang, N.; Wang, X.; Ran, D.; Yuan, X.; Jin, Y.; et al. Permethrin modulates cholinergic mini-synaptic currents by partially blocking the calcium channel. Toxicol Lett 2011, 201, 258–263. [Google Scholar] [CrossRef] [PubMed]
- Abou-Donia, M.B.; Dechkovskaia, A.M.; Goldstein, L.B.; Abdel-Rahman, A.; Bullman, S.L.; Khan, W.A. Co-exposure to pyridostigmine bromide, DEET, and/or permethrin causes sensorimotor deficit and alterations in brain acetylcholinesterase activity. Pharmacol Biochem Behav 2004, 77, 253–262. [Google Scholar] [CrossRef] [PubMed]
- Tsounidi, D.; Soulis, D.; Manoli, F.; Klinakis, A.; Tsekenis, G. AChE-based electrochemical biosensor for pesticide detection in vegetable oils: matrix effects and synergistic inhibition of the immobilized enzyme. Analytical and Bioanalytical Chemistry 2023, 415, 615–625. [Google Scholar] [CrossRef] [PubMed]
- Rose, R.L.; Sparks, T.C. Acephate toxicity, metabolism, and anticholinesterase activity in Heliothis virescens (F.) and Anthonomus grandis grandis (Boheman). Pesticide Biochemistry and Physiology 1984, 22, 69–77. [Google Scholar] [CrossRef]
- Bucur, B.; Munteanu, F.D.; Marty, J.L.; Vasilescu, A. Advances in Enzyme-Based Biosensors for Pesticide Detection. Biosensors (Basel) 2018, 8. [Google Scholar] [CrossRef] [PubMed]
Figure 1.
Schematic illustration of the MQDs-based electrochemical OP biosensor.
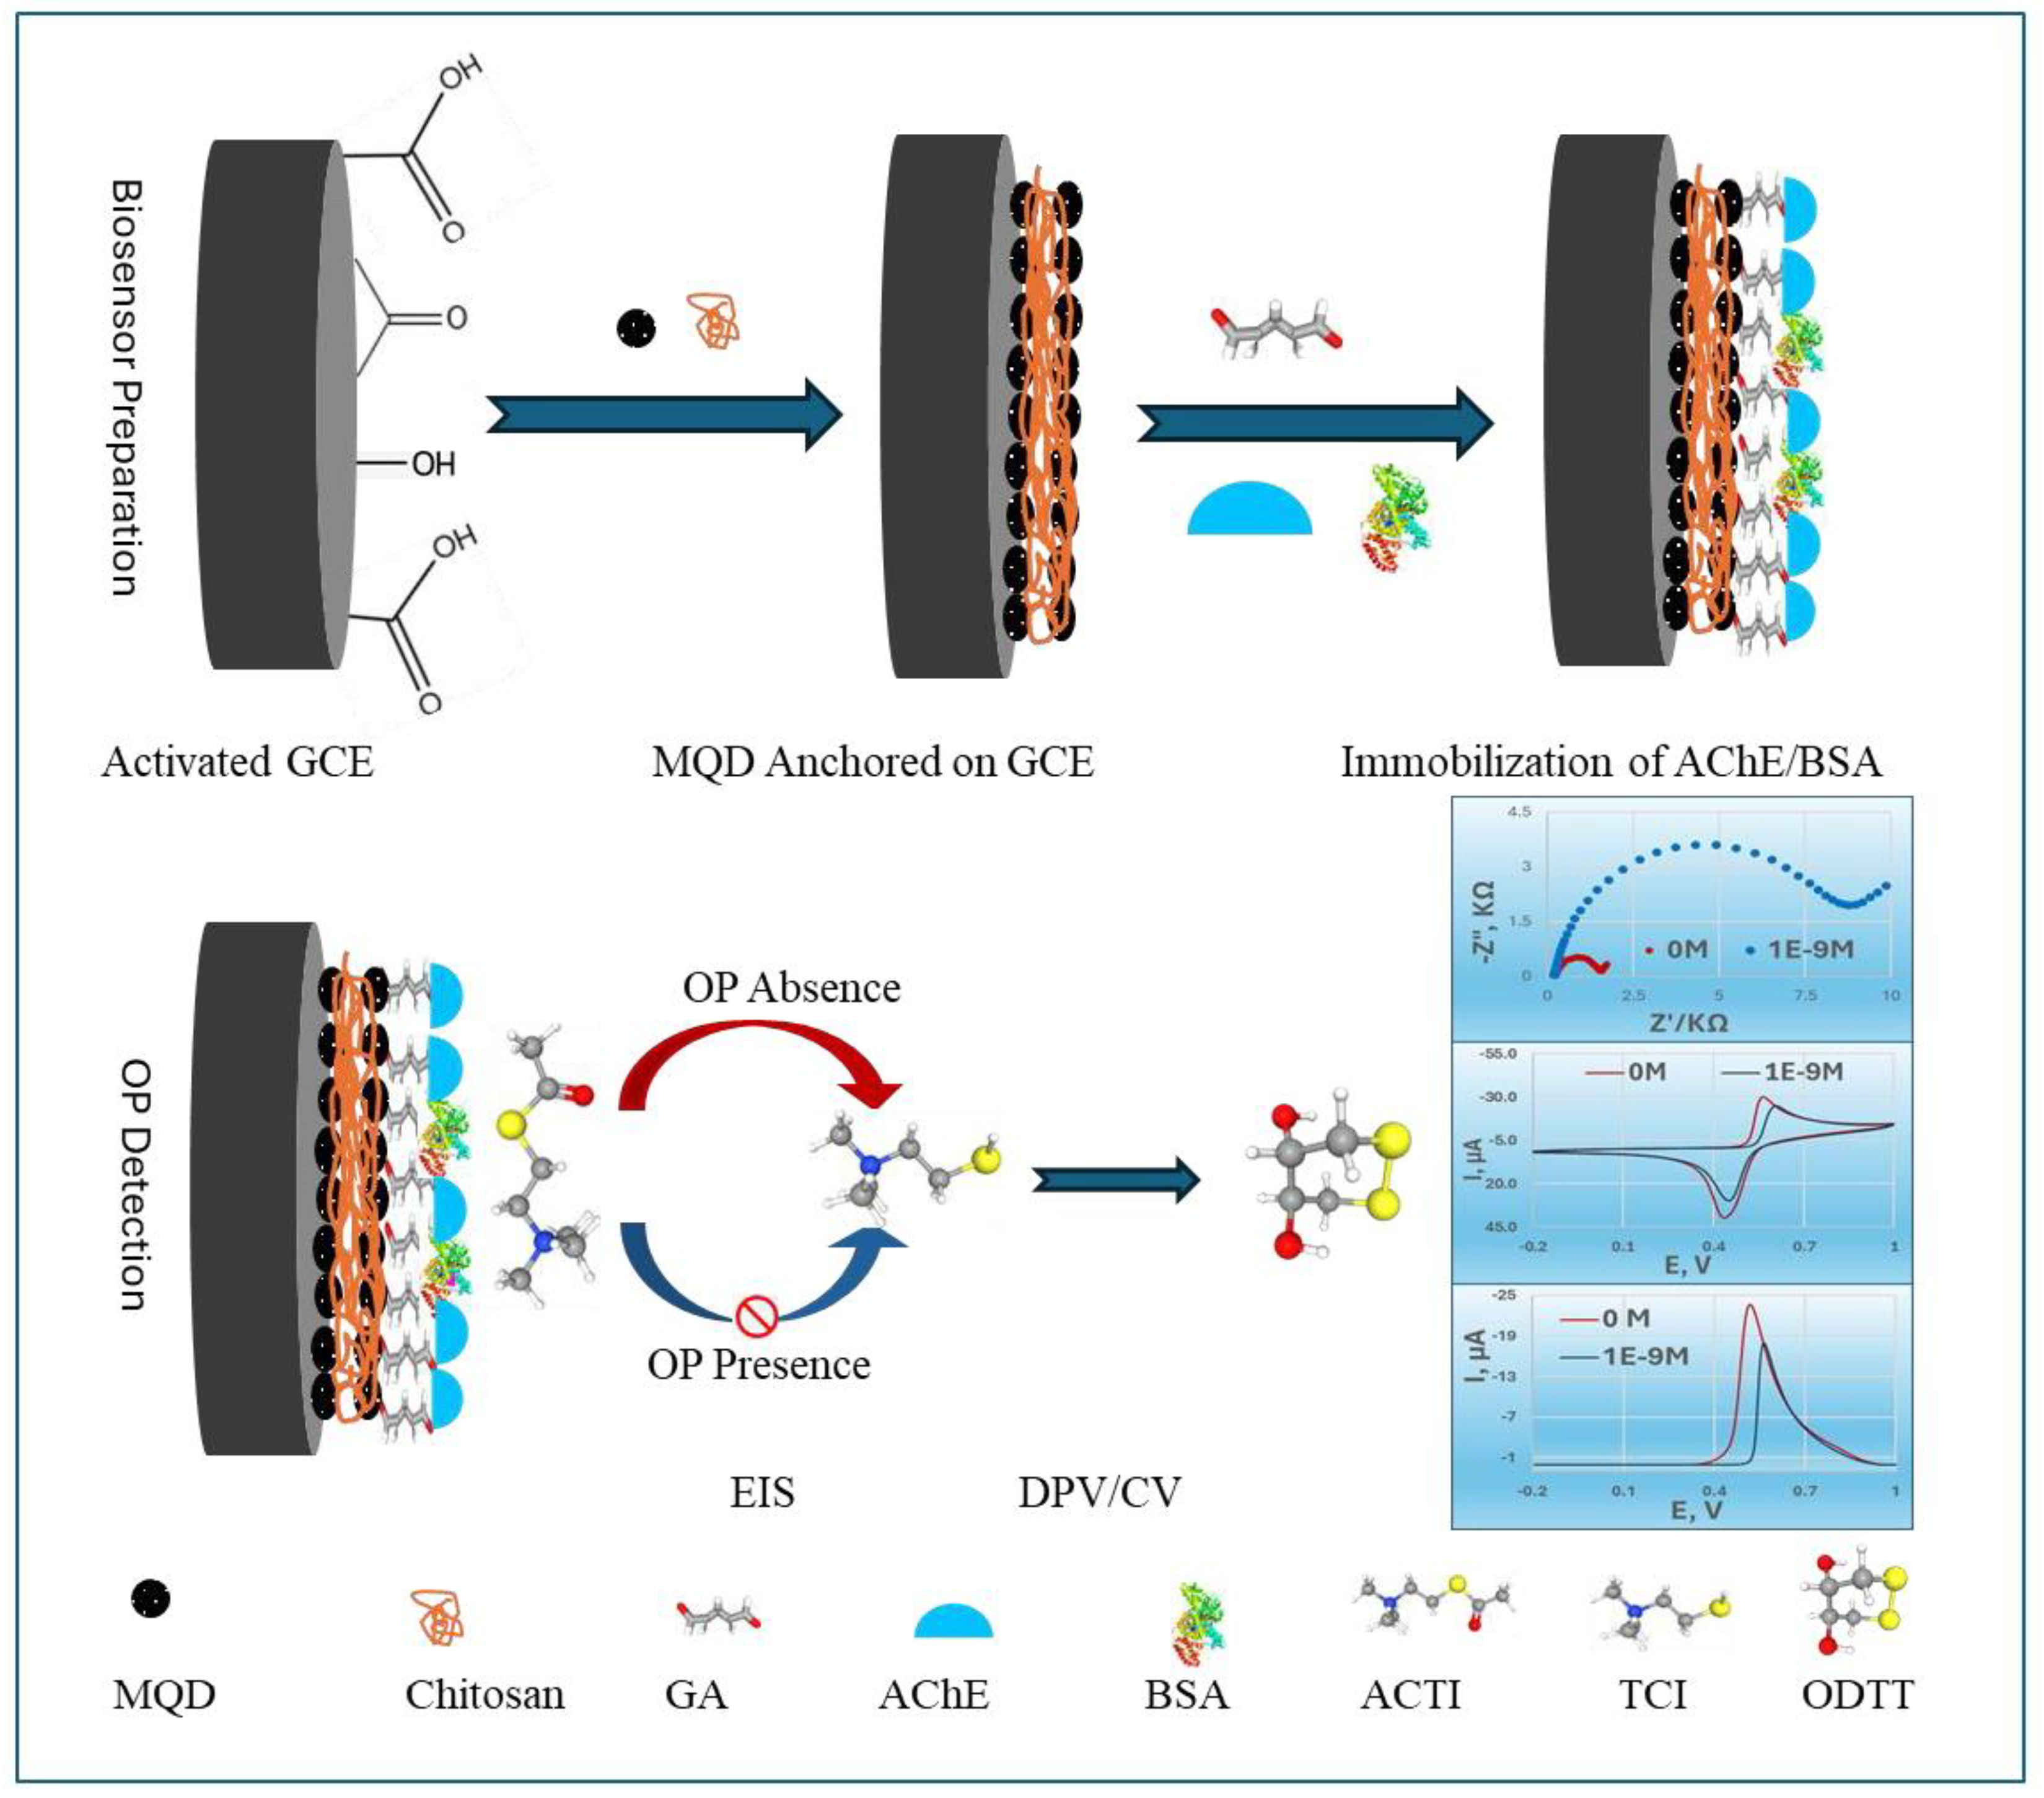
Figure 2.
(a) Schematic representation showing the transformation from MAX phase to Ti₃C₂TX MXene and subsequently to Ti3C2TX MQDs; (b) X-ray diffraction (XRD) patterns of the Ti3AlC2 MAX phase and the corresponding Ti3C2TX MXene 2D sheets after etching; (c) Scanning electron microscopy (SEM) image of layered Ti3C2TX MXene sheets,(d) Atomic force microscopy (AFM) image depicting the morphology of Ti3C2TX MQDs; (e) UV-Vis absorbance and photoluminescence (PL) emission spectra of the synthesized MQDs(insets are MQD solution under visible light and 365 nm UV lamp), (f) Photoluminescence (PL) lifetime profile of the Ti3C2TX MQDs.
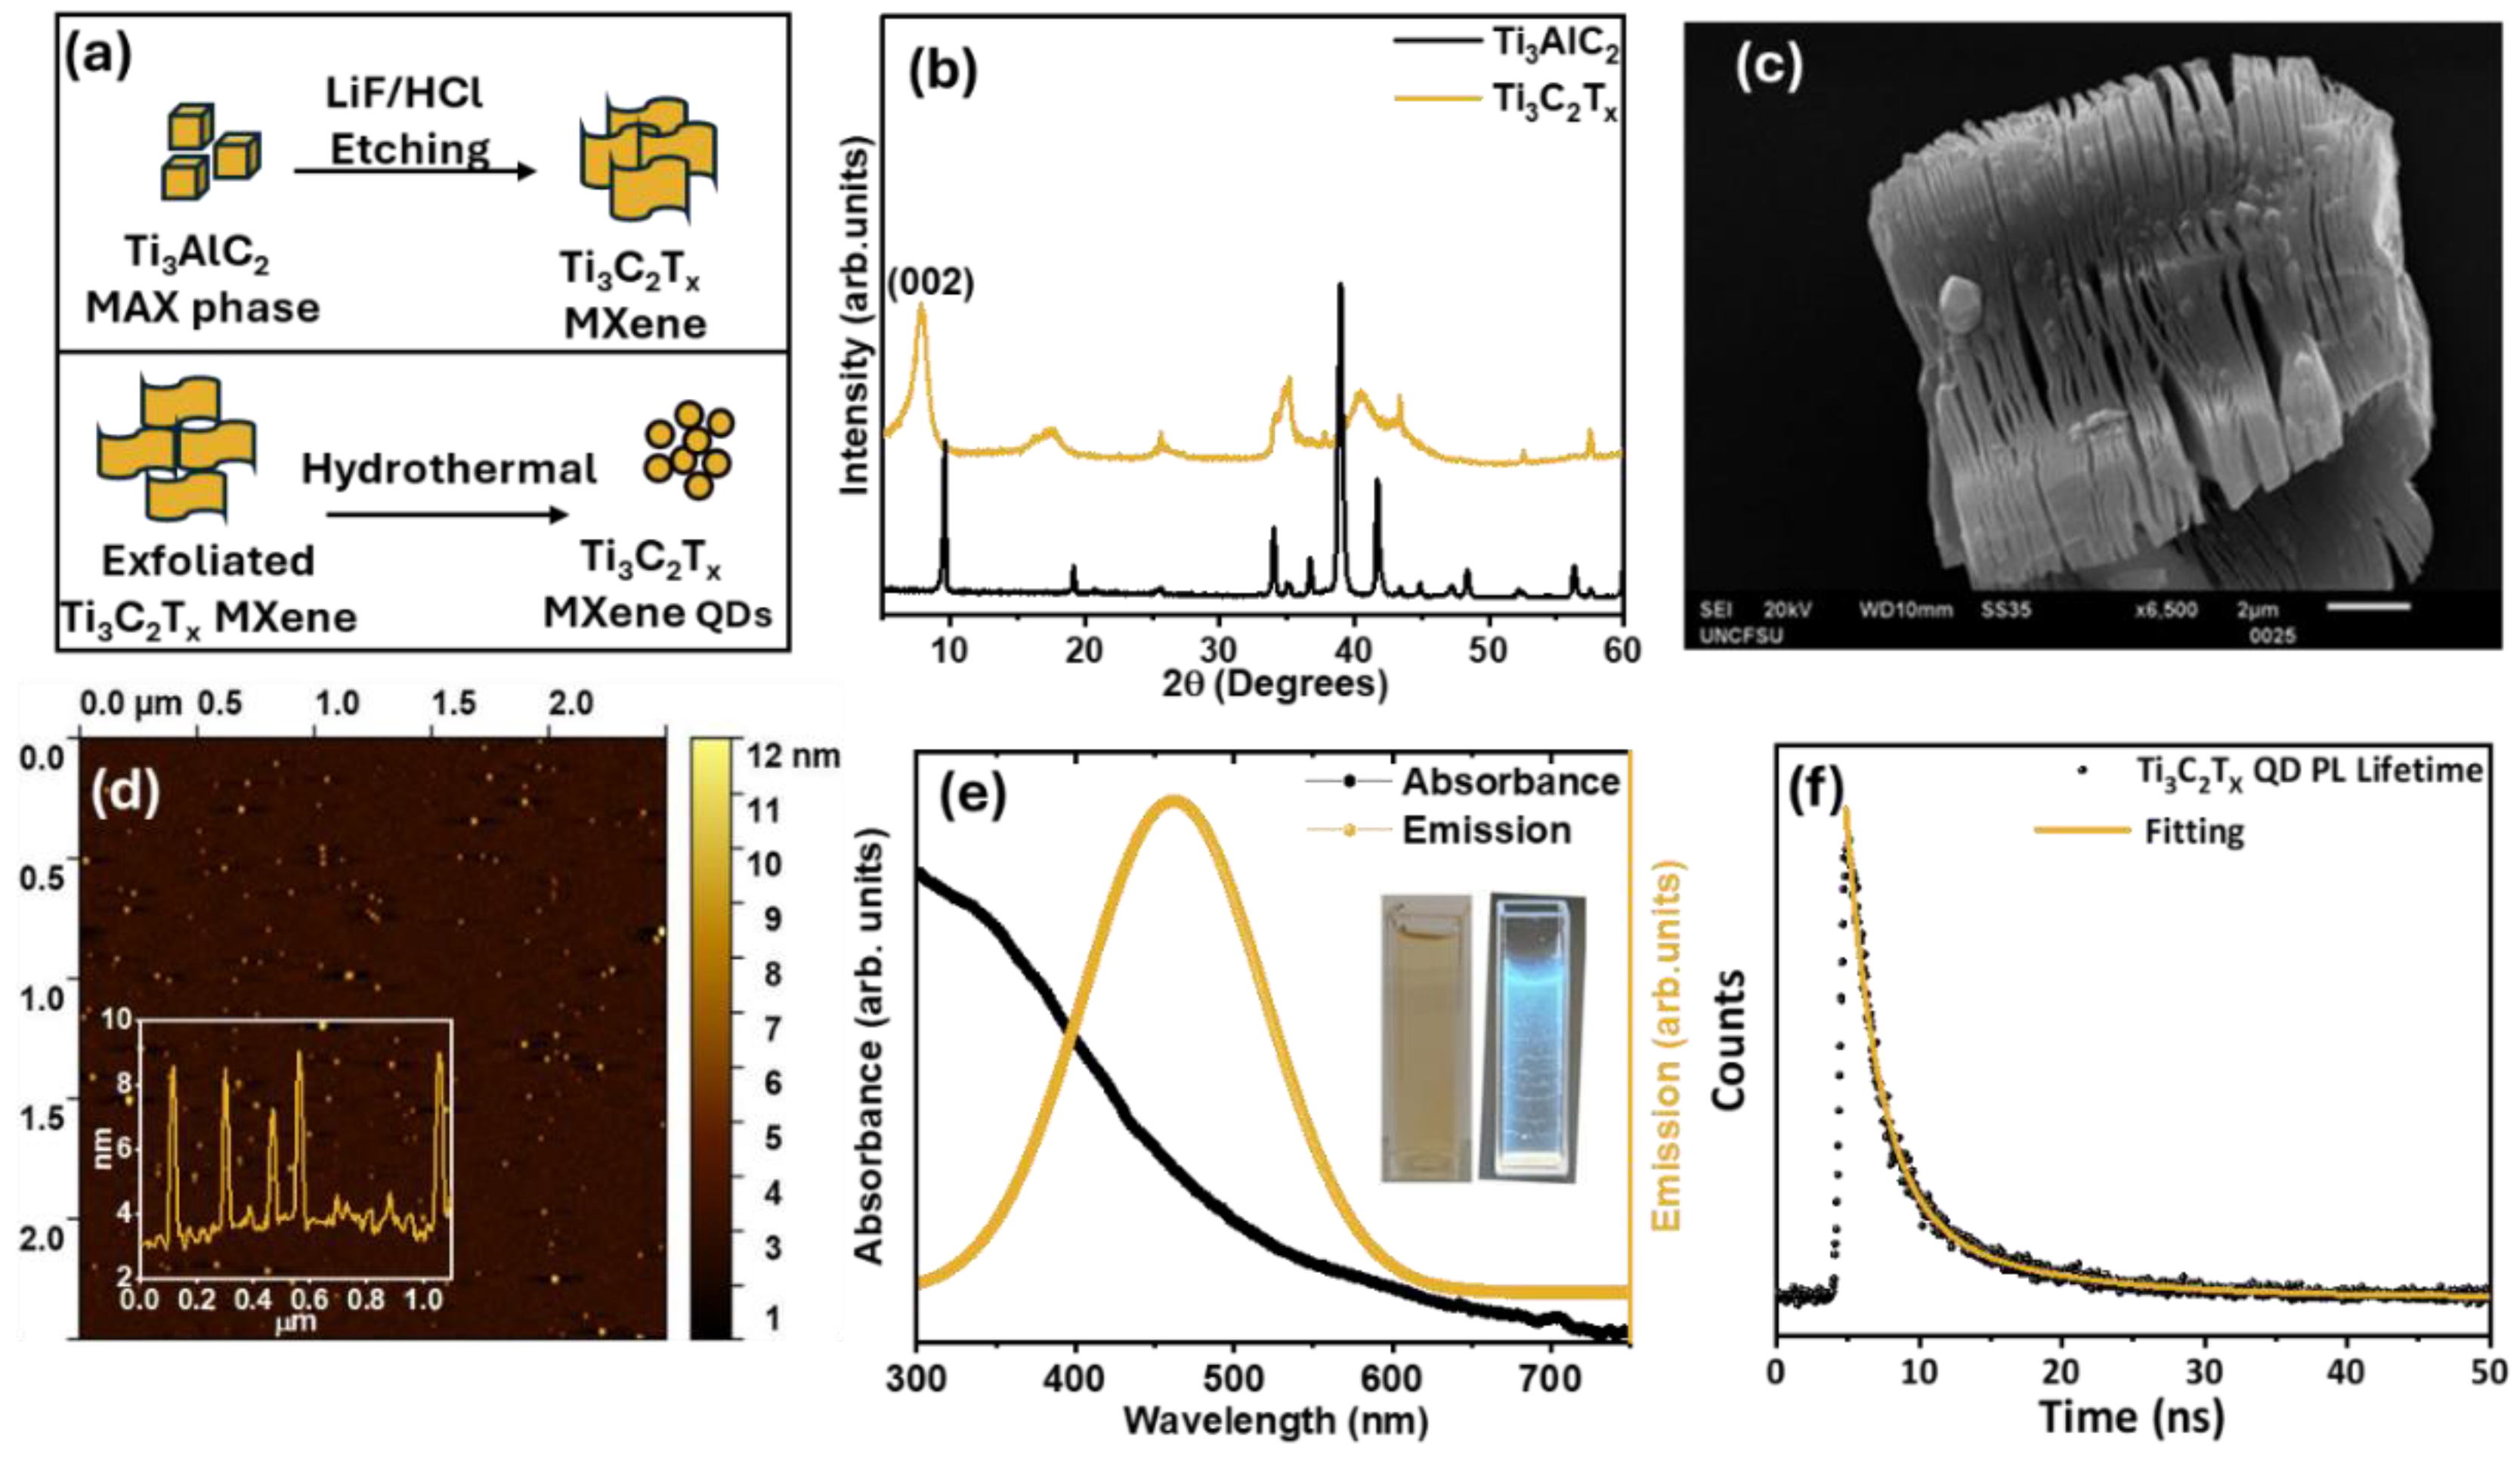
Figure 3.
(a). Nyquist plots from electrochemical impedance spectroscopy (EIS) of the MQD-AChE biosensor for increasing concentrations of CPS; (b). Linear relationship between normalized charge-transfer resistance and log[CPS]; (c). Differential pulse voltammetry (DPV) responses of the biosensor to CPS; (d). Linear relationship between peak current and log[CPS]; (e). Cyclic voltammograms (CV) (scan rate: 25 mV/s) for CPS; (f). Repeated DPV scan of MQD-AChE biosensor in the presence of 1×10⁻⁹ M of CPS concentration at 1,6, 11,16, 21, and 31 min.
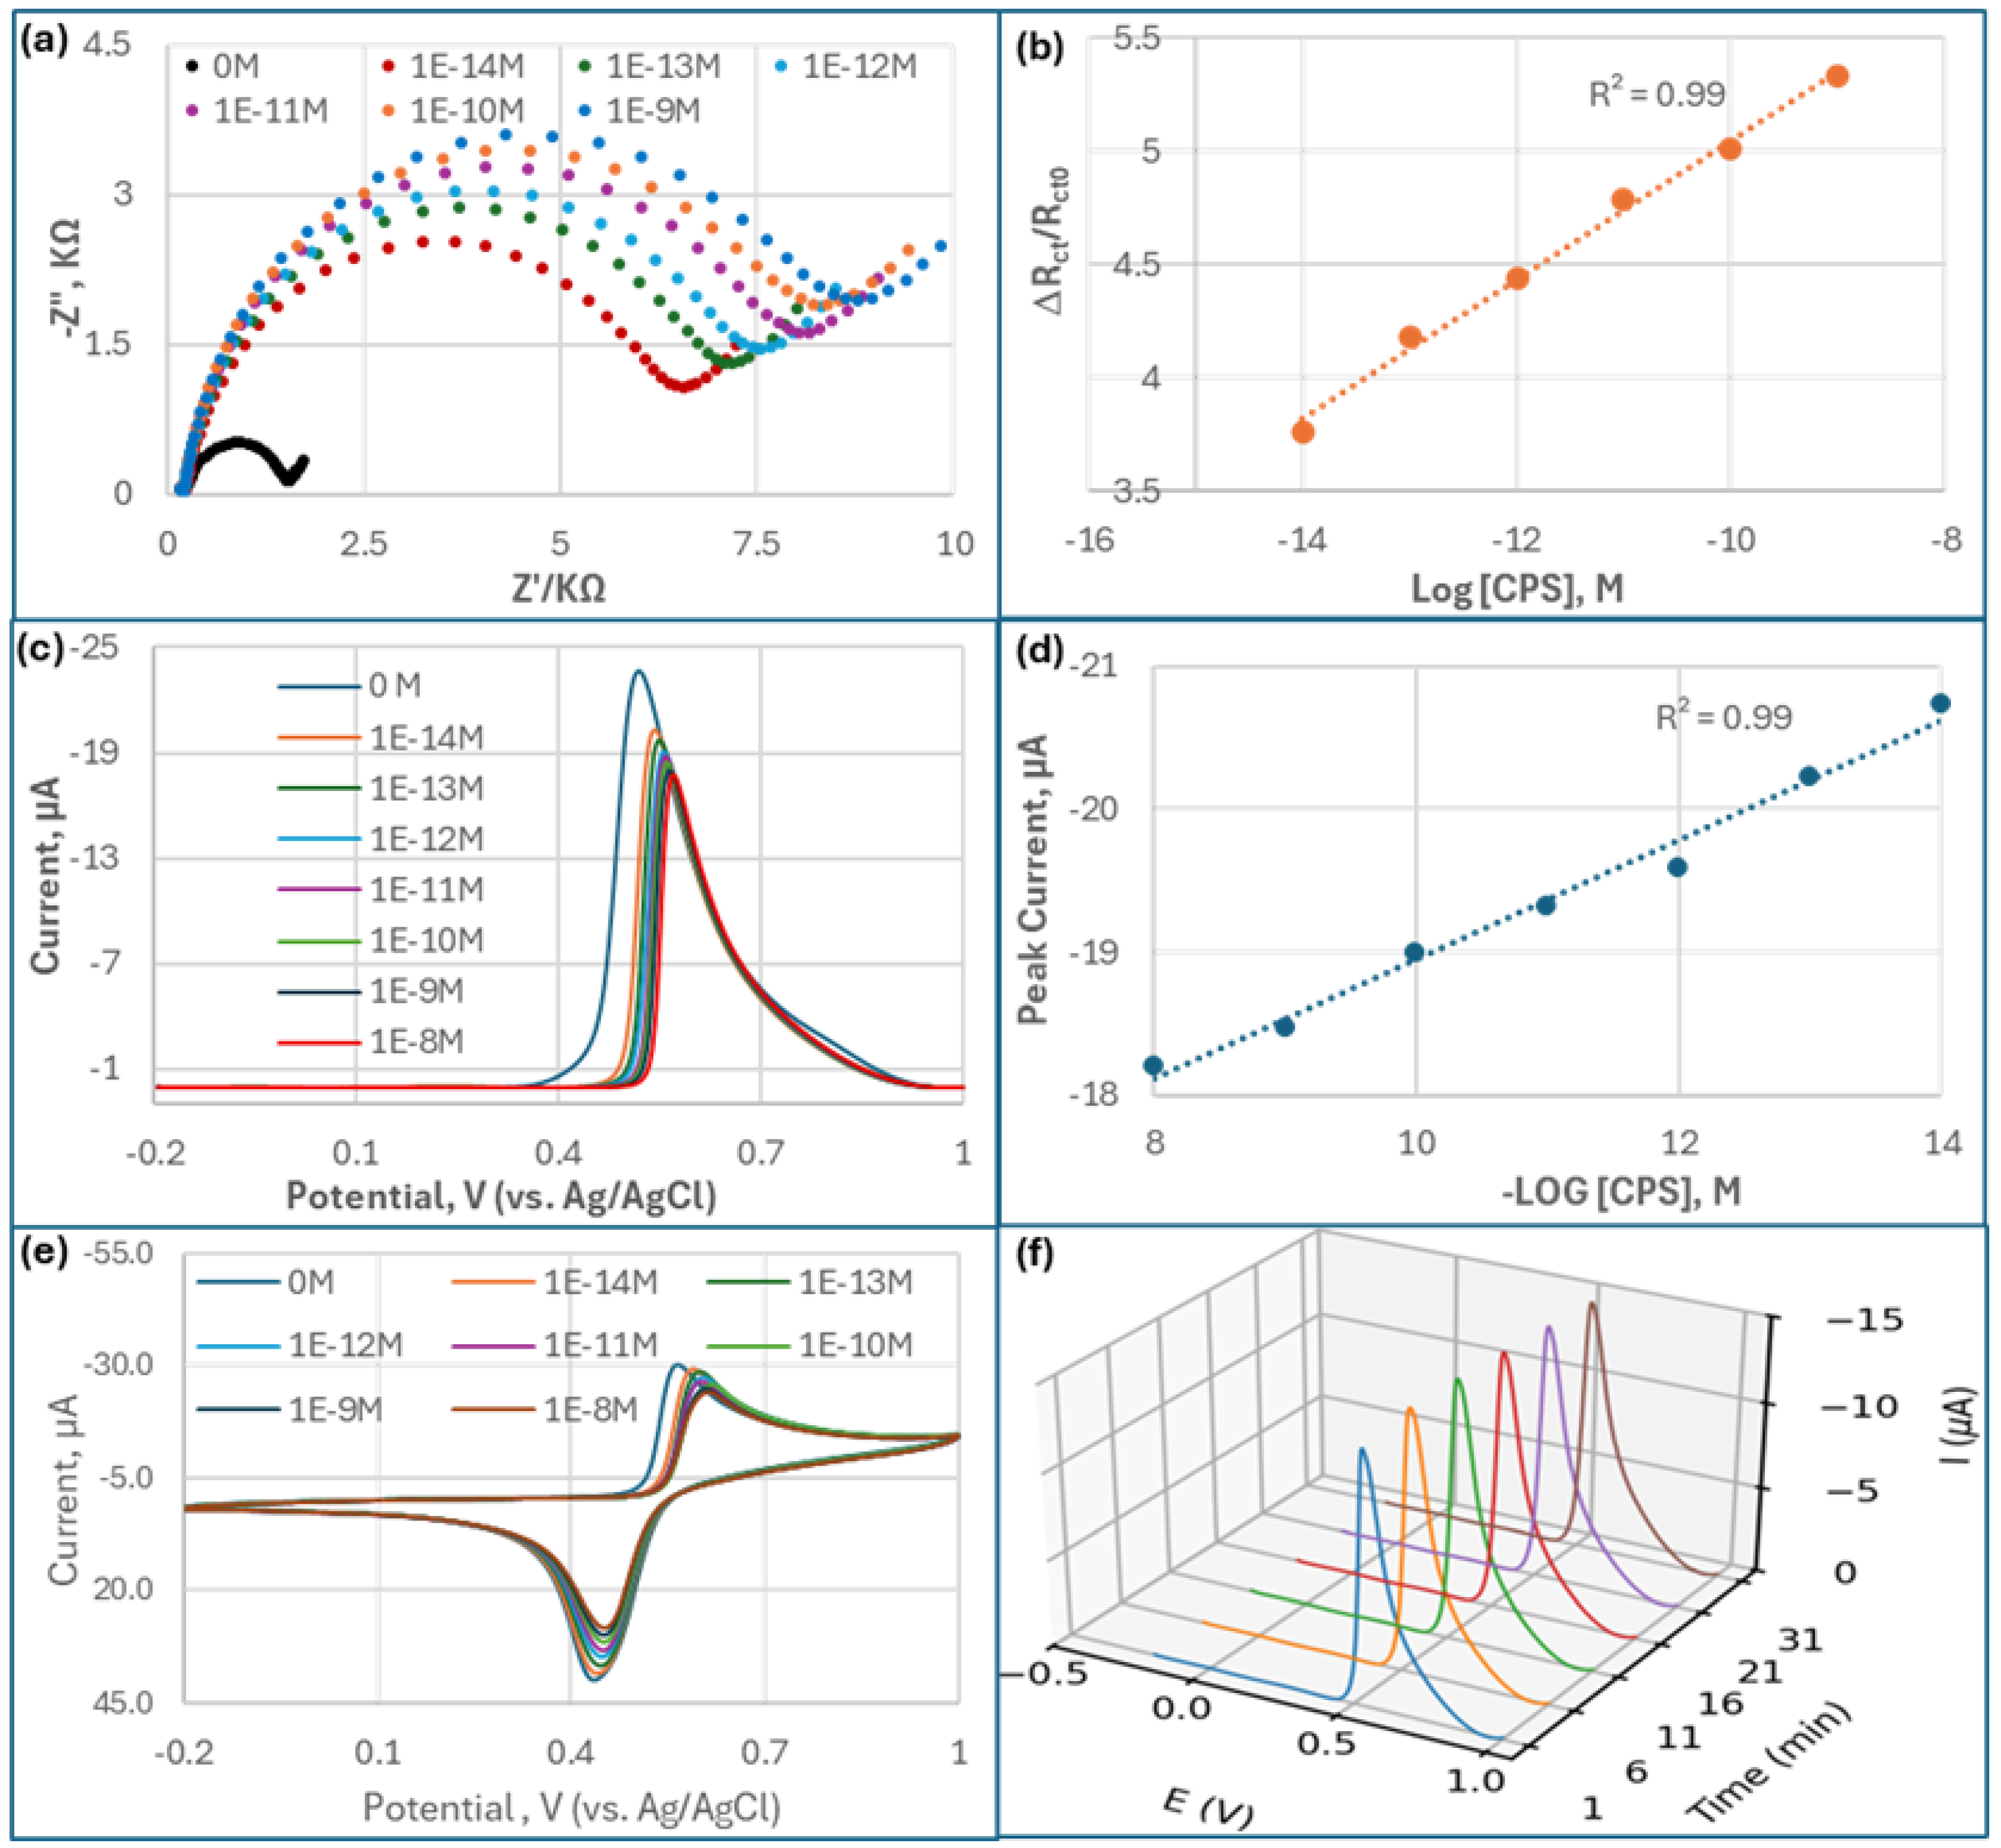
Figure 4.
DPV response of the MQD-based biosensor by adding (a). acephate (ACE); (b). glyphosate (GLY); (c). a negative control, permethrin (PERM).
Figure 4.
DPV response of the MQD-based biosensor by adding (a). acephate (ACE); (b). glyphosate (GLY); (c). a negative control, permethrin (PERM).
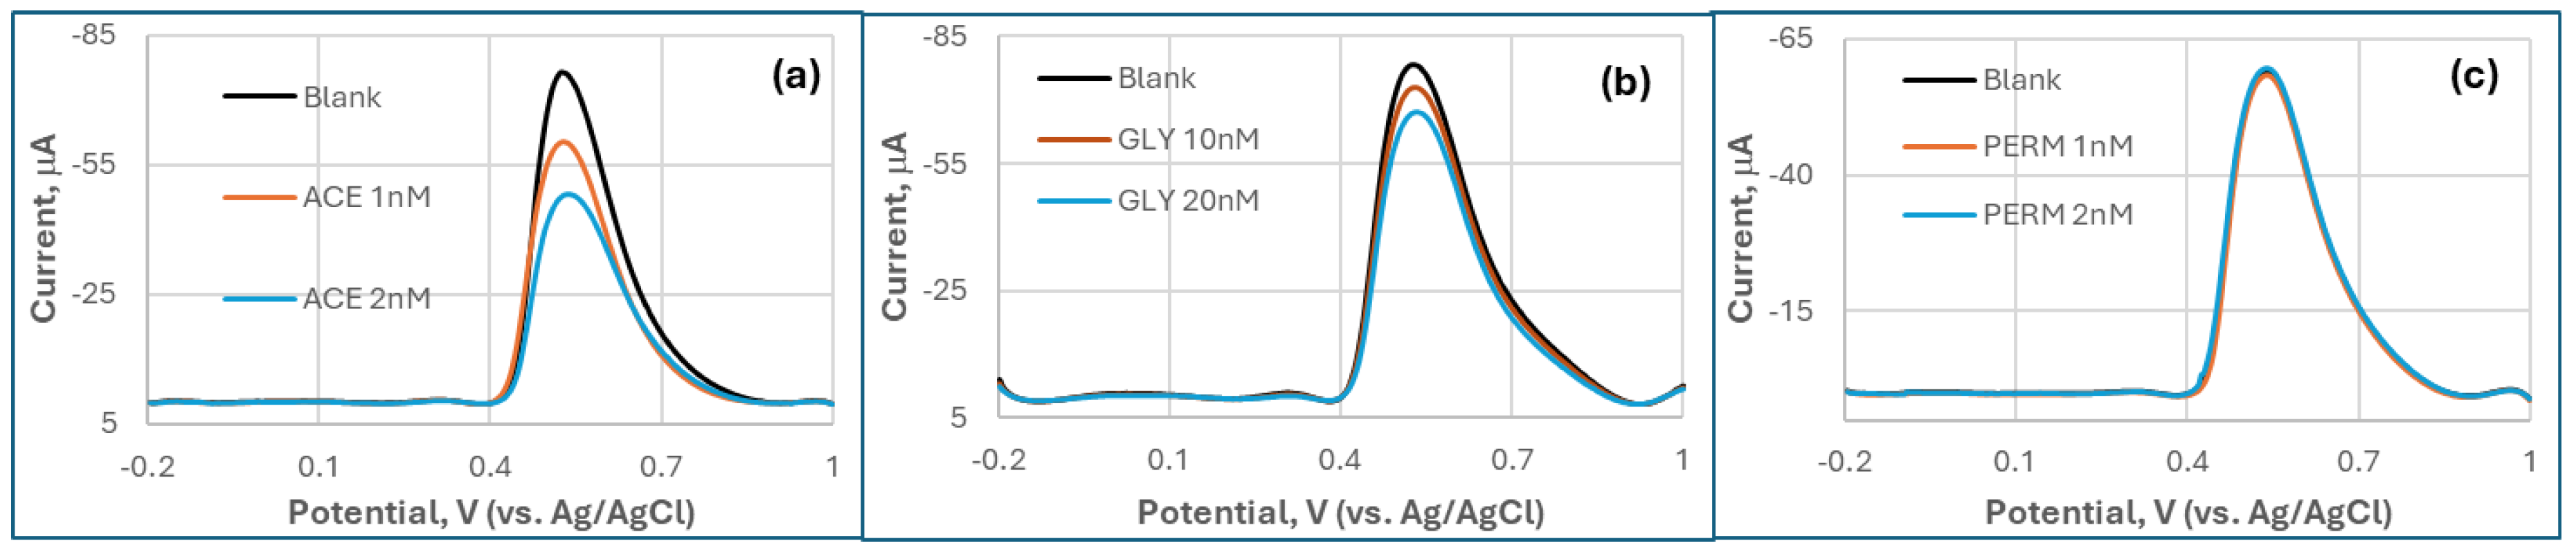
Figure A1.
The equivalent circuit of the MQD-based OP biosensor for the EIS simulation.

Figure A2.
CPS Concentrations responsible to the anodic peak current (Ipa, Blue) and Cathodic peak current (Ipc, Orange) in CV curves.
Figure A2.
CPS Concentrations responsible to the anodic peak current (Ipa, Blue) and Cathodic peak current (Ipc, Orange) in CV curves.

Figure A3.
DPV responses of the MQD-based OP biosensor in homogenized beetle sample solution showed the distinctive inhibition effect for OPs (A: CPS, B: ACE, and C: GLY) compared to the control (D: PERM).
Figure A3.
DPV responses of the MQD-based OP biosensor in homogenized beetle sample solution showed the distinctive inhibition effect for OPs (A: CPS, B: ACE, and C: GLY) compared to the control (D: PERM).

Figure A4.
In Vitro Cholinergic Activity Assay of CPS (green), ACE (red), GLY (cyan), PERM (magenta), and the negative control (blue)in homogenate of Bean Beetles.
Figure A4.
In Vitro Cholinergic Activity Assay of CPS (green), ACE (red), GLY (cyan), PERM (magenta), and the negative control (blue)in homogenate of Bean Beetles.

Disclaimer/Publisher’s Note: The statements, opinions and data contained in all publications are solely those of the individual author(s) and contributor(s) and not of MDPI and/or the editor(s). MDPI and/or the editor(s) disclaim responsibility for any injury to people or property resulting from any ideas, methods, instructions or products referred to in the content. |
© 2025 by the authors. Licensee MDPI, Basel, Switzerland. This article is an open access article distributed under the terms and conditions of the Creative Commons Attribution (CC BY) license (http://creativecommons.org/licenses/by/4.0/).
Copyright: This open access article is published under a Creative Commons CC BY 4.0 license, which permit the free download, distribution, and reuse, provided that the author and preprint are cited in any reuse.


