
Submitted:
25 July 2025
Posted:
28 July 2025
You are already at the latest version
Abstract
A comprehensive UPLC-MS/MS method was developed and validated for the simultaneous separation and quantification of atenolol, propranolol, quinidine, and verapamil, established intestinal permeability standards used in the Caco-2 cell monolayer model. This in vitro model is widely accepted for predicting intestinal drug permeability and is formally recognized by global regulatory agencies, including the FDA, EMA, and WHO, as a surrogate for assessing drug permeability in biowaiver applications under the Biopharmaceutics Classification System (BCS) framework. Despite its regulatory importance, standardized methods for the simultaneous quantification of key permeability markers remain scarce. The selected compounds represent distinct transport pathways: paracellular (atenolol), passive transcellular (propranolol, verapamil), and P-glycoprotein-mediated efflux (quinidine). Method validation followed FDA guidelines and demonstrated high selectivity, linearity (r² > 0.998), precision, and accuracy. Solid-phase extraction enhanced recovery and reduced matrix effects. Application to Caco-2 permeability assays confirmed expected transport profiles, including P-gp inhibition effects with verapamil. By integrating multiple analytes in a single workflow, the method improves analytical throughput, supports mechanistic interpretation, and ensures consistency across assays. This advanced separation strategy, combined with sensitive mass spectrometric detection, supports regulatory and BCS-based classification studies, contributing to the standardization of permeability assessments in drug development.

Keywords:
advanced chromatography
; caco-2 cell monolayer
; drug absorption prediction
; efflux transporter
; intestinal permeability standards
; P-gp inhibition
; regulatory applications
; tandem mass spectrometry
1. Introduction
The Caco-2 cell monolayer model is widely employed in the pharmaceutical industry as an in vitro system to evaluate intestinal drug permeability and elucidate transport mechanisms [1,2]. Its broad acceptance by major regulatory agencies, including the United States Food and Drug Administration (FDA), the European Medicines Agency (EMA), the World Health Organization (WHO), and the Brazilian Health Regulatory Agency (ANVISA), underscores its reliability and relevance for predicting in vivo drug absorption [3,4,5]. These agencies formally recognize the Caco-2 model as a regulatory-acceptable in vitro surrogate for assessing drug permeability, particularly in the context of biowaiver applications under the Biopharmaceutics Classification System (BCS) [1].
Studies have shown that Caco-2 monolayers accurately mimic drug transport across the intestinal epithelium, especially for compounds that undergo passive transcellular diffusion, which exhibits the strongest correlation with in vivo conditions [6,7]. Furthermore, the model’s capacity to simulate key gastrointestinal transport mechanisms has established it as an indispensable tool for predicting human drug absorption [7].
Among the various compounds studied using this model, atenolol is widely recognized as a reference drug for low permeability, particularly in investigations of passive transport. As a BCS Class III compound, atenolol is highly soluble but poorly permeable. Its absorption occurs via both transcellular and paracellular routes, making it a relevant standard for demonstrating the Caco-2 model’s ability to predict drug transport and absorption [7,8,9,10].
In contrast to atenolol, propranolol is recognized as a key example of high-permeability drugs, primarily absorbed through passive transcellular pathways. Propranolol has been extensively cited as a high-permeability marker in foundational studies, including the BCS framework proposed by Amidon et al. [11] and has been further emphasized in regulatory guidelines (e.g., FDA) [4,7] and comprehensive reviews such as those by Zheng and co-authors [10].
Verapamil and quinidine, while also showing high permeability, are of particular interest due to their interactions with P-glycoprotein (P-gp), a key efflux transporter involved in drug absorption [12]. Verapamil, frequently mentioned in studies such as Anderle et al. [13] and Dahlgren et al. [8], stands out as a dual-purpose marker, illustrating both high permeability and its role as a P-gp inhibitor. Similarly, quinidine highlights how active efflux can shape drug transport, as discussed in studies addressing transporter-mediated drug interactions [14].
Collectively, these compounds, atenolol, propranolol, verapamil, and quinidine, illustrate the versatility of the Caco-2 model in studying both passive diffusion and transporter-mediated mechanisms. They provide critical insights into the processes governing intestinal drug absorption [14]. However, despite their widespread use of these permeability standards, a unified, robust analytical method capable of quantifying them simultaneously has remained limited.
To address this gap, the present study reports the development and validation of a novel UPLC-MS/MS method for the simultaneous separation and quantification of atenolol, propranolol, quinidine, and verapamil (Figure 1), four well-established permeability reference compounds in the Caco-2 cell monolayer model. This comprehensive multianalyte method enables accurate and precise quantification of compounds representing a range of permeability and transporter profiles. By allowing simultaneous measurement, the method improves analytical throughput, improves consistency, and supports more rigorous permeability assessments. These advances are particularly valuable in regulatory and biowaiver contexts, where methodological standardization and analytical robustness are paramount.
2. Results and Discussion
2.1. Bioanalytical Method Validation
2.1.1. Selectivity, Linearity, Carryover, Precision and Accuracy
To ensure reliable permeability measurements in Caco-2 cells, a robust bioanalytical method is required to detect analytes across a wide dynamic range and within complex biological matrices. Our validated UPLC-MS/MS method fulfilled these criteria.
The method exhibited excellent selectivity, with no interfering peaks observed at the retention times of the analytes or the internal standard (IS) in any of the tested matrices. Selectivity was confirmed using blank apical and basolateral matrices, as well as matrices spiked at the lower limit of quantification (LLOQ) for each analyte (Figure 2; Figure S1, Supplementary Materials). This specificity ensures unambiguous separation and quantification of standards in permeability assays involving Caco-2 cell monolayers.
Linearity was confirmed across all analytes, with correlation coefficients ranging from 0.998 to 1.000 (Table 1). The regression residuals were normally distributed with no lack of fit (p > 0.05), indicating that the model is statistically robust and reliable across the entire tested concentration range.
The method demonstrated high sensitivity, with lower limits of quantification (LLOQs) meeting FDA acceptance criteria (coefficient of variation [CV] ≤ 20%; accuracy within ± 20%). This sensitivity is particularly important in Caco-2 assays, where analytes may be present at low concentrations due to limited accumulation or transport, depending on their permeability characteristics.
No carryover was observed following high-concentration injections (Figure 3), ensuring sample-to-sample integrity, a critical requirement for multi-analyte quantification in sequential permeability assessments.
Intra- and inter-day reproducibility were confirmed, with CV% and relative error (RE%) within regulatory thresholds (Table 2), underscoring the method’s reliability for longitudinal studies involving multiple time points or biological replicates.
Collectively, these results validate the method’s suitability for the simultaneous separation and quantification of both low- and high-permeability markers in Caco-2 cells, enabling comprehensive modeling of passive and active transport mechanisms.
2.1.2. Recovery, Matrix Effect, Stability and Robustness
Sample preparation is a common challenge in permeability studies due to the complexity of biological matrices. In this study, solid-phase extraction (SPE) was employed to improve analyte recovery and minimize matrix effects.
Extraction efficiency was consistently high, with recovery ranging from 85.99% to 98.04% (Table S1, Supplementary Materials), confirming effective analyte extraction from both apical and basolateral compartments. Internal standard-normalized matrix factors (ranging from 0.94 to 1.16) and low CVs (1.37–6.47%) indicated minimal matrix interference (Table 3).
Although some slope variability was observed for certain analytes (e.g., atenolol, verapamil; Figure S2, Supplementary Materials), this is consistent with known matrix-dependent effects. Therefore, calibration within matrix is recommended, particularly for high-precision UPLC-MS/MS quantification.
SPE proved essential not only for improving signal clarity but also for standardizing sample preparation across varying assay conditions, an important factor in ensuring reproducibility in in vitro permeability studies. This approach supports the findings of Ötles and Kartal [15], who emphasized SPE’s ability to selectively isolate target compounds while mitigating interference from complex matrices. These advantages underscore the value of SPE as an integral component of bioanalytical workflows, particularly when accurate quantification of multiple analytes is required.
Stability assessments demonstrated consistent analyte recovery under various storage and handling conditions (Table S2, Supplementary Materials), with recoveries ranging from 84.8% to 98.65%. The method remained robust to minor variations in solvent composition (Table S3, Supplementary Materials), although deviations were observed at the LLOQ for propranolol and quinidine. These variations remained within acceptable limits, emphasizing the importance of strict solvent control in analytical workflows.
Overall, the method showed excellent stability and robustness, making it suitable for bioanalytical applications that involve repeated measurements, long-term storage, or freeze–thaw cycles.
2.2. TEER Results and Monolayer Integrity
The integrity of the Caco-2 monolayer was monitored using transepithelial electrical resistance (TEER) throughout the 21-day differentiation protocol. TEER values stabilized at approximately 900 Ω·cm² by day 9 and remained steady through day 21 (Figure S3, Supplementary Materials), confirming the formation of tight junctions and full monolayer differentiation.
Following the 4-hour permeability assays, TEER values were measured again to confirm the monolayer’s structural integrity. In accordance with established guidelines and literature recommendations [16], only monolayers with TEER values between 500 and 1100 Ω·cm² before and after the assay were considered acceptable and included in the analysis, ensuring data reliability and preserving the physiological relevance of the permeability results.
Maintaining monolayer integrity is essential for distinguishing between paracellular and transcellular transport, further underscoring the importance of rigorous quality control in Caco-2-based permeability studies.
2.3. Cell Viability and Cytotoxicity Assessment
Lactate dehydrogenase (LDH) assays confirmed that atenolol, verapamil (50 µM), quinidine (20 µM), and propranolol (5 µM) did not induce cytotoxicity (Figure S4, Supplementary Materials). These concentrations are thus suitable for permeability studies, preserving both monolayer integrity and cellular viability.
2.4. Application to Permeability Assessment and Efflux Ratio Results
The bidirectional apparent permeability (Papp) of propranolol, quinidine, and atenolol was evaluated under A→B (apical to basolateral) and B→A (basolateral to apical) conditions, both with and without the P-glycoprotein (P-gp) inhibitor verapamil. Verapamil, a well-established P-gp inhibitor, was employed to investigate the contribution of efflux transport to the directional permeability of these analytes. This experimental design enabled the differentiation of transport mechanisms, including passive diffusion and P-gp-mediated efflux, within the intestinal monolayer. Separately, verapamil’s transport properties were assessed without the addition of an external inhibitor to provide a clear understanding of its intrinsic bidirectional permeability.
Propranolol and verapamil showed high A→B and B→A Papp values (Figure 4) with efflux ratios close to 1 (Figure 5), indicating predominant passive transcellular transport consistent with BCS Class I classification [10,17].
Quinidine displayed directional transport characteristic of active efflux via P-gp. Co-administration with verapamil increased A→B transport and reduced B→A movement, confirming P-gp inhibition and demonstrating the model’s ability to detect transporter interactions.
Atenolol consistently showed moderate permeability in both directions, unaffected by P-gp inhibition, confirming its paracellular transport route and validating its role as a moderate permeability standard [7,9].
These findings are in line with the known pharmacokinetic properties of each compound and highlight the method’s utility in differentiating between passive diffusion and transporter-mediated processes.
While many studies have focused on specific molecule transport (e.g., [18,19,20,21,22,23,24,25,26]), few have developed integrated approaches using permeability standards. Even when such standards are employed, most methods require separate assays or provide limited mechanistic insight.
Logoyda et al. [27] addressed this gap with a method for verapamil, while Venkatesh et al. [28] analyzed all four standards via RP-HPLC. However, these approaches are limited by lower sensitivity and selectivity.
In contrast, the present UPLC-MS/MS method enables the simultaneous separation and quantification of multiple standards with superior sensitivity, allowing direct comparisons across diverse transport mechanisms. This represents a significant advancement for both mechanistic investigations and regulatory applications. The inclusion of atenolol, propranolol, quinidine, and verapamil allows for a comprehensive assessment of key drug transport pathways.
By leveraging the capabilities of triple quadrupole mass spectrometry in multiple reaction monitoring (MRM) mode, originally introduced by Yost and Enke [29], this method delivers high specificity, sensitivity, and throughput. Its successful application in Caco-2 permeability assays underscores the essential role of mass spectrometry in contemporary pharmacokinetic research.
3. Materials and Methods
3.1. Reagents and Equipment
Caco-2 human colorectal adenocarcinoma cells (CRL-2102) were obtained from the Rio de Janeiro Cell Bank (BCRJ, Rio de Janeiro, Brazil). Cells were cultured in Dulbecco’s Modified Eagle Medium (DMEM) supplemented with fetal bovine serum (FBS), non-essential amino acids (NEAA) (both from Gibco™, Thermo Fisher Scientific, Grand Island, NY, USA), and penicillin-streptomycin (Sigma-Aldrich, St. Louis, MO, USA).
Trypsin (Gibco™) and phosphate-buffered saline (PBS; Gibco™) were used during routine cell maintenance. Cytotoxicity was evaluated using a lactate dehydrogenase (LDH) detection kit (Roche Applied Science, Mannheim, Germany). Dimethyl sulfoxide (DMSO, 1% v/v) and Triton X-100 (2% v/v) (both from Sigma-Aldrich) were used in cytotoxicity assays performed with a microplate spectrophotometer (Biochrom Ltd., Cambridge, UK). Hank’s Balanced Salt Solution (HBSS) containing 2-(N-morpholino) ethanesulfonic acid (MES) and N-(2-hydroxyethyl)piperazine-N′-(2- ethanesulfonic acid) (HEPES) buffers was purchased from Sigma-Aldrich. Methanol (MeOH) and acetonitrile (ACN) were obtained from Fisher Scientific (Waltham, MA, USA), and ultrapure water was generated using a Milli-Q system (MilliporeSigma, Burlington, MA, USA).
Samples from permeability assays were prepared using Discovery DSC-18 solid-phase extraction (SPE) cartridges (500 mg, 3 mL; Sigma-Aldrich). Analytical standards included atenolol, quinidine, propranolol, hydrochloride verapamil, and metoprolol (internal standard-IS), all from Sigma-Aldrich. Key equipment included Transwell® plates with 1 μm polycarbonate membranes, centrifuge tubes, and cell culture plates from Corning Costar (Corning, NY, USA). Samples were processed using refrigerated centrifuges (Eppendorf, Hamburg, Germany), and analyses were conducted on an Ultra-performance liquid chromatography-tandem mass spectrometry system (UPLC-MS/MS, Waters Xevo TQ-S, Milford, MA, USA) equipped with Ascentis® Express C18 column (10 cm × 4.6 mm, 2.7 μm). Monolayer integrity was monitored using an EVOM2 TEER measurement device (World Precision Instruments, Sarasota, FL, USA).
3.2. Instrumental Analytical Conditions
Separation and quantification of atenolol, propranolol, quinidine, and verapamil were performed using UPLC- MS/MS. Chromatographic separation employed a mobile phase consisting of (A) water with 0.1% formic acid, (B) methanol with 0.1% ammonium hydroxide, and (C) acetonitrile with 0.1% formic acid. The flow rate was maintained at 0.350 mL/min using a gradient program starting with 45% B and 5% C, increasing to 92% B and 3% C by 6 minutes, and returning to the initial conditions by 16 minutes. The injection volume was set to 10 μL.
Detection was carried out in multiple reaction monitoring (MRM) mode using electrospray ionization (ESI) in positive mode. Source parameters included an interface temperature of 150°C, a desolvation line temperature of 300°C, and a nebulizer gas flow of 7.00 and 6.68 Bar. These settings were optimized to achieve precise and reproducible analyte quantification. Specific MRM transitions and MS parameters are provided in the supplementary data (Table S4).
3.3. Bioanalytical Method Validation
The bioanalytical method used to separate and quantify atenolol, propranolol, quinidine, and verapamil in samples from intestinal permeability assays was validated in compliance with the FDA Bioanalytical Method Validation Guidance for Industry [30]. The validation process involved evaluating selectivity, linearity, precision, accuracy, recovery, matrix effects, stability, and robustness. All steps were conducted using metoprolol as the internal standard and performed within a biological matrix to ensure reliability and relevance to experimental conditions. Analytes were quantified based on peak area ratios relative to the internal standard.
3.3.1. Selectivity
Selectivity was assessed by analyzing blank matrix samples to confirm the absence of interfering peaks at the retention times of the analytes and internal standard. Specificity was confirmed by comparing chromatograms from blanks, matrix-spiked samples, and solvent standards [30].
3.3.2. Linearity
Calibration curves were prepared using pooled samples for atenolol (25.4–600 ng/mL), propranolol (25.4–600 ng/mL), quinidine (12.7–406.3 ng/mL), and verapamil (600–6500 ng/mL), covering the expected dynamic range for intestinal permeability studies. The relationship between analyte concentration and detector response was evaluated using least squares regression to ensure linearity. At least 75% of the calibration points were required to meet the acceptance criteria of being within ±15% of the nominal values, with a slightly broader allowance of ±20% at the Lower Limit of Quantification (LLOQ).
3.3.3. Carryover Analysis
Carryover analysis was performed in accordance with FDA guidelines to verify the absence of significant residual analyte interference between injections. High concentration samples at the upper limit of quantification (ULOQ) were injected for atenolol (600 ng/mL), quinidine (406.3 ng/mL), propranolol (6500 ng/mL), and verapamil (6500 ng/mL), followed directly by blank samples. The blank samples were evaluated to ensure that residual signals remained below the acceptable thresholds.
3.3.4. Precision and Accuracy
Precision and accuracy were evaluated using quality control (QC) samples prepared at four concentration levels: LLOQ, low, medium, and high. The concentrations used were 25.4 ng/mL (LLOQ), 76.2 ng/mL (low), 312.7 ng/mL (medium), and 450 ng/mL (high) for atenolol and propranolol; 12.7 ng/mL (LLOQ), 38.1 ng/mL (low), 209.5 ng/mL (medium), and 304.73 ng/mL (high) for quinidine; and 600 ng/mL (LLOQ), 900 ng/mL (low), 3550 ng/mL (medium), and 4875 ng/mL (high) for verapamil. Intra-assay precision was assessed by analyzing QC samples within the same analytical run, while inter-assay precision was determined across multiple runs. Accuracy was evaluated by comparing the measured concentrations to their nominal values, ensuring adherence to predefined acceptance criteria.
3.3.5. Recovery and Matrix Effects
Recovery was determined by comparing the signal of extracted samples to that of unextracted standards at the same concentrations. Matrix effects were assessed by comparing signals from matrix-spiked samples with those from neat solutions.
3.3.6. Stability
Stability studies were conducted to evaluate the behavior of atenolol, quinidine, propranolol, and verapamil under different conditions. These tests included assessing short-term stability at room temperature, long-term stability during storage at −20°C for up to 45 days, and stability across three freeze-thaw cycles. Additionally, the stability of the analytes was tested in the media used for intestinal permeability assays, specifically HBSS with MES and HEPES buffers at pH 6.0 and 7.4.
3.3.7. Robustness
Robustness was evaluated by introducing small, deliberate variations in analytical parameters, such as flow rate of the mobile phase (±2%), column temperature (±3°C), and mobile phase pH (±0.05 units). These tests ensured that the method’s performance was unaffected by minor operational deviations.
3.4. Cytotoxicity Assays
Cytotoxicity was assessed using the LDH release assay adapted from Li et al. [31,32]. In summary, LDH released into the extracellular environment catalyzes the reduction of NAD+ to NADH and H+ through the oxidation of lactate to pyruvate. Subsequently, a catalyst (diaphorase) transfers H/H+ from NADH + H+ to a tetrazolium salt (iodonitrotetrazolium, INT), resulting in the formation of a red-colored formazan product [33]. Test compounds were dissolved in DMSO at a final concentration of 1% (v/v) in HBSS with 10 mM MES buffer (pH 6.0). Triton X-100 (2% v/v) served as a positive control to induce complete cell lysis. The cells were incubated with the test solutions for 4 hours at 37°C, and LDH release into the supernatant was measured using a commercial LDH detection kit, following the manufacturer’s instructions. Absorbance was recorded at 490 nm using a microplate spectrophotometer. Cytotoxicity was calculated as a percentage of total LDH release using the formula 1 [32]:
Cytotoxicity (%) = Sample LDH Release − Background × 100
Total LDH Release – Background
Total LDH Release – Background
All experiments were conducted in triplicate, with the results expressed as mean values accompanied by standard deviations.
3.5. Caco-2 Cell Permeability Assay
Caco-2 cells were cultured in DMEM supplemented with 10% FBS, 1% NEAA, and antibiotics. The cells were seeded at a density of 1 × 10⁵ cells/cm2 onto 1μm polycarbonate inserts in 6-well plates and incubated at 37°C in a humidified atmosphere with 10% CO2/90% O2. Over 21 days, the cells differentiated into a confluent monolayer. The Transepithelial Electrical Resistance (TEER) was determined using the formula 2 [34]:
TEER = (Rtotal - Rblank) × 𝐴
In this formula, Rtotal represents the electrical resistance measured across the cell monolayer and the insert (Ω), while Rblank corresponds to the resistance of an insert without cells (Ω). The term A refers to the surface area of the membrane (cm2). TEER values were expressed in Ω ⋅ cm2 [34].
TEER was monitored throughout the differentiation process and measured again immediately before and after the permeability assays to confirm the integrity of the monolayers. Only monolayers with TEER values exceeding 500 Ω ⋅ cm2 were included in the experiments [16,35]. For the permeability assays, the apical compartment, simulating the intestinal lumen, was filled with HBSS containing 10 mM MES at pH 6.0, while the basolateral compartment, representing systemic circulation contained HBSS with 10 mM HEPES and 4% FBS at pH 7.4. Test compounds were added to the apical compartment at the following concentrations: atenolol (50 µM), propranolol (5 µM), quinidine (20 µM) and verapamil (50 µM). Their transport to the basolateral compartment was monitored. Bidirectional assays were conducted to evaluate passive diffusion and active transport mechanisms.
The experiments were performed in the presence and absence of verapamil, a P-glycoprotein inhibitor, at a final concentration of 50 μM. Verapamil was added to both compartments, and the monolayers were pre-incubated for 30 minutes. After this pre-incubation, verapamil was removed, and the test compounds were added to the apical compartment along with verapamil at a concentration of 50 μM. This setup allowed the evaluation of the influence of P-glycoprotein-mediated efflux on the transport of the test compounds [14].
The apparent permeability coefficient (Papp) was calculated using the formula 3 [36]:
𝑃app = Δ𝐶/Δt × 𝐴 × 𝐶0
In this equation, ∆C/∆t represents the rate of compound transport (µg/s), A is the membrane surface area (cm2), and C0 is the initial concentration in the donor compartment (µg/cm3).
In this formula, Papp(B→A) and Papp(A→B) are the permeability coefficients for the basolateral-to-apical and apical-to-basolateral directions, respectively. Compound concentrations in the apical, basolateral, and cellular compartments were determined using UPLC-MS/MS.
3.6. Preparation of Samples
Samples from the apical and basolateral compartments were processed using SPE to isolate and concentrate the analytes. The pH of the samples was adjusted to 11, ensuring compatibility with the pKa of the target analytes, before being loaded onto pre-conditioned SPE cartridges. The cartridges were prepared by sequential conditioning with methanol, neutral water, and basified water to activate and equilibrate the stationary phase.
After sample loading, the cartridges were washed with basified water to remove residual impurities, and the analytes were eluted with methanol. The methanolic eluates were dried using a rotary evaporator, and the residues were reconstituted in methanol. Finally, the samples were transferred to vials and prepared for analysis using UPLC-MS/MS.
The inserts used for the permeability assays were prepared by adding glass beads to disrupt the cellular monolayer, aiding in the extraction of analytes. Methanol was added to the samples, followed by vortexing to initiate cell lysis. To further enhance the disruption caused by the glass beads, the samples were subjected to ultrasonication for 30 minutes. Subsequently, the samples were centrifuged at 4°C for 15 minutes at 5000 RPM in a refrigerated centrifuge to separate the supernatant, which was carefully collected for analysis.
To facilitate the understanding of this process, a detailed workflow is provided as a flowchart in the supplementary data (Figure S5), outlining the integration of these steps for samples preparation.
3.7. Stastitical Analyses
Statistical analyses were conducted to thoroughly evaluate the experimental data. Multifactorial comparisons were assessed using two-way ANOVA, while one-way ANOVA followed by Tukey’s post hoc test was employed for single-factor analyses. Statistical significance was set at p < 0.05, and all results are expressed as mean ± standard deviation (SD). Additional details regarding the statistical methods and analyses can be found in the captions accompanying each figure and table.
5. Conclusions
This study presents a validated UPLC-MS/MS method for the simultaneous separation and quantification of atenolol, propranolol, quinidine, and verapamil, offering a practical and reliable solution for drug permeability studies. By addressing diverse permeability profiles in a single workflow, this method simplifies the analytical process and provides consistent results, ensuring compliance with regulatory standards.
The method addresses current limitations in the field, including fragmented assay workflows, limited sensitivity, and inconsistent use of permeability standards. Its application can enhance drug classification under the BCS framework and support regulatory submissions by ensuring model integrity and analytical robustness.
Supplementary Materials
The following supporting information can be downloaded at the website of this paper posted on Preprints.org, Table S1: Solid-phase extraction (SPE) recovery of the analytes; Table S2: Recovery values (%) of the analytes under various stability conditions; Table S3: Parameters used to assess the robustness of the method; Table S4: Optimized mass spectrometer parameters for analyte quantification. Highlighted are the ions selected for quantification.; Figure S1: Chromatograms for the selectivity assessment of the UPLC–MS/MS method. Representative MRM chromatograms are shown for: the blank apical matrix (left column), the blank basolateral matrix (middle column), and the basolateral matrix spiked at the lower limit of quantification (LLOQ) for each analyte (right column). The rows correspond to: (A) Atenolol; (B) internal standard, Metoprolol; (C) Quinidine; (D) Propranolol and (E) Verapamil. Figure S2: Comparison of calibration curves prepared in methanol and matrix for atenolol, propranolol, quinidine, and verapamil; Figure S3: Transepithelial electrical resistance (TEER) measurements of Caco-2 cells cultured on Transwell™ permeable supports for 21 days. Results are expressed as mean ± standard deviation (SD). Data were analyzed using one-way analysis of variance (ANOVA) followed by Tukey’s post hoc test. Values marked with * indicate statistically significant differences according to Tukey’s test (p < 0.05); Figure S4: Cytotoxicity analysis of different compounds in Caco-2 cell culture. (A) atenolol (A50 and A100 µM), (B) quinidine (Q10, Q20, and Q30 µM), (C) propranolol (P5 and P10 µM), and (D) verapamil (V25, V50, and V100 µM). Triton X-100 (2%) was used as the positive control. Statistical significance: ####p < 0.0001 vs. basal control; ****p < 0.0001 vs. positive control (Triton X-100). HBSS with 1% DMSO was used as the basal control.; Figure S5: Workflow diagram illustrating the step-by-step procedure for sample preparation.
Author Contributions
Conceptualization, J.C.F., N.A.; methodology, J.C.F., N.A., A., L.S., C., E.J., M., L.A.B.; validation, A., L.S., C., E.J.; formal analysis, A., L.S., C., E.J.; investigation, A., L.S., C., E.J.; resources, J.C.F., N.A.; statistical analyses, A., L.S.; writing-original draft preparation, A., L.S.; writing review, J.C.F., N.A., C., E.J., M., L.A.B.. All authors have read and agreed to the published version of the manuscript.
Funding
This research was funded by São Paulo Research Foundation, FAPESP, [grants 2024/05555-5 and 2017/04138-8], the Coordination for the Improvement of Higher Education Personnel [CAPES: finance code 001] and the National Council for Scientific and Technological Development [grant 303490/2022-5].
Institutional Review Board Statement
Not applicable.
Informed Consent Statement
Not applicable.
Data Availability Statement
The original contributions presented in this study are included in the article/Supplementary Materials. Further inquiries can be directed to the corresponding author.
Conflicts of Interest
The authors declare no conflicts of interest.
Abbreviations
The following abbreviations are used in this manuscript:
| ACN | Acetonitrile |
| ANOVA | Analysis of Variance |
| A→B | Apical to Basolateral |
| B→A | Basolateral to Apical |
| BCS | Biopharmaceutics Classification System |
| CAPES | Coordination for the Improvement of Higher Education Personnel |
| CV | Coefficient of Variation |
| DMEM | Dulbecco’s Modified Eagle Medium |
| DMSO | Dimethyl Sulfoxide |
| EMA | European Medicines Agency |
| ESI | Electrospray Ionization |
| ER | Efflux Ratio |
| FAPESP | São Paulo Research Foundation |
| FBS | Fetal Bovine Serum |
| FDA | Food and Drug Administration |
| HBSS | Hank’s Balanced Salt Solution |
| HEPES | N-(2-hydroxyethyl)piperazine-N′-(2-ethanesulfonic acid) |
| INT | Iodonitrotetrazolium |
| IS | Internal Standard |
| LDH | Lactate Dehydrogenase |
| LOD | Limit of Detection |
| LLOQ | Lower Limit of Quantification |
| MF | Matrix Factor |
| MES | 2-(N-morpholino)ethanesulfonic acid |
| MRM | Multiple Reaction Monitoring |
| NEAA | Non-Essential Amino Acids |
| N/A | Not Applicable |
| PBS | Phosphate-Buffered Saline |
| Papp | Apparent Permeability Coefficient |
| P-gp | P-glycoprotein |
| QC | Quality Control |
| RE | Relative Error |
| SPE | Solid-Phase Extraction |
| TEER | Transepithelial Electrical Resistance |
| ULOQ | Upper Limit of Quantification |
| UPLC-MS/MS | Ultra-Performance Liquid Chromatography-Tandem Mass Spectrometry |
| WHO | World Health Organization |
References
- Kus, M.; Ibragimow, I.; Piotrowska-Kempisty, H. Caco-2 Cell Line Standardization with Pharmaceutical Requirements and In Vitro Model Suitability for Permeability Assays. Pharmaceutics 2023, 15, 2523. [CrossRef]
- Morita, T.; Yoshida, H.; Tomita, N.; Sato, Y. Comparison of in Vitro Screening Methods for Evaluating the Effects of Pharmaceutical Excipients on Membrane Permeability. Int. J. Pharm. 2024, 665, 124727. [CrossRef]
- International Council for Harmonisation of Technical Requirements for Pharmaceuticals for Human Use. ICH M9: Biopharmaceutics Classification System-Based Biowaivers, 2020. Available online: https://www.ema.europa.eu/en/ich-m9-biopharmaceutics-classification-system-based-biowaivers-scientific-guideline (accessed on 21 July 2025).
- Food and Drug Administration M9 Biopharmaceutics Classification System-Based Biowaivers: Guidance for Industry. U.S. Department of Health and Human Services, 2021. Available online: https://www.fda.gov/media/148472/download (accessed on 21 July 2025).
- World Health Organization. WHO Expert Committee on Specifications for Pharmaceutical Preparations: Fortieth Report; WHO Technical Report Series No. 937, 2006. Available online: https://www.who.int/teams/health-product-policy-and-standards/standards-and-specifications/norms-and-standards-for-pharmaceuticals/expert-committee-on-specifications-for-pharmaceutical-preparations (accessed July 24, 2025).
- Boonnop, R.; Meetam, P.; Siangjong, L.; Tuchinda, P.; Thongphasuk, P.; Soodvilai, S.; Soodvilai, S. Black Ginger Extract and Its Active Compound, 5,7-Dimethoxyflavone, Increase Intestinal Drug Absorption via Efflux Drug Transporter Inhibitions. Drug Metab. Pharmacokinet. 2023, 50, 100500. [CrossRef]
- Food and Drug Administration. Waiver of In Vivo Bioavailability and Bioequivalence Studies for Immediate-Release Solid Oral Dosage Forms Based on a Biopharmaceutics Classification System: Guidance for Industry. U.S. Department of Health and Human Services, 2017. Available online: https://digirepo.nlm.nih.gov/master/borndig/101720038/UCM070246.pdf (accessed on 24 July 2025).
- Dahlgren, D.; Lennernäs, H. Permeability and Drug Absorption: Predictive Experimental, Computational and In Vivo Approaches. Pharmaceutics 2019, 11, 411. [CrossRef]
- Hubatsch, I.; Ragnarsson, E.G.E.; Artursson, P. Determination of Drug Permeability and Prediction of Drug Absorption in Caco-2 Monolayers. Nat. Protoc. 2007, 2, 2111–2119. [CrossRef]
- Zheng, Y.; Benet, L.Z.; Okochi, H.; Chen, X. pH Dependent but Not P-Gp Dependent Bidirectional Transport Study of S-Propranolol: The Importance of Passive Diffusion. Pharm. Res. 2015, 32, 2516–2526. [CrossRef]
- Amidon, G.L.; Lennernäs, H.; Shah, V.P.; Crison, J.R. A Theoretical Basis for a Biopharmaceutic Drug Classification: The Correlation of in Vitro Drug Product Dissolution and in Vivo Bioavailability. Pharm. Res. 1995, 12, 413–420.
- Faassen, F.; Vogel, G.; Spanings, H.; Vromans, H. Caco-2 Permeability, P-Glycoprotein Transport Ratios and Brain Penetration of Heterocyclic Drugs. Int. J. Pharm. 2003, 263, 113–122. [CrossRef]
- Anderle, P.; Niederer, E.; Rubas, W.; Hilgendorf, C.; Spahn-Langguth, H.; Wunderli-Allenspach, H.; Merkle, H.P.; Langguth, P. P-Glycoprotein (P-Gp) Mediated Efflux in Caco-2 Cell Monolayers: The Influence of Culturing Conditions and Drug Exposure on P-Gp Expression Levels. J. Pharm. Sci. 1998, 87, 757–762.
- Patil, A.G.; D’Souza, R.; Dixit, N.; Damre, A. Validation of Quinidine as a Probe Substrate for the in Vitro P-Gp Inhibition Assay in Caco-2 Cell Monolayer. Eur. J. Drug Metab. Pharmacokinet. 2011, 36, 115–119. [CrossRef]
- Ötles, S.; Kartal, C. Solid-Phase Extraction (SPE): Principles and Applications in Food Samples. Acta Sci. Pol. Technol. Aliment. 2016, 15, 5–15. [CrossRef]
- Chen, S.; Einspanier, R.; Schoen, J. Transepithelial Electrical Resistance (TEER): A Functional Parameter to Monitor the Quality of Oviduct Epithelial Cells Cultured on Filter Supports. Histochem. Cell Biol. 2015, 144, 509–515. [CrossRef]
- Fedi, A.; Vitale, C.; Ponschin, G.; Ayehunie, S.; Fato, M.; Scaglione, S. In Vitro Models Replicating the Human Intestinal Epithelium for Absorption and Metabolism Studies: A Systematic Review. J. Controlled Release 2021, 335, 247–268. [CrossRef]
- Okur, N.Ü.; Çağlar, E.Ş.; Kaynak, M.S.; Diril, M.; Özcan, S.; Karasulu, H.Y. Enhancing Oral Bioavailability of Domperidone Maleate: Formulation, In Vitro Permeability Evaluation In-Caco-2 Cell Monolayers and In Situ Rat Intestinal Permeability Studies. Curr. Drug Deliv. 2024, 21, 1010–1023. [CrossRef]
- Zhang, S.Y.; Ong, W.S.Y.; Subelzu, N.; Gleeson, J.P. Validation of a Caco-2 Microfluidic Chip Model for Predicting Intestinal Absorption of BCS Class I-IV Drugs. Int. J. Pharm. 2024, 656, 124089. [CrossRef]
- Liu, X.-Y.; Zhang, Y.-B.; Yang, X.-W.; Wu, X.-W.; Yang, Y.-F.; Xu, W.; Wan, M.-Q.; Gong, Y.; Liu, N.-F.; Zhang, P. Biological Analysis of Constituents in Spatholobi Caulis by UFLC-MS/MS: Enhanced Quantification and Application to Permeability Properties Study in Caco-2 Cell Monolayer Model. J. Pharm. Biomed. Anal. 2023, 226, 115235. [CrossRef]
- Yang, B.; Li, Y.; Shi, W.; Liu, Y.; Kan, Y.; Chen, J.; Hu, J.; Pang, W. Use of Fluorescent 2-AB to Explore the Bidirectional Transport Mechanism of Pseudostellaria Heterophylla Polysaccharides across Caco-2 Cells. Molecules 2022, 27, 3192. [CrossRef]
- Ren, S.; Liu, J.; Xue, Y.; Zhang, M.; Liu, Q.; Xu, J.; Zhang, Z.; Song, R. Comparative Permeability of Three Saikosaponins and Corresponding Saikogenins in Caco-2 Model by a Validated UHPLC-MS/MS Method. J. Pharm. Anal. 2021, 11, 435–443. [CrossRef]
- Song, J.H.; Lee, H.R.; Shim, S.M. Determination of S-Methyl-L-Methionine (SMM) from Brassicaceae Family Vegetables and Characterization of the Intestinal Transport of SMM by Caco-2 Cells. J. Food Sci. 2017, 82, 36–43. [CrossRef]
- Spinks, C.B.; Zidan, A.S.; Khan, M.A.; Habib, M.J.; Faustino, P.J. Pharmaceutical Characterization of Novel Tenofovir Liposomal Formulations for Enhanced Oral Drug Delivery: In Vitro Pharmaceutics and Caco-2 Permeability Investigations. Clin. Pharmacol. 2017, 9, 29–38. [CrossRef]
- Del Mar Contreras, M.; Borrás-Linares, I.; Herranz-López, M.; Micol, V.; Segura-Carretero, A. Further Exploring the Absorption and Enterocyte Metabolism of Quercetin Forms in the Caco-2 Model Using Nano-LC-TOF-MS. Electrophoresis 2016, 37, 998–1006. [CrossRef]
- Fukuuchi, T.; Kobayashi, M.; Yamaoka, N.; Kaneko, K. Evaluation of Cellular Purine Transport and Metabolism in the Caco-2 Cell Using Comprehensive High-Performance Liquid Chromatography Method for Analysis of Purines. Nucleosides Nucleotides Nucleic Acids 2016, 35, 663–669. [CrossRef]
- Logoyda, L.; Herasymiuk, M.; Popovych, D.; Pidruchna, S.; Hlushok, V.; Herasymiuk, N.; Zarivna, N. HPLC MS/MS Method Development for the Quantitative Determination of Verapamil Hydrochloride from Caco-2 Cell Monolayers. Pharmacia 2020, 67, 63–69. [CrossRef]
- Venkatesh, G.; Ramanathan, S.; Mansor, S.M.; Nair, N.K.; Sattar, M.A.; Croft, S.L.; Navaratnam, V. Development and Validation of RP-HPLC-UV Method for Simultaneous Determination of Buparvaquone, Atenolol, Propranolol, Quinidine and Verapamil: A Tool for the Standardization of Rat in Situ Intestinal Permeability Studies. J. Pharm. Biomed. Anal. 2007, 43, 1546–1551. [CrossRef]
- Yost, R.; Enke, C. Selected Ion Fragmentation with a Tandem Quadrupole Mass Spectrometer. J. Am. Chem. Soc. 1978, 100, 2274–2275.
- Food and Drug Administration. Bioanalytical Method Validation Guidance for Industry. US Department of Health and Human Services. 2018. Available online: https://www.fda.gov/media/70858/download (accessed on 24 July 2025).
- Li, F.; Du, P.; Yang, W.; Huang, D.; Nie, S.; Xie, M. Polysaccharide from the Seeds of Plantago Asiatica L. Alleviates Nonylphenol Induced Intestinal Barrier Injury by Regulating Tight Junctions in Human Caco-2 Cell Line. Int. J. Biol. Macromol. 2020, 164, 2134–2140. [CrossRef]
- Roche Diagnostics GmbH. Cytotoxicity Detection Kit (LDH): For the quantitative determination of lactate dehydrogenase released from damaged cells. Sigma-Aldrich, 2011. Available online: https://www.sigmaaldrich.com/deepweb/assets/sigmaaldrich/product/documents/167/504/11644793001.pdf (accessed on 24 July 2025).
- Hiebl, B.; others Impact of Serum in Cell Culture Media on in Vitro Lactate Dehydrogenase (LDH) Release Determination. J. Clin. Biochem. 2017, 9–13. [CrossRef]
- Li, B.; Wu, J.; Li, H.; Jiang, Z.; Zhou, X.; Xu, C.; Ding, N.; Zha, J.; He, W. In Vitro and In Vivo Approaches to Determine Intestinal Epithelial Cell Permeability. J. Vis. Exp. 2018, 140, 57032. [CrossRef]
- Ude, V.; Brown, D.; Viale, L.; Kanase, N.; Stone, V.; Johnston, H. Impact of Copper Oxide Nanomaterials on Differentiated and Undifferentiated Caco-2 Intestinal Epithelial Cells; Assessment of Cytotoxicity, Barrier Integrity, Cytokine Production and Nanomaterial Penetration. Part. Fibre Toxicol. 2017, 14, 31. [CrossRef]
- Yang, Y.; Bai, L.; Li, X.; Xiong, J.; Xu, P.; Guo, C.; Xue, M. Transport of Active Flavonoids, Based on Cytotoxicity and Lipophilicity: An Evaluation Using the Blood–Brain Barrier Cell and Caco-2 Cell Models. Toxicol. In Vitro 2014, 28, 388–396. [CrossRef]
Figure 1.
Analytical standards: (A) atenolol, (B) quinidine, (C) propranolol, (D) verapamil, and (E) metoprolol (internal standard - IS).
Figure 1.
Analytical standards: (A) atenolol, (B) quinidine, (C) propranolol, (D) verapamil, and (E) metoprolol (internal standard - IS).
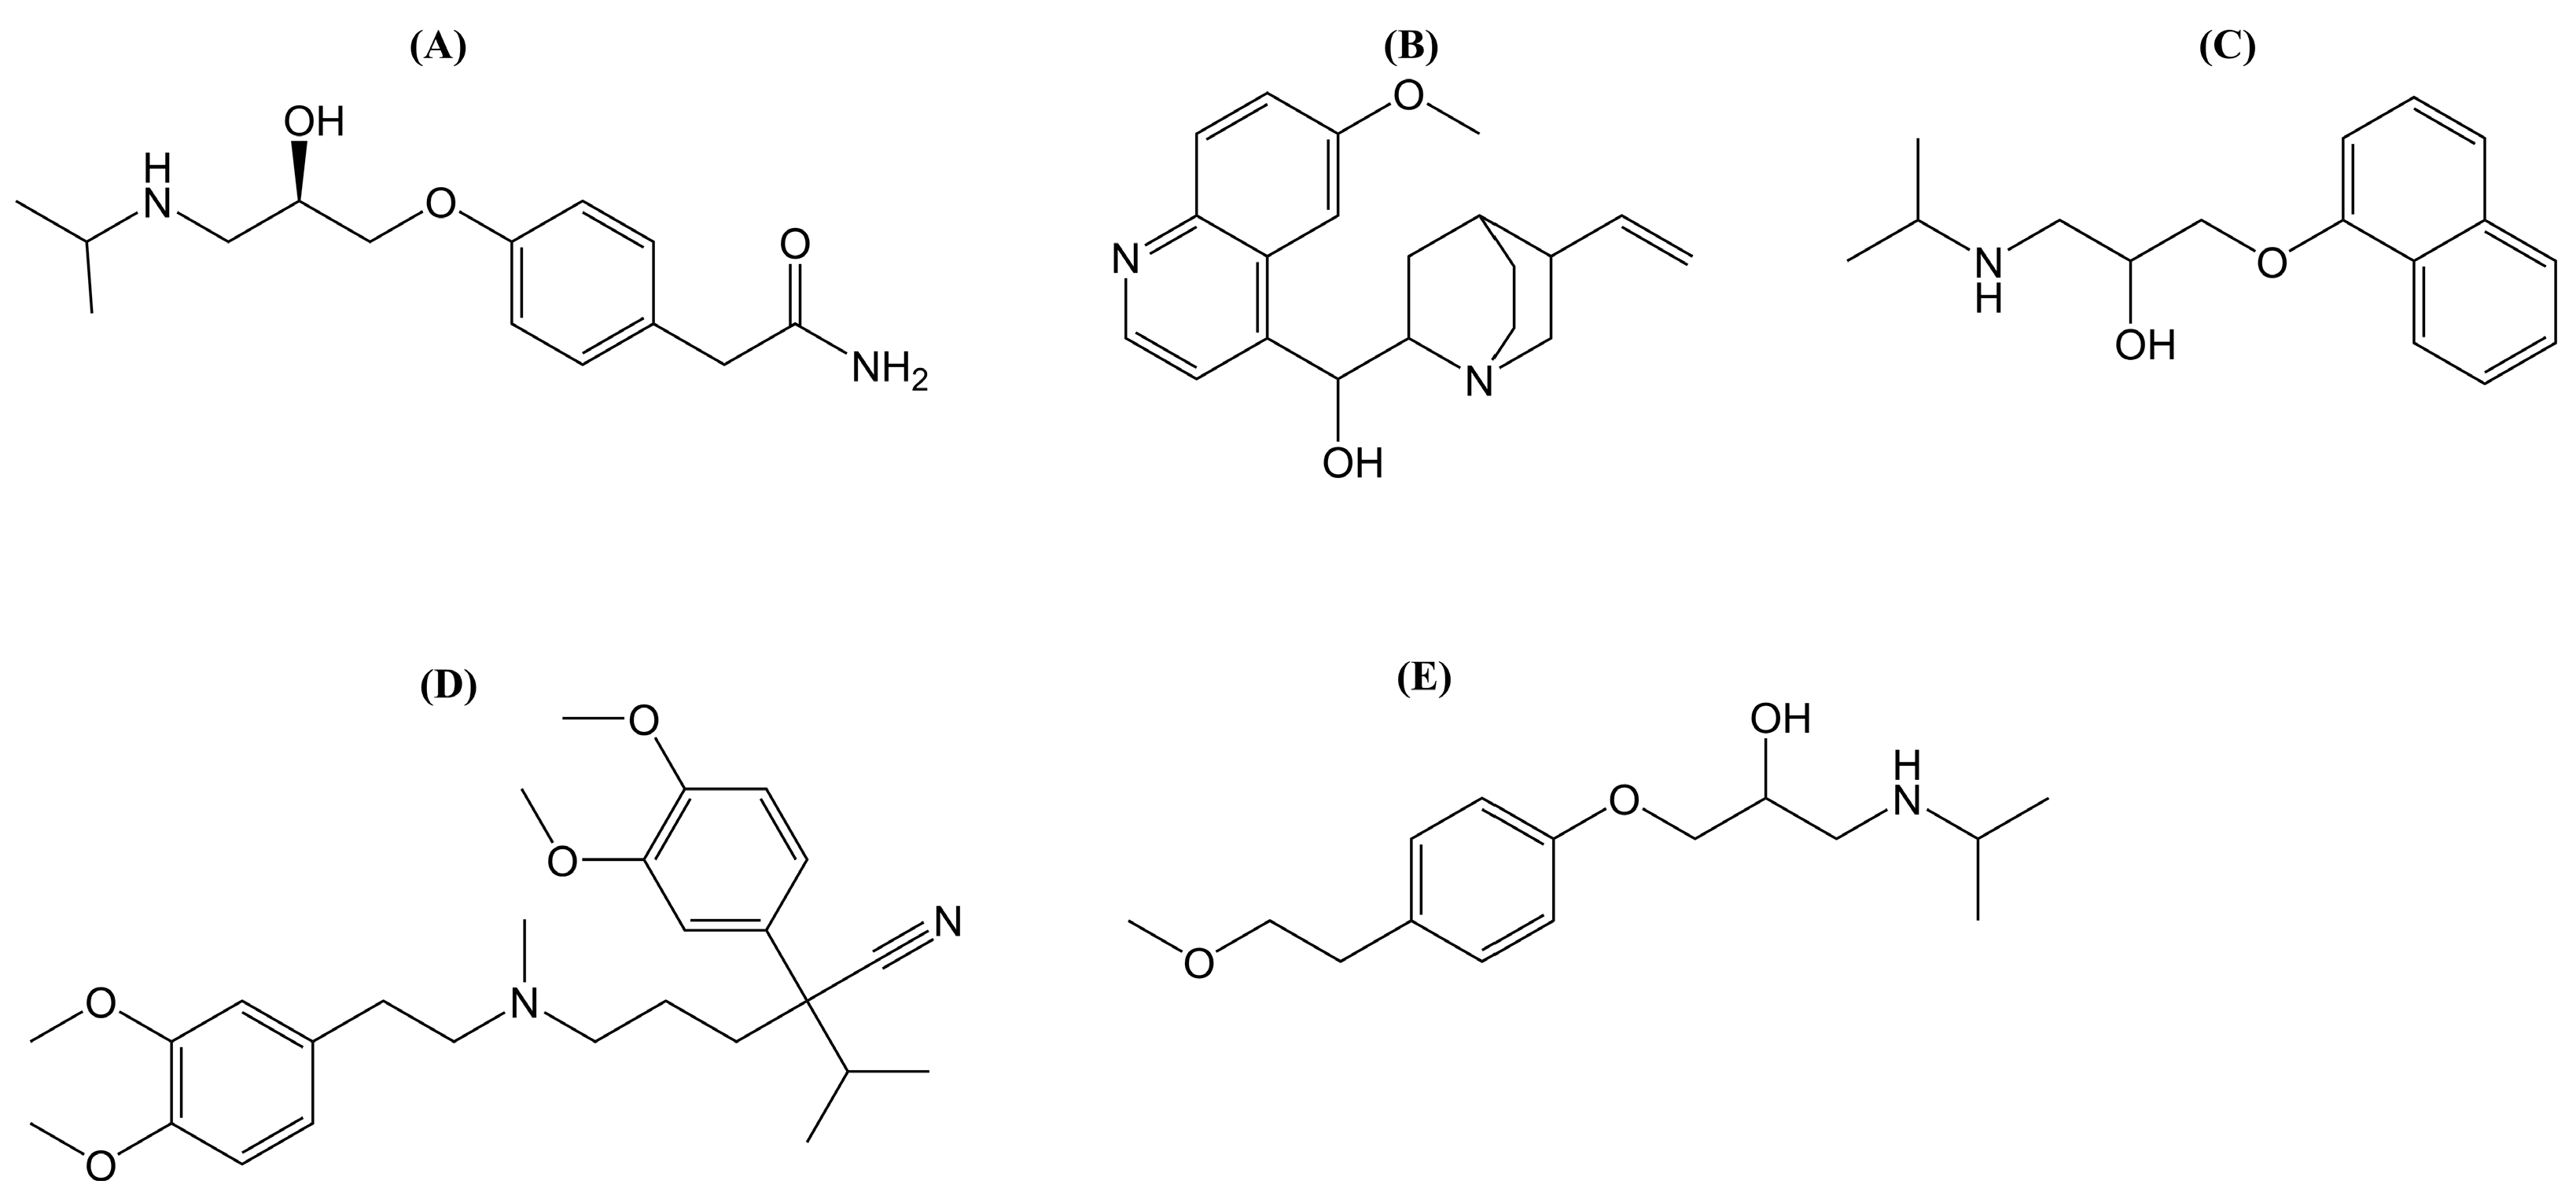
Figure 2.
Chromatograms demonstrating the selectivity of the analytical method. Distinct peaks are shown for each standard compound: (1) Atenolol (tR 2.57 min), (2) Metoprolol (tR 3.75), (3) Quinidine (tR 3.86), (4) Propranolol (tR 5.35), and (5) Verapamil (tR 5.81). Each compound is clearly identified with high specificity under the established analytical conditions.
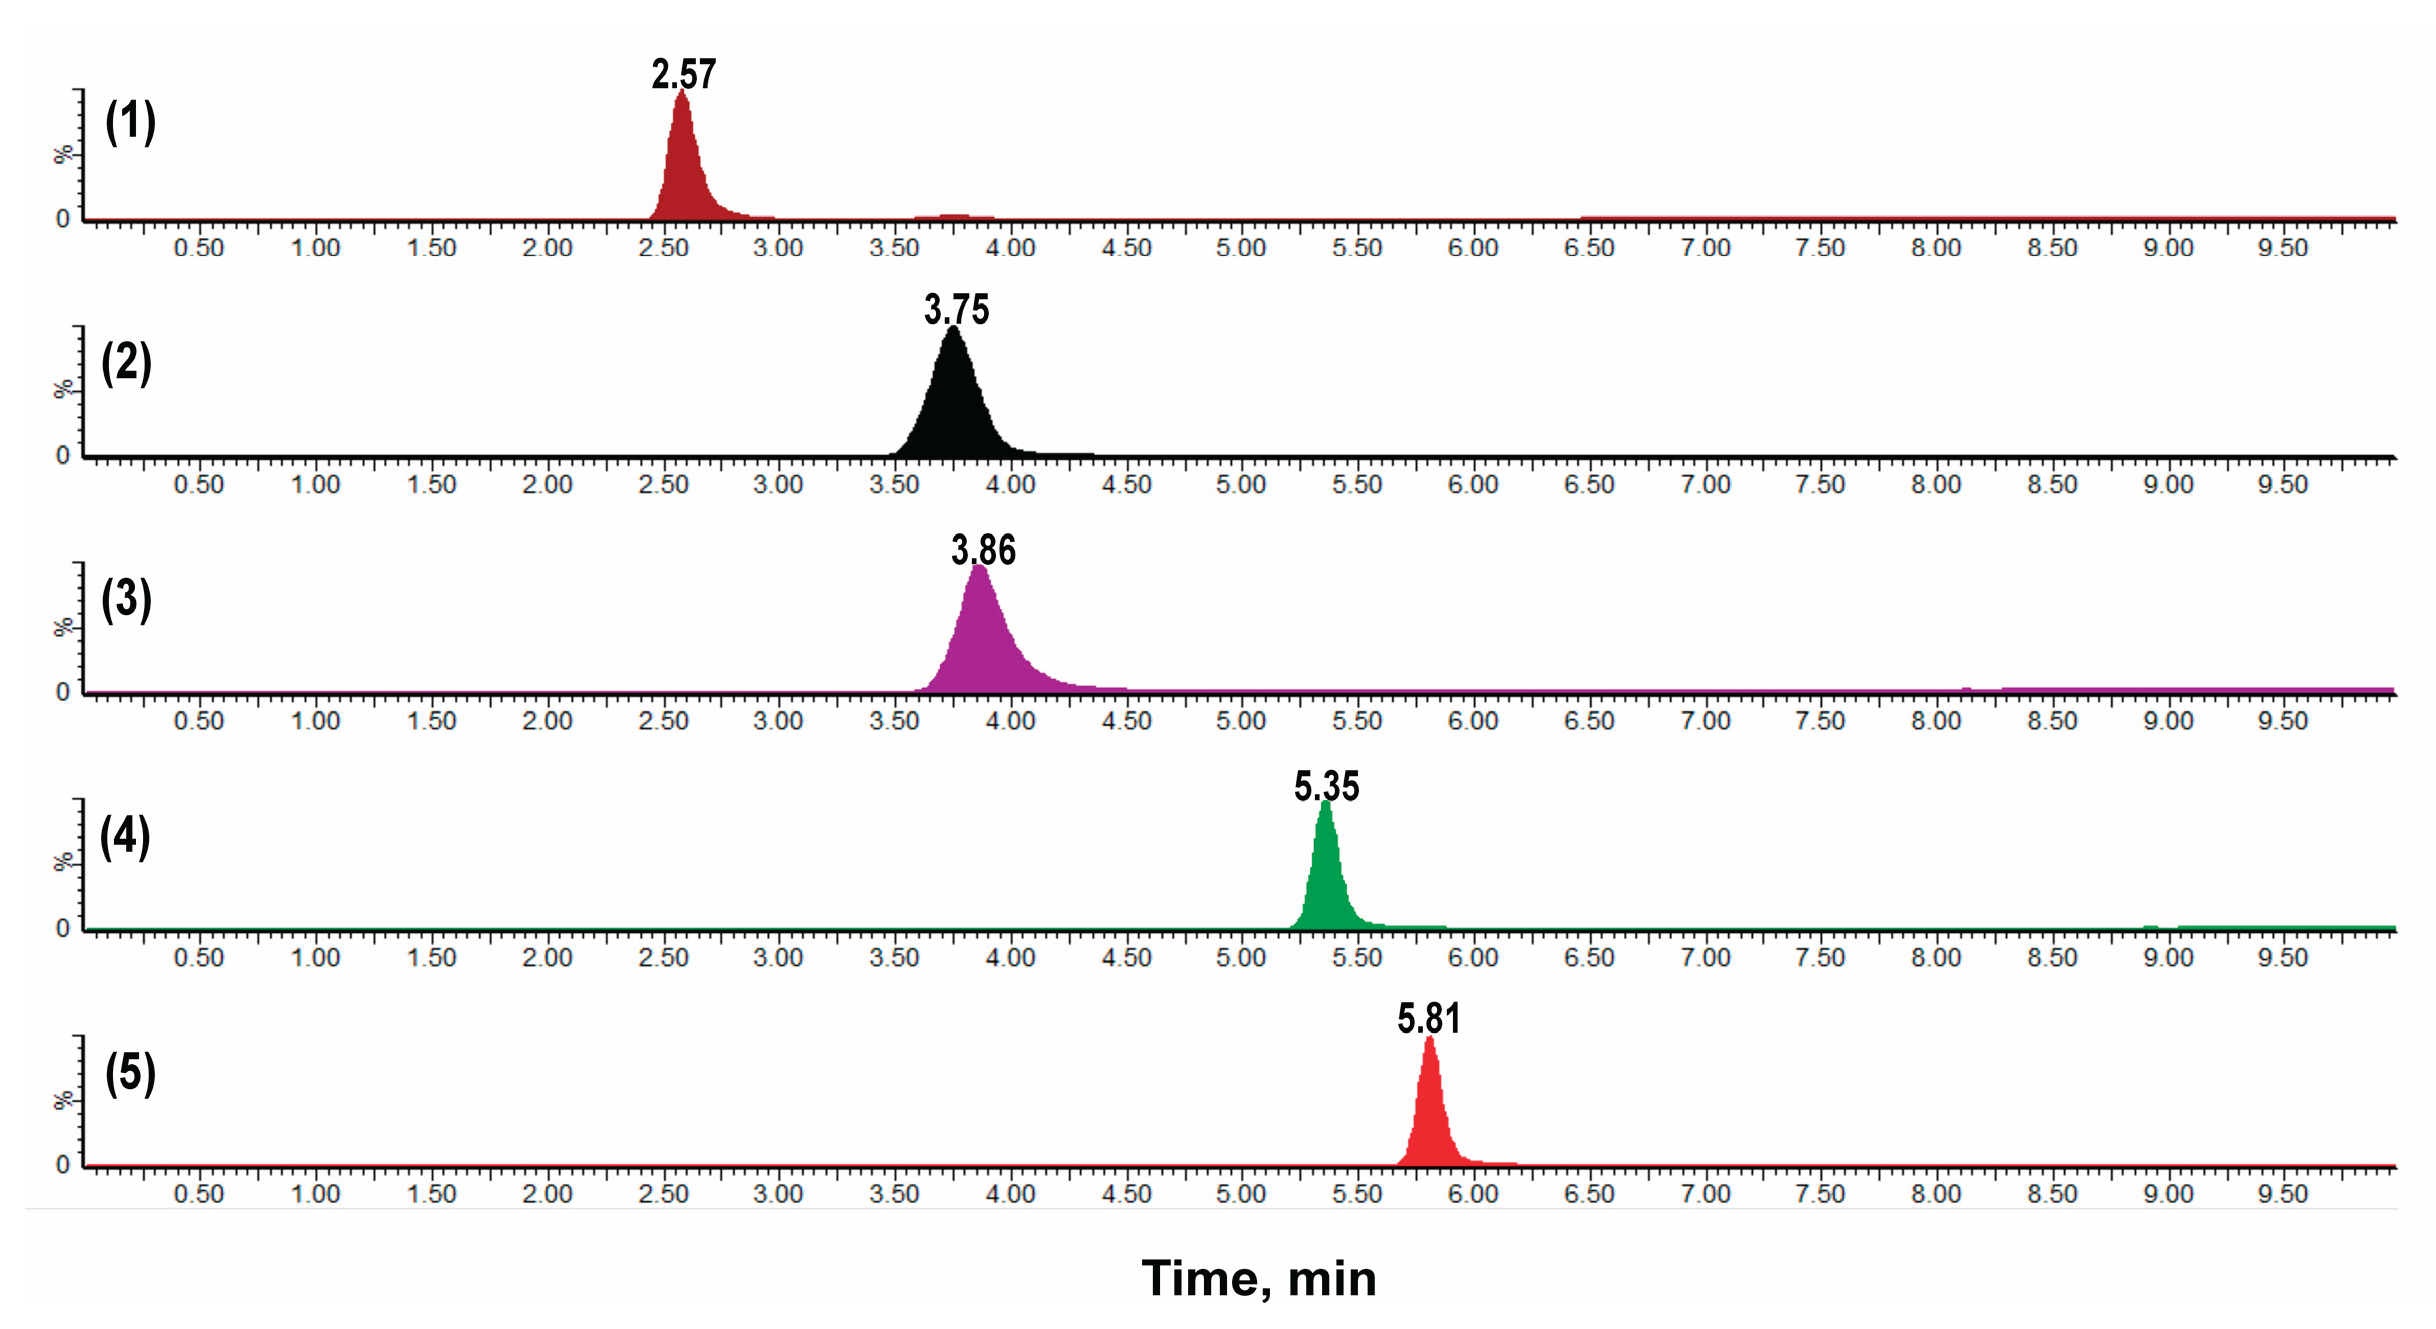
Figure 3.
Chromatograms demonstrating the absence of carryover effect in the analytical method. The analytes (1) Atenolol (267.223 > 145.02), (2) Metoprolol (268.3 > 115.8), (3) Quinidine (324.7 > 307.1), (4) Propranolol (260.16 > 115.967), and (5) Verapamil (455.1 > 149.6) show no detectable residual peaks in the blank sample, confirming the absence of carryover.
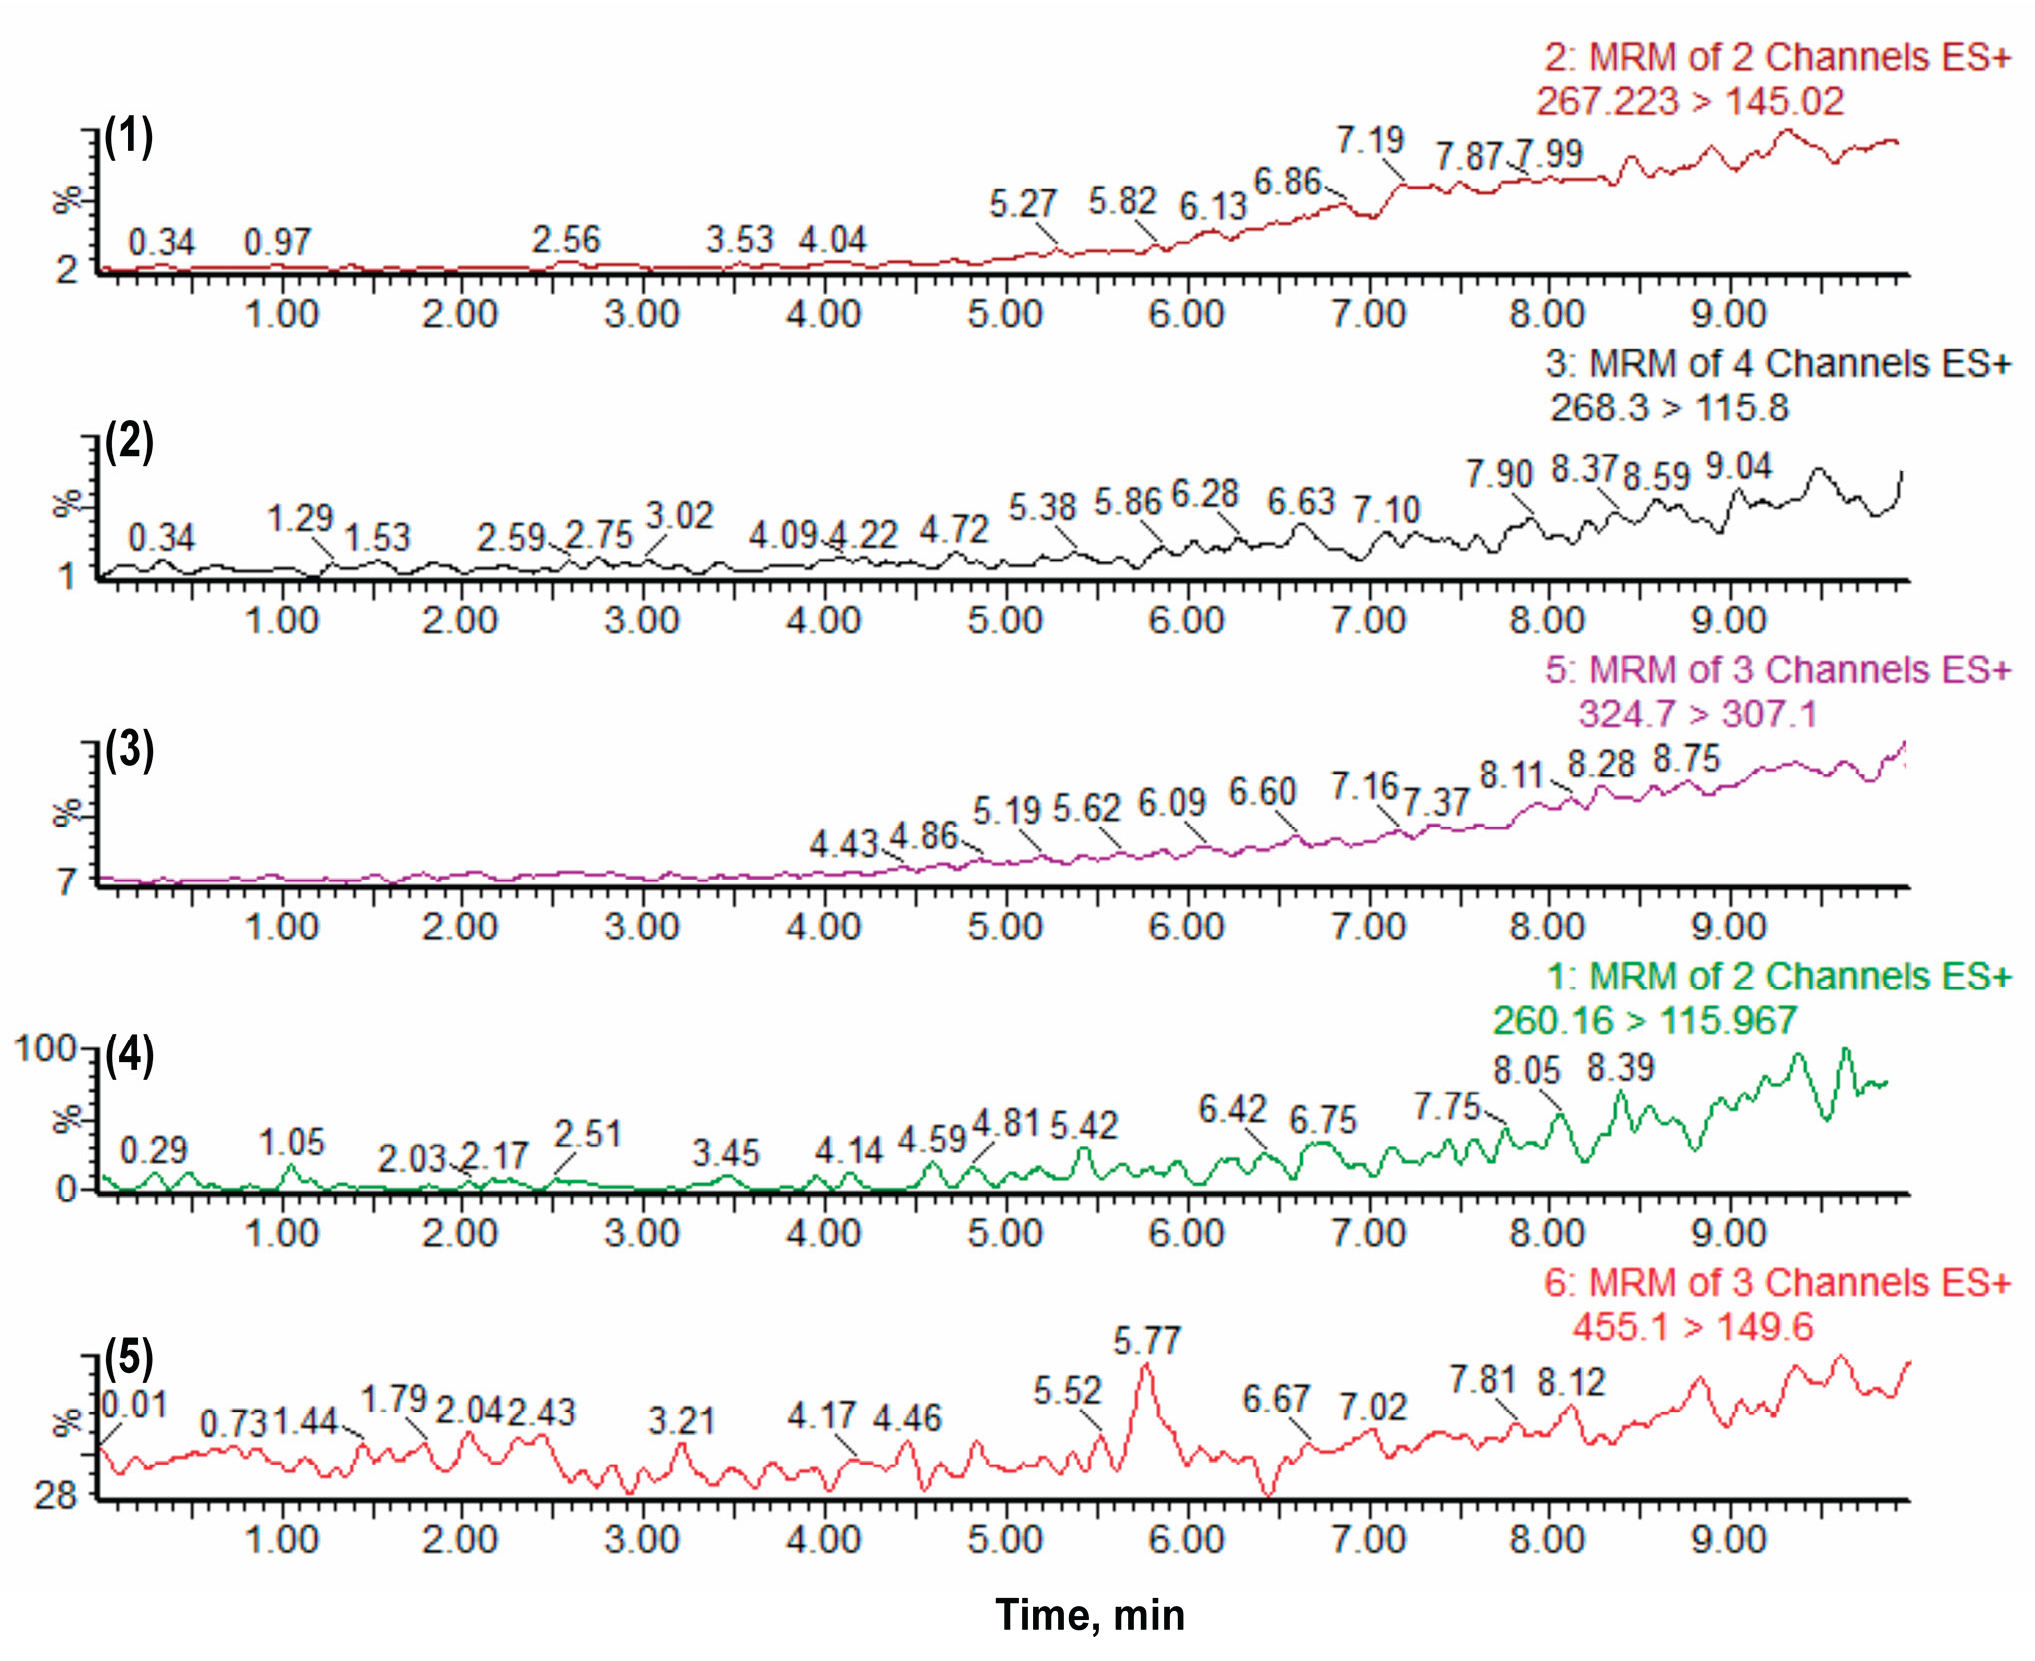
Figure 4.
Apparent permeability (Papp) of the analytes in the presence (w/) and absence (w/o) of verapamil in Caco-2 cell permeability assays. Experiments were conducted in both apical-to-basolateral (A→B) and basolateral-to-apical (B→A) directions. Data were analyzed using two-way ANOVA followed by Tukey’s post hoc test. Statistical significance is indicated as **** p < 0.0001 and * p < 0.001. Identical letters denote no statistically significant differences. N/A indicates conditions where the analysis does not apply. Data are presented as mean ± standard deviation.
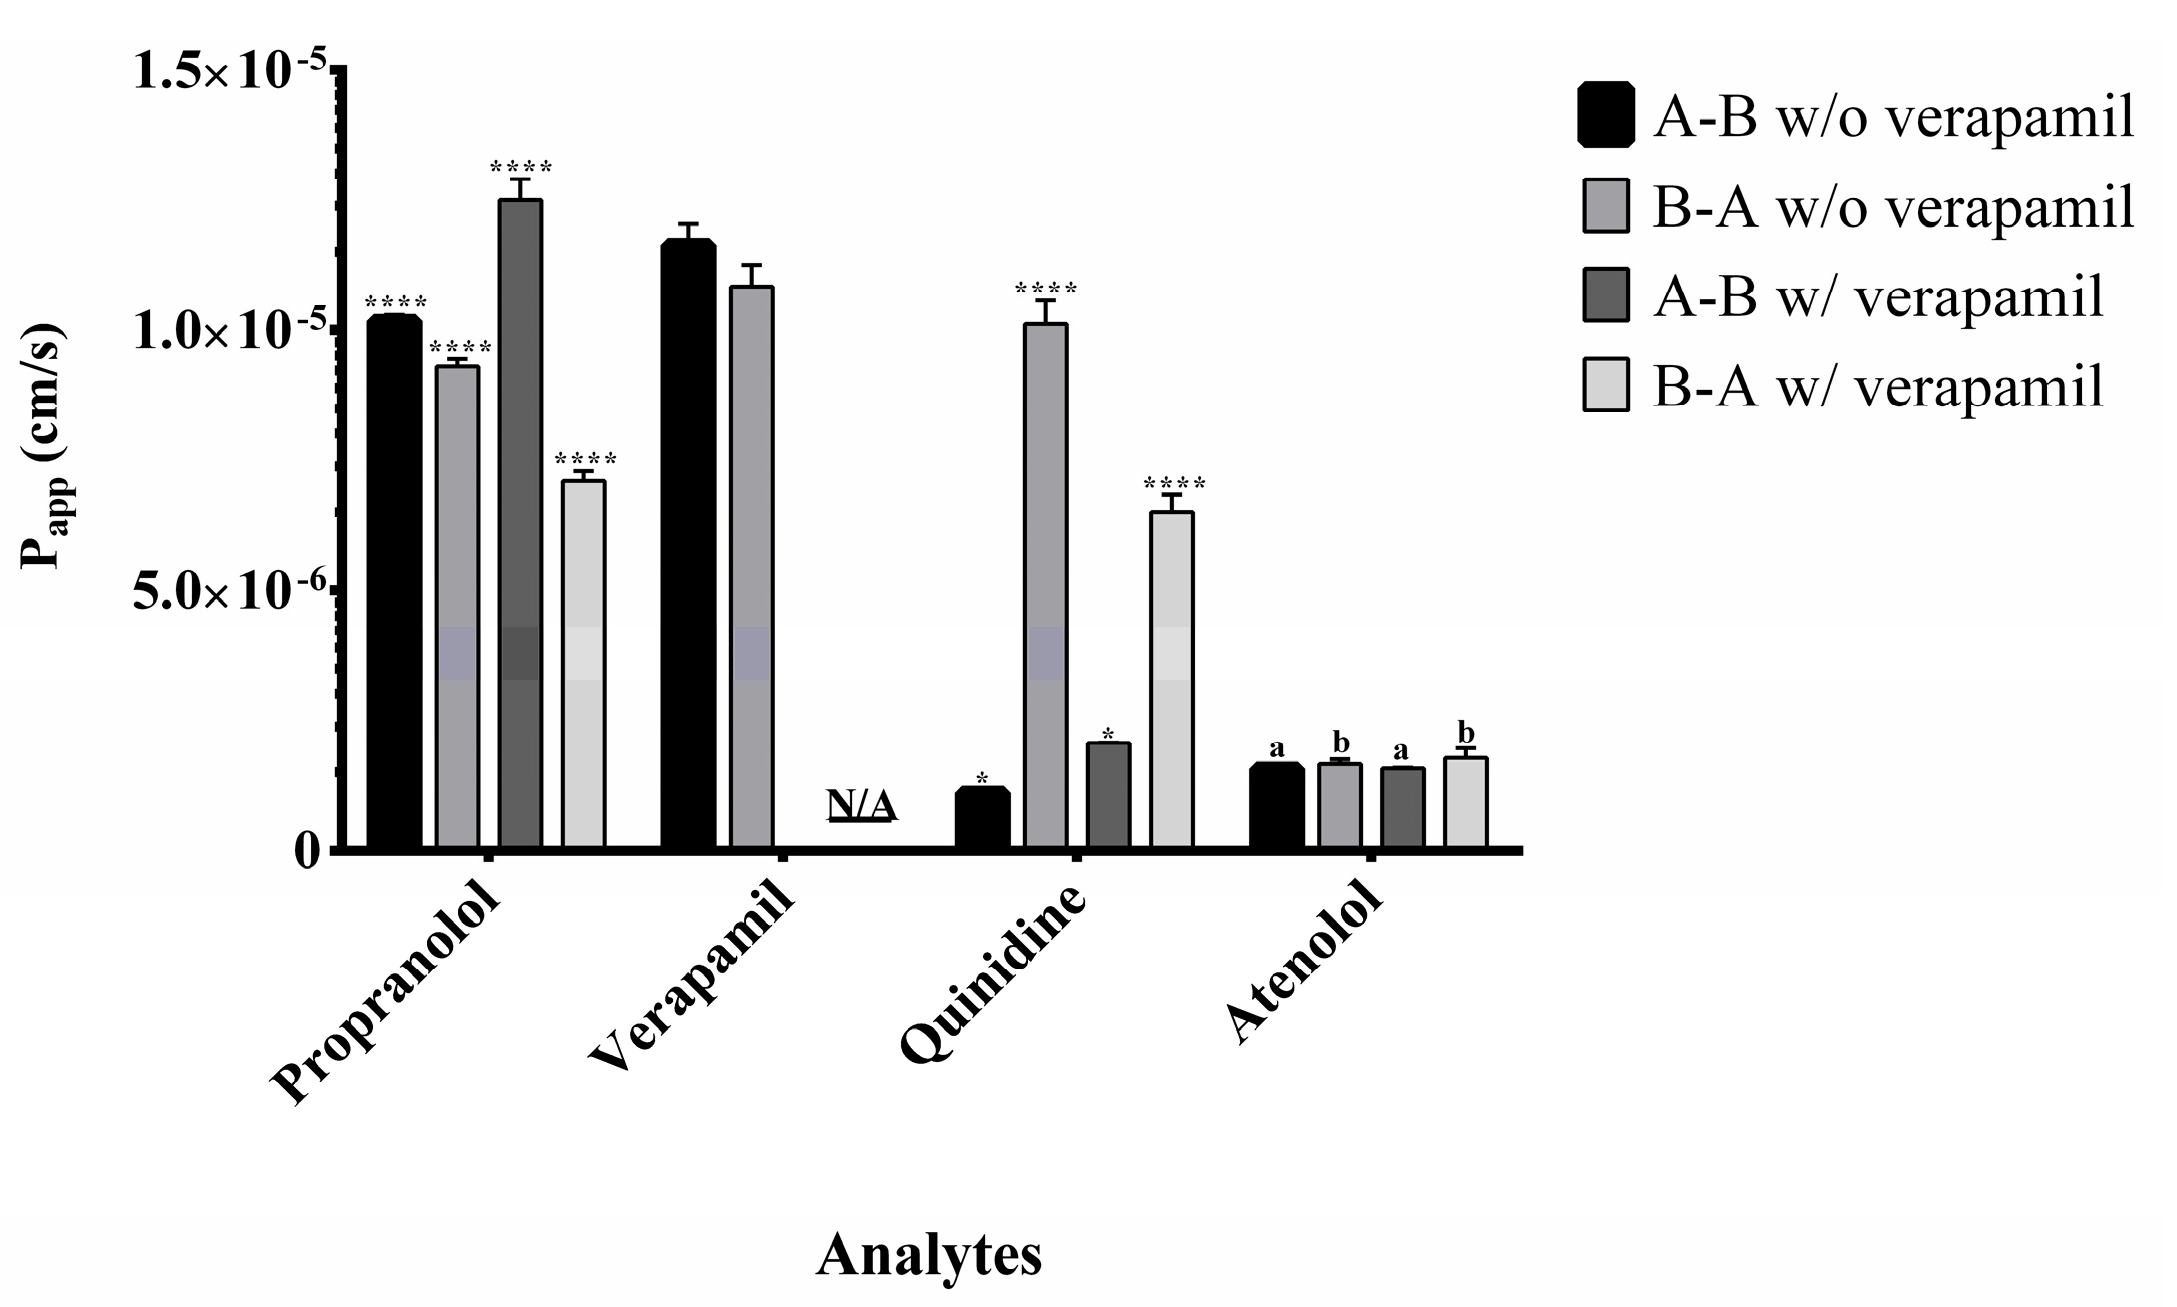
Figure 5.
Efflux ratios of the analytes in the presence (w/) and absence (w/o) of verapamil in Caco-2 cell permeability assays. Data were analyzed using two-way ANOVA followed by Tukey’s post hoc test. Comparisons were made between conditions with and without verapamil. Statistical significance is indicated as **** p < 0.0001. Identical letters denote no statistically significant differences. N/A indicates conditions where the analysis does not apply. Data are presented as mean ± standard deviation.
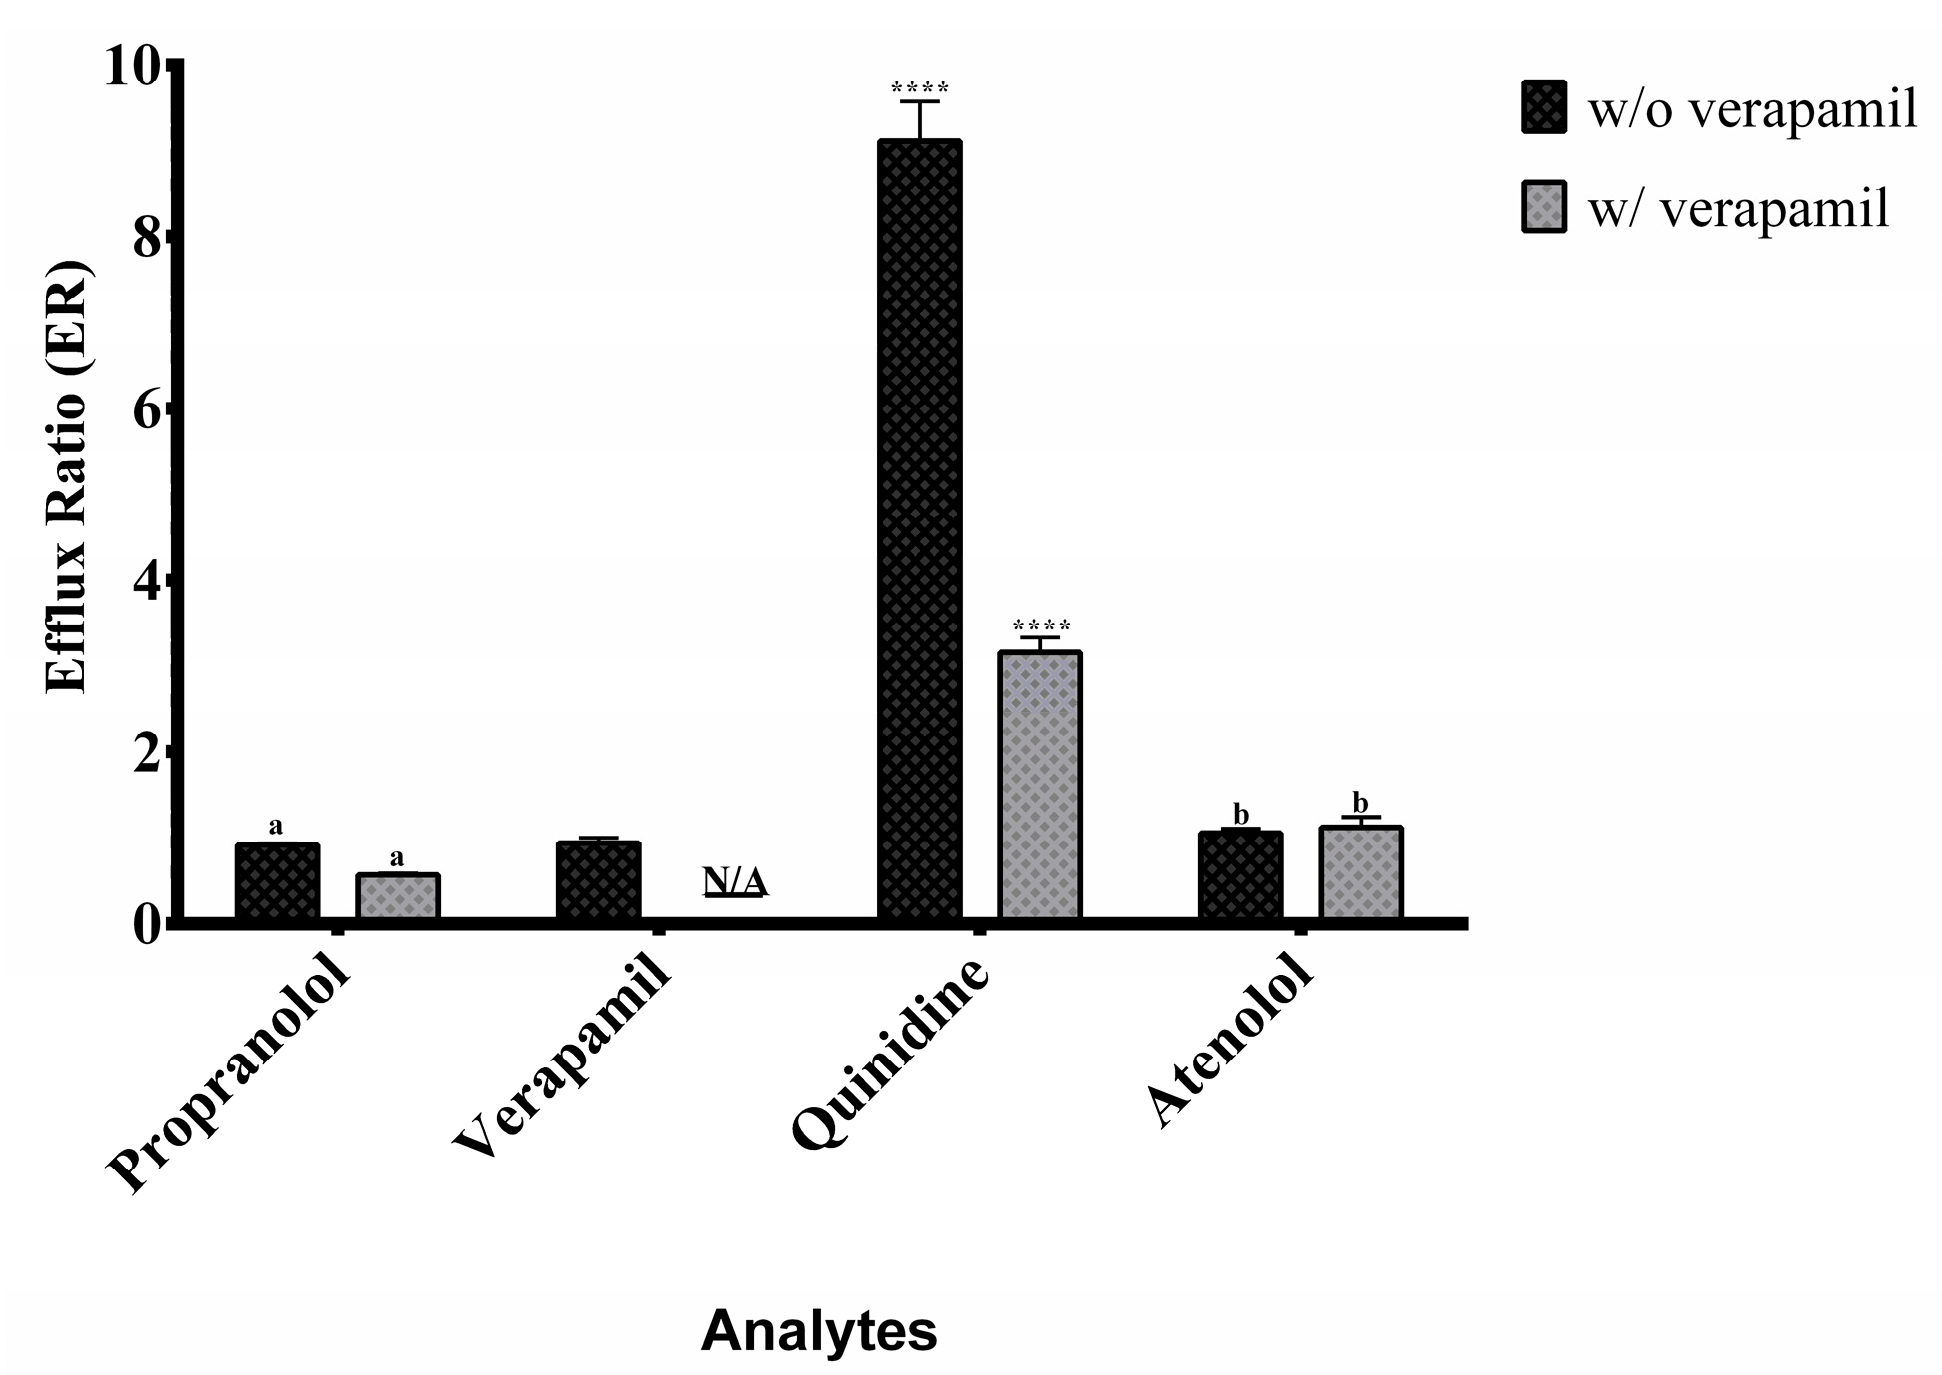

Table 1.
Parameters assessed to confirm the linearity of the method, including the limits of detection (LOD) and quantification (LLOQ).
Table 1.
Parameters assessed to confirm the linearity of the method, including the limits of detection (LOD) and quantification (LLOQ).
| Analyte | Regression Equation | Linear Correlation Coefficient | Lack of Fit (p-value) | Normality (p-value) | LOD/LLOQ (ng/mL) |
| Atenolol | Y = 4.7817x - 0.0809 | 0.998 | 0.091 | 0.790 | 10/25.4 |
| Quinidine | Y = 4.2705x - 0.00861 | 0.999 | 0.766 | 0.049 | 2/12.7 |
| Propranolol | Y = 2.4184x -0.04191 | 0.999 | 0.334 | 0.678 | 1/25.4 |
| Verapamil | Y = 5.498x + 8.632 | 1.000 | 0.069 | 0.081 | 1/600 |
Table 2.
Precision and accuracy results for the method.
| Analyte | Level | Intra-day Precision (CV%) | Inter-day Precision (CV%) | Intra-day Accuracy (RE%) | Inter-day Accuracy (RE%) | ||||
| Day 1 | Day 2 | Day 3 | Day 1 | Day 2 | Day 3 | ||||
| Atenolol | LLOQ | 4.87 | 7.34 | 1.61 | 5.26 | -0.53 | -13.10 | -16.69 | -19.44 |
| Low | 1.65 | 1.92 | 15.10 | 2.58 | -6.91 | 6.69 | -6.20 | -8.33 | |
| Mid | 2.87 | 0.42 | 12.95 | 3.53 | 4.98 | 1.10 | -4.34 | 11.80 | |
| High | 2.37 | 0.31 | 15.08 | 1.62 | -3.26 | -0.62 | -9.51 | -14.82 | |
| Quinidine | LLOQ | 1.86 | 4.00 | 0.42 | 1.05 | 0.02 | -14.13 | 15.93 | -14.41 |
| Low | 1.19 | 0.71 | 0.84 | 3.56 | -0.44 | 7.80 | 12.17 | -4.78 | |
| Mid | 1.31 | 0.24 | 3.55 | 1.67 | 3.92 | -2.21 | 2.17 | 0.24 | |
| High | 0.73 | 0.67 | 1.39 | 1.19 | -13.22 | -13.97 | -1.94 | -6.40 | |
| Propranolol | LLOQ | 6.59 | 6.97 | 9.81 | 2.26 | -5.27 | -17.41 | -8.50 | -4.58 |
| Low | 3.09 | 1.75 | 8.87 | 2.20 | -2.27 | 7.00 | -3.54 | 1.21 | |
| Mid | 4.01 | 0.07 | 13.41 | 4.09 | 5.07 | -2.21 | -10.62 | 1.44 | |
| High | 0.34 | 0.96 | 13.01 | 7.25 | -1.38 | -11.32 | -8.21 | 11.62 | |
| Verapamil | LLOQ | 1.55 | 7.23 | 1.73 | 4.89 | -4.07 | 0.94 | 9.51 | 15.69 |
| Low | 6.42 | 1.29 | 3.36 | 0.39 | 0.50 | 5.95 | -6.18 | 4.82 | |
| Mid | 0.34 | 1.94 | 0.71 | 0.63 | 0.86 | 0.04 | -8.07 | -8.53 | |
| High | 1.73 | 0.57 | 4.56 | 3.69 | 5.52 | 7.61 | -4.25 | 2.12 | |
CV% = Coefficient of Variation (indicates precision); RE% = Relative Error (indicates accuracy). QC Levels: LLOQ = Lower Limit of Quantification; Low QC = Low Quality Control; Mid QC = Medium Quality Control; High QC = High Quality Control.
Table 3.
Matrix effect assessment using the internal standard-normalized matrix factor (IS-Normalized MF).
Table 3.
Matrix effect assessment using the internal standard-normalized matrix factor (IS-Normalized MF).
| Analyte | Level | IS-Normalized MF (n=6) | Mean IS-Normalized MF | CV (%) |
| Atenolol | Low | 0.98, 0.89, 0.92, 1.04, 0.89, 0.91 | 0.94 | 6.47 |
| High | 1.04, 1.06, 1.04, 1.04, 1.06, 1.08 | 1.05 | 1.37 | |
| Quinidine | Low | 0.99, 1.03, 0.96, 1.06, 0.96, 0.96 | 0.99 | 4.55 |
| High | 1.05, 1.05, 1.07, 1.08, 1.08, 1.07 | 1.07 | 1.38 | |
| Propranolol | Low | 0.98, 0.93, 0.89, 1.02, 0.86, 0.95 | 0.94 | 6.02 |
| High | 1.20, 1.13, 1.14, 1.17, 1.21, 1.12 | 1.16 | 3.20 | |
| Verapamil | Low | 0.90, 0.90, 0.91, 1.04, 0.91, 0.96 | 0.94 | 6.14 |
| High | 0.97, 1.11, 1.13, 0.97, 1.11, 1.13 | 1.07 | 7.32 |
Notes: Precision is expressed as coefficient of variation (CV%). IS-Normalized MF represents the internal standard- normalized matrix factor.
Disclaimer/Publisher’s Note: The statements, opinions and data contained in all publications are solely those of the individual author(s) and contributor(s) and not of MDPI and/or the editor(s). MDPI and/or the editor(s) disclaim responsibility for any injury to people or property resulting from any ideas, methods, instructions or products referred to in the content. |
© 2025 by the authors. Licensee MDPI, Basel, Switzerland. This article is an open access article distributed under the terms and conditions of the Creative Commons Attribution (CC BY) license (http://creativecommons.org/licenses/by/4.0/).
Copyright: This open access article is published under a Creative Commons CC BY 4.0 license, which permit the free download, distribution, and reuse, provided that the author and preprint are cited in any reuse.


