
Submitted:
21 July 2025
Posted:
22 July 2025
You are already at the latest version
Abstract
In the quest for greener alternatives to conventional organic solvents, Deep Eutectic Solvents (DESs) have gained significant attention due to their sustainability, biodegradability, and tunability. The use of water as an active and genuine component has recently led to the emergence of water-based DESs (wb-DESs). Here, a careful experimental characterization was performed on choline acetate (ChAc)/water mixtures across a range of water:ChAc molar ratios (n = 2–6). Differential Scanning Calorimetry (DSC) revealed glass transitions between 150–180 K, with no first-order transitions, leading to a classification of these mixtures as Low Transition-Temperature Mixtures (LTTMs). Physicochemical measurements, including density, viscosity, electrical conductivity, and refractive index, were conducted over a broad temperature range. NMR analyses provided insights into dynamics and solvation environments, with ¹H T1slow relaxation times reaching their lowest value at n = 2, consistently with the formation of a strong hydrogen-bonding network. The n = 2 mixture was further investigated using Small and Wide-Angle X-ray Scattering (S-WAXS) and ab initio molecular dynamics (AIMD). These studies, jointly with 1H NMR choline diffusion coefficient, directly challenge previous claims of the existence of aggregation phenomena in wb-DES. The simulation revealed a well-organized solvation structure, where acetate and water synergistically stabilize the choline cation through a cooperative hydrogen-bonding network. These findings highlight the impact and significance of an integrated physicochemical study in guiding the rational development of new sustainable systems, such as wb-DESs.
Keywords:
water
; eutectic
; hydrogen bonding
; ab initio
; molecular dynamics
; x-ray scattering
; solid liquid equilibrium
1. Introduction
In recent years, there has been significant growth in the interest to develop new solvent systems to address the sustainability challenges raised by conventional organic solvents. In this context, Deep Eutectic Solvents (DESs) are considered innovative "green" alternatives for a wide range of applications [1,2]. The term "DES" was first introduced in the early 21st century, when Abbott and colleagues discovered a mixture of urea and choline chloride with a melting point significantly lower than that of either constituents [3]. Nowadays, DESs are defined as a subclass of traditional eutectic solvents, specifically referring to mixtures of two or more compounds with a melting point considerably lower than expected for an ideal eutectic behaviour [4,5]. The negative deviation from the eutectic ideality occurs when inter-species interactions are more favourable than those between the individual components themselves [6]. Typically, the most observed favourable interactions are hydrogen bonding interactions. As a result, the lowering in the melting point is often attributed to the formation of strong hydrogen bonds (HBs), which arise from a complex interplay between a Hydrogen Bond Donor (HBD) and a Hydrogen Bond Acceptor (HBA) species [1,3].
The growing interest in DESs stems from several attractive properties, including their cost-effective production and simple preparation. Additionally, considering the broad liquid window made accessible by the deep eutectic nature, they offer the opportunity to tailor their solvating properties by adjusting their chemical composition, carefully selecting both the HBD and HBA. This tunability allows for the development of solvents that are often non-flammable, biocompatible, and low in toxicity [7].
DESs, depending on the nature of the HBA and HBD species, can be classified into five distinct "Types". In Type I, II, and III, the HBA is always a quaternary ammonium salt, with each type differing by the nature of the HBD: in Type I, a metal chloride is used as the HBD; in Type II, hydrated metal chlorides are employed; and in Type III, small organic molecules are used as generic HBDs. Type IV represents a hybrid between Types II and III, where hydrated metal chlorides interact with small organic molecules serving as HBDs. Finally, Type V involves the combination of non-ionic species as both HBA and HBD [6,8].
The most common type is Type III, where choline chloride (ChCl) reigns supreme as the quaternary ammonium salt used [3,9,10,11,12,13,14]. ChCl is commonly used as a nutritional additive and a safe supplement in animal feed. It has been approved for use by the Environmental Protection Agency (EPA) as an inert ingredient in pesticide products without numerical limitation for pre-harvest use (40 CFR 180.920). It has also been designated as a GRAS (Generally Recognized as Safe) compound and is approved by the Food and Drug Administration (FDA) as a human nutrient under 21 CFR 182.8252 and as a nutrient in animal feeds under 21 CFR 582.5252. Accordingly, ChCl-based DESs are generally considered non-toxic and biodegradable [15].
Recently, the combination of ChCl and water has been investigated for the development of a deep eutectic mixture that can be regarded sustainable from all viewpoints, resulting in the formation of a new class of DESs known as water-based DESs (wb-DESs) [16,17].
In the sustainability context, and by leveraging the task-specific properties of DESs, alternative anions paired with choline have been explored. Recently, choline acetate (ChAc) has been proposed as a component of a DES. ChAc is a fully bio-derived ionic liquid (IL), making it more biodegradable, biocompatible, and cost-effective compared to traditional imidazolium-based ILs [18]. ChAc was efficiently utilized as a HBA in conjunction with several HBDs, including urea, ethylene glycol, and glycerol, to create DESs [19,20], particularly for enzyme stabilization and increase of their activity [21,22,23,24,25], but also in the framework of hemicellulose solubilization [26]. Recently, due to the strong water affinity of ChAc, its combination with water was utilized for the extraction of several algicidal chemicals from mango waste [27]. Additionally, a thorough thermophysical analysis, combined with Density Functional Theory (DFT) calculations, was performed to better understand the solute-solvent interactions in highly diluted aqueous solutions of ChAc across a broad concentration range, highlighting the existence of strong ion-water interactions [28].
The integration of water and ChAc has been explored particularly in the domain of electrochemistry for the advancement of aqueous electrolytes. A recent study demonstrated that water containing ChAc can be effectively utilized as an electrolyte in Zn-ion devices, resulting in great performance with a capacity of approximately 200 mW·h·g-1 over 20 cycles [29]. Furthermore, a 30 wt% aqueous solution of ChAc was effectively employed as an electrolyte in Zn-Air cells, demonstrating good reversible capacity and energy efficiency [30]. Additionally, the ion-ion and solvent interactions of ChAc in both protic water and aprotic dimethyl sulfoxide was also explored through concentration-dependent NMR, with the aim of utilizing ChAc-based electrolytes for Zn-air battery technologies [31]. The mixture of ChAc and water was also studied in the context of DESs formation. Miao et al. investigated numerous ChAc aqueous solutions with varied percentages of water and identified the ChAc/water mixture with the 35 wt% of water as the one having the deep eutectic behaviour [32].
Given the necessity of developing new sustainable and environmentally appropriate DESs like the aforementioned wb-DESs [16,17,33], this study presents a thorough physicochemical analysis of various ChAc/water mixtures with diverse water:ChAc molar ratios (n) in a range between 2 and 6. First, a thermodynamic analysis was carried out using Differential Scanning Calorimetry (DSC) measurements, comparing with the corresponding findings with Miao et al. data set [32]. Next, density, viscosity, electrical conductivity, and refractive index of all the mixtures were measured between 278 and 323 K. Finally, 1H NMR experiments were utilized to calculate chemical shifts, relaxation times, and the choline, acetate, and water diffusion coefficients as a function of water content. Despite the lack of experimental data for systems with n < 2, NMR experiments suggested a more rigid hydrogen-bonding network for n=2, likely indicative of DES-like behaviour. On this basis, the structural organization of the n = 2 mixture was investigated through a combined approach involving X-ray scattering experiments (SAXS and WAXS) and ab initio molecular dynamics (AIMD) simulations.
2. Experimental Methods
2.1. Chemicals
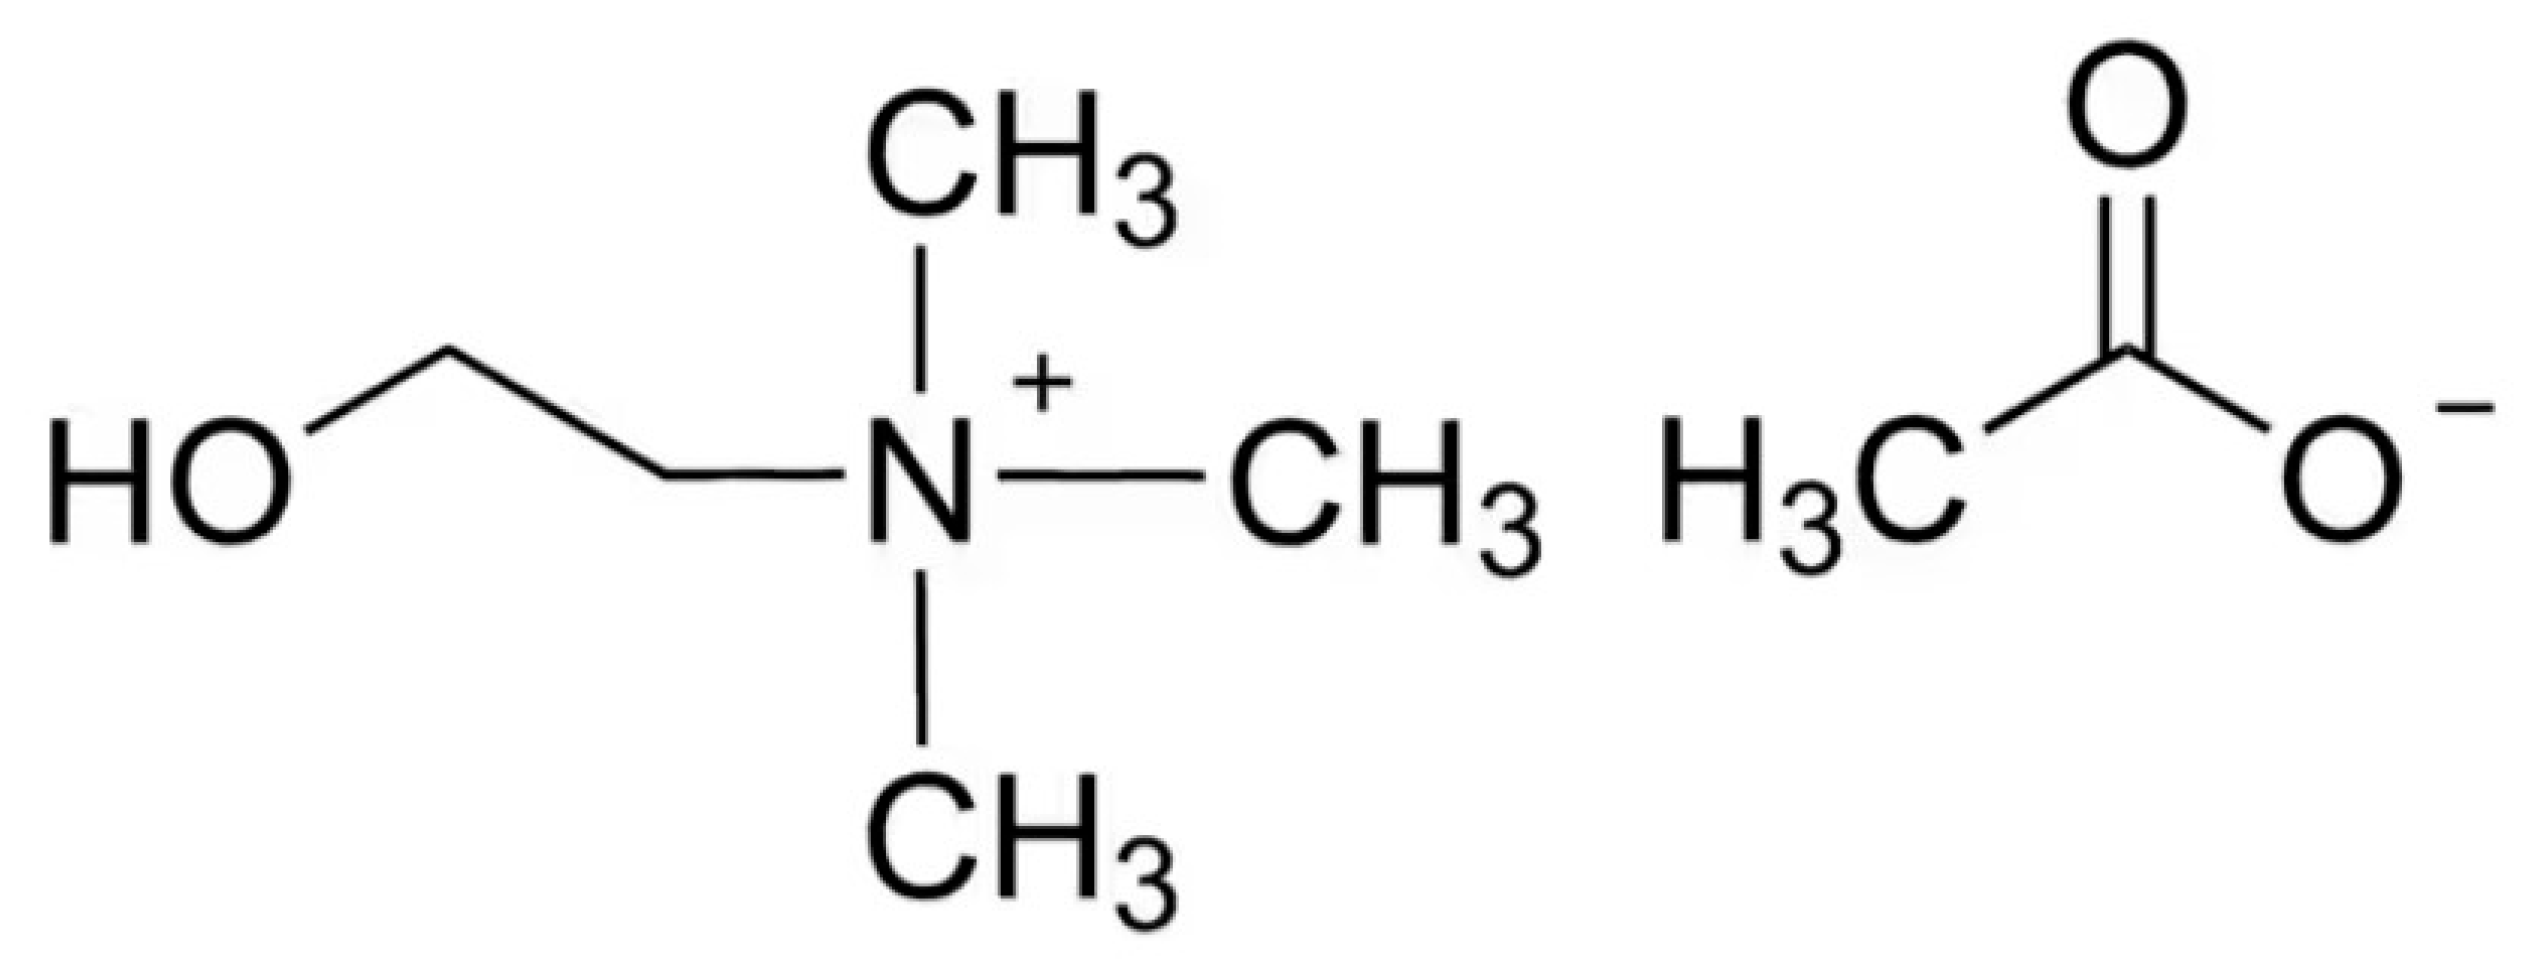
Choline Acetate (ChAc, Scheme 1) was purchased by Iolitec (purity: 98%). Prior to preparation of ChAc/water mixtures, ChAc was dried under high vacuum at 303 K for approximately 8 days to remove any trace of moisture and then stored under anhydrous conditions. The dried ChAc was precisely weighed inside a glove box, and MilliQ water was subsequently added to prepare mixtures with different water:ChAc molar ratios n (n = 2, 3, 4, 5, and 6, corresponding to molar fraction 0.33 > xChAc > 0.14). Mixtures were continually stirred at around 303 K until transparent and homogenous liquids were achieved.
Scheme 1.
Schematic representation of ChAc.
2.2. DSC Measurements
DSC experiments were performed using a Mettler Toledo DSC 822 with an FRS5 sensor and provided with a liquid nitrogen cooling system. During experiments, the furnace was purged with dry nitrogen at a flow rate of 30 ml/min. The samples, ranging in weight from 5 mg to 9 mg, were carefully weighed using a Mettler MT5 analytical balance (uncertainty of 0.005 mg). The samples were then placed in a 40 μl metal pan and quickly sealed.
Finally, mixtures were subjected to a temperature program that included dynamic cooling from 293 K to 143 K at a rate of 10 K/min, followed by heating from 143 K to 319 K with a scanning rate of 10 K/min.
2.3. Density Measurements
Density (ρ) experiments were conducted using a Mettler Toledo Density Meter DM45 DeltaRange at temperatures ranging from 278.15 K to 323.15 K. A standard calibration procedure using dry air and bi-distilled water at 293.15 K was conducted.
2.4. Viscosity Measurements
An Anton Paar micro viscosimeter, the Lovis 2000 M/ME model, was used to measure dynamic viscosity (η) with a 0.5% accuracy. Peltier elements were used to regulate the temperature to within 0.02 K. Calibrated glass capillaries with varied sizes (1.59 mm, 1.80 mm, and 2.50 mm) were then used for measurements and chosen depending on the desired viscosity range. These measurements took place within a temperature range of 278.15 K to 323.15 K.
2.5. Electrical Conductivity Measurements
A Mettler Toledo Five Easy FE30 conductivity meter was used to measure electrical conductivity (ec) at temperatures ranging from 278.15 K to 313.15 K. The instrument used an LE703 conductivity electrode with a cell constant of 0.73 cm⁻¹. Temperature was controlled using an adequate experimental setup that included a thermostatic bath, with an accuracy of 0.1 K.
2.6. Refractive Index Measurements
The refractive index (nD) values at the Na D line (589 nm) were determined using an Abbe Refractometer 2AWJ from Optika. The instrument can measure refractive indices between 1.3 and 1.7 with a resolution of 0.0005. The refractometer is equipped with a thermostat covering the temperature range of 278.15 K to 343.15 K. Measurements were carried out at intervals of 10 K within the temperature range from 283.15 K to 313.15 K.
2.7. X-Ray Scattering Experiments
2.7.1. Small Angle X-Ray Sscattering
Small-angle X-ray scattering (SAXS) experiments were carried out at the SAXSLab, Sapienza University of Rome, using a Xeuss 2.0 Q-Xoom system (Xenocs SA, Sassenage, France). The instrument is equipped with a micro-focused Genix 3D X-ray source (λ = 0.1542 nm) and a two-dimensional Pilatus3 R 300K detector, which allows for variable sample-to-detector distances. The scattering vector Q, defined as Q=(4πsinθ)/λ, with θ representing the scattering angle, was calibrated using a silver behenate reference standard. To cover a broad Q-range (0.1 < Q (Å-1) < 1.7), measurements were performed at multiple sample-detector distances. The probed sample was sealed in a quartz capillary (1.0 mm nominal thickness) using hot glue and placed in the instrument’s sample chamber under reduced pressure (~0.2 mbar). The raw two-dimensional scattering images were corrected for dark current, masked, azimuthally averaged, and normalized with respect to incident beam intensity, exposure time, and solid angle per pixel. All data reduction steps were carried out using the FoxTrot software developed at SOLEIL. Subsequently, the capillary background was subtracted to obtain the final one-dimensional scattering profiles (I(Q) vs. Q).
2.7.2. Wide Angle X-Ray Scattering
The x-ray scattering experiment was performed at Diamond Light Source (UK) using the I15-1 XPDF line with an energy of 76.69 keV (0.161669 Å). Data were acquired on a Perkin Elmer XRD 4343CT positioned at a distance of 700 mm, with a beam stop put on the detector to gather low angle scattering. The sample was put into a 2 mm borosilicate capillary and properly sealed with hot glue. Capillary was then put onto the beamline using an automatic robotic system and the measurements was executed for approximately 10 minutes at room temperature, with relevant background and empty capillary readings collected for processing.
2.8. NMR Measurements
All samples were transferred to 5 mm NMR tubes, equipped with a capillary containing deuterated water (D2O), used as chemical shift reference and for lock. NMR measurements were performed on a Bruker NEO 500 console (11.74 T) equipped with a direct observe BBFO (broadband including fluorine) iProbe. 1H spectra were recorded with 4 scans using 32768 points and SW=8 ppm. 1H and 13C-{1H} T1 relaxation measurements were carried out using standard inversion recovery (IR) technique. 13C-{1H} spectra were acquired for delay time τ, in the range 0.05-200 s and data matrices of 16384 (t2) × 16 (t1), with 8 transients per increment, over a spectral width of 200 ppm. 1H data were recorded for various delay time τ, in the range 0.05-8 s with and data matrices of 16384 (t2) × 16 (t1), with 8 transients per increment, over a spectral width of 8 ppm. Data were processed using a mono-exponential or bi-exponential fitting function (R2=0.999). 1H diffusion coefficients were measured using the bipolar pulse longitudinal eddy current delay (BPP-LED) pulse sequence. The pulse gradients were incremented from 2 to 95% of the maximum gradient strength in a linear ramp with 32 steps using a pulsed gradient unit capable of producing sine-shaped magnetic field pulse gradients in the z-direction of 53 G cm-1. All experiments were carried out with pulse gradient δ=2.4-3 ms, diffusion time Δ=0.2-0.6 ms, 8 scans, and a relaxation delay of 10 seconds. Experimental errors are within 2%. The temperature was set at 300-320 K and controlled with air flow.
2.9. Computational Details
To investigate the n=2 system by means of quantum chemical methods, ab initio molecular dynamics (AIMD) simulations have been performed with the CP2k program package [36,37], using the Quickstep method [38] and Orbital Transformation (OT) [39]. The electron structure was described by Kohn-Sham density functional theory (KS-DFT) [40,41] with the BLYP exchange-correlation functional [42,43] together with the empirical D3 dispersion correction [44,45], using the revised damping parameters of Smith et al. [46]. Atom-centered basis sets of the type DZVP-MOLOPT-SR-GTH [47] and GTH pseudopotentials [48,49] were applied, and the plane-wave energy cutoff was set to 350 Ry. The simulation was performed in NVT ensemble; the temperature was kept at 350 K with a Nose-Hoover chain (NHC) thermostat [50,51] using a time constant of 100 fs. The equations of motion were integrated with time step of 0.5 fs. The AIMD simulation was running for 330 ps (660‘000 steps), of which the first 50 ps were discarded as equilibration.
The initial configuration for the AIMD simulation was obtained as follows: 35 ion pairs of ChAc and 70 water molecules were randomly distributed in a cell by using the Packmol software [52]. An initial pre-equilibration was performed via force field MD using the Lammps package [53], modeling water with the TIP4P-EW force field [54] and ChAc with Acevedo’s parameters [55]. The bonds and angles in water were kept fixed with the SHAKE algorithm [56,57]. The Lennard-Jones and Coulomb cutoff was set to 800 pm, and long-range electrostatic interactions were described by a PPPM solver as implemented in Lammps. The simulation protocol was as follows. After a short (25 ps) NVT simulation with a Berendsen thermostat [58] (coupling constant 5.0 fs) at 450 K, a first NpT run for 1.0 ns followed, using a Nosé–Hoover thermostat [50,51] (coupling constant of 100 fs) and a Nosé–Hoover barostat (coupling constant of 2000 fs). Subsequently, the temperature was ramped down to 350 K in NVT ensemble, followed by another NpT run for 500 ps (parameters as above). Then, a Langevin thermostat [59,60] was applied for 500 ps to dampen acoustic shock waves in the system due to the changing cell size. During a long (4 ns) NpT run, the average cell density was computed, and the cell size was then scaled to this value and kept fixed from now on. The temperature was again ramped up to 450 K to allow for proper orientation of the molecules, and after additional 2 ns simulation at increased temperature, the system was cooled down to 350 K. Finally, 20 ns of equilibration were performed in NVT ensemble to obtain the initial configuration for the AIMD simulation. The resulting cell density was found to be 1.035 g cm-1, corresponding to a cubic cell size of around 2.2 nm.
3. Results and Discussion
The thermal behaviour of ChAc/water mixtures at different molar ratios n (n=2-6) has been monitored by Differential Scanning Calorimetry (DSC) measurements. Heating traces are shown in Figure 1.
Figure 1.
DSC heating (10 K/min) traces of ChAc/water mixtures at different molar ratios n.
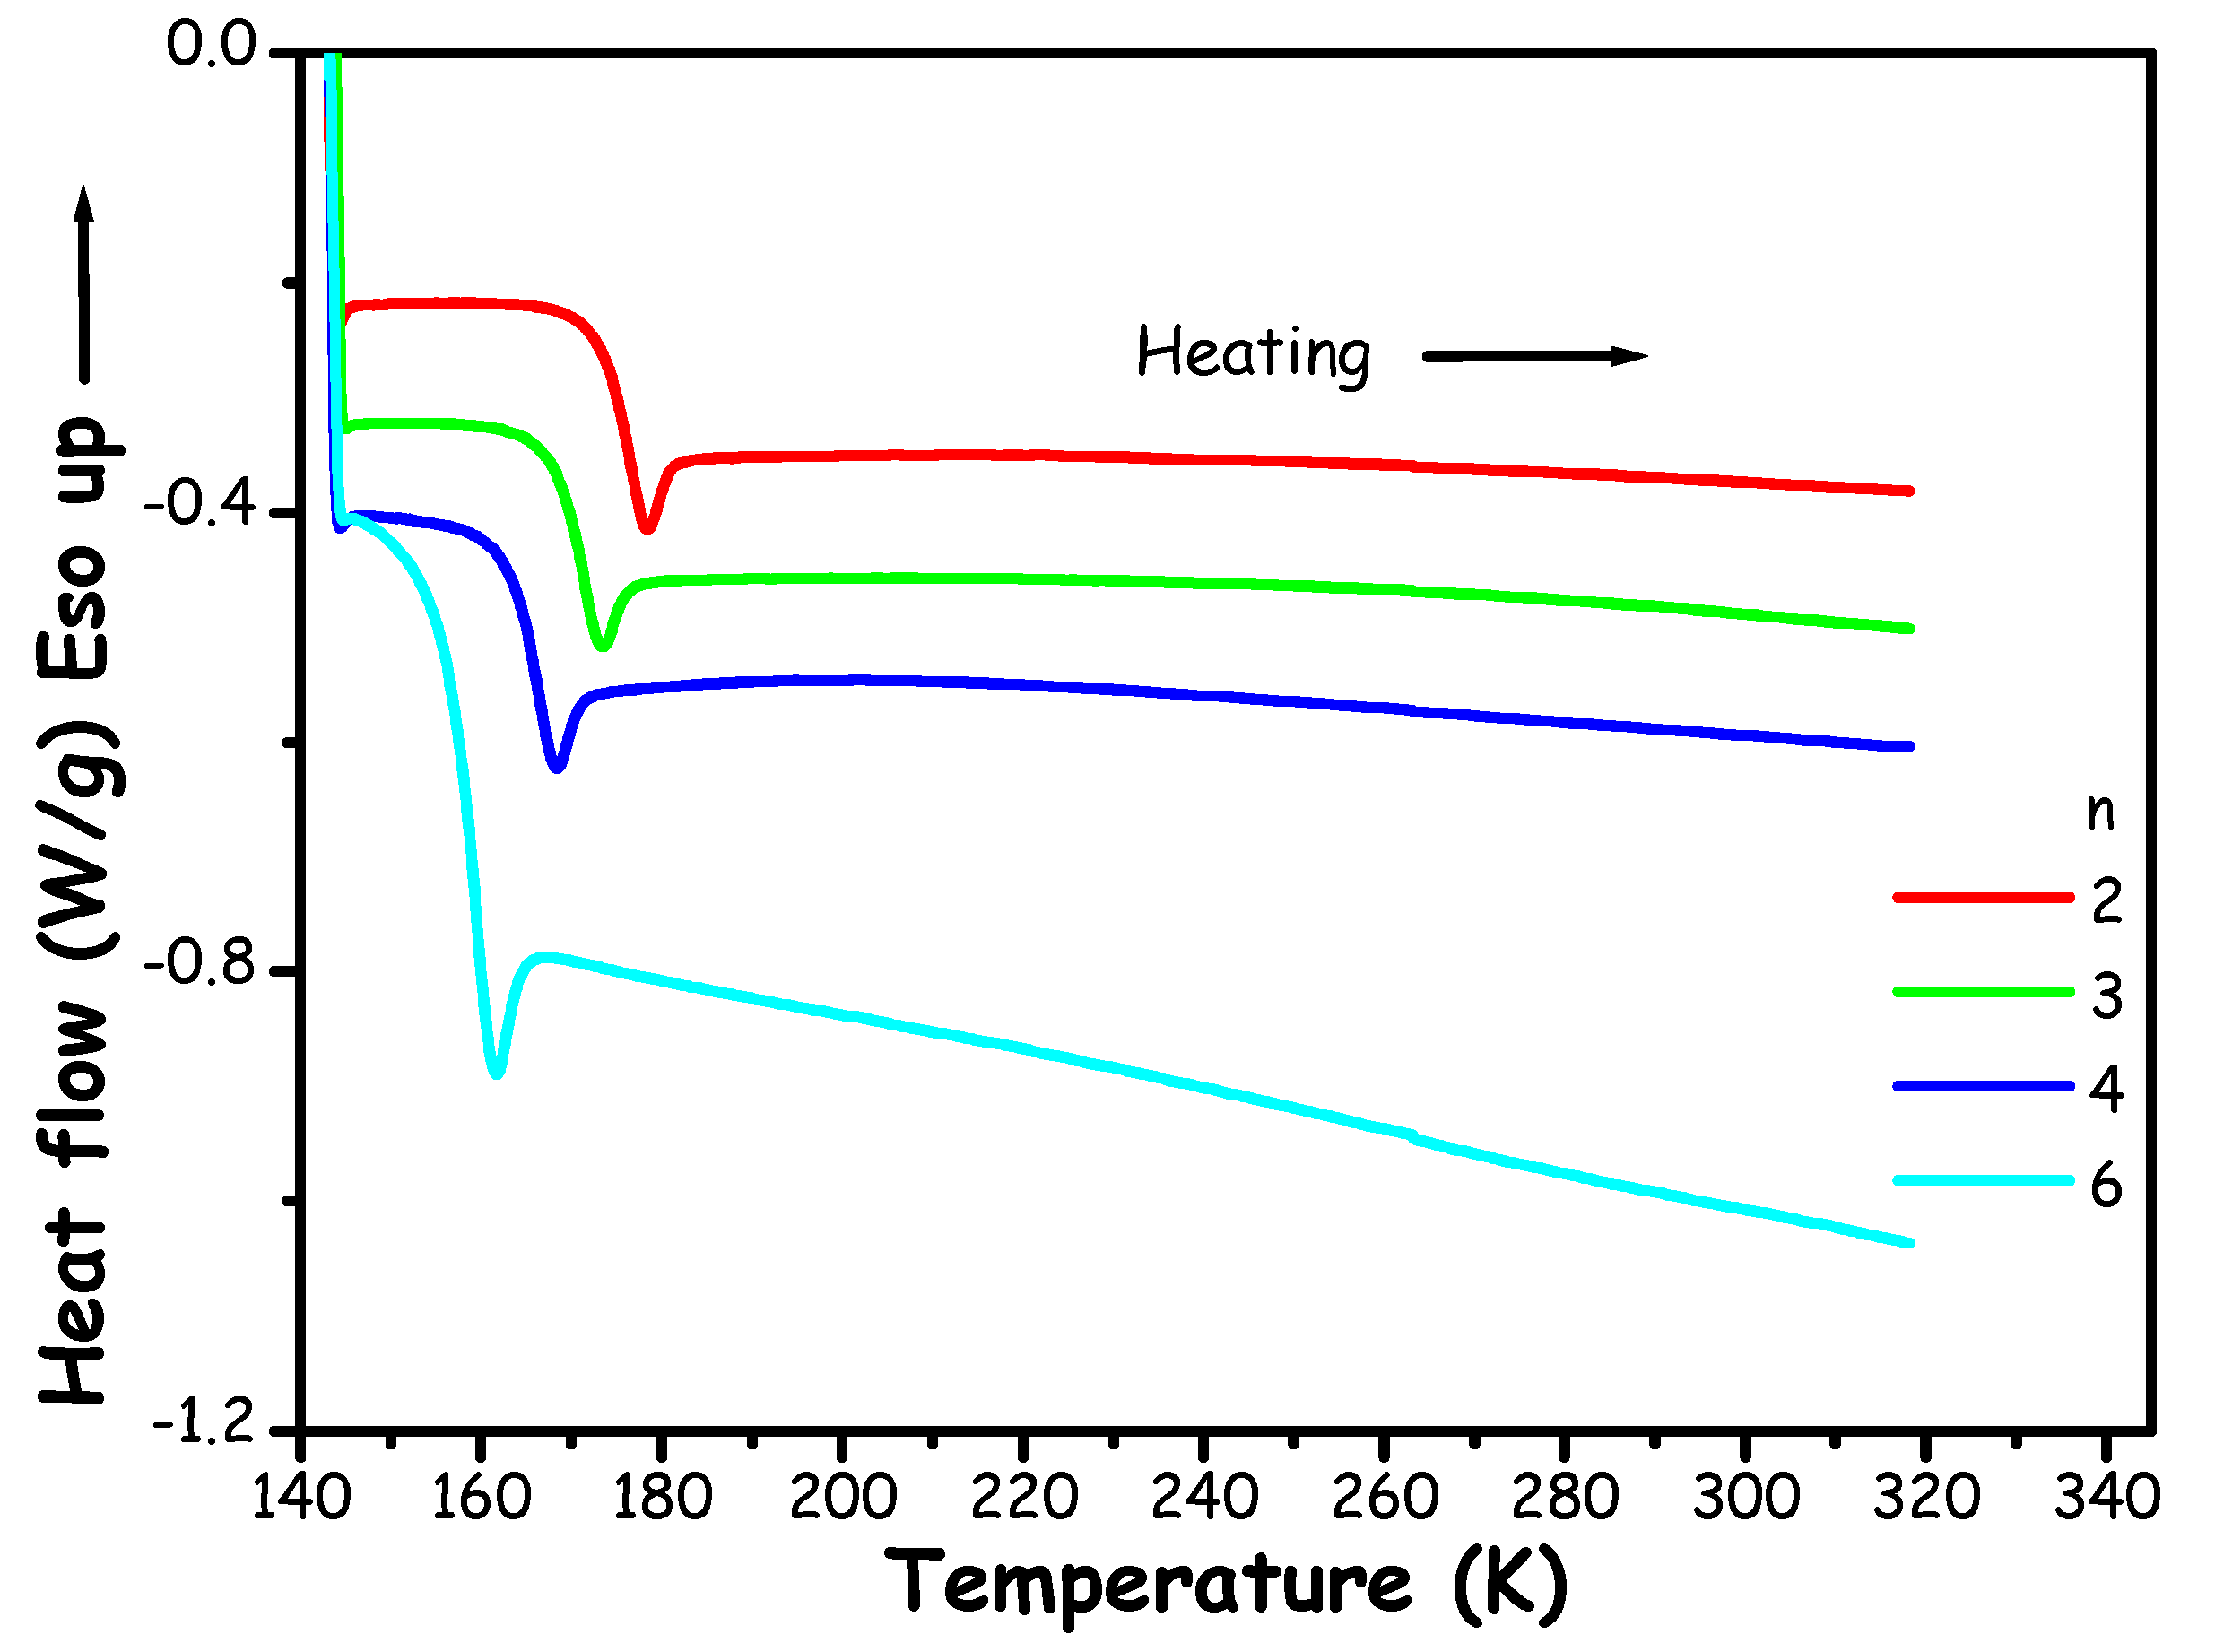
Figure 1 shows that the thermograms consistently reveal merely the presence of a glass transition (Tg), in the range 150-180 K. This second-order phenomenon occurs when temperature rises and an amorphous solid transform into a subcooled liquid. In particular, in the present data sets, the glass transition is superimposed to an enthalpic recovery endotherm, which manifests as an endothermic peak. This feature is typically due to sample aging. The present experiment set did not allow to detect crystallization events and/or the corresponding melting ones: the mixtures invariably maintained amorphous/liquid within the investigated temperature range, far below the melting temperatures of both ChAc (362.63 K) and water (273.15 K). This allows us to reliably identify our systems at least as Low Transition-Temperature Mixtures (LTTMs), as it is not possible to discern solid-liquid equilibria data that might prompt for (deep) eutectic behaviour.
In this context, we can compare (Table S2 and Figure S1 in the ESI) our results with Miao et al. thermal transitions reported for ChAc/water mixtures [32]. Therein, we show the values obtained for the glass transition, Tg (which follow a rather linear dependence from n) and those associated to the transition indicated as melting by Miao et al.[32], Ttr. Those authors obtained their transition temperatures as “maxima of the melting endotherms”. It emerges that a reasonable agreement exists between their Ttr and our Tg values, thus suggesting that rather than melting points, those transitions might refer to enthalpy recovery features embedded into the glass transition. If this is the case (no DSC traces were provided in reference [32]), no indication that ChAc/water mixtures might be characterised by solid-liquid equilibria has been obtained in the literature and only glass transitions can be detected. Hence, the previous claim that ChAc/water mixture with n=5 corresponds to a DES is not substantiated.
From a thermodynamic perspective, our results can be compared with those from other ChAc-based mixtures. When ChAc is mixed with glycerol, ethylene glycol, and urea at different molar ratios it shows not only distinct glass transitions but also melting points [64]. On the other hand, our observations align with the results obtained for the ChAc:U (1:2) system, which displays a liquid-glass transition temperature of approximately 223 K upon cooling [20]. Additionally, our results are consistent with findings from various ChAc-based LTTMs, containing different Hydrogen Bond Donors - including urea, glycerol and ethylene glycol (1:2 ratio) – where either glass transition or no transition at all, down to 190 K, have been reported [22].
Figure 2 presents the density (ρ) values (Table S3 of the ESI) for the tested ChAc/water mixtures (n=2-6) as a function of temperature in the range 278.15 K to 323.15 K.
Figure 2.
Density (ρ) values of ChAc/water mixtures at different molar ratios n as function of temperature. The solid lines represent the description of experimental data in terms of model (1).
Figure 2.
Density (ρ) values of ChAc/water mixtures at different molar ratios n as function of temperature. The solid lines represent the description of experimental data in terms of model (1).
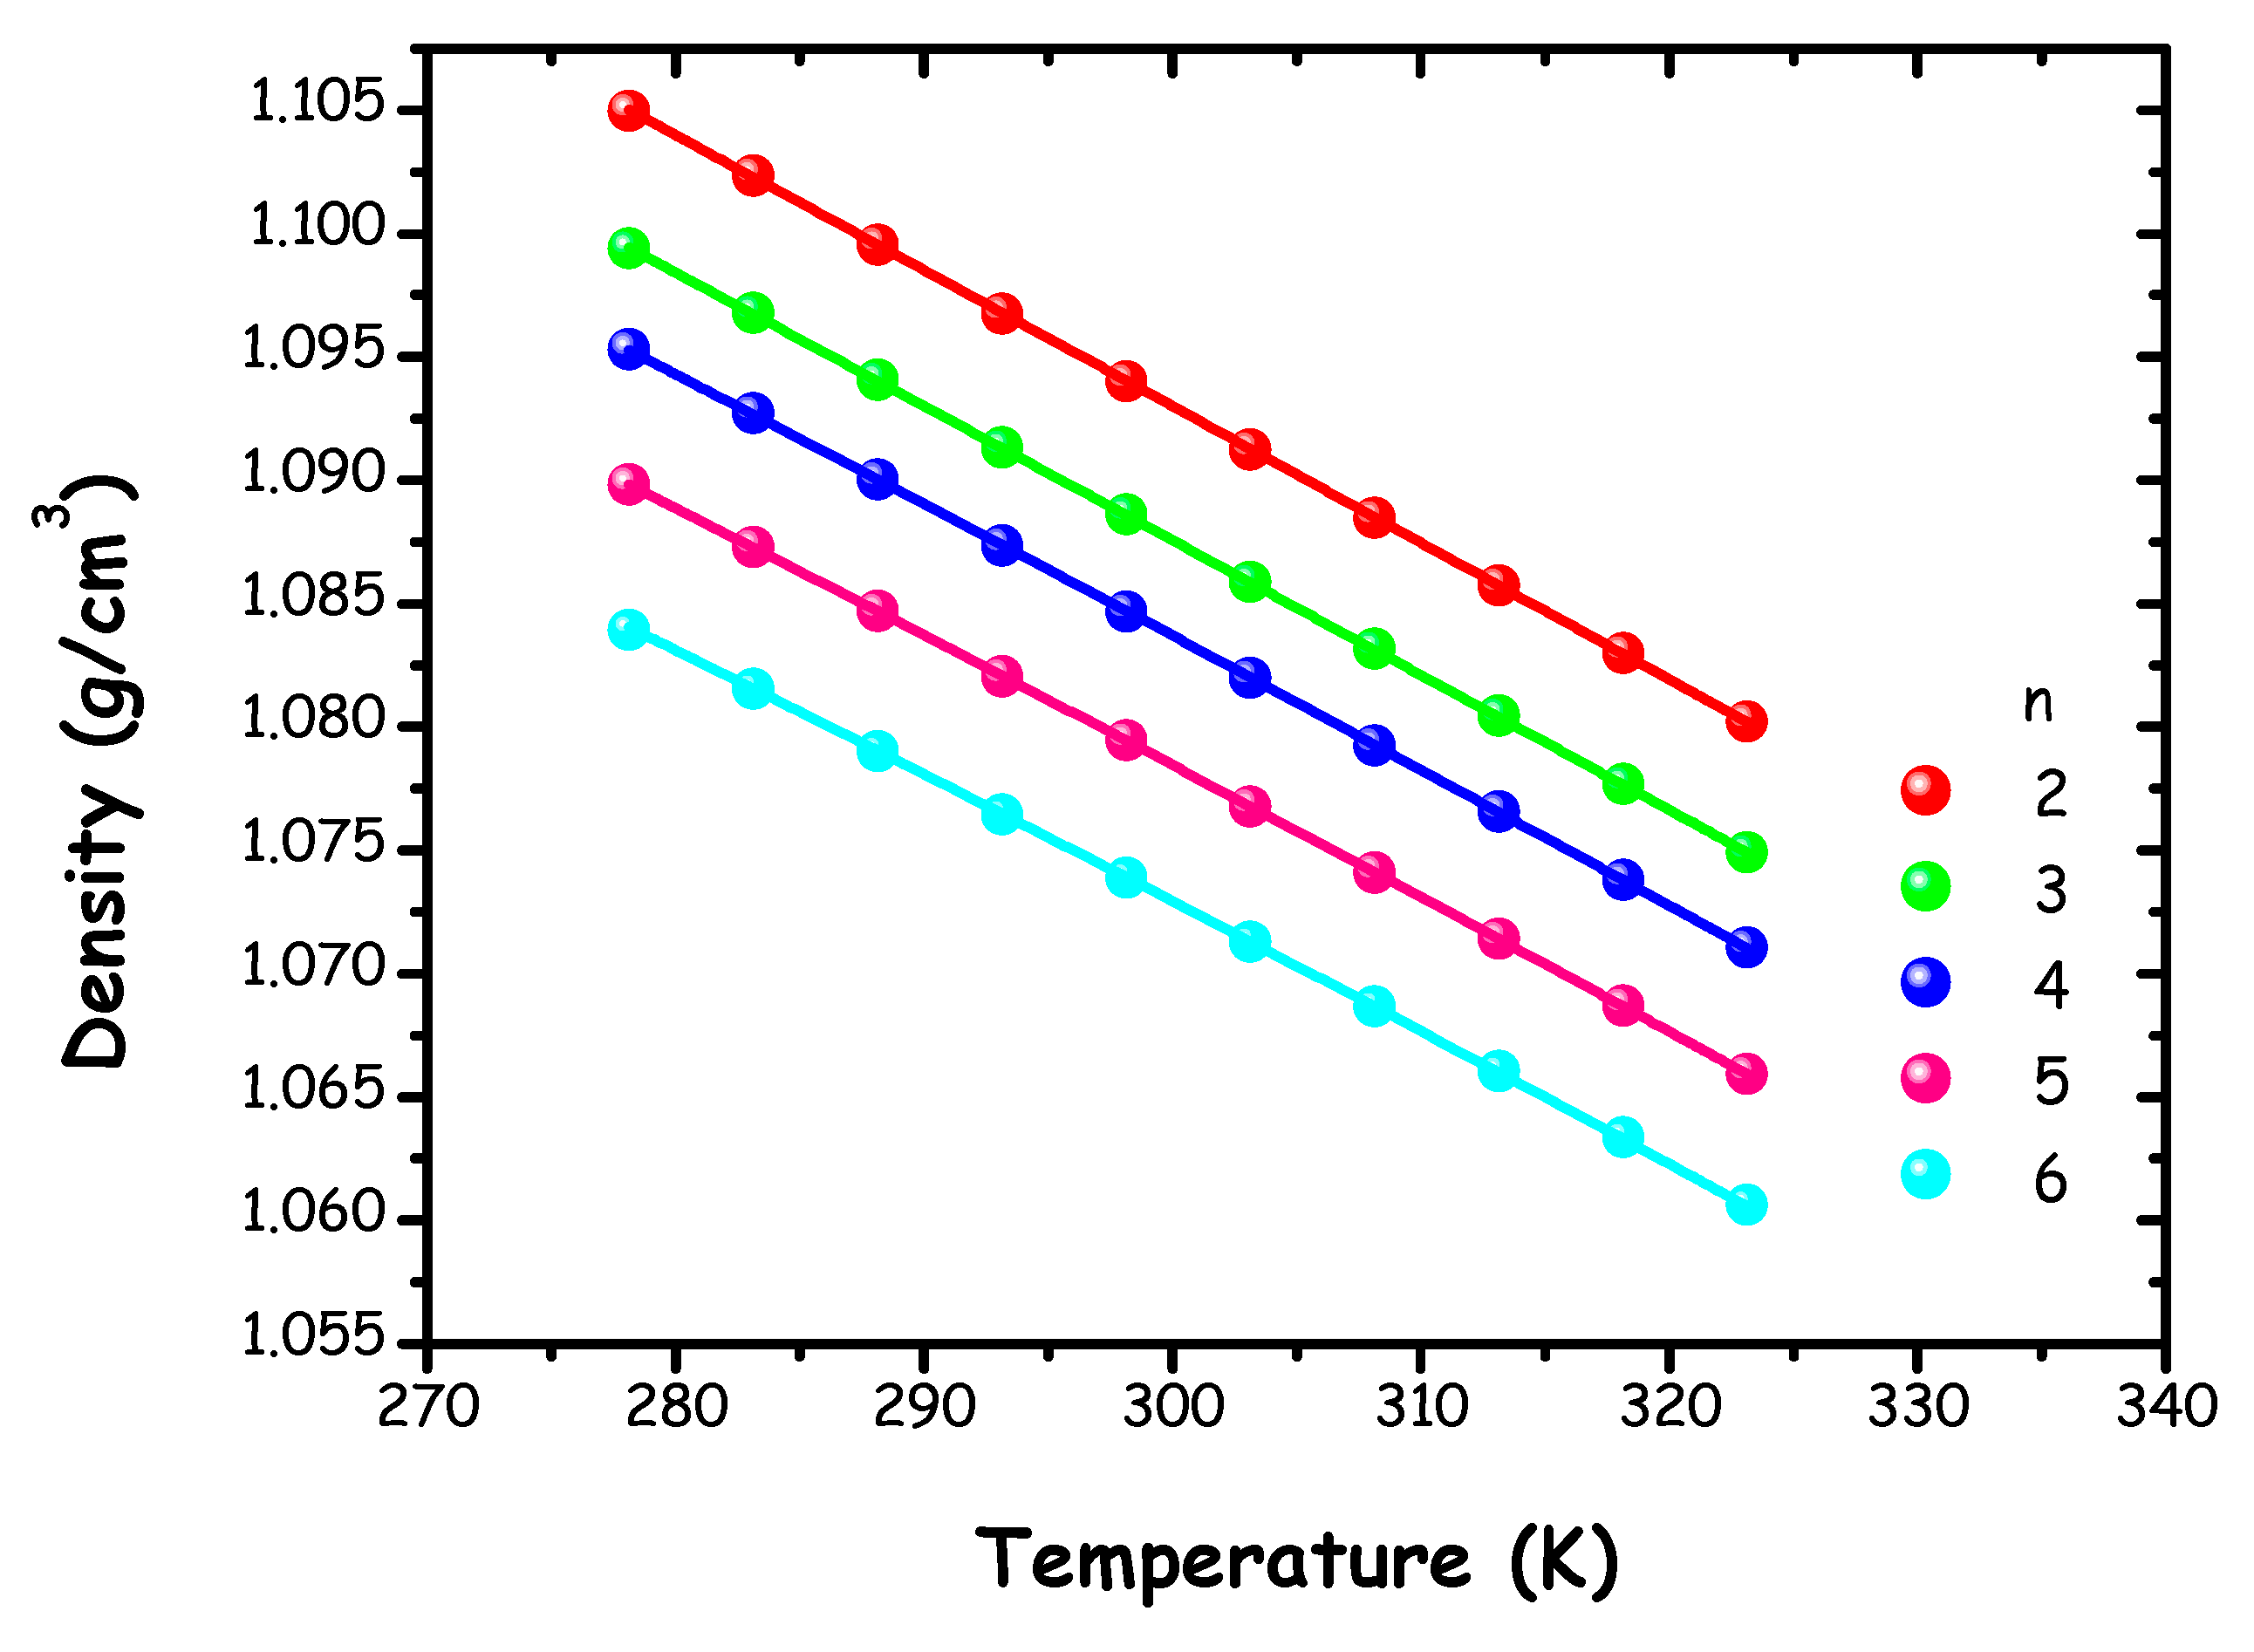
The relationship between density and temperature was evaluated through a quadratic relationship, described as follows:
(1)
where ρ (g/cm3) indicates the experimental density of the mixtures, while ρ0, B and A represent fitting parameters (Table S4 of the ESI).
A linear model is commonly used to describe the relationship between density and temperature in various DESs and/or LTTMs containing different choline salts, particularly choline chloride [13,65,66,67]. Our study opts for a quadratic model in the ρ(T) trend. This choice has been shown to result in more accurate modelling, especially across a broad temperature spectrum, similarly to the approach used in reference [16]. For comparison, Polomski et al. and Hoppe et al. have reported density measurements at 298.15 K for various ChAc-systems using diverse HBD species at 1:2 molar ratio and obtained higher density values than our study, consistently with the different nature of the involved HBD species [19,22].
Density values for each mixture at 298 K as a function of the molar ratio n are reported in Figure S2 of the ESI. A linear trend is observed between density and n, in agreement with our previous findings on ChCl/water systems within the same concentration range [16].
We also mention related density data reported by Veroutis et al., who conducted a physicochemical characterization of diluted aqueous (D2O) solutions of ChAc. Specifically, they measured the density of various ChAc and D2O mixtures across a range of salt concentrations, from 6 mM to 796 mM (corresponding to the n range between 70 and 9000). Their study reported an essentially constant density value of ρ = 1.1058 g/cm³ at ca. 296 K [31].
The thermal expansion experienced by the explored mixtures due to temperature increase can be described by the volumetric thermal expansion coefficient α. This coefficient is defined at constant pressure as:
(2)
Based on the density-temperature relationship outlined in equation (1), the α coefficient can be determined as follows:
(3)
Figure S3 in the ESI shows the thermal expansion coefficients as a function of temperature for each mixture. As illustrated, the thermal expansion coefficient displays a clear monotonic trend with increasing temperature, analogously to the ChCl/water system [16]. The rate of change, and thus the slope, increases as the water content increases, ultimately approaching the behaviour of pure water. Results in Figure S3 suggest that an isosbestic point exists at ca. 320 K. This observation is comparable to the ChCl/water case, where the curves intersected at ca. 315 K [16], suggesting a thermally activated onset of local and transient tetrabonded hydrogen bond networks in water at lower temperatures [68]. However, for the ChAc/water mixtures, this point is less clearly defined, likely due to the more limited range of mixtures explored in this study.
Dynamic viscosity (η) experiments were performed on the ChAc/water mixtures (n=2-6) over a temperature range of 278.15 K to 323.15 K (Table S5 of the ESI). Figure 3 displays the resulting data, which were modelled using the Vogel-Fulcher-Tamann (VFT) model:
(4)
Figure 3.
Dynamic viscosity (η) of ChAc/water mixtures at different molar ratios n as a function of temperature. The solid lines represent the description of experimental data in terms of model (4). In the inset, the energy of activation for viscous flow as a function of molar ratios n at 298.15 K.
Figure 3.
Dynamic viscosity (η) of ChAc/water mixtures at different molar ratios n as a function of temperature. The solid lines represent the description of experimental data in terms of model (4). In the inset, the energy of activation for viscous flow as a function of molar ratios n at 298.15 K.
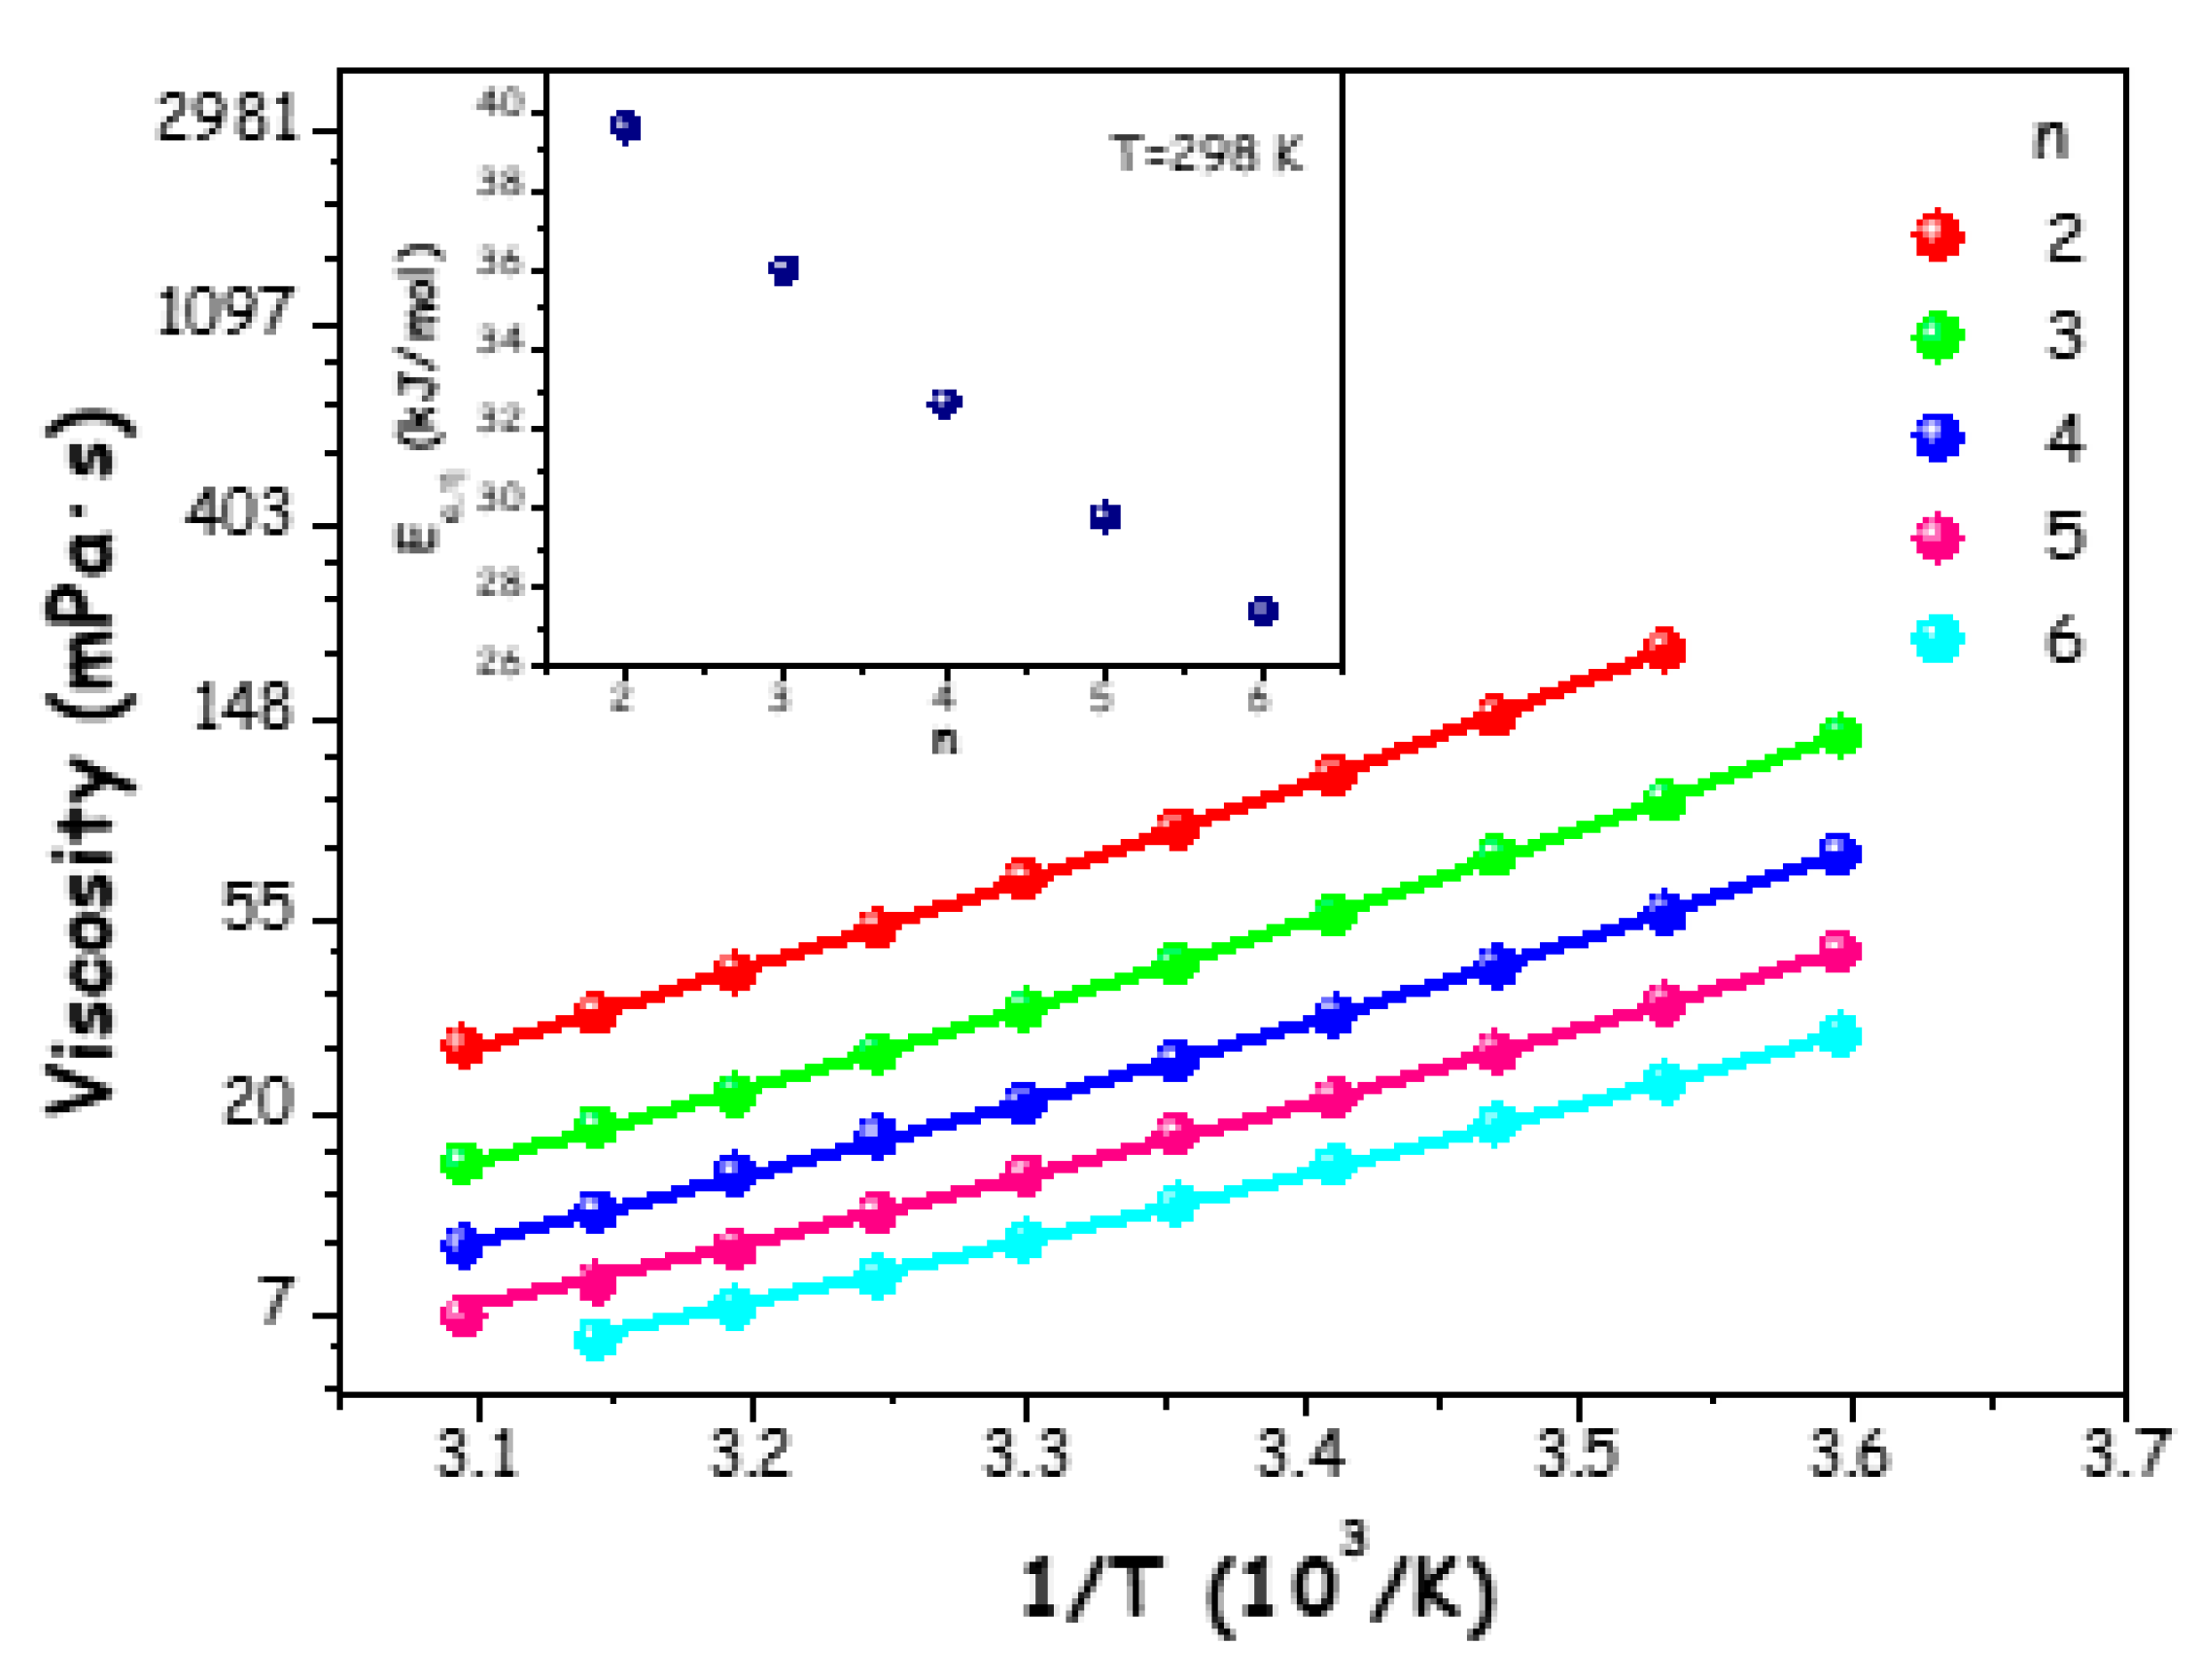
In (4) η0, D and T0 are the fitting parameters, representing the viscosity value at the high-temperature limit, a quantity associated to the activation energy, and the so-called "Vogel temperature", respectively. Fitting parameters are reported in Table S6 of the ESI.
Dynamic viscosity is one of the fundamental properties of (deep) eutectic solvents, since it plays a key role in developing solvents' applications; it is noteworthy that ChAc/water mixtures possess substantially lower dynamic viscosity values than other ChAc-based eutectic mixtures [19,22].
To have better understanding about dynamic viscosity, the activation energy for viscous flow, Ea,η, at T = 298.15 K was estimated, using the relationship:
(5)
where R denotes the gas constant (R=8.3145 J·mol-1·K-1).
Assuming viscosity is a thermally driven process, Ea,η is a physical magnitude indicating how quickly viscosity changes with temperature. Thus, this value represents the energy activation barrier that a species must overcome when exposed to a viscous flow [16,69]. In the inset of Figure 3, this energy barrier is displayed as a function of n at a temperature of 298.15 K, revealing a clear linear decrease as water content grows.
Finally, in Figure S4 of the ESI dynamic viscosity values as function of n are reported. As expected, we notice a decrease of dynamic viscosity as n increases [16]. We mention that Veroutis et al. observed significantly lower dynamic viscosity values for their highly dilute D2O solutions of ChAc at 23.5 °C [31].
The electrical conductivity (κ) of ChAc/W mixtures (n=2-6) was assessed within the temperature range of 278.15 K to 313.15 K, with corresponding values provided in Table S7 of the ESI.
Given the relationship between conductivity and dynamic viscosity, we modelled the conductivity temperature dependence by the VFT model:
ln κ = ln κo + Dκ/(T-Tκ) (6)
here, κo, Tκ, and Dκ represent fitting parameters as listed in Table S8 of the ESI.
Figure 4.
Electrical conductivity values (κ) of ChAc/water mixtures at different molar ratios n as a function of temperature. The solid lines represent the description of experimental data in terms of model (6).
Figure 4.
Electrical conductivity values (κ) of ChAc/water mixtures at different molar ratios n as a function of temperature. The solid lines represent the description of experimental data in terms of model (6).
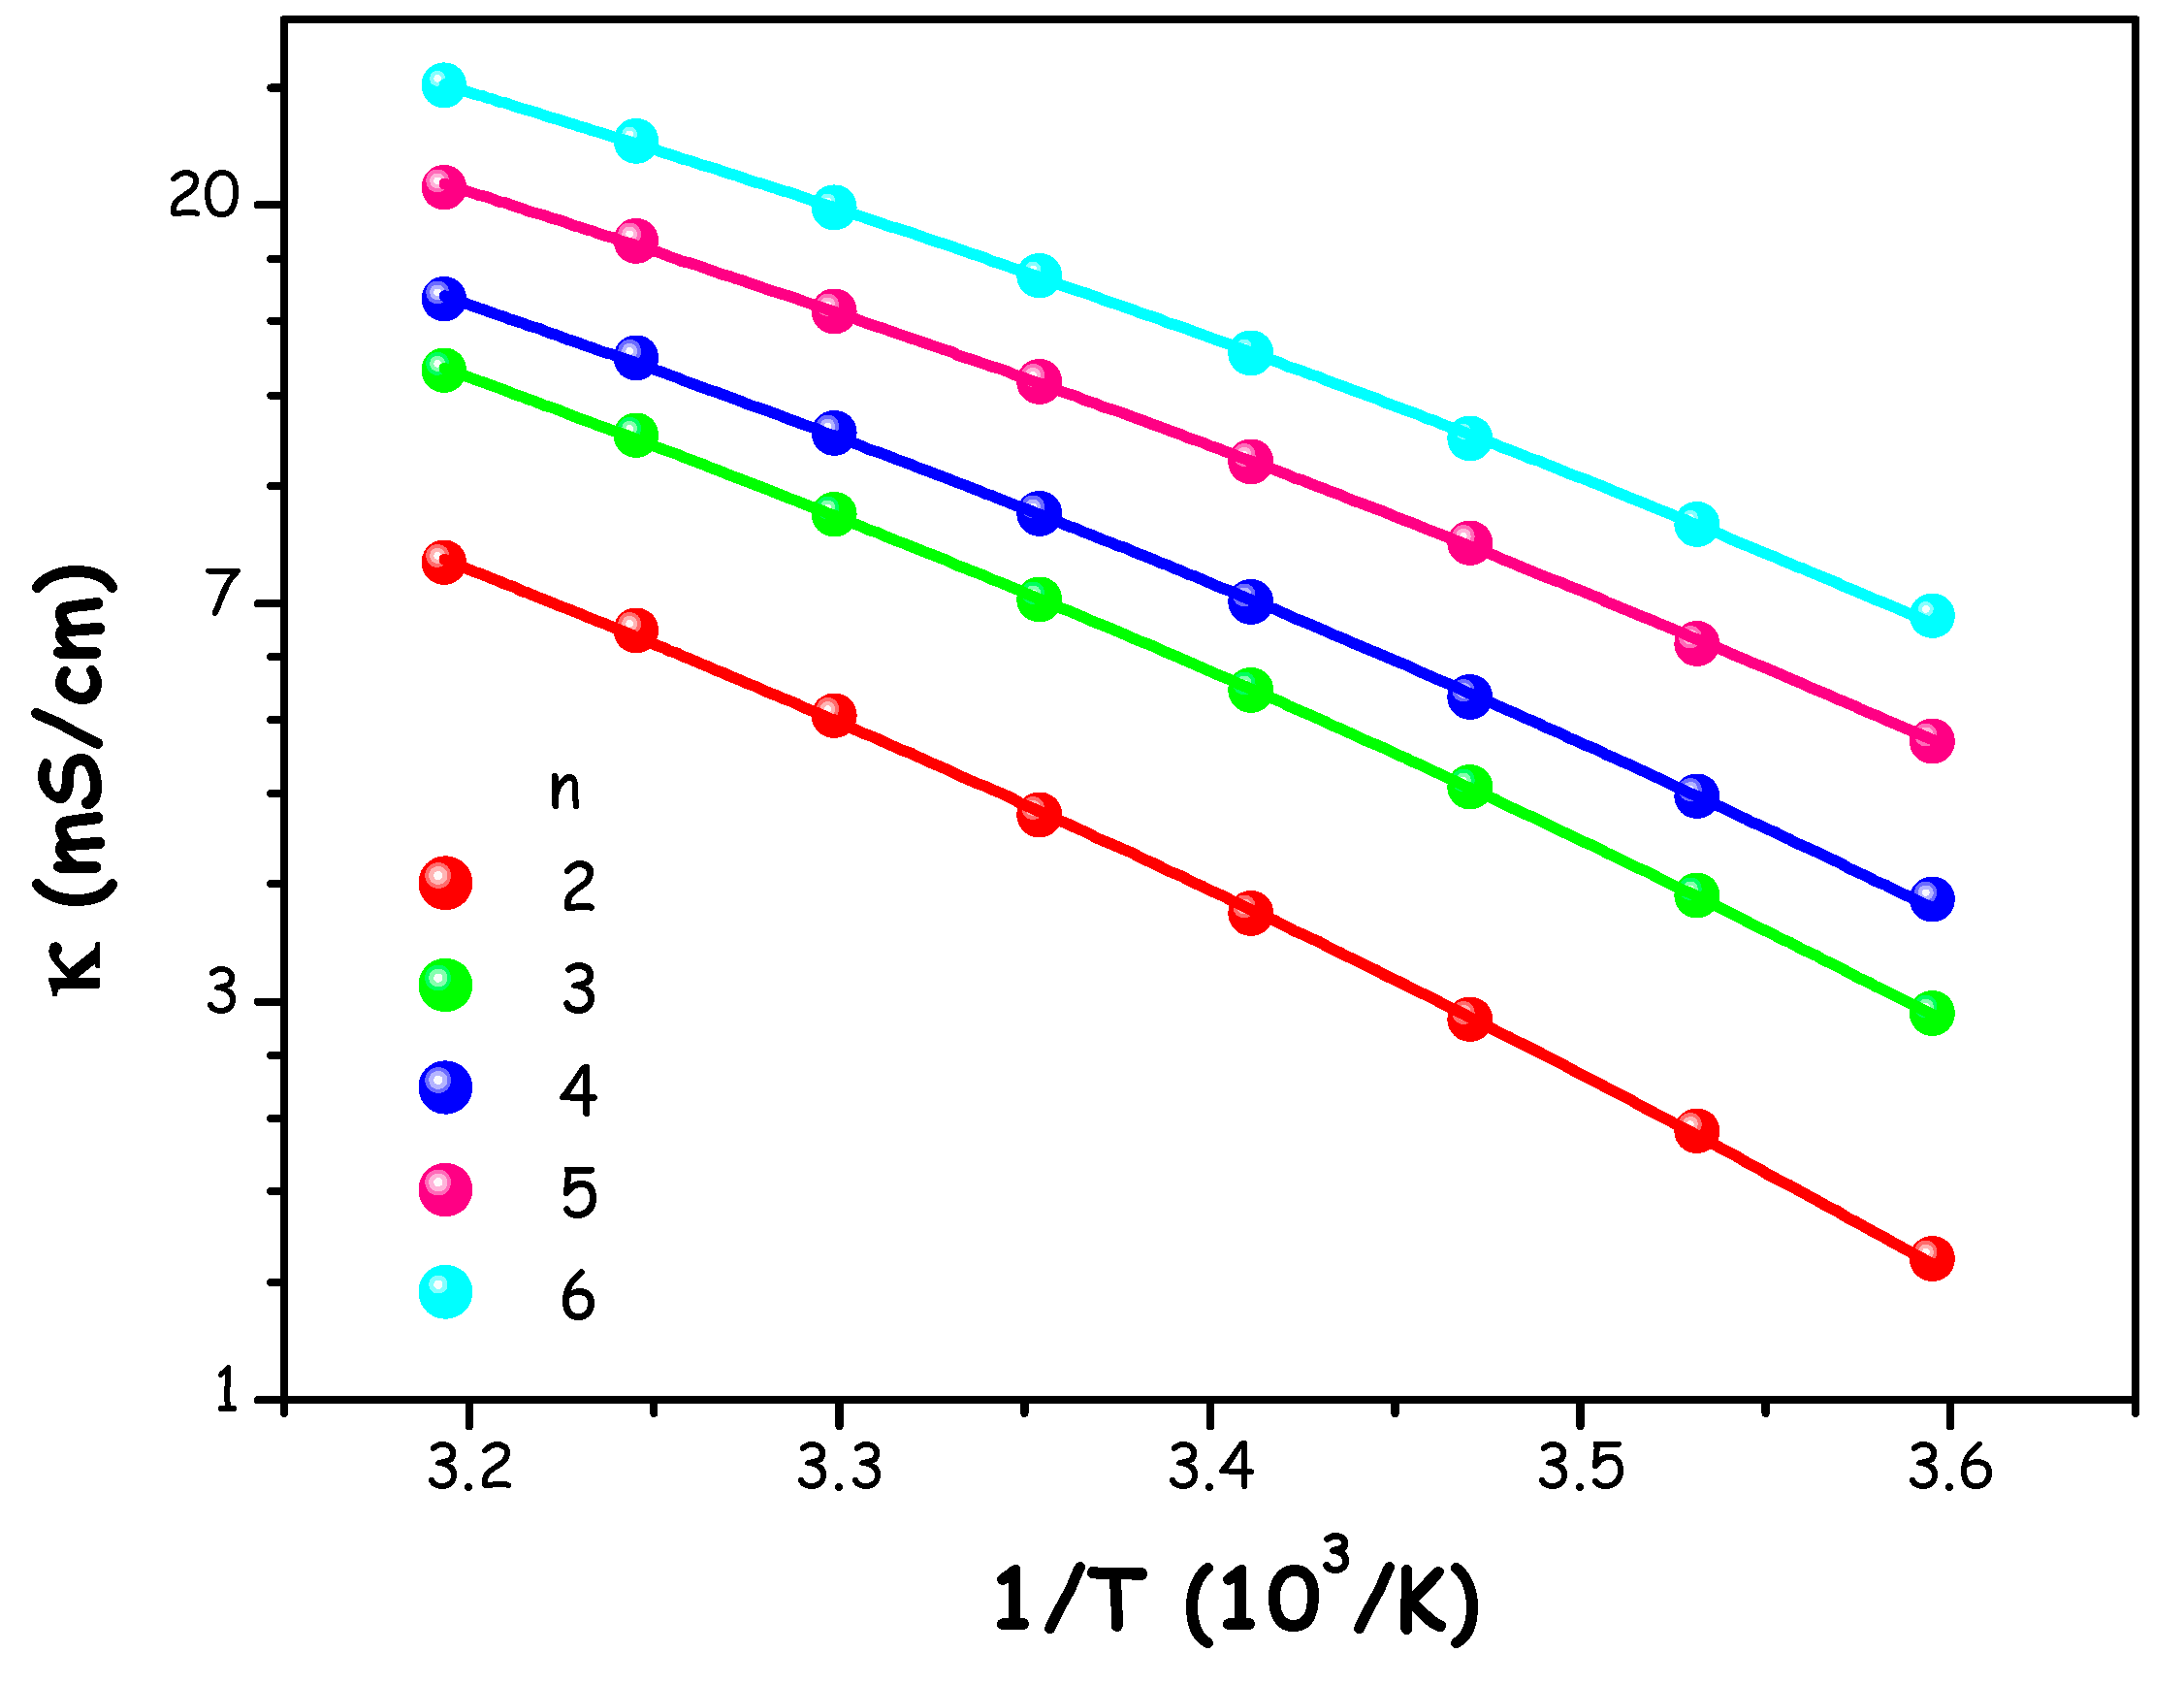
When comparing our findings with those reported by Polomski et al. and Hoppe et al., who investigated numerous binaries and ternary ChAc-based systems featuring various types of HBDs, we observe higher conductivity values at 298.15 K. Specifically, the first study reported a conductivity range of 0.24-9.93 mS/cm, whereas the second study showed a range of 0.34-4.60 mS/cm [19,22].
Finally, these mixtures were analysed to investigate the relationship between electrical conductivity and dynamic viscosity. Specifically, molar conductivity (Λ = κ·M/ρ, where M is the molar mass of the mixture and ρ is the density) is shown in Figure 5 as a function of fluidity, η-1, with the goal of examining the Walden product.
Figure 5.
Walden plot of ChAc/water mixtures at different molar ratios n and in a temperature range between 278.15 and 313.15 K. The grey dashed line represents the ideal trend for a 1 M aqueous KCl solution, the black line represents a vertically shifted (by an order of magnitude) ideal trend.
Figure 5.
Walden plot of ChAc/water mixtures at different molar ratios n and in a temperature range between 278.15 and 313.15 K. The grey dashed line represents the ideal trend for a 1 M aqueous KCl solution, the black line represents a vertically shifted (by an order of magnitude) ideal trend.
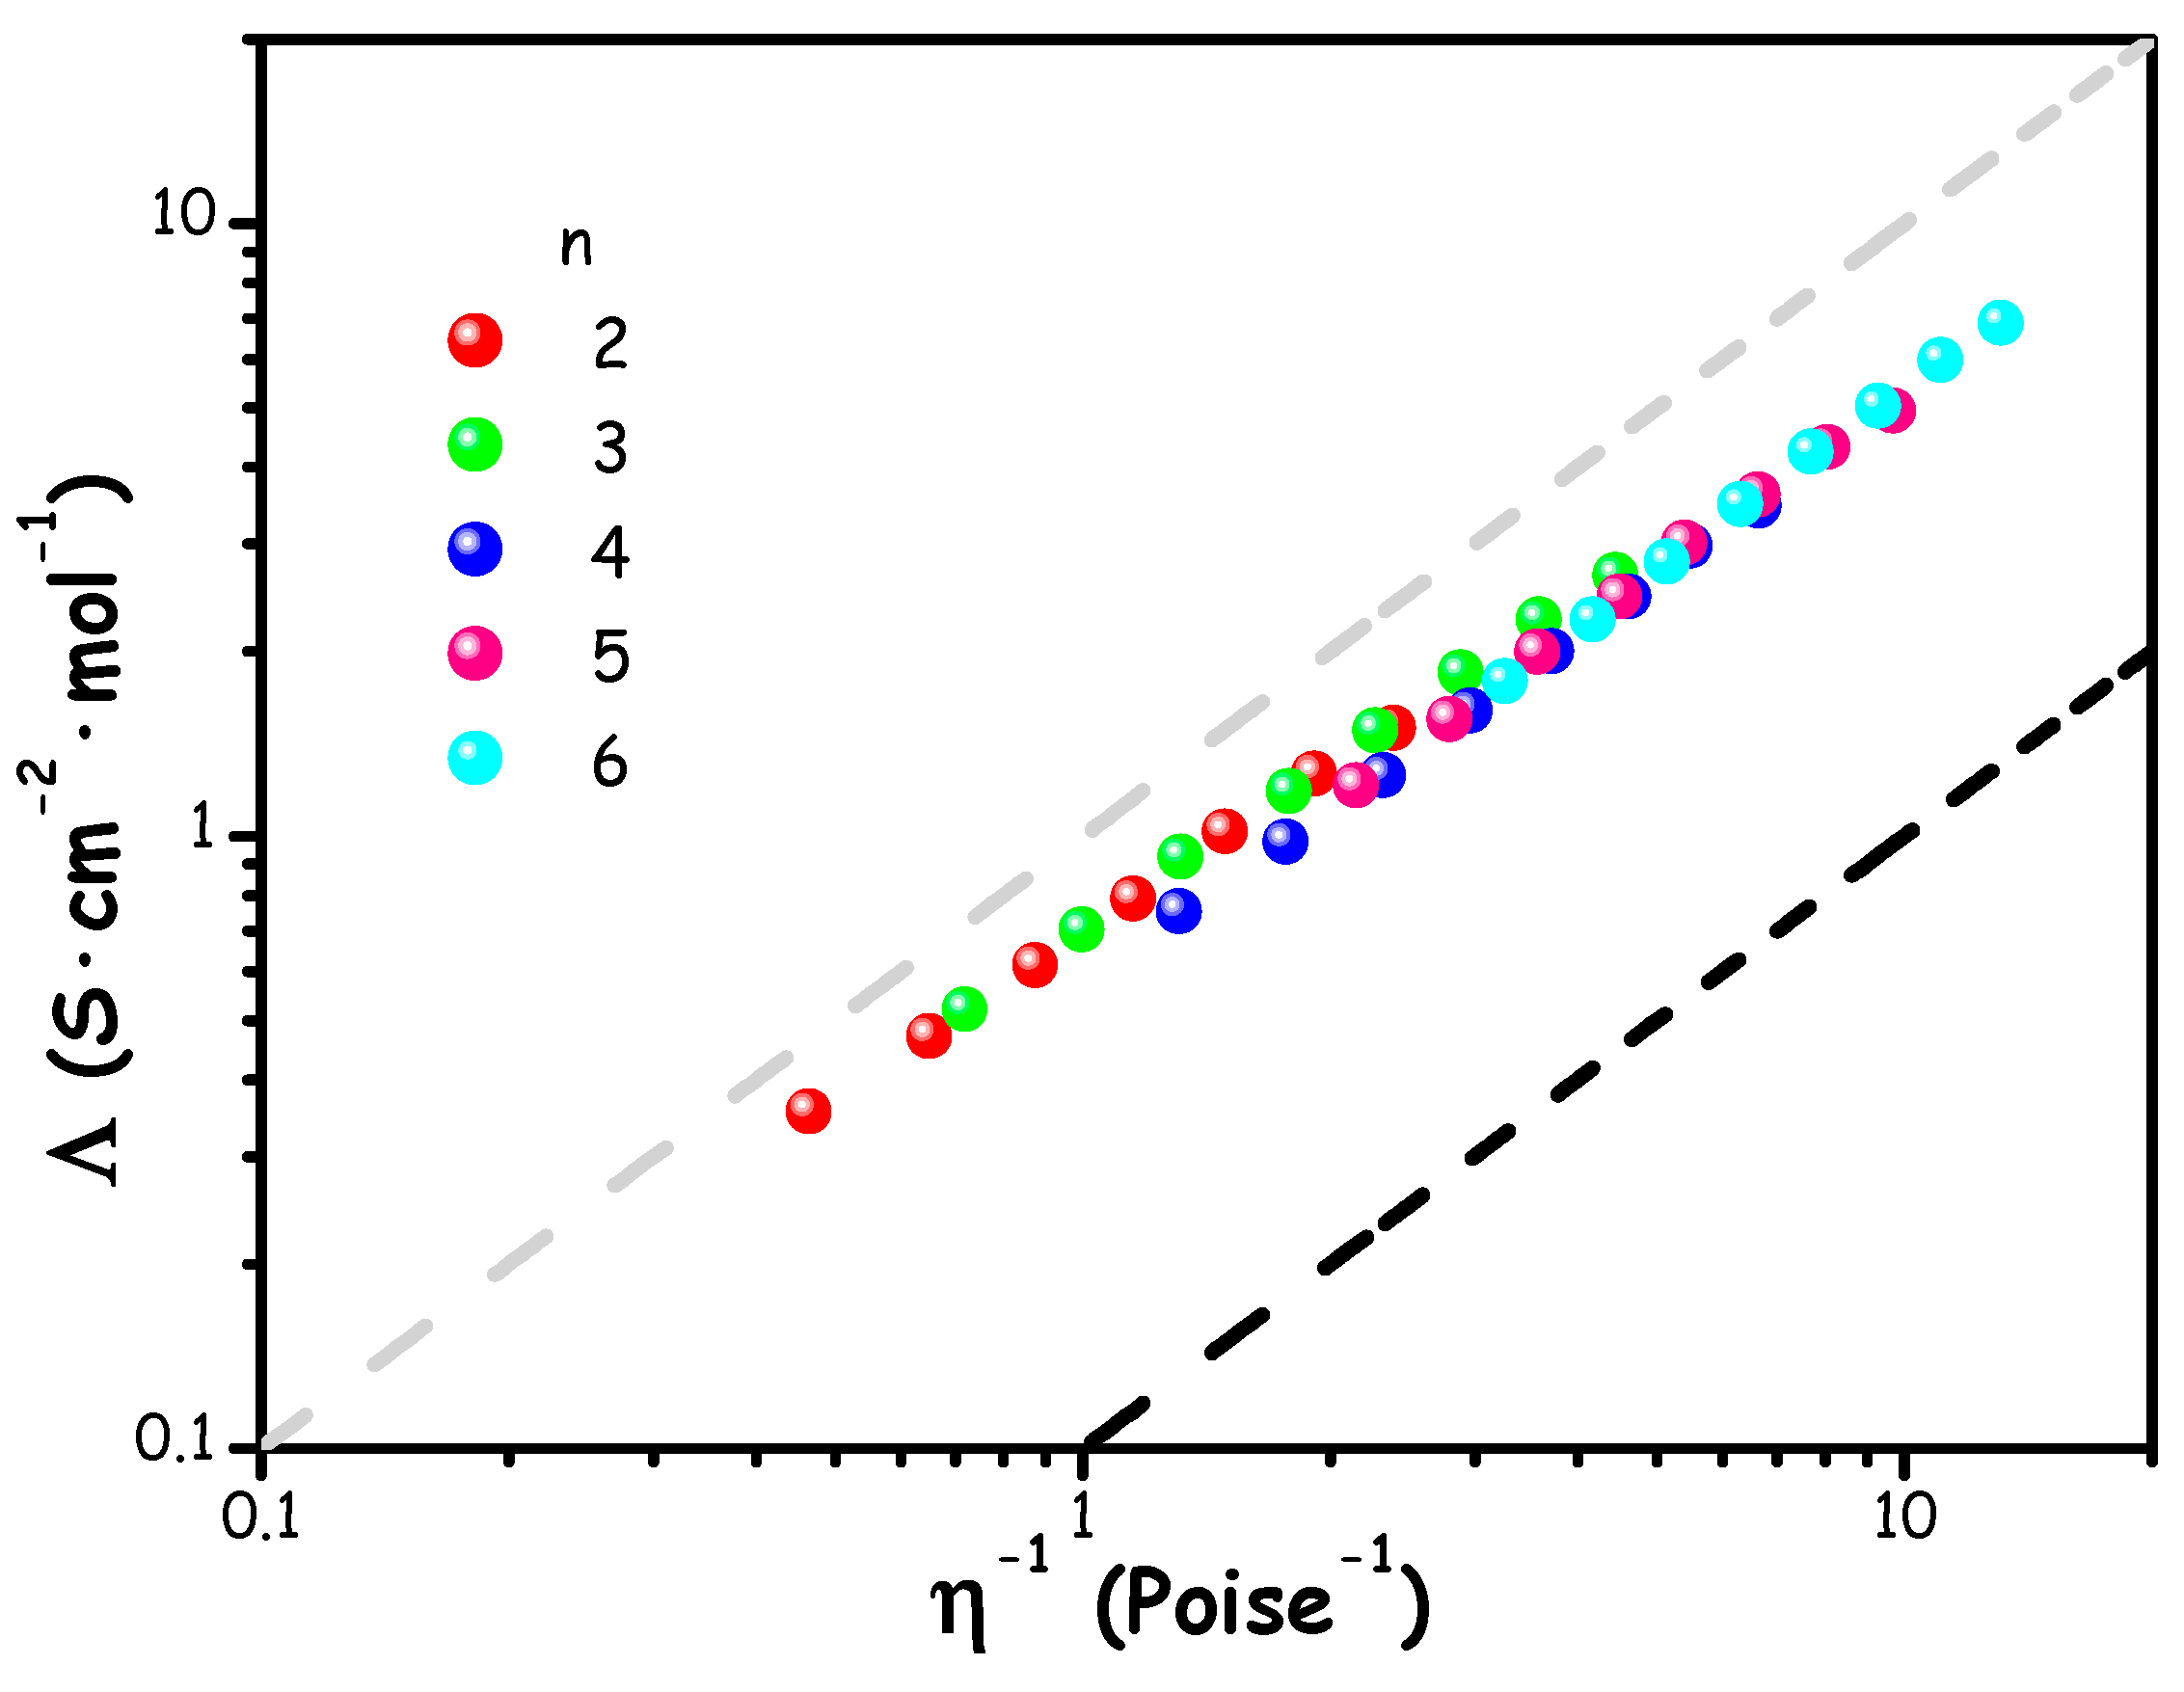
This type of representation is commonly used in electrochemistry, particularly for organic electrolytes containing lithium salts [70,71,72], ionic liquids (ILs) [73,74,75,76], and more recently in the context of (deep) eutectic mixtures [77,78,79,80]. It provides valuable insights into the degree of ionic dissociation within a specific system, which are compared to an ideal reference trend derived from dilute aqueous KCl solutions, where it is assumed that ions behave ideally, without significant interionic interactions. The grey line in Figure 5 represents the "1 M KCl reference," which corresponds to fully dissociated ions, while the black line, parallel to the first but displaced downward by one order of magnitude, suggests that 90% of the ions are paired. Mixtures located between these two lines are considered to have "good ionicity", highlighting the large population of unpaired ionic species in the mixture [81,82].
The trend observed in Figure 5 indicates that, across the probed water content levels, the mixtures exhibit remarkable ionic behaviour, with only slight deviations from the KCl reference trend. This suggests that the mixtures behave similarly to conventional aqueous salt solutions, where ions are relatively free to diffuse.
Refractive index (nD) measurements were executed on the ChAc/water mixtures (n=2-6) every 10 K over a temperature range between 283.15 and 313.15 K. The corresponding results are shown in Figure 6 and listed in Table S9. The relationship between refractive index values and temperature was described using a linear relationship, with the corresponding fitting parameters provided in Table S10 of the ESI.
Figure 6.
(nD) values of ChAc/water mixtures as a function of temperature. Solid lines represent linear fits.
Figure 6.
(nD) values of ChAc/water mixtures as a function of temperature. Solid lines represent linear fits.
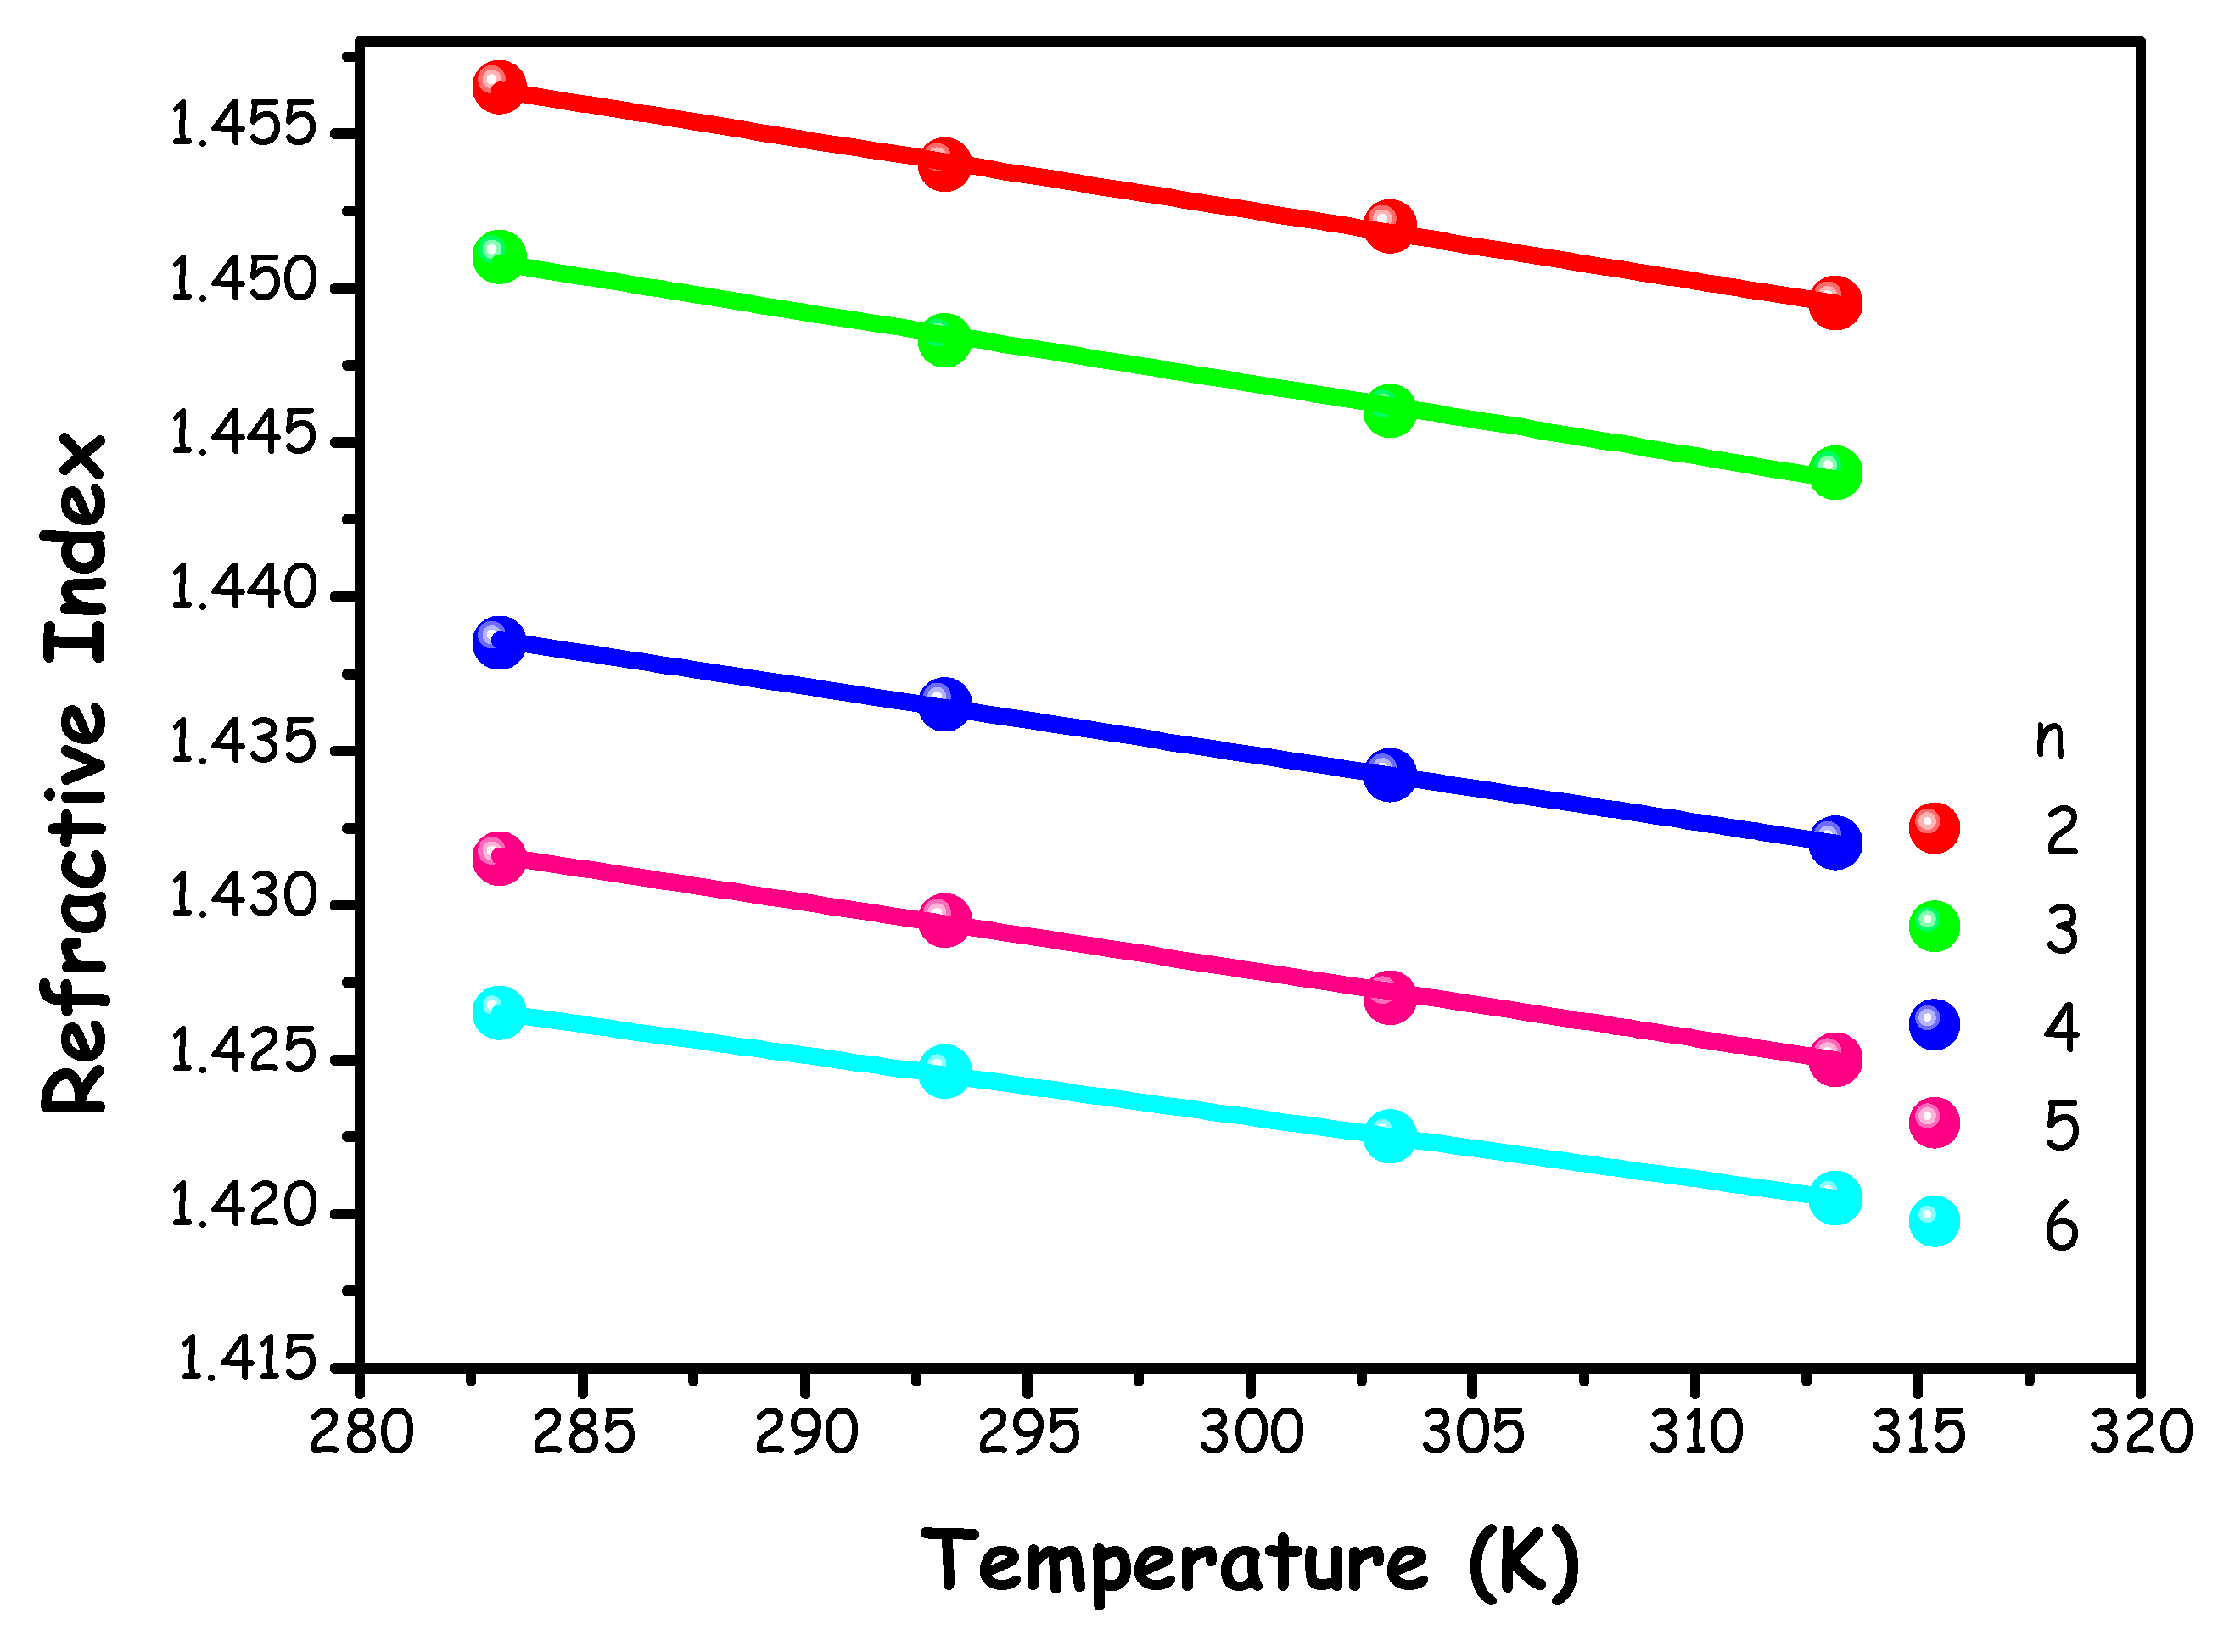
The observation of a linear decrease with increasing temperature is consistent with other ChAc-based systems [19] and the ChCl/water mixture [16].
1H NMR methods have been widely used to study the local structure and dynamics of several choline-based DES systems. As an example, the proton spectrum of ChAc/water (n = 4), along with the molecular structure and peak assignments, is shown in Figure 7. The spectrum shows well-resolved lines for all protons of choline and acetate, in particular we observe the coalescence of the –OH/water peaks in a broad signal indicating an intermediate dynamic exchange regime on the chemical shift timescale, analogously to our previous findings on ChCl/water [16].
Figure 7.
1H NMR spectrum of the mixture ChAc/water (n=4), molecular structure of choline-acetate and peaks assignment.
Figure 7.
1H NMR spectrum of the mixture ChAc/water (n=4), molecular structure of choline-acetate and peaks assignment.
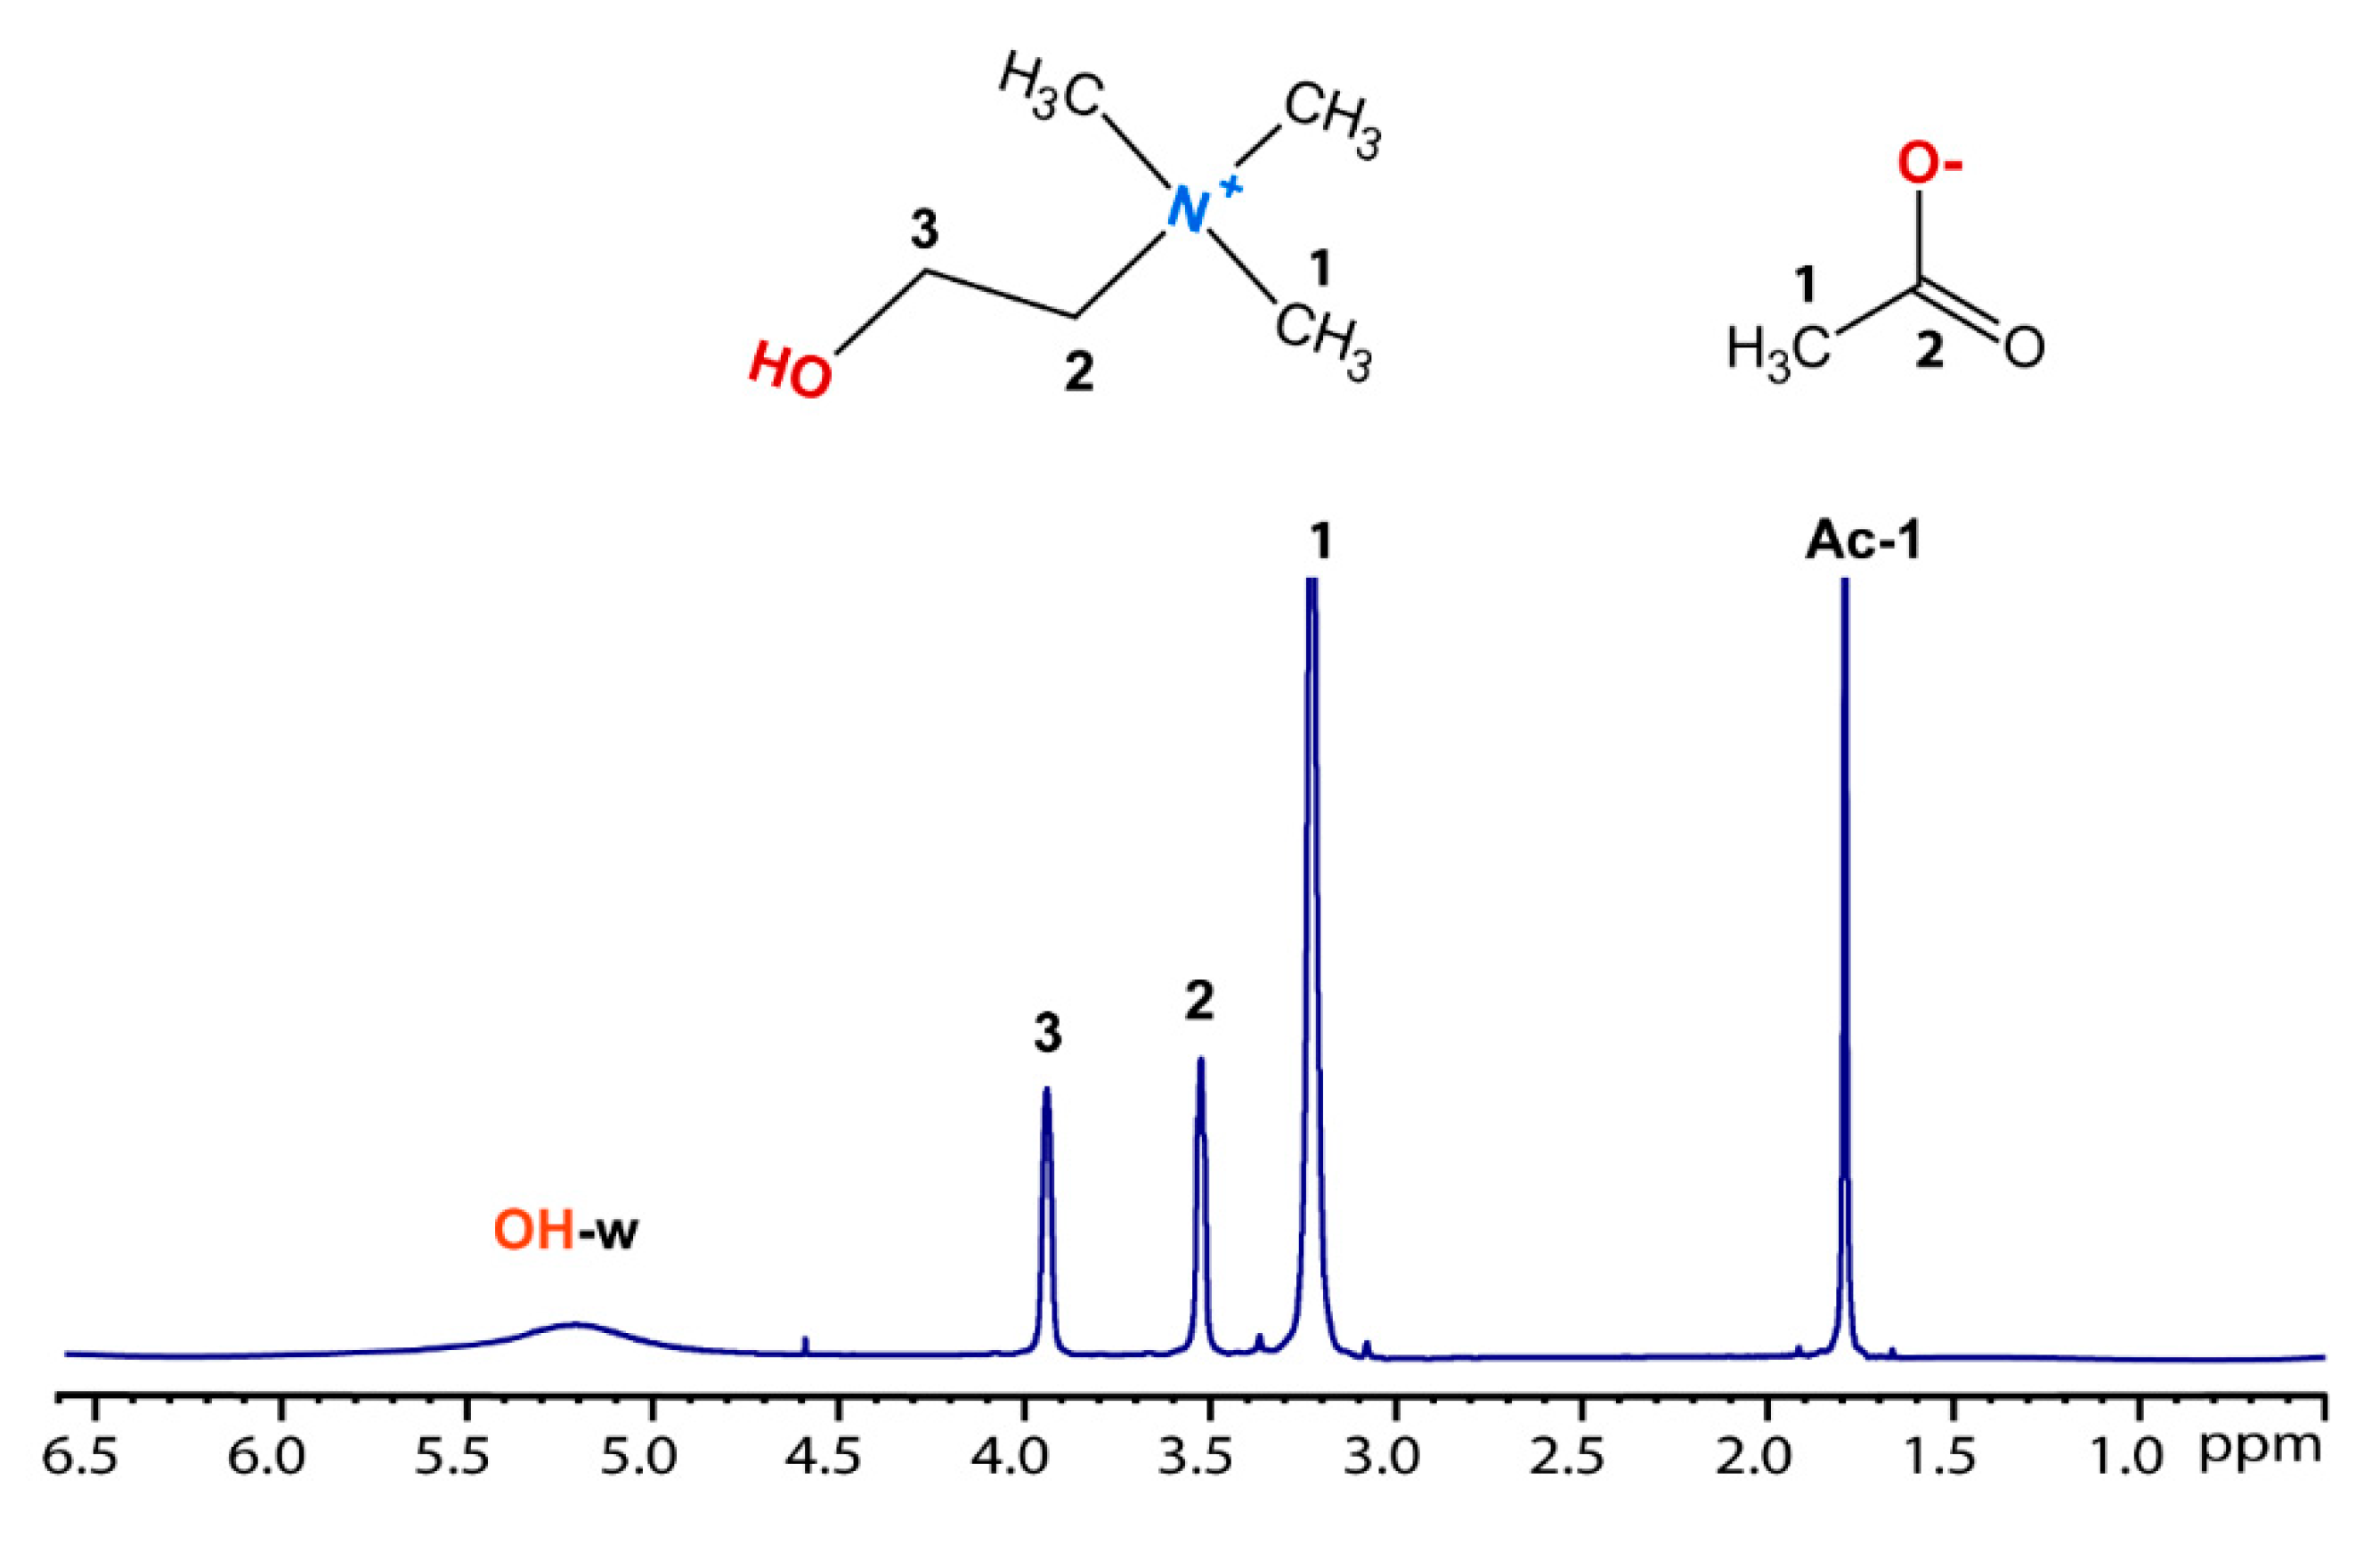
The proton spectra of all samples ChAc/water (n=2-6) are reported in Figure S5. We can observe that by increasing the amount of water, the linewidth of the –OH/water signal is progressively modified, becoming narrower. No significant changes are observed in the chemical shift of water, choline and acetate (data shown in Figure S6 of the ESI).
Additionally, NMR diffusion studies are performed to obtain information on the translational motion of individual molecular species forming the solutions [83,84]. The diffusion coefficients of both choline and acetate (Figure S6) increase progressively with the amount of water added, with acetate faster than choline, reflecting the decrease in viscosity of the entire system. Water diffusivity maintains rather constant for the probed ChAc/water mixtures (n=4-6); this behaviour is at odd with the one encountered in choline chloride water wb-DES, where a faster, composition dependant diffusivity was observed for water [16].
Diffusion coefficients can be described in terms of the Stokes-Einstein (SE) equation:
D=kBT/6π·η·Rh (7)
where kB is the Boltzmann constant, D, η and Rh are the diffusion coefficient, viscosity and hydrodynamic radius of the probed species, respectively.
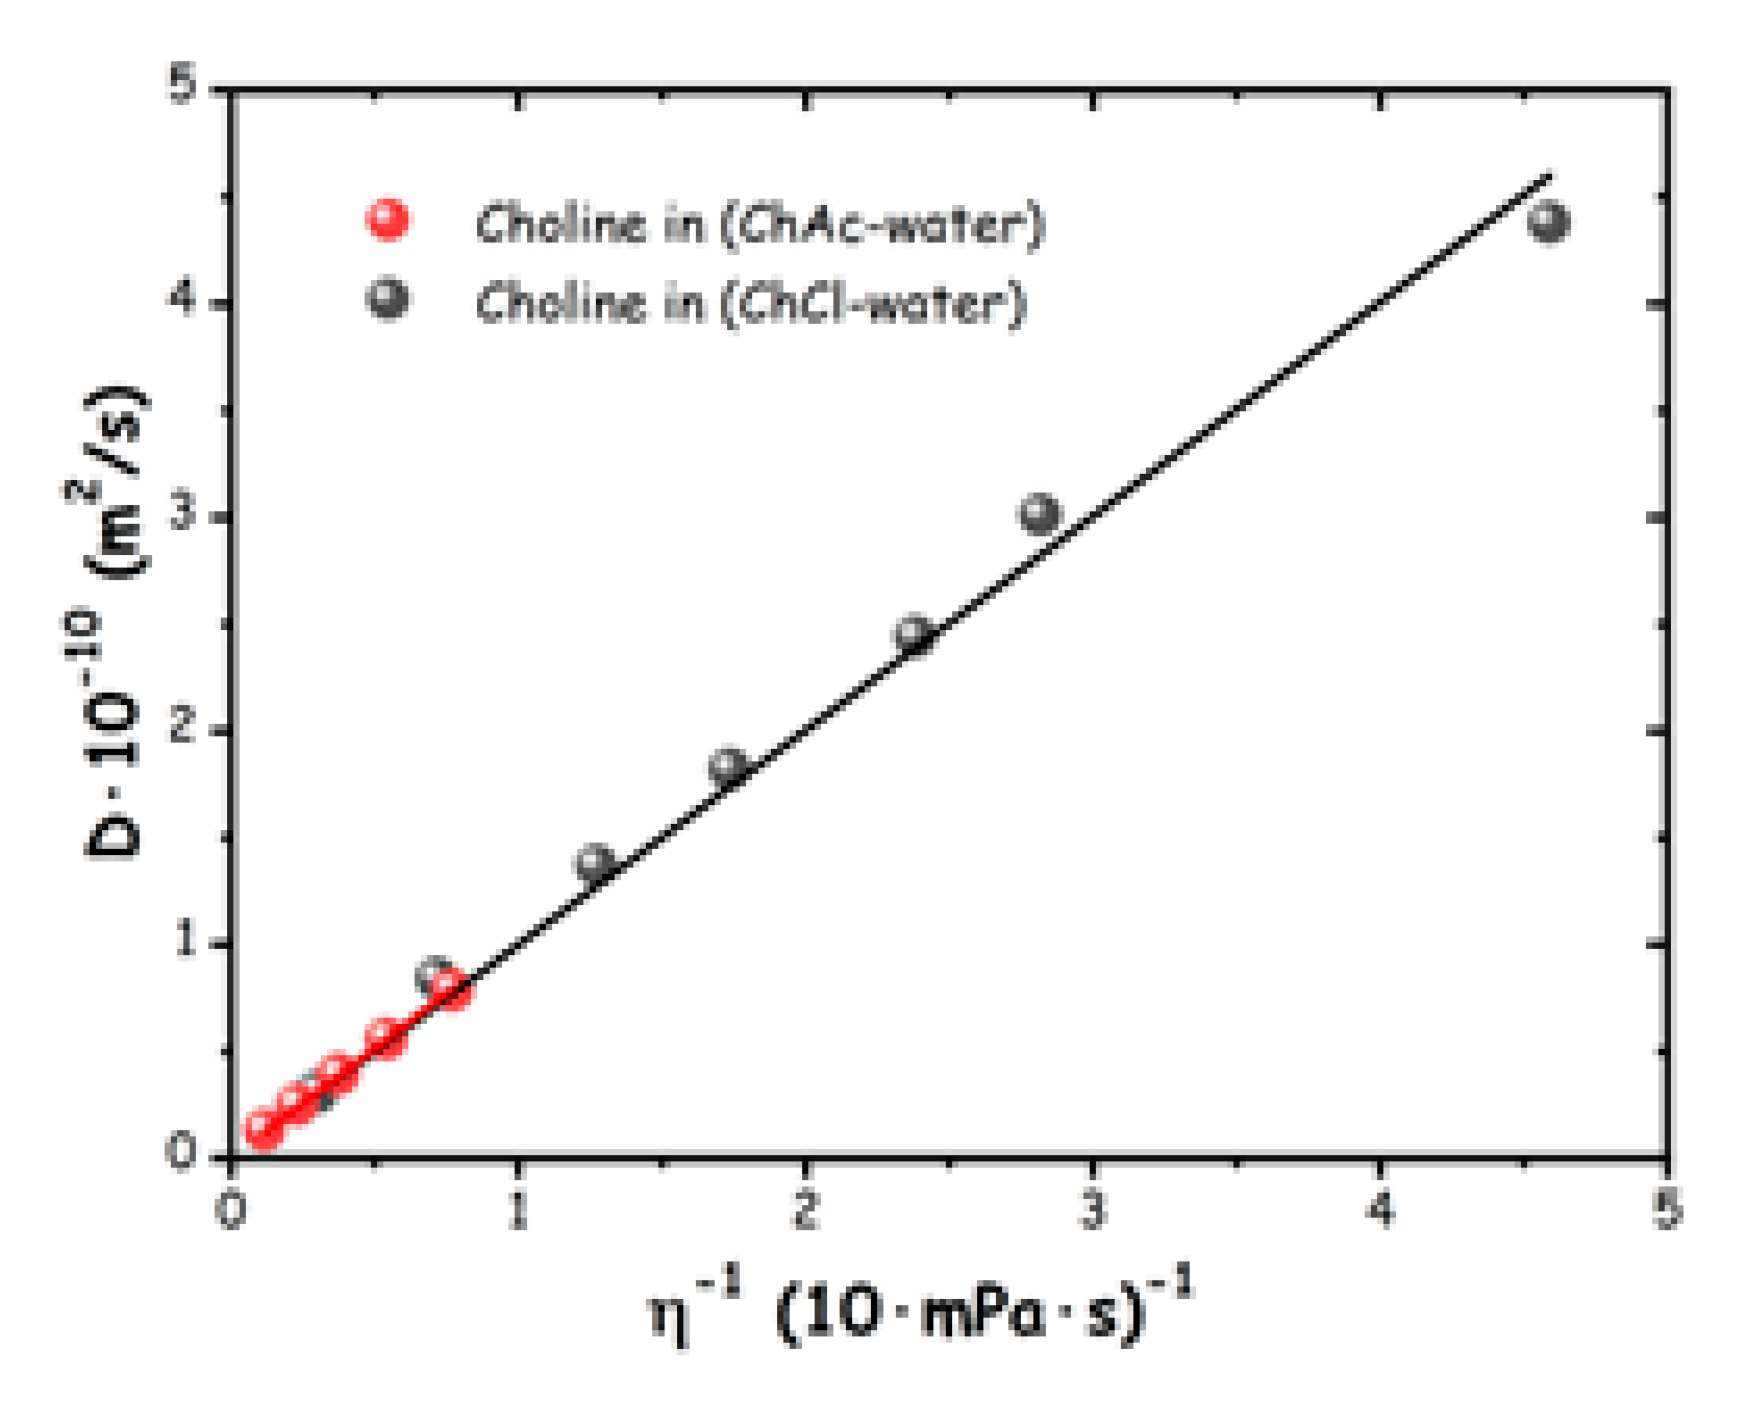
Figure 8 shows a comparison of diffusion coefficients of the choline cation, DCh, versus the corresponding fluidities (inverse viscosities), for ChCl/water [16] and ChAc/water mixtures at 300 K, respectively. It clearly emerges that the two data sets are essentially superimposed and can be both described by Rh of ca. 2.15 Å, accounting for the diffusing choline cation. These results indicate that: a) in both wb-DES systems, across the whole explored water-salt ratio range, no evidence of change or evolution of Rh is observed; b) the observed Rh for choline in the two probed systems are essentially identical. If an association (such as an aggregation) process would take place in these systems, one would observe a change in the corresponding size of the aggregates with composition and with anion. We can then extend our original finding [16] and state that the experimental results for diffusion coefficients do not support the claim that “cluster aggregation” is observed in wb-DES (including the ChCl/water one) [85]. The mentioned report based such a claim on the ground of conductivity, ultrasound spectroscopy and diffusion coefficients for ChCl/water mixtures. While a discussion on the other characterizations is outside the scope of this work, the latter data set, which is directly comparable to our results, was not taking into consideration the DCh dependence on viscosity. Once explicitly accounting for viscosity, those DCh data nicely follow (data digitalised from the original work, not shown) the linear trend reported in Figure 8, thus indicating that the observed monotonical increasing of Dcholine upon dilution, rather than reflecting a decrease in Rh (hence the wrong claim of large aggregates at low water content), is simply a consequence of decreasing viscosity, without substantial structural changes involved.
Figure 8.
1H NMR diffusion coefficients of choline cation in ChCl/water and ChAc/water mixtures versus fluidity at 300 K. The straight lines correspond to a modelling of the data in terms of the SE equation with values of Rh= 2.19 and 2.13 Å, for the two data sets.
Figure 8.
1H NMR diffusion coefficients of choline cation in ChCl/water and ChAc/water mixtures versus fluidity at 300 K. The straight lines correspond to a modelling of the data in terms of the SE equation with values of Rh= 2.19 and 2.13 Å, for the two data sets.
The longitudinal relaxation time (spin-lattice, T1) of all carbon and proton atoms of the mixtures ChAc/water (n=2-6) were measured at 300 K (Figure S7 of the ESI and Figure 9).
Figure 9.
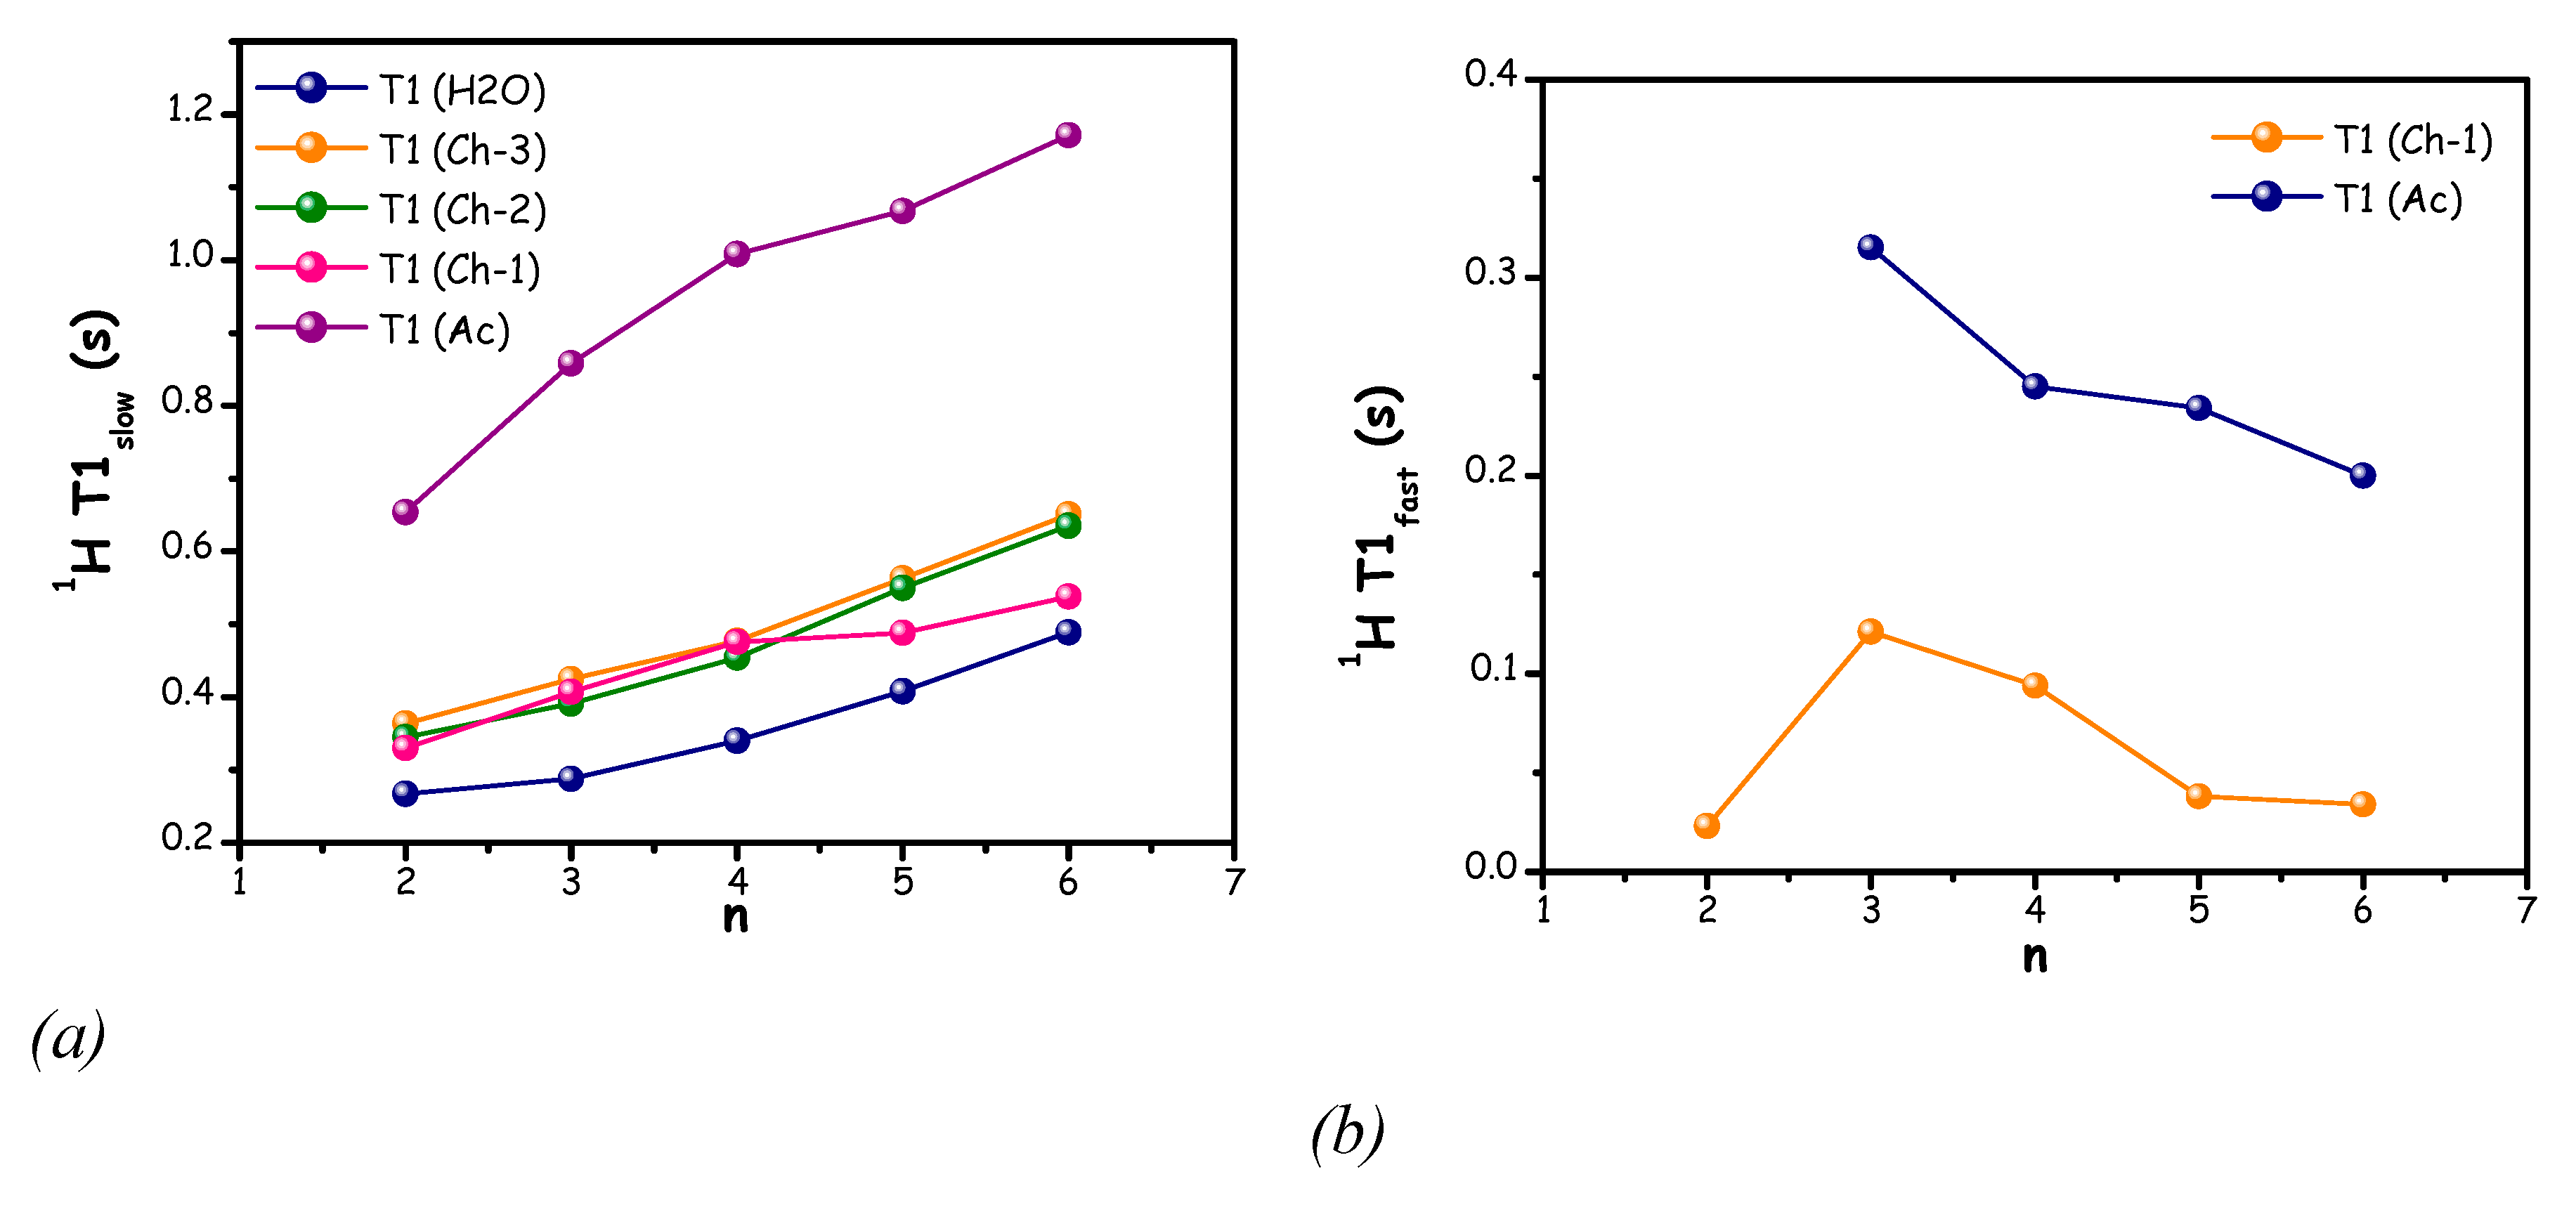
1H longitudinal (spin−lattice, T1) relaxation times for ChAc/water mixtures as a function of n, at 300 K T1slow (a), T1fast (b).
Figure 9.
1H longitudinal (spin−lattice, T1) relaxation times for ChAc/water mixtures as a function of n, at 300 K T1slow (a), T1fast (b).
The T1 values of all carbon atoms were obtained using a mono-exponential fit of the experimental data. In all cases, the T1 values of Ac-1 and Ac-2 are higher than those of Ch-1, Ch-2 and Ch-3 which in turn show similar values. For all carbons, the T1 increases upon water addition, indicating a fast rotational motion which can be related to a progressive decrease in viscosity of the sample.
The 1H T1 relaxation values (data shown in Figure 9) were best obtained by a biexponential fit of the signal decay curve, providing two relaxation components (T1slow and T1fast) for Ch-1 and Ac protons, while Ch-2, Ch-3 and water signal decays were well fitted with a mono-exponential function. This behaviour can be attributed to some dynamical heterogeneity experienced by Ch-1 and Ac in these peculiar systems.
The measured T1slow of all protons in choline-acetate/water mixtures (n = 2–6) increases with increasing water content (Figure 9 (a)). In a previous study on a series of betaine-based DESs, a minimum in the T1 of the hydroxyl proton was observed and attributed to the formation of a deep eutectic characterized by a strong hydrogen-bonding network, which restricts molecular rotational motion [86]. In the present study, since no measurements were performed for n < 2, it is not possible to identify a clear minimum. However, it is evident that the lowest 1H T1slow value is observed at n = 2, particularly for acetate protons (Ac). This suggests a reduced mobility of acetate at this composition, which likely arises from strong hydrogen-bonding interactions involving the acetate anion.
Moreover, the methyl group of acetate shows the highest T1 value. The T1 measurements were also performed at higher temperature (320 K) and the experimental data are reported in Figure S8-S9. A similar trend is also observed at higher temperature, but with higher T1 values for all protons.
Scheme 2.
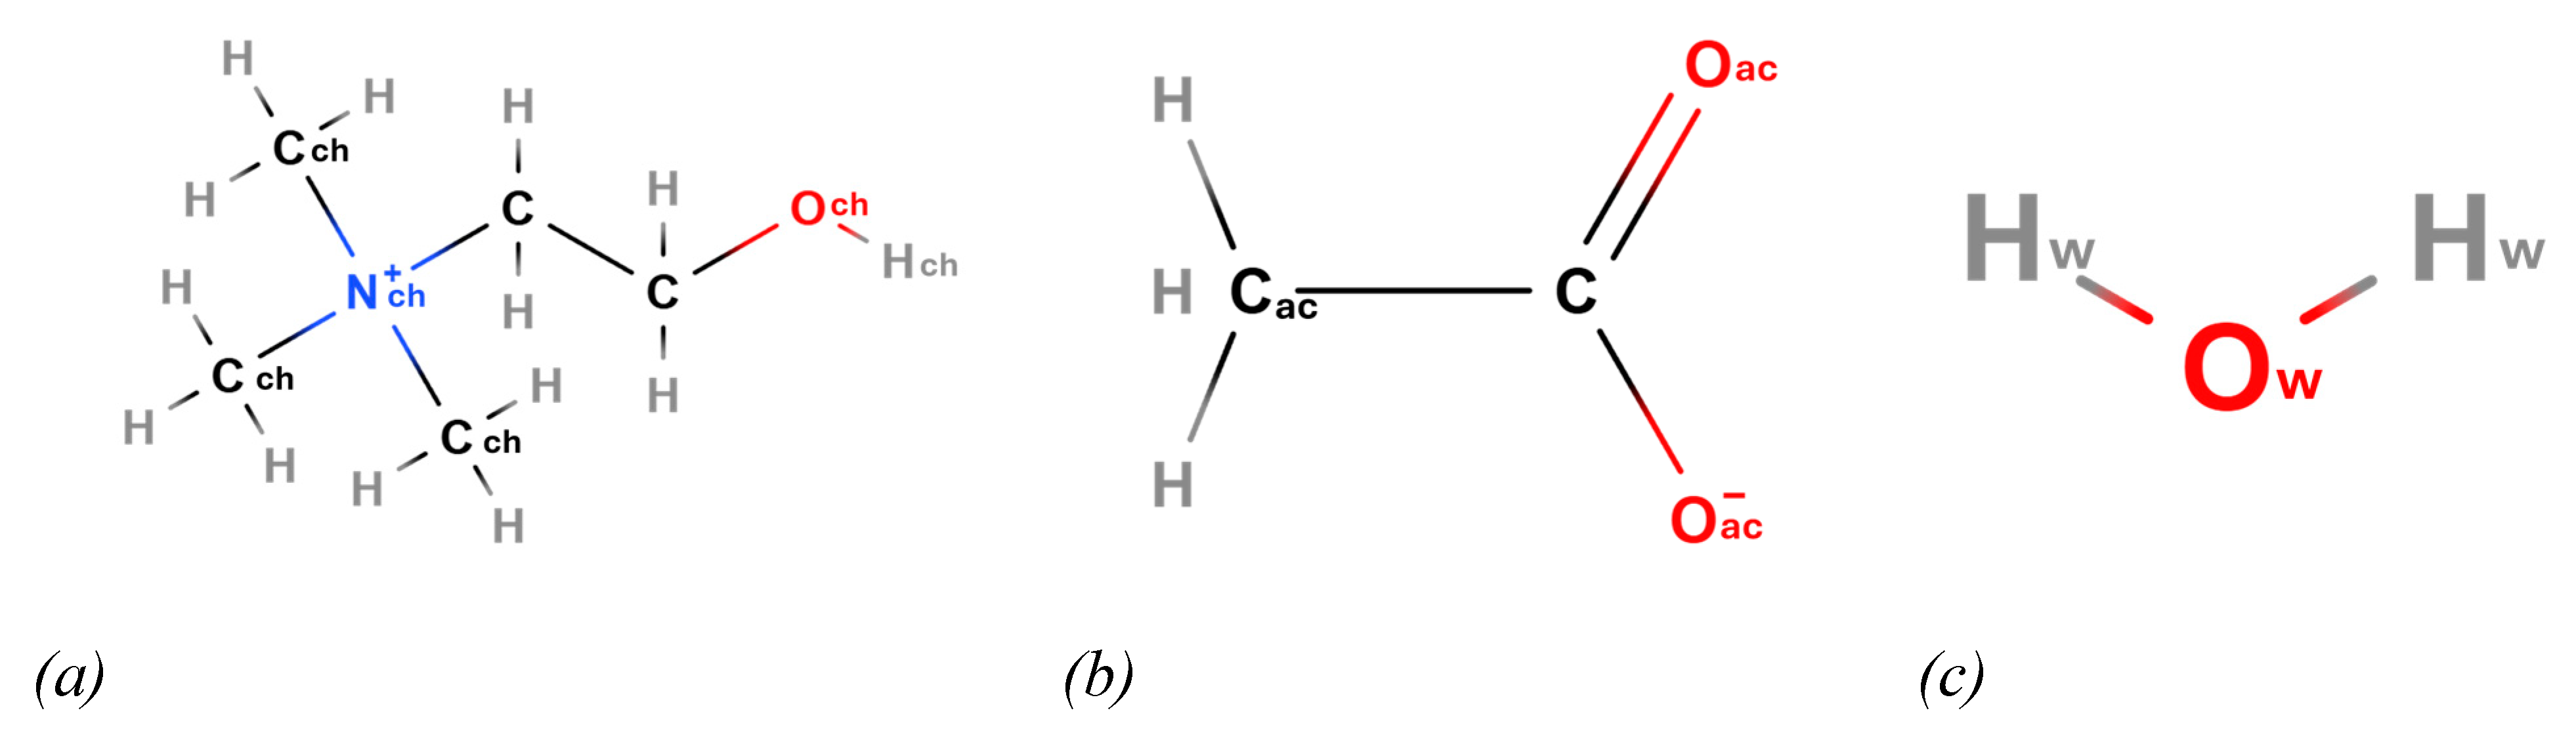
Schematic representation of choline (Ch) (a) on the left, acetate (Ac) (b) in the middle and water (c) on the right side.
Scheme 2.
Schematic representation of choline (Ch) (a) on the left, acetate (Ac) (b) in the middle and water (c) on the right side.
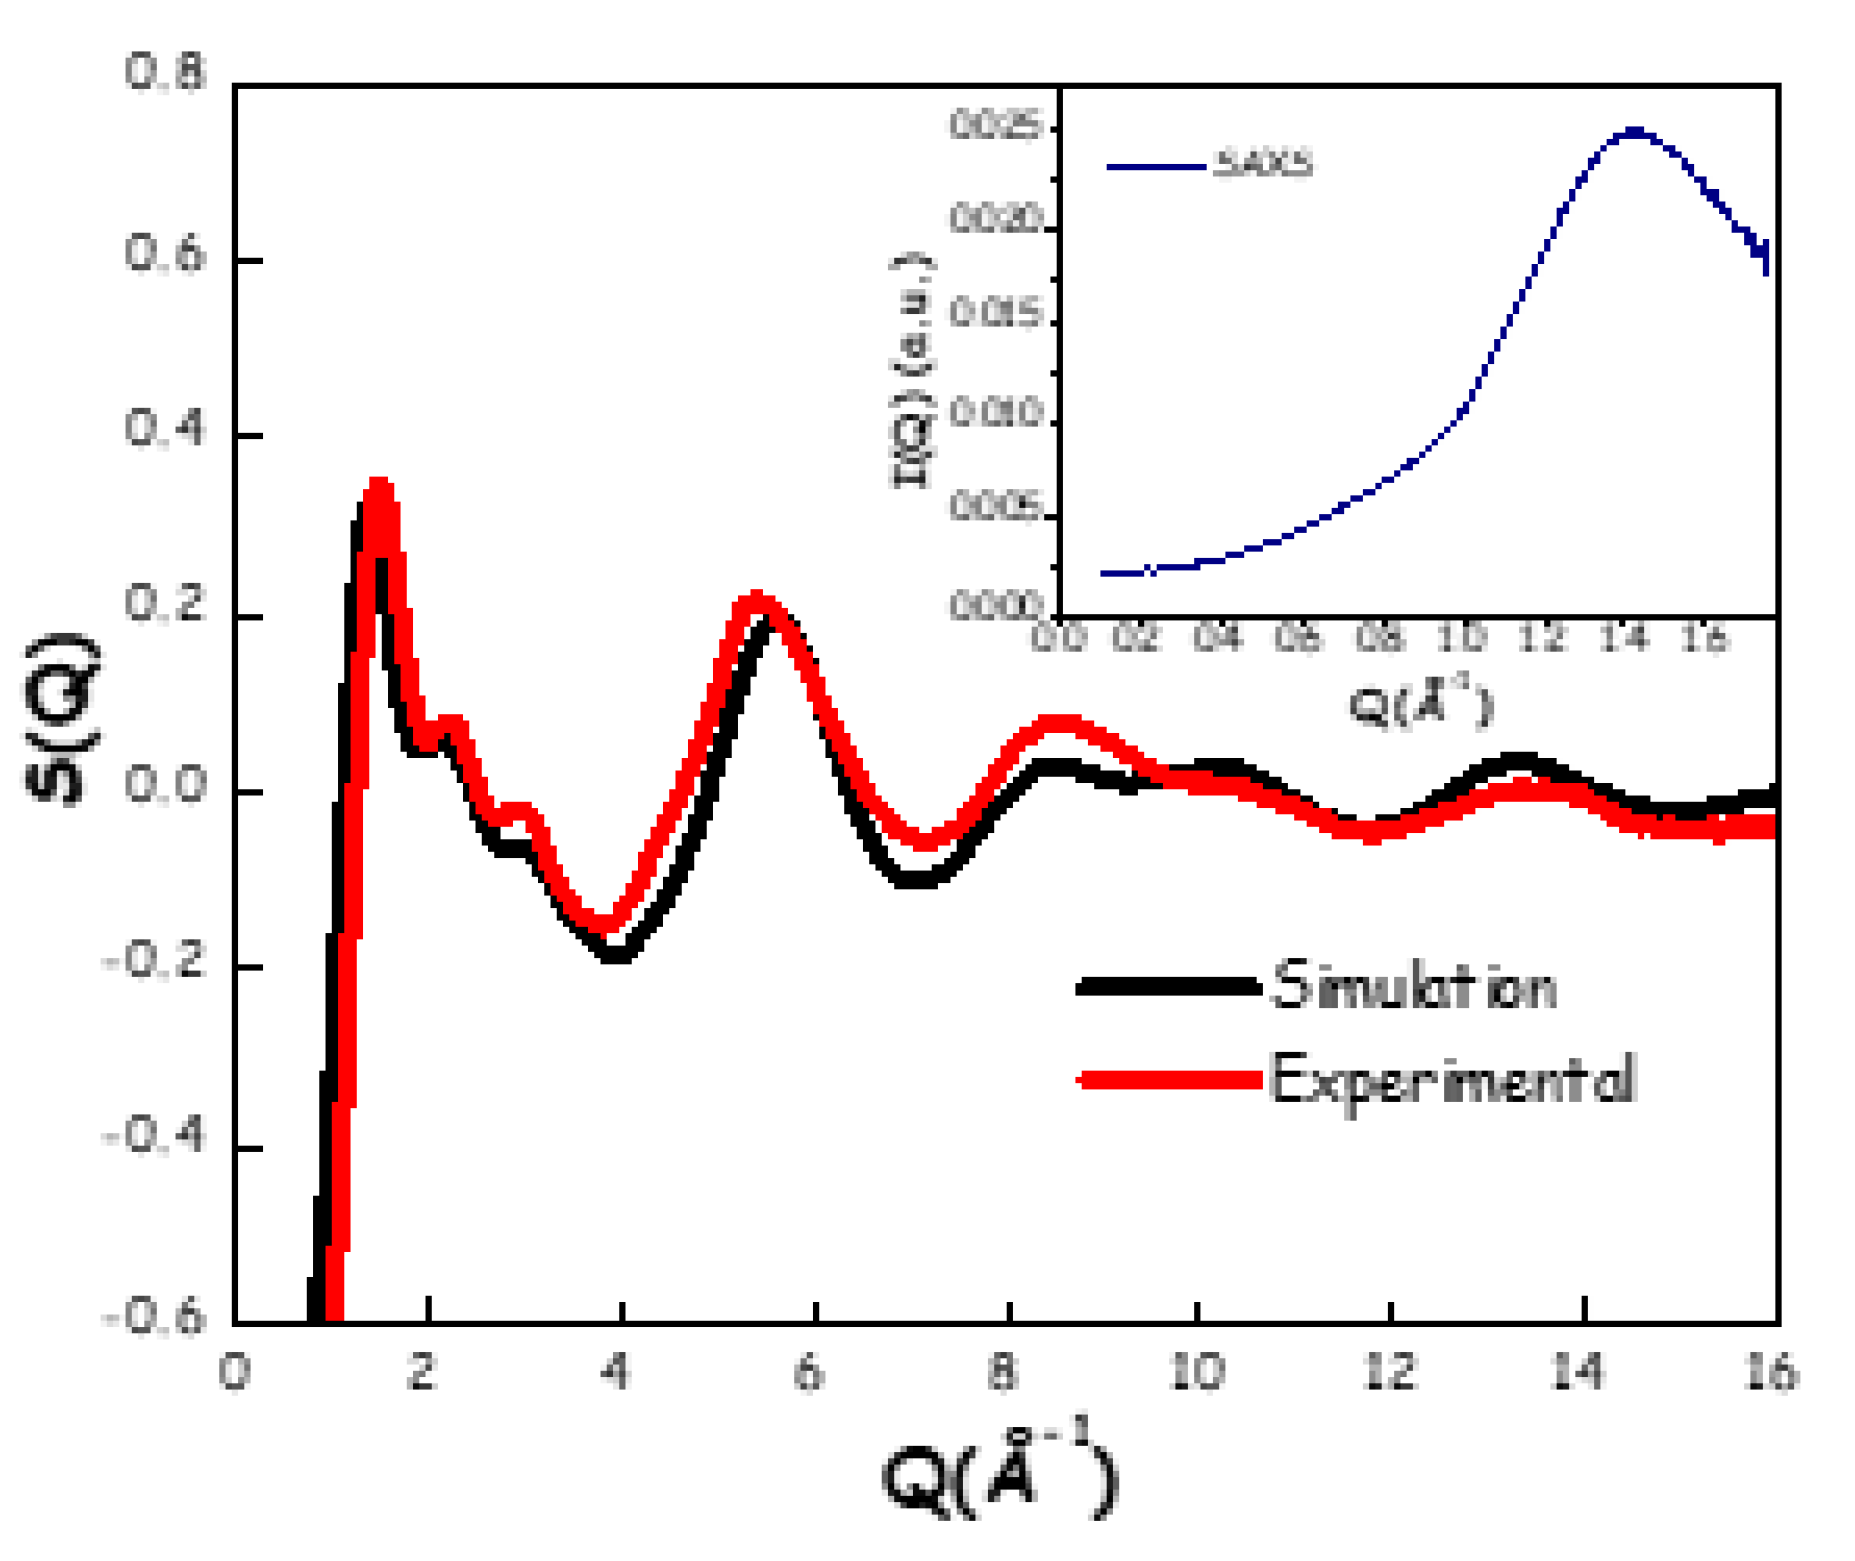
Although the ¹H longitudinal relaxation time (spin-lattice, T₁) data do not allow us to unequivocally identify the formation of a DES, due to the absence of experimental data at n < 2, they clearly indicate the presence of a strong hydrogen-bonding network in the ChAc/water mixture at n = 2. For this reason and considering that several known DESs are based on a 1:2 HBA:HBD molar ratio, we selected this composition for detailed structural analysis, as it offers a meaningful basis for comparison with other DES systems. Thus, a structural examination of the mixture at this composition was carried out using ab initio molecular dynamics (AIMD) simulations. The simulated density is 1.0345 g/cm3, to be compared with an extrapolated value from experimental data of 1.06526 g/cm3, with a satisfactory agreement by less than 3%. In Figure 10, a comparison between computed (at 350 K) and synchrotron X-ray weighted normalized structural factor (at 298 K) is presented. The satisfactory agreement between computed and experimental data (especially considering the difference in temperature between the two data sets) validates the AIMD simulation from the structural point of view. Experimental scattering data at low Q-values, reported in the inset of Figure 10, do not indicate evidence of structural heterogeneities in the mesoscale, similarly to what we reported in the case of both the ChCl/water [16,17] and ChAc-urea [20] systems. Together with the evidence related to diffusion coefficients discussed above, these findings further indicate that, analogously to other systems (ChCl/water and ChAc-urea), the presently studied wb-DES are not characterised by mesoscopic structural heterogeneities, related to “cluster aggregation”. On the other hand, the existence of an intense and structured feature at ca. 1.5 Å-1 is common in liquid systems with organic chemicals, including ChCl-based DESs [9,17,33,87,88,89,90,91].
Figure 10.
Experimental (black line, room temperature) and computed (red line, 350 K) X-ray weighted normalised structure factors for the ChAc/water mixture (n = 2). In the inset, the experimental SAXS pattern for the same mixture at room temperature.
Figure 10.
Experimental (black line, room temperature) and computed (red line, 350 K) X-ray weighted normalised structure factors for the ChAc/water mixture (n = 2). In the inset, the experimental SAXS pattern for the same mixture at room temperature.
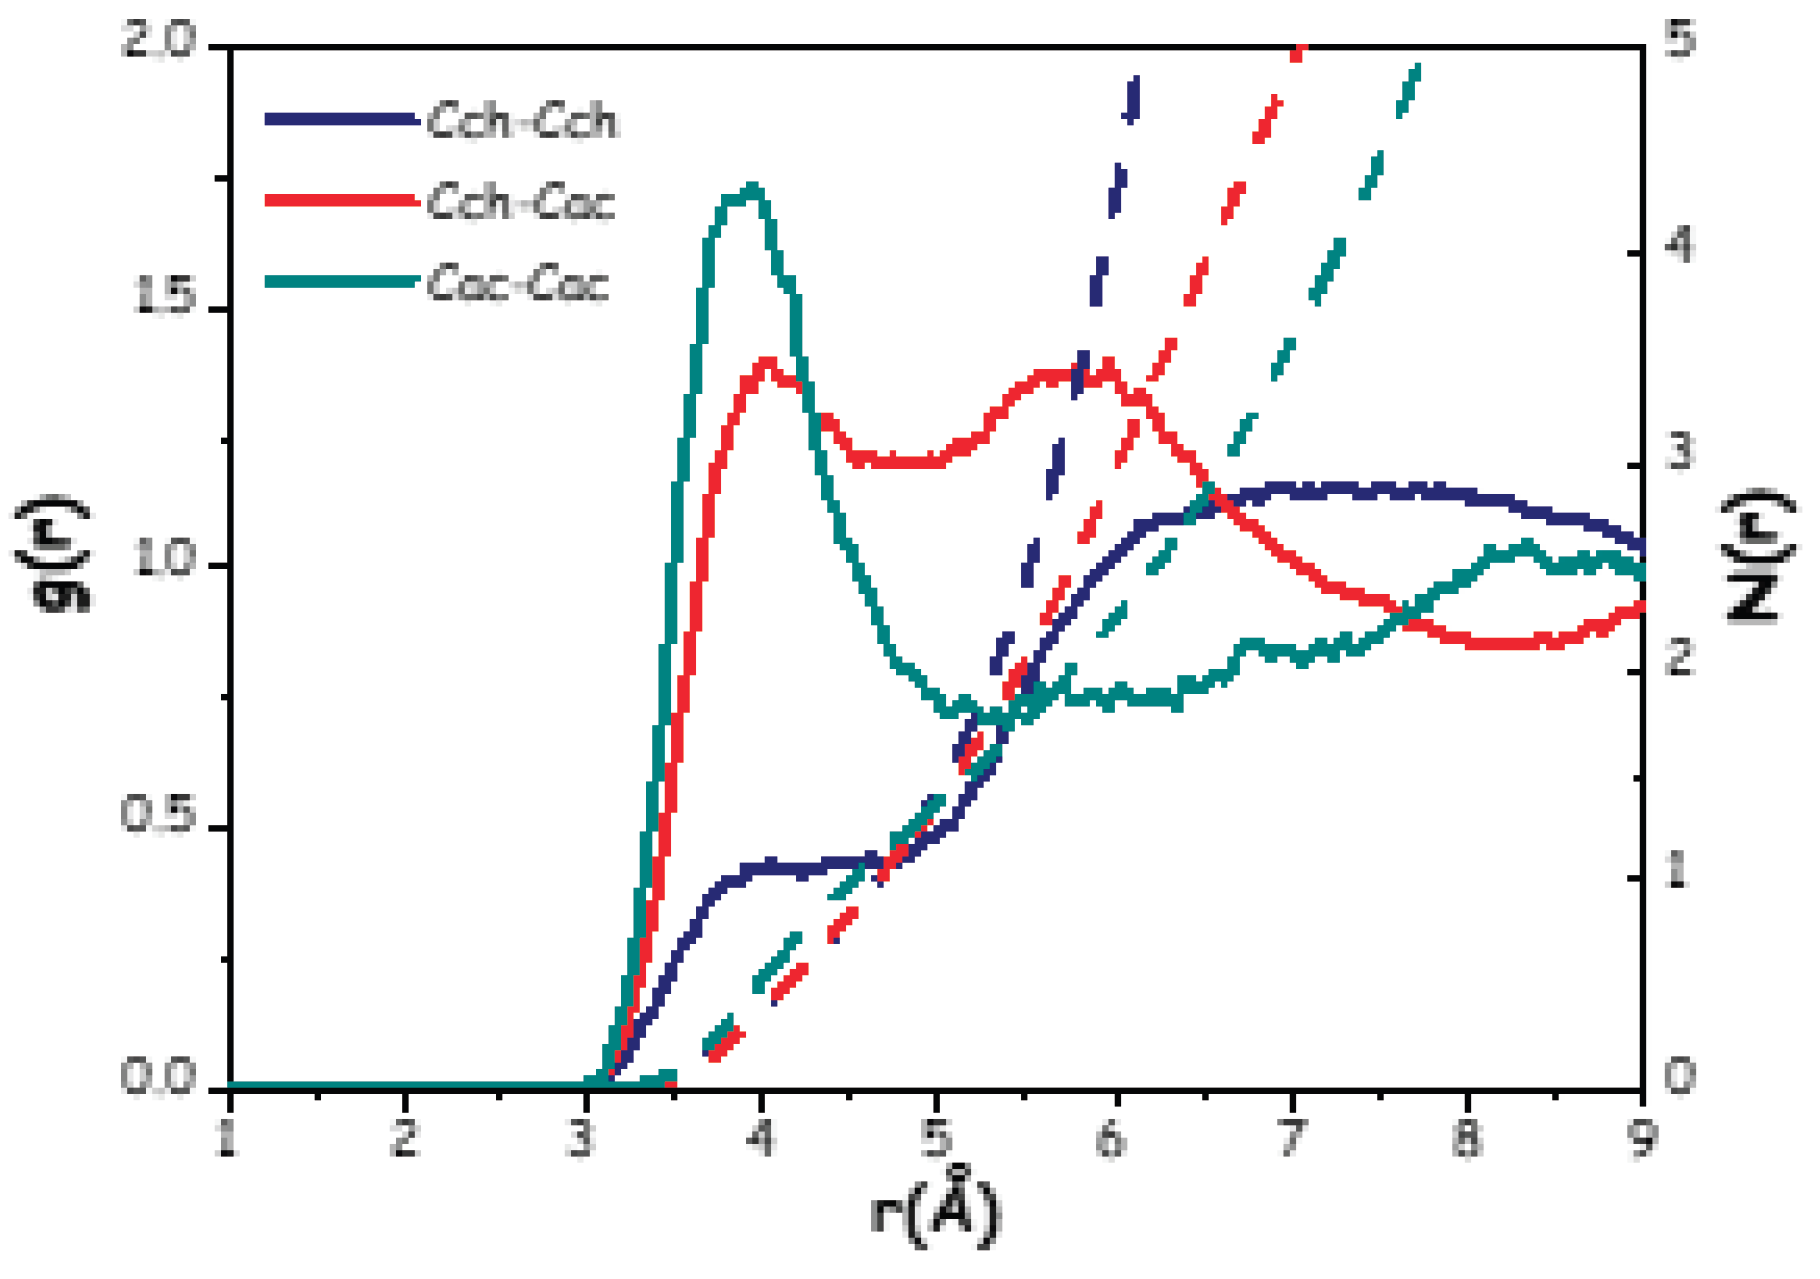
The AIMD generated trajectory was interrogated for further structural details, by examining the radial distribution functions (RDFs) and the related running numbers of neighbours (N(r)s) of selected moieties/atomic species. In Figure 11, the RDFs relating to the correlations between the centres of mass of all the species in the mixture are shown.
Figure 11.
(continuous lines) and related number of nearest neighbours (dashed lines) of the centres of mass of choline (Ch), acetate (Ac) and water (W).
Figure 11.
(continuous lines) and related number of nearest neighbours (dashed lines) of the centres of mass of choline (Ch), acetate (Ac) and water (W).
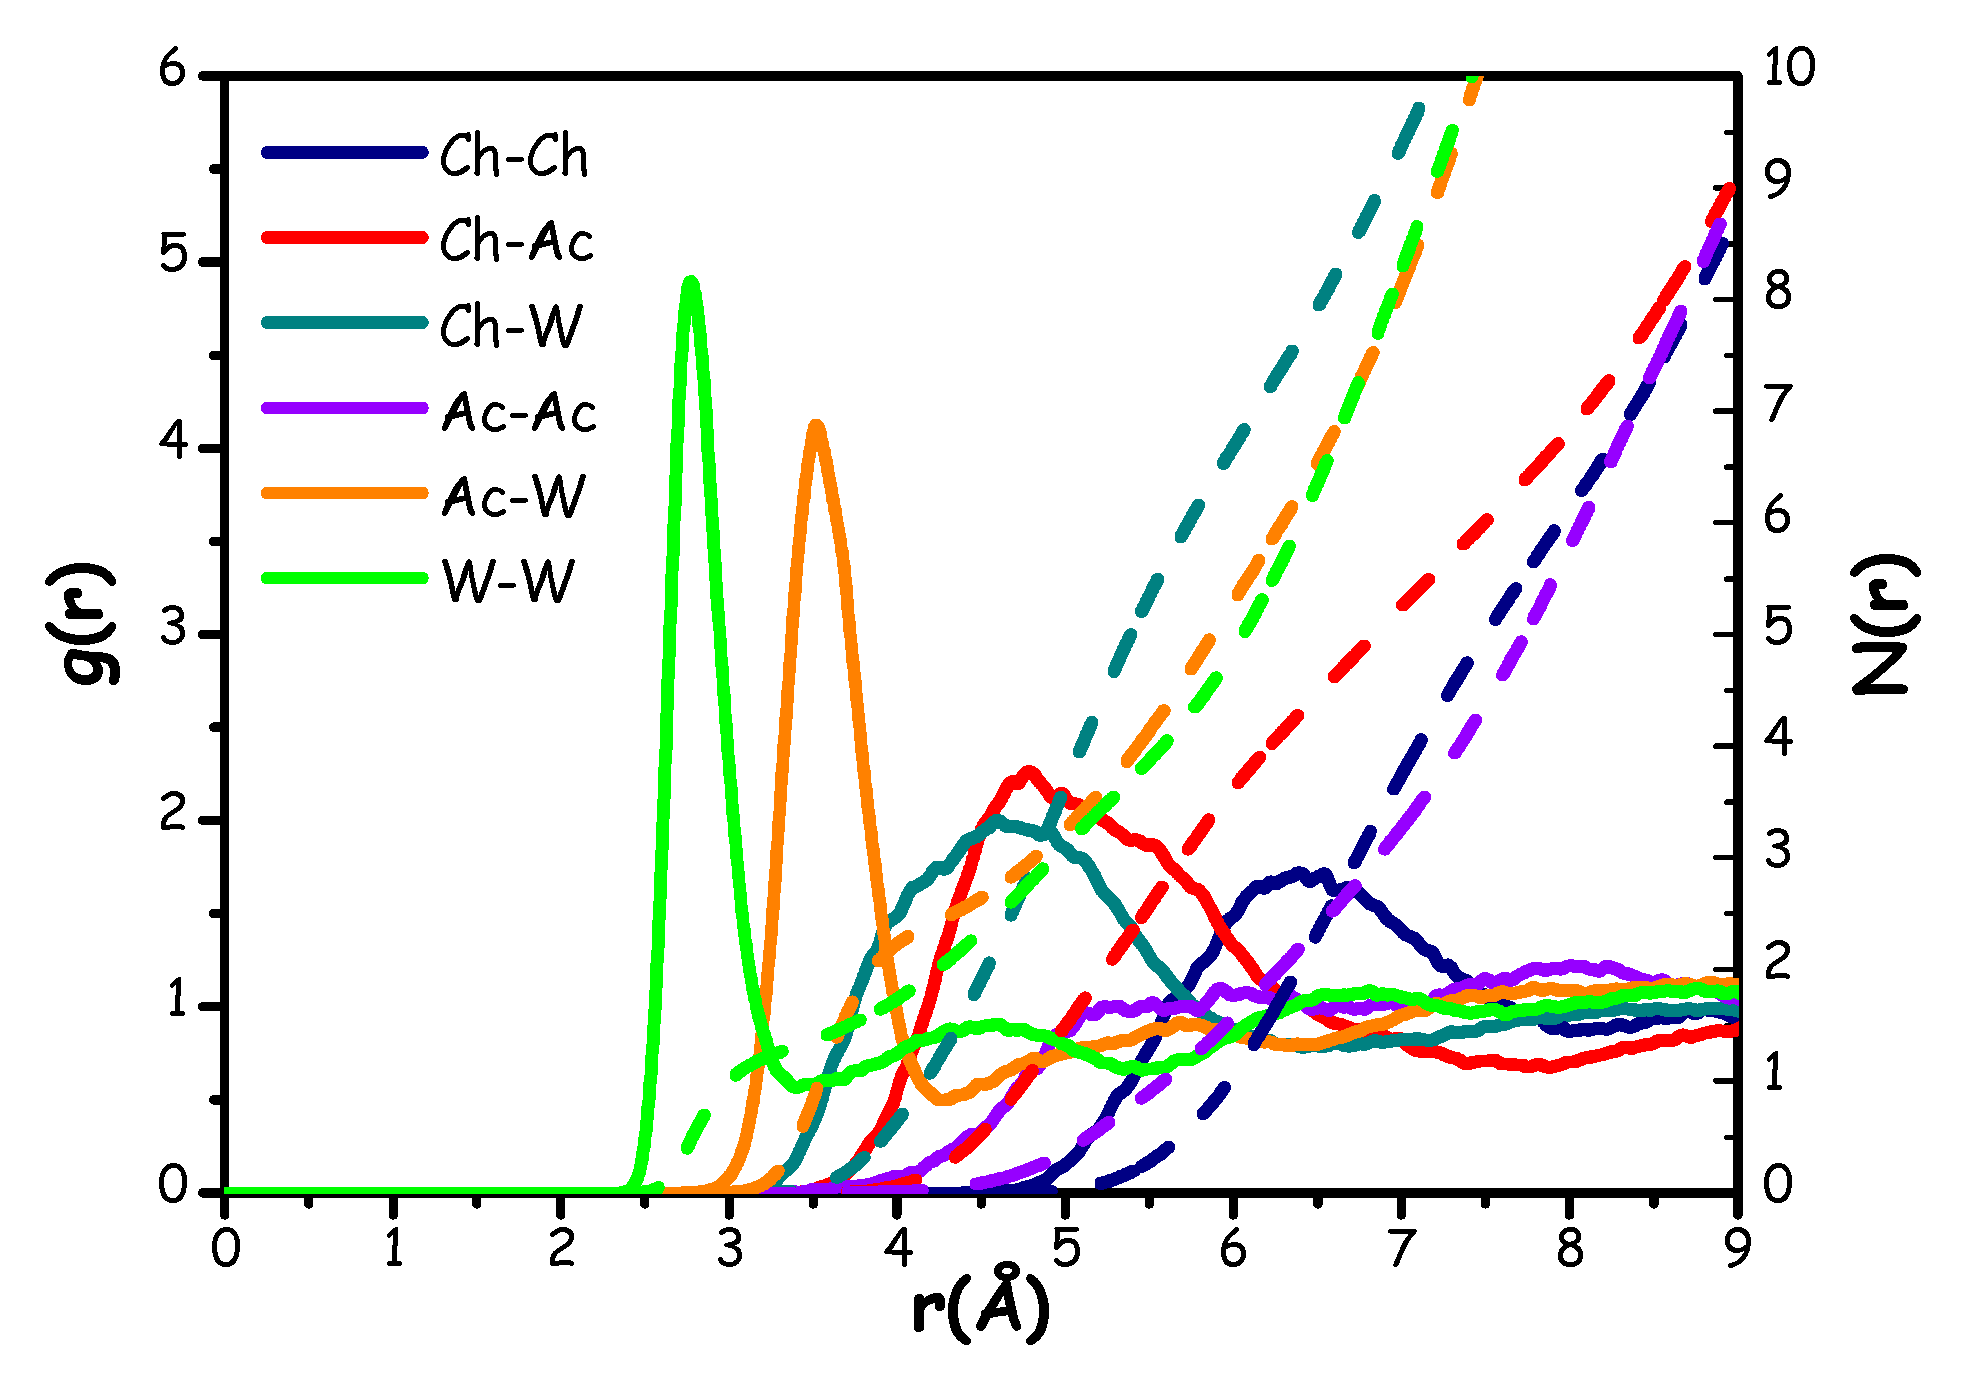
Figure 11 illustrates a situation where the correlations between the centres of mass are distributed across three distinct regions, akin to the pattern observed in a previous ChCl-based wb-DES, named Aquoline (ChCl:water 1:3.3) [17]. This effect is likely due to the difference in size between the different components: i) at distances r < 3 Å, a sharp and intense peak centred at ca. 2.8 Å reflects the strong correlation between neighbour water molecules (W-W correlation); ii) correlations involving W and either Ac or Ch, as well as the Ch-Ac and Ac-Ac ones, fall in the intermediate range between 3.0 Å and 6.0 Å; finally, iii) Ch-Ch correlations are characterised by a broad, weak peak above 6 Å (at ca. 6.4 Å).
In the intermediate range, the Ac-W correlation shows a pronounced peak at around 3.5 Å, while Ch-Ac and Ch-W correlations are characterized by broader and less intense peaks centred at 4.9 Å and 4.6 Å, respectively. This prompts for strong interactions between the acetate anion and water molecules. For comparison, the Ch-Ac correlation in the ChAc-urea system shows a peak centred at a greater distance of approximately 5.3 Å, along with a lower number of acetate anions surrounding a reference choline (about 3.4 vs the present value of ca. 6 (see Table 1) [20]. The Ch-W interaction, on the other hand, resembles that reported in Aquoline, although the peak here is centred at a slightly lower distance (4.6 Å compared to 5.0 Å [17]).

Table 1.
Peak position, distance of integration and number of nearest neighbours related to all the correlations shown in Figure 11.
Table 1.
Peak position, distance of integration and number of nearest neighbours related to all the correlations shown in Figure 11.
| Correlation | Peak position (Å) | Integration distance (Å) | N(r) |
| Ch-Ch | 6.4 | 8.0 | 6.2 |
| Ch-Ac | 4.9 | 7.0 | 5.3 |
| Ch-W | 4.6 | 6.3 | 7.5 |
| W-Ch | 4.6 | 6.3 | 3.7 |
| Ac-Ac | 8.0 | 9.0 | 9.1 |
| Ac-W | 3.5 | 4.3 | 2.5 |
| W-Ac | 3.5 | 4.3 | 1.2 |
| W-W | 2.8 | 3.5 | 1.4 |
Ac-Ac correlation appears to be relatively featureless and with an amplitude close to unity, thus reflecting a low probability of interactions likely due to electrostatic repulsion between acetate anions. Indeed, we can observe only a broad peak with a very low intensity around 8.0 Å. This observation aligns with the ChAc-urea mixture [20], but contrasts sharply with the findings in ChCl/water [17], where the anion-anion correlation exhibited a more structured pattern.
The observations related to Ch-Ch correlations at large separation distances are consistent with those in Reline, Aquoline, and the ChAc-urea system [17,20,87,91], where a peak around 6.5 Å was detected. Furthermore, integrating this peak up to a distance of about 8.0 Å yields a number of nearest neighbours equal to 6.2, which resembles the cases of both Reline (ChCl-urea 1:2) [87] and Aquoline [17], while, in the case of the ChAc-urea system, only 3 surrounding choline neighbours were found [20]. In general, the observed overall spatial distribution is quite similar to the one seen in Aquoline, but with one key difference: in Aquoline, the correlation between the anion and water occurs in the first region (r < 3 Å), whereas in this case, it is observed in the central region (r between 3.0 Å and 6.0 Å) [17]. This discrepancy is likely related to the smaller size of chloride compared to acetate. Moreover, it is worth noting that the RDFs for the correlations between choline and either water or acetate nearly overlap between 4 and 6 Å. This suggests a strong interplay between the acetate anion and water in efficiently solvating the choline cation.
To obtain a clearer understanding of the overall structural organization, particularly around the choline cation, we further examined the RDFs associated with the correlations involving the Och or Nch atoms with selected atomic species from choline, acetate, or water (Figure 12).
Figure 12.
Radial distribution functions (solid lines) and corresponding number of nearest neighbours (dashed lines) for correlations between the Och group and selected atomic species of choline, acetate, and water (a), and between the Nch group and selected atomic species of choline, acetate, and water (b).
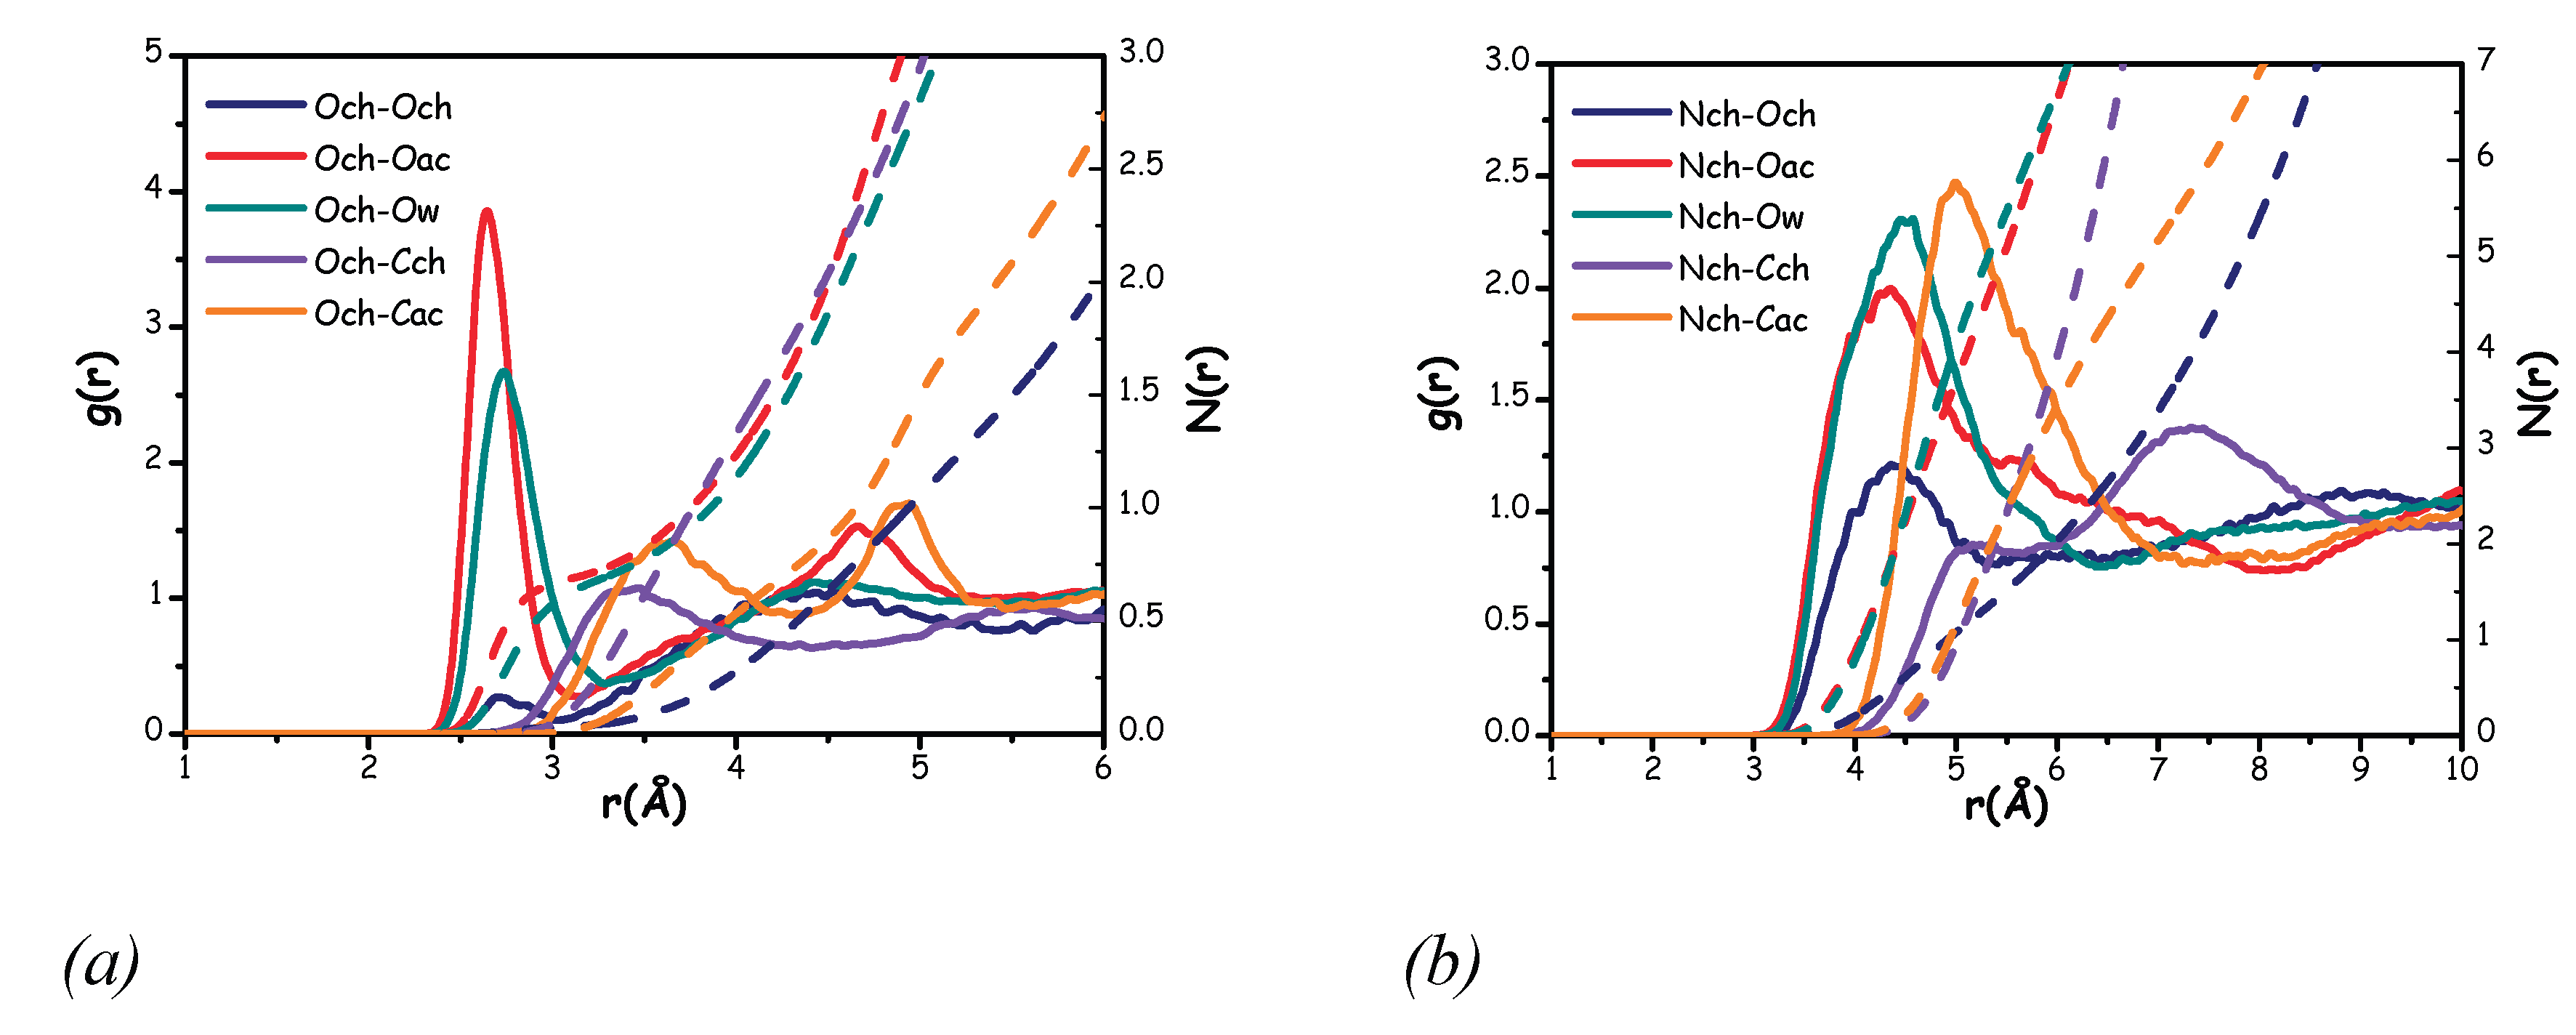
Figure 12 shows that both water and acetate effectively solvate the choline oxygen region and the ammonium moiety. However, more structured features are observed in the RDFs related to the Och species. This may be attributed to the steric hindrance caused by the methyl groups in the choline ammonium moiety and to the development of hydrogen bonding interactions involving choline’ hydroxyl group. Specifically, both the Och-Oac and Och-Ow correlations exhibit sharp, intense peaks centred at approximately 2.6 Å and 2.7 Å, respectively, with comparable solvation numbers 0.7 (Figure 12 (a)). When comparing with the behaviour observed in Aquoline [17], here, a larger role played by the anion is observed, but this observation is presumably a consequence of the lower water content in the present case.
On the other hand, both the Och-Cch and Och-Cac correlations are characterized by less sharp and intense peaks, centred at distances of 3.5 Å and 3.6 Å, respectively (Figure 12 (a)). This suggests weak interactions between hydroxyl moiety and methyl groups. In the case of Cch, the observed correlation likely arises from the coulombic interactions between the positively charged ammonium group and the partially negatively charged hydroxyl moiety. In the case of Cac, the correlation is likely mediated by the interaction between the choline hydroxyl hydrogen and acetate oxygen atoms. Finally, the Och-Och correlation clearly exhibits an unstructured peak, indicating a low probability of interaction between two choline molecules.
Concerning Nch, water and acetate provide efficient solvation. Both the Nch-Ow and Nch-Oac correlations exhibit the highest intensity peaks (Figure 12 (b)), and at the same integration distance, they show the greatest number of nearest neighbours (Table 2). Interestingly, at a relatively short distance of about 4.4 Å, a moderately intense peak is observed for the Nch-Och correlation. This correlation might be attributed to the electrostatic attraction between the positively charged ammonium group and the choline oxygen, but also to a collective solvation scenario induced by both acetate and water, with simultaneous solvation of both the ammonium group and the hydroxyl one.
Table 2.
Peak position, distance of integration and number of nearest neighbours related to all the correlations shown in Figure 12.
Table 2.
Peak position, distance of integration and number of nearest neighbours related to all the correlations shown in Figure 12.
| Correlation | Peak position (Å) | Integration distance (Å) | N(r) |
| Och-Oac | 2.6 | 3.5 | 0.83 |
| Och-Ow | 2.7 | 3.5 | 0.77 |
| Och-Cch | 3.4 | 4.3 | 1.70 |
| Och-Cac | 3.6 | 4.3 | 0.74 |
| Nch-Och | 4.4 | 5.5 | 0.63 |
| Nch-Oac | 4.3 | 5.5 | 2.20 |
| Nch-Ow | 4.5 | 5.5 | 2.30 |
| Nch-Cch | 5.1 | 5.5 | 1.03 |
| Nch-Cac | 5.0 | 7.5 | 2.50 |
Finally, examining the RDFs that involve correlations between Nch and Cac, we observe a relatively intense peak around 5.0 Å. This peak reflects the ammonium solvation scenario involving the acetate oxygens. In the case of the Nch-Cch correlation, a broad peak is observed at approximately 7.3 Å, accompanied by a small shoulder just below unity around 5.1 Å (Figure 12 (b)). This feature suggests the difficulty that the choline methyl group faces in solvating the ammonium group of another choline molecule
Interestingly, for both the Och and Nch species, all correlations involving acetate or water show similar features and numbers of nearest neighbours (Table 2). However, for the Och species, the acetate anion is closer to the hydroxyl group than the water molecules. A similar trend is observed for the Nch species, where the Nch-Oac correlation occurs at a shorter distance than the Nch-Ow correlation (Table 2).
A better understanding about the structural organization of the probed mixture can be achieved considering all conceivable hydrogen bonding interactions between the components. In Figure 13 the correlations for all the hydrogen bonding interactions involving water or acetate as a reference are illustrated.
Figure 13.
Radial distribution functions (solid lines) and corresponding number of nearest neighbours (dashed lines) for selected hydrogen bonding correlations considering water as the reference molecule (a) and choline or acetate as the reference molecule (b).
Figure 13.
Radial distribution functions (solid lines) and corresponding number of nearest neighbours (dashed lines) for selected hydrogen bonding correlations considering water as the reference molecule (a) and choline or acetate as the reference molecule (b).
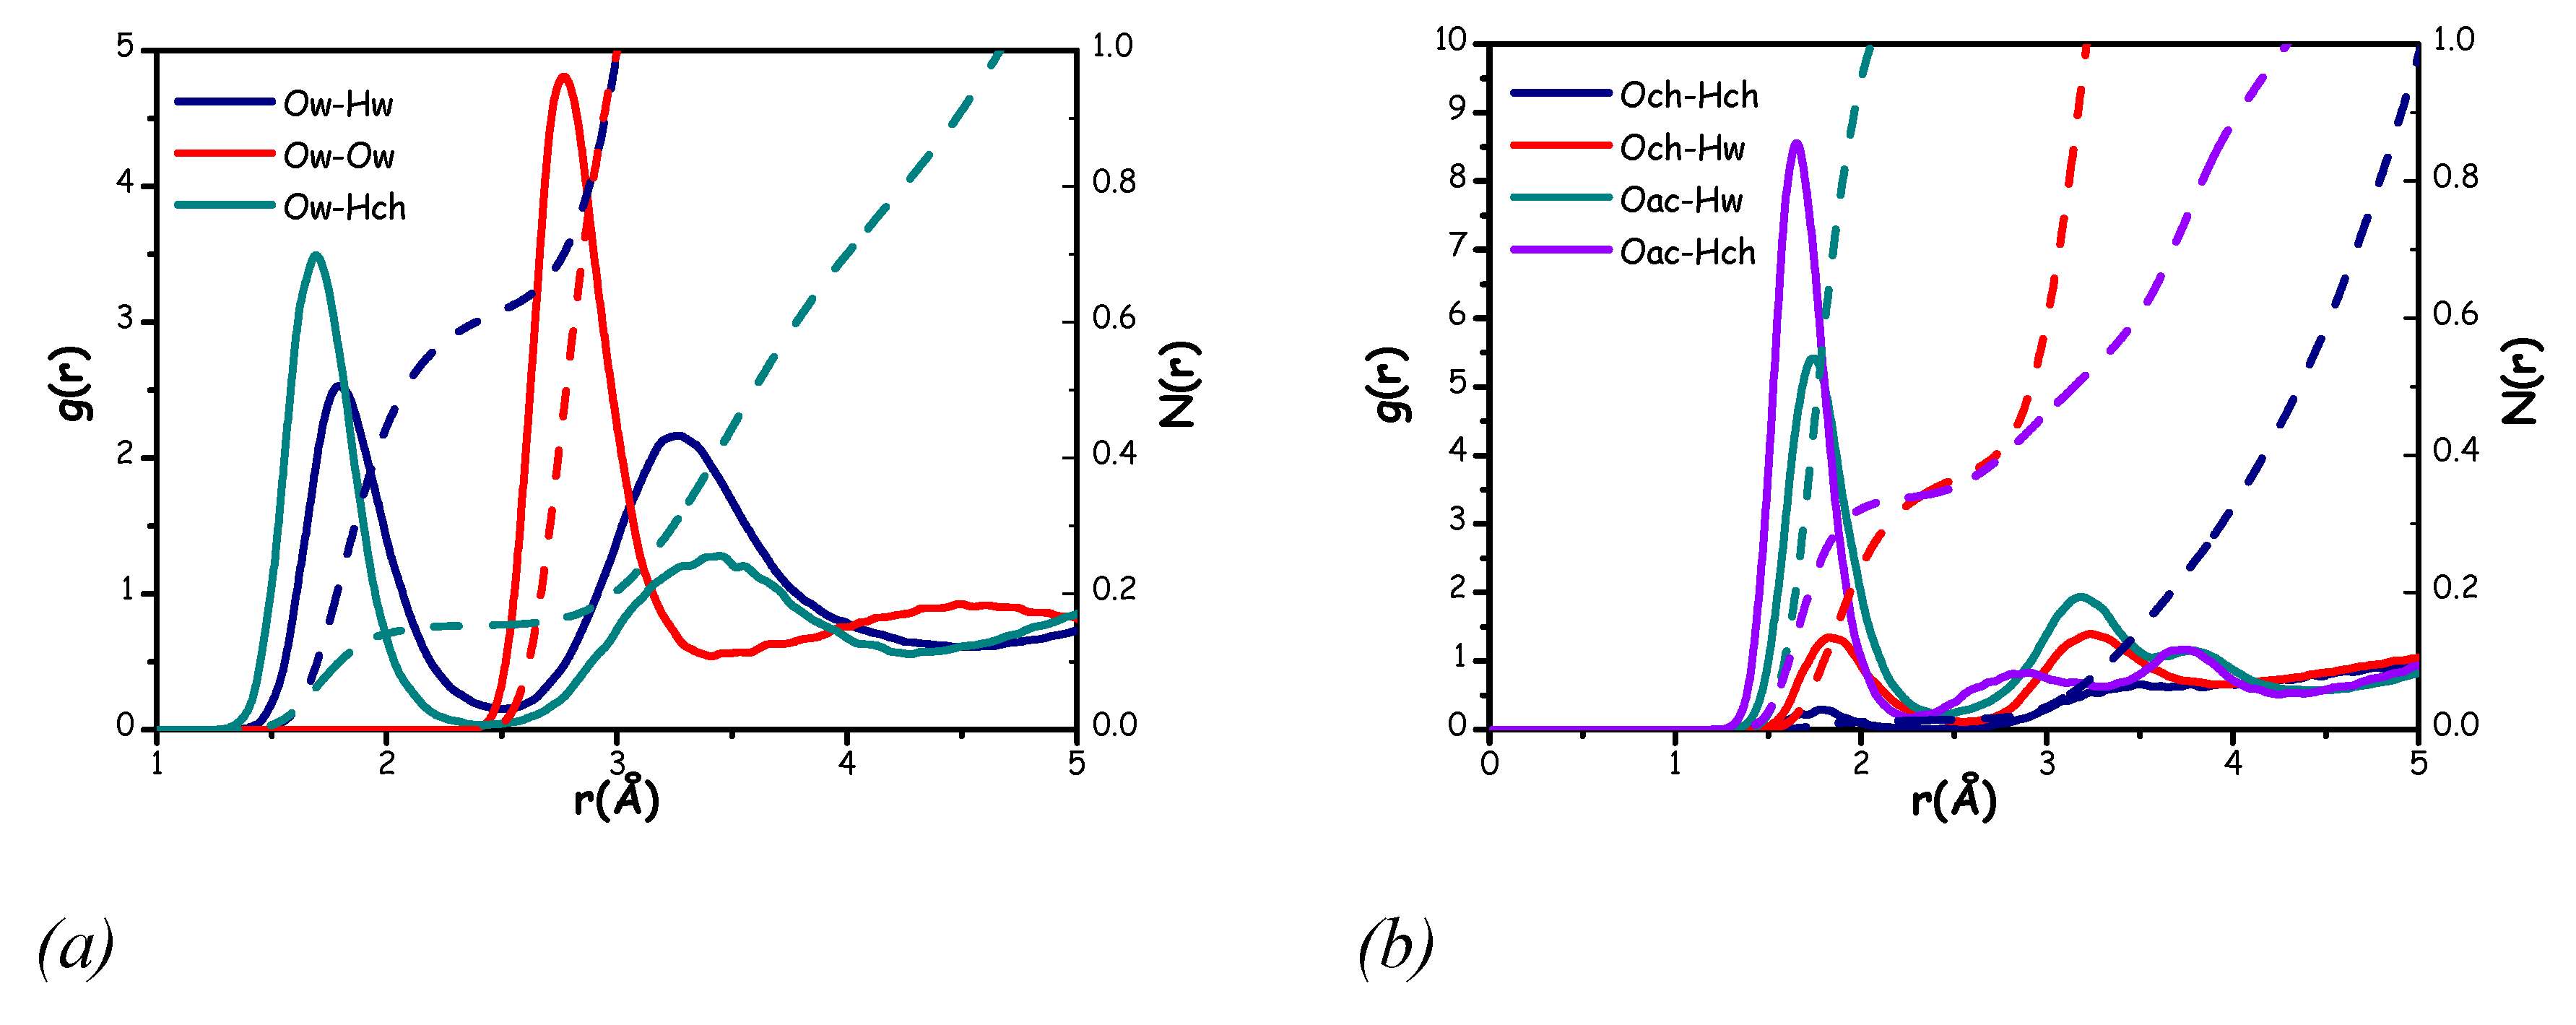
As shown in Figure 13, water molecules effectively solvate both hydroxyl choline and acetate oxygens’ region, with all hydrogen bonding correlations displaying sharp and intense peaks. Indeed, peaks are centred in a distance range between 1.7-1.9 Å and exceed unity, indicating strong hydrogen bonding interactions. However, a distinct preference of water hydrogens to interact with the acetate oxygens rather than the choline oxygen clearly emerges, as evidenced by the higher coordination number for the Oac-Hw correlation than for the Och-Hw one (see Table 3).
Table 3.
Peak position, distance of integration and number of nearest neighbours related to all the correlations shown in Figure 13.
Table 3.
Peak position, distance of integration and number of nearest neighbours related to all the correlations shown in Figure 13.
| Correlation | Peak position (Å) | Integration distance (Å) | N(r) |
| Ow-Hw | 1.8 | 2.5 | 0.62 |
| Ow-Ow | 2.8 | 3.5 | 1.4 |
| Ow-Hch | 1.7 | 2.5 | 0.16 |
| Hw-Och | 1.9 | 2.5 | 0.10 |
| Hch-Ow | 1.7 | 2.5 | 0.31 |
| Och-Hw | 1.9 | 2.5 | 0.37 |
| Oac-Hw | 1.7 | 2.5 | 1.16 |
| Oac-Hch | 1.7 | 2.5 | 0.36 |
| Hw-Oac | 1.7 | 2.5 | 0.58 |
| Hch-Oac | 1.7 | 2.5 | 0.71 |
| Och-Hch | 1.8 | 2.5 | 0.02 |
The hydrogen bonding solvation of water around the choline hydroxyl group shows subtle differences also when comparing the Ow-Hch and Och-Hw correlations (Figure 13 (a) and (b), respectively). The former exhibits a peak at a shorter distance than the latter (Table 3), and this peak appears also more intense and sharper. These features indicate a slight preference for water molecules to interact with the choline hydroxyl group via the Ow species, rather than through its Hw atoms. This behaviour likely reflects the system’s tendency to maintain strong hydrogen bond interactions between the water hydrogen atoms and the acetate oxygen atoms.
A further inspection of Figure 13 reveals acetate anion's strong ability to interact with the choline hydroxyl group. The Oac-Hch correlation displays the most intense peak, which, as shown in Table 3, is centred at the shortest distance and for which we found 0.36 choline hydroxyl hydrogens surrounding the acetate oxygens’ region. This observation suggests the formation of a strong hydrogen bond interaction between acetate and choline hydroxyl, as previously noted in the ChAc-urea mixture [20]. These findings underscore the significance of the anion, which can interact effectively with both choline and water.
However, when comparing the solvation effectiveness of water and acetate toward the choline hydroxyl group, the acetate anion appears to be more effective. The number of coordinating Oac species interacting with the choline hydroxyl hydrogen (Hch) exceeds the combined number of coordinating water species, both Ow and Hw, towards choline hydroxyl moiety (Table 3). This indicates that acetate oxygens may form stronger interactions with the choline hydroxyl group than water molecules do.
An examination of the Och-Hch correlation from Figure 13 highlights the difficulty of the choline cation in forming hydrogen bonds with another choline, further suggesting limited interactions between choline cations through hydrogen bonding.Inizio moduloFine modulo At the same time, although the Ow-Hw correlation displays a significant feature with a sharp peak centred at 1.8 Å, the overall analysis of Figure 13 suggests that water molecules struggle to exist in an environment similar to bulk water. This hypothesis is further supported by the Ow-Ow correlation, which, like in the Aquoline case, shows a depletion region within the first solvation shell [17]. This likely indicates a preferential interaction between water molecules and both choline and acetate, rather than with other water molecules.
In summary, the analysis of Figure 13 suggests a structural arrangement for which the role of the acetate anion, and its synergy with water, is particularly significant. The acetate, with its carboxyl group bearing a strongly delocalized negative charge, effectively interacts with both the Hch and Hw groups. Meanwhile, water molecules seem to arrange themselves around the acetate anion in such a way that they can interact with the Hch group through their Ow species, and with both the Oac and Ow of other water molecules via their Hw species. This type of structural organization can be clearly visualized through the Spatial Distribution Functions (SDFs) shown in Figure 14.
Figure 14.
Spatial distribution function of water (blue) and acetate (red) centres of mass surrounding a reference choline hydroxyl group (a). Spatial distribution function of water (blue) and choline (orange) centres of mass surrounding a reference acetate anion (b). In both cases the distribution isovalues refer approximately to 30% of the maximum amplitude.
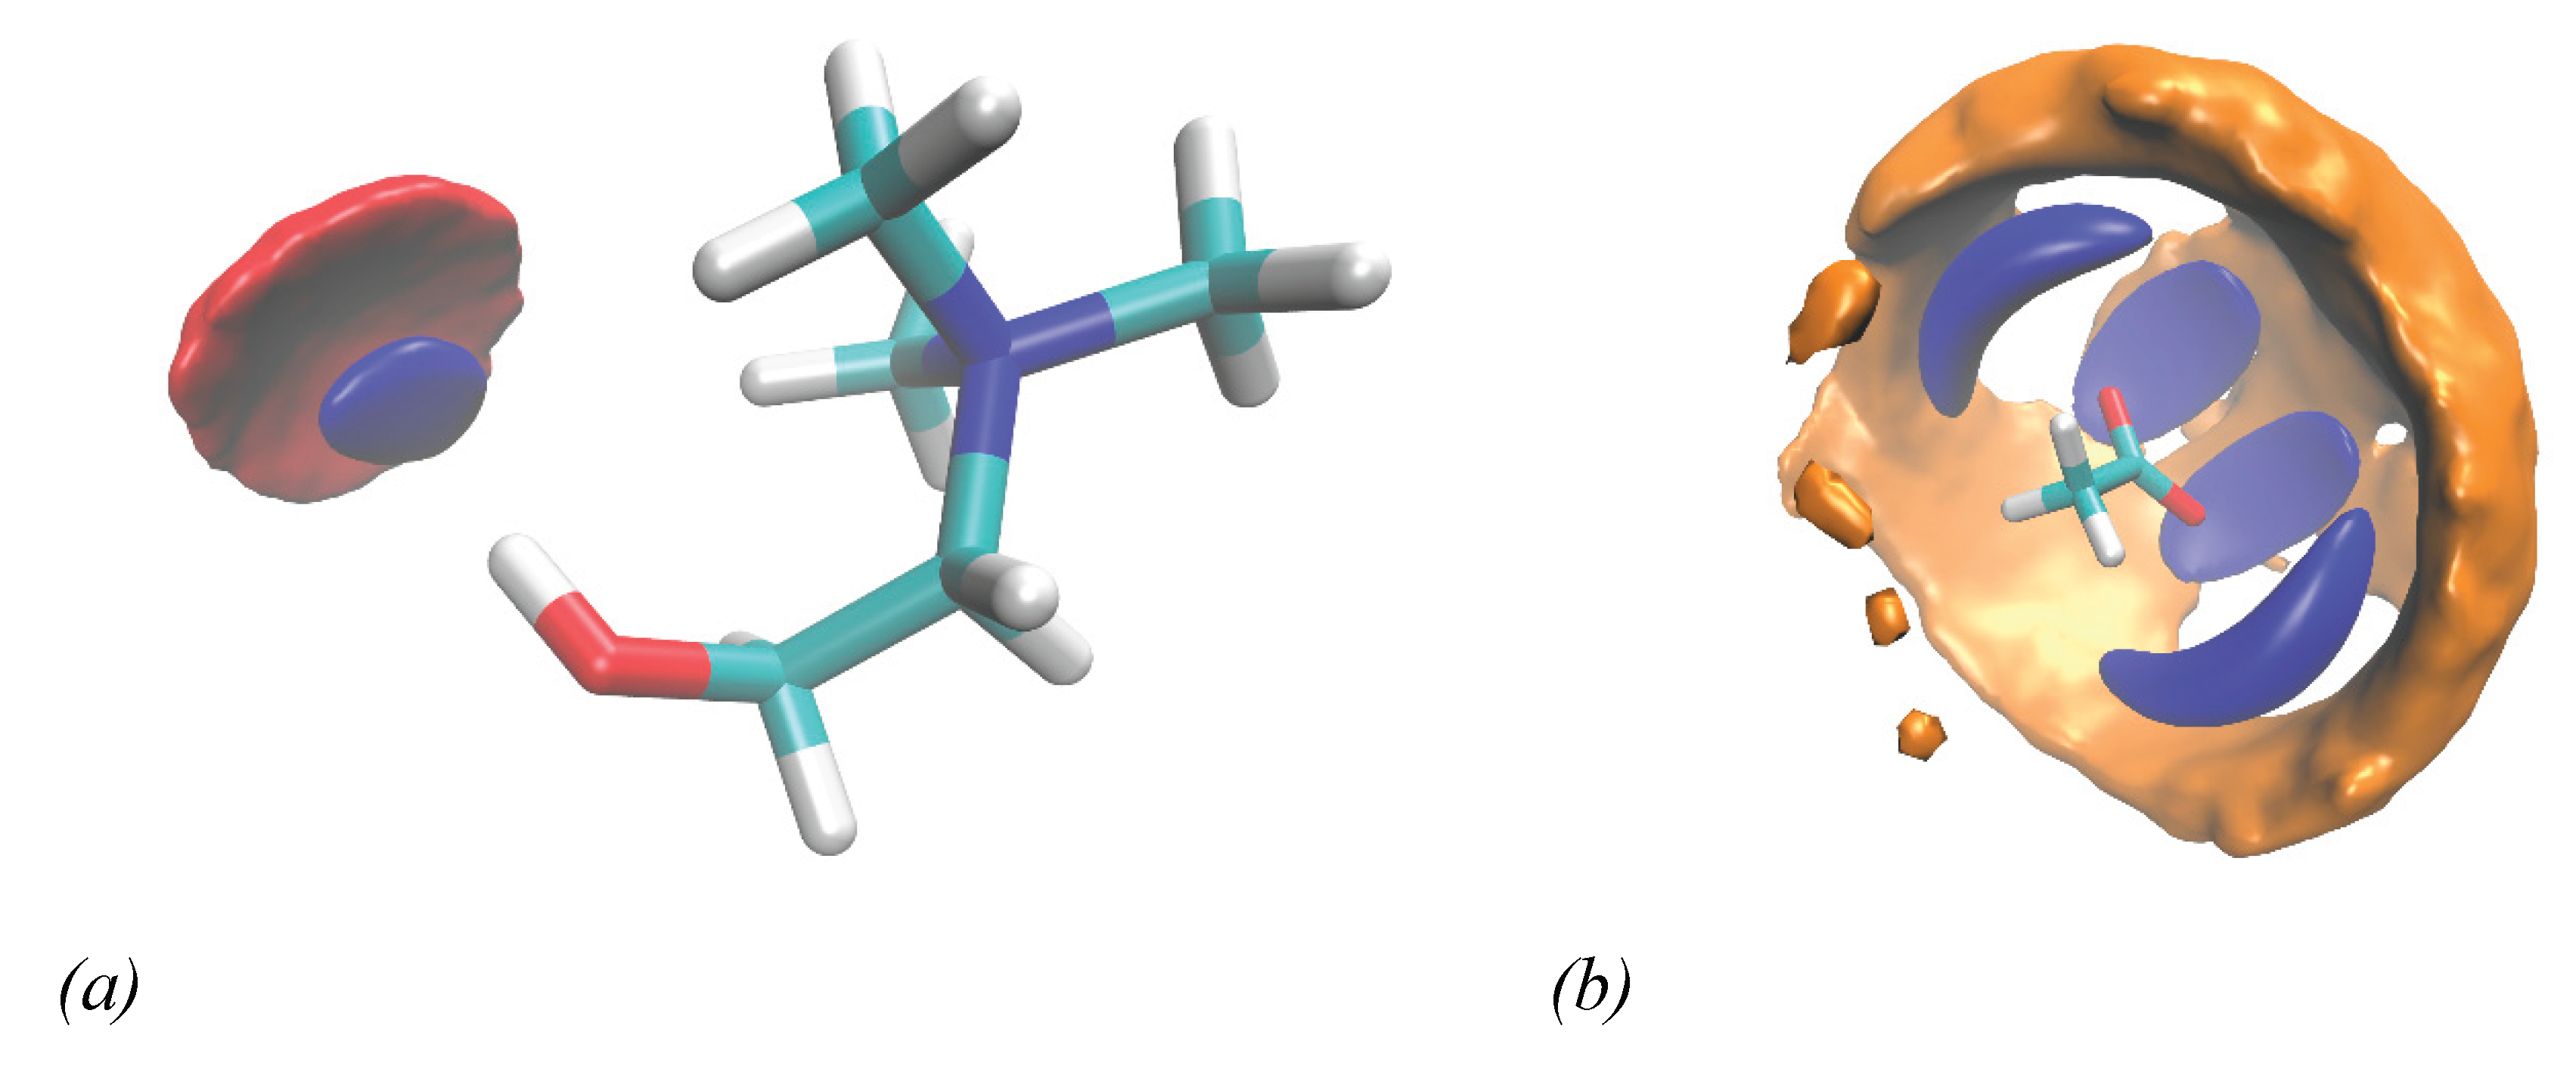
Upon examining the spatial distribution of both acetate (red) and water (blue) around the hydroxyl group of choline, it becomes clear that both species synergically interact with the hydroxyl hydrogen of the choline cation (Figure 14 (a)). The distributions of acetate and water around the hydroxyl hydrogen nearly overlap. An inspection of Figure 14 (b) shows how water (in blue) can distribute around acetate in a specific organized way, through which it can interact with both the oxygens’ acetate and other water molecules through strong hydrogen bonding interactions. In this way, choline cation (in orange) can effectively distribute around both acetate and water, interacting with both through its hydroxyl and ammonium region (Figure 12).
This well-defined, cooperative solvation structure, predominantly governed by strong hydrogen-bonding interactions, is characteristic of deep eutectic systems. However, due to the lack of experimental data at lower water contents, a definitive classification of the n = 2 mixture as a wb-DES cannot be firmly established.
Finally, we consider the potential for observing dispersive correlations involving the methyl groups of both choline and acetate. To illustrate this, in Figure 15 the RDFs corresponding to the correlations between the carbon atoms of the acetate and choline methyl moieties are presented. Figure 15 reveals that the correlation between two different choline methyl groups (Cch-Cch) is unstructured, showing a weak feature at 4 Å. This further prompts for a scenario where the choline cation is effectively solvated by both water and acetate, thereby reducing the likelihood of direct interactions between choline moieties.
Figure 15.
Radial distribution functions (solid lines) and corresponding number of nearest neighbours (dashed lines) for selected correlations between the methyl groups of choline and acetate.
Figure 15.
Radial distribution functions (solid lines) and corresponding number of nearest neighbours (dashed lines) for selected correlations between the methyl groups of choline and acetate.
In contrast, the Cac-Cac correlation is characterised by a sharp, intense peak centred around 3.9 Å. This feature aligns well with what was observed in the ChAc-urea mixture with n=2, where correlations between two different acetate molecules only show significant features in the methyl region [20]. Finally, the Cch-Cac correlation exhibits a feature characterized by a broad solvation shell centred around 4.0 Å, which can be attributed to the solvation process induced by the acetate oxygens toward the positively charged ammonium group of choline. Overall, despite differences in the homogeneity of local distribution, methyl-methyl correlations seem to be driven mostly by steric hindrance, as the first solvation shells have essentially identical coordination numbers.
4. Conclusions
Given the ongoing search for greener and more innovative alternatives to traditional organic solvents, the scientific community has shown strong commitment to the development of sustainable media. Among these, Deep Eutectic Solvents (DESs) have emerged as promising candidates thanks to their desirable properties, including low toxicity, biodegradability, ease of preparation, and tunability. In this context, the use of water as an active component in DESs has recently gained attention, aiming to create fully sustainable systems termed as water-based DESs (wb-DESs). Notably, combinations involving choline chloride (ChCl), the most widely used hydrogen bond acceptor (HBA) in DES research, and water, along with other water-based eutectic mixtures, have been proposed as viable solutions [16,17,33].
In this scenario, here a comprehensive experimental physicochemical characterization was carried out on choline acetate (ChAc)/water mixtures across various water:ChAc molar ratios (n=2-6). Differential Scanning Calorimetry (DSC) revealed the presence of a glass transition (Tg) between 150-180 K for all systems, with no first-order transitions observed, classifying all the mixtures as Low Transition-Temperature Mixtures (LTTMs). Key thermophysical properties, density (ρ), dynamic viscosity (η), electrical conductivity (ec), and refractive index (nD), were measured over a wide temperature range. Density followed a quasi-linear dependence on temperature (278.15–323.15 K), while viscosity and conductivity data were successfully modelled using the Vogel–Fulcher–Tammann (VFT) relationship. The Walden plot highlighted good ion dissociation and high fluidity across all mixtures. Refractive index measurements (283.15–383.15 K) displayed a linear temperature dependence. NMR studies provided further insights into the structural and dynamic behaviour. 1H-NMR measurements at 300 K showed well-resolved peaks for all protons, with signal coalescence between water and choline -OH groups, indicating intermediate dynamic exchange. Self-diffusion coefficients increased with water content, with acetate diffusing faster than choline, while water diffusion remained constant. Longitudinal relaxation times (T1) for 1H and 13C nuclei confirmed dynamic changes across compositions. Notably, the T1slow component of protons T1 exhibited its lowest value at n = 2, reflecting enhanced hydrogen bonding and reduced molecular mobility. These features are generally consistent with the formation of a deep eutectic mixture, but the lack of experimental data at lower water contents prevents a definitive confirmation that the n = 2 can be classified as a wb-DES. Such mixture was studied via ab-initio molecular dynamics (AIMD) simulations and Wide-Angle X-ray Scattering (WAXS) analysis. The excellent agreement between simulated and experimental densities, as well as between the computed and experimental structure factor S(Q), confirms the reliability of AIMD in describing the bulk structural features of the system. Both experimental and simulated S(Q) exhibit no features in the low-Q region (<1 Å⁻¹), indicating the absence of mesoscale heterogeneities or aggregation in the mixture. This finding converges with 1H NMR choline diffusion coefficient – based assessment that no cluster aggregation can be detected in the probed mixtures, thus challenging a recent proposal in this respect. A more detailed structural picture was obtained through radial distribution functions (RDFs) and spatial distribution functions (SDFs). Analysis of the RDFs between the centres of mass of all components reveals a clear organization into three coordination regions: the shortest distances correspond to water–water correlations, while choline–choline correlations appear at longer distances. The acetate anion plays a central role in the solvation environment, effectively interacting with both water and choline. AIMD analyses show that water and acetate can both solvate the choline cation, particularly its hydroxyl and ammonium groups, with a marked preference for the hydroxyl moiety due to steric hindrance around the ammonium. Examination of hydrogen bonding patterns illustrates that both water and acetate form strong interactions with the hydroxyl group of choline. However, acetate exhibits a slightly stronger and more structured interaction than water. Water, in turn, shows a preferential interaction via its oxygen atom rather than its hydrogen. Overall, the structural analysis points to a pronounced synergistic effect between acetate and water in solvating the choline cation. The two species cooperate in stabilizing the choline hydroxyl group, forming an extended, organized hydrogen-bond network, a feature likely supporting the deep eutectic nature of the mixture.
This study highlights the importance of a comprehensive physicochemical and structural characterization in guiding the rational design of wb-DESs and/or LTTMs. The strong hydrogen-bonding network identified at n = 2, highlighted by both AIMD simulations and NMR analyses, suggests a possible wb-DES behaviour for this composition. However, due to the lack of experimental data at lower n values, a definitive classification cannot be confirmed. In any case, such an extensive and integrated approach is essential for understanding the molecular organization of these systems and for enabling the rational development of green, tuneable solvents for future applications in sustainable chemistry and environmentally friendly technologies.
Supplementary Materials
The following supporting information can be downloaded at the website of this paper posted on Preprints.org.
Author Contributions
Conceptualization, Alessandro Triolo and Olga Russina; Data curation, Emanuela Mangiacapre; Formal analysis, Emanuela Mangiacapre, Zina Barhoumi, Martin Brehm, Franca Castiglione, Valerio Di Lisio, Alessandro Triolo and Olga Russina; Funding acquisition, Alessandro Triolo and Olga Russina; Investigation, Emanuela Mangiacapre, Zina Barhoumi, Martin Brehm, Franca Castiglione, Valerio Di Lisio and Alessandro Triolo; Methodology, Emanuela Mangiacapre, Martin Brehm, Franca Castiglione and Alessandro Triolo; Project administration, Olga Russina; Resources, Olga Russina; Software, Martin Brehm; Supervision, Alessandro Triolo and Olga Russina; Writing – original draft, Emanuela Mangiacapre; Writing – review & editing, Alessandro Triolo and Olga Russina.
Acknowledgments
This work has been supported by the University of Rome Sapienza Project: "Chemical physical properties and solvation capability of water-based eutectic solvents." (RM123188F106B148). Expert support from Dr. A. Del Giudice and access to the SAXS-Lab at the University of Rome Sapienza is acknowledged. Research at ISM-CNR was supported by the project ECS00000024 "Ecosistemi dell'Innovazione”— Rome Technopole of the Italian Ministry of University and Research, public call n. 3277, PNRR— Mission 4, Component 2, Investment 1.5, financed by the European Union, Next Generation EU. This work was also supported by PRIN2022 (“SEED4GREEN”), sponsored by the European Union, Next Generation EU, Missione 4 Componente 1 (RG11715C7CC660BE). We acknowledge Diamond Light Source, Rutherford Appleton Laboratory, U.K., for the provision of synchrotron access to Beamline I15-1 (Proposal No. CY34748). The skillfull support from Dr. D. Irving is acknowledged.
References
- E.L. Smith, A.P. Abbott, K.S. Ryder, Deep Eutectic Solvents (DESs) and Their Applications, Chem. Rev. 114 (2014) 11060–11082. [CrossRef]
- A.P. Abbott, Deep eutectic solvents and their application in electrochemistry, Curr. Opin. Green Sustain. Chem. 36 (2022) 100649. [CrossRef]
- A.P. Abbott, G. Capper, D.L. Davies, R.K. Rasheed, V. Tambyrajah, Novel solvent properties of choline chloride/urea mixtures, Chemical Communications (2003) 70–71. [CrossRef]
- M.A.R. Martins, S.P. Pinho, J.A.P. Coutinho, Insights into the Nature of Eutectic and Deep Eutectic Mixtures, J. Solution Chem. 48 (2019) 962–982. [CrossRef]
- van den Bruinhorst, M. Costa Gomes, Is there depth to eutectic solvents?, Curr. Opin. Green Sustain. Chem. 37 (2022) Article-100659. [CrossRef]
- D.O. Abranches, J.A.P. Coutinho, Annual Review of Chemical and Biomolecular Engineering Everything You Wanted to Know about Deep Eutectic Solvents but Were Afraid to Be Told, Annu. Rev. Chem. Biomol. Eng. 2023 14 (2023) 141–163. [CrossRef]
- Z. Wang, X. Zhao, Y. Chen, C. Wei, J. Jiang, A review of designable deep eutectic solvents for green fabrication of advanced functional materials, RSC Sustainability 3 (2025) 738–756. [CrossRef]
- D.O. Abranches, J.A.P. Coutinho, Type V deep eutectic solvents: Design and applications, Curr. Opin. Green Sustain. Chem. 35 (2022) Article 100612. [CrossRef]
- M. Gilmore, L.M. Moura, A.H. Turner, M. Swadźba-Kwaśny, S.K. Callear, J.A. McCune, O.A. Scherman, J.D. Holbrey, A comparison of choline:urea and choline:oxalic acid deep eutectic solvents at 338 K, Journal of Chemical Physics 148 (2018) Article 193823. [CrossRef]
- Z. Maugeri, P. de María, Novel choline-chloride-based deep-eutectic-solvents with renewable hydrogen bond donors: levulinic acid and sugar-based polyols, RSC Adv. 2 (2012) 421–425. [CrossRef]
- C. Fanali, S. Della Posta, L. Dugo, A. Gentili, L. Mondello, L. De Gara, Choline-chloride and betaine-based deep eutectic solvents for green extraction of nutraceutical compounds from spent coffee ground, J. Pharm. Biomed. Anal. 189 (2020) 113421. [CrossRef]
- N.F. Gajardo-Parra, M.J. Lubben, J.M. Winnert, Á. Leiva, J.F. Brennecke, R.I. Canales, Physicochemical properties of choline chloride-based deep eutectic solvents and excess properties of their pseudo-binary mixtures with 1-butanol, J. Chem. Thermodyn. 133 (2019) 272–284. [CrossRef]
- A.R. Harifi-Mood, R. Buchner, Density, viscosity, and conductivity of choline chloride + ethylene glycol as a deep eutectic solvent and its binary mixtures with dimethyl sulfoxide, J. Mol. Liq. 225 (2017) 689–695. [CrossRef]
- S. Di Muzio, O. Russina, D. Mastrippolito, P. Benassi, L. Rossi, A. Paolone, F. Ramondo, Mixtures of choline chloride and tetrabutylammonium bromide with imidazole as examples of deep eutectic solvents: their structure by theoretical and experimental investigation, J. Mol. Liq. 352 (2022) Article 118427. [CrossRef]
- K. Radošević, M. Cvjetko Bubalo, V. Gaurina Srček, D. Grgas, T. Landeka Dragičević, I. Radojčić Redovniković, Evaluation of toxicity and biodegradability of choline chloride based deep eutectic solvents, Ecotoxicol. Environ. Saf. 112 (2015) 46–53. [CrossRef]
- E. Mangiacapre, F. Castiglione, M. D’Aristotile, V. Di Lisio, A. Triolo, O. Russina, Choline chloride-water mixtures as new generation of green solvents: A comprehensive physico-chemical study, J. Mol. Liq. 383 (2023) Article 122120. [CrossRef]
- Triolo, F. Lo Celso, M. Brehm, V. Di Lisio, O. Russina, Liquid structure of a choline chloride-water natural deep eutectic solvent: A molecular dynamics characterization, J. Mol. Liq. 331 (2021) 115750. [CrossRef]
- Asakawa, M. Kohara, C. Sasaki, C. Asada, Y. Nakamura, Comparison of choline acetate ionic liquid pretreatment with various pretreatments for enhancing the enzymatic saccharification of sugarcane bagasse, Ind. Crops Prod. 71 (2015) 147–152. [CrossRef]
- D. Połomski, P. Garbacz, K. Czerwinski, M. Chotkowski, Synthesis and physicochemical properties of the mixtures based on choline acetate or choline chloride, J. Mol. Liq. 327 (2021) Article 114820. [CrossRef]
- Triolo, M.E. Di Pietro, A. Mele, F. Lo Celso, M. Brehm, V. Di Lisio, A. Martinelli, P. Chater, O. Russina, Liquid structure and dynamics in the choline acetate:urea 1:2 deep eutectic solvent, Journal of Chemical Physics 154 (2021) Article 244501. [CrossRef]
- H. Zhao, G.A. Baker, S. Holmes, New eutectic ionic liquids for lipase activation and enzymatic preparation of biodiesel, Org. Biomol. Chem. 9 (2011) 1908–1916. [CrossRef]
- J. Hoppe, R. Drozd, E. Byzia, M. Smiglak, Deep eutectic solvents based on choline cation - Physicochemical properties and influence on enzymatic reaction with β-galactosidase, Int. J. Biol. Macromol. 136 (2019) 296–304. [CrossRef]
- Y. Ma, G. Vernet, N. Zhang, S. Kara, Exploring DES-Water Mixtures for Improved ADH-CHMO Fusion Enzyme Performance in Linear Cascades, ChemCatChem 17 (2025) e202401792. [CrossRef]
- Z.L. Huang, B.P. Wu, Q. Wen, T.X. Yang, Z. Yang, Deep eutectic solvents can be viable enzyme activators and stabilizers, Journal of Chemical Technology and Biotechnology 89 (2014) 1975–1981. [CrossRef]
- B.P. Wu, Q. Wen, H. Xu, Z. Yang, Insights into the impact of deep eutectic solvents on horseradish peroxidase: Activity, stability and structure, J. Mol. Catal. B Enzym. 101 (2014) 101–107. [CrossRef]
- G. Colombo Dugoni, A. Mezzetta, L. Guazzelli, C. Chiappe, M. Ferro, A. Mele, Purification of Kraft cellulose under mild conditions using choline acetate based deep eutectic solvents, Green. Chem. 22 (2020) 8680–8691. [CrossRef]
- M.L. Segatto, L. Schnarr, O. Olsson, K. Kümmerer, V.G. Zuin, Ionic liquids vs. ethanol as extraction media of algicidal compounds from mango processing waste, Front. Chem. 10 (2022) 986987. [CrossRef]
- Bansal, D. Chauhan, K.K. Bhasin, G.R. Chaudhary, The study of molecular interactions of aqueous solutions of Choline Acetate at different temperatures, J. Mol. Liq. 286 (2019) 110878. [CrossRef]
- M. Eckert, W. Peters, J.F. Drillet, Fast microwave-assisted hydrothermal synthesis of pure layered δ-MnO2 for multivalent ion intercalation, Materials 11 (2018) 2399. [CrossRef]
- M. Sakthivel, S.P. Batchu, A.A. Shah, K. Kim, W. Peters, J.F. Drillet, An electrically rechargeable Zinc/Air cell with an aqueous choline acetate electrolyte, Materials 13 (2020) 1–21. [CrossRef]
- E. Veroutis, S. Merz, R.-A. Eichel, J. Granwehr, Solvation and Ion-Pairing Effects of Choline Acetate Electrolyte in Protic and Aprotic Solvents Studied by NMR Titrations, ChemPhysChem 23 (2022) e202100602. [CrossRef]
- S. Miao, H.J. Jiang, S. Imberti, R. Atkin, G. Warr, Aqueous choline amino acid deep eutectic solvents, Journal of Chemical Physics 154 (2021) 214504. [CrossRef]
- Triolo, F. Lo Celso, O. Russina, Liquid structure of a water-based, hydrophobic and natural deep eutectic solvent: The case of thymol-water. A Molecular Dynamics study, J. Mol. Liq. 372 (2023) 121151. [CrossRef]
- M. Basham, J. Filik, M.T. Wharmby, P.C.Y. Chang, B. El Kassaby, M. Gerring, J. Aishima, K. Levik, B.C.A. Pulford, I. Sikharulidze, D. Sneddon, M. Webber, S.S. Dhesi, F. Maccherozzi, O. Svensson, S. Brockhauser, G. Náray, A.W. Ashton, Data Analysis WorkbeNch (DAWN), J. Synchrotron Radiat. 22 (2015) 853–858. [CrossRef]
- A.K. Soper, GudrunN and GudrunX: programs for correcting raw neutron and X-ray diffraction data to differential scattering cross section, 2011. http://epubs.stfc.ac.uk.
- J. Hutter, M. Iannuzzi, F. Schiffmann, J. Vandevondele, Cp2k: Atomistic simulations of condensed matter systems, Wiley Interdiscip. Rev. Comput. Mol. Sci. 4 (2014) 15–25. [CrossRef]
- T.D. Kühne, M. Iannuzzi, M. Del Ben, V. V. Rybkin, P. Seewald, F. Stein, T. Laino, R.Z. Khaliullin, O. Schütt, F. Schiffmann, D. Golze, J. Wilhelm, S. Chulkov, M.H. Bani-Hashemian, V. Weber, U. Borštnik, M. Taillefumier, A.S. Jakobovits, A. Lazzaro, H. Pabst, T. Müller, R. Schade, M. Guidon, S. Andermatt, N. Holmberg, G.K. Schenter, A. Hehn, A. Bussy, F. Belleflamme, G. Tabacchi, A. Glöß, M. Lass, I. Bethune, C.J. Mundy, C. Plessl, M. Watkins, J. VandeVondele, M. Krack, J. Hutter, CP2K: An electronic structure and molecular dynamics software package -Quickstep: Efficient and accurate electronic structure calculations, Journal of Chemical Physics 152 (2020) Article 194103. [CrossRef]
- J. Vandevondele, M. Krack, F. Mohamed, M. Parrinello, T. Chassaing, J. Hutter, Quickstep: Fast and accurate density functional calculations using a mixed Gaussian and plane waves approach, Comput. Phys. Commun. 167 (2005) 103–128. [CrossRef]
- J. VandeVondele, J. Hutter, An efficient orbital transformation method for electronic structure calculations, Journal of Chemical Physics 118 (2003) 4365–4369. [CrossRef]
- P. Hohenberg, W. Kohn, Inhomogeneous Electron Gas, Physical Review 136 (1964) B864–B871. [CrossRef]
- W. Kohn, L.J. Sham, Self-Consistent Equations Including Exchange and Correlation Effects, Physical Review 140 (1965) A1133–A1138. [CrossRef]
- Lee, W. Yang, R.G. Parr, Development of the Colle-Salvetti correlation-energy formula into a functional of the electron density, Phys. Rev. B 37 (1988) 785–789. [CrossRef]
- A.D. Becke, Density-functional exchange-energy approximation with correct asymptotic behavior, Phys. Rev. A (Coll Park) 38 (1988) 3098–3100. [CrossRef]
- S. Grimme, S. Ehrlich, L. Goerigk, Effect of the damping function in dispersion corrected density functional theory, J. Comput. Chem. 32 (2011) 1456–1465. [CrossRef]
- S. Grimme, J. Antony, S. Ehrlich, H. Krieg, A consistent and accurate ab initio parametrization of density functional dispersion correction (DFT-D) for the 94 elements H-Pu, Journal of Chemical Physics 132 (2010) Article 154104. [CrossRef]
- D.G.A. Smith, L.A. Burns, K. Patkowski, C.D. Sherrill, Revised Damping Parameters for the D3 Dispersion Correction to Density Functional Theory, Journal of Physical Chemistry Letters 7 (2016) 2197–2203. [CrossRef]
- J. VandeVondele, J. Hutter, Gaussian basis sets for accurate calculations on molecular systems in gas and condensed phases, Journal of Chemical Physics 127 (2007) Article 114105. [CrossRef]
- Hartwigsen, S. Goedecker, J. Hutter, Relativistic separable dual-space Gaussian pseudopotentials from H to Rn, Phys. Rev. B 58 (1998) 3641–3662. [CrossRef]
- S. Goedecker, M. Teter, J. Hutter, Separable dual-space Gaussian pseudopotentials, Phys. Rev. B 54 (1996) 1703–1710. [CrossRef]
- S. Nosé, A unified formulation of the constant temperature molecular dynamics methods, J. Chem. Phys. 81 (1984) 511–519. [CrossRef]
- G.J. Martyna, M.L. Klein, M. Tuckerman, Nosé-Hoover chains: The canonical ensemble via continuous dynamics, J. Chem. Phys. 97 (1992) 2635–2643. [CrossRef]
- L. Martinez, R. Andrade, E.G. Birgin, J.M. Martínez, PACKMOL: A package for building initial configurations for molecular dynamics simulations, J. Comput. Chem. 30 (2009) 2157–2164. [CrossRef]
- S. Plimpton, Fast Parallel Algorithms for Short-Range Molecular Dynamics, J. Comput. Phys. 117 (1995) 1–19. [CrossRef]
- H.W. Horn, W.C. Swope, J.W. Pitera, J.D. Madura, T.J. Dick, G.L. Hura, T. Head-Gordon, Development of an improved four-site water model for biomolecular simulations: TIP4P-Ew, Journal of Chemical Physics 120 (2004) 9665–9678. [CrossRef]
- B. Doherty, O. Acevedo, OPLS Force Field for Choline Chloride-Based Deep Eutectic Solvents, Journal of Physical Chemistry B 122 (2018) 9982–9993. [CrossRef]
- H.C. Andersen, Rattle: A “velocity” version of the shake algorithm for molecular dynamics calculations, J. Comput. Phys. 52 (1983) 24–34. [CrossRef]
- J.-P. Ryckaert, G. Ciccotti, H.J.C. Berendsen, Numerical integration of the cartesian equations of motion of a system with constraints: molecular dynamics of n-alkanes, J. Comput. Phys. 23 (1977) 327–341. [CrossRef]
- H.J.C. Berendsen, J.P.M. Postma, W.F. Van Gunsteren, A. Dinola, J.R. Haak, Molecular dynamics with coupling to an external bath, J. Chem. Phys. 81 (1984) 3684–3690. [CrossRef]
- T. Schneider, E. Stoll, Molecular-dynamics study of a three-dimensional one-component model for distortive phase transitions, Phys. Rev. B 17 (1978) 1302–1322. [CrossRef]
- B. DÜNWEG, W. PAUL, BROWNIAN DYNAMICS SIMULATIONS WITHOUT GAUSSIAN RANDOM NUMBERS, International Journal of Modern Physics C 02 (1991) 817–827. [CrossRef]
- M. Brehm, B. Kirchner, TRAVIS - A free analyzer and visualizer for monte carlo and molecular dynamics trajectories, J. Chem. Inf. Model 51 (2011) 2007–2023. [CrossRef]
- M. Brehm, M. Thomas, S. Gehrke, B. Kirchner, TRAVIS—A free analyzer for trajectories from molecular simulation, Journal of Chemical Physics 152 (2020) Article 164105. [CrossRef]
- O. Hollõczki, M. Macchiagodena, H. Weber, M. Thomas, M. Brehm, A. Stark, O. Russina, A. Triolo, B. Kirchner, Triphilic Ionic-Liquid Mixtures: Fluorinated and Non-fluorinated Aprotic Ionic-Liquid Mixtures, ChemPhysChem 16 (2015) 3325–3333. [CrossRef]
- H. Zhao, G.A. Baker, S. Holmes, New eutectic ionic liquids for lipase activation and enzymatic preparation of biodiesel, Org. Biomol. Chem. 9 (2011) 1908–1916. [CrossRef]
- Y. Xie, H. Dong, S. Zhang, X. Lu, X. Ji, Effect of water on the density, viscosity, and CO2 solubility in choline chloride/urea, J. Chem. Eng. Data 59 (2014) 3344–3352. [CrossRef]
- V. Agieienko, R. Buchner, Variation of Density, Viscosity, and Electrical Conductivity of the Deep Eutectic Solvent Reline, Composed of Choline Chloride and Urea at a Molar Ratio of 1:2, Mixed with Dimethylsulfoxide as a Cosolvent, J. Chem. Eng. Data 65 (2020) 1900–1910. [CrossRef]
- R.B. Leron, M.H. Li, High-pressure density measurements for choline chloride: Urea deep eutectic solvent and its aqueous mixtures at T = (298.15 to 323.15) K and up to 50 MPa, Journal of Chemical Thermodynamics 54 (2012) 293–301. [CrossRef]
- Andreani, C. Corsaro, D. Mallamace, G. Romanelli, R. Senesi, F. Mallamace, The onset of the tetrabonded structure in liquid water, Sci. China Phys. Mech. Astron. 62 (2019) Article 107008. [CrossRef]
- H. Jin, B. O’Hare, J. Dong, S. Arzhantsev, G.A. Baker, J.F. Wishart, A.J. Benesi, M. Maroncelli, Physical properties of ionic liquids consisting of the 1-butyl-3- methylimidazolium cation with various anions and the bis(trifluoromethylsulfonyl)imide anion with various cations, Journal of Physical Chemistry B 112 (2008) 81–92. [CrossRef]
- V. Piacentini, C. Simari, E. Mangiacapre, A. Pierini, A. Gentile, S. Marchionna, I. Nicotera, S. Brutti, E. Bodo, Aprotic Electrolytes Beyond Organic Carbonates: Transport Properties of LiTFSI Solutions in S-Based Solvents, ChemSusChem 18 (2024) e202402273. [CrossRef]
- S.-Y. Lee, K. Ueno, C.A. Angell, Lithium Salt Solutions in Mixed Sulfone and Sulfone-Carbonate Solvents: A Walden Plot Analysis of the Maximally Conductive Compositions, The Journal of Physical Chemistry C 116 (2012) 23915–23920. [CrossRef]
- M. Dahbi, F. Ghamouss, F. Tran-Van, D. Lemordant, M. Anouti, Comparative study of EC/DMC LiTFSI and LiPF6 electrolytes for electrochemical storage, J. Power Sources 196 (2011) 9743–9750. [CrossRef]
- Triolo, F. Lo Celso, C. Ottaviani, P. Ji, G.B. Appetecchi, F. Leonelli, D.S. Keeble, O. Russina, Structural features of selected protic ionic liquids based on a super-strong base, Phys. Chem. Chem. Phys. 21 (2019) 25369–25378. [CrossRef]
- G. De Araujo Lima E Souza, M.E. Di Pietro, F. Castiglione, P.H. Marques Mezencio, P. Fazzio Martins Martinez, A. Mariani, H.M. Schütz, S. Passerini, M. Middendorf, M. Schönhoff, A. Triolo, G.B. Appetecchi, A. Mele, Implications of Anion Structure on Physicochemical Properties of DBU-Based Protic Ionic Liquids, Journal of Physical Chemistry B 126 (2022) 7006–7014. [CrossRef]
- O. Russina, R. Caminiti, A. Triolo, S. Rajamani, B. Melai, A. Bertoli, C. Chiappe, Physico-chemical properties and nanoscale morphology in N-alkyl-N-methylmorpholinium dicyanamide room temperature ionic liquids, J. Mol. Liq. 187 (2013) 252–259. [CrossRef]
- O. Russina, A. Triolo, L. Gontrani, R. Caminiti, Mesoscopic Structural Heterogeneities in Room-Temperature Ionic Liquids, J. Phys. Chem. Lett. 3 (2012) 27–33. [CrossRef]
- W. Chen, X. Bai, Z. Xue, H. Mou, J. Chen, Z. Liu, T. Mu, The formation and physicochemical properties of PEGylated deep eutectic solvents, New J. Chem. 43 (2019) 8804–8810. [CrossRef]
- M. Hayyan, T. Aissaoui, M.A. Hashim, M.A. AlSaadi, A. Hayyan, Triethylene glycol based deep eutectic solvents and their physical properties, J. Taiwan Inst. Chem. Eng. 50 (2015) 24–30. [CrossRef]
- Y. Cui, C. Li, J. Yin, S. Li, Y. Jia, M. Bao, Design, synthesis and properties of acidic deep eutectic solvents based on choline chloride, J. Mol. Liq. 236 (2017) 338–343. [CrossRef]
- Y. Wang, W. Chen, Q. Zhao, G. Jin, Z. Xue, Y. Wang, T. Mu, Ionicity of deep eutectic solvents by Walden plot and pulsed field gradient nuclear magnetic resonance (PFG-NMR), Physical Chemistry Chemical Physics 22 (2020) 25760–25768. [CrossRef]
- D.R. MacFarlane, M. Forsyth, E.I. Izgorodina, A.P. Abbott, G. Annat, K. Fraser, On the concept of ionicity in ionic liquids, Physical Chemistry Chemical Physics 11 (2009) 4962–4967. [CrossRef]
- C.A. Angell, N. Byrne, J.-P. Belieres, Parallel Developments in Aprotic and Protic Ionic Liquids: Physical Chemistry and Applications, Acc. Chem. Res. 40 (2007) 1228–1236. [CrossRef]
- R. Nanda, K. Damodaran, A review of NMR methods used in the study of the structure and dynamics of ionic liquids, Magnetic Resonance in Chemistry 56 (2018) 62–72. [CrossRef]
- M. Zubkov, G.R. Dennis, T. Stait-Gardner, A.M. Torres, S.A. Willis, G. Zheng, W.S. Price, Physical characterization using diffusion NMR spectroscopy, Magnetic Resonance in Chemistry 55 (2017) 414–424. [CrossRef]
- Lepore, G. Ciancaleoni, D.R. Perinelli, G. Bonacucina, S. Gabrielli, G. de Simone, R. Gabbianelli, L. Bordoni, M. Tiecco, Cluster aggregation of water-based deep eutectic solvents in water and evaluation of their cytotoxicity, J. Mol. Liq. 415 (2024) 126427. [CrossRef]
- C. Allegretti, P. D’Arrigo, F.G. Gatti, L.A.M. Rossato, E. Ruffini, Dependence of 1H-NMR T1 relaxation time of trimethylglycine betaine deep eutectic solvents on the molar composition and on the presence of water, RSC Adv. 13 (2023) 3004–3007. [CrossRef]
- O.S. Hammond, D.T. Bowron, K.J. Edler, Liquid structure of the choline chloride-urea deep eutectic solvent (reline) from neutron diffraction and atomistic modelling, Green Chemistry 18 (2016) 2736–2744. [CrossRef]
- A.H. Turner, J.D. Holbrey, Investigation of glycerol hydrogen-bonding networks in choline chloride/glycerol eutectic-forming liquids using neutron diffraction, Phys. Chem. Chem. Phys. 21 (2019) 21782–21789. [CrossRef]
- Y. Zhang, D. Poe, L. Heroux, H. Squire, B.W. Doherty, Z. Long, M. Dadmun, B. Gurkan, M.E. Tuckerman, E.J. Maginn, Liquid Structure and Transport Properties of the Deep Eutectic Solvent Ethaline, Journal of Physical Chemistry B 124 (2020) 5251–5264. [CrossRef]
- S. Kaur, S. Sharma, H.K. Kashyap, Bulk and interfacial structures of reline deep eutectic solvent: A molecular dynamics study, J. Chem. Phys. 147 (2017) 194507. [CrossRef]
- O.S. Hammond, D.T. Bowron, K.J. Edler, The Effect of Water upon Deep Eutectic Solvent Nanostructure: An Unusual Transition from Ionic Mixture to Aqueous Solution, Angewandte Chemie - International Edition 56 (2017) 9782–9785. [CrossRef]
Disclaimer/Publisher’s Note: The statements, opinions and data contained in all publications are solely those of the individual author(s) and contributor(s) and not of MDPI and/or the editor(s). MDPI and/or the editor(s) disclaim responsibility for any injury to people or property resulting from any ideas, methods, instructions or products referred to in the content. |
© 2025 by the authors. Licensee MDPI, Basel, Switzerland. This article is an open access article distributed under the terms and conditions of the Creative Commons Attribution (CC BY) license (http://creativecommons.org/licenses/by/4.0/).
Copyright: This open access article is published under a Creative Commons CC BY 4.0 license, which permit the free download, distribution, and reuse, provided that the author and preprint are cited in any reuse.


