
Submitted:
18 July 2025
Posted:
21 July 2025
You are already at the latest version
Abstract
Skilled Birth Attendance (SBA) is essential for reducing maternal and neonatal mortality, yet access remains limited in many low- and middle-income countries. This study used machine learning to predict SBA use among Ugandan women and identify key influencing factors. We analysed data from the 2016 Uganda Demographic and Health Survey, focusing on women aged 15 to 49 who had given birth in the preceding five years. After preparing and selecting relevant features, six tree-based models (decision tree, random forest, gradient boosting, XGBoost, LightGBM, CatBoost) and logistic regression were applied. Class imbalance was addressed using cost-sensitive learning, and hyperparameters were tuned via Bayesian optimization. XGBoost performed best (F1-score: 0.52; recall: 0.73; AUC: 0.75). SHapley Additive Explanations (SHAP) were used to interpret model predictions. Key predictors of SBA use included education level, antenatal care visits, region (especially Northern Uganda), perceived distance to a healthcare facility, and urban or rural residence. The results demonstrate the value of interpretable machine learning for identifying at-risk populations and guiding targeted maternal health interventions in Uganda.
Keywords:
maternal healthcare
; skilled birth attendance
; machine learning
; class imbalance
; class weights
; SHAP explainability
1. Introduction
Maternal health services including antenatal care (ANC), Skilled Birth Attendance (SBA), and postnatal care are critical interventions that reduce maternal and neonatal mortality [1,2,3]. SBA, as defined by the World Health Organization (WHO), requires the presence of a trained and accredited health professional, such as a midwife, doctor, or nurse, during labor, delivery, and the immediate postpartum period [4]. These trained professionals play a key role in preventing and managing obstetric emergencies like obstetric haemorrhage, hypertensive disorders in pregnancy, and pregnancy-related infections, which are the leading causes of maternal death in Sub-Saharan Africa [5]. Their presence at birth also ensures good hygiene, timely referral in the event of complications, and continuous care, ultimately protecting mothers and infants from morbidity and mortality [6]. Widespread utilization of SBA greatly reduces deaths and complications of both mother and newborn, making better access to skilled birth attendants essential for improving maternal and child health worldwide [4].
In spite of the clear need of SBA during delivery, disparities in healthcare access, infrastructure, wealth, and education contribute to inconsistencies in utilization in many low- and middle-income countries [7,8,9]. Despite efforts to promote facility-based deliveries, many births in Sub-Saharan Africa still occur without the presence of a qualified health professional, increasing the risks of complications and adverse maternal and neonatal outcomes [10].
Uganda implemented a skilled attendance at birth strategy as part of its efforts to meet the Millennium Development Goal (MDG) 5 target of reducing the maternal mortality ratio (MMR) by 75% [11]. This initiative led to a significant increase in skilled birth attendance, rising from 35% in the 1990s to 42% in 2006, and reaching 74% by 2016. However, this progress still fell short of the 90% coverage target [12]. Similarly, Uganda's Maternal Mortality Rate (MMR) declined from 506 maternal deaths per 100,000 live births in 1995 to 336 deaths per 100,000 live births in 2016 [13], yet remained far from the stated goal of reducing the MMR by 75%. The challenges in reaching this goal highlight the need for more targeted, data-driven approaches to identify women at risk of not using skilled delivery services and develop interventions that increase uptake.
2. Related Literature
Previous studies from across sub-Saharan Africa have identified a range of socio-demographic, economic, and obstetric factors associated with the use of skilled birth attendance (SBA) or health facility delivery. Maternal education is consistently reported as one of the most influential determinants, with women who have attained secondary education or higher being significantly more likely to seek skilled care during childbirth [14,15]. Antenatal care (ANC) attendance, especially completing at least four visits, has also been strongly linked to increased SBA use, as it promotes early identification of complications and strengthens engagement with the healthcare system [16,17]. Geographic location plays a critical role; studies from Sub-Saharan Africa show that urban women consistently report higher utilization of skilled delivery services than their rural counterparts, largely due to better access to healthcare infrastructure [10,18]. Wealth status, often captured through the household wealth index, is another key predictor, with wealthier women more likely to afford transportation and delivery-related costs [19]. Furthermore, perceived distance to health facilities and partner’s educational attainment have also been found to influence SBA uptake, particularly in African contexts, where male partners often play a role in healthcare decision-making [20,21].
Studies on SBA have predominantly used traditional statistical methods [8,9,22,23,24,25], which may not fully capture the complex relationships and interactions among socio-economic, demographic, and obstetric factors that influence the uptake of SBA. Machine Learning (ML) models have demonstrated success in identifying patterns in maternal health data, providing valuable insights into which women are most at risk of not using maternal health services [26,27,28,29]. By adopting ML methods, policymakers and healthcare providers can identify high-risk populations, thereby implementing targeted interventions which could significantly strengthen the country’s ability to reduce maternal and neonatal mortality. While some studies have applied machine learning to the prediction of place of delivery and use of skilled birth attendance [27,28,30], our study aims to use nationally representative data from the Uganda Demographic and Health Survey and machine learning models to predict whether a woman in Uganda used skilled delivery services at the time of birth, while identifying the key socio-economic, demographic, obstetric, and healthcare-related factors influencing this decision.
3. Methodology
3.1. Data Source and Study Population
This study utilized secondary data from the 2016 Uganda Demographic and Health Survey (UDHS). The 2016 UDHS was a nationally representative cross-sectional survey conducted by the Uganda Bureau of Statistics (UBOS) in collaboration with ICF. It primarily targeted women of reproductive age (15-49 years), as well as men aged 15-54 and children under five within sampled households. A total of 18,506 women aged 15-49 and 5,336 men aged 15-54, were interviewed across 19,588 households, providing data on urban and rural areas across all the regions of Uganda. The survey employed a two-stage stratified sampling approach to ensure national representation across all regions of Uganda. Data gathered included information on household characteristics, fertility, maternal and child health, and other health indicators. Only women who had given birth at least once in the five years preceding the survey and were dejure residents were considered for this study.
3.2. Study Variables
In this study, the target variable was presence of skilled birth attendant during the last delivery (Yes/No). Only doctors, nurses/midwives and medical assistants/clinical officers were considered as skilled birth attendants. The independent variables/features were grouped according to Andersen’s Behavioral Model for Healthcare Use [31]:
- Predisposing factors: sex of household head, age of household head, marital status, family type, household size, region, family mobility, religion, education level, literacy, frequency of reading newspaper, frequency of listening to radio, frequency of watching tv, partner’s education level, fertility preference, age first sex, age first birth, children ever born, age group, and birth interval.
- Enabling factors: owning a bank account, wealth index, internet use, health insurance, radio ownership, television ownership, mobile ownership, residence, perceived distance to healthcare facility, perceived healthcare cost, partner’s employment status, healthcare autonomy, expenditures autonomy, and employment status.
- Need factors: wanted pregnancy, pregnancy duration, number of ANC visits, first trimester ANC, contraception use, and healthcare facility visits.
The Sex Marriage Birth (SMB) sequence variable was also examined as a predictor of Skilled Birth Attendant (SBA) use. This variable represents the order in which key life events, i.e., sex, marriage, and childbirth, occur in a woman’s life. It may provide additional contextual and behavioral insights, offering a broader perspective than individual factors like age at first sex or age at first birth. The SMB sequence can also reflect social norms that influence maternal healthcare decisions.
The variable includes the following categories:
- 4.
- Sex → Marriage → Birth (SMB)
- 5.
- Marriage → Sex → Birth (MSB)
- 6.
- Sex → Birth → Marriage (SBM)
- 7.
- Sex → Birth → No Marriage (SBNoM)
Figure 1 summarizes the workflow adopted in this study.
3.3. Data Preprocessing
First, a few outliers in the continuous variables were assessed using Interquartile Range (IQR) method and were dropped. The data was then examined for missingness. Out of the 40 features used in analysis, 9 features had missing data ranging from 0.03% to 2.8%. Missing data were imputed using a K-Nearest Neighbors (KNN) imputation approach, which estimates missing values based on the similarity of observations within the dataset.
For each categorical feature with missing values, KNN identifies the k most similar observations (nearest neighbors) using an appropriate distance metric for categorical data, such as Hamming distance. The missing value is imputed based on the most frequently occurring category among the k-nearest neighbors. This process is repeated for all variables with missing values. KNN imputation for categorical data preserves existing relationships between variables and avoids assumptions regarding missing data mechanism. It is particularly effective in datasets with complex interactions between categorical features. KNN imputation has been shown to achieve higher predictive accuracy for missing data compared to other imputation methods [32,33].
Next, features were assessed for being near constant. A near zero variance variable is one in which nearly all observations fall into a single category, leaving very little variability. In the case of the health insurance variable, 98.93% of the records were "no" while only 1.07% were "yes." This extreme imbalance means that almost every observation has the same value ("no"), which offers little information for differentiating between cases. Consequently, this variable is considered to have near zero variance and may be not be useful for predictive modeling [34]. It was, therefore, dropped from further analysis.
Multicollinearity among categorical variables was assessed using Cramér’s V, which is a measure of association between two nominal variables. Cramér’s V ranges from 0 (no association) to 1 (perfect association). There was a strong correlation between marital status and variables such as partner’s employment status, partner’s education level, family type and healthcare autonomy due to women who are not in a union all failing in the same category in these variables. The same applied to number of ANC visits and ANC in the first trimester; all women without an ANC Visit were grouped together. The heatmap in Figure 2 indicates that all pairwise Cramér’s V values were below 0.8, suggesting that no strong associations exist between the features. This implies that multicollinearity was not a major concern in the dataset, and all categorical features were retained for further modeling.
We normalized the numerically encoded categorical variables using MaxAbsScaler, which scales each feature to the [-1, 1] range by dividing by its maximum absolute value. This prevents variables with larger scales from disproportionately influencing the model which is particularly important for algorithms that depend on feature magnitudes.
3.4. Data Splitting and Handling Class Imbalance
To enable reliable model evaluation, the dataset was split into a training set (80%) for model training, and a testing set (20%) for evaluating model performance on unseen data. The split was performed randomly via stratified sampling while preserving the distribution of the target variable.
Upon examining the distribution of the target variable in the training set, we identified an imbalance between the two classes in the target variable (SBA Yes/SBA No) (Figure 3). Class imbalance can skew machine learning models, favoring the majority class, and leading to poor predictive performance for the minority class. To mitigate this issue, a cost-sensitive learning approach was applied by assigning higher misclassification penalties to the minority class. This approach ensured that the learning algorithm prioritized the underrepresented class without artificially altering the dataset's distribution [35].
In our approach, we used class weights during model training computed using the formula:
This formula assigns higher weights to the minority class by accounting for the imbalance in the dataset. By applying these weights, we ensured that the model focused more on the minority class during training, helping to balance the influence of both classes. This method improves the model's ability to predict the minority class more effectively without being dominated by the majority class. The cost-sensitive weighting was consistently applied across both feature selection and model training.
3.5. Feature Selection
We used Elastic Net for feature selection because it effectively handles multicollinearity while retaining important predictors. By combining L1 (Lasso) and L2 (Ridge) regularization, Elastic Net automatically reduces the impact of redundant or weak predictive features by shrinking their coefficients, ensuring that only the most relevant variables contribute to the model. Unlike Lasso, which may arbitrarily drop one variable from a group of correlated features, Elastic Net distributes importance among them and removes only those that add little unique value [36]. This makes it particularly useful as a preprocessing step for tree-based models like Random Forest or XGBoost, which do not inherently manage collinearity well. By eliminating redundant predictors, Elastic Net ensures that tree-based models focus on meaningful splits, reducing overfitting and improving both model stability and interpretability.
3.6. Model Training
This study focuses on the use of machine learning models that provide not only strong predictive capability but also clear interpretability. Our goal is not just to predict outcomes but to understand the drivers behind them, and to do so in a way that can be clearly communicated to policymakers, practitioners, and stakeholders. For that reason, we focused on models that avoid the black-box nature of many machine learning techniques and instead offer transparent, explainable decision-making.
We used a variety of tree-based algorithms for their well-established strength in capturing complex patterns while still providing clear insights into which factors drive predictions. These models enable us to identify the most important predictors of skilled birth attendance, explain individual-level predictions, and translate findings into actionable policy recommendations. These methods have been briefly outlined below:
Decision Tree: A supervised learning algorithm that uses a tree-like structure to make decisions. It works by splitting the data into branches based on different feature values, forming a series of if-then rules. Each path through the tree shows how a decision is made, which makes the model easy to understand and explain. While decision trees are quick to train and interpret, they can sometimes overfit the data, especially when the dataset is complex. Still, their clear structure makes them useful when model transparency is important. [37].
Random Forest: An ensemble learning method that constructs multiple decision trees and combines their predictions for higher accuracy and stability. Each tree is trained on a random subset of data and features, reducing the risk of overfitting. For classification tasks, the final prediction is determined by majority voting among the trees. It is well-suited for large datasets and handles high-dimensional datasets efficiently [38]
Gradient Boosting: An ensemble technique that builds models in a sequential manner. Each new tree is trained to minimize the errors made by the combined ensemble of all previous trees. This additive training process allows the model to correct bias and capture intricate patterns in the data. Gradient Boosting can outperform many algorithms in terms of accuracy, but regularization is needed to avoid overfitting. When combined with model explanation tools (e.g., SHAP), it offers a good balance between predictive power and interpretability [39].
XGBoost (Extreme Gradient Boosting): A powerful boosting algorithm that builds trees sequentially, with each new tree correcting errors from the previous ones. Unlike Random Forest which grows trees independently, XGBoost refines predictions step by step, reducing bias. It includes built-in regularization, preventing overfitting while maintaining high accuracy. Known for its speed, efficiency, and ability to handle missing values, it is widely used for large-scale predictive tasks [40].
LightGBM (Light Gradient Boosting Machine): Optimized for speed and efficiency, it follows a boosting approach similar to XGBoost but grows trees leaf-wise instead of level-wise. This method prioritizes the most important splits first, improving accuracy while requiring less memory. It also handles missing values and categorical data automatically, making it ideal for large datasets [41].
CatBoost (Categorical Boosting): Designed to handle categorical features efficiently without requiring manual encoding. Unlike Random Forest which builds trees independently, or XGBoost and LightGBM, which split trees differently, CatBoost constructs symmetrical trees, ensuring balanced learning. It also employs ordered boosting, which helps reduce overfitting and prevents data leakage. This makes it particularly effective for datasets with many categorical variables, commonly used in finance, healthcare, and recommendation systems [42].
We also included logistic regression as a baseline model. While limited in capturing non-linear relationships and interactions, its statistical transparency makes it a useful benchmark, especially in public health research where it is widely used.
3.7. Hyperparameter Tuning
To enhance the model’s performance, we fine-tuned the hyperparameters using Bayesian Optimization. Unlike Grid Search, which exhaustively tests every possible combination of hyperparameters, Bayesian Optimization takes a ‘smarter approach’. It begins by sampling a small set of random hyperparameter values, then builds a probabilistic model to predict how changes in these values might impact performance. As it learns from previous results, it gradually narrows its search to focus on the combinations that are most likely to improve performance. This method is especially valuable for large search spaces, as it significantly reduces the number of iterations required to find the best performing combination of hyperparameters [43].
To ensure robust tuning, we implemented 5-fold cross-validation. The training data was divided into five equal parts, and in each iteration, four parts were used for training while the fifth served as the validation set. By rotating the validation set across all five folds, we obtained performance metrics for every subset of the data. The final score was the average across all folds, providing a more reliable estimate of the model’s generalization ability.
The best hyperparameters were chosen based on the highest average F1 score for women who did not utilize SBA during cross-validation. This metric was selected to prioritize the accurate identification of this underrepresented and at-risk group. Finally, we tested the optimized model on a held-out test set to verify its performance on unseen data. This step was essential to ensure that the model was not overfitting to the training set and could generalize efficiently.
3.8. Model Evaluation
After hyperparameter tuning, each model was retrained on the entire training set (with the selected parameters) and evaluated on the held-out test set (20%). This final evaluation provides an unbiased estimate of real-world performance.
The following metrics were computed to assess model quality:
- 8.
- Accuracy: the proportion of correct predictions made by the model out of all predictions.
- 9.
- Area Under the ROC Curve (AUC): measures how well the model can distinguish between different classes. It is a score ranging from 0 to 1, where 1 means perfect distinction and 0.5 means no distinction.
- 10.
- Recall: measures how well the model identifies positive cases.
- 11.
- Precision: the proportion of true positive results out of all the positive results predicted by the model
- 12.
- F1-Score: combines precision and recall into a single score. It is useful for evaluating models trained on imbalanced data.
Where TP = True Positive, TN = True Negative, FP = False Positive, FN = False Negative.
3.9. Enhancing Model Interpretability with SHAP
SHAP (SHapley Additive Explanations) is a machine learning interpretability method that explains how each feature contributes to a model’s predictions. It assigns SHAP values to individual features, indicating their positive or negative impact on the predicted outcome. This allows us to understand not just which features are important, but how they influence the model’s decision. Unlike traditional feature importance methods, SHAP provides both global insights (overall feature importance) and local explanations (individual predictions). This makes it particularly useful in critical areas like healthcare, where model transparency is essential. By using SHAP, complex models such as Random Forest and XGBoost become more interpretable, helping stakeholders gain trust in the predictions and make informed decisions [44].
We used a combination of Stata 15, R 4.4.0, and Python 3.13 for the analysis. Initial data cleaning, outlier removal, and categorization of variables were conducted in Stata. Missing data imputation was performed in R using the VIM package. Tree-based machine learning modeling and interpretability analysis were carried out in Python. The scikit-learn library was used for decision tree, random forest, and gradient boosting models, while xgboost, lightgbm, and catboost were used for their respective algorithms. Bayesian optimization for hyperparameter tuning was implemented using the scikit-optimize library. For model interpretation, the shap library was used to generate both global and local explanations of feature contributions.
4. Results
4.1. Socio-Demographic and Economic Characteristics of the Study Population
A total of 9,611 women aged 15-49 who had given birth in the 5-year period preceding the 2016 UDHS survey were included in this study. According to results in Table 1, women in urban areas had a higher proportion of SBA use (90.69%) compared to those in rural areas (70.82%). Among rural women, 29.18% gave birth without skilled assistance, while in urban areas, only 9.31% lacked SBA. Women aged 15-19 years had the highest SBA utilization rate at 80.56%, while those aged 40 and older had the lowest SBA rate at 62.93%. Women in the richest quintile had the highest SBA rate at 87.30%, while those in the poorest quintile had the lowest at 68.14%. Almost a third (31.86%) of women in the poorest quintile gave birth without skilled care, compared to only 12.70% in the richest group.
4.2. Maternal Obstetric Characteristics of the Study Population
As seen in Table 2, women who gave birth for the first time had the highest SBA rate (86.73%) compared to those with two or more children. Women who had four or more ANC visits had the highest SBA rate at 80.70%, while those with fewer than four ANC visits had a lower SBA rate of 67.40.%. Over a half (54.92%) of women with no ANC visits gave birth without skilled assistance. Women with a birth interval of more than three years had the highest skilled birth attendance (SBA) rate at 77.04%, followed by those with a birth interval of less than two years at 70.43%. Women with a birth interval of 2-3 years had the lowest SBA rate at 67.55%, with 32.45% giving birth without skilled assistance.
4.3. Feature Selection
The feature selection process using Elastic Net regularization identified the most influential predictors of SBA usage while mitigating the effects of multicollinearity. By balancing L1 (Lasso) and L2 (Ridge) penalties, the model retained only the most relevant features, eliminating redundant or weak predictive variables. The selected features and their corresponding coefficient magnitudes are presented in Figure 4. Among the strongest predictors were internet use, urban residence, television ownership, number of ANC visits, and regional factors (e.g., residing in Northern Uganda or Kampala).
4.4. Machine Learning Analysis of Skilled Birth Attendance
In evaluating the performance of various models, we found that several performed quite similarly, especially in terms of recall, F1-score, and AUC. Our primary focus was on identifying women who did not use skilled birth attendance (SBA), which is the group of particular concern from a public health perspective. For this reason, we optimized all models using the F1-score for class 0 (women without SBA), which balances both precision and recall for this underrepresented group.
Across all models, XGBoost achieved the highest AUC (0.7473) and one of the best F1-scores (0.52), alongside Gradient Boosting, CatBoost, and LightGBM (Table 3). While the differences in performance were small, XGBoost stood out as the most consistent across all metrics including precision, recall, accuracy, and AUC, making it the most reliable choice overall.
The relatively modest F1-scores are largely due to the imbalance in the dataset, where fewer women fell into the "no SBA" category. To address this, we used class weighting, which gave more importance to these minority cases during training. This helped the models focus more on correctly identifying those most at risk of not accessing skilled care.
Although Gradient Boosting, CatBoost, and LightGBM also performed well (Figure 5) and remain strong alternatives, XGBoost offered the best combination of performance and consistency for our objectives.
The SHAP feature importance plot (Figure 6) highlights the most influential variables driving the model's predictions for skilled birth attendance. Education level emerged as the most critical factor, followed closely by number of ANC visits and urban residence, emphasizing the role of education and healthcare access in maternal care decisions. Regional disparities, particularly for the Northern region, and perceived distance to healthcare facilities also significantly impacted predictions. These insights not only enhance model transparency but also point to key intervention areas for improving maternal health outcomes.
The SHAP Beeswarm plot (Figure 7) shows how each feature in our model affects the prediction of whether a woman will use skilled delivery services. Each dot represents one woman, and the color shows the value of the feature (i.e., low to high). The position of the dots tells us how much that feature increased or decreased the model’s prediction. The top ten insights are:
- Education level is the most important factor. Women with higher education are much more likely to use skilled delivery services.
- ANC visits also play a big role. Women who attended more antenatal care visits, especially 4 or more, have higher chances of using skilled birth attendants.
- Urban residence is linked to higher use of services.
- Region (Northern) has positive SHAP values, meaning women from the Northern region are more likely to use skilled delivery services, according to the model.
- Distance to health facility is another important factor. Women who said distance was a big problem were less likely to use skilled care.
- Wealth index shows that wealthier women are more likely to use skilled services.
- Longer birth intervals are linked to higher chances of use of SBA.
- Number of children ever born shows that first-time mothers or those with fewer children are more likely to seek skilled delivery services.
- Television ownership and other media exposure like mobile ownership help improve use of services.
- Partner’s education also matters; women with more educated partners were more likely to use skilled care.
The SHAP dependence plots (Figure 8) further simplify the visualizations for the top five features.
5. Discussion
This study set out to develop interpretable machine learning models to predict the likelihood of skilled birth attendance (SBA) using nationally representative demographic and health survey data from Uganda. We evaluated a range of models, including logistic regression and six tree-based classifiers: decision tree, random forest, gradient boosting, XGBoost, LightGBM, and CatBoost. Among these, the best-performing model - XGBoost - achieved an F1-score of 0.52, a recall of 0.73, and an AUC of 0.75. While these figures may not appear exceptionally high, they reflect the intrinsic challenge of predicting imbalanced health outcomes [45,46].
Compared to previous studies, our results are in line with what others have found. For example, Ngusie et al [30] used data from 12 sub-Saharan African countries to build machine learning models. While this wide scope helps with generalizing results across countries, it does not allow for deeper insights within any single country. Their study also reported the highest AUC, which may partly be due to the larger, combined dataset boosting performance. In contrast, our study focuses only on Uganda, which means we can capture country-specific patterns that might otherwise be missed. For instance, we found that being from the Northern region was one of the strongest predictors of skilled birth attendance. This kind of detail would likely have been lost in a combined dataset. Focusing on one country helps ensure that the findings are relevant to national health policies and targeted interventions. It is also worth noting the aforementioned study used place of delivery as their target variable. In contrast, we used use of SBA as the outcome, a choice that aligns with WHO recommendations for assessing maternal healthcare [47]. Our data show that skilled attendance can occur outside of health facilities, for example, through home visits by trained providers.
It is also important to highlight key methodological differences between our work and previous studies. For instance, Tesfaye et al [28] included “place of delivery” as a predictor for skilled delivery service use which is an approach that risks data leakage, since place of delivery is inherently tied to the outcome being predicted. We deliberately excluded such variables to ensure that our model's predictions were based only on true predictors known before delivery. This strengthens the validity and practical value of our results.
Our study achieved results that are slightly lower than those reported by Fredriksson et al [27]. One possible reason for this difference is the availability of certain variables such as place of previous delivery, which was used in their model. In our dataset, this variable was missing for more than half of the observations and was therefore excluded from our analysis. Importantly, while their study focused solely on prediction, we took a step further by applying SHAP (SHapley Additive exPlanations) to interpret both individual-level and overall model predictions. This helped us understand not only what the model predicted, but also why. This is an essential step in making machine learning outputs useful for real-world decision-making. Additionally, to address class imbalance, we applied class weighting during model training. While techniques like Synthetic Minority Oversampling Technique (SMOTE) are commonly used in similar research, they are designed for continuous variables and can produce unrealistic synthetic examples when applied to categorical data [48]. Given our dataset was entirely categorical, class weighting was a more appropriate and reliable approach.
SHAP analysis identified five main factors that most strongly influenced whether a woman used skilled birth attendance (SBA): her level of education, the number of antenatal care (ANC) visits she attended, her region of residence (particularly Northern Uganda), whether she perceived distance to a health facility as a barrier, and whether she lived in an urban or rural area. Women with secondary education were more likely to use SBA, reflecting the well-established role of education in promoting health awareness, autonomy, and service utilization [49]. Similarly, women who attended four or more ANC visits were much more likely to use SBA, likely due to increased contact with health professionals and exposure to awareness campaigns [17].
Regional variation also played a key role in the decision to utilize SBA. Women from Northern Uganda were less likely to access SBA services, pointing to persistent inequalities in health facilities’ accessibility, sociocultural context and economic development [50]. Further, women who reported that distance was not a barrier had higher SBA use, underlining the importance of physical access to services [18]. Finally, urban residence was associated with greater SBA use, emphasizing the disparity between urban and rural areas in accessing skilled delivery services, probably due to better facility coverage, higher awareness, and improved transportation options in urban settings [18].
6. Conclusions
This study highlights the value of using interpretable machine learning to identify the key factors influencing skilled birth attendance in Uganda. Instead of relying on black-box models, we used SHAP values to explain not just the predictions, but the reasoning behind them, hence making the results easier to understand and apply. Tree-based models such as XGBoost, LightGBM, CatBoost, and Random Forest provided both strong performance and meaningful insights, helping us present findings in a way that policymakers and health professionals can act on. By working with nationally representative data, avoiding data leakage, and handling class imbalance, we built models that are both reliable and relevant. Most importantly, we did not stop at prediction; we used the models to uncover actionable insights, like the role of antenatal care and regional disparities, that can help shape future maternal health strategies
Author Contributions
Conceptualization, S.M., R.W., AND I.K.; Methodology, S.M., R.W., AND I.K..; Software, S.M.; Validation, R.W., AND I.K.; Formal Analysis, S.M.; Investigation, S.M.; Data Curation, S.M.; Writing – Original Draft Preparation, S.M.; Writing – Review & Editing, S.M., R.W., AND I.K.; Visualization, S.M..; Supervision, R.W., AND I.K.; Project Administration, R.W. All authors have read and agreed to the published version of the manuscript.
Funding
This study was funded partly by The African Centre of Excellence in Data Science and the University of Rwanda.
Institutional Review Board Statement
Not applicable.
Informed Consent Statement
We were granted access to the DHS dataset through official approval from the DHS Program (https://www.dhsprogram.com). This study used secondary data and since the data is already anonymized and does not contain any personal identifiers, no further ethical clearance was required. The DHS Program follows strict guidelines to ensure the confidentiality and privacy of all respondents.
Data Availability Statement
The dataset utilized in this study is publicly available through the DHS website upon request to the relevant authority (https://dhsprogram.com/data/available-datasets.cfm). Furthermore, the code used in this study can be provided upon reasonable request to the corresponding author.
Acknowledgments
The authors are indebted to the School of Statistics and Planning, Makerere University, and the African Centre of Excellence in Data Science, University of Rwanda, for their invaluable technical support throughout this study.
Conflicts of Interest
The authors declare no conflict of interest.
References
- Kibria, G.M.A.; Burrowes, V.; Choudhury, A.; Sharmeen, A.; Ghosh, S.; Mahmud, A.; KC, A. Determinants of Early Neonatal Mortality in Afghanistan: An Analysis of the Demographic and Health Survey 2015. Global Health 2018, 14, 47. [Google Scholar] [CrossRef] [PubMed]
- Pattinson, R.C.; Vannevel, V.; Barnard, D.; Baloyi, S.; Gebhardt, G.S.; Roux, K. le; Moran, N.; Moodley, J. Failure to Perform Assisted Deliveries Is Resulting in an Increased Neonatal and Maternal Morbidity and Mortality: An Expert Opinion. South African Medical Journal 2018, 108, 75–78. [Google Scholar] [CrossRef] [PubMed]
- Tekelab, T.; Chojenta, C.; Smith, R.; Loxton, D. The Impact of Antenatal Care on Neonatal Mortality in Sub-Saharan Africa: A Systematic Review and Meta-Analysis. PLOS ONE 2019, 14, e0222566. [Google Scholar] [CrossRef] [PubMed]
- WHO Births Attended by Skilled Health Personnel; 2004.
- Musarandega, R.; Nyakura, M.; Machekano, R.; Pattinson, R.; Munjanja, S.P. Causes of Maternal Mortality in Sub-Saharan Africa: A Systematic Review of Studies Published from 2015 to 2020. Journal of Global Health 2021, 11. [Google Scholar] [CrossRef] [PubMed]
- Adegoke, A.; van den Broek, N. Skilled Birth Attendance-Lessons Learnt. BJOG: An International Journal of Obstetrics & Gynaecology 2009, 116, 33–40. [Google Scholar] [CrossRef]
- Dantas, J.A.R.; Singh, D.; Lample, M. Factors Affecting Utilization of Health Facilities for Labour and Childbirth: A Case Study from Rural Uganda. BMC Pregnancy Childbirth 2020, 20, 39. [Google Scholar] [CrossRef] [PubMed]
- Sserwanja, Q.; Mukunya, D.; Musaba, M.W.; Kawuki, J.; Kitutu, F.E. Factors Associated with Health Facility Utilization during Childbirth among 15 to 49-Year-Old Women in Uganda: Evidence from the Uganda Demographic Health Survey 2016. BMC Health Serv Res 2021, 21, 1160. [Google Scholar] [CrossRef] [PubMed]
- Tesema, G.A.; Tessema, Z.T. Pooled Prevalence and Associated Factors of Health Facility Delivery in East Africa: Mixed-Effect Logistic Regression Analysis. PLOS ONE 2021, 16, e0250447. [Google Scholar] [CrossRef] [PubMed]
- Doctor, H.V.; Nkhana-Salimu, S.; Abdulsalam-Anibilowo, M. Health Facility Delivery in Sub-Saharan Africa: Successes, Challenges, and Implications for the 2030 Development Agenda. BMC Public Health 2018, 18, 765. [Google Scholar] [CrossRef] [PubMed]
- A: of Finance, Planning and Economic Development Millennium Development Goals Report for Uganda 2010; Special Theme, 2010.
- Munabi-Babigumira, S.; Nabudere, H.; Asiimwe, D.; Fretheim, A.; Sandberg, K. Implementing the Skilled Birth Attendance Strategy in Uganda: A Policy Analysis. BMC Health Serv Res 2019, 19, 655. [Google Scholar] [CrossRef] [PubMed]
- UBOS; ICF International Uganda Demographic and Health Survey 2016; The DHS Program ICF Rockville, Maryland, USA: Kampala, Uganda, 2018.
- Kawakatsu, Y.; Sugishita, T.; Oruenjo, K.; Wakhule, S.; Kibosia, K.; Were, E.; Honda, S. Determinants of Health Facility Utilization for Childbirth in Rural Western Kenya: Cross-Sectional Study. BMC Pregnancy Childbirth 2014, 14, 265. [Google Scholar] [CrossRef] [PubMed]
- Moshi, F.V.; Mbotwa, C.H. Determinants for Choice of Home Birth over Health Facility Birth among Women of Reproductive Age in Tanzania: An Analysis of Data from the 2015-16 Tanzania Demographic and Health Survey and Malaria Indicator Survey. BMC Pregnancy Childbirth 2020, 20, 561. [Google Scholar] [CrossRef] [PubMed]
- Fekadu, G.A.; Kassa, G.M.; Berhe, A.K.; Muche, A.A.; Katiso, N.A. The Effect of Antenatal Care on Use of Institutional Delivery Service and Postnatal Care in Ethiopia: A Systematic Review and Meta-Analysis. BMC Health Serv Res 2018, 18, 577. [Google Scholar] [CrossRef] [PubMed]
- Mwebesa, E.; Kagaayi, J.; Ssebagereka, A.; Nakafeero, M.; Ssenkusu, J.M.; Guwatudde, D.; Tumwesigye, N.M. Effect of Four or More Antenatal Care Visits on Facility Delivery and Early Postnatal Care Services Utilization in Uganda: A Propensity Score Matched Analysis. BMC Pregnancy Childbirth 2022, 22, 7. [Google Scholar] [CrossRef] [PubMed]
- Gabrysch, S.; Campbell, O.M. Still Too Far to Walk: Literature Review of the Determinants of Delivery Service Use. BMC Pregnancy Childbirth 2009, 9, 34. [Google Scholar] [CrossRef] [PubMed]
- Bain, L.E.; Aboagye, R.G.; Dowou, R.K.; Kongnyuy, E.J.; Memiah, P.; Amu, H. Prevalence and Determinants of Maternal Healthcare Utilisation among Young Women in Sub-Saharan Africa: Cross-Sectional Analyses of Demographic and Health Survey Data. BMC Public Health 2022, 22, 647. [Google Scholar] [CrossRef] [PubMed]
- Nesbitt, R.C.; Lohela, T.J.; Soremekun, S.; Vesel, L.; Manu, A.; Okyere, E.; Grundy, C.; Amenga-Etego, S.; Owusu-Agyei, S.; Kirkwood, B.R.; et al. The Influence of Distance and Quality of Care on Place of Delivery in Rural Ghana. Sci Rep 2016, 6, 30291. [Google Scholar] [CrossRef] [PubMed]
- Reynolds, H.W.; Luseno, W.K.; Speizer, I.S. The Measurement of Condom Use in Four Countries in East and Southern Africa. AIDS Behav 2012, 16, 1044–1053. [Google Scholar] [CrossRef] [PubMed]
- Atusiimire, L.B.; Waiswa, P.; Atuyambe, L.; Nankabirwa, V.; Okuga, M. Determinants of Facility Based–Deliveries among Urban Slum Dwellers of Kampala, Uganda. PLOS ONE 2019, 14, e0214995. [Google Scholar] [CrossRef] [PubMed]
- Ayele, G.S.; Melku, A.T.; Belda, S.S. Utilization of Skilled Birth Attendant at Birth and Associated Factors among Women Who Gave Birth in the Last 24 Months Preceding the Survey in Gura Dhamole Woreda, Bale Zone, Southeast Ethiopia. BMC Public Health 2019, 19, 1501. [Google Scholar] [CrossRef] [PubMed]
- Budu, E.; Chattu, V.K.; Ahinkorah, B.O.; Seidu, A.-A.; Mohammed, A.; Tetteh, J.K.; Arthur-Holmes, F.; Adu, C.; Yaya, S. Early Age at First Childbirth and Skilled Birth Attendance during Delivery among Young Women in Sub-Saharan Africa. BMC Pregnancy Childbirth 2021, 21, 834. [Google Scholar] [CrossRef] [PubMed]
- Solanke, B.L.; Rahman, S.A. Multilevel Analysis of Factors Associated with Assistance during Delivery in Rural Nigeria: Implications for Reducing Rural-Urban Inequity in Skilled Care at Delivery. BMC Pregnancy Childbirth 2018, 18, 438. [Google Scholar] [CrossRef] [PubMed]
- Bessmertny, I.A.; Enkomaryam, B.C.; Mamuye, A.L. Determining the Critical Factors of Antenatal Care Follow-Up Using Two-Phase Machine Learning. In Proceedings of the 2024 XXVII International Conference on Soft Computing and Measurements (SCM); May 2024; pp. 316–319. [Google Scholar]
- Fredriksson, A.; Fulcher, I.R.; Russell, A.L.; Li, T.; Tsai, Y.-T.; Seif, S.S.; Mpembeni, R.N.; Hedt-Gauthier, B. Machine Learning for Maternal Health: Predicting Delivery Location in a Community Health Worker Program in Zanzibar. Front. Digit. Health 2022, 4. [Google Scholar] [CrossRef] [PubMed]
- Tesfaye, B.; Atique, S.; Azim, T.; Kebede, M.M. Predicting Skilled Delivery Service Use in Ethiopia: Dual Application of Logistic Regression and Machine Learning Algorithms. BMC Med Inform Decis Mak 2019, 19, 209. [Google Scholar] [CrossRef] [PubMed]
- Yehuala, T.Z.; Agimas, M.C.; Derseh, N.M.; Wubante, S.M.; Fente, B.M.; Yismaw, G.A.; Tesfie, T.K. Machine Learning Algorithms to Predict Healthcare-Seeking Behaviors of Mothers for Acute Respiratory Infections and Their Determinants among Children under Five in Sub-Saharan Africa. Front. Public Health 2024, 12. [Google Scholar] [CrossRef] [PubMed]
- Ngusie, H.S.; Tesfa, G.A.; Taddese, A.A.; Enyew, E.B.; Alene, T.D.; Abebe, G.K.; Walle, A.D.; Zemariam, A.B. Predicting Place of Delivery Choice among Childbearing Women in East Africa: A Comparative Analysis of Advanced Machine Learning Techniques. Front. Public Health 2024, 12. [Google Scholar] [CrossRef] [PubMed]
- Andersen, R. Revisiting the Behavioral Model and Access to Medical Care: Does It Matter? Journal of Health and Social Behavior 1995, 36, 1–10. [Google Scholar] [CrossRef] [PubMed]
- Batista, G.E.A.P.A.; Monard, M.C. An Analysis of Four Missing Data Treatment Methods for Supervised Learning. Applied Artificial Intelligence 2003, 17, 519–533. [Google Scholar] [CrossRef]
- Memon, S.M.; Wamala, R.; Kabano, I.H. A Comparison of Imputation Methods for Categorical Data. Informatics in Medicine Unlocked 2023, 42, 101382. [Google Scholar] [CrossRef]
- Kuhn, M.; Johnson, K. Applied Predictive Modeling; Springer New York: New York, NY, 2013; ISBN 978-1-4614-6848-6. [Google Scholar]
- Araf, I.; Idri, A.; Chairi, I. Cost-Sensitive Learning for Imbalanced Medical Data: A Review. Artif Intell Rev 2024, 57, 80. [Google Scholar] [CrossRef]
- Zou, H.; Hastie, T. Regularization and Variable Selection Via the Elastic Net. Journal of the Royal Statistical Society Series B: Statistical Methodology 2005, 67, 301–320. [Google Scholar] [CrossRef]
- Quinlan, J.R. C4. P: 5, 2014. [Google Scholar]
- Breiman, L. Random Forests. Machine Learning 2001, 45, 5–32. [Google Scholar] [CrossRef]
- Friedman, J.H. Greedy Function Approximation: A Gradient Boosting Machine. Annals of statistics 2001, 1189–1232. [Google Scholar] [CrossRef]
- Chen, T.; Guestrin, C. Xgboost: A Scalable Tree Boosting System. In Proceedings of the Proceedings of the 22nd acm sigkdd international conference on knowledge discovery and data mining.
- Ke, G.; Meng, Q.; Finley, T.; Wang, T.; Chen, W.; Ma, W.; Ye, Q.; Liu, T.-Y. Lightgbm: A Highly Efficient Gradient Boosting Decision Tree. Advances in neural information processing systems 2017, 30. [Google Scholar]
- Prokhorenkova, L.; Gusev, G.; Vorobev, A.; Dorogush, A.V.; Gulin, A. CatBoost: Unbiased Boosting with Categorical Features. Advances in neural information processing systems 2018, 31. [Google Scholar]
- Snoek, J.; Larochelle, H.; Adams, R.P. Practical Bayesian Optimization of Machine Learning Algorithms. Advances in neural information processing systems 2012, 25. [Google Scholar]
- Lundberg, S.M.; Lee, S.-I. A Unified Approach to Interpreting Model Predictions. Advances in neural information processing systems 2017, 30. [Google Scholar]
- He, H.; Garcia, E.A. Learning from Imbalanced Data. IEEE Transactions on knowledge and data engineering 2009, 21, 1263–1284. [Google Scholar]
- Johnson, J.M.; Khoshgoftaar, T.M. Survey on Deep Learning with Class Imbalance. J Big Data 2019, 6, 27. [Google Scholar] [CrossRef]
- WHO Intrapartum Care for a Positive Childbirth Experience; WHO recommendations; Geneva, Switzerland, 2018.
- Chawla, N.V.; Bowyer, K.W.; Hall, L.O.; Kegelmeyer, W.P. SMOTE: Synthetic Minority over-Sampling Technique. Journal of artificial intelligence research 2002, 16, 321–357. [Google Scholar] [CrossRef]
- Babalola, S.; Fatusi, A. Determinants of Use of Maternal Health Services in Nigeria - Looking beyond Individual and Household Factors. BMC Pregnancy Childbirth 2009, 9, 43. [Google Scholar] [CrossRef] [PubMed]
- Rutaremwa, G.; Wandera, S.O.; Jhamba, T.; Akiror, E.; Kiconco, A. Determinants of Maternal Health Services Utilization in Uganda. BMC Health Serv Res 2015, 15, 271. [Google Scholar] [CrossRef] [PubMed]
Figure 1.
Machine Learning Workflow.
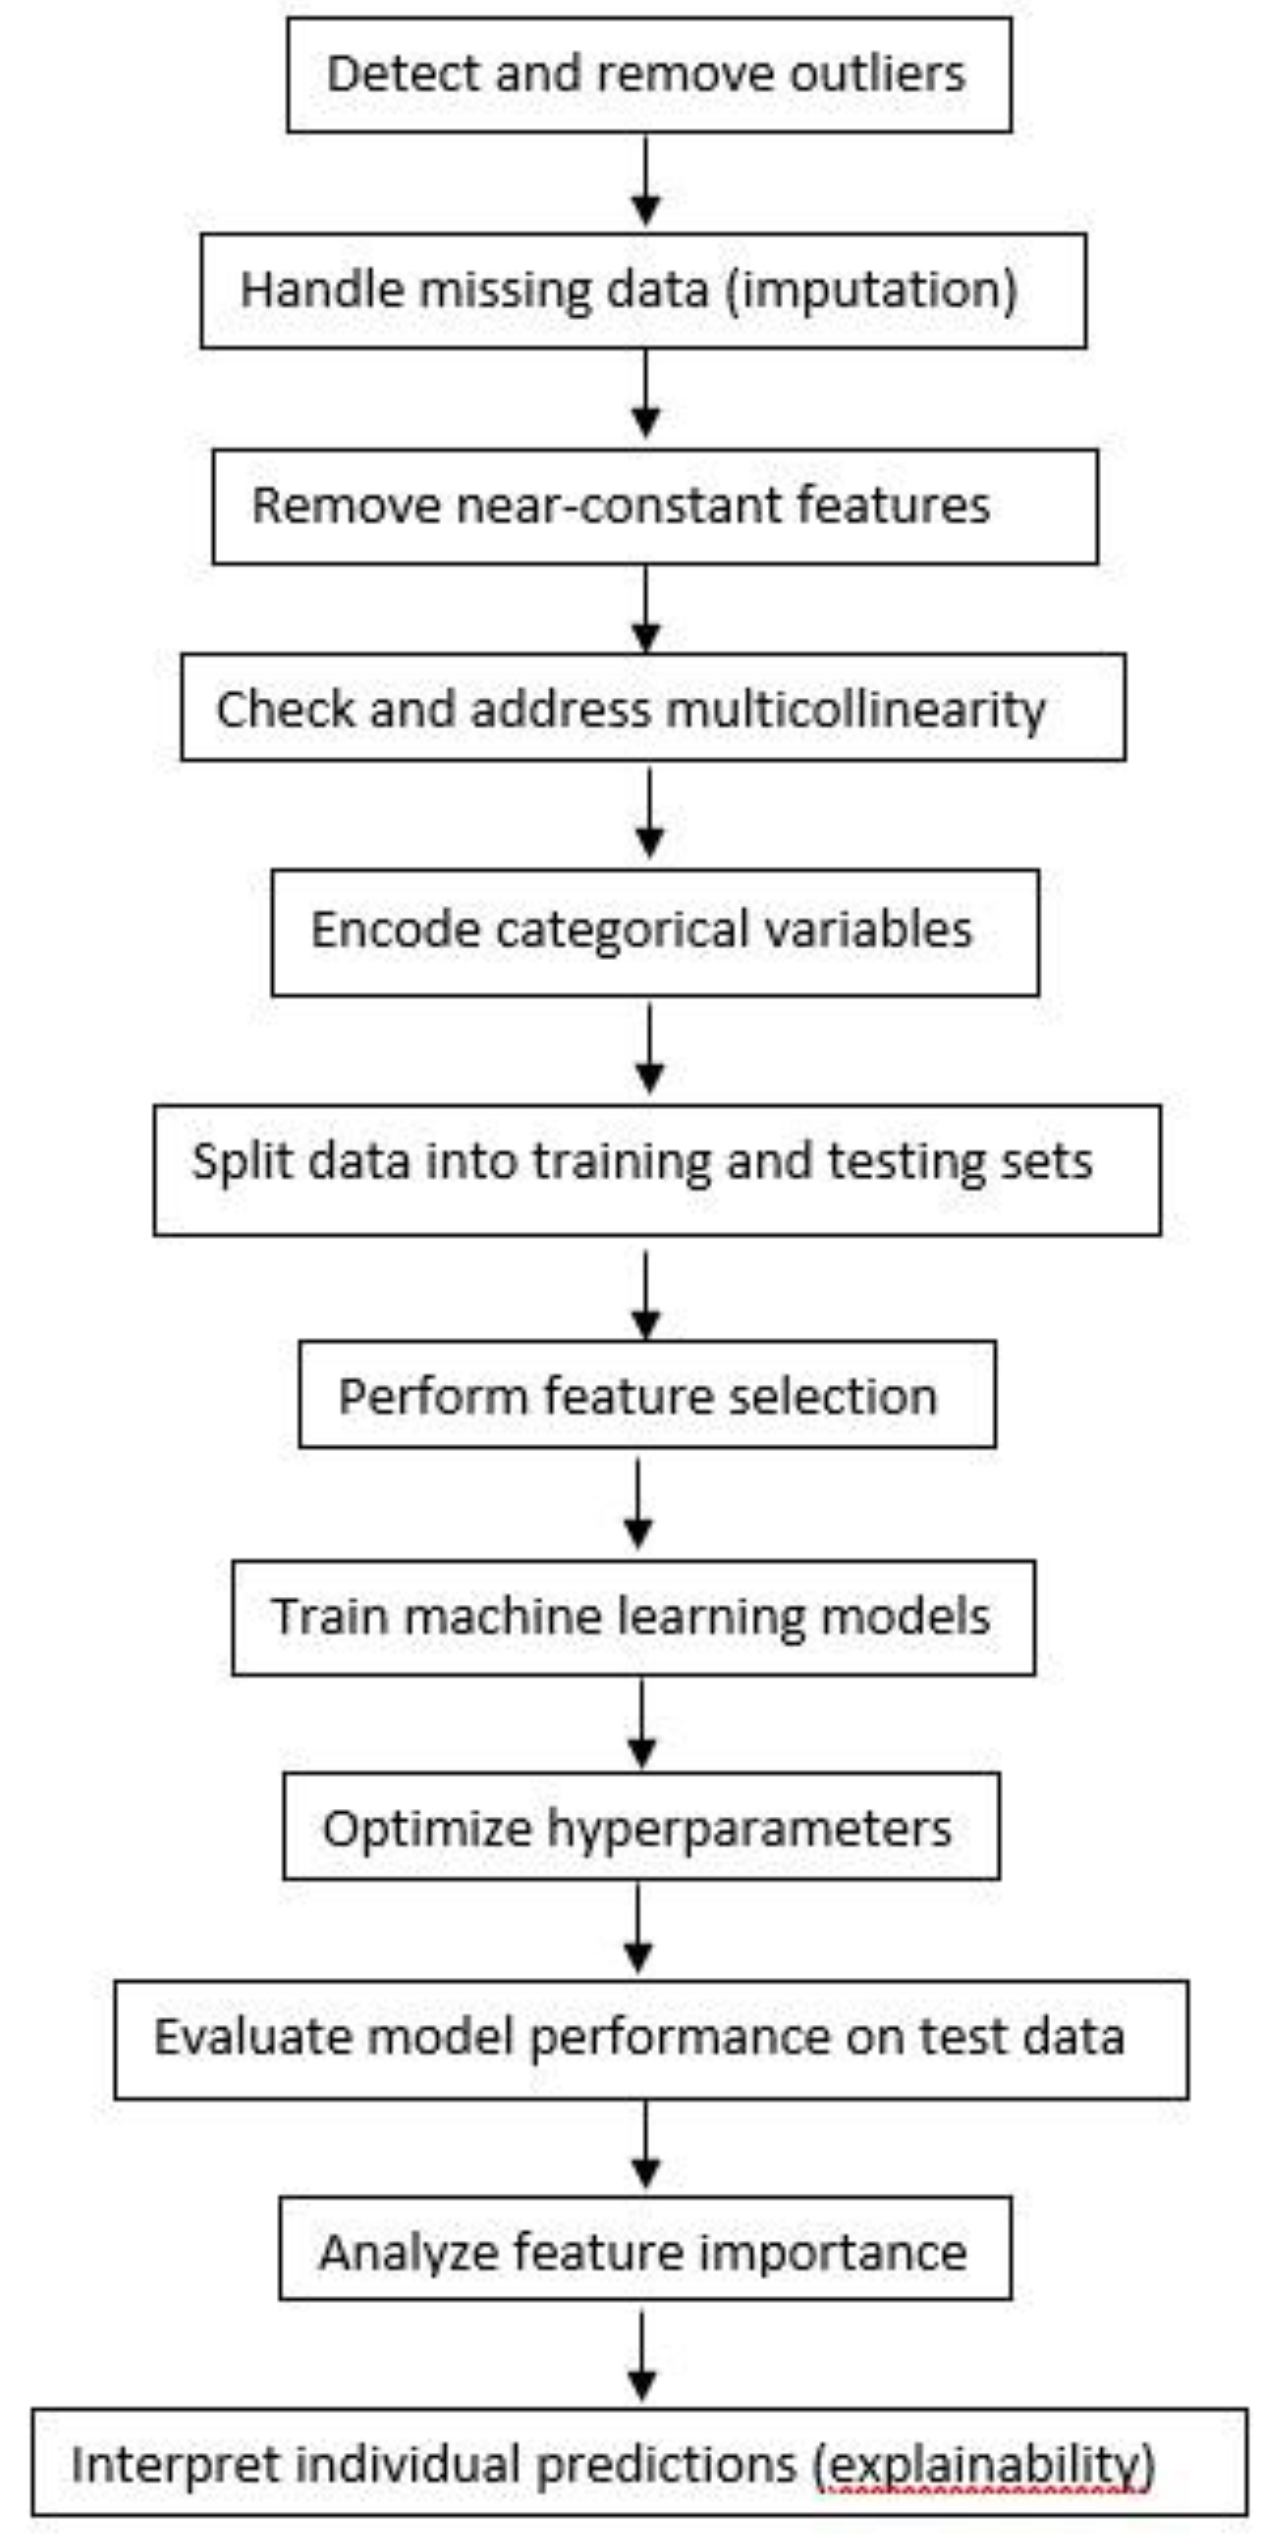
Figure 2.
Feature Correlation Heatmap (Cramér's V)Finally, two types of encodings were applied depending on the nature of the categorical features; One-hot encoding was used on Nominal Variables, creating a separate binary indicator column for each unique category. Label encoding was used on Ordinal Variables to map each category to an integer in a way that maintains the ordering. This step transforms categorical data into numeric form, which is compatible with most machine learning algorithms.
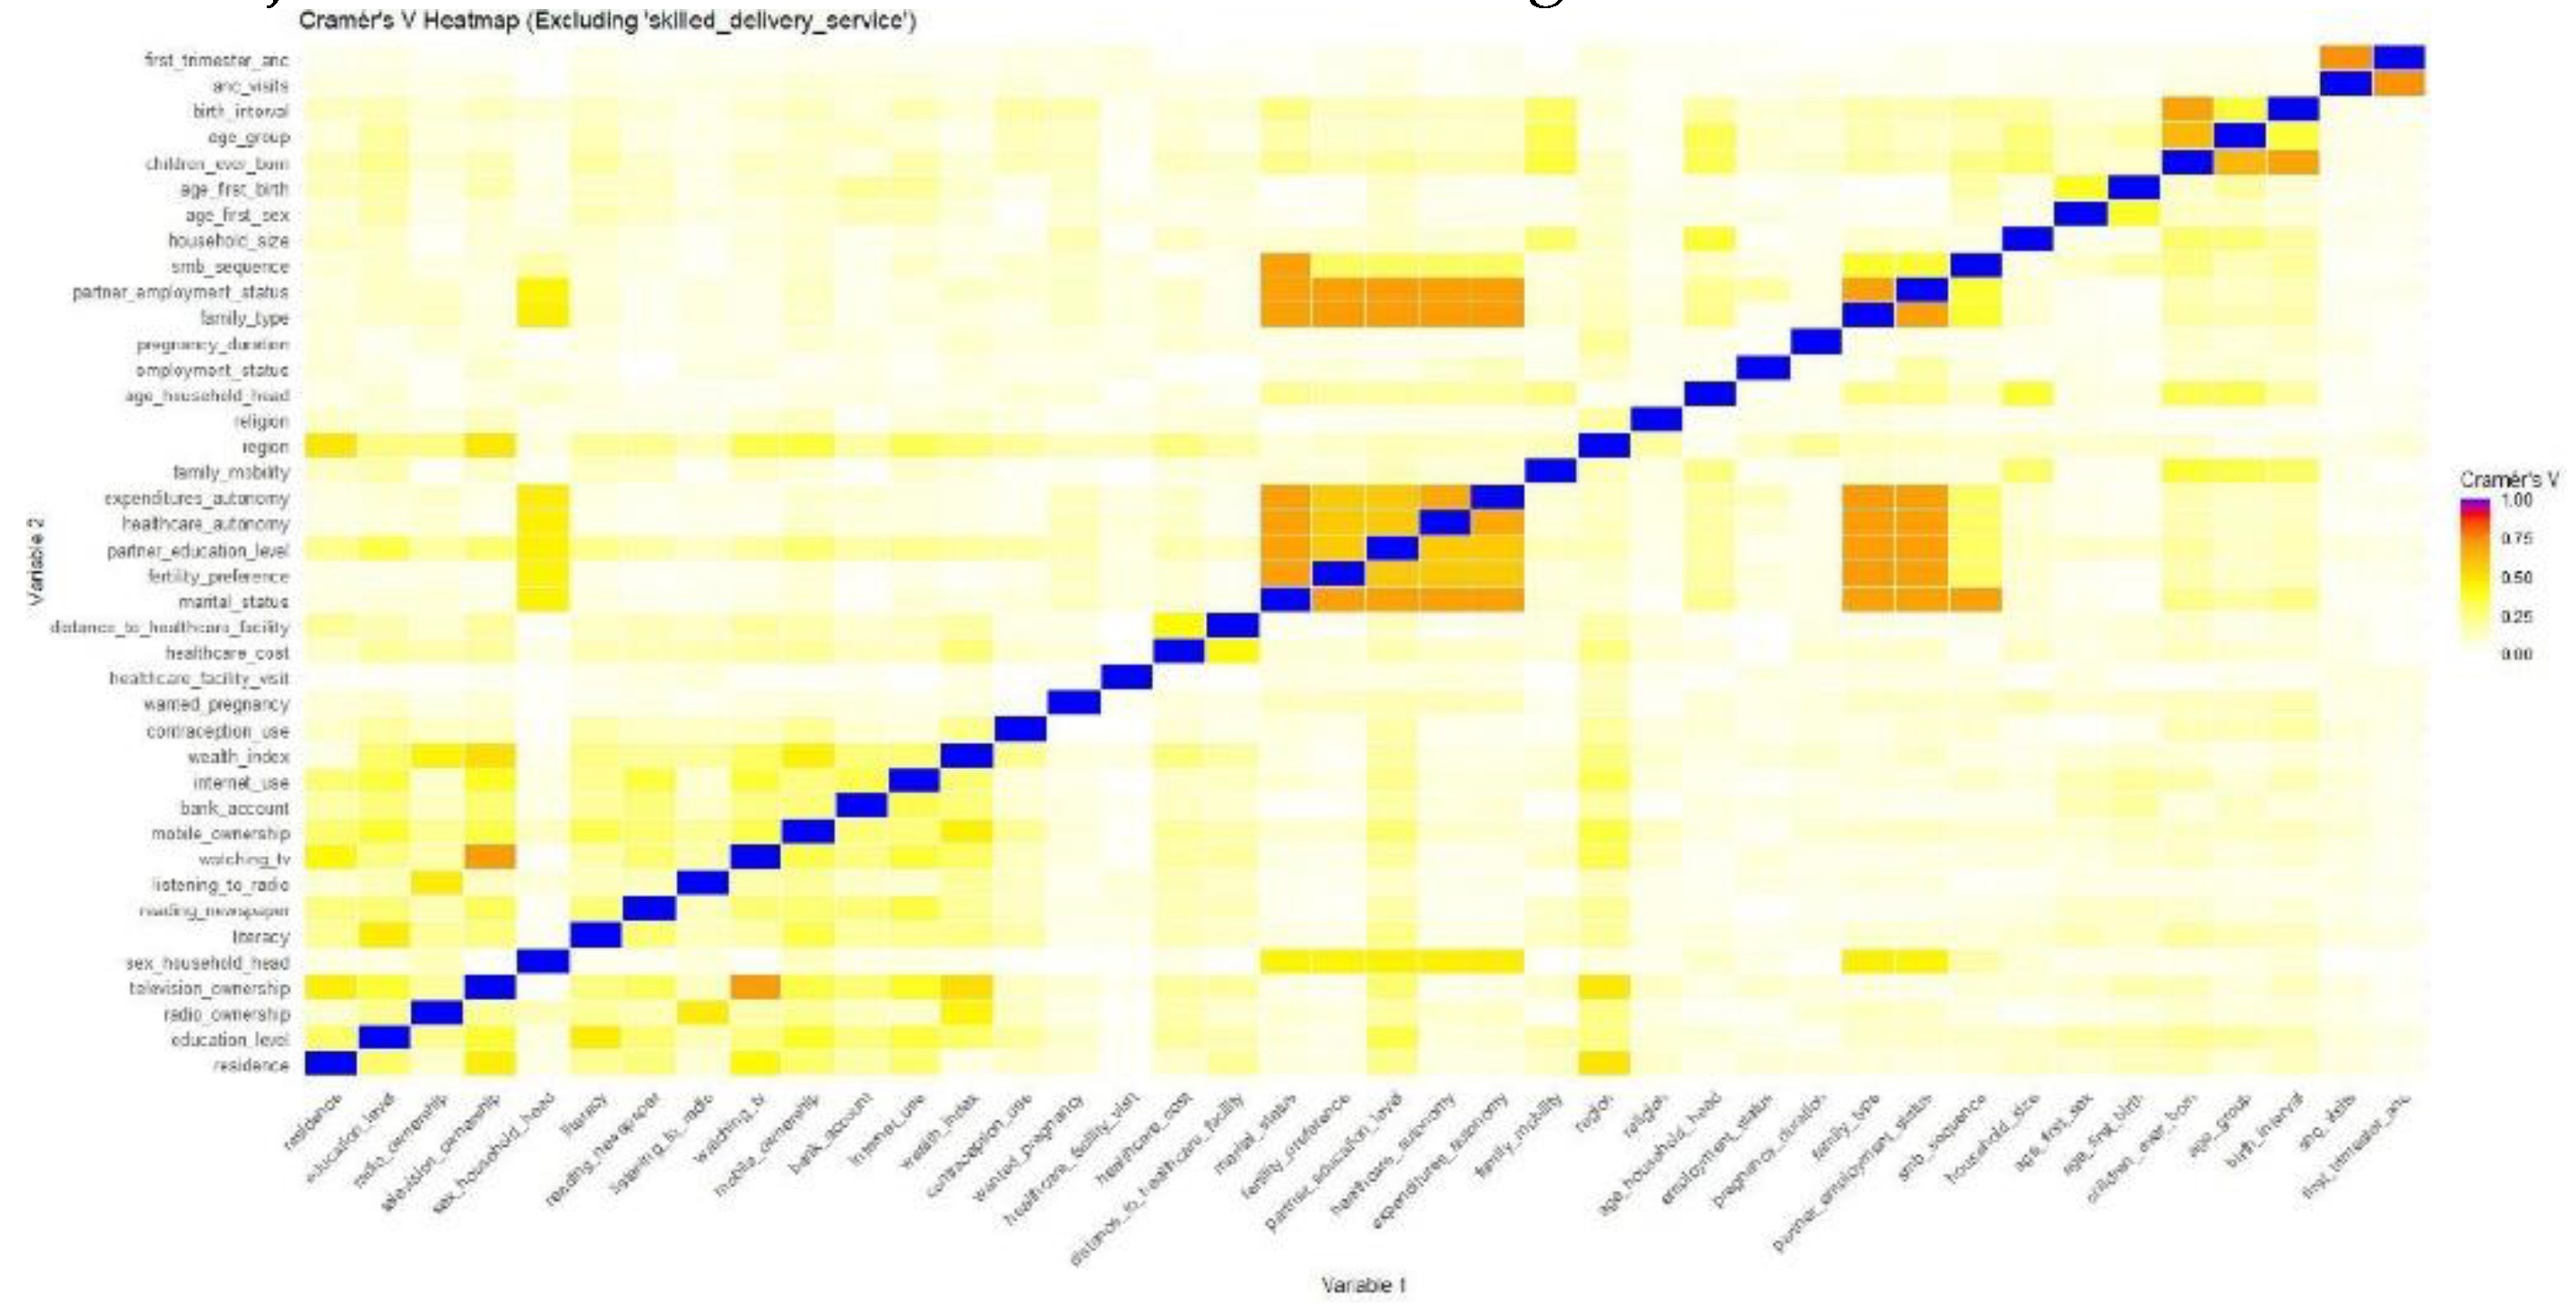
Figure 3.
Class distribution and weight assignment.
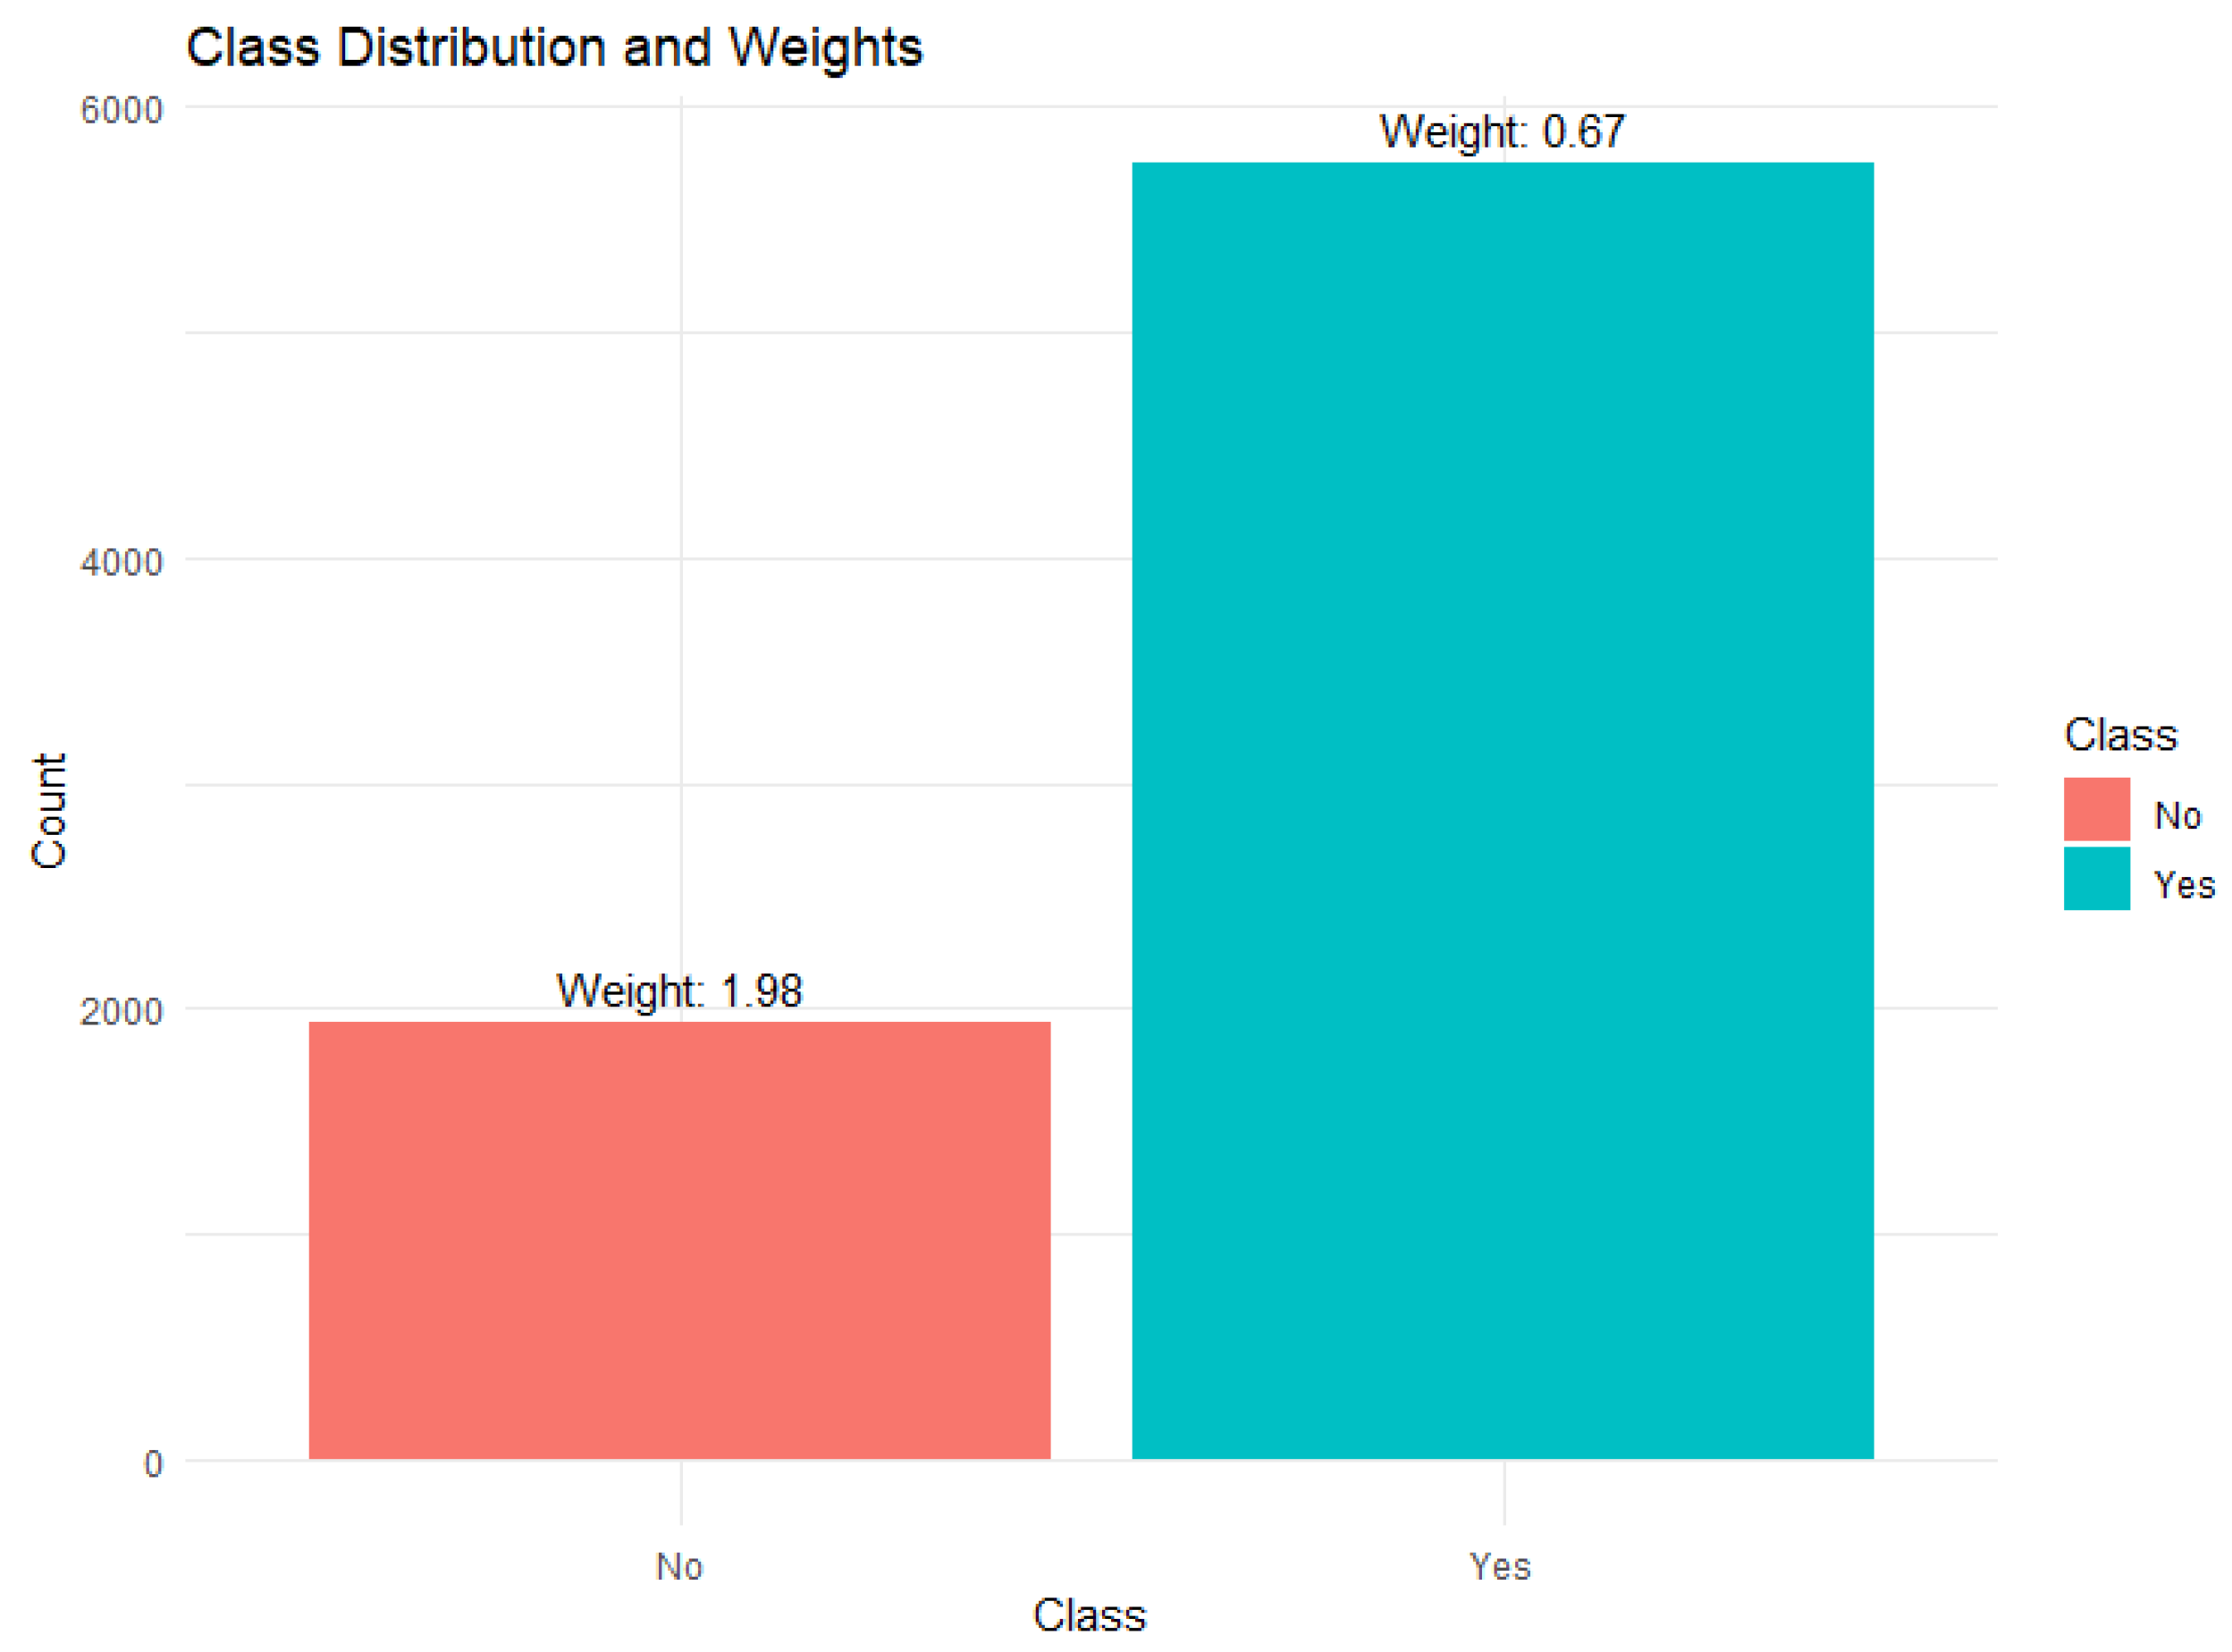
Figure 4.
Features Selected by Elastic Net.
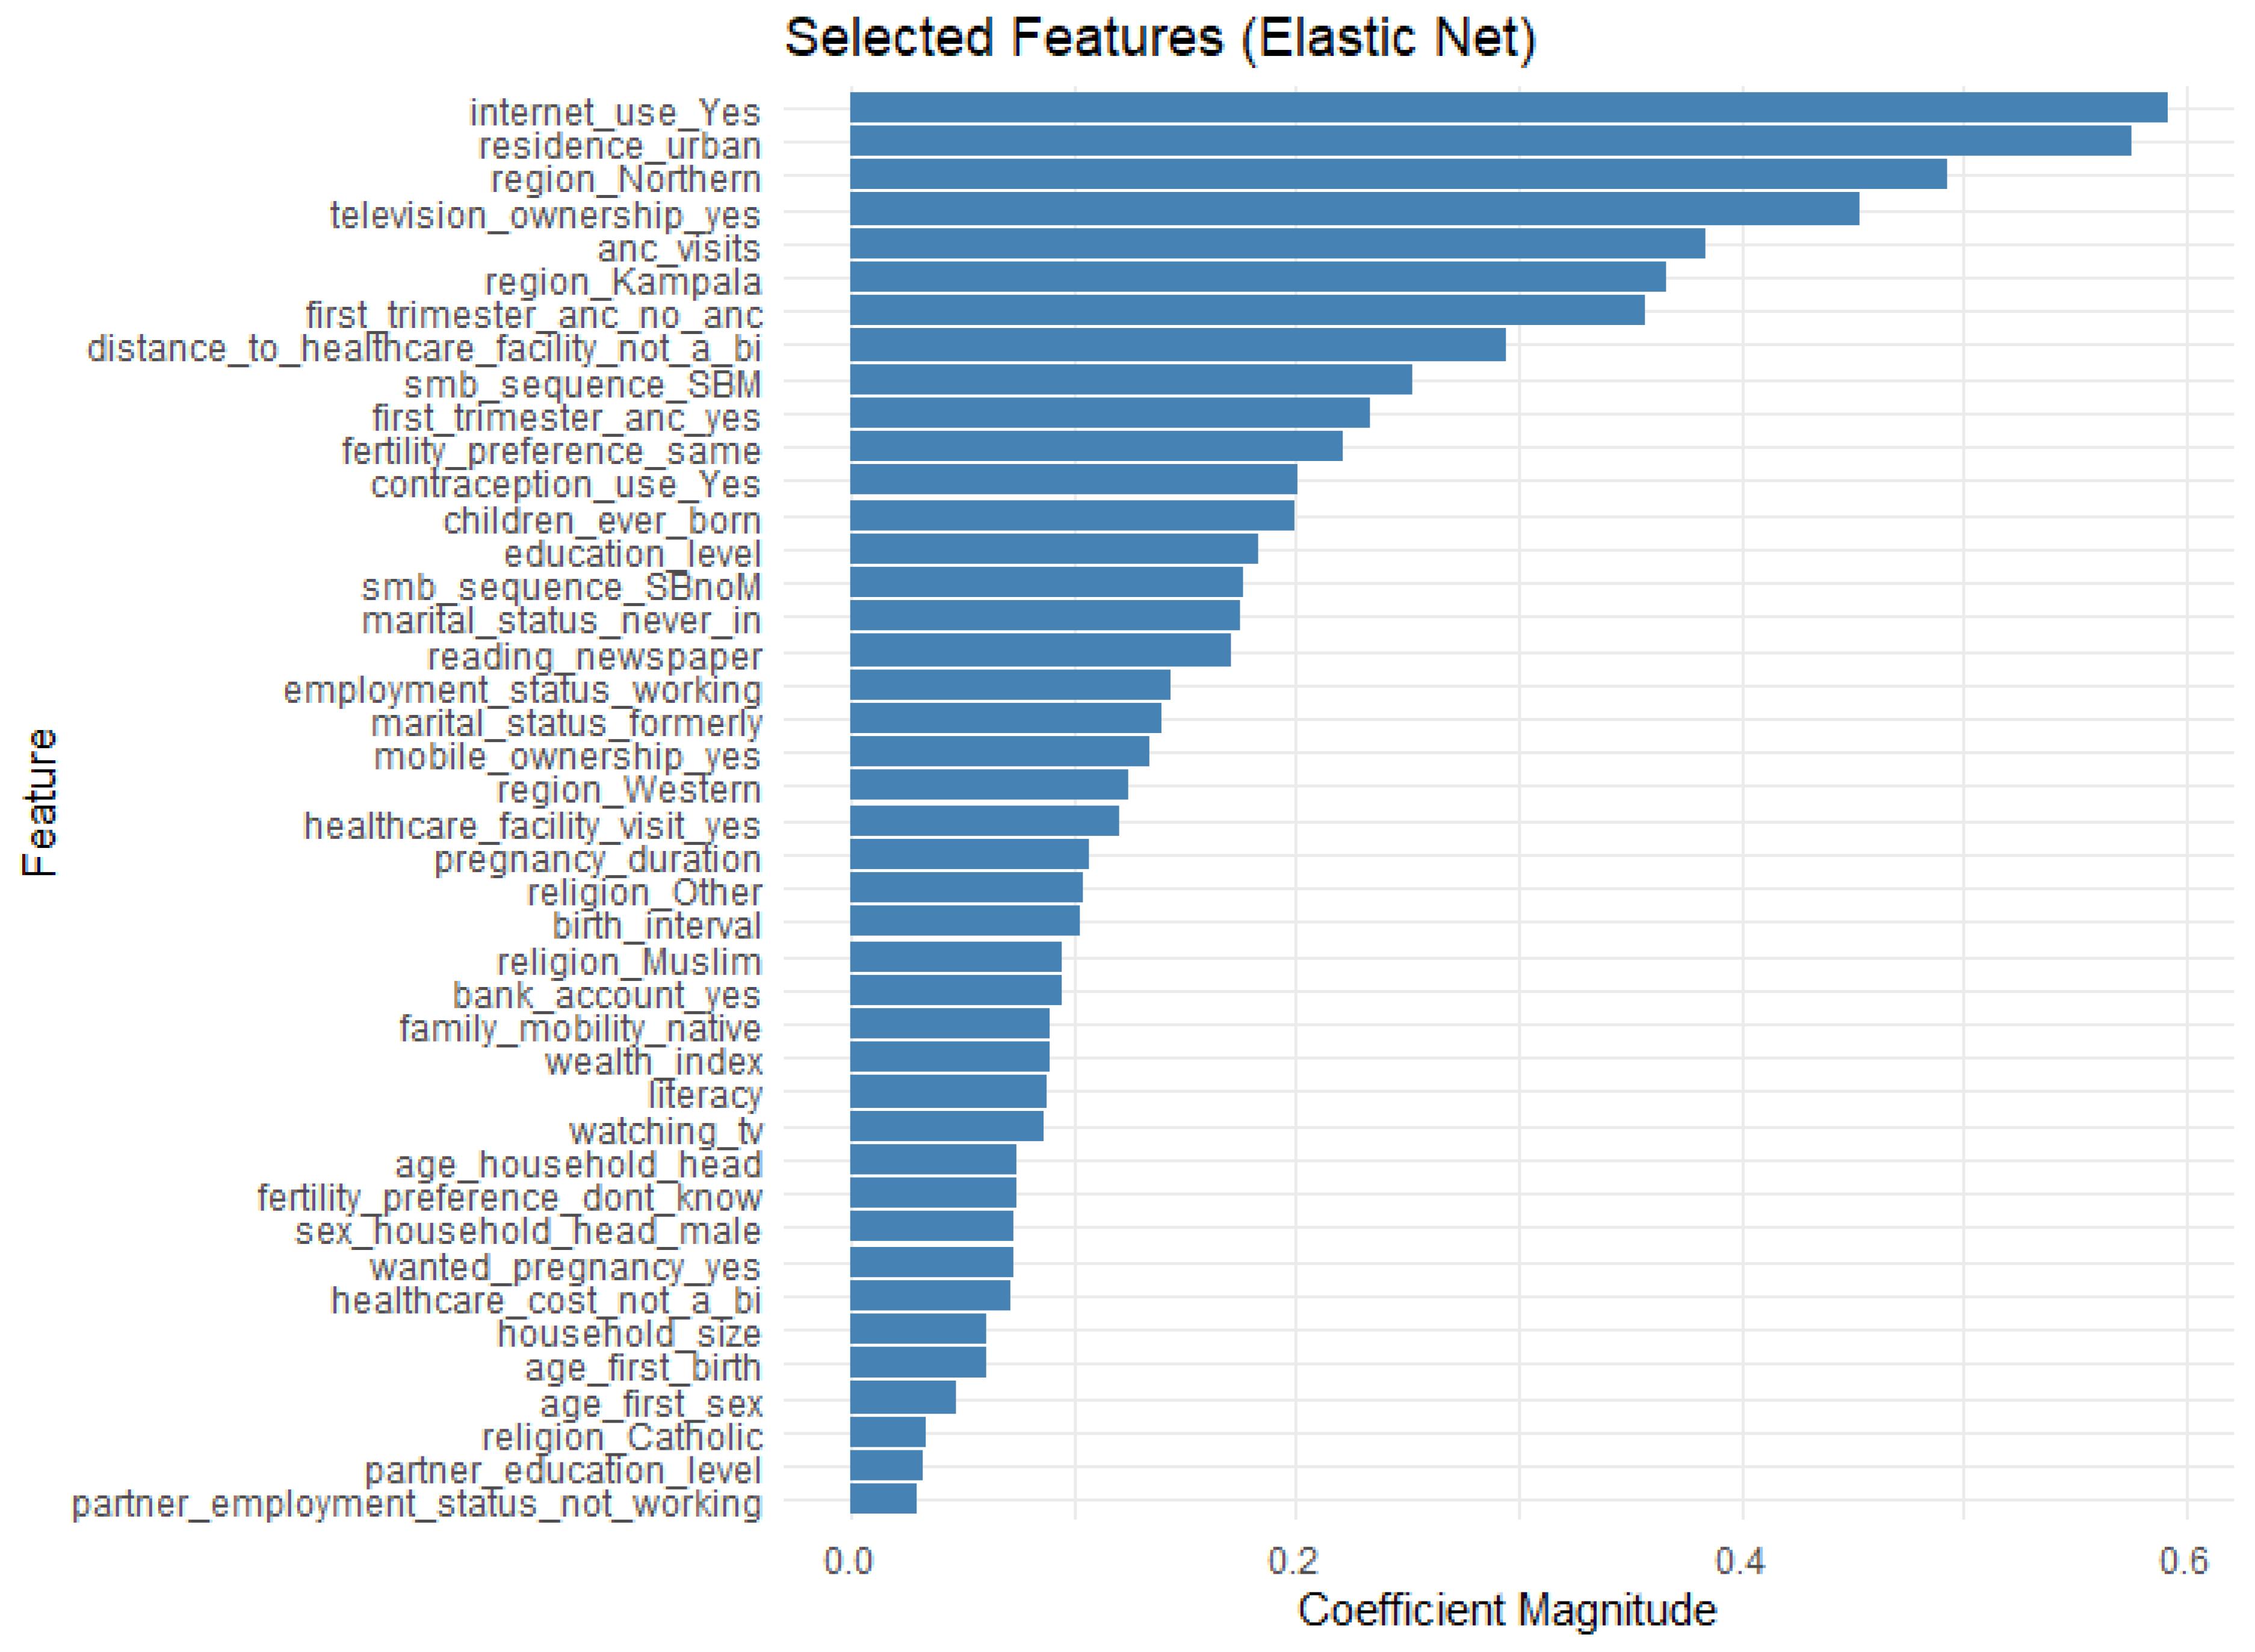
Figure 5.
ROC Curve Comparison for Models.
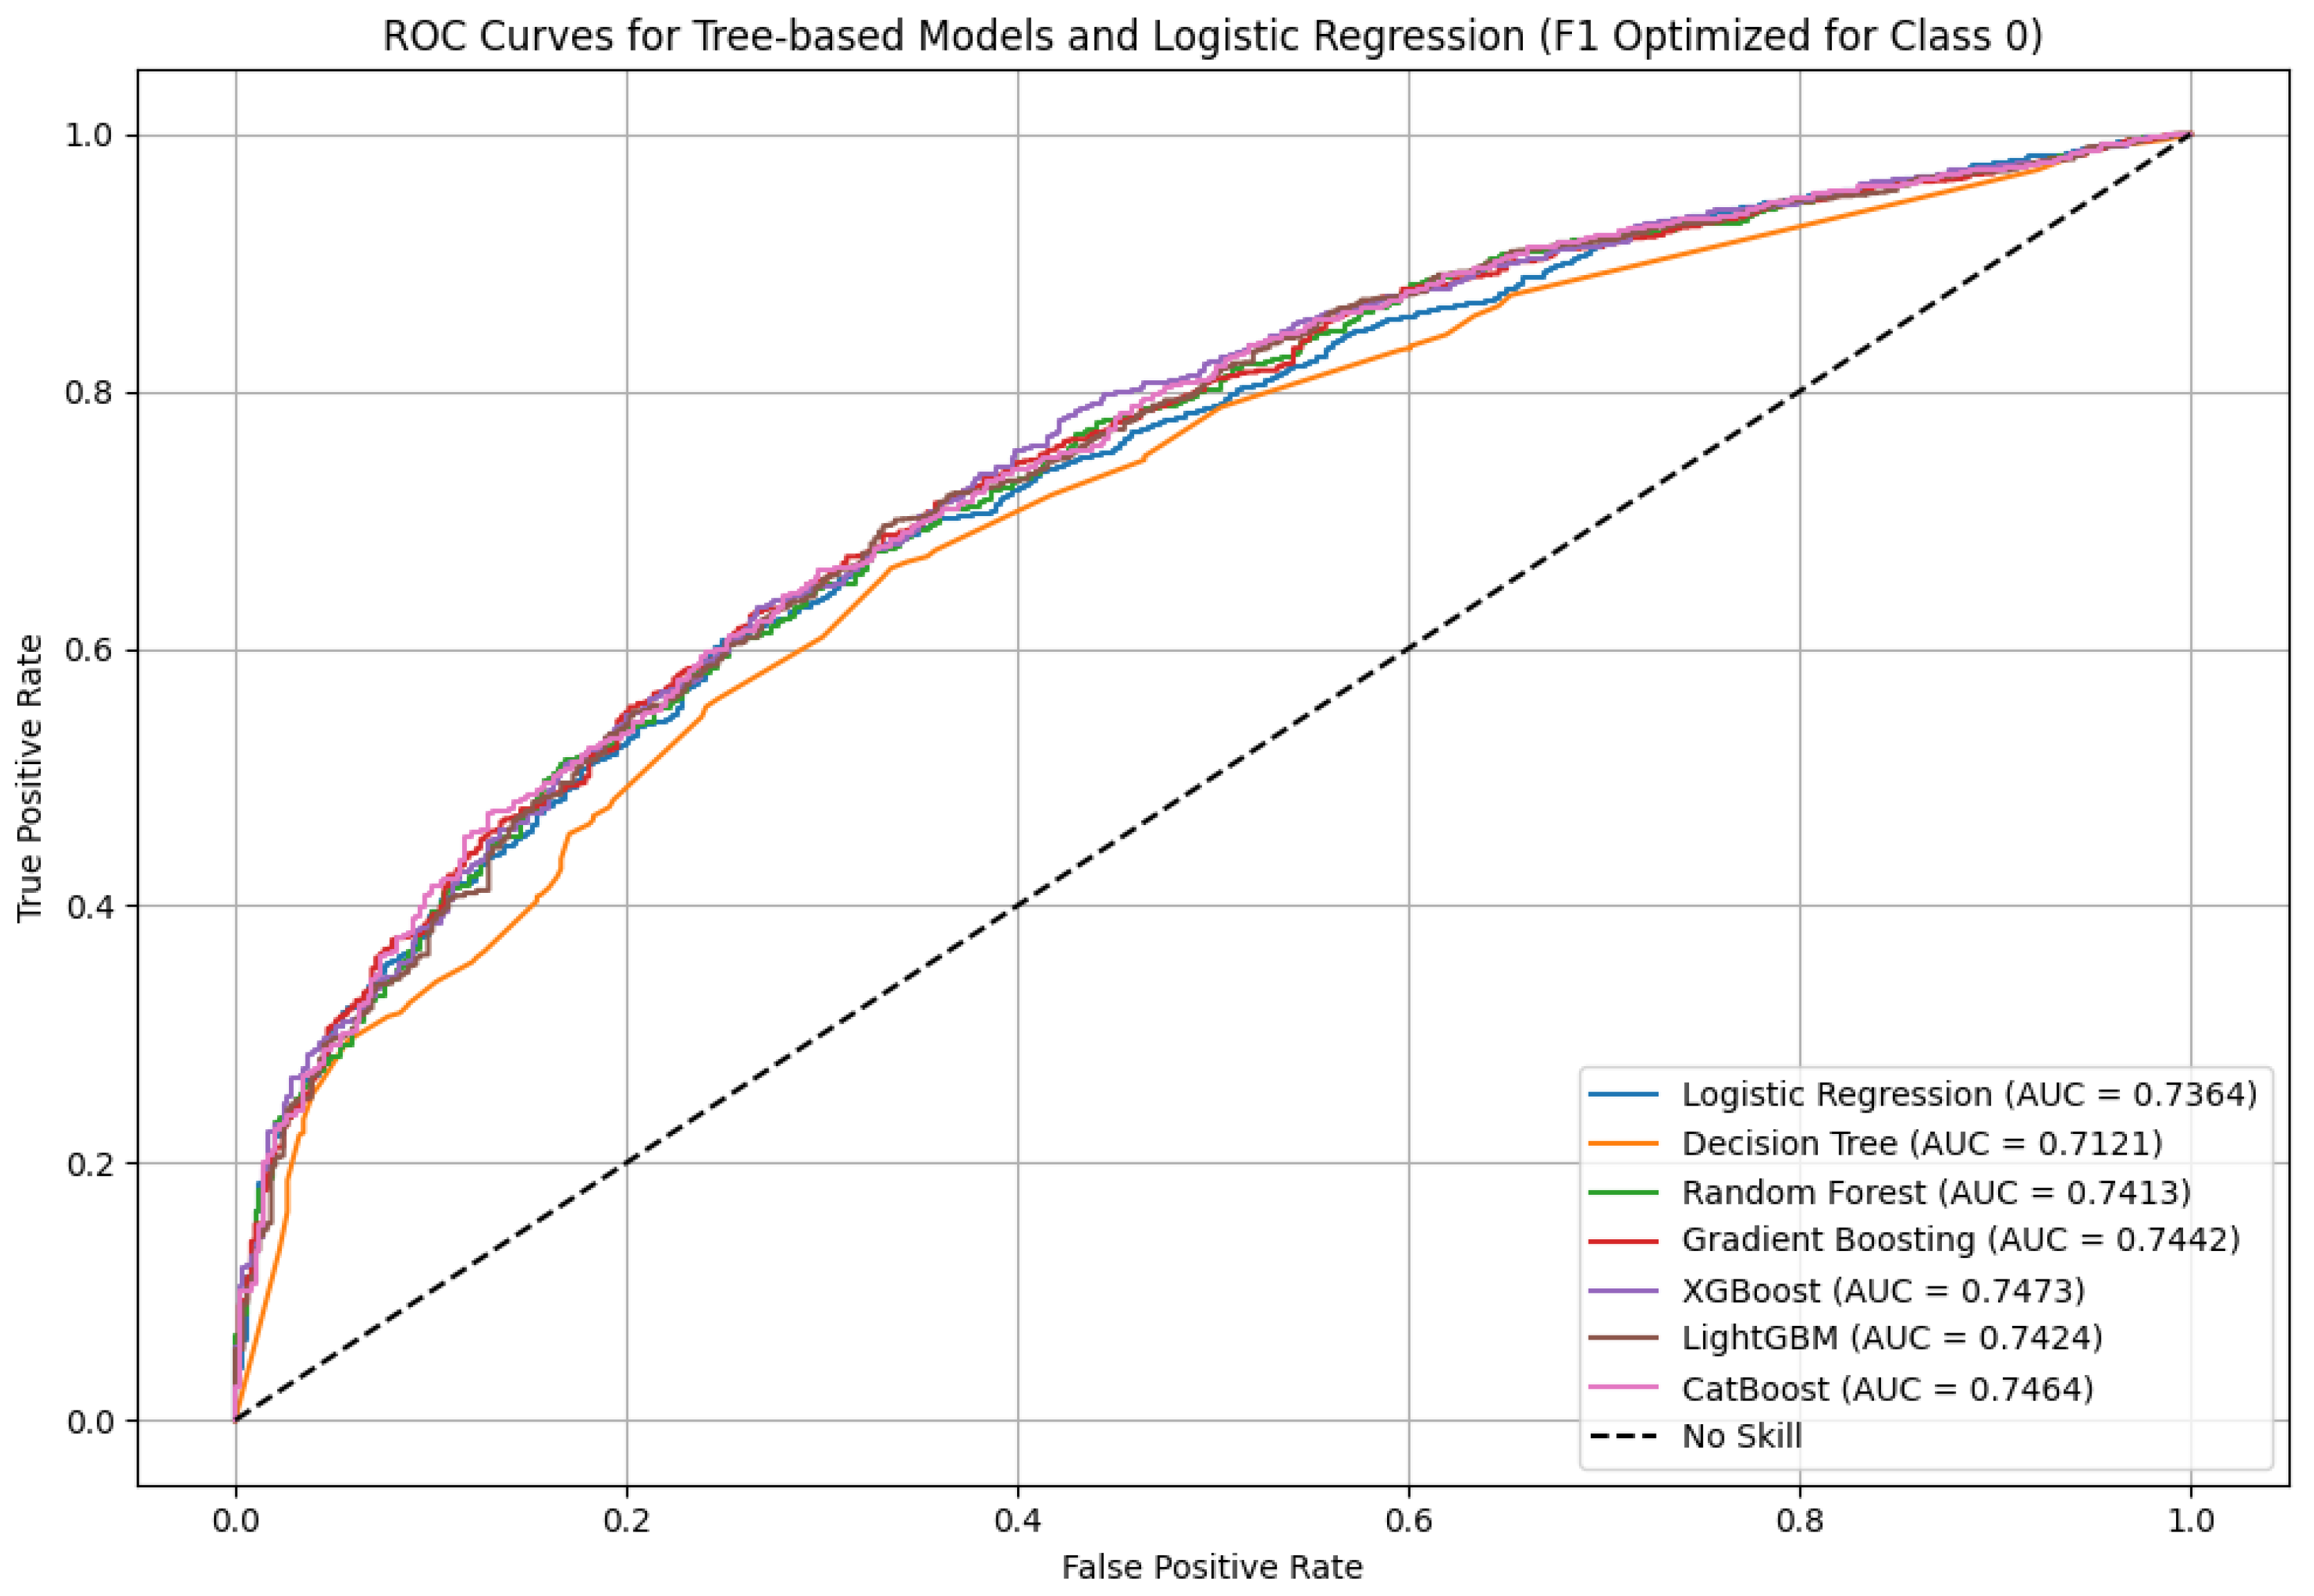
Figure 6.
Key Predictors of Skilled Birth Attendance: SHAP-Based Feature Importance.
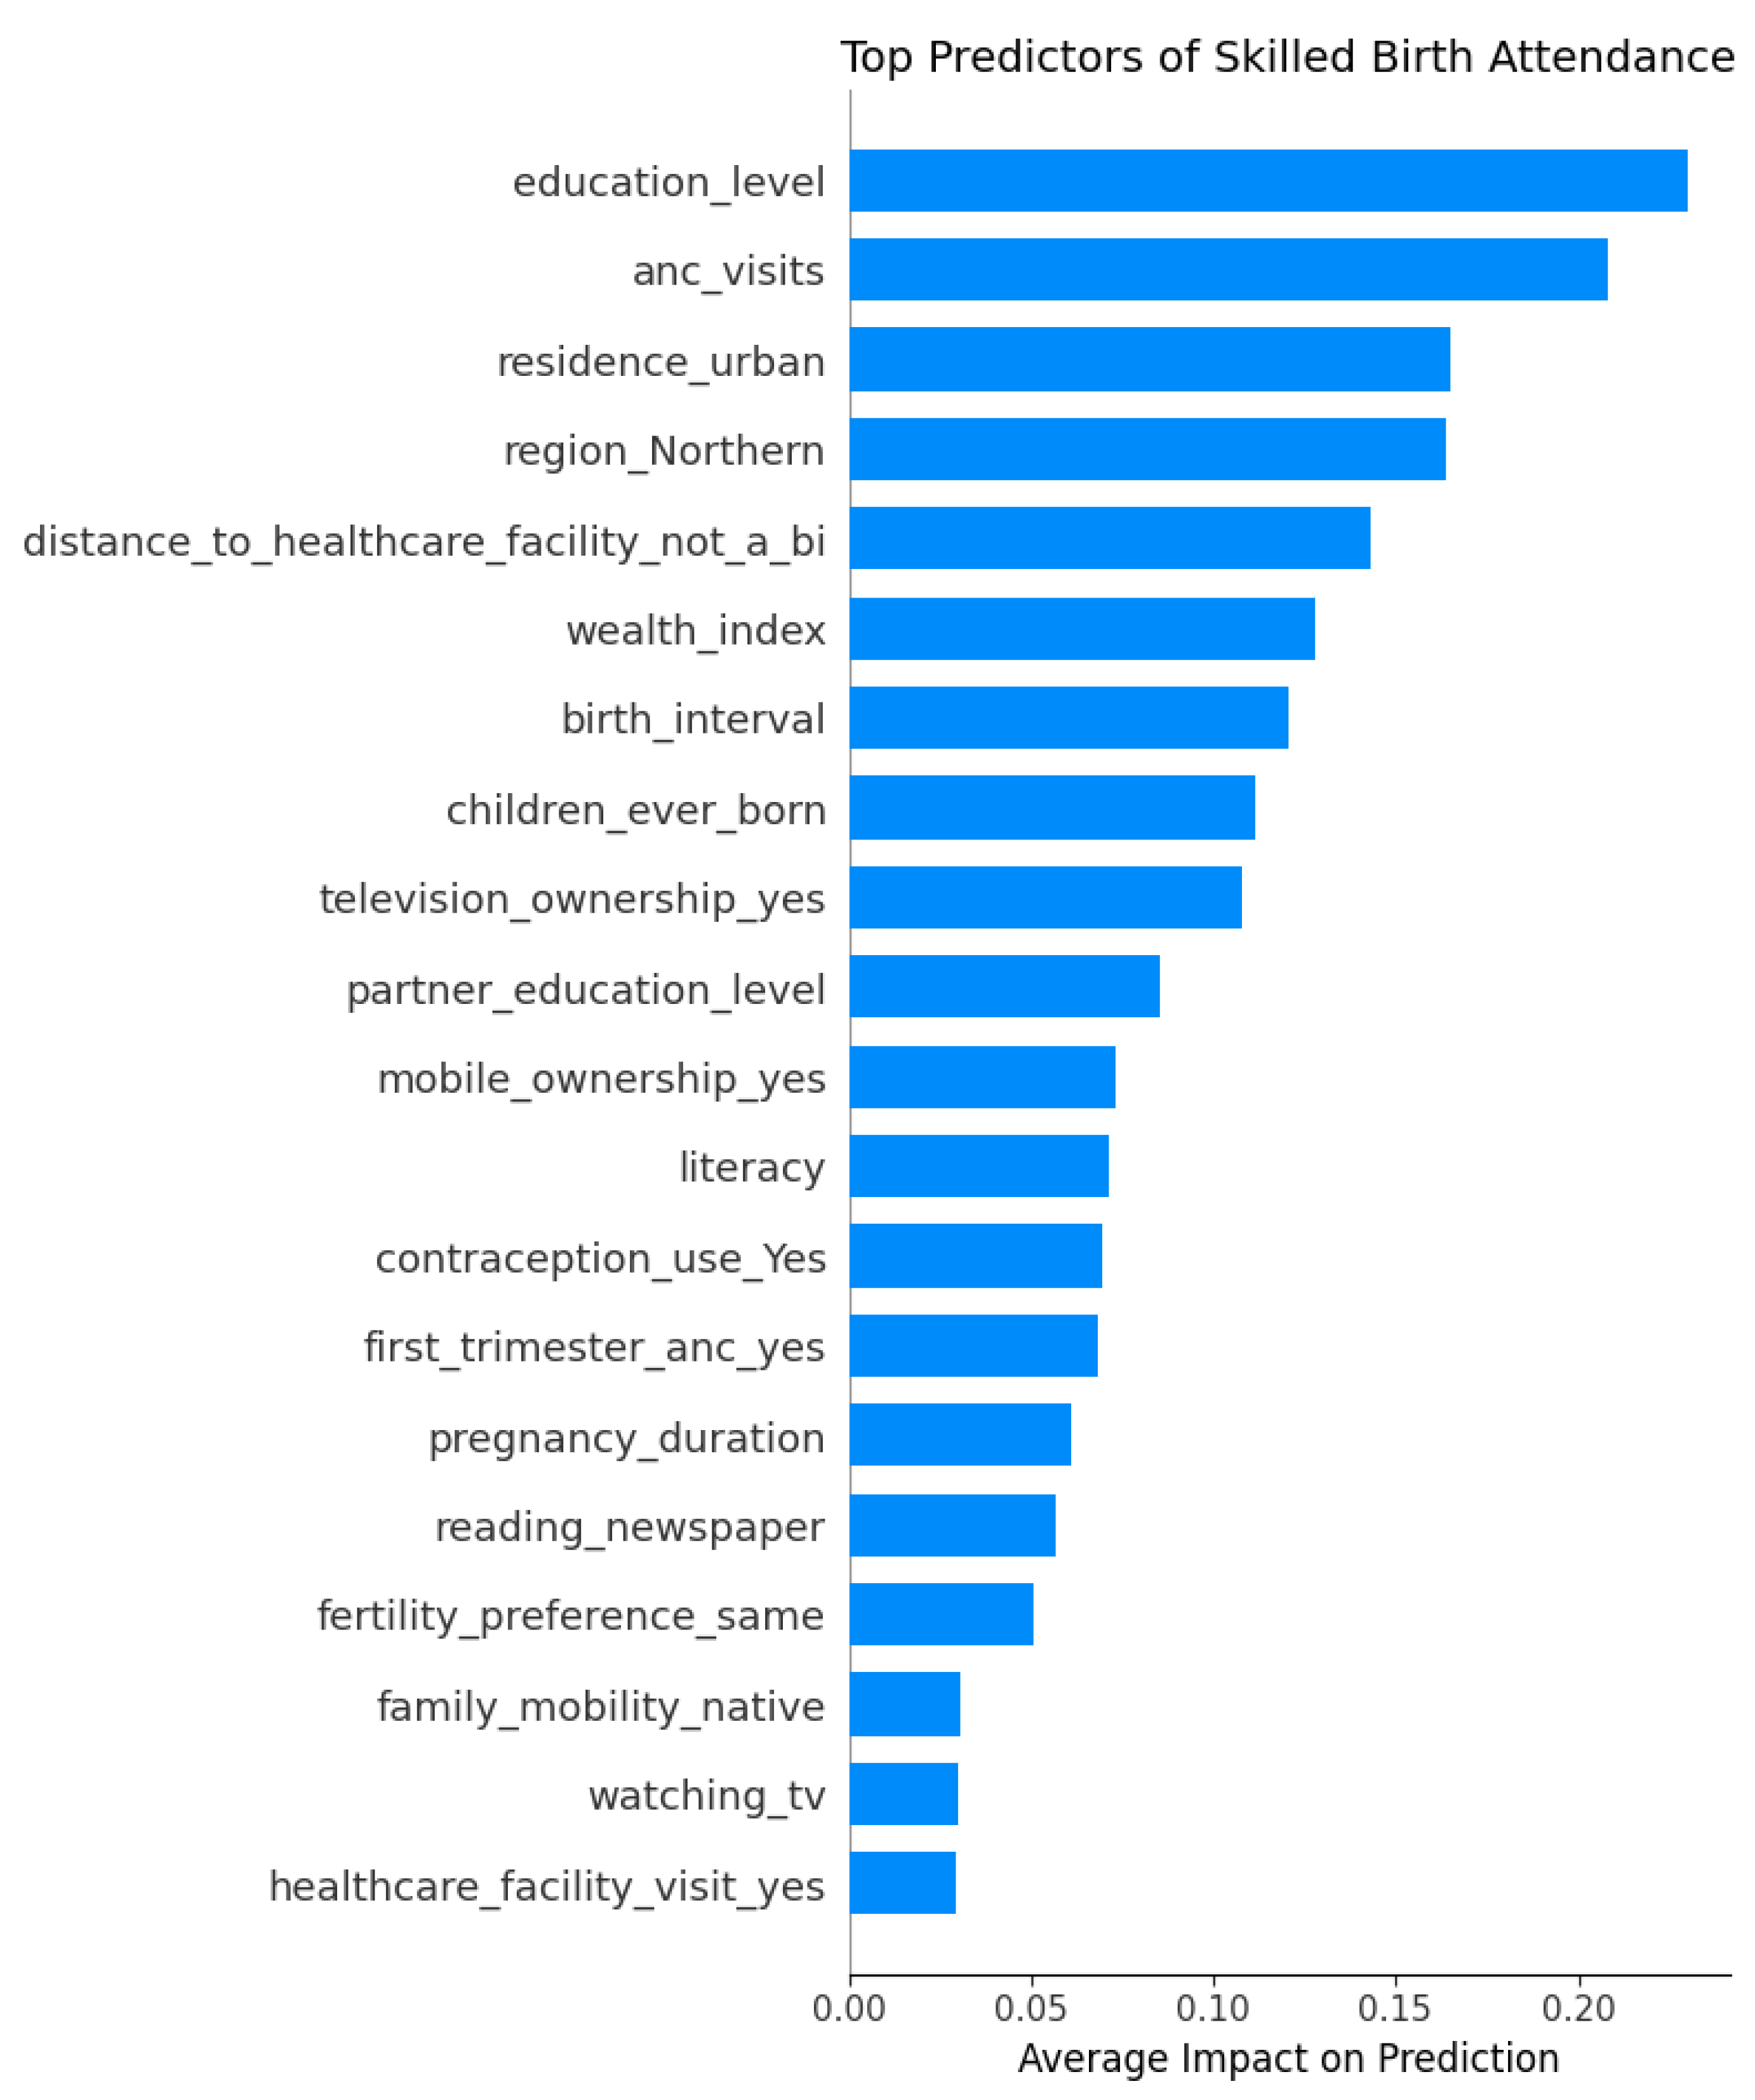
Figure 7.
SHAP Beeswarm Plot: Top 20 Predictors of Skilled Birth Attendance Use.
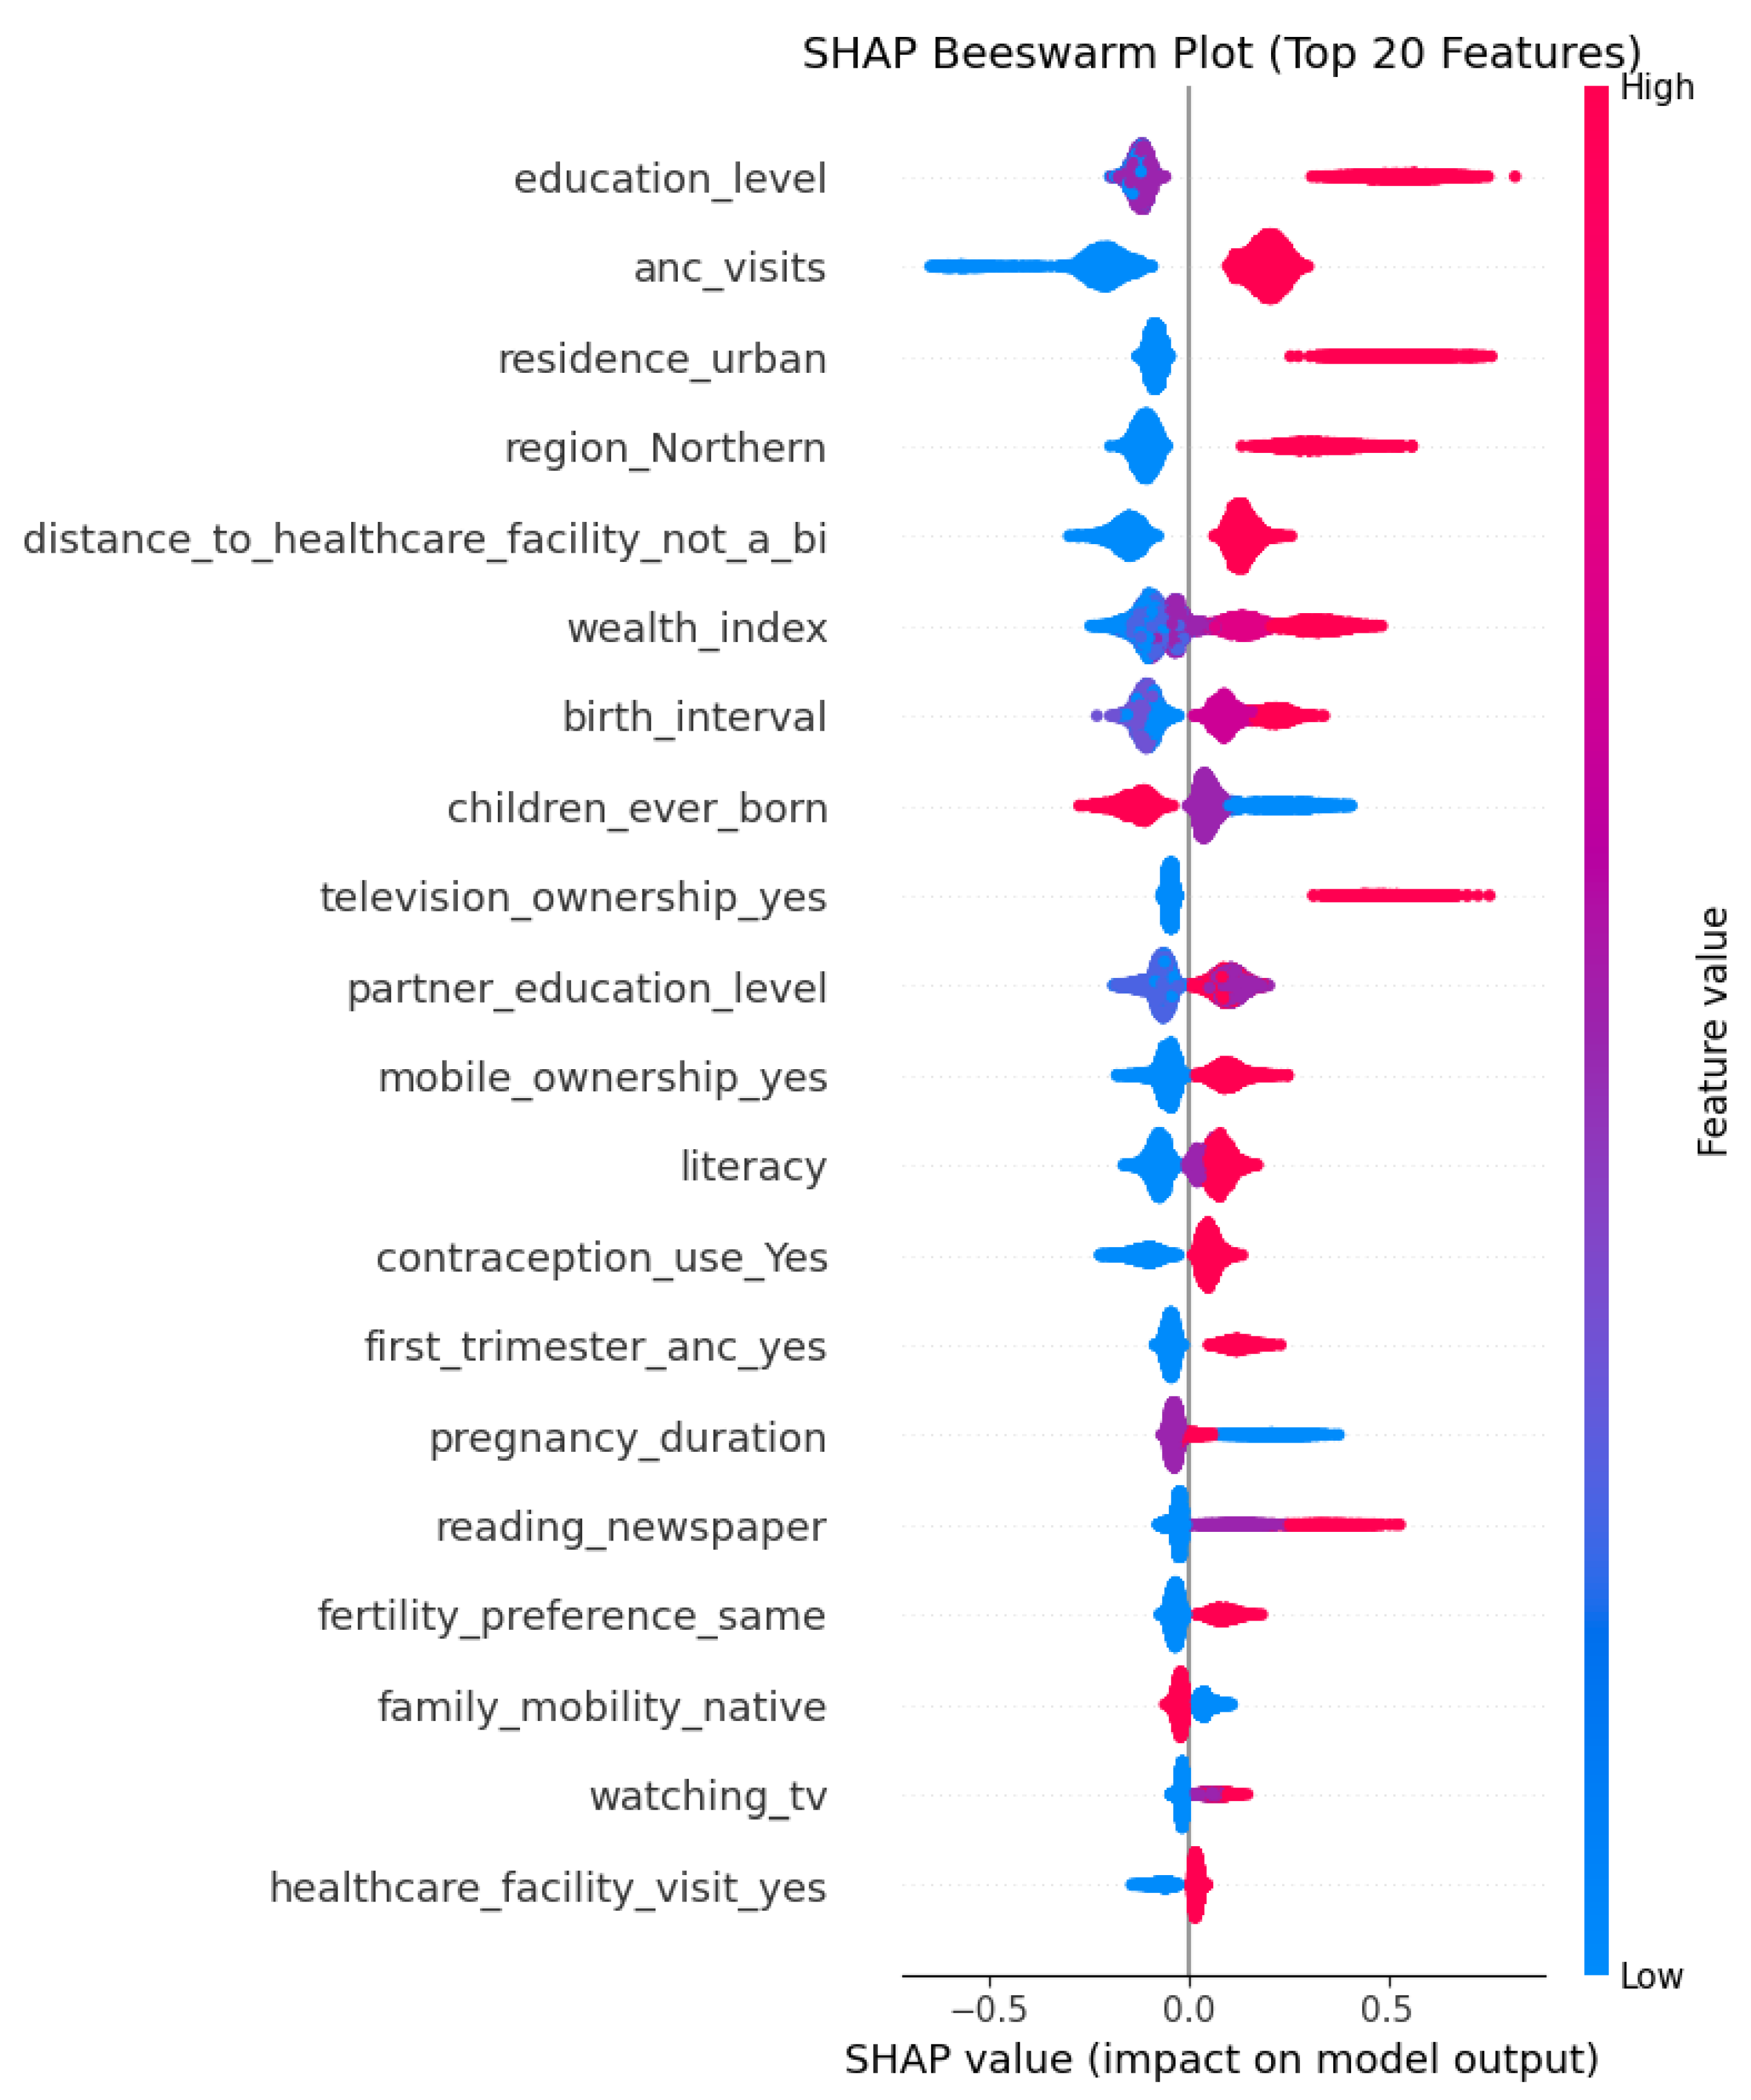
Figure 8.
SHAP Dependence Plots for Top 5 Predictive Features.
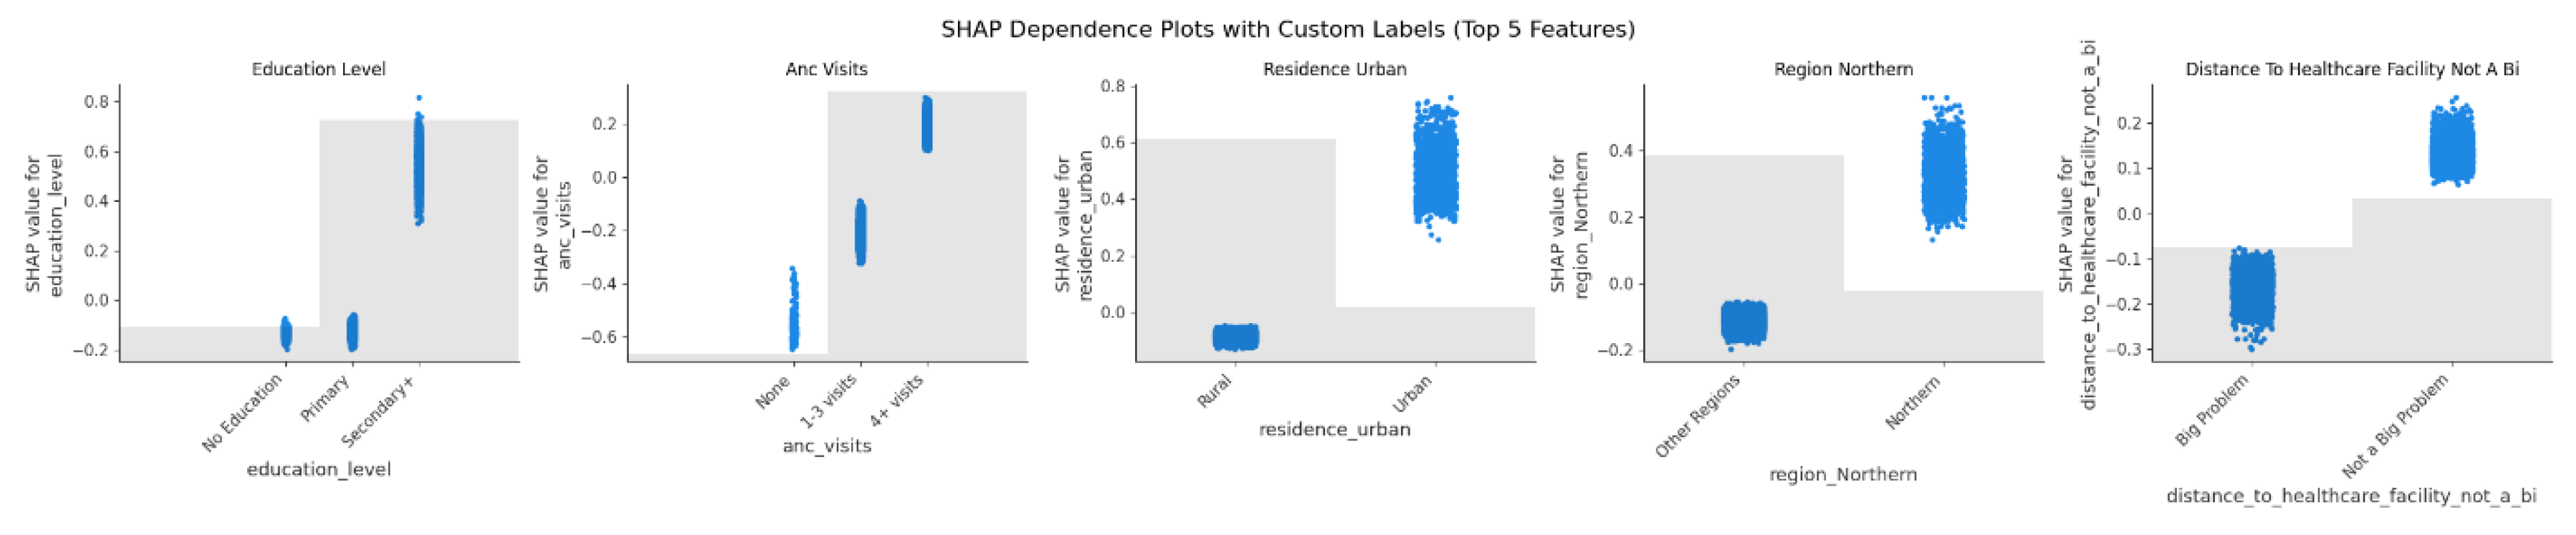

Table 1.
Socio-Demographic and Economic Characteristics of the Women in the Study by Utilization of SBA.
Table 1.
Socio-Demographic and Economic Characteristics of the Women in the Study by Utilization of SBA.
| Variable | Category | SBA Yes (74.73%) | SBA No (25.27%) |
Total |
|---|---|---|---|---|
| Family Mobility | Native | 4,201 (71.36%) | 1,686 (28.64%) | 5,887 |
| Internal Immigrant | 2,981 (80.05%) | 743 (19.95%) | 3,724 | |
| Residence | Rural | 5,467 (70.82%) | 2,253 (29.18%) | 7,720 |
| Urban | 1,715 (90.69%) | 176 (9.31%) | 1,891 | |
| Region | Central | 1,216 (78.91%) | 325 (21.09%) | 1,541 |
| Kampala | 467 (96.09%) | 19 (3.91%) | 486 | |
| Northern | 1,876 (76.95%) | 562 (23.05%) | 2,438 | |
| Western | 1,760 (70.26%) | 745 (29.74%) | 2,505 | |
| Eastern | 1,863 (70.54%) | 778 (29.46%) | 2,641 | |
| Religion | Anglican | 2,214 (73.87%) | 783 (26.13%) | 2,997 |
| Catholic | 2,929 (74.26%) | 1,015 (25.74%) | 3,944 | |
| Muslim | 966 (81.24%) | 223 (18.76%) | 1,189 | |
| Other | 1,073 (72.45%) | 408 (27.55%) | 1,481 | |
| Literacy | None | 2,542 (66.32%) | 1,291 (33.68%) | 3,833 |
| Partial | 886 (71.74%) | 349 (28.26%) | 1,235 | |
| Complete | 3,754 (82.63%) | 789 (17.37%) | 4,543 | |
| Education Level | No Education | 789 (64.99%) | 425 (35.01%) | 1,214 |
| Primary | 4,147 (70.24%) | 1,757 (29.76%) | 5,904 | |
| Secondary | 2,246 (90.09%) | 247 (9.91%) | 2,493 | |
| Wealth Index | Poorest | 1,608 (68.14%) | 752 (31.86%) | 2,360 |
| Poorer | 1,410 (69.7%) | 613 (30.3%) | 2,023 | |
| Middle | 1,372 (73.37%) | 498 (26.63%) | 1,870 | |
| Richer | 1,424 (79.51%) | 367 (20.49%) | 1,791 | |
| Richest | 1,368 (87.30%) | 199 (12.7%) | 1,567 | |
| Age Group | 15-19 | 1,235 (80.56%) | 298 (19.44%) | 1,533 |
| 20-24 | 2,136 (77.7%) | 613 (22.3%) | 2,749 | |
| 25-29 | 1,764 (75.51%) | 572 (24.49%) | 2,336 | |
| 30-34 | 1,088 (70.93%) | 446 (29.07%) | 1,534 | |
| 35-39 | 684 (66.93%) | 338 (33.07%) | 1,022 | |
| 40++ | 275 (62.93%) | 162 (37.07%) | 437 | |
| Employment Status | Not Working | 1,206 (78.62%) | 328 (21.38%) | 1,534 |
| Working | 5,976 (73.99%) | 2,101 (26.01%) | 8,077 | |
| Marital Status | Currently in Union | 5,910 (74.16%) | 2,059 (25.84%) | 7,969 |
| Formerly in Union | 819 (72.93%) | 304 (27.07%) | 1,123 | |
| Never In Union | 453 (87.28%) | 66 (12.72%) | 519 | |
| SMB Sequence | MSB | 2,987 (72.59%) | 1,128 (27.41%) | 4,115 |
| SBM | 1,191 (78.30%) | 330 (21.70%) | 1,521 | |
| SMB | 2,551 (73.81%) | 905 (26.19%) | 3,456 | |
| SBnoM | 453 (87.28%) | 66 (12.72%) | 519 | |
| Family Type | Monogamous | 4,468 (74.77%) | 1,508 (25.23%) | 5,976 |
| Polygamous | 1,442 (72.35%) | 551 (27.65%) | 1,993 | |
| Not In Union | 1,272 (77.47%) | 370 (22.53%) | 1,642 | |
| Household Size | 1-4 | 2,555 (78.62%) | 695 (21.38%) | 3,250 |
| 5-8 | 3,554 (72.63%) | 1,339 (27.37%) | 4,893 | |
| >8 | 1,073 (73.09%) | 395 (26.91%) | 1,468 | |
| Sex Household Head | Female | 1,906 (76.15%) | 597 (23.85%) | 2,503 |
| Male | 5,276 (74.23%) | 1,832 (25.77%) | 7,108 | |
| Age of Household Head | <25 | 738 (75.93%) | 234 (24.07%) | 972 |
| 25-29 | 1,333 (77.05%) | 397 (22.95%) | 1,730 | |
| 30-49 | 3,990 (73.06%) | 1,471 (26.94%) | 5,461 | |
| 50++ | 1,121 (77.42%) | 327 (22.58%) | 1,448 | |
| Radio Ownership | No | 2,977 (70.51%) | 1,245 (29.49%) | 4,222 |
| Yes | 4,205 (78.03%) | 1,184 (21.97%) | 5,389 | |
| Television Ownership | No | 5,933 (71.65%) | 2,347 (28.35%) | 8,280 |
| Yes | 1,249 (93.84%) | 82 (6.16%) | 1,331 | |
| Mobile Ownership | No | 3,895 (68.84%) | 1,763 (31.16%) | 5,658 |
| Yes | 3,287 (83.15%) | 666 (16.85%) | 3,953 | |
| Bank Account Ownership | No | 6,262 (73.27%) | 2,285 (26.73%) | 8,547 |
| Yes | 920 (86.47%) | 144 (13.53%) | 1,064 | |
| Internet Use | No | 6,708 (73.52%) | 2,416 (26.48%) | 9,124 |
| Yes | 474 (97.33%) | 13 (2.67%) | 487 | |
| Reading Newspaper | At Least Once a Week | 536 (92.89%) | 41 (7.11%) | 577 |
| Less Than Once a Week | 852 (86.23%) | 136 (13.77%) | 988 | |
| Not At All | 5,794 (72.01%) | 2,252 (27.99%) | 8,046 | |
| Listening To Radio | At Least Once a Week | 4,213 (77.4%) | 1,230 (22.6%) | 5,443 |
| Less Than Once a Week | 1,170 (77.02%) | 349 (22.98%) | 1,519 | |
| Not At All | 1,799 (67.91%) | 850 (32.09%) | 2,649 | |
| Watching Tv | At Least Once a Week | 1,303 (91.25%) | 125 (8.75%) | 1,428 |
| Less Than Once a Week | 741 (79.25%) | 194 (20.75%) | 935 | |
| Not At All | 5,138 (70.89%) | 2,110 (29.11%) | 7,248 | |
| Health Insurance | No | 7,089 (74.56%) | 2,419 (25.44%) | 9,508 |
| Yes | 93 (90.29%) | 10 (9.71%) | 103 | |
| Partner Education Level | No Education | 436 (68.55%) | 200 (31.45%) | 636 |
| Primary | 3,001 (67.94%) | 1,416 (32.06%) | 4,417 | |
| Secondary | 2,473 (84.81%) | 443 (15.19%) | 2,916 | |
| Not In Union | 1,272 (77.47%) | 370 (22.53%) | 1,642 | |
| Partner Employment Status | Not Working | 194 (68.55%) | 89 (31.45%) | 283 |
| Working | 5,716 (74.37%) | 1,970 (25.63%) | 7,686 | |
| Not In Union | 1,272 (77.47%) | 370 (22.53%) | 1,642 | |
| Healthcare Facility Visit in the Past Year | No | 1,415 (71.11%) | 575 (28.89%) | 1,990 |
| Yes | 5,767 (75.67%) | 1,854 (24.33%) | 7,621 | |
| Healthcare Cost | Big Problem | 3,337 (70.64%) | 1,387 (29.36%) | 4,724 |
| Not A Big Problem | 3,845 (78.68%) | 1,042 (21.32%) | 4,887 | |
| Distance To Healthcare Facility | Big Problem | 2,704 (67.67%) | 1,292 (32.33%) | 3,996 |
| Not A Big Problem | 4,478 (79.75%) | 1,137 (20.25%) | 5,615 | |
| Healthcare Decision Making | Husband/Partner Alone | 1,581 (73.36%) | 574 (26.64%) | 2,155 |
| Respondent Alone | 1,697 (73.78%) | 603 (26.22%) | 2,300 | |
| Respondent And Husband/Partner | 2,632 (74.9%) | 882 (25.1%) | 3,514 | |
| Not In Union | 1,272 (77.47%) | 370 (22.53%) | 1,642 | |
| Expenditures Decision Making | Husband/Partner Alone | 2,086 (73.17%) | 765 (26.83%) | 2,851 |
| Respondent Alone | 883 (72.32%) | 338 (27.68%) | 1,221 | |
| Respondent And Husband/Partner | 2,941 (75.47%) | 956 (24.53%) | 3,897 | |
| Not In Union | 1,272 (77.47%) | 370 (22.53%) | 1,642 |
Table 2.
Maternal Obstetric Characteristics of the Women in the Study by Utilization of SBA.
| Variable | Category | SBA Yes (74.73%) | SBA No (25.27%) |
Total |
|---|---|---|---|---|
| Contraception Use | No | 1,968 (68.76%) | 894 (31.24%) | 2,862 |
| Yes | 5,214 (77.26%) | 1,535 (22.74%) | 6,749 | |
| Wanted Pregnancy | No | 3,118 (72.56%) | 1,179 (27.44%) | 4,297 |
| Yes | 4,064 (76.48%) | 1,250 (23.52%) | 5,314 | |
| Wanting Same Number of Children as Husband/Partner | No | 2,542 (72.94%) | 943 (27.06%) | 3,485 |
| Yes | 2,267 (78.01%) | 639 (21.99%) | 2,906 | |
| Don’t Know | 1,101 (69.77%) | 477 (30.23%) | 1,578 | |
| Not In Union | 1,272 (77.47%) | 370 (22.53%) | 1,642 | |
| Children Ever Born | 1 | 1,595 (86.73%) | 244 (13.27%) | 1,839 |
| 2-4 | 3,332 (76.76%) | 1,009 (23.24%) | 4,341 | |
| 5++ | 2,255 (65.72%) | 1,176 (34.28%) | 3,431 | |
| Birth Interval (Years) | <2 | 1,203 (70.43%) | 505 (29.57%) | 1,708 |
| 2-3 | 2,048 (67.55%) | 984 (32.45%) | 3,032 | |
| >3 | 2,335 (77.04%) | 696 (22.96%) | 3,031 | |
| First Birth | 1,596 (86.74%) | 244 (13.26%) | 1,840 | |
| Age at First Sex | Early | 1,211 (67.84%) | 574 (32.16%) | 1,785 |
| Moderate | 3,579 (74.04%) | 1,255 (25.96%) | 4,834 | |
| Late | 2,392 (79.95%) | 600 (20.05%) | 2,992 | |
| Age at First Birth | <18 | 2,611 (70.85%) | 1,074 (29.15%) | 3,685 |
| 18-24 | 4,202 (76.65%) | 1,280 (23.35%) | 5,482 | |
| >25 | 369 (83.11%) | 75 (16.89%) | 444 | |
| Number of ANC Visits | None | 119 (45.08%) | 145 (54.92%) | 264 |
| 1-3 | 2,431 (67.40%) | 1,176 (32.60%) | 3,607 | |
| 4++ | 4,632 (80.70%) | 1,108 (19.30%) | 5,740 | |
| First Trimester ANC | No | 4,737 (73.07%) | 1,746 (26.93%) | 6,483 |
| Yes | 2,281 (81.23%) | 527 (18.77%) | 2,808 | |
| No ANC | 164 (51.25%) | 156 (48.75%) | 320 | |
| Pregnancy Duration (Months) | <9 | 1,117 (79.62%) | 286 (20.38%) | 1,403 |
| 9 | 5,464 (73.82%) | 1,938 (26.18%) | 7,402 | |
| >9 | 601 (74.57%) | 205 (25.43%) | 806 | |
| Place of Delivery | Health facility | 6,971 (98.24) | 125 (1.76) | 7,096 |
| Not at health facility | 211 (8.39) | 2,304 (91.61) | 2,515 |
Table 3.
Comparison of the Performance of Machine Learning Models in the Prediction of SBA.
| Method | Precision | Recall | F1-Score | Accuracy | AUC |
|---|---|---|---|---|---|
| Logistic Regression | 0.39 | 0.76 | 0.51 | 0.64 | 0.7364 |
| Random Forest | 0.40 | 0.71 | 0.51 | 0.66 | 0.7413 |
| Gradient Boosting | 0.40 | 0.74 | 0.52 | 0.65 | 0.7442 |
| XGBoost | 0.40 | 0.73 | 0.52 | 0.66 | 0.7473 |
| LightGBM | 0.43 | 0.67 | 0.52 | 0.69 | 0.7424 |
| Decision Tree | 0.40 | 0.66 | 0.50 | 0.66 | 0.7121 |
| CatBoost | 0.41 | 0.70 | 0.52 | 0.67 | 0.7464 |
Disclaimer/Publisher’s Note: The statements, opinions and data contained in all publications are solely those of the individual author(s) and contributor(s) and not of MDPI and/or the editor(s). MDPI and/or the editor(s) disclaim responsibility for any injury to people or property resulting from any ideas, methods, instructions or products referred to in the content. |
© 2025 by the authors. Licensee MDPI, Basel, Switzerland. This article is an open access article distributed under the terms and conditions of the Creative Commons Attribution (CC BY) license (http://creativecommons.org/licenses/by/4.0/).
Copyright: This open access article is published under a Creative Commons CC BY 4.0 license, which permit the free download, distribution, and reuse, provided that the author and preprint are cited in any reuse.


