
Submitted:
17 July 2025
Posted:
18 July 2025
You are already at the latest version
Abstract
Background/Objectives: Anemia remains a significant public health concern among pregnant women in low-income countries like Nigeria. Largely driven by micronutrient deficiencies, it leads to poor outcomes. This study examines pregnant women’s micronutrient intake and evaluates its relationship with anemia to inform targeted interventions. Methods: This cross-sectional study involved 87 pregnant women attending antenatal clinics in Ogbomoso, Nigeria. Data on sociodemographic factors, dietary intake, and anthropometry were collected. Micronutrient intake was assessed using 24-hour recall and dietary diversity questionnaires. Hemoglobin was measured with an automated analyzer, and anemia was defined by WHO criteria. Descriptive statistics summarized participant characteristics, while logistic regression assessed associations between micronutrient intake and anemia. Ethical approval and informed consent were obtained. Results: Most participants were aged 25–34, self-employed, and earned less than ₦50,000 monthly. Dietary analysis revealed widespread inadequacies in key micronutrients, including vitamins A, D, B1, B2, B6, C, folate, calcium, iron, and zinc, with over 90% failing to meet recommended dietary allowances. Anemia affected 48.2%, primarily mild cases, with no severe anemia observed. No significant anthropometric or blood pressure differences were noted between anemic and non-anemic women. However, low vitamin B2 intake was significantly associated with anemia (p = 0.021). Strong positive correlations were found between vitamin B12 and both vitamin D (r = 0.969) and E (r = 0.960). Conclusions: Anemia and low micronutrient intake are common among pregnant women in Ogbomoso. Regular hemoglobin checks, early detection of deficiencies, improved antenatal care, dietary guidance, and timely interventions like dietary diversification and supplementation are essential to address related health risks effectively.
Keywords:
micronutrient deficiency
; anaemia
; haemoglobin
; pregnant women
1. Introduction
Micronutrient deficiencies, commonly referred to as “hidden hunger,” remain a pressing global health concern, disproportionately affecting low- and middle-income countries [1,2,3]. Among the most vulnerable groups are pregnant women, who face heightened nutritional demands to support foetal development, placental function, and maternal health [4]. These demands are often unmet in resource-limited settings, leading to a high prevalence of micronutrient deficiencies and their associated health consequences [5,6]. Anemia, characterized by insufficient hemoglobin levels, is a well-documented outcome of micronutrient deficiencies during pregnancy, affecting an estimated 36.5% of pregnant women globally [7]. In Sub-Saharan Africa (SSA), including Nigeria, the prevalence ranges from 35% to 70%, with various factors identified as contributing aetiology to this high rate [8,9]. Anemia prevalence that varies significantly across SSA with Burkina Faso 54.4%, Ghana 50.8%, and South-Western Nigeria 56.3% [10,11,12,13].
While iron deficiency is recognized as the leading cause of anemia, contributing to approximately 50% of cases (Stevens et al., 2013), deficiencies in other essential micronutrients—such as folate, vitamin B12, zinc, and vitamin A—are increasingly acknowledged as significant contributors [14,15].
Micronutrients play a pivotal role in maternal and foetal health. Iron and folate are critical for hemoglobin synthesis and DNA replication, while vitamin B12 supports neurological development and immune function [14,16]. Zinc facilitates enzymatic reactions and cellular growth, and vitamin A contributes to immune competence and vision [17]. Deficiencies in these nutrients not only exacerbate the risk of anemia but also increase susceptibility to adverse maternal and foetal outcomes, including preterm delivery, low birth weight, and intrauterine growth restriction [1].
In Nigeria, the dietary habits of many pregnant women reflect limited diversity, with diets predominantly consisting of starchy staples and limited intake of animal-sourced foods, fruits, and vegetables [18,19]. This pattern results in inadequate intakes of bioavailable of essential nutrients like iron, zinc, and vitamin B12 crucial for both optimal maternal and foetal health, which are often found in animal products. Furthermore, socio-cultural practices, such as food taboos and restrictions during pregnancy, further limit dietary diversity and micronutrient adequacy [18]. Seasonal variations in food availability also play a role in shaping dietary patterns and exacerbate nutritional deficits during critical periods [19,20].
Despite the inclusion of Iron and Folic Acid (IFA) supplementation in routine antenatal care (ANC) programs with plans to transit to Multiple Micronutrient Supplementation (MMS)), compliance remains suboptimal in Nigeria, with factors such as poor awareness, side effects, and inconsistent supply chains contributing to low adherence [9,21,22]. Consequently, anemia persists as a major public health concern, underscoring the need for complementary strategies that address dietary practices and overall micronutrient intake.
Studies have established a strong link between dietary diversity and reduced anemia prevalence. Previous studies demonstrated that improved dietary diversity significantly enhances micronutrient adequacy and reduces the risk of anemia among pregnant women in resource-constrained settings [19,23]. Similarly, the potential of food-based interventions, such as fortified staples and nutrition education, to address micronutrient deficiencies in sub-Saharan Africa are highlighted [3]. However, there is a paucity of localized research examining these associations within specific populations, such as pregnant women in Ogbomoso, Nigeria.
This study seeks to bridge this gap by investigating the relationship between dietary intake of key micronutrients and anemia prevalence among pregnant women in Ogbomoso. The findings aim to contribute to the growing body of evidence needed to design culturally sensitive and sustainable interventions for improving maternal nutrition and reducing the burden of anemia in similar settings.
2. Materials and Methods
2.1. Study Design
This is a cross-sectional study designed to investigate the association between micronutrient intake and anemia among pregnant women in Ogbomoso, Nigeria. The study involved the collection of dietary intake data, biomarker assessments, and hemoglobin levels to evaluate micronutrient deficiencies and their relationship to anemia.
2.2. Sampling and Ethics
The study population comprised pregnant women aged 18–45 years, residing in Ogbomoso, who were within their second or third trimester of pregnancy. Participants were recruited from healthcare facilities providing antenatal care services within the study area. Eligible participants were pregnant women aged 18–45 years, who had attended at least one antenatal care session, and were within their second or third trimester. They must have provided informed consent and reported no pre-existing chronic illnesses (e.g., diabetes, hypertension, or kidney disease) or conditions that could affect hemoglobin levels, such as hemoglobinopathies. Exclusion criteria included women with acute or chronic infections (e.g., malaria or HIV/AIDS), those receiving iron therapy beyond standard antenatal supplementation, or those unwilling to provide blood samples or dietary information.
A total of 88 pregnant women participated in the study from 2 healthcare facilities in Ogbomoso, Nigeria.
2.3. Study Variables
- Socio-demographic and Clinical Information: A structured questionnaire was used to collect data on participants’ socio-demographic characteristics (e.g., age, education, and socioeconomic status) and clinical history (e.g., gravidity, parity, and antenatal supplementation use).
- Dietary Assessment: A 24-hour dietary recall and Dietary Diversity Questionnaire (DDQ) were administered to evaluate participants’ micronutrient intake using methods earlier described (39). Nutrient intake data were analyzed using food composition tables and dietary analysis software.
- Hemoglobin Measurement: Venous blood samples were collected to measure hemoglobin levels using an automated hematology analyzer.
- Anemia Classification: Anemia was defined based on World Health Organization (WHO) criteria as hemoglobin levels below 11.0 g/dL during pregnancy. The severity of anemia was further categorized as mild (10.0–10.9 g/dL), moderate (7.0–9.9 g/dL), or severe (<7.0 g/dL).
2.4. Statistical Analysis
All data were analyzed using STATA statistical software (version 17; Stata Corp LLC, College Station, TX, USA). Descriptive statistics, including means, standard deviations, and frequency distributions, were used to summarize participants’ socio-demographic characteristics, dietary intake, and hemoglobin levels. Categorical variables such as anemia classification and supplementation use were presented using absolute counts (n) and percentages (%).
To examine relationships between micronutrient intake, biochemical markers, and anemia status, chi-square (χ2) tests were used for categorical comparisons. Logistic regression models were applied to assess the strength of associations between independent variables (e.g., nutrient intakes) and the likelihood of anemia, adjusting for relevant covariates where appropriate. Interaction effects and effect sizes were evaluated, and the statistical significance threshold was set at p < 0.05 for all analyses.
2.5. Ethics Approval
The study protocol was approved by the Institutional Review Board (IRB) of the Oyo State Ministry of Health with approval number NHREC/OYOSHRIEC/10/11/22. Written informed consent was obtained from all participants, and all data were anonymized to protect participants’ confidentiality.
3. Results
The sociodemographic data of the pregnant women presented in Table 1 reveals significant insights into their profiles. Majority of the pregnant women (60.2%) are aged 25-34, followed by 20.5% aged 35-49, and 19.3% aged 15-24. Their husbands are predominantly aged 31-40 (47.7%), with 29.5% aged ≤30, and 22.7% aged 41 and above. Yoruba is the dominant ethnic group, representing 94.3% of respondents, with minimal representation from Igbo (3.4%), Benin (1.1%), and Rivers (1.1%) tribes. Christianity is the prevailing religion (65.9%), while Islam accounts for 34.1%. Marital status indicates nearly all parents are married (98.9%), with only 1.1% being single.
Educational attainment reveals that most pregnant women hold SSCE qualifications (41.9%), while 35.1% have tertiary degrees (BSc/B.Ed./HND). Similarly, their husbands predominantly possess BSc/B.Ed./HND (35.2%), with 29.5% having SSCE. The husbands exhibit slightly higher tertiary education levels than mothers, suggesting varied socioeconomic dynamics. For pregnant women, self-employment is the most common occupation (48.9%), followed by skilled workers (27.3%) and professional roles (17%).
The income data of the women indicates a predominant low-income group, with 63.6% earning less than 50k. A smaller proportion of them earn between 50k-100k (28.4%), while only a few fall into higher income brackets, such as 100k-150k (5.7%) and 150k-200k (1.1%). This suggests that most mothers in this group have limited financial resources. In terms of parity, the distribution shows that most women have 1 or 2 children, with 31.8% having one child and 30.7% having two children. Fewer women have 3 (21.6%), 4 (5.7%), 5 (4.5%), or 6 (3.4%) children, indicating a tendency toward smaller family sizes within this group. Regarding pregnancy trimester distribution, the overwhelming majority (88.6%) are in their third trimester, while a small percentage (5.7%) are in their second trimester. This suggests that the study population is primarily composed of mothers who are in the later stages of their pregnancies.
Table 2 summarizes the hematological and blood pressure status of the study group comprising 83 participants. Among the participants, 51.8% had normal hemoglobin levels (Hb >11 g/dL), while 48.2% were anemic (Hb <11 g/dL). Of those with anemia, 44.6% had mild anemia (Hb 9.0–11 g/dL), and 3.6% had moderate anemia (Hb 7.0–8.9 g/dL), with no cases of severe anemia (Hb <7.0 g/dL). Regarding blood pressure, 14.6% of participants were pre-hypertensive based on systolic blood pressure (SBP: 120–129 mmHg), while 11.0% were hypertensive (SBP >130 mmHg). For diastolic blood pressure (DBP), 2.4% were pre-hypertensive (DBP: 90–99 mmHg), and 1.22% had hypertensive DBP (>100 mmHg). This data suggests a notable prevalence of mild anemia and elevated blood pressure parameters, highlighting potential risks for adverse maternal and foetal outcomes. Figure 1 shows the prevalence of anemia among the participants. Of the 83 participants, 40 (48.2%) were classified as anemic, while 43 (51.8%) were considered normal.
The comparison of anthropometric and packed cell volume (PCV) parameters in Table 3 between anemic and normal groups reveals several notable findings. Mothers weight is higher in the anemic group (72.05±2.36 kg) compared to the normal group (67.01±1.76 kg), but the difference is not statistically significant (p = 0.091). Similarly, height measurements (156.76±1.05 cm vs. 157.89±1.09 cm, p = 0.455) did not show significant differences between the groups. Body Mass Index (BMI) is slightly higher in the anemic group (29.52±1.19) compared to the normal group (26.93±0.86), but this difference is also not significant (p = 0.077).
Table 4 presents nutrient intake of pregnant women showing significant variability when compared to the Recommended Dietary Allowances (RDA). Carbohydrate intake was generally adequate for 83% of participants, but protein intake was insufficient for 56%. Key micronutrients such as vitamin A, B1, B2, B6, C, and folate were severely inadequate, with over 90% of participants not meeting their RDAs. Vitamin D and calcium inadequacies were also notable, with 92% and 96% of participants failing to meet the RDAs, respectively. Iron and zinc deficiencies were observed in 90% and 87% of participants. Conversely, selenium and phosphorus intake showed better results, with 26% and 25% adequacy, respectively. Overall, the findings highlight a significant gap in meeting RDAs, particularly for vitamins and minerals critical for maternal and infant health justifying the need for pregnant women in Nigeria to consume a more diverse diet or for Supplementation during pregnancy to prevent adverse health outcomes due to these micronutrient deficiencies.
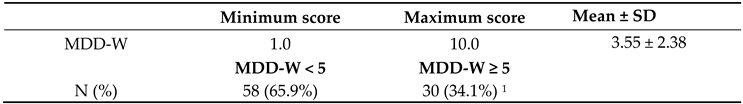
Dietary diversity of the pregnant women based on their consumption of various food groups from the DDQ was summarized in Table 5. Most participants consumed grains, white roots/tubers/plantains (76.1%) and other vegetables (77.8%). However, consumption was notably low for vitamin A-rich fruits and vegetables (6.8%), nuts and seeds (20.3%), and other fruits (13.6%). Overall, the data indicate limited dietary diversity, with many participants not consuming nutrient-rich food groups essential for optimal nutrition. The mean Minimum Dietary Diversity for Women (MDD-W) score was 3.55 ± 2.38. Most of the pregnant women (65.9%) had a minimum dietary diversity threshold (MDD-W < 5), indicating suboptimal dietary diversity and risk of micronutrient deficiency.
The comparison of blood pressure, and Micronutrient intake between anemic and normal groups in Table 6 showed notable differences. Blood pressure readings reveal no significant differences, with the systolic blood pressure averaging 106.98±1.65 in the anemic group and 111.00±2.50 in the normal group (p = 0.183), and the diastolic blood pressure averaging 61.32±1.64 in the anemic group and 63.46±1.86 in the normal group (p = 0.389). Vitamin B2 intake was significantly lower in the anemic group (0.36±0.05) compared to the normal group (0.57±0.07, p = 0.021). Although not statistically significant, Vitamin A and carbohydrate intakes were lower in the anemic group compared to the normal group. Conversely, Vitamin B6 intake was slightly higher in the anemic group (0.91±0.19) than in the normal group (0.81±0.13), but the difference was not significant. Other nutrients, including protein, Vitamin B1, Vitamin B3, Vitamin B12, Vitamin C, Vitamin D, and Vitamin E, showed no notable differences between the two groups. Folate levels were also comparable between the anemic (144.27±27.97) and normal groups (145.19±29.74, p = 0.982).
Calcium intakes were higher in the normal group (603.83±197.09) compared to the anemic group (241.12±34.63, p = 0.067). Iodine levels were higher in the anemic group (16.59±13.84) than in the normal group (3.23±2.19, p = 0.164). Similarly, iron levels were higher in the normal group (69.35±56.02) compared to the anemic group (13.86±2.09, p = 0.314). Zinc levels were also higher in the normal group (38.87±32.38) than in the anemic group (8.24±2.15, p = 0.342). Copper, phosphorus, and selenium levels showed no significant differences between the groups.
Table 7 presents the association between nutrient adequacy and anemic status of pregnant women. The results indicate a significant association between anemia status and adequacy of Vitamin B2 and calcium intake, with none of the anemic women meeting adequacy for these nutrients, compared to 4.5% of non-anemic women (χ2 = 4.385, p = 0.036). These were the only micronutrients showing a statistically significant relationship with anemia. No significant associations were found between anemia status and intake adequacy of other micronutrients including iron, zinc, selenium, Vitamin A, Vitamin B12, and folate (p > 0.05). Inadequacy in these nutrients was widespread across both anemic and non-anemic groups.
4. Discussion
The main findings from our study reveals that, an association exists between Vitamin B2 intake and anemia status, with pregnant women with anemia exhibiting notably lower Vitamin B2 intake compared to their non-anemic counterparts. While Ca adequacy was also associated with maternal anemic status, no significant associations were observed between anemia status and the intake of key minerals like copper, iron, selenium and zinc.
Exploring the socio-economic status of the pregnant women revealed that the mean maternal age was 29.47 ± 6.00 years, with an average parity of two, aligning with national fertility patterns. The older mean age of husbands (36.52 ± 7.20 years) mirrors broader demographic trends observed in marital dynamics across many societies. The average maternal BMI of 28.14 ± 5.94 reflects a high prevalence of overweight, consistent with the growing burden of overweight and obesity among urban Nigerian women. Educationally, both mothers and fathers had predominantly secondary-level education (51.72%), with few attaining postgraduate qualifications. Notably, a significant proportion of mothers (62.8%) reported earning less than ₦50,000 per month, underscoring persistent economic hardship in the population studied. These findings collectively highlight the intersection of low socioeconomic status, limited educational advancement, and increasing nutritional challenges—factors which compound maternal and child health risks and underscore the urgent need for context-specific interventions in similar low-resource urban settings.
The prevalence of anemia in this study was 48.2%, with the majority being cases of mild anemia (44.6%) and a small percentage (3.6%) classified as moderate anemia. There were no cases of severe anemia. These findings are consistent with the World Health Organization’s (WHO) 2021 report (7), which estimates a global prevalence of anemia among pregnant women to be approximately 36.5%, with variations based on geographic regions and socioeconomic factors. In comparison to other studies, the prevalence in this study aligns closely with findings from a study conducted in Nigeria by Latinos et al., which reported a 54.5% prevalence of anemia in pregnant women, predominantly mild cases [25]. The lower prevalence of moderate and no severe anemia observed here is in keeping with findings from Southern Ethiopia where 66.6% of pregnant women had mild anemia and 33.3% having moderate anemia, but no severe cases were reported despite differences in dietary pattern and locations [26]. Moreover, studies have highlighted that mild anemia is more common in settings where iron deficiency is prevalent [15]. The absence of severe anemia is consistent with findings from a review that reported reductions in cases of severe anemia in resource-limited settings [27].
The results of this study highlight significant nutritional inadequacies among the participants, particularly in the intake of vitamins and minerals critical for maternal health. The observed dietary gaps, especially in vitamins A, B1, B2, B6, C, D, and folate, where over 90% of participants failed to meet the RDAs, are consistent with findings in other studies conducted in low- and middle-income countries (LMICs). For instance, a study on pregnant women in sub-Saharan Africa (37) reported widespread inadequacies in vitamins A, C, D, and folate due to poor dietary diversity and limited access to fortified foods. Similarly, a study in South Asia (38) documented significant micronutrient deficiencies among pregnant women in South Asia, linking these deficiencies to adverse maternal and foetal outcomes. The inadequate protein intake observed in 56% of participants aligns with findings from a previous study in Nigeria which reported insufficient protein consumption among pregnant women in similar location in rural Nigeria. due to reliance on carbohydrate-rich staples [28]. Additionally, the low levels of calcium and iron adequacy (4.5% and 10.2%, respectively) reflect broader trends in LMICs, where diets are often deficient in dairy products and iron-rich foods [29]. Interestingly, selenium and iodine intake showed better adequacy compared to other micronutrients, with 26% and 100% adequacy rates, respectively. This aligns with studies in regions where iodine supplementation programs or naturally high selenium levels in soil exist [30]. However, the stark inadequacy of zinc (87.4%) and iron (89.8%) intake raises concerns, as these are essential for foetal development and immune function [31,32]. These findings suggest that interventions, such as dietary diversification, food fortification, and micronutrient supplementation programs, are urgently needed to address these gaps.
Dietary diversity among the pregnant women in this study was notably low, with a mean MDD-W score of 3.55 ± 2.38 and 65.9% scoring below the minimum threshold of five food groups. Most consumed staples like grains, tubers, and vegetables (76.1–77.8%), but intake of vitamin A-rich produce (6.8%), nuts and seeds (20.3%), and other fruits (13.6%) was substantially limited. The study aligns with a previous study in Ethiopia which reported that only 25.4% of pregnant achieved adequate dietary diversity, which was significantly associated with higher maternal education, increased household income, livestock ownership, husband’s emotional support, and women’s participation in shopping (40). This study also aligns with another Ethiopian study (41), which reported a mean MDD-W of ~4.0 among Ethiopian women, with 56.6% exhibiting inadequate diversity. In study in Vietnam, it was reported that over half of the pregnant women failed to meet RNI for key nutrients and predominantly consumed cereals with low fruit and vegetable intake
This study highlights the complex interplay between micronutrient intake and anemia among pregnant women, underscoring anemia as a persistent public health concern in resource-constrained settings. Although no significant differences in blood pressure were observed between anemic and non-anemic women, marked disparities in dietary micronutrient intake emerged, particularly for Vitamin B2 (riboflavin) and calcium. The significantly lower intake of Vitamin B2 among anemic participants reinforces its pivotal role in hemoglobin synthesis and iron metabolism, aligning with evidence that riboflavin deficiency can impair iron mobilization and contribute to anemia [33]. Similarly, although calcium intake differences were not statistically significant, its higher intake among non-anemic women suggests a potential indirect role in supporting hematological status [34].
Adequacy analysis further emphasized these findings: none of the anemic participants met the adequacy threshold for calcium or Vitamin B2, while 4.5% of the non-anemic group did (χ2 = 4.385, p = 0.036). These results support existing literature on the importance of riboflavin and calcium in hematopoiesis and overall nutritional health. Interestingly, iodine intake was slightly higher in the anemic group, though its relevance remains uncertain without biochemical confirmation. While iron and zinc are traditionally emphasized in anemia research, our findings showed no significant differences in their dietary intake between groups. This observation is consistent with previous studies that suggest dietary iron and zinc intake may not always correspond with anemia risk due to factors like poor absorption, low bioavailability, or the presence of inhibitors [36]. The higher Vitamin B6 intake seen among anemic participants may reflect unique dietary habits, warranting further exploration. These results align with global findings linking inadequate intake of essential nutrients—particularly Vitamin A, riboflavin, and calcium—with increased anemia risk [31,32,35]. Our study supports the view that anemia is multifactorial, involving both dietary and non-dietary determinants such as infections, inflammation, and genetic factors.
Collectively, these findings emphasize that addressing anemia in pregnant women requires comprehensive nutritional strategies that go beyond Iron supplementation or Multiple Micronutrient Supplementation. Nutritional interventions must prioritize improving overall diet quality, incorporating diverse, nutrient-dense foods and fortified products. Furthermore, addressing broader determinants such as infections, inflammation, and genetic predispositions, while enhancing nutrient bioavailability, remains essential for reducing anemia burden in low-resource populations.
5. Conclusions
In conclusion, this study underscores the significant association between inadequate Vitamin B2 and calcium intake and anemia among pregnant women, highlighting the critical role of dietary quality in maternal health. Addressing micronutrient deficiencies through dietary diversification, targeted supplementation, and context-specific public health strategies is essential for improving maternal nutritional status and reducing anemia prevalence in resource-limited settings.
Author Contributions
Conceptualization: O.O.A.; methodology, O.O.A, A.A.A., and O.O.; software and statistical analysis, O.O.A. and O.A.O.; validation, O.O.A., A.A.A., and O.O.; formal analysis, O.O.A. and O.A.O.; investigation, O.O.A., A.A.A., O.A.A., and O.O.; resources, O.O.A. and A.A.A.,.; data curation, O.O.A. and O.A.O.; writing—original draft preparation, O.O.A.; writing—review and editing, O.O.A, A.A.A., O.A.A., O.A.O., and O.O..; visualization, O.O.A. and A.A.A.; supervision, O.O.A., A.A.A., and O.O.; project administration, O.O.A. and A.A.A; funding acquisition, O.O.A, A.A.A., and O.O. All authors have read and agreed to the published version of the manuscript.
Funding
Please add: This research received no external funding but cofounded by O.O.A, A.A.A and O.O.
Institutional Review Board Statement
The study protocol was approved by the Institutional Review Board (IRB) of the Oyo State Ministry of Health with approval number NHREC/OYOSHRIEC/10/11/22. Written informed consent was obtained from all participants, and all data were anonymized to protect participants’ confidentiality.
Informed Consent Statement
Informed consent was obtained from all the pregnant women that participated in the study.
Data Availability Statement
Datasets for the study is available, and request can be sent to bolajiadewuyi@yahoo.co.uk.
Acknowledgments
The authors thank the pregnant women, Health care professionals and management of the 2 hospitals that took part in the study.
Conflicts of Interest
The authors declare no conflict of interest
Abbreviations
The following abbreviations are used in this manuscript:
| ANC | Antenatal Clinics |
| FFQ | Food Frequency Questionnaire |
| RDA | Recommended Dietary Allowance |
| Hb | Hemoglobin |
| WHO | World Health Organization |
| STATA | Statistical Analysis Software |
| MMS | Multiple Micronutrient Supplementation |
| IFA | Iron and Folic Acid |
| SSA | Sub-Saharan Africa |
| MDDQ | Minimum Dietary Diversity questionnaire |
| IRB | Institutional Review Boards |
| NHREC | National Health Research Ethics Committee |
| PCV | Packed cell volume |
| SBP | Systolic blood pressure |
| DBP | Diastolic blood pressure |
| HIV/AIDS | Human Immunodeficiency Virus/Acquired Immunodeficiency Syndrome |
References
- Black, R.e.; Victora, C.g.; Walker, S.P.; Bhutta, Z.A.; Christian, P.; de Onis, M.; Ezzati, M.; Grantham-McGregor, S.; Katz, J.; Martorell, R.; et al. Maternal and child undernutrition and overweight in low-income and middle-income countries. Lancet 2013, 382, 427–451. [Google Scholar] [CrossRef] [PubMed]
- Weffort, V.R.S.; Lamounier, J.A. Hidden hunger – a narrative review. J. de Pediatr. 2023, 100, S10–S17. [Google Scholar] [CrossRef] [PubMed]
- Nair, M.K.; Augustine, L.F.; Konapur, A. Food-Based Interventions to Modify Diet Quality and Diversity to Address Multiple Micronutrient Deficiency. Front. Public Heal. 2016, 3, 277. [Google Scholar] [CrossRef] [PubMed]
- Gernand, A.D.; Schulze, K.J.; Stewart, C.P.; West, K.P., Jr.; Christian, P. Micronutrient deficiencies in pregnancy worldwide: Health effects and prevention. Nat. Rev. Endocrinol. 2016, 12, 274–289. [Google Scholar] [CrossRef] [PubMed]
- Lowe, N.M. The global challenge of hidden hunger: perspectives from the field. Proc. Nutr. Soc. 2021, 80, 283–289. [Google Scholar] [CrossRef] [PubMed]
- Tam, E.; Keats, E.C.; Rind, F.; Das, J.K.; Bhutta, A.Z.A. Micronutrient Supplementation and Fortification Interventions on Health and Development Outcomes among Children Under-Five in Low- and Middle-Income Countries: A Systematic Review and Meta-Analysis. Nutrients 2020, 12, 289. [Google Scholar] [CrossRef] [PubMed]
- WHO. Anaemia in women and children. Geneva: World Health Organization; 2021.
- Nyarko, S.H.; Boateng, E.N.; Dickson, K.S.; Adzrago, D.; Addo, I.Y.; Acquah, E.; Ayebeng, C. Geospatial disparities and predictors of anaemia among pregnant women in Sub-Saharan Africa. BMC Pregnancy Childbirth 2023, 23, 1–13. [Google Scholar] [CrossRef] [PubMed]
- Fite, M.B.; Assefa, N.; Mengiste, B. Prevalence and determinants of Anemia among pregnant women in sub-Saharan Africa: a systematic review and Meta-analysis. Arch. Public Heal. 2021, 79, 1–11. [Google Scholar] [CrossRef] [PubMed]
- Tirore, L.L.; Areba, A.S.; Tamrat, H.; Habte, A.; Abame, D.E. Determinants of severity levels of anemia among pregnant women in Sub-Saharan Africa: multilevel analysis. Front. Glob. Women's Heal. 2024, 5, 1367426. [Google Scholar] [CrossRef] [PubMed]
- Lingani, M.; Zango, H.S.; Valéa, I.; Samadoulougou, S.; Sanou, M.A.; Sorgho, H.; Sawadogo, E.; Dramaix, M.; Donnen, P.; Robert, A.; et al. Prevalence and determinants of anaemia among pregnant women in high malaria transmission setting: a cross-sectional study in rural Burkina Faso. Pan Afr. Med J. 2024, 47, 2. [Google Scholar] [CrossRef] [PubMed]
- Wemakor, A. Prevalence and determinants of anaemia in pregnant women receiving antenatal care at a tertiary referral hospital in Northern Ghana. BMC Pregnancy Childbirth 2019, 19, 1–11. [Google Scholar] [CrossRef] [PubMed]
- Oyerinde, O.O.; Nkanga, E.A.; Oyerinde, I.E.; Akintoye, O.; Asekun-Olarinmoye, I.; Alabi, Q.K. Factors Affecting Anemia in Pregnancy Women in Ibeju-Lekki, Lagos State, Nigeria. Inq. J. Heal. Care Organ. Provision, Financing 2023, 60. [Google Scholar] [CrossRef] [PubMed]
- Bailey, R.L.; West, K.P., Jr.; Black, R.E. The Epidemiology of Global Micronutrient Deficiencies. Ann. Nutr. Metab. 2015, 66 (Suppl. 2), 22–33. [Google Scholar] [CrossRef] [PubMed]
- Haider, B.A.; Bhutta, Z.A. Multiple-micronutrient supplementation for women during pregnancy. Database Syst Rev. 2012, 11, CD004905. [Google Scholar] [CrossRef]
- Jorge, S.E.; Ribeiro, D.M.; Santos, M.N.N.; de Fátima Sonati, M. Hemoglobin: Structure, synthesis and oxygen transport. Sickle Cell Anaemia 2016. [Google Scholar] [CrossRef]
- Costa, M.I.; Sarmento-Ribeiro, A.B.; Gonçalves, A.C. Zinc: From Biological Functions to Therapeutic Potential. Int. J. Mol. Sci. 2023, 24, 4822. [Google Scholar] [CrossRef] [PubMed]
- Ekwochi, U.; Osuorah, C.D.I.; Ndu, I.K.; Ifediora, C.; Asinobi, I.N.; Eke, C.B. Food taboos and myths in South Eastern Nigeria: The belief and practice of mothers in the region. J. Ethnobiol. Ethnomedicine 2016, 12, 1–6. [Google Scholar] [CrossRef] [PubMed]
- Adinma, J.; Umeononihu, O.; Umeh, M. Maternal nutrition in Nigeria. Trop. J. Obstet. Gynaecol. 2017, 34, 79. [Google Scholar] [CrossRef]
- Muthayya, S.; Rah, J.H.; Sugimoto, J.D.; Roos, F.F.; Kraemer, K.; Black, R.E.; Noor, A.M. The Global Hidden Hunger Indices and Maps: An Advocacy Tool for Action. PLOS ONE 2013, 8, e67860. [Google Scholar] [CrossRef] [PubMed]
- World Health Organization. Developing and validating an iron and folic acid supplementation indicator for tracking progress towards global nutrition monitoring framework targets: final report 18. Geneva: World Health Organization; 2018. 20 June.
- Gebremariam, A.D.; Tiruneh, S.A.; Abate, B.A.; Engidaw, M.T.; Asnakew, D.T.; Budhathoki, S.S. Adherence to iron with folic acid supplementation and its associated factors among pregnant women attending antenatal care follow up at Debre Tabor General Hospital, Ethiopia, 2017. PLOS ONE 2019, 14, e0210086. [Google Scholar] [CrossRef] [PubMed]
- Islam, H.; Nayan, M.; Jubayer, A.; Amin, R. A review of the dietary diversity and micronutrient adequacy among the women of reproductive age in low- and middle-income countries. Food Sci. Nutr. 2023, 12, 1367–1379. [Google Scholar] [CrossRef] [PubMed]
- O Senbanjo, I.; O Senbanjo, C.; A Afolabi, W.; O Olayiwola, I. Co-existence of maternal overweight and obesity with childhood undernutrition in rural and urban communities of Lagos State, Nigeria. . 2019, 90, 266–274. [Google Scholar] [CrossRef]
- Olatunbosun, O.A.; Abasiattai, A.M.; Bassey, E.A.; James, R.S.; Ibanga, G.; Morgan, A. Prevalence of Anaemia among Pregnant Women at Booking in the University of Uyo Teaching Hospital, Uyo, Nigeria. BioMed Res. Int. 2014, 2014, 1–8. [Google Scholar] [CrossRef] [PubMed]
- Lebso, M.; Anato, A.; Loha, E.; Clarke, S.L. Prevalence of anemia and associated factors among pregnant women in Southern Ethiopia: A community based cross-sectional study. PLOS ONE 2017, 12, e0188783–e0188783. [Google Scholar] [CrossRef] [PubMed]
- A Bhutta, Z.; Das, J.K.; Rizvi, A.; Gaffey, M.F.; Walker, N.; Horton, S.; Webb, P.; Lartey, A.; E Black, R. Evidence-based interventions for improvement of maternal and child nutrition: what can be done and at what cost? Lancet 2013, 382, 452–477. [Google Scholar] [CrossRef] [PubMed]
- Oladipo FS, Taiwo AF, Ariyo O. Food choice, energy and nutrient intake of pregnant women in Afijio and Oyo East Local Government areas of Oyo State, Nigeria. Nigerian Agric J Food Nutr Res. 2024;8:165-175.
- Stevens GA, Finucane MM, De-Regil LM, Paciorek CJ, Flaxman SR, Branca F, Peña-Rosas JP, Bhutta ZA, Ezzati M. Global, regional, and national trends in hemoglobin concentration and prevalence of total and severe anaemia in children and pregnant and non-pregnant women for 1995–2011: a systematic analysis of population-representative data. Lancet Glob Health. 2013;1:e16-25.
- Zimmermann MB, Andersson M. Update on iodine status worldwide. Curr Opin Endocrinol Diabetes Obes. 2012;19:382-387.
- Allen, L. Guidelines on food fortification with micronutrients. World Health Organization; 2006.
- Dary O, Hurrell R. Guidelines on food fortification with micronutrients. Geneva: World Health Organization and Food and Agriculture Organization of the United Nations; 2006.
- Powers, H.J. Riboflavin (vitamin B-2) and health. Am. J. Clin. Nutr. 2003, 77, 1352–1360. [Google Scholar] [CrossRef] [PubMed]
- Ramakrishnan, U.; Manjrekar, R.; Rivera, J.; Gonzáles-Cossío, T.; Martorell, R. Micronutrients and pregnancy outcome: A review of the literature. Nutr. Res. 1999, 19, 103–159. [Google Scholar] [CrossRef]
- UNICEF, WHO. Iron deficiency anaemia: assessment, prevention, and control. A guide for programme managers. Geneva: World Health Organization; 2001.
- Zimmermann, M.B.; Hurrell, R.F. Nutritional iron deficiency. Lancet 2007, 370, 511–520. [Google Scholar] [CrossRef] [PubMed]
- Lee, S.E.; A Talegawkar, S.; Merialdi, M.; E Caulfield, L. Dietary intakes of women during pregnancy in low- and middle-income countries. Public Health Nutr 2012, 16, 1340–1353. [Google Scholar] [CrossRef] [PubMed]
- A Bhutta, Z.; Das, J.K.; Rizvi, A.; Gaffey, M.F.; Walker, N.; Horton, S.; Webb, P.; Lartey, A.; E Black, R. Evidence-based interventions for improvement of maternal and child nutrition: what can be done and at what cost? Lancet 2013, 382, 452–477. [Google Scholar] [CrossRef] [PubMed]
- Herforth, A.W.; Ballard, T.; Rzepa, A. Development of the Diet Quality Questionnaire for Measurement of Dietary Diversity and Other Diet Quality Indicators. Curr. Dev. Nutr. 2024, 8, 103798. [Google Scholar] [CrossRef] [PubMed]
- Desta, M.; Akibu, M.; Tadese, M.; Tesfaye, M. Dietary Diversity and Associated Factors among Pregnant Women Attending Antenatal Clinic in Shashemane, Oromia, Central Ethiopia: A Cross-Sectional Study. J. Nutr. Metab. 2019, 2019, 1–7. [Google Scholar] [CrossRef] [PubMed]

Table 1.
Sociodemographic Characteristics of Pregnant Women.
| Variable | Categories | Frequency | Percentage (%) |
|---|---|---|---|
| Women’s age | 15-24 | 17 | 19.3 |
| 25-34 | 53 | 60.2 | |
| 35-49 | 18 | 20.5 | |
| Husband’s age | ≤30 | 26 | 29.5 |
| 31-40 | 42 | 47.7 | |
| 41 and above | 20 | 22.7 | |
| Tribe | Benin | 1 | 1.1 |
| Igbo | 3 | 3.4 | |
| Rivers | 1 | 1.1 | |
| Yoruba | 83 | 94.3 | |
| Religion | Christianity | 58 | 65.9 |
| Islam | 30 | 34.1 | |
| Marital status | Married | 87 | 98.9 |
| Single | 1 | 1.1 | |
| Women’s Education | B.sc /B.Ed. /HND | 26 | 35.1 |
| NCE/OND | 14 | 18.9 | |
| PGDE and above | 3 | 4.1 | |
| Primary Education | 31 | 41.9 | |
| Husband’s Education | B.Sc. /B.Ed. /HND | 39 | 44.3 |
| NCE/OND | 13 | 14.8 | |
| PGDE and above | 3 | 3.4 | |
| Primary Education | 33 | 37.5 | |
| Women’s Occupation | Professional | 15 | 17.0 |
| Self employed | 43 | 48.9 | |
| Semi-professional | 5 | 5.7 | |
| Skilled Worker | 24 | 27.3 | |
| Student | 1 | 1.1 | |
| Women’s Income | <50,000 | 56 | 63.6 |
| (Naira) | 50,000 – 100,000 | 25 | 28.4 |
| 100,000 – 150,000 | 6 | 6.8 | |
| 150,000 – 200,000 | 1 | 1.1 | |
| Parity | 1 | 28 | 31,8 |
| 2 | 27 | 30.7 | |
| 3 | 19 | 21.6 | |
| 4 | 5 | 5.7 | |
| 5 | 4 | 4.5 | |
| 6 | 3 | 3.4 | |
| Pregnant trimester | Second trimester | 5 | 5.7 |
| Third trimester | 78 | 88.6 | |
| BMI | Underweight | 0 | 0.0 |
| Normal | 24 | 36.4 | |
| Overweight/Obesity | 42 | 5 |
1 Tables may have a footer.
Table 2.
Prevalence of Anemia and blood pressure amongst Pregnant women.
| Study group | Total Frequency (%) |
|---|---|
| Normal (Hb >11g/DL) | 43/83 (51.8%) |
| Anemia (Hb < 11g/DL) | 40/83 (48.2%) |
| Mild Anemia (9.0 - 11g/DL) | 37/83 (44.6%) |
| Severe Anemia (<7.0gDL) | Nil |
| Pre-Hypertensive Systolic Blood Pressure (SBP) (120 -129 mmHg) | 12/82 (14.6%) |
| Hypertensive SBP (>130 mmHg) | 9/82 (11.0%) |
| Pressure (DBP) (90 -99 mmHg) | 2/82 (2.4%) |
| Pressure (DBP) (90 -99 mmHg) | |
| Hypertensive DBP (>100 mmHg) | 1/81 (1.22%) |
Table 3.
Comparison of Anthropometric parameters Between Anemic and Normal Groups.
| Subject | Anemic | Normal | P-Value |
|---|---|---|---|
| Mothers weight (Kg) | 72.05±2.36 | 67.01±1.76 | 0.091 |
| Mothers’ height (cm) | 156.76±1.05 | 157.89±1.09 | 0.455 |
| Mothers BMI | 29.52±1.19 | 26.93±0.86 | 0.077 |
Table 4.
Micronutrient Intake and Adequacy of pregnant women in relation to their Recommended Dietary Allowance (RDA).
Table 4.
Micronutrient Intake and Adequacy of pregnant women in relation to their Recommended Dietary Allowance (RDA).
| Nutrient | RDA | Intake (Mean±SD) | %Adequacy | %Inadequacy |
|---|---|---|---|---|
| Carbohydrate | 175g/d | 332.78 ± 244.24 | 72/88 (83.0%) | 17.0% |
| Protein | 71g/d | 75.75 ± 44.84 | 38/88 (44.2%) | 55.8% |
| Vitamin A | 770μ/g | 30 [3.61-250.05] | 1/77 (1.3%) | 98.70% |
| Vitamin B1 | 1.4mg/d | 0.38 [0.1-1.55] | 4/82 (4.9%) | 95.1% |
| Vitamin B2 | 1.4mg/d | 0.46 ± 0.41 | 4/82 (4.9%) | 95.1% |
| Vitamin B3 | 18mg/d | 10.58 ± 8.78 | 16/82 (19.5%) | 80.5% |
| Vitamin B6 | 1.9mg/d | 0.65 [0.31-3.37] | 4/82 (5.1%) | 94.9% |
| Vitamin B12 | 2.6μ/g | 1.23 [0.01-3.26] | 31/77 (40.3%) | 59.7% |
| Vitamin C | 85mg/d | 1.62 [0.01-15.1] | 4/79 (5.1%) | 94.9% |
| Vitamin D | 15μ/g | 0.32 [0.01-4.68] | 7/87 (8.1%) | 92.0% |
| Vitamin E | 15mg/d | 1.81 [0.81-7.14] | 4/78 (5.3%) | 94.7% |
| Folate | 600μ/g | 77.48 [18.23 -205.84] | 2/77 (2.6%) | 97.4% |
| Copper | 1000μ/g | 12.20 [4.96 -30.1] | 0/86 (0.0%) | 100.0% |
| Iron | 27mg/d | 10.43 [6.99 –16.79] | 9/88 (10.2%) | 89.8% |
| Zinc | 12mg/d | 4.90 [3.21 -7.99] | 11/87 (12.6%) | 87.4% |
| Calcium | 1300mg/d | 172.43 [91.37 -308.49] | 4/88 (4.5%) | 95.5% |
| Selenium | 60μ/g | 47.12 ± 43.63 | 20/76 (26.3%) | 73.4% |
| Iodine | 220μ/g | 528.09 ± 514.63 | 0/7 (0.0%) | 100.0% |
| Phosphorus | 700mg/d | 368.97 [158.64 -678.60] | 19/77 (24.7%) | 75.3% |
Table 5.
Minimum dietary diversity scores (MDD-W) of food groups consumed by the pregnant women.
| Food groups | Yes (consumed) | No (not consumed) |
|---|---|---|
| Grains, white roots and tubers, plantains | 67 (76.1%) | 21 (23.9%) |
| Pulses (beans, peas and lentils) | 25 (41.7%) | 35 (58.3%) |
| Nuts and seeds(a) | 12 (20.3%) | 47 (79.7%) |
| Dairy | 32 (36.4%) | 56 (63.6%) |
| Meat, poultry and fish | 48 (54.6%) | 40 (45.4%) |
| Eggs | 24 (38.7%) | 38 (61.3%) |
| Dark green leafy vegetables(b) | 36 (40.9%) | 52 (59.1%) |
| Other vitamin A-rich fruits and vegetables(c) | 6 (6.8%) | 82 (93.2%) |
| Other vegetables(d) | 49 (77.8%) | 14 (22.2%) |
| Other fruits(e) | 12 (13.6%) | 76 (86.4%) |
a - Groundnut, ogbono, melon seed, cashews etc. b- Ewedu, water leave, bitter leave, zobo leave, zobo leaves, okazi, afang, etc c- carrots, mango, pumpkin, pawpaw, etc. d - Tomato, garden egg, okro, cucumber, cabbage, etc. e -Grapes, orange, guava, tangerine, watermelon, etc.
Table 6.
Comparison of Micronutrient Intake, Blood Pressure between Anaemic and Normal Groups.
| Parameters | Anaemic | Normal | P-Value |
|---|---|---|---|
| Protein (g) | 75.10±6.29 | 76.43±7.47 | 0.892 |
| Carbohydrate (g) | 347.46±47.18 | 317.04±20.20 | 0.565 |
| Vitamin A (µg) | 71.55±18.32 | 87.92±26.97 | 0.615 |
| Vitamin B1 (mg) | 0.44±0.07 | 0.45±0.08 | 0.960 |
| Vitamin B2 (mg) | 0.36±0.05 | 0.57±0.07 | 0.021 |
| Vitamin B3 (mg) | 9.90±1.46 | 11.23±1.30 | 0.495 |
| Vitamin B6 (mg) | 0.91±0.19 | 0.81±0.13 | 0.673 |
| Vitamin B12(mg) | 2.73±0.57 | 2.78±0.61 | 0.956 |
| Vitamin C (mg) | 12.51±4.66 | 18.21±7.32 | 0.511 |
| Vitamin D (mg) | 3.17±0.85 | 3.76±1.09 | 0.668 |
| Vitamin E (mg) | 4.54±0.83 | 4.39±1.02 | 0.911 |
| Folate (µg) | 144.27±27.97 | 145.19±29.74 | 0.982 |
| Calcium (mg) | 241.12±34.63 | 603.83±197.09 | 0.067 |
| Copper (mg) | 24.37±7.77 | 787.51±764.95 | 0.316 |
| Iodine (µg) | 16.59±13.84 | 3.23±2.19 | 0.164 |
| Iron (mg) | 13.86±2.09 | 69.35±56.02 | 0.314 |
| Phosphorus (mg) | 488.21±71.58 | 566.95±92.96 | 0.506 |
| Selenium (µg) | 45.09±7.26 | 49.17±6.97 | 0.686 |
| Zinc (mg) | 8.24±2.15 | 38.87±32.38 | 0.342 |
| Systolic blood pressure (mmHg) | 106.98±1.65 | 111.00±2.50 | 0.183 |
| Diastolic blood pressure (mmHg) | 61.32±1.64 | 63.46±1.86 | 0.389 |
Table 7.
Nutrient Adequacy amongst Anaemic and Normal Pregnant Women.
| Variable | Categories | Anemic (%) | Normal (%) | Total (%) | (χ2) | P-value |
|---|---|---|---|---|---|---|
| Carbohydrate | Adequate | 34 (38.6%) | 38 (43.2%) | 72 (81.8%) | 2.428 | 0.119 |
| Inadequate | 11 (12.5%) | 5 (5.7%) | 16 (18.2%) | |||
| Protein | Adequate | 21 (23.9%) | 17 (19.3%) | 38 (43.2%) | 0.456 | 0.500 |
| Inadequate | 24 (27.3%) | 26 (29.5%) | 50 (56.8%) | |||
| Vitamin A | Adequate | 0 (0.0%) | 1 (1.1%) | 1 (1.1%) | 1.059 | 0.304 |
| Inadequate | 45 (51.1%) | 42 (47.7%) | 87 (98.9%) | |||
| Vitamin B1 | Adequate | 2 (2.3%) | 2 (2.3%) | 4 (4.5%) | 0.002 | 0.963 |
| Inadequate | 43 (48.9%) | 41 (46.6%) | 84 (95.5%) | |||
| Vitamin B2 | Adequate | 0 (0.0%) | 4 (4.5%) | 4 (4.5%) | 4.385 | 0.036 |
| Inadequate | 45 (51.1%) | 39 (44.3%) | 84 (95.5%) | |||
| Vitamin B3 | Adequate | 8 (9.1%) | 8 (9.1%) | 16 (18.2%) | 0.010 | 0.920 |
| Inadequate | 37 (42.0%) | 35 (39.8%) | 72 (81.8%) | |||
| Vitamin B6 | Adequate | 2 (2.3%) | 2 (2.3%) | 4 (4.5%) | 0.002 | 0.963 |
| Inadequate | 43 (48.9%) | 41 (46.6%) | 84 (95.5%) | |||
| Vitamin B12 | Adequate | 15 (17.0%) | 16 (18.2%) | 31 (35.2%) | 0.145 | 0.704 |
| Inadequate | 30 (34.1%) | 27 (30.7%) | 57 (64.8%) | |||
| Vitamin C | Adequate | 3 (3.4%) | 1 (1.1%) | 4 (4.5%) | 0.955 | 0.328 |
| Inadequate | 42 (47.7%) | 42 (47.7%) | 84 (95.5%) | |||
| Vitamin D | Adequate | 4 (4.5%) | 3 (3.4%) | 7 (8.0%) | 0.110 | 0.740 |
| Inadequate | 41 (46.6%) | 40 (45.5%) | 81 (92.0%) | |||
| Vitamin E | Adequate | 2 (2.3%) | 2 (2.3%) | 4 (4.5%) | 0.002 | 0.963 |
| Inadequate | 43 (48.9%) | 41 (46.6%) | 84 (95.5%) | |||
| Folate | Adequate | 1 (1.1%) | 1 (1.1%) | 2 (2.3%) | 0.001 | 0.974 |
| Inadequate | 44 (50.0%) | 42 (47.7%) | 86 (97.7%) | |||
| Copper | Inadequate | 45 (51.1%) | 43 (48.9%) | 88 (100.0%) | - | - |
| Calcium | Adequate | 0 (0.0%) | 4 (4.5%) | 4 (4.5%) | 4.385 | 0.036 |
| Inadequate | 45 (51.1%) | 39 (44.3%) | 84 (95.5%) | |||
| Iron | Adequate | 4 (4.5%) | 5 (5.7%) | 9 (10.2%) | 0.180 | 0.672 |
| Inadequate | 41 (46.6%) | 38 (43.2%) | 79 (89.8%) | |||
| Zinc | Adequate | 4 (4.5%) | 7 (8.0%) | 11 (12.5%) | 1.098 | 0.295 |
| Inadequate | 41 (46.6%) | 36 (40.9%) | 77 (87.5%) | |||
| Selenium | Adequate | 9 (10.2%) | 11 (12.5%) | 20 (22.7%) | 0.390 | 0.532 |
| Inadequate | 36 (40.9%) | 32 (36.4%) | 68 (77.3%) | |||
| Iodine | Inadequate | 45 (51.1%) | 43 (48.9%) | 88 (100.0%) | - | - |
| Phosphorus | Adequate | 10 (11.4%) | 9 (10.2%) | 19 (21.6%) | 0.022 | 0.883 |
| Inadequate | 35 (39.8%) | 34 (38.6%) | 69 (78.4%) |
Disclaimer/Publisher’s Note: The statements, opinions and data contained in all publications are solely those of the individual author(s) and contributor(s) and not of MDPI and/or the editor(s). MDPI and/or the editor(s) disclaim responsibility for any injury to people or property resulting from any ideas, methods, instructions or products referred to in the content. |
© 2025 by the authors. Licensee MDPI, Basel, Switzerland. This article is an open access article distributed under the terms and conditions of the Creative Commons Attribution (CC BY) license (http://creativecommons.org/licenses/by/4.0/).
Copyright: This open access article is published under a Creative Commons CC BY 4.0 license, which permit the free download, distribution, and reuse, provided that the author and preprint are cited in any reuse.


