
Submitted:
11 July 2025
Posted:
15 July 2025
You are already at the latest version
Abstract
Abstract: The primary objective of this research is to investigate the impact of tendon profile layout on the shear strength of unbonded, post-tensioned prestressed concrete bridge I-girders. This study involves an experimental investigation where ten un-bonded, post-tensioned bridge girders are cast and subjected to four-point loads. The focus of the investigation is on the effect of different tendon profile layouts, including trapezoidal, parabolic, and harped shapes. The experimental results reveal that the shear behavior of the specimens progresses through three distinct stages: the elastic stage, the elastic–plastic stage, and the plastic stage, with all specimens ultimately failing due to shear. The findings show that tendon profiles with an eccentricity at the end of the beam = -80mm (80 mm above the neutral axis) exhibited the highest ultimate load capacity, coupled with the largest deflection. Conversely, profiles with an eccentricity of = 80mm (80 mm below the neutral axis) demonstrated the lowest load capacity and minimal deflection. Among the various configurations tested, the specimen with the harped tendon profile (GF-1 HA) showed the highest ultimate load capacity. On the other hand, the trapezoidal tendon profile specimen (GF-2 TR) exhibited the lowest deflection. These improvements in stiffness, load capacity, and deflection are attributed to enhanced resistance, particularly at the supports. Consequently, the optimized tendon layouts offer a reduction in deflection and an increase in the overall structural efficiency, leading to potential cost savings in bridge girder production.
Keywords:
profile layout
; shear strength
; unbonded
; post-tension
; prestress
; tendon eccentricity
; ultimate load
; trapezoidal
; parabolic
; harped
1. Introduction
In recent years, structural engineering has focused on achieving more cost-effective solutions through the use of advanced design methods and stronger materials, which have contributed to reductions in both weight and cross-sectional dimensions of structures. This is particularly crucial for reinforced concrete, where dead loads often constitute a significant portion of the total load, making such innovations highly beneficial. Despite these advancements, challenges such as cracking and excessive deflection, particularly in high-stiffness structures, continue to pose significant concerns. Prestressed concrete addresses these issues by introducing internal stresses that counteract external loads, thereby enhancing the strength, durability, and overall performance of traditionally reinforced concrete [1,2].
Prestressing systems are the systems used to induce internal force on the structure before loading it and improve the performance of the structure in different manners. There are two types of prestressed concrete systems: pretensioned and post-tensioned. Pretensioning involves stretching the tendons before the concrete pour is placed, whereas in post-tensioning the tendons are jacked into tension after the concrete cures. The two methods are aimed to enhance the structural effectiveness and the overall performance of concrete structures by overcoming stresses resulting from external loads, thereby improving the strength and stability. [3,4,5].
Post-tensioning (PT) is widely used in bridge construction because of its numerous benefits over conventional reinforced concrete. Among these benefits are the increased efficiency regarding materials, better deflection and cracking control, longer material life, quicker construction times, lower costs, and greater design flexibility. The ability to improve structural performance and minimize the overall weight of structure post-tensioning becomes an efficient solution for contemporary infrastructure construction projects [6].
Post-tensioned concrete combines the typical reinforced concrete with post-tensioning tendons that are used to induce internal forces that allow the concrete to withstand external loads. A typical post-tensioning tendon is composed of several key components: prestressing strands, protective ducts that encase the strands, grout that secures the strands in position, and anchorages that transfer the forces from the tendons to the concrete. This system increases concrete stiffness; it's stress enhancing, so it improves total structural performance[7].
Durability of post tensioning tendon depends on materials like prestressing steel, anchorages and ducts as well as installation quality. Design aspects comprising tendon arrangement and protective measures of environment are also significant [8].
Post-tensioned prestressed concrete can be achieved through two primary methods: bonded post-tensioning and unbonded post-tensioning. In bonded post-tensioning, the tendons are in direct contact with the surrounding concrete, allowing for stress transfer through the bond at the tendon-concrete interface. In contrast, unbonded post-tensioning involves tendons that are not in contact with the concrete, meaning stress is not transferred through surface bonding. These two methods offer distinct approaches for stress distribution, each influencing the structural behavior and overall performance of the concrete differently.
The layout of tendon profiles plays a critical role in reducing tension within concrete structures. The curvature of the tendons creates stresses in the concrete that are equal in magnitude but opposite in direction to the tensile forces. In most prestressed beams, tendons are placed with an eccentricity relative to the bottom (soffit) of the beam, which helps counteract the sagging bending moments caused by the external loads acting on the transverse components. As a result, prestressed beams experience upward deflection, or camber, due to the prestressing force. Since the bending moment is a multiplication of both the prestressing force and the tendon eccentricity, the tendon profile directly represents the bending moment diagram[9].
In prestressed concrete beams, two factors play an important role in minimizing the magnitude of diagonal tensile stresses under service load, as compared to conventional reinforced concrete that develops stresses without applying any prestress force to the concrete section. The first factor results from the mixture of longitudinal compressive stress and shearing stress. The second factor surrounds the tendons slope, which usually creates a shear force due to the prestress that opposes the shear force induced by the load. This opposing shear reduces diagonal tension in the beam during service. It should be noted that while prestressed beams deflect satisfactorily under service loads, checking diagonal tensile stresses at these loads is not necessarily sufficient for safety against failure. A small reduction in compressive stress or increase in shear stress, especially if a beam is overloaded, may result in an immoderate increase of principal tension. As well, when inclined tendons are employed to resist shear their contribution does not increase proportionally with load, implying small increments in shear can pose substantial design issues. Therefore, diagonal tension design in prestressed beams should be based on factored loads rather than service loads, as principal stress analysis enables you to predict the load where the first diagonal crack will occur. [1]
Numerous experimental and numerical studies were performed on the shear strength of unbonded prestressed concrete girder in the last few decades. In addition, several numerical studies have looked into the effects of different tendon profile arrangements on the overall functionality of such systems.
In their study, Rupf et al. [10] they examined the behavior of post-tensioned beams with low shear reinforcement and flanges. Experimental data from twelve reinforced concrete beams are studied, emphasis on shear strength, failure modes and comparison with design codes and elastic–plastic stress filed analysis. In their study, Huber et al. [11] they emphasized the important influence of arching action to the shear resistance of slender post-tensioned beam. It has been found that the shear design models used in the assessment are excessively conservative, especially near interior supports. In particular, the flexural-shear crack model provides encouraging predictions of the shear capacity for post-tensioned beams with low shear reinforcement ratios. Ruiz et al. [12] they examined the load-carrying mechanisms and strength of thin-webbed post-tensioned beams failing due to web crushing. It explores how cracking and stress disruptions from prestressing tendons reduce shear strength, using results from six full-scale tests on prestressed beams. Rana et al.[13] They proposed a cost optimization technique for a post-tensioned PC I-girder bridge focused at reducing material, fabrication, and installation costs. The optimization includes girder spacing, tendon arrangement and reinforcement of variables, utilizing Evolutionary Operation (EVOP) to result in cost efficient and feasible designs. Jiang et al. [14] they presented a simplified design formula for the shear capacity of prestressed concrete (PC) beams reinforced in steel plates. Using equilibrium equations, the shear contribution of the steel plates was determined taking into account shear compression failure. A parametric investigation Situated by using test data and a validated finite-element program. The formula with consideration of strength-reduction factor 0.494 accurately predicts the shear resistance of PC beams strengthened by steel plates and is consistent with the experimental results. Huber et al. [15] in their study, they presented experimental testing the shear behavior of aging post-tensioned concrete bridges, that frequently have low shear reinforcement. Testing four full scale beams of varying tendon profiles and transverse reinforcement, the research investigated shear mechanisms of aggregate interlock, stirrups and dowel action. Results indicated that stirrups alone could not account for load-carrying behavior and aggregate interlock had only a small effect. Experimental results were compared to estimates from new and existing design codes in order to understand the current design practice. Hillebrand et al. [16] they studied the fatigue behavior of 10 T-shaped prestressed concrete beams with shear reinforcement is questioned and compared by means of experimental load cycles to the prediction of the German approach based on the Eurocode 2. The study findings were beneficial for the evaluation of existing bridges and the design and construction of new bridges. Eisa et al. [17]They investigated static response of prestressed reinforced concrete beams externally reinforced with steel plates and woven carbon fiber fabric (WCFF). Results of testing 20 large-scale beams showed that both techniques enhanced the flexural and shear strength. U-shaped steel plates provided the highest load capacity and deflection reduction, while WCFF wrapping produced increase in shear strength. Qi et al. [18] they evaluated the shear performance of reinforced concrete beams with externally prestressed Carbon fiber reinforced polymer (CFRP) tendons The results indicate that CFRP tendons with stirrups increase yield and ultimate load capacities, delay diagonal cracks and provide considerable shear resistances, the levels of improvement related to preload stresses. Although initially damaged in the shear zone, the shear capacity is not much affected as load is increased. The results, along with predictive model with an error of less than 10% provide useful ideas to composite design. Zhao et al. [19] they studied the shear behavior of 16m span prestressed hollow slabs test and numerical simulation. results show of shear-compression failure, cracks are formed at 1.35m to 1.95m from beam ends, finite element model reliability quasi-authenticated by ABAQUS simulation. Jancy et al. [20]they presented a new method of modelling post-tensioned beams, calibrating a finite element model versus load capacity and post-critical response until experimental evidence is matched. Two different beam with dissimilar tendons arrangement have been analyzed under the purview of Abaqus/Explicit and Hyper mesh, ensuring crack patterns & behavior at various loading stage are accurately addressed. Lim et al. [21] they study the influence of high-strength stirrups on the shear behavior of prestressed concrete(PSC) beams. Experimental and finite element simulations demonstrated that the limit of the ACI 318-14 code for the yield strength of shear reinforcement is overly conservative and may be plotted up to 610 MPa. Mohamed et al. [22] they explores enhancing the structural behavior of reinforced concrete beams using external pre-stressing tendons to increase load capacity and resistance. Seven RC beams were tested with different tendon configurations, showing significant improvements in load-carrying capacity, deflection, and ductility. The straight-line tendon with inner deviators proved most effective. Yaqub et al. [23] they investigates the performance of PC I-girders strengthened with iron-based shape memory alloy (Fe-SMA) strips and ribbed rebar and their shear capacity using experimentation and numerical modelling. Fe-SMA can recover pre-induced strains during heating, leading to enhanced shear properties and 40-47% capacity recovery. Crack control and serviceability of active Fe-SMA shear strengthening are better than those of passive systems. In their study, Wang et al. [24] investigate experimentally the shear behavior of corroded post-tensioned prestressed concrete beams with full and insufficient grouting. There was an acceleration of corrosion, leading to diagonal crack development and reduced shear capacity. Specifically, inadequate grouting accelerated crack propagation, and corrosion losses of 31.7% reduced shear strength by as much as 15.44%. Peng et al. [25] investigated the shear behavior of post-tensioned concrete beams reinforced with longitudinal FRP strands but no stirrups. Results indicated that post-tensioned beams failed in shear compression or shear tension, with draping FRP tendons enhancing shear cracking strength by 8.8%; arching was significant to shear resistance. Qi et al. [26] studied the post-cracking shear behavior of externally prestressed concrete beams. Nine beams with different parameters, such as prestressing conditions and the ratio of shear reinforcement, were tested. Results indicated that prestressing increased concrete shear capacity by 68%, with shear strength reserves between 1.72 and 2.96. The beams exhibited large post-cracking deformability, with ductility factors varying from 3.0 to 7.6, and the stiffness decreased significantly after cracking.
Jaing et al.[27] study provides a simplified design equation for the shear strength of prestressed concrete (PC) beams reinforced with steel plates. The formula, developed from the assumption of equilibrium equations, is based on a shear compression failure. Test data and a validated 3D finite element analysis showed the effectiveness of steel plates in increasing shear strength with a proposed strength-reduction factor of 0.494. The formula closely predicts experimental outcomes.
Ahmed et al. [28] examine the shear response of single-cell, box-like testing specimens similar to keyed joints in concrete segments. Tests evaluated shear capacity, crack development, and deformations of several joint types. Epoxied joints possessed 25-28% higher shear capacity than dry joints, higher shear transfer, and uniform stress distribution. The AASHTO design criterion conservatively estimates the shear capacity of epoxied and dry joints but overestimates it for the multi-key type dry joints. Ahmed et al. [29]studied the shear behavior of box girder segmental bridges with bonded joints under direct shear load. Important parameters were confined stress, prestressing eccentricity, and concrete compressive strength. It was found that the shear capacity increased by 40% per 50% increase in confining stress. Concrete strength greatly increased joint shear strength. Comparison with design provisions showed an 11.3% underprediction of shear strength in keyed epoxied specimens.
Ng et al. [30] revisit the load balancing method described in the implementation and present two samples to demonstrate the process. They show the method's simplicity, even for curved continuous bridges, and argue that it should be used as a more efficient method instead of the traditional one henceforth in standard design practices. Jagarapu et al. [31] study the optimal cost analysis of simply supported prestressed concrete beams with six design variables and practical constraints. The beam's overall cost is given as a cost ratio, with allowance made for the volatile material costs. A parametric study investigates the effect of parameters such as population size, live load intensity, cable profile, and beam lengths, resulting in a database for a wide range of span lengths.
Khan et al. [32] propose a new method of designing cable layouts for prestressed concrete (PC) slabs, overcoming the limitations of parabolic profiles. On the other hand, the B-splines are employed to describe the actual smooth cable profile with the changing curvature. An efficient treatment, based on the B-spline convex hull property, is given. The method was successfully applied to design a two-span PC slab including both friction and non-friction conditions. Colajanni et al. [33]proposed a design method aimed at optimizing the reinforcement layout in prestressed concrete beams subjected to both bending moments and shear forces. Their work addresses the complexities involved in calculating the behavior of beams under simultaneous loading conditions, focusing primarily on plastic models and directional field methods. The study presents a unified analytical approach for analyzing the interaction between axial force, bending moment, and shear force, which is validated through experimental data, non-linear analysis, and a case history, including a detailed full-scale beam design example. Dixit et al. [34]created a three-dimensional finite element model (3D-FEM) of post-tensioned concrete beams in order to study the influences of eccentricity, prestressing force, and cable profile under concentrated point load. Results, verified through comparison with the analytical models using ANSYS, show the significance of these variables in the design. The developed 3D-FE model reasonably evaluates design attribute effects on beam performance. Naser [35] determines the best tendon profile arrangement for post-tensioned concrete bridges based on its effect on structural performance and vertical deflection. Two models of a bridge were investigated: simply supported and continuous tendon profiles. FEM outcomes indicated that continuous tendon form generally led to lower vertical deflections with loads preloaded and loads serviced, indicating the continuous tendon sort is advantageous for bridge utilization since it provides superior loads with extensive load-bearing capacities and also reduces deflection. Yakov et al. [36] present an approach for the optimization of the layout of post-tensioned cables in concrete slabs via three-dimensional B-splines by cable modeling in accordance with exact geometry. Savings of up to 20% for standard floor plans are shown, while savings over 50% for irregular plans can be suffered, all with retained structural performance. Raini [37] emphasizes the importance of the computer programming language C in developing analytical skills and problem-solving in civil engineering. It shows how computer systems make easier complex tasks like analyzing and designing prestressed beams of concrete with variable cable configurations. Using C programming, deflection estimation is greatly efficient, and it is compared to conventional analytical methods. Mohamed et al. [38] examine the influence of external prestressing tendons on the behavior of reinforced concrete (RC) T-beams. Seven beams were tested with different tendon profiles and deviator arrangements. Results, processed with ANSYS, exhibited that external tendons greatly enhanced load capacity and stiffness, including ductility, with the straight-line tendon being the most effective for simple beams. Huber [39] tested four large post-tensioned beams with different tendon shapes and different levels of transverse reinforcement, which simulated the conditions of older post-tensioned concrete bridge girders. The outcomes showed that the shear capacity of the stirrups triggered by the critical shear cracks is inadequate to explain the load-carrying behavior of the beams. Experimental results were compared to the presented design predictions to verify their accuracy.
The tendon profile layout plays a vital role in the design of post-tensioned concrete bridges. However, most research focuses on the numerical analysis of its impact on the structural performance of prestressed concrete beams and slabs. Experimental studies are not exist, and if they do exist, there are very few.
This gap in experimental research prompts the need for further investigation into the shear behavior of unbonded, post-tensioned prestressed concrete bridge girders, particularly with varying tendon profile layouts and eccentricities at the end anchorages. To address this, this study presents experimental investigations involving ten simply supported I-sections, designed according to ACI 318M-19 with different tendon profile shapes and eccentricities. The study focuses on key improvements, including enhanced load resistance, increased bending moment capacity, better deflection control, greater stiffness of prestressed concrete I-bridge girders, and reduced construction costs. The findings provide valuable insights and recommendations for engineers and designers, guiding the practical application and design of tendon profile layouts for unbonded prestressed concrete I-bridge girders.
2. Materials and Methods
2.1. Concrete Mix Design and Material Properties
The design concrete mix used in this study was designed based on ACI 211.1 standard and followed the recommendations of the ACI 211.1R recommendation. A high-performance superplasticizer, Sika ViscoCrete 1681 as shown in Figure 1, was added to improve workability and overall performance of the mixture. The detailed mixing proportions are presented in Table 1. The compressive strength of the concrete cubes (fcu) was set to reach a minimum of 55 MPa at 28 days.
The concrete compressive strength was evaluated using 150 × 150 × 150 mm cubic samples, following the BS 12390-3 standard The compressive strength was determined by testing 12 concrete cubes at 28 days. For the first seven beams, which incorporated straight, trapezoidal, and parabolic tendon profiles, the average compressive strength was 62.8 MPa. In contrast, the last three beams, which featured a harped tendon profile, exhibited a higher average compressive strength of 69.7 MPa. These values were measured using a concrete compression testing machine.
The concrete splitting tensile strength (ft) was measured by testing cylindrical specimens with dimensions of 150 × 300 mm, in accordance with the ASTM C496/C496M standard , as shown in Figure 2a. For the first seven beams, which utilized straight, trapezoidal, and parabolic tendon profiles, the splitting tensile strength was found to be 3.96 MPa. In comparison, the last three beams with a harped tendon profile exhibited a lower average tensile strength of 2.74 MPa.
The concrete flexural strength was evaluated using 150 × 150 × 550 mm prism samples, as shown in Figure 2b. The testing followed the standard procedure for determining concrete flexural strength using a simple beam with third-point loading, as specified in the ASTM C78/C78M standard [40,41]. The modulus of rupture (fr) for the first seven beams, which featured straight, trapezoidal, and parabolic tendon profiles, was measured at 4.8 MPa. For the last three beams with a harped tendon profile, the modulus of rupture was slightly higher at 5.3 MPa.
The modulus of elasticity for the tested beams was determined using a 150 × 300 mm cylindrical specimen, following the guidelines set out in ASTM C469/C469M, as shown in Figure 3. Deformation was measured with an accuracy of 0.001 mm. The calculated modulus of elasticity (Ec) for the first seven beams, which featured straight, trapezoidal, and parabolic tendon profiles, was 32,552 MPa. For the final three beams, which incorporated a harped tendon profile, the modulus of elasticity (Ec) was calculated to be 37,096 MPa.
2.2. Specimen’s Shape, Size, and Dimensions
In this study, ten simply supported prestressed post-tensioned I-beams were designed using various unbonded single-strand tendon profiles, in accordance with the ACI 318M-19 code. All beams had identical geometry, with a length of 3300 mm, a width of 250 mm, and a depth of 500 mm. Solid rectangular end blocks were incorporated at both ends of the beams, as shown in Figure 4.
The end blocks were specifically designed to accommodate the necessary end anchorage hardware and provided additional reinforcement. While they contribute to the structural integrity of the beam by securing the anchorage components, their role in reducing transverse tension or preventing cracking within the beam is minimal. Their primary function is to ensure proper anchorage and support, rather than to significantly influence the beam’s overall performance under load.
2.3. Prestressing and Reinforcement Detail
For all tested beams, the primary reinforcement comprised a single seven-wire, low-relaxation strand with a diameter of 15.24 mm (Grade 270). The strand served as the unbonded prestressing steel and was placed inside a plastic duct with an inner diameter of 20 mm. This configuration ensured the proper placement and protection of the prestressing steel during testing, contributing to the overall structural behavior and performance of the beams. The longitudinal reinforcement was composed of deformed steel bars with diameters of 12 mm and 16 mm. To ensure the beams were designed to resist flexural failure two longitudinal bar 16 mm were added at top and bottom of the beam, 4 mm steel wires were used for the vertical stirrups. The stirrups were spaced 200 mm apart along the beam's length, with a tighter arrangement of 125 mm spacing near the ends of the beams, specifically within the anchorage zone. The reinforcement details for the post-tensioned I-beams, including the end blocks, are provided in Figure 5.
The mechanical properties including dimensions and material specifications, of the strands and steel reinforcement used in the experimental program, are summarizes in the Table 2
2.4. Tested Specimens Preparation
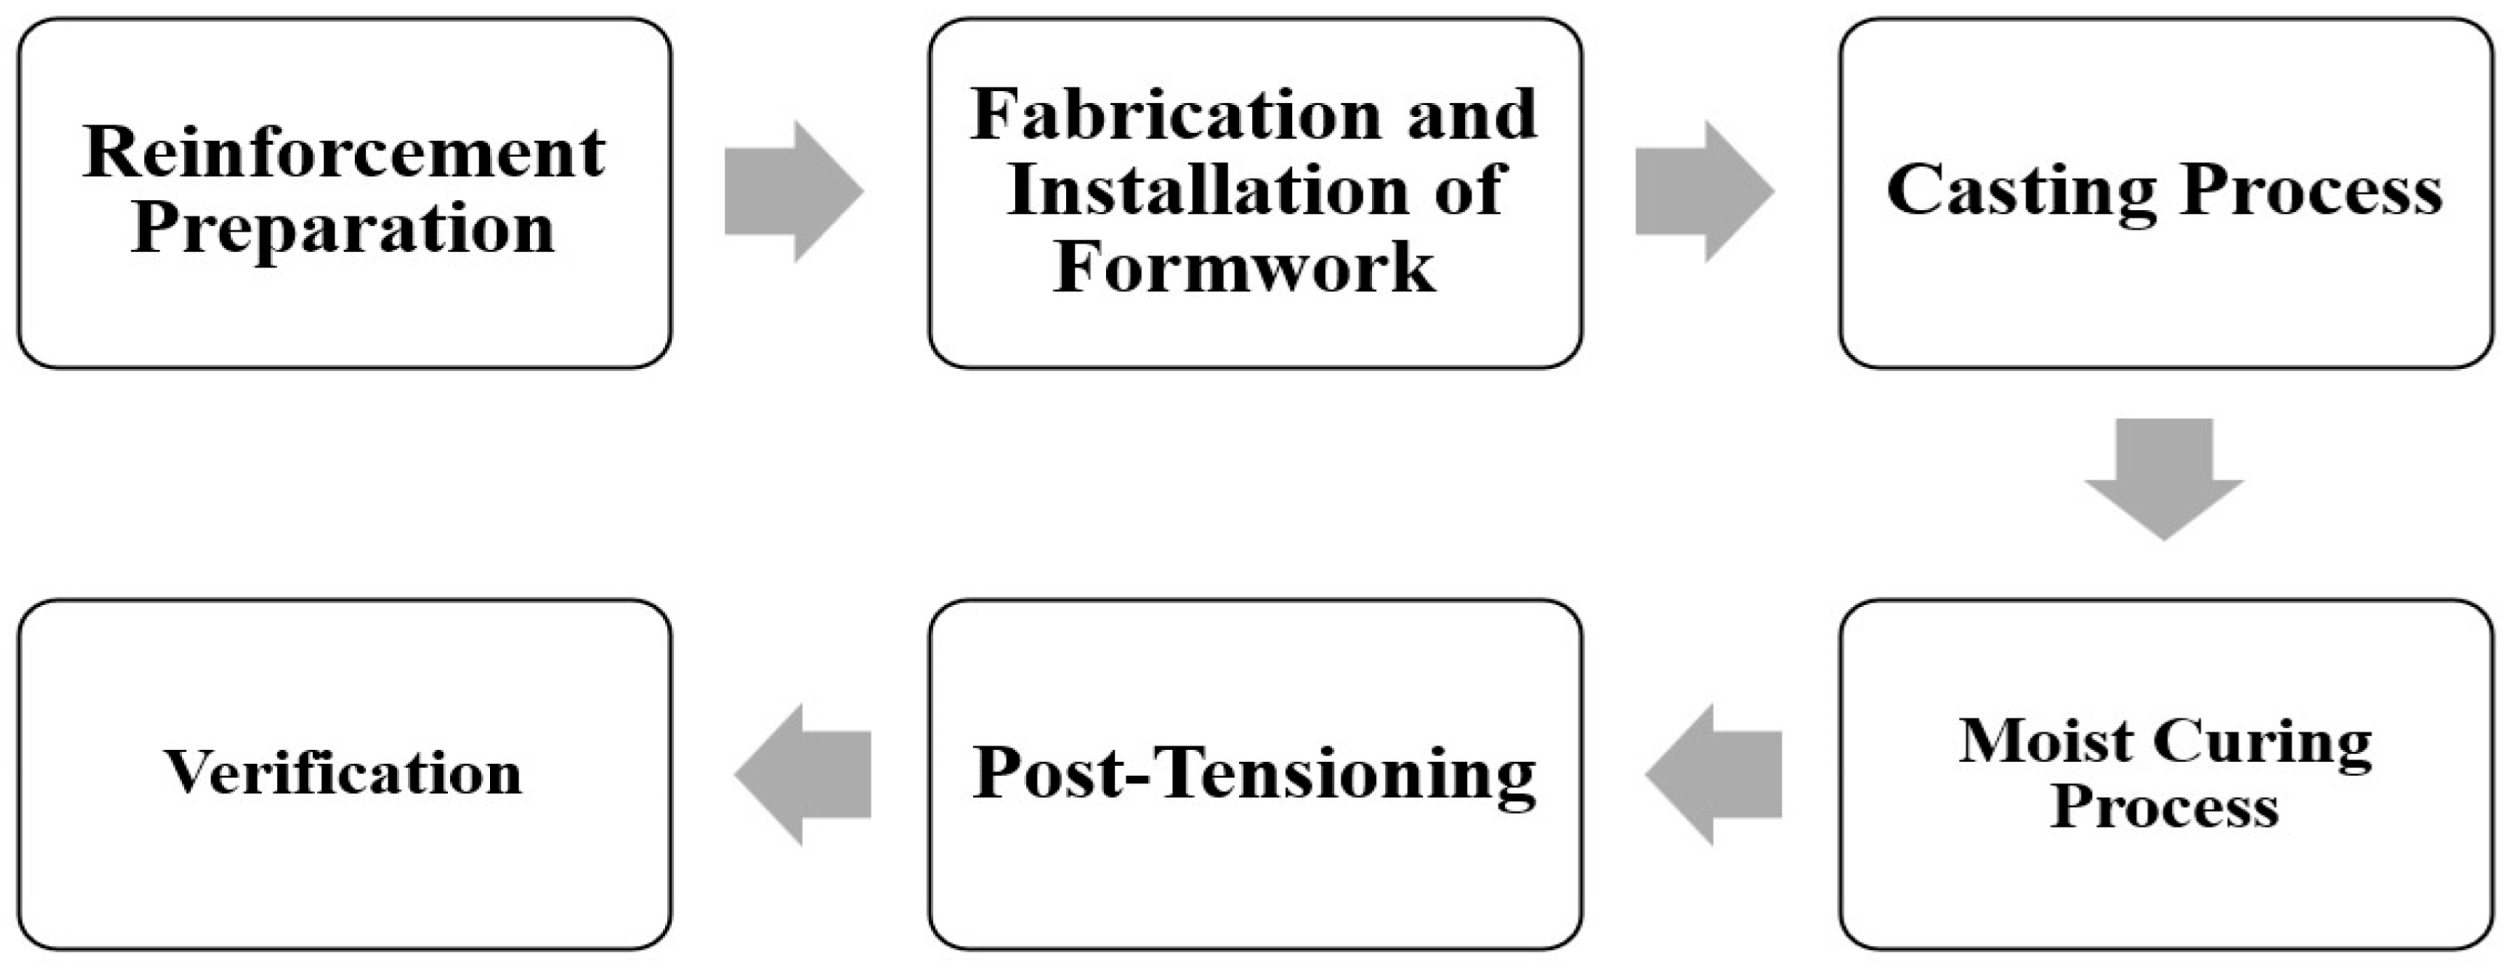
The reinforcement was prepared, as illustrated in Figure 6a. The strands were prepared at the factory, with one strand cut to a length of 3.70 m for each beam. These strands were then inserted into plastic ducts with an inner diameter of 20 mm, which had been pre-embedded within the specimen body, as depicted in Figure 6b. Spiral reinforcement was added to the end block, specifically in the anchorage zone, as shown in Figure 6c.
The reinforcement preparation process is shown in Figure 6a. One strand cut to a length of 3.70 m for every beam. These strands were then placed inside plastic ducts with an inner diameter of 20 mm, which had been pre-embedded in the specimen body, as shown in Figure 6b. Additionally, spiral reinforcement was incorporated into the end block, particularly in the anchorage zone, as illustrated in Figure 6c. This reinforcement arrangement ensured proper prestressing and structural integrity during testing.
Molds made from steel and plywood were employed to cast the reinforced beams in distinct batches. A total of ten reinforced concrete beams were produced at the Kirkuk Limited Company for Concrete Girders, as shown in Figure 1a. After casting, the beams underwent a moist curing process, which commenced 15 hours later and continued for 7 days, as presented in Figure 7b. This curing procedure was crucial to ensuring the proper hydration of the concrete, contributing to the beams' strength and durability for the subsequent testing.
The post-tensioning operation was carried out After 28 days of curing, by experienced staff with post-tensioning equipment as shown in Figure 8a, and the strands were stressed up to 70% of their ultimate tensile strength (fpu) to obtain the design prestress under service load. The wedge and plate were put on hold by 20% of the amount of jacking force to fix them, and then the total amount of jacking force, 182.282 N, was imposed, as shown in Figure 8b.
The post-tensioning process for each beam took approximately 15 minutes. Figure 8 provides the flowchart detailing the preparation process for the test specimens.
Figure 8.
(a) Post-tensioning machine. (b) tendon jacking.
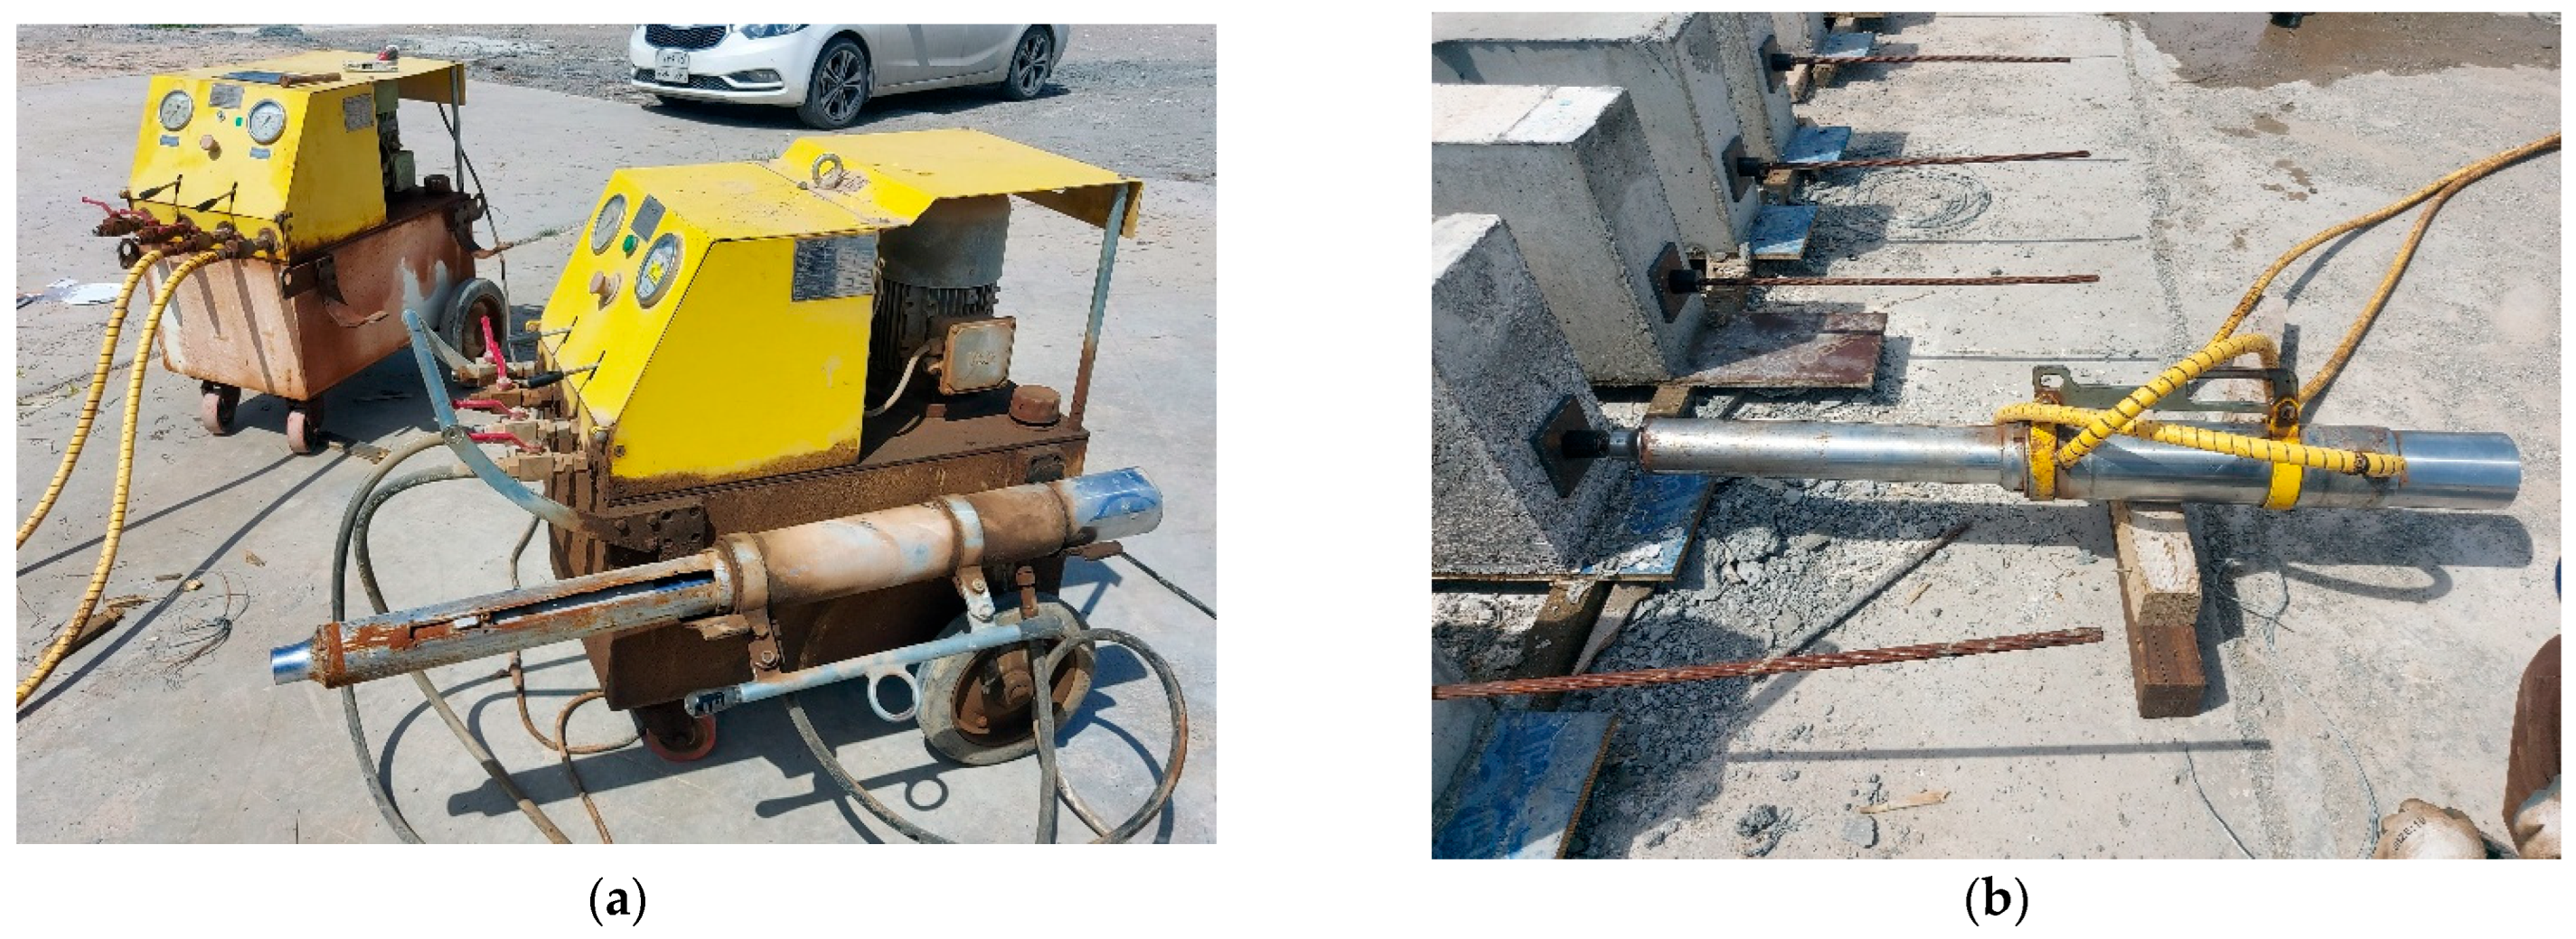
Figure 8.
Flow chart for the preparation of the test specimens.
2.5. Experimental Variables
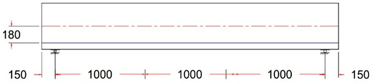
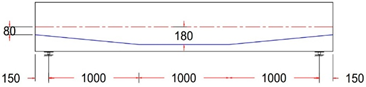
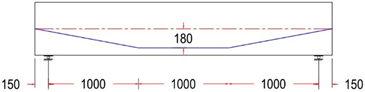
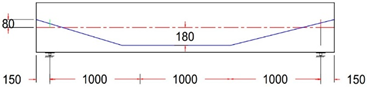
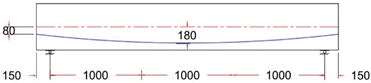
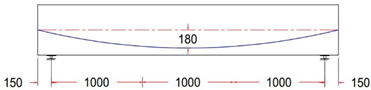
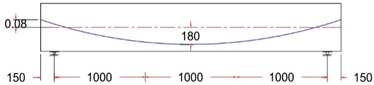
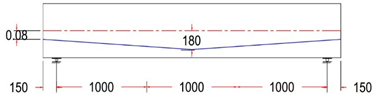
Test variable selection was extensively evaluated, and specimens were prepared with a focus on the most important parameters. The variable of primary interest was tendon profile layout. Ten different tendon profiles, as listed in Table 3,were selectd. Beam eccentricity at midspan was always 180 mm, while eccentricity at the anchorages (located at the beam end face) varied with eccentricity as 180, 80, 0, and −80 mm.
2.6. Test Setup and Instrumentation
Experiments were carried out at the Civil Engineering Laboratory, Salahaddin University, Erbil, using four-point loading tests to study the Shear responses of the beams. The beams were tested as simply supported at both ends. The testing machine was a maximum capacity of 2500 kN, as shown in Fig. 10b; the load was exerted by a hydraulic jack, and a 100 Ton load cell was used to read the load data. The force was transmitted with the aid of a steel beam.
Tests were performed at the Civil Engineering Laboratory at Salahaddin University at Erbil and four-point loading was used to measure the shear capacity of the beams. Beams were subjected to four point loading with supports at both ends. The load was carried out by there a testing machine with capacity up to 2500 kN as presented in Fig.10 b, the load was exerted using a hydraulic jack. A 100 ton load cell was used to measure and record load data and the force was transfer to the specimen through a steel beam, which facilitates the accurate and uniform load application in the test.The steel beam, which has even loading distribution, divides it into two areas 1000 mm apart. as shown in Figure 10a.To measure the mid-span deflection of the beam, two linear variable displacement transducers (LVDTs) with gauge length of 300 mm were used. The LVDTs were mounted at midspan of the beam, with the first one was mounted on the front face of the beam and the second on the rear side, and both at the midspan. This arrangement allowed to estimate the average displacement. This was of particular significance when the steel tube did not maintain the perfect alignment. The arrangement with the LVDTs is shown in Figure 10a and the beam specimens are depicted in Figure 10c.
2.7. Experimental Procedure
Universal testing machine were used for testing the beams, as illustrated in Figure 10a. The following procedure was carefully followed to ensure the consistency and accuracy of the experiment. To begin, the load cell and the LVDTs were connected to a data logger, which was tasked with recording of the load and deflection of the specimen, as presented in Figure 1ia. Next, the computer linked to the data logger, for record the data automatically, ensuring comprehensive data management.
Before the load was applied, the load adjustment control wheel was loosened to avoid the specimen experiencing any abrupt or inappropriate load. Once the specimen was properly centered in the testing rig, the load was applied by slowly turning the control wheel to apply load and to uniformly increase the load. The load was applied at an average rate of approximately 60 kN/min in the elastic stage. Cracks initiated, and the specimen became slightly more plastic, whilst during the test the digital load display did not give a constant load rate or stopped to give a constant load rate, indicating the material had changed its behavior. The testing was stopped for safety reasons when the load became steady or slightly decreased, while the displacement continued to increase significantly. The whole test process, ranging from loading to failure, approximately lasted 30 min. Any cracking formed in the sample during the test was carefully highlighted and marked by a line. When the test was finished, unset the load adjustment control wheel, turn off the machine, and pull the plug connecting with the computer, finishing the experiment safely and tidily.
This step-by-step procedure ensured precise control and thorough monitoring of the specimen's behavior during the testing, guaranteeing the accuracy and reliability of the data collected throughout the experiment.
3. Experimental Program
3.1. Load–Deflection Curves
Ten unbonded post-tensioned beams of the same cross-sectional dimensions and reinforcement arrangements but with different tendon profiles were tested under four-point load. The shear response of the beams was evaluated by load-deflection curves, crack developments and failure modes to understand their structural behavior.
Table 4 gives the first crack, ultimate load and the ratio (Pcr/Pu), an important parameter that defines the beam ductility and the overall structural performance. This is a very useful number when one wants to understand how the beam behaves under increasing load, or its ability to be able to take more force before cracking happens and failure occurs, thus providing an estimate of how strong or tough the beam really is.
All specimens initially displayed a linear response up to the cracking load. After that, an elastoplastic behavior was identified, as the applied load increased, the load-deflection ratio decreased, signaling a reduction in the strength of the beams. Then a plastic response followed, which was attributed to the yielding of the longitudinal rebar, and this behavior persisted until the test's conclusion, as illustrated in Figure 11.
As shown in Figure 11a, The load-deflection curve for the control specimen (GS-1 ST), demonstrated an initial linear response during the elastic stage, where load increased proportionally with deflection. Upon reaching 167.17 kN and 1.36 mm deflection, the first cracks appeared, marking the transition to inelastic behavior elastoplastic stage. The load-deflection curve then showed a decrease in slope, indicating reduced beam stiffness due to cracking, with deflection increasing more rapidly than load. As the load continued to rise, the curve displayed a further reduction in slope, transitioning to a plastic response caused by the yielding of the longitudinal reinforcement, which continued until the test concluded. During this phase, the load stabilized while deflection increased sharply. The ultimate load reached 601.17 kN, with a deflection of 30.1 mm, and the Pcr/Pu ratio was 27.81%, as indicated in Table 4.
For GS-2 TR, with eccentricity at the end of the beam (ee) 80 mm, exhibited a different load-deflection response, as shown in Figure 11b. Its elastic stage was lower compared to the GS-1 ST, the first crack appeared at 137.98 kN and a deflection of 0.98 mm. This specimen demonstrated a higher ultimate load of 603.03 kN and a significantly greater deflection of 42.59 mm at failure. The ultimate load increased by 1.86 kN (a 0.31% increase), while the ultimate deflection increased by 12.59 mm, reflecting a 41.97% increase over the control specimen, as summarized in Table 5. The (Pcr/Pu) ratio for GS-2 TR was 22.88%, which was lower than that of the control beam, as detailed in Table 4. For GS-3 TR, with eccentricity at the anchorage point zero, demonstrated a distinct behavior, as shown in Figure 11c. This specimen exhibited a larger elastic stage compared to the GS-1 ST, with the first crack appearing at 184.73 kN and a deflection of 0.79 mm. It reached a higher ultimate load of 613.42 kN and a lower deflection of 37.59 mm at failure. These values represent a 12.25 kN (2.04%) increase in ultimate load and a 7.49 mm (24.88%) increase in ultimate deflection compared to the control specimen, as summarized in Table 5. The (Pcr/Pu) ratio for GS-3 TR was 30.11%, higher than that of the GS-1 ST, as presented in Table 4.
Specimen GS-4 TR, with the ee = −80 mm at the anchorage point, demonstrated unique load-deflection characteristics, as shown in Figure 11d. The elastic stage for this specimen was higher than that of the control beam, with the first cracks forming at 188.72 kN and a mid-span deflection of 1.44 mm. The specimen exhibited a larger ultimate load of 647.08 kN and a larger deflection of 42 mm at failure. Compared to the control beam, this represents an increase in ultimate load by 45.91 kN (7.64%) and an increase in ultimate deflection by 11.9 mm (39.53%), as summarized in Table 5. The (Pcr/Pu) ratio for GS-4 TR was 29.16%, which is higher than that of the GS-1 ST, as presented in Table 4.
For GS-5 PR, with the ee = +80 mm at the anchorage point, demonstrated distinct load-deflection behavior, as shown in Figure 11e. This specimen exhibited a higher elastic stage compared to the control beam, with the first cracks appearing at 178.6 kN, surpassing the control beam’s cracking load, and a deflection 2 mm greater than that of the control specimen. The specimen achieved a larger ultimate load of 607.43 kN, with a corresponding deflection of 37.24 mm at failure. These values reflect an increase in ultimate load by 6.26 kN (1.04%) and an increase in ultimate deflection by 6.79 mm (22.56%) over the control beam, as summarized in Table 5. The (Pcr/Pu) ratio for GS-5 PR was 29.40%, which is higher than that of the control beam, as indicated in Table 4. The specimen GS-6 PR, with ee = 0, exhibited unique load-deflection behavior, as depicted in Figure 11f. Compared to the GS1-ST, this specimen displayed a longer elastic stage, with the first cracks occurring at 183.95 kN and a deflection of 1.68 mm. It reached a larger ultimate load of 613.6 kN and a higher deflection of 42.04 mm at failure. These findings represent a 2.07% increase in ultimate load (12.43 kN) and a 39.67% increase in ultimate deflection (11.94 mm) compared to the control specimen, as summarized in Table 5. The (Pcr/Pu) ratio for GS-6 PR was 29.98%, which is lower than that of the GS-1 ST, as shown in Table 4. For GS-7 PR, with the ee= −80 mm, exhibited distinct load-deflection behavior, as shown in Figure 11g. The elastic stage for this specimen was shorter than that of GS-1 ST. The first crack in the concrete appeared at a load of 151.2 kN with a deflection of 1.43 mm. It reached a larger ultimate load of 624 kN and a higher deflection of 42.26 mm at failure. These results represent a 3.80% increase in ultimate load (22.83 kN) and a 41.06% increase in ultimate deflection (12.36 mm) compared to the control specimen, as summarized in Table 5. The (Pcr/Pu) ratio for GS-7 PR was 24.23%, which is lower than that of GS-1 ST, as indicated in Table 4. These findings suggest that the eccentricity of the tendon profile contributed to an enhanced load-bearing capacity and deflection, although the ductility, as indicated by the (Pcr/Pu) ratio, was slightly reduced compared to the GS-1 ST.
For GS-1 HA, with the ee=+80 mm at the anchorage, displayed distinct load-deflection behavior, as shown in Figure 11h. The specimen exhibited a shorter elastic stage compared to the control beam, with the first crack appearing at 126.73 kN and a deflection of 0.86 mm. Despite this, GS-1 HA reached a larger ultimate load of 608.4 kN and a higher deflection of 35.82 mm at failure. These results correspond to a 1.20% increase in ultimate load and a 19.00% increase in ultimate deflection compared to the control beam, as detailed in Table 5. The (Pcr/Pu) was 20.83%, lower than that of the GS-1 ST, as illustrated in Table 4. For GS-2 HA, with the ee=0, exhibited a load-deflection behavior, as illustrated in Figure 11i. The elastic stage for this specimen was shorter compared to the GS-1 ST, with the first crack occurring at 145.88 kN and a deflection of 1.3 mm. However, this specimen reached a larger ultimate load of 615 kN and a greater deflection of 41.95 mm at failure. These results indicate a 2.30% increase in ultimate load and a 39.37% increase in ultimate deflection compared to the control beam, as summarized in Table 5. The (Pcr/Pu) for GS-2 HA was 23.72%, which is lower than that of GS-1 ST, as shown in Table 4. These findings suggest that the tendon configuration in GS-2 HA enhanced both the load-carrying capacity and deflection behavior, while slightly reducing the beam's ductility as evidenced by the (Pcr/Pu) ratio.
Specimen GF-3 HA, with the ee= −80 mm at the anchorage, exhibited distinct load-deflection behavior, as shown in Figure 11j. its elastic stage was shorter than that of the GS-1 ST, the first cracks appeared at 166.48 kN with a deflection of 1.52 mm. The specimen demonstrated a significantly higher ultimate load of 706.5 kN and a greater deflection of 43.81 mm at failure. These results reflect a 17.52% increase in ultimate load and a 45.55% increase in ultimate deflection compared to the control beam, as summarized in Table 5. The (Pcr/Pu) ratio for GF-3 HA was 23.56%, lower than that of the GS-1 ST, as indicated in Table 4. For GF-3 HA, featuring (ee) of −80 mm at the anchorage, exhibited distinct load-deflection behavior, as shown in Figure 11j. Its elastic stage was shorter compared to the GS-1 ST, with the first cracks appearing at 166.48 kN and a deflection of 1.52 mm. This specimen demonstrated a significantly greater ultimate load of 706.5 kN and a highrt deflection of 43.81 mm at failure. These results indicate a 17.52% increase in ultimate load and a 45.55% increase in ultimate deflection compared to the control beam, as summarized in Table 5. The (Pcr/Pu) for GF-3 HA was 23.56%, which is lower than that of the GS-1 ST, as presented in Table 4. These findings suggest that the harped tendon profile with eccentricity significantly improved both the load-bearing capacity and deflection performance, although the beam's ductility, as indicated by the (Pcr/Pu) ratio, was slightly reduced.
When comparing all beams to the GS-1ST control, as depicted in Figures 11k–m, the variances in ultimate loads and corresponding deflections can be attributed to variations in tendon profile layouts (straight, trapezoidal, parabolic, and harped) and tendon end anchorage configurations. Beams with higher eccentricity at the end anchorages or steeper tendon slopes demonstrated a greater load capacity than those with lower eccentricity or straight tendons. This enhanced load capacity is primarily due to the influence of the tendon profile layout, where beams with greater eccentricity or steeper slopes experience a higher vertical component of the effective prestressing force (Vp). This increase in prestressing force results in a higher nominal shear (Vcw), which raises the point at which web-shear cracking occurs, ultimately leading to improved shear strength capacity and overall performance of the beams.
3.3. Crack Patterns and Mode of Failure
During testing, the cracking loads were recorded when the first oblique cracks appeared in the web, caused by high diagonal tension. As the load increased, these cracks spread diagonally, both upward and downward. This behavior was attributed to the thin web structure combined with high prestressing forces, which intensified the diagonal tension and facilitated crack propagation. The crack patterns and failure modes for each specimen are presented in Figure 12 and Table 4. Web-shear cracks formed in the shear span region of all specimens, initially appearing on either side of the web. In some cases, the first crack became dominant, while in others, cracks from the opposite side grew to prominence. As the load increased, these cracks expanded diagonally in both upward and downward directions, extending further within the shear span. Additionally, some flexural cracks developed from the bottom flange, extending toward the loading points. As the cracks progressed, a significant reduction in the beam's load-bearing capacity and stiffness occurred, primarily due to the continued growth and propagation of these cracks.
4. Conclusions
This study aimed to investigate the impact of tendon profile layout on the shear strength of tested beams. Ten different I-girders with varying tendon profiles were tested, and several key conclusions emerged from the findings:
- The tendon profile layout significantly influenced the failure process in unbonded prestressed concrete I-girders.
- The shear behavior of the specimens was characterized by three stages: the elastic stage, elastic-plastic stage, and the plastic (ductility) stage. All specimens experienced shear failure.
- The first visible cracks occurred at approximately 20.83% to 30.11% of the ultimate load, averaging around 26.17% for all specimens.
- Among the specimens with a trapezoidal tendon profile, the greater increase in ultimate load was observed in specimen GF-4 TR, which showed a 12.80% improvement compared to the control beam. For the specimens with a parabolic tendon profile, an increase of 6.36% in ultimate load was recorded, with specimen GF-7 PR achieving a maximum increase of 22.83 kN over the control beam. Specimens featuring a harped tendon profile also demonstrated greater increase in ultimate load, with specimen GF-3 HA showing a significant 29.36% improvement over the control beam. These results highlight the beneficial impact of tendon profile layout on the load-carrying capacity of prestressed concrete beams.
- The vertical deflection measurements of the tendon profile specimens revealed distinct variations. For the trapezoidal tendon profile, specimen GF-2 TR exhibited the smallest deflection at 35.14 mm, which was 17.13% greater than that of the GS-1 ST. Among the parabolic tendon profile specimens, GF-5 PR showed the least deflection at 37.24 mm, 22.97% higher than GS-1 ST, while for harped tendon profile, GF-1 HA recorded a lower deflection of 35.82 mm, 19.4% greater than GS-1 ST. These findings highlight the influence of tendon profile shapes on deflection behavior, offering insights into their structural performance.
- The study revealed that each tendon profile shape (trapezoidal, parabolic, harped) exhibited the highest ultimate load capacity and deflection when the eccentricity was set at ee = -80 mm, while the eccentricity of ee = +80 mm resulted in the lowest load capacity and deflection. Notably, specimen GF-1 HA, featuring the harped tendon profile, displayed the greatest ultimate load capacity, while specimen GF-2 TR, with the trapezoidal tendon profile, recorded the smallest deflection. These findings highlight the significant influence of tendon profile shape and eccentricity on the structural performance of the specimens.
- The experimental results of girders tested with optimized tendon profiles indicated that their performance was enhanced remarkably in comparison with the control beam. These girders could carry higher loads, These girders could sustain larger loads due to the more effective distribution of the prestressing forces along the girder length. The optimum tendon arrangements lead to more homogeneous distribution of stresses inside the concrete, fully utilizing a larger part of the cross-section. Such an increased stress distribution not only raises the structural effect and efficiency and improves the girder’s ductility but also prolongs the bridge structure’s service life. This study demonstrates the advantage of adopting optimized tendon profiles to enhance the performance and durability of prestressed concrete bridge girders.
Finally, the findings from this research reveal that optimized tendon configurations lead to significant enhancements in load-carrying capacity and overall performance. These results offer valuable insights for the design and optimization of prestressed concrete girders, providing a basis for improving structural performance, extending service life, and ensuring greater safety in bridge construction. The study underscores the potential of tendon layout optimization in advancing the efficiency and durability of prestressed concrete structures.
Author Contributions
Conceptualization, S.I.H. and O.Q.A.; methodology, S.I.H.; validation, S.I.H., O.Q.A., and A.M.L.; formal analysis, S.I.H.; investigation, S.I.H.; resources, S.I.H.; data curation, S.I.H.; writing—original draft preparation, S.I.H.; writing—review and editing, A.L and O.Q.A.; visualization, S.I.H. and A.M.L.; supervision, A.M.L. and O.Q.A.; project administration, A.M.L. and O.Q.A. All authors have read and agreed to the published version of the manuscript.
Funding
This research received no external funding.
Institutional Review Board Statement
Not applicable.
Informed Consent Statement
Not applicable.
Data Availability Statement
The data presented in this study are available on request from the corresponding author. The data are not publicly available due to privacy restrictions.
Acknowledgments
The authors would like to acknowledge the Laboratory of Civil Engineering at the University of Salaheddin-Erbil for providing the facilities and resources required to conduct the experimental tests. Special thanks to the technical staff for their assistance and support throughout the research process. We extend our sincere gratitude to Kirkuk Limited Company for Concrete Girder for their expert technical support in the post-tensioning of beams. Special thanks to their skilled prestressing concrete plant staff, whose precision and professionalism were essential to this research.
Conflicts of Interest
The authors declare no conflicts of interest
References
- Darwin, David.; Dolan, C.W.. Design of Concrete Structures; 16th ed.; McGraw-Hill Education, 2021; ISBN 9781260575118.
- Hao, H.; Bi, K.; Chen, W.; Pham, T.M.; Li, J. Towards next Generation Design of Sustainable, Durable, Multi-Hazard Resistant, Resilient, and Smart Civil Engineering Structures. Eng Struct 2023, 277, 1–20. [Google Scholar] [CrossRef]
- Nilson, A.H. Design of Prestressed Concrete; Second Edition.; Wiley, 1987.
- Naser, A.F.; Zonglin, W. Strengthening of Jiamusi Pre-Stressed Concrete Highway Bridge by Using External Post-Tensioning Technology in China. Journal of Engineering and Applied Sciences 2010, 5, 60–69. [Google Scholar]
- Naser, A.F.; Zonglin, W. Finite Element and Experimental Analysis and Evaluation of Static and Dynamic Responses of Oblique Pre-Stressed Concrete Box Girder Bridge. Research Journal of Applied Sciences, Engineering and Technology 2013, 6, 3642–3657. [Google Scholar] [CrossRef]
- Abdullah, A.B.M.; Rice, J.A.; Hamilton, H.R.; Consolazio, G.R. Damage Identification in Unbonded Tendons for Post-Tensioned Bridges. In Proceedings of the International Conference on Advances in Experimental Structural Engineering; August 2015; Vol. 2015-August, p. 8.
- Corven, J.; Natio, C.; Pessiki, S. Designing and Detailing Post-Tensioned Bridges to Accommodate Nondestructive Evaluation; 2018.
- Fuzier, J.-P.; Ganz, H.-R.; Matt, P. Durability Of-Tensioning Tendons; Case Postale 88, CH-1015 Lausanne, Switzerland, 2006.
- Nusrath, F.R.; Satheesh, V.S.; Manigandan, M.; Suresh, B.S. An Overview on Tendon Layout for Prestressed Concrete Beams. IJISET-International Journal of Innovative Science, Engineering & Technology 2015, 2, 944. [Google Scholar]
- Rupf, M.; Fernández Ruiz, M.; Muttoni, A. Post-Tensioned Girders with Low Amounts of Shear Reinforcement: Shear Strength and Influence of Flanges. Eng Struct 2013, 56, 357–371. [Google Scholar] [CrossRef]
- Huber, P.; Huber, T.; Kollegger, J. Experimental and Theoretical Study on the Shear Behavior of Single- and Multi-Span T- and I-Shaped Post-Tensioned Beams. Structural Concrete 2020, 21, 393–408. [Google Scholar] [CrossRef]
- Ruiz, M.F.; Muttoni, A. Shear Strength of Thin-Webbed Post-Tensioned Beams. ACI Struct J 2008, 105, 308–317. [Google Scholar]
- Rana, S.; Ahsan, R. Design of Prestressed Concrete I-Girder Bridge Superstructure Using Optimization Algorithm. IABSE-JSCE Joint Conference on Advances in Bridge Engineering-II 2010, 211–223. [Google Scholar]
- Jiang, C.; Xiong, W.; Ye, J. Simplified Design Formula for the Shear Capacity of Prestressed Concrete T-Beams Strengthened by Steel Plates. KSCE Journal of Civil Engineering 2025, 29. [Google Scholar] [CrossRef]
- Huber, P.; Wien, T.U.; Huber, T.; Kollegger, J. Shear Behavior of Post-Tensioned Concrete Beams with a Low Amount of Transverse Reinforcement. In Proceedings of the fib Symposium 2016 Cape Town; Cape Town, November 1 2016.
- Hillebrand, M.; Hegger, J. Fatigue Testing of Shear Reinforcement in Prestressed Concrete T-Beams of Bridges. Applied Sciences (Switzerland) 2020, 10. [Google Scholar] [CrossRef]
- Eisa, A.S.; Kotrasova, K.; Sabol, P.; Mihaliková, M.; Attia, M.G. Experimental and Numerical Study of Strengthening Prestressed Reinforced Concrete Beams Using Different Techniques. Buildings 2024, 14. [Google Scholar] [CrossRef]
- Qi, H.; Jiang, H.; Wang, B.; Zhuge, P. Experimental Study on Shear Performance of Concrete Beams Reinforced with Externally Unbonded Prestressed CFRP Tendons. Fibers 2024, 12. [Google Scholar] [CrossRef]
- Zhao, K.; Wang, H.; Li, H.; Wei, Y.; Lu, J.; Li, G. Experimental and Numerical Analysis of Shear Performance of 16 m Full-Scale Prestressed Hollow Core Slabs. Infrastructures (Basel) 2025, 10. [Google Scholar] [CrossRef]
- Jancy, A.; Stolarski, A.; Zychowicz, J. Experimental and Numerical Research of Post-Tensioned Concrete Beams. Materials 2023, 16. [Google Scholar] [CrossRef] [PubMed]
- Lim, H.-S.; Jun, B.-K.; Shin, D.-I.; Lee, J.-Y. Shear Capacity of Post-Tensioning Pre-Stressed Concrete Beams with High Strength Stirrups. International Journal of Structural and Civil Engineering Research 2016, 4. [Google Scholar] [CrossRef]
- Mohamed, G.A.; Eisa, A.S.; Purcz, P.; Ručinský, R.; El-Feky, M.H. Effect of External Tendon Profile on Improving Structural Performance of RC Beams. Buildings 2022, 12. [Google Scholar] [CrossRef]
- Yaqub, M.A.; Czaderski, C.; Matthys, S. Shear Strengthening of Precast Prestressed Bridge I-Girders Using Shape Memory Reinforcement. Eng Struct 2024, 305, 1–15. [Google Scholar] [CrossRef]
- Wang, L.; Hu, Z.; Yi, J.; Dai, L.; Ma, Y.; Zhang, X. Shear Behavior of Corroded Post-Tensioned Prestressed Concrete Beams with Full/Insufficient Grouting. KSCE Journal of Civil Engineering 2020, 24, 1881–1892. [Google Scholar] [CrossRef]
- Peng, F.; Xue, W. Experimental Investigation on Shear Behavior of FRP Post-Tensioned Concrete Beams without Stirrups. Eng Struct 2021, 244, 1–14. [Google Scholar] [CrossRef]
- Qi, J.; Ma, Z.J.; Wang, J.; Bao, Y. Post-Cracking Shear Behaviour of Concrete Beams Strengthened with Externally Prestresssed Tendons. Structures 2020, 23, 214–224. [Google Scholar] [CrossRef]
- Jiang, C.; Xiong, W.; Ye, J. Simplified Design Formula for the Shear Capacity of Prestressed Concrete T-Beams Strengthened by Steel Plates. KSCE Journal of Civil Engineering 2025, 29. [Google Scholar] [CrossRef]
- Ahmed, G.H.; Aziz, O.Q. Shear Behavior of Dry and Epoxied Joints in Precast Concrete Segmental Box Girder Bridges under Direct Shear Loading. Eng Struct 2019, 182, 89–100. [Google Scholar] [CrossRef]
- Ahmed, G.H.; Aziz, O.Q. Influence of Intensity & Eccentricity of Posttensioning Force and Concrete Strength on Shear Behavior of Epoxied Joints in Segmental Box Girder Bridges. Constr Build Mater 2019, 197, 117–129. [Google Scholar] [CrossRef]
- Ng, P.L.; Kwan, A.K.H. Practical Determination of Prestress Tendon Profile by Load-Balancing Method. HKIE Transactions Hong Kong Institution of Engineers 2006, 13, 27–35. [Google Scholar] [CrossRef]
- Jagarapu, D.C.K.; Venkat, L. Genetic Algorithm Based Optimum Design of Prestressed Concrete Beam. International Journal for Computational Civil and Structural Engineering 2013, 3, 644–654. [Google Scholar]
- Khan, A.A.; Pathak, K.K.; Dindorkar, N. CABLE LAYOUT DESIGN OF ONE WAY PRESTRESSED SLABS USING FEM. Journal of Engineering, Science and Management Education 2010, 2, 34–41. [Google Scholar]
- Colajanni, P.; Recupero, A.; Spinella, N. Design Procedure for Prestressed Concrete Beams. Computers and Concrete 2014, 13, 235–253. [Google Scholar] [CrossRef]
- Dixit, A.S.; Khurd, V.G. Effect of Prestressing Force, Cable Profile and Eccentricity on Post Tensioned Beam. International Research Journal of Engineering and Technology 2017, 4, 626–632. [Google Scholar]
- Naser, A.F. Optimum Design of Vertical Steel Tendons Profile Layout of Post-Tensioning Concrete Bridges: Fem Static Analysis. ARPN Journal of Engineering and Applied Sciences 2018, 13, 9244–9256. [Google Scholar]
- Yakov, Z.; Amir, O. Layout Optimization of Post-Tensioned Cables in Concrete Slabs. Structural and Multidisciplinary Optimization 2021, 63, 1–25. [Google Scholar] [CrossRef]
- Rani, U.M. Effect of Tendon Profile on Deflections in Prestressed Concrete Beams Using C Programme. International Journal of Computer Science and Engineering 2021, 8, 6–8. [Google Scholar] [CrossRef]
- Mohamed, G.A.; Eisa, A.S.; Purcz, P.; Ručinský, R.; El-Feky, M.H. Effect of External Tendon Profile on Improving Structural Performance of RC Beams. Buildings 2022, 12, 1–16. [Google Scholar] [CrossRef]
- Huber, P.; Wien, T.U.; Huber, P.; Kollegger, J. Shear Strength of Post-Tensioned Concrete Girders with Minimum Shear Reinforcement. In Proceedings of the 11th CCC Congress HAINBURG 2015; 2015.
- Fakhrulddin Abdullah, A.; Burhan Al-Deen Abdul-Rahman, M.; Abbas Al-Attar, A. Investigate the Mechanical Characteristics and Microstructure Of-Geopolymer Concrete Exposure to High Temperatures. Journal of Rehabilitation in Civil Engineering v-n (year) 2025, 1. [Google Scholar]
- Husain, H.M.; Oukaili, N. k.; Jomaa’h, M.M. EFFECT OF PRESTRESSING FORCE ON TORSION RESISTANCE OF CONCRETE BEAMS. Journal of Engineering 2007, 13, 1902–1918. [Google Scholar]
Figure 1.
Sika ViscoCrete 1681.

Figure 2.
(a) Concrete splitting tensile strength test. (b) Concrete Prism test.
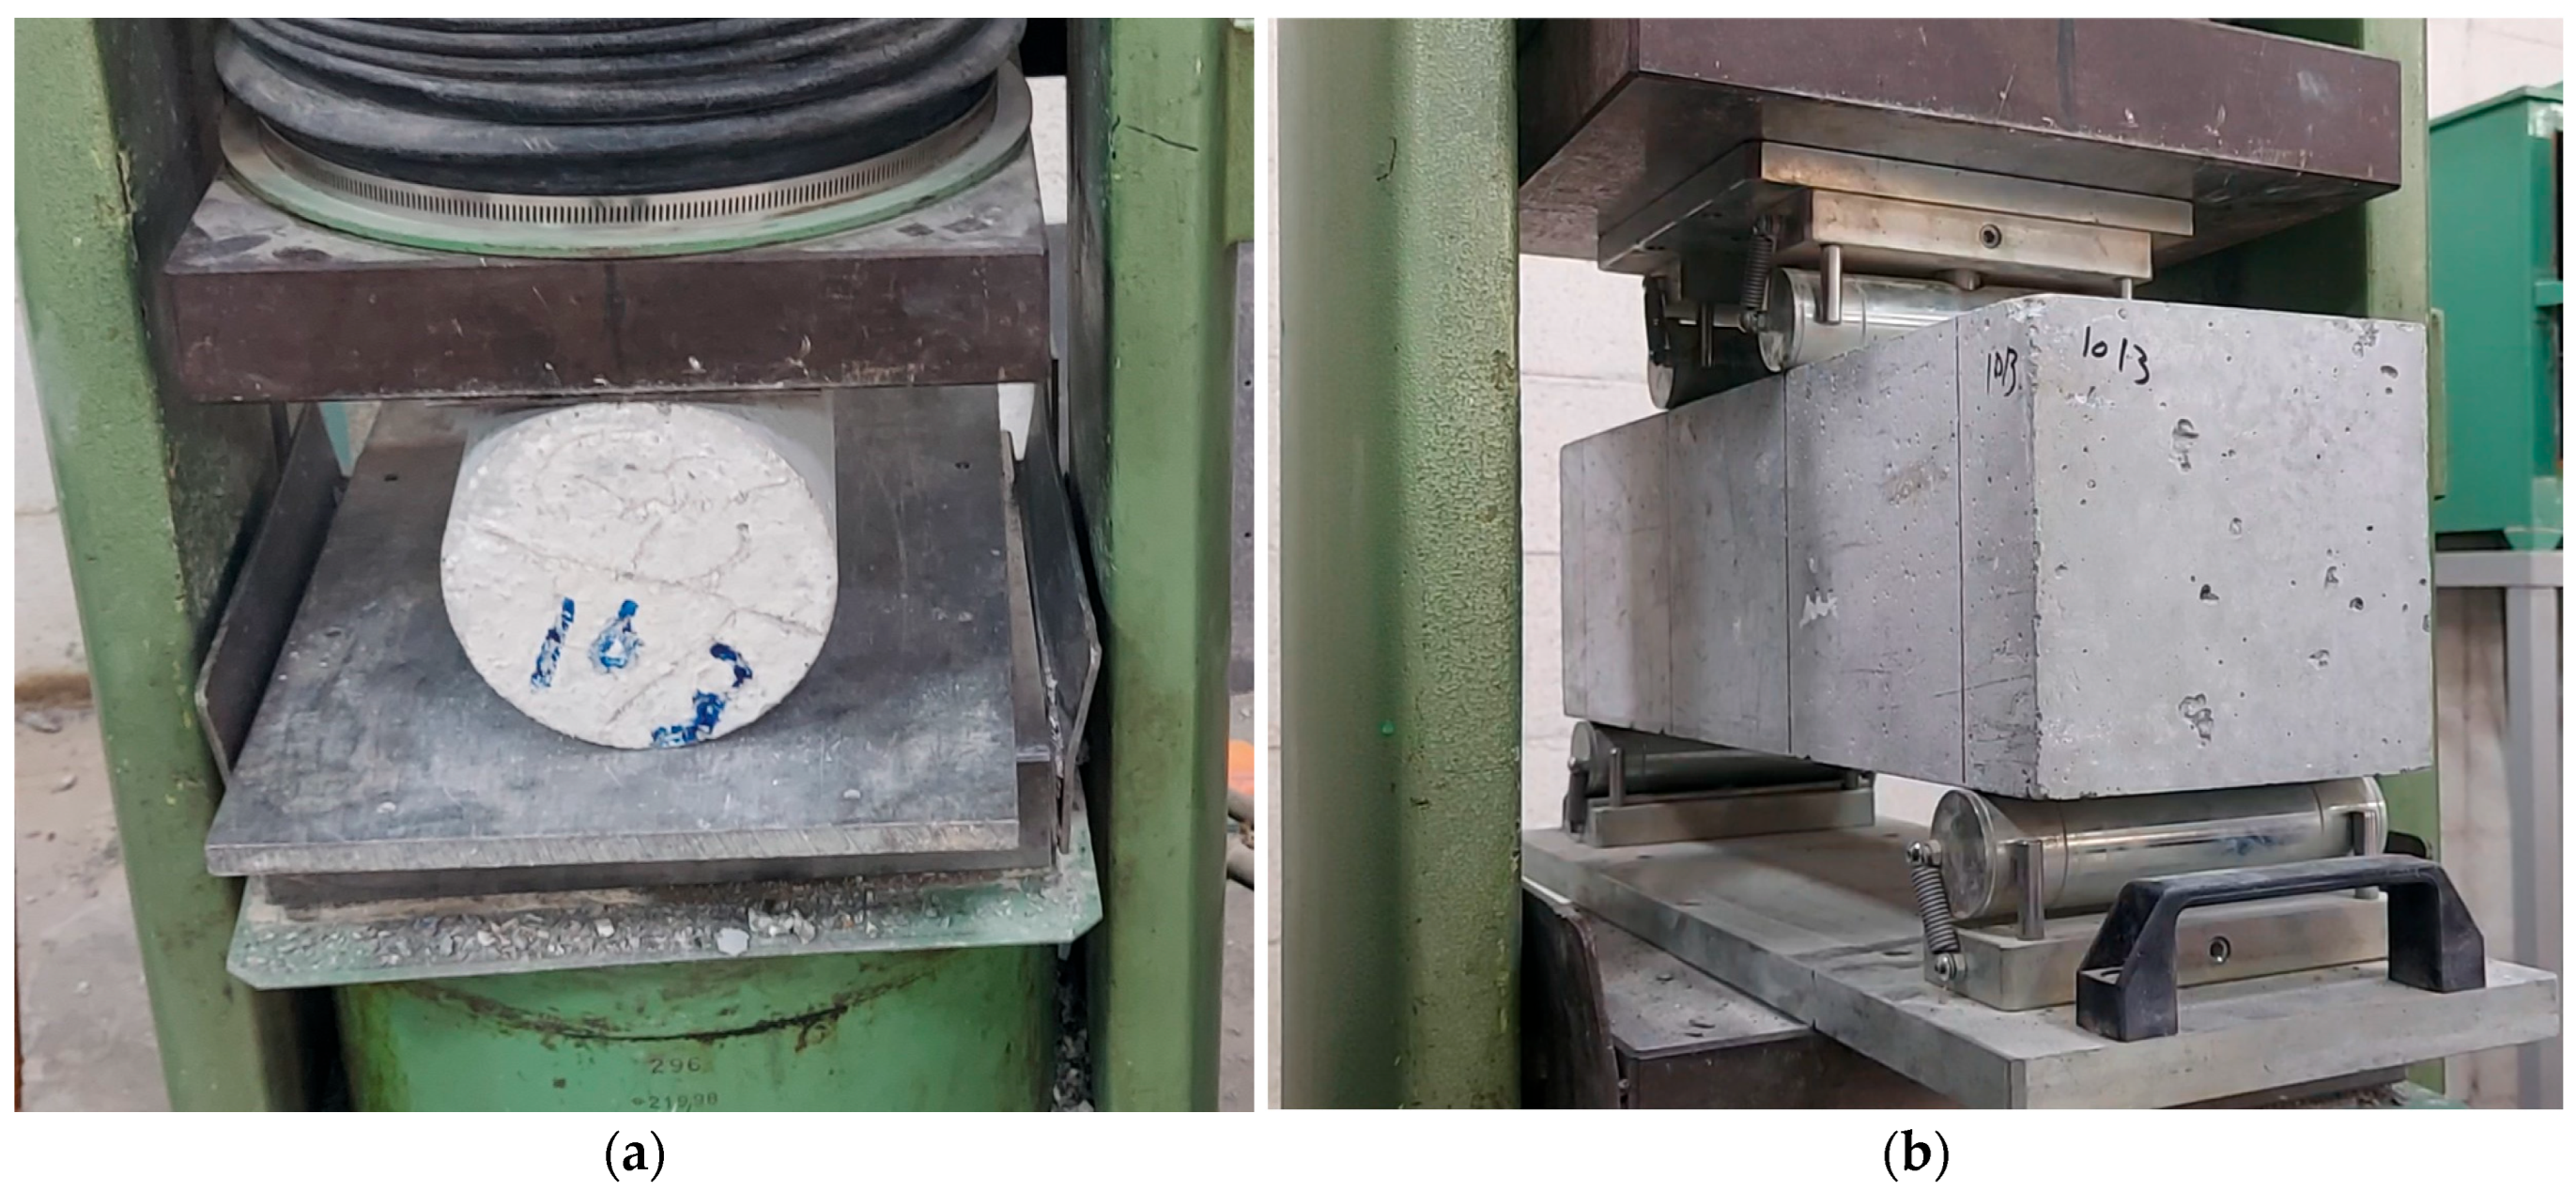
Figure 3.
Concrete static modulus of elasticity test.
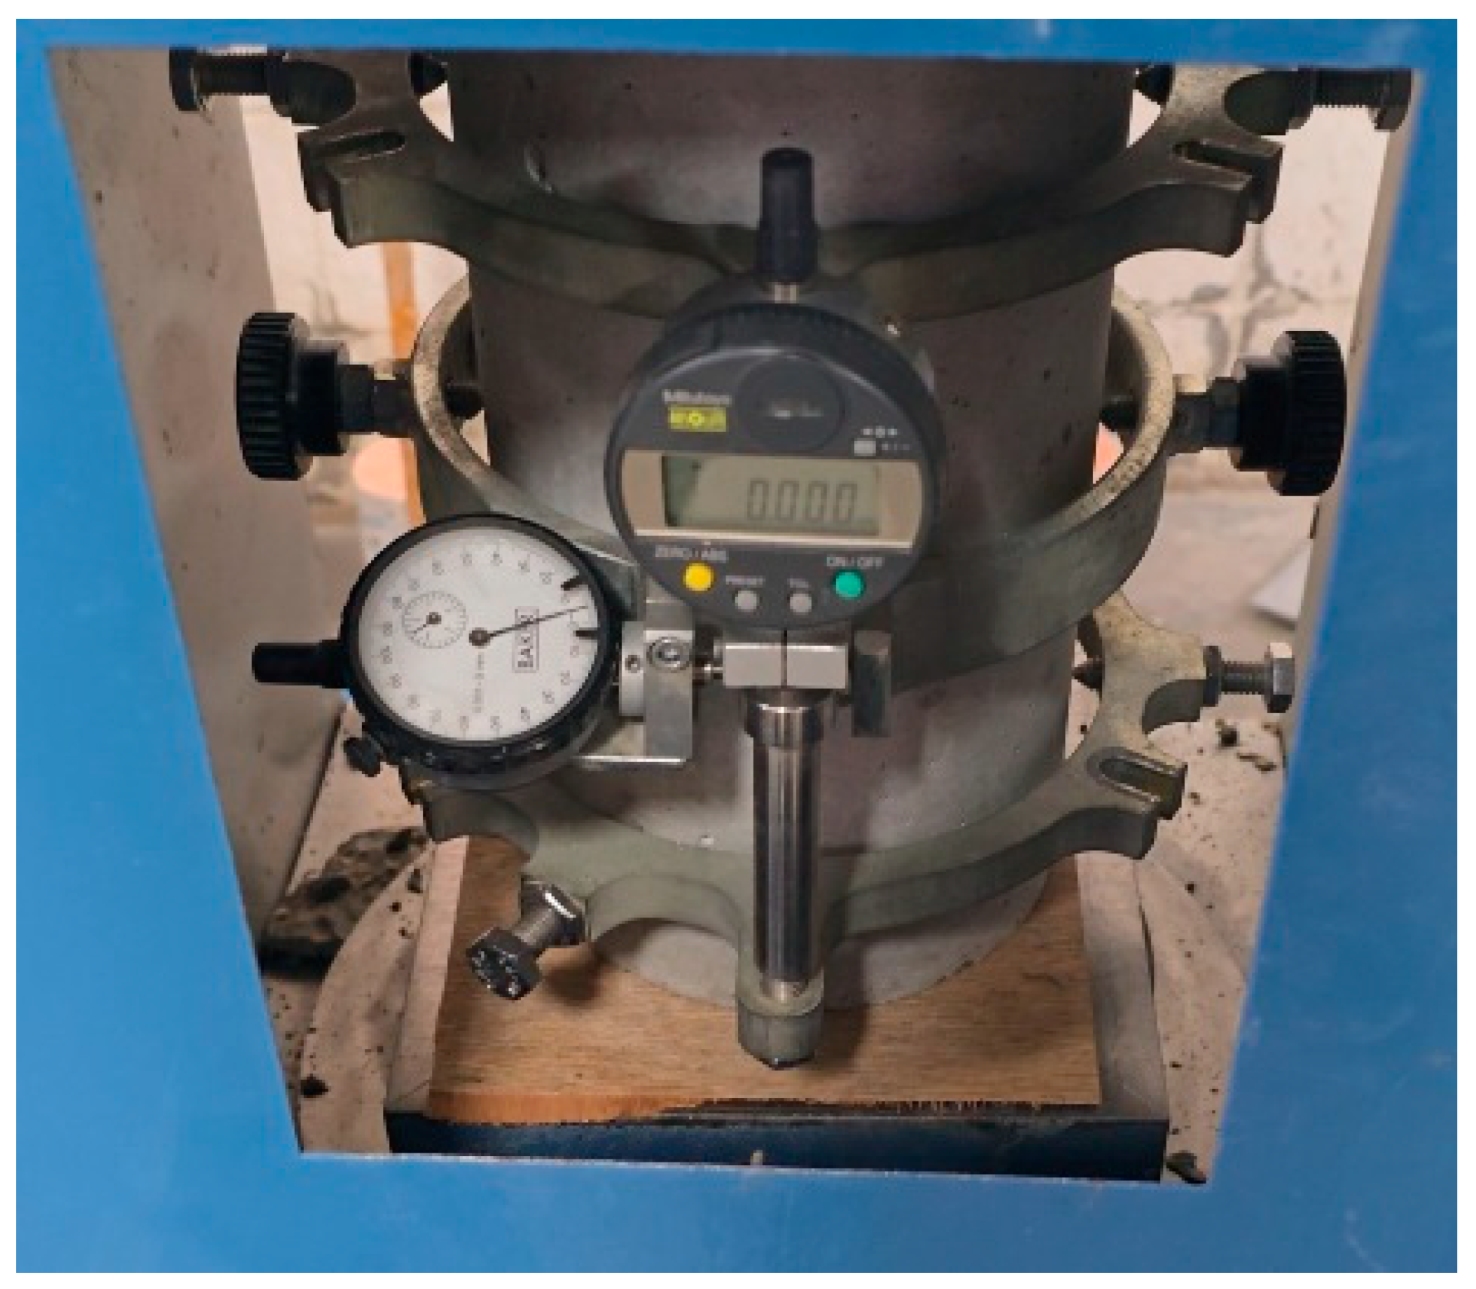
Figure 4.
Tested specimens dimension details.
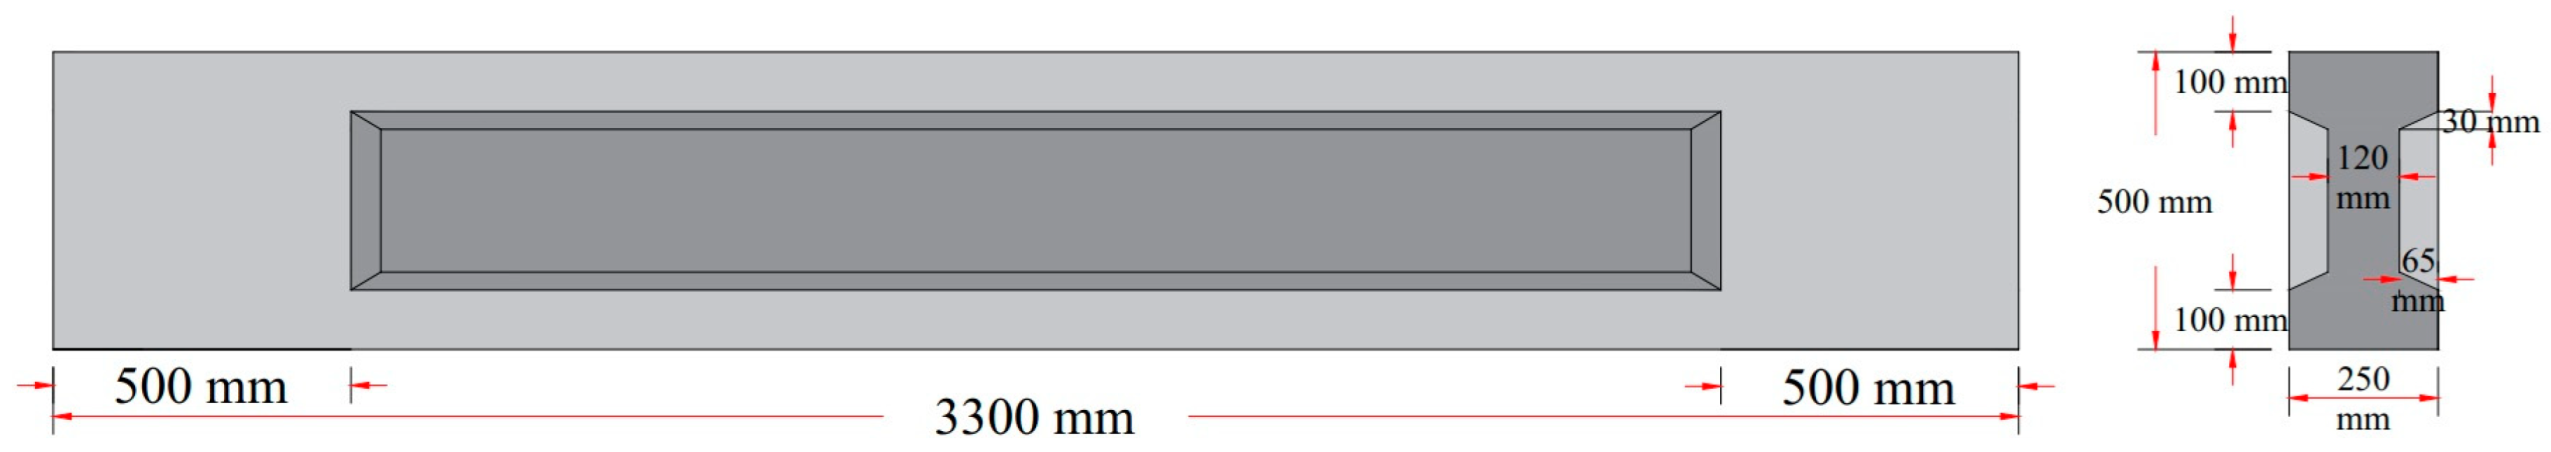
Figure 5.
Detail of reinforcement.
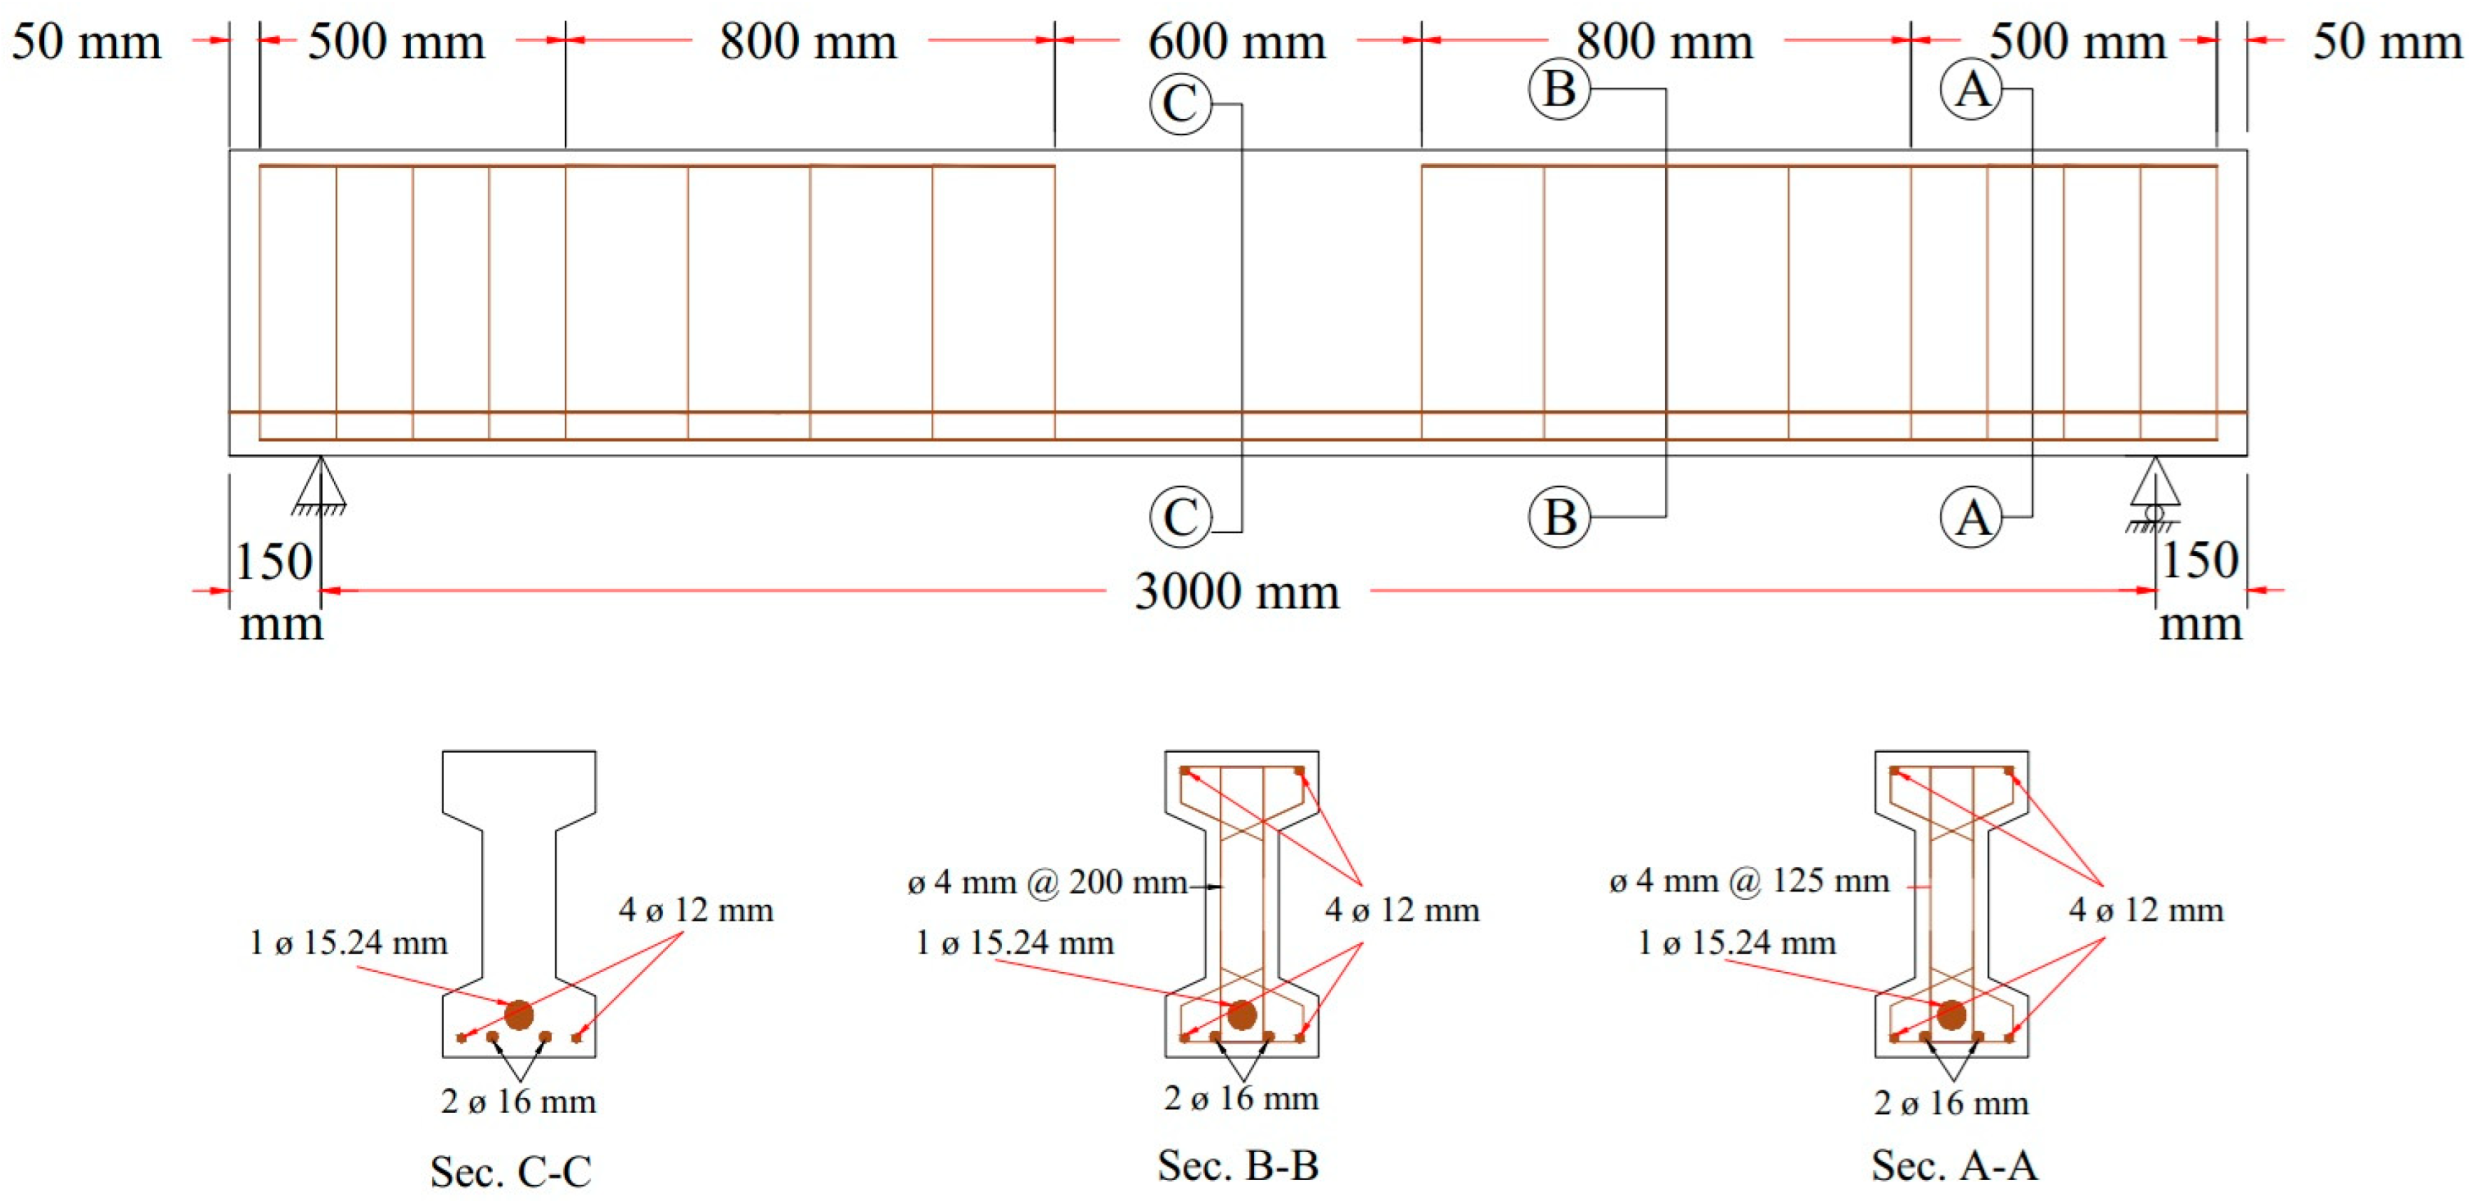
Figure 6.
Specimen preparation detail: (a) Specimen preparation detail, (b) plastic duct, and (c) End block spiral.
Figure 6.
Specimen preparation detail: (a) Specimen preparation detail, (b) plastic duct, and (c) End block spiral.
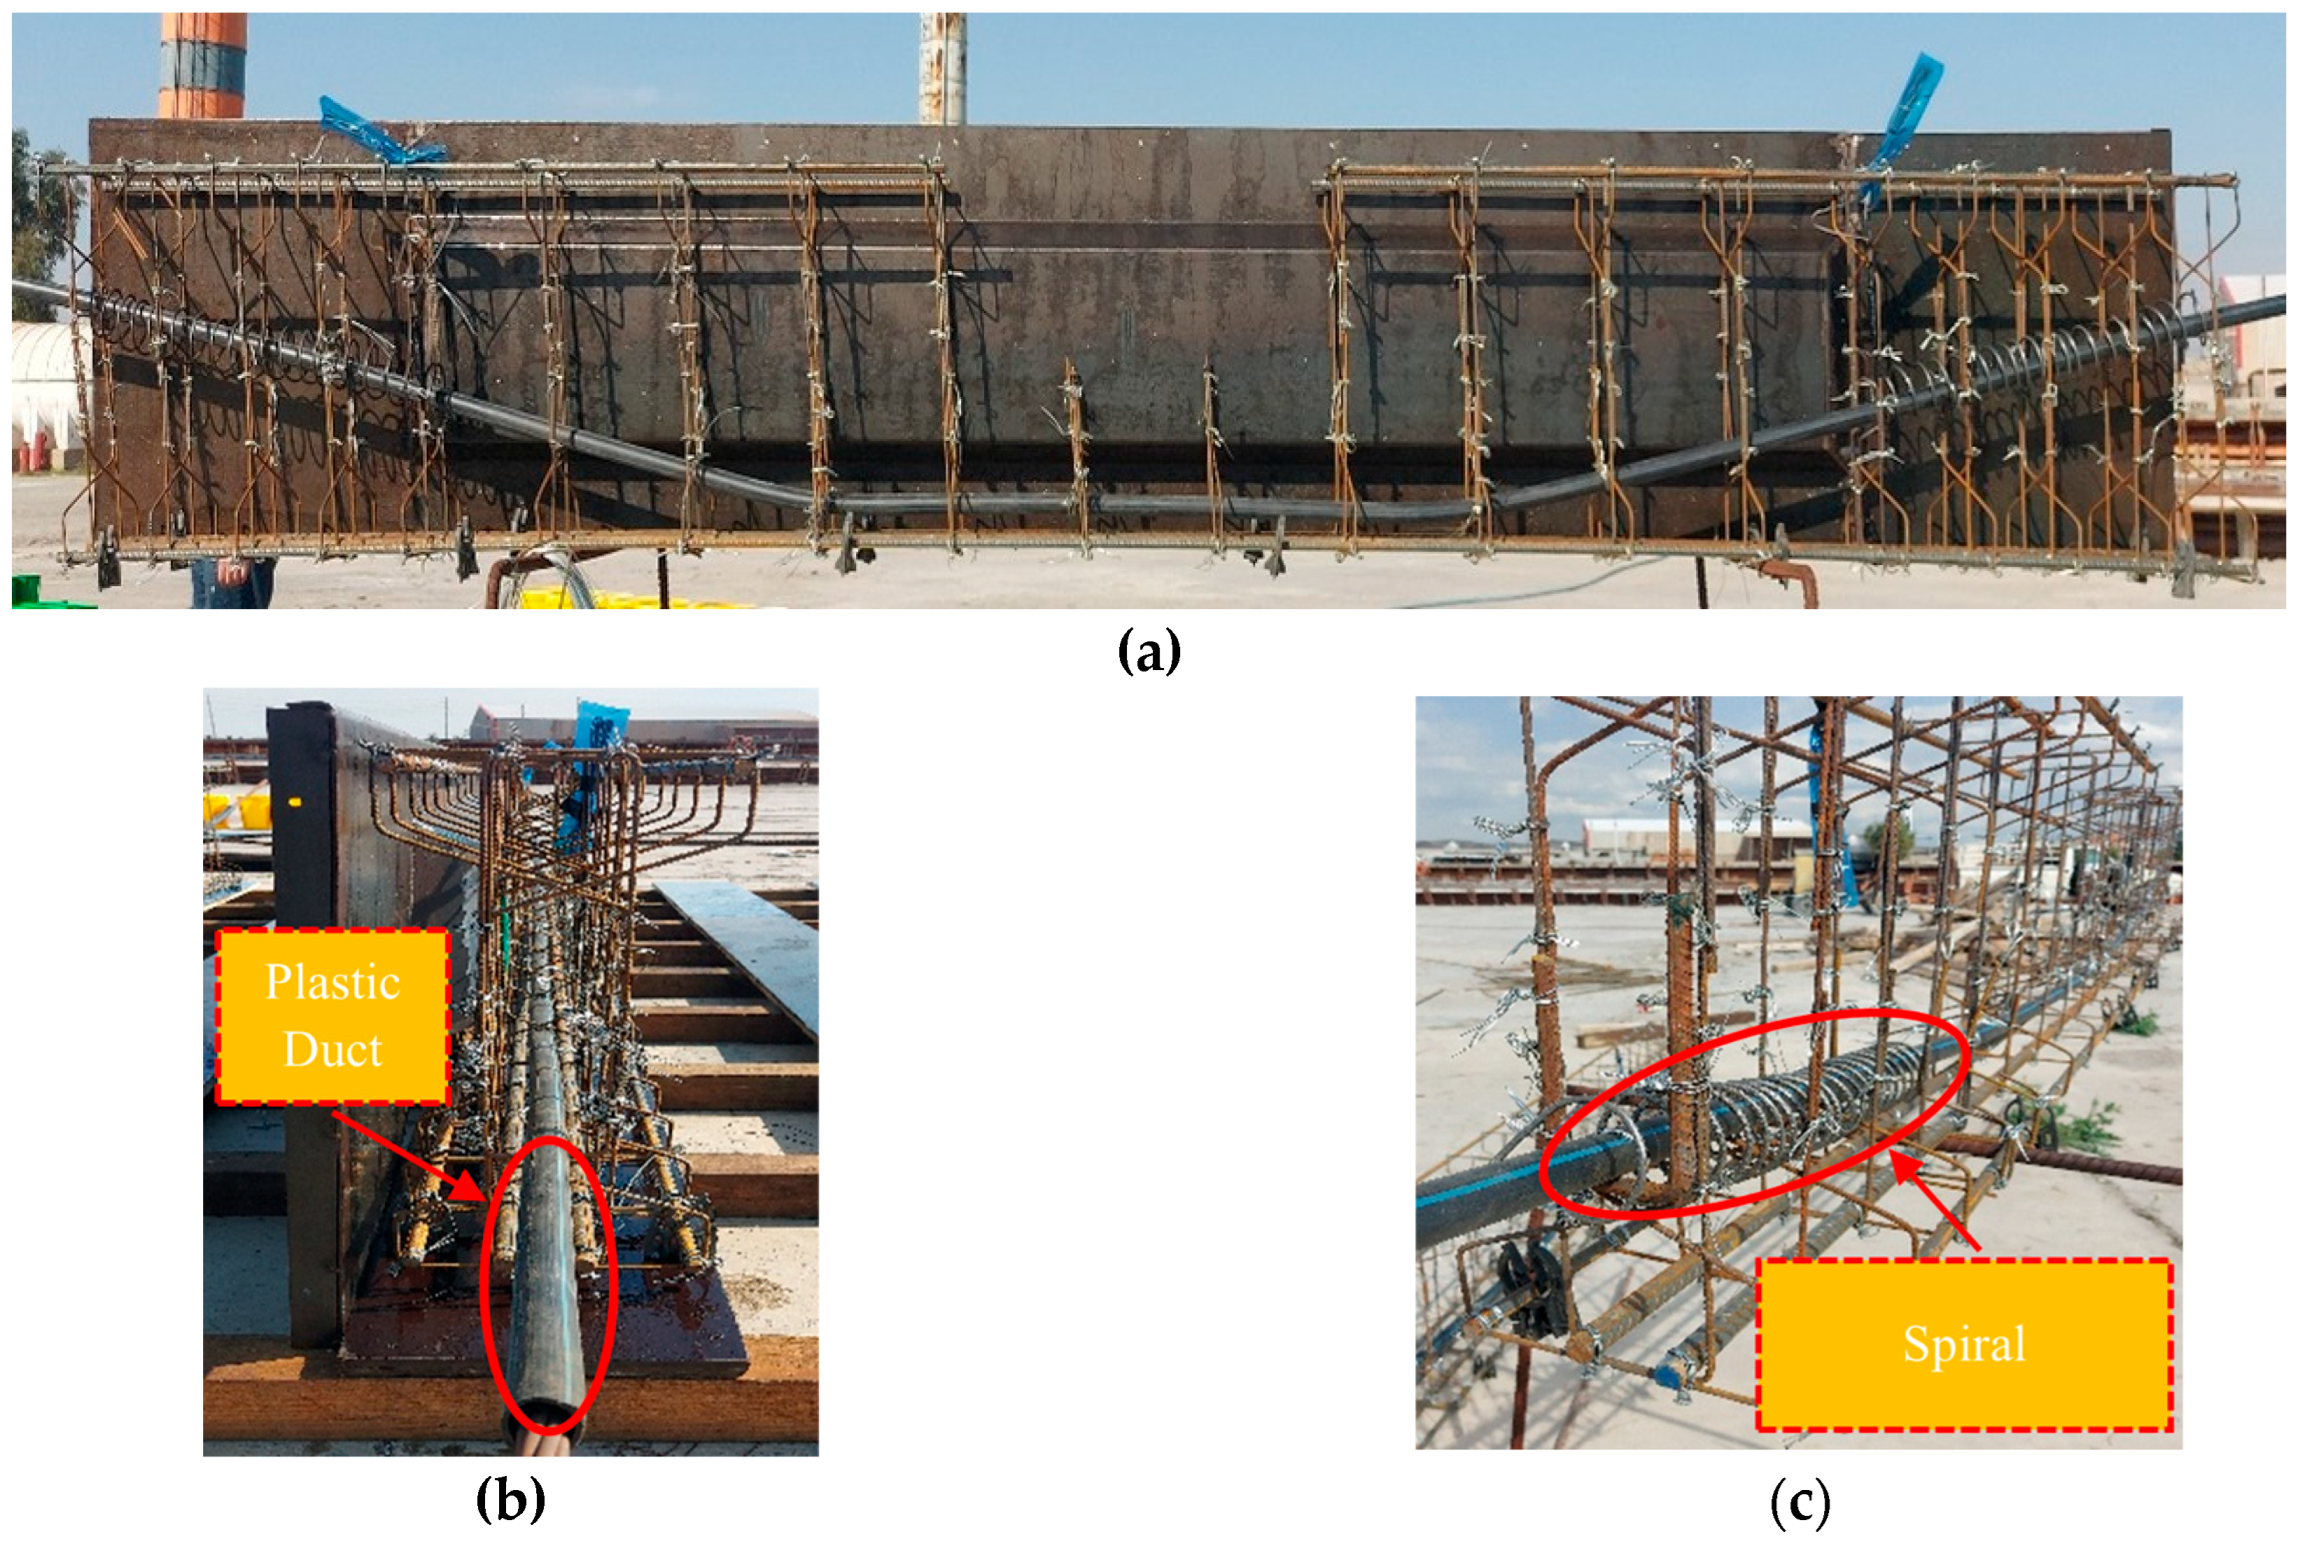
Figure 7.
The manufacturing of beams: (a) mold. (b) curing process.
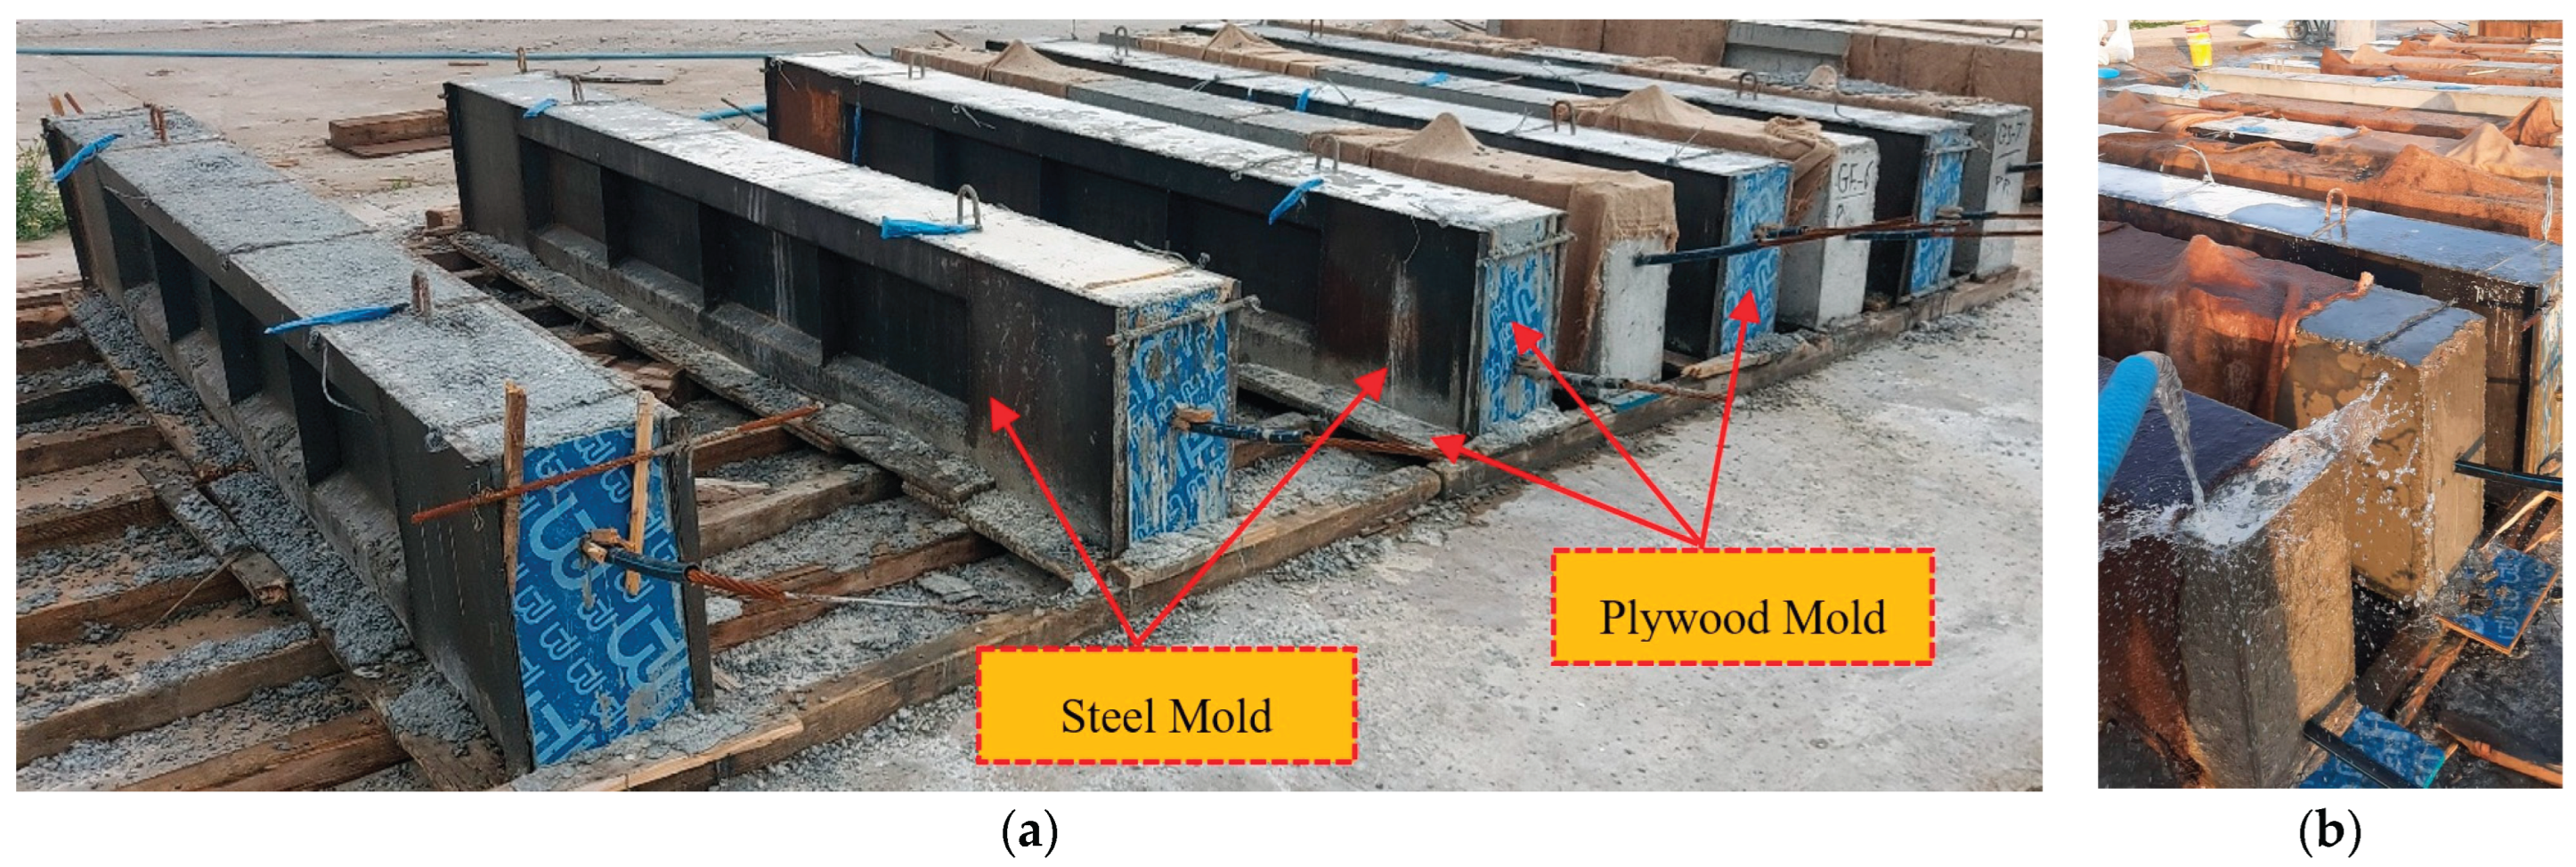
Figure 10.
Tested specimens preparation: (a) tested set up, (b) testing device)\, and (c) tested beams.
Figure 10.
Tested specimens preparation: (a) tested set up, (b) testing device)\, and (c) tested beams.
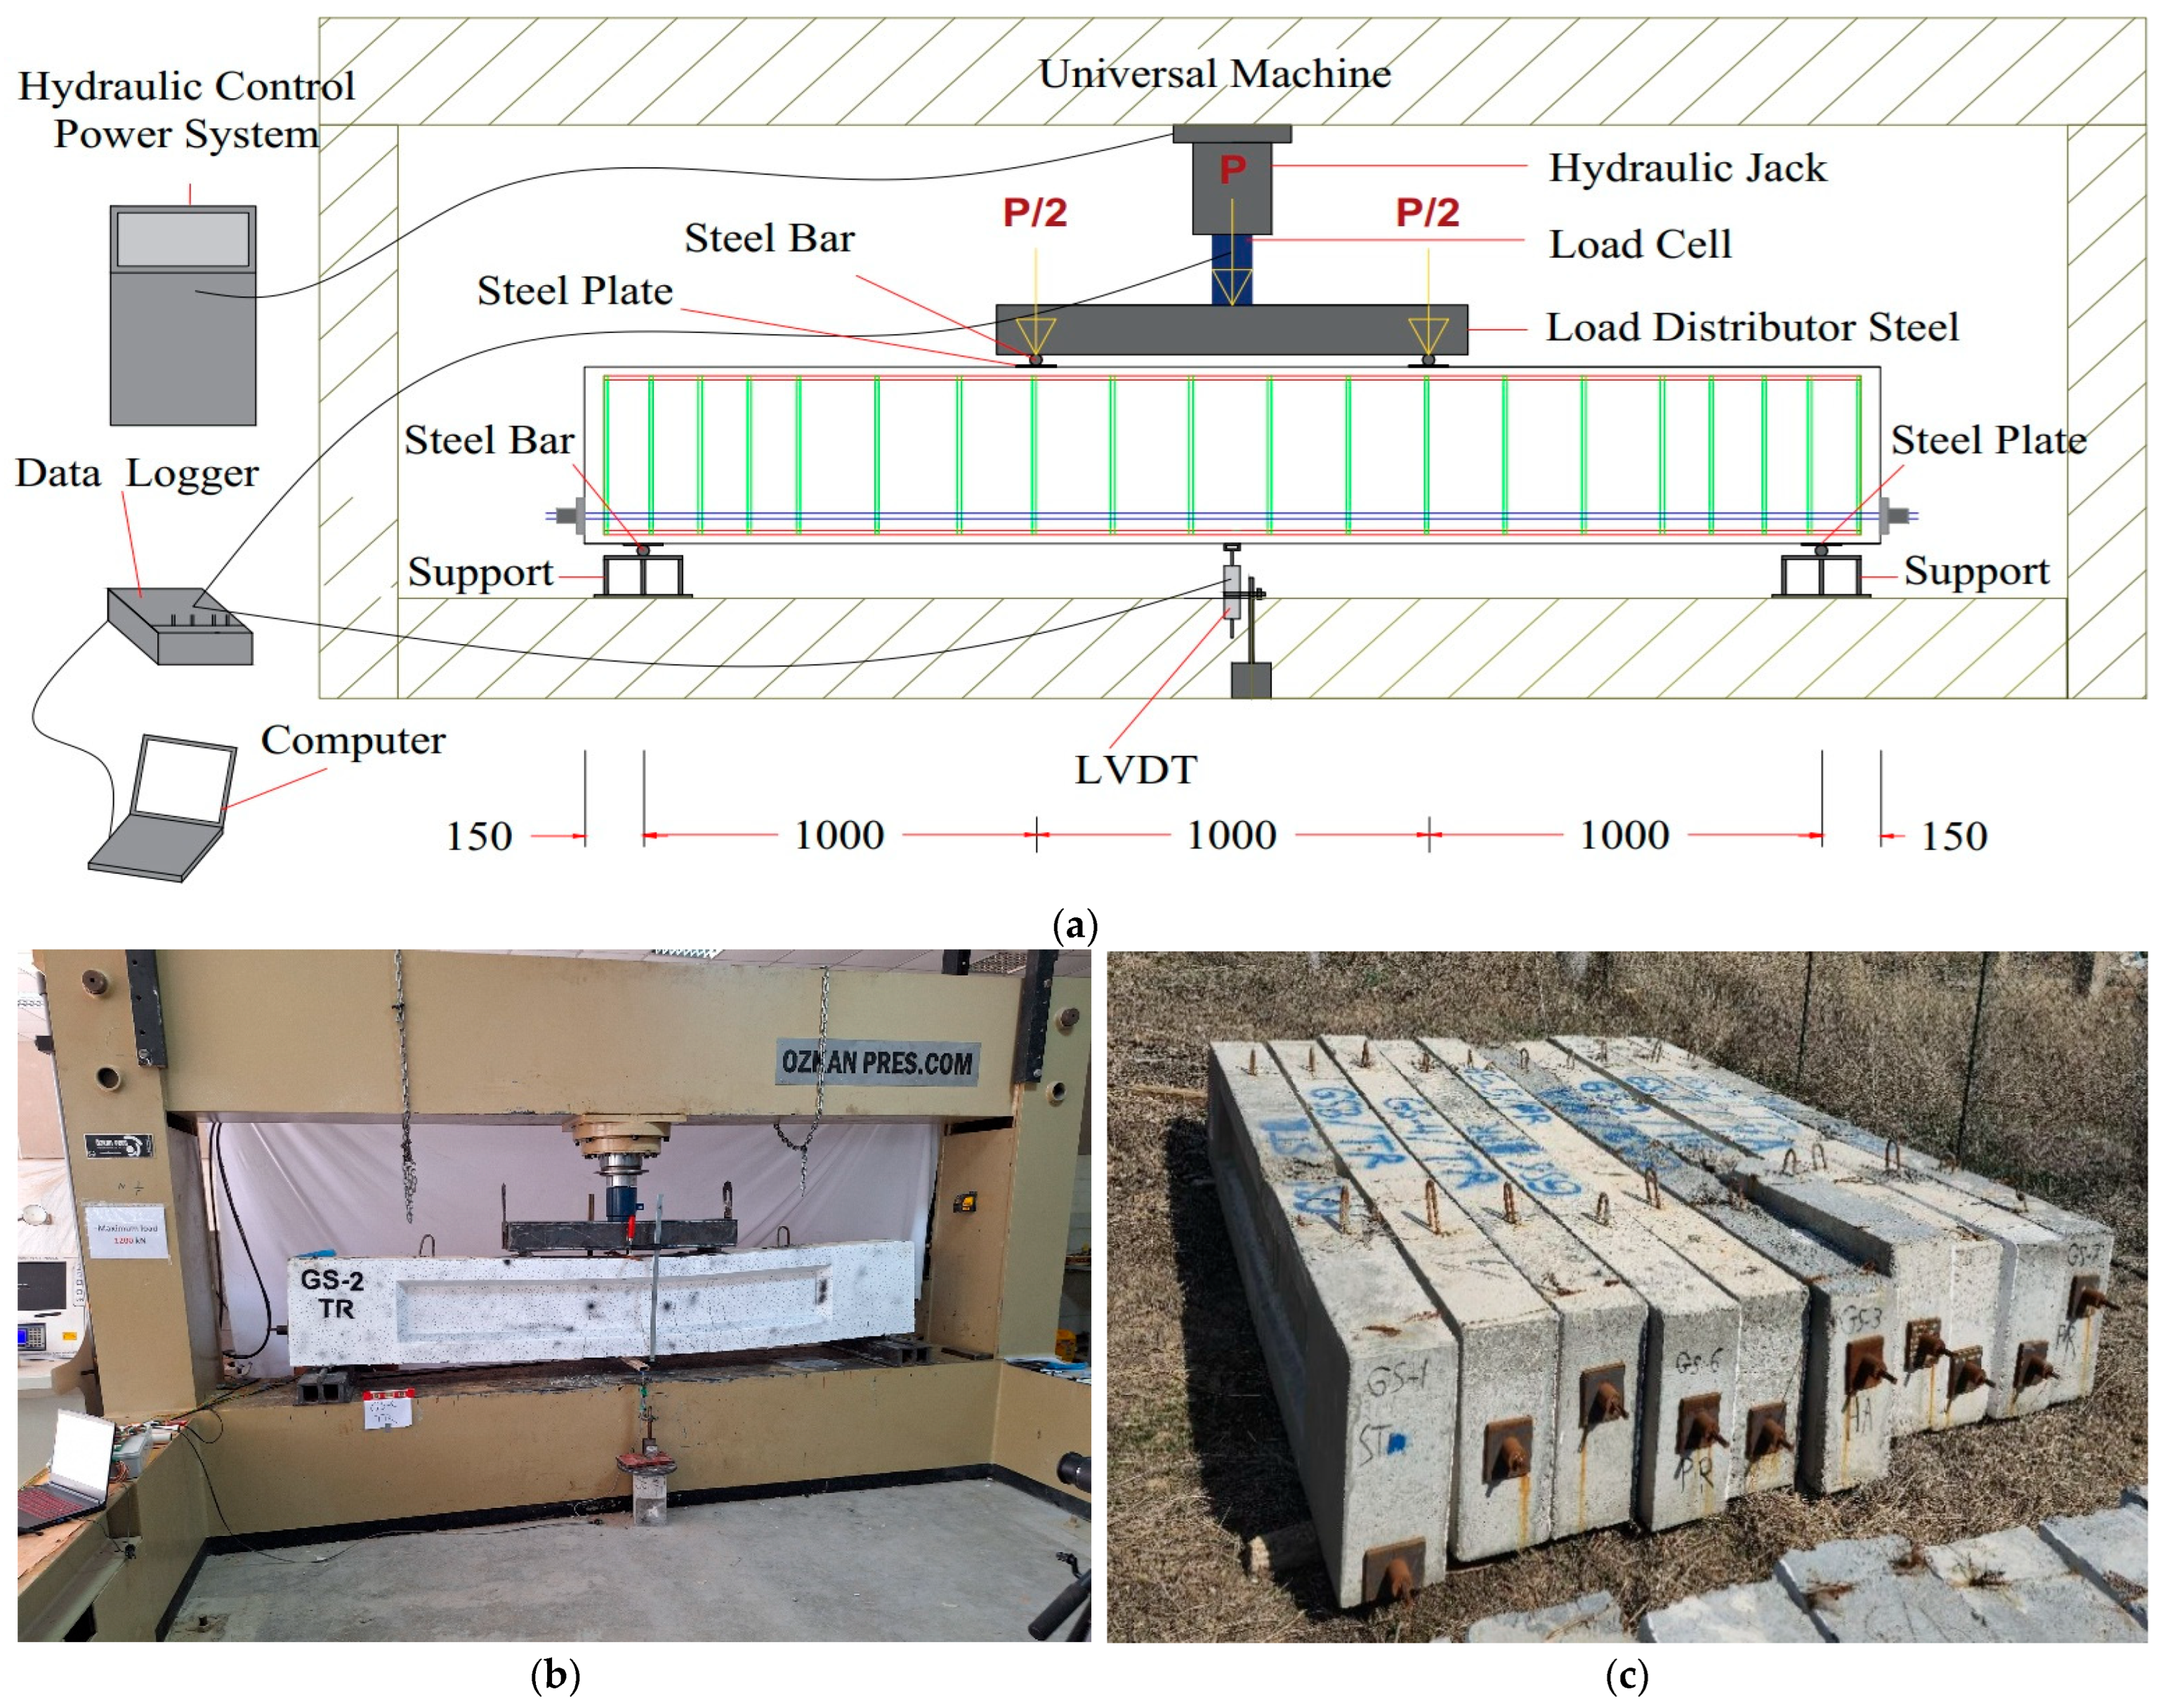
Figure 11.
Load vs. Deflection relationship for tested beam specimens.
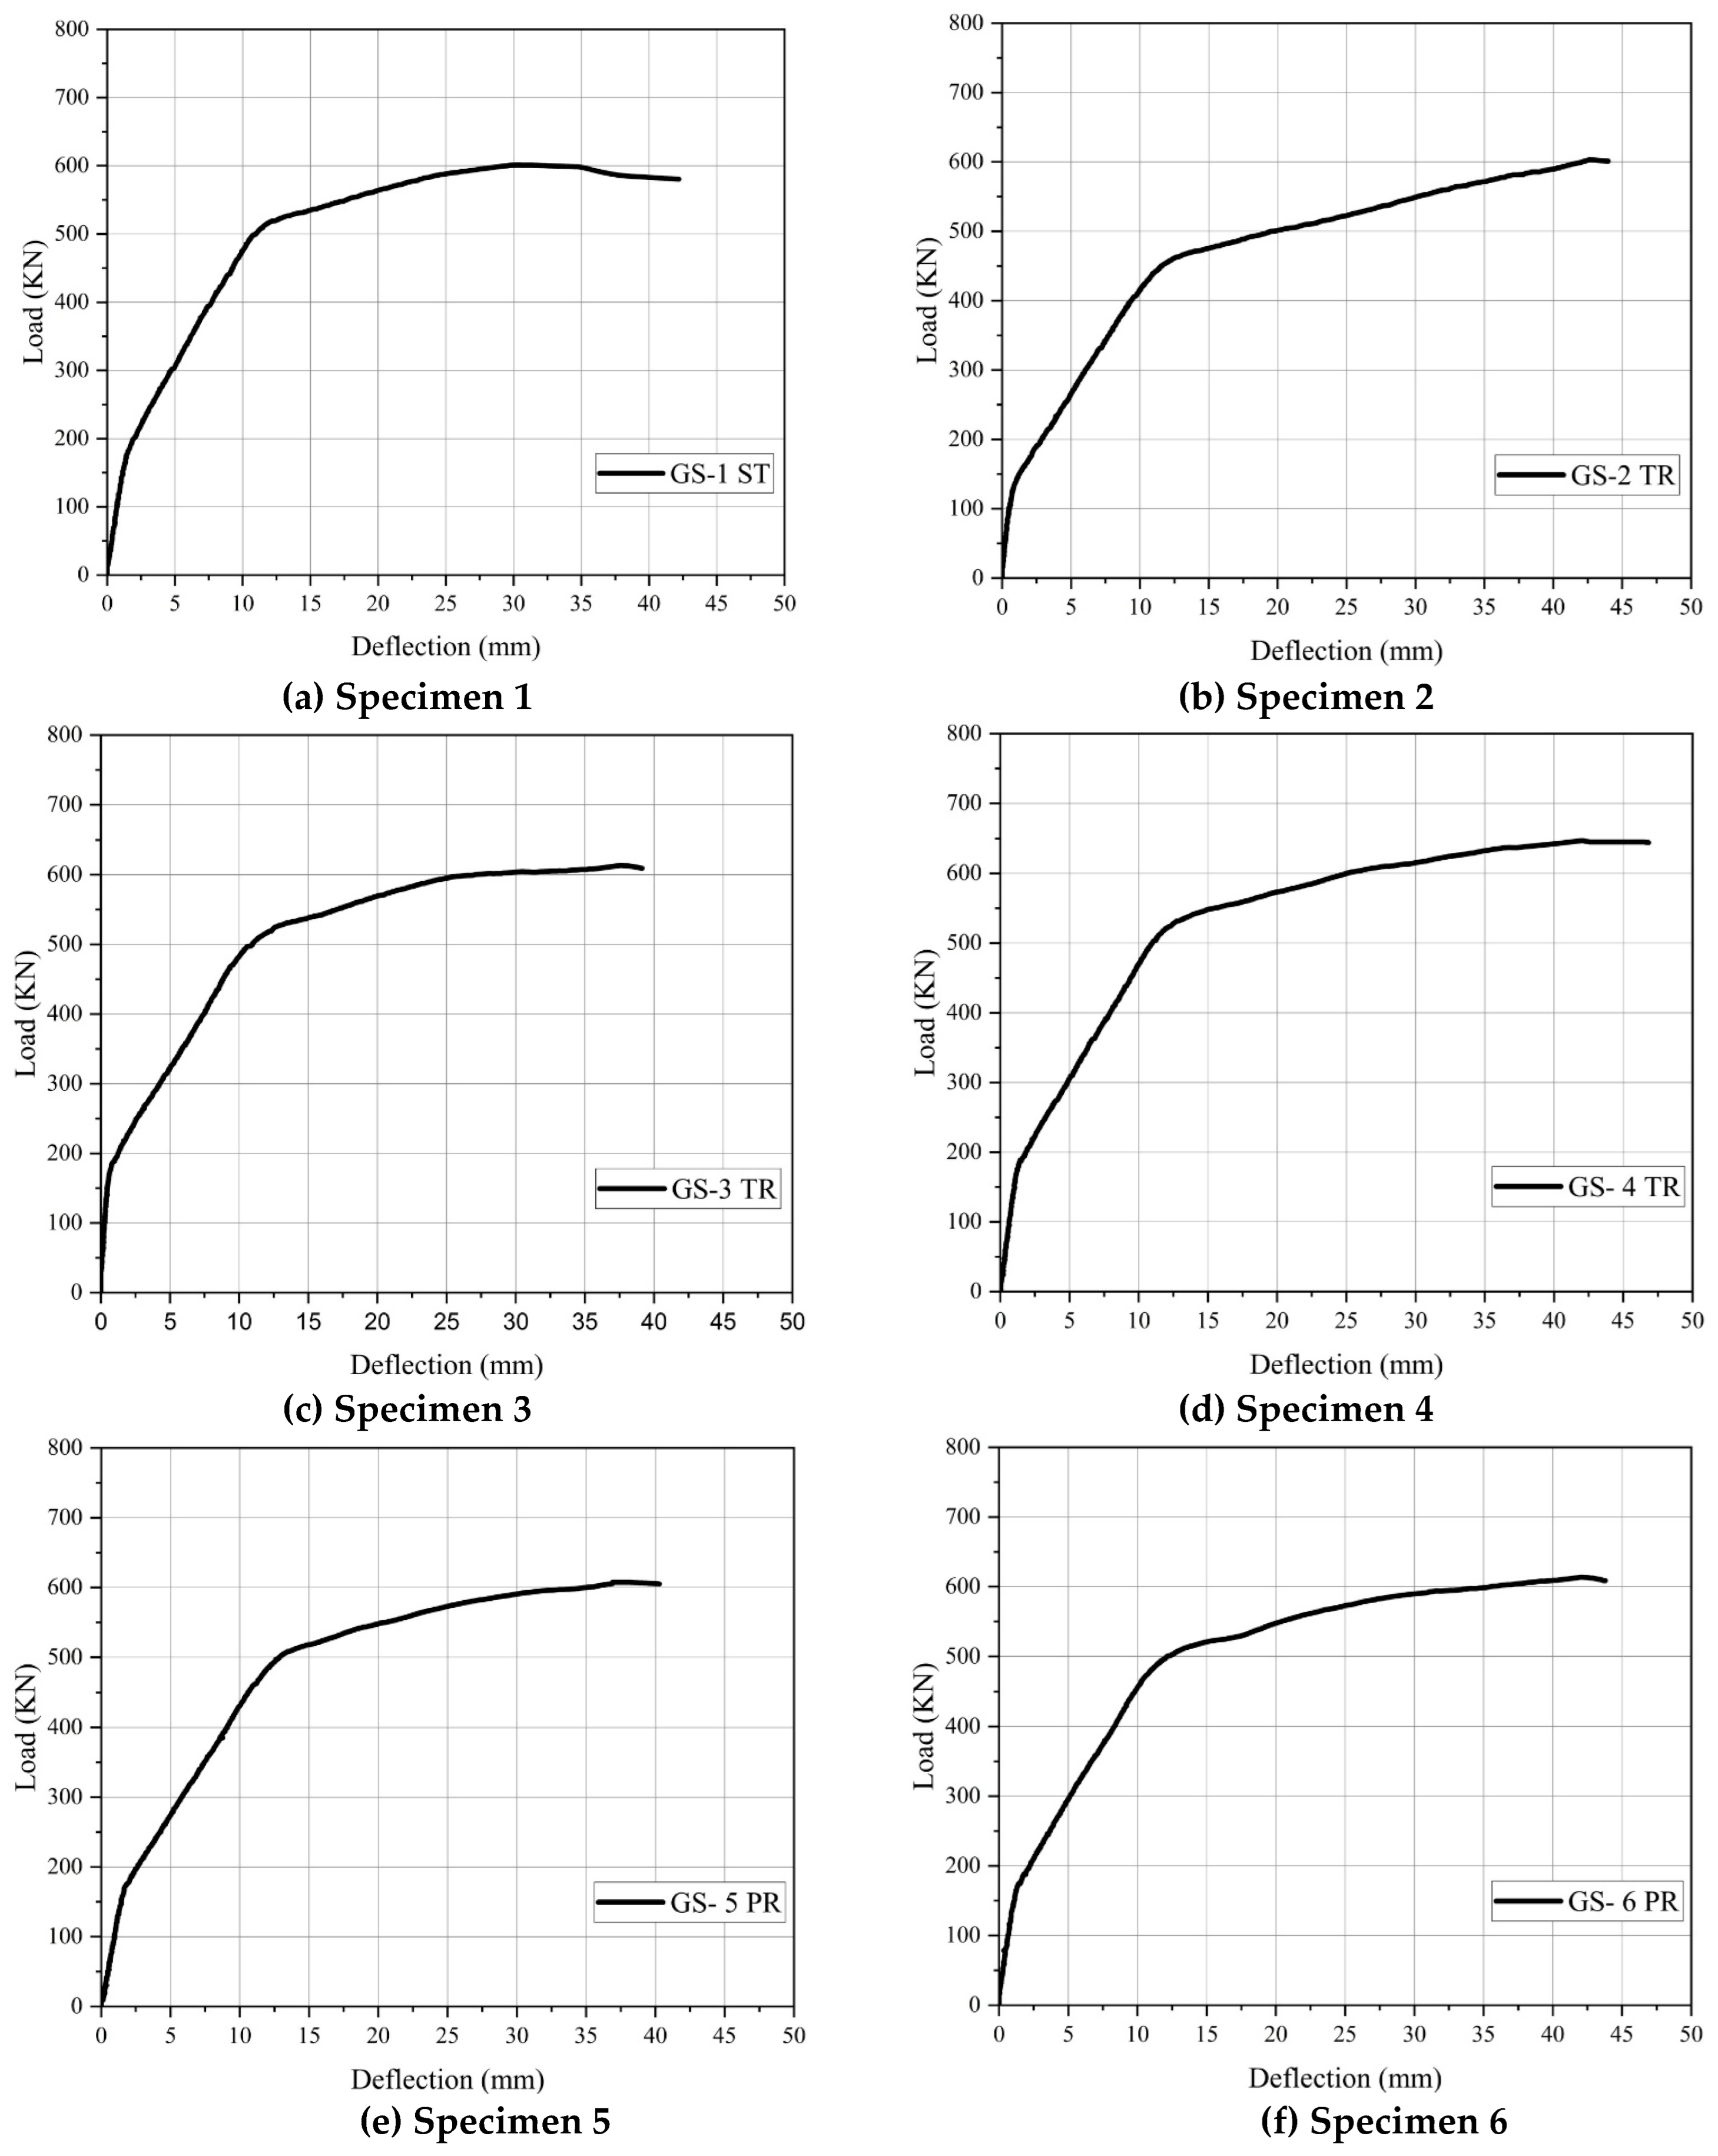
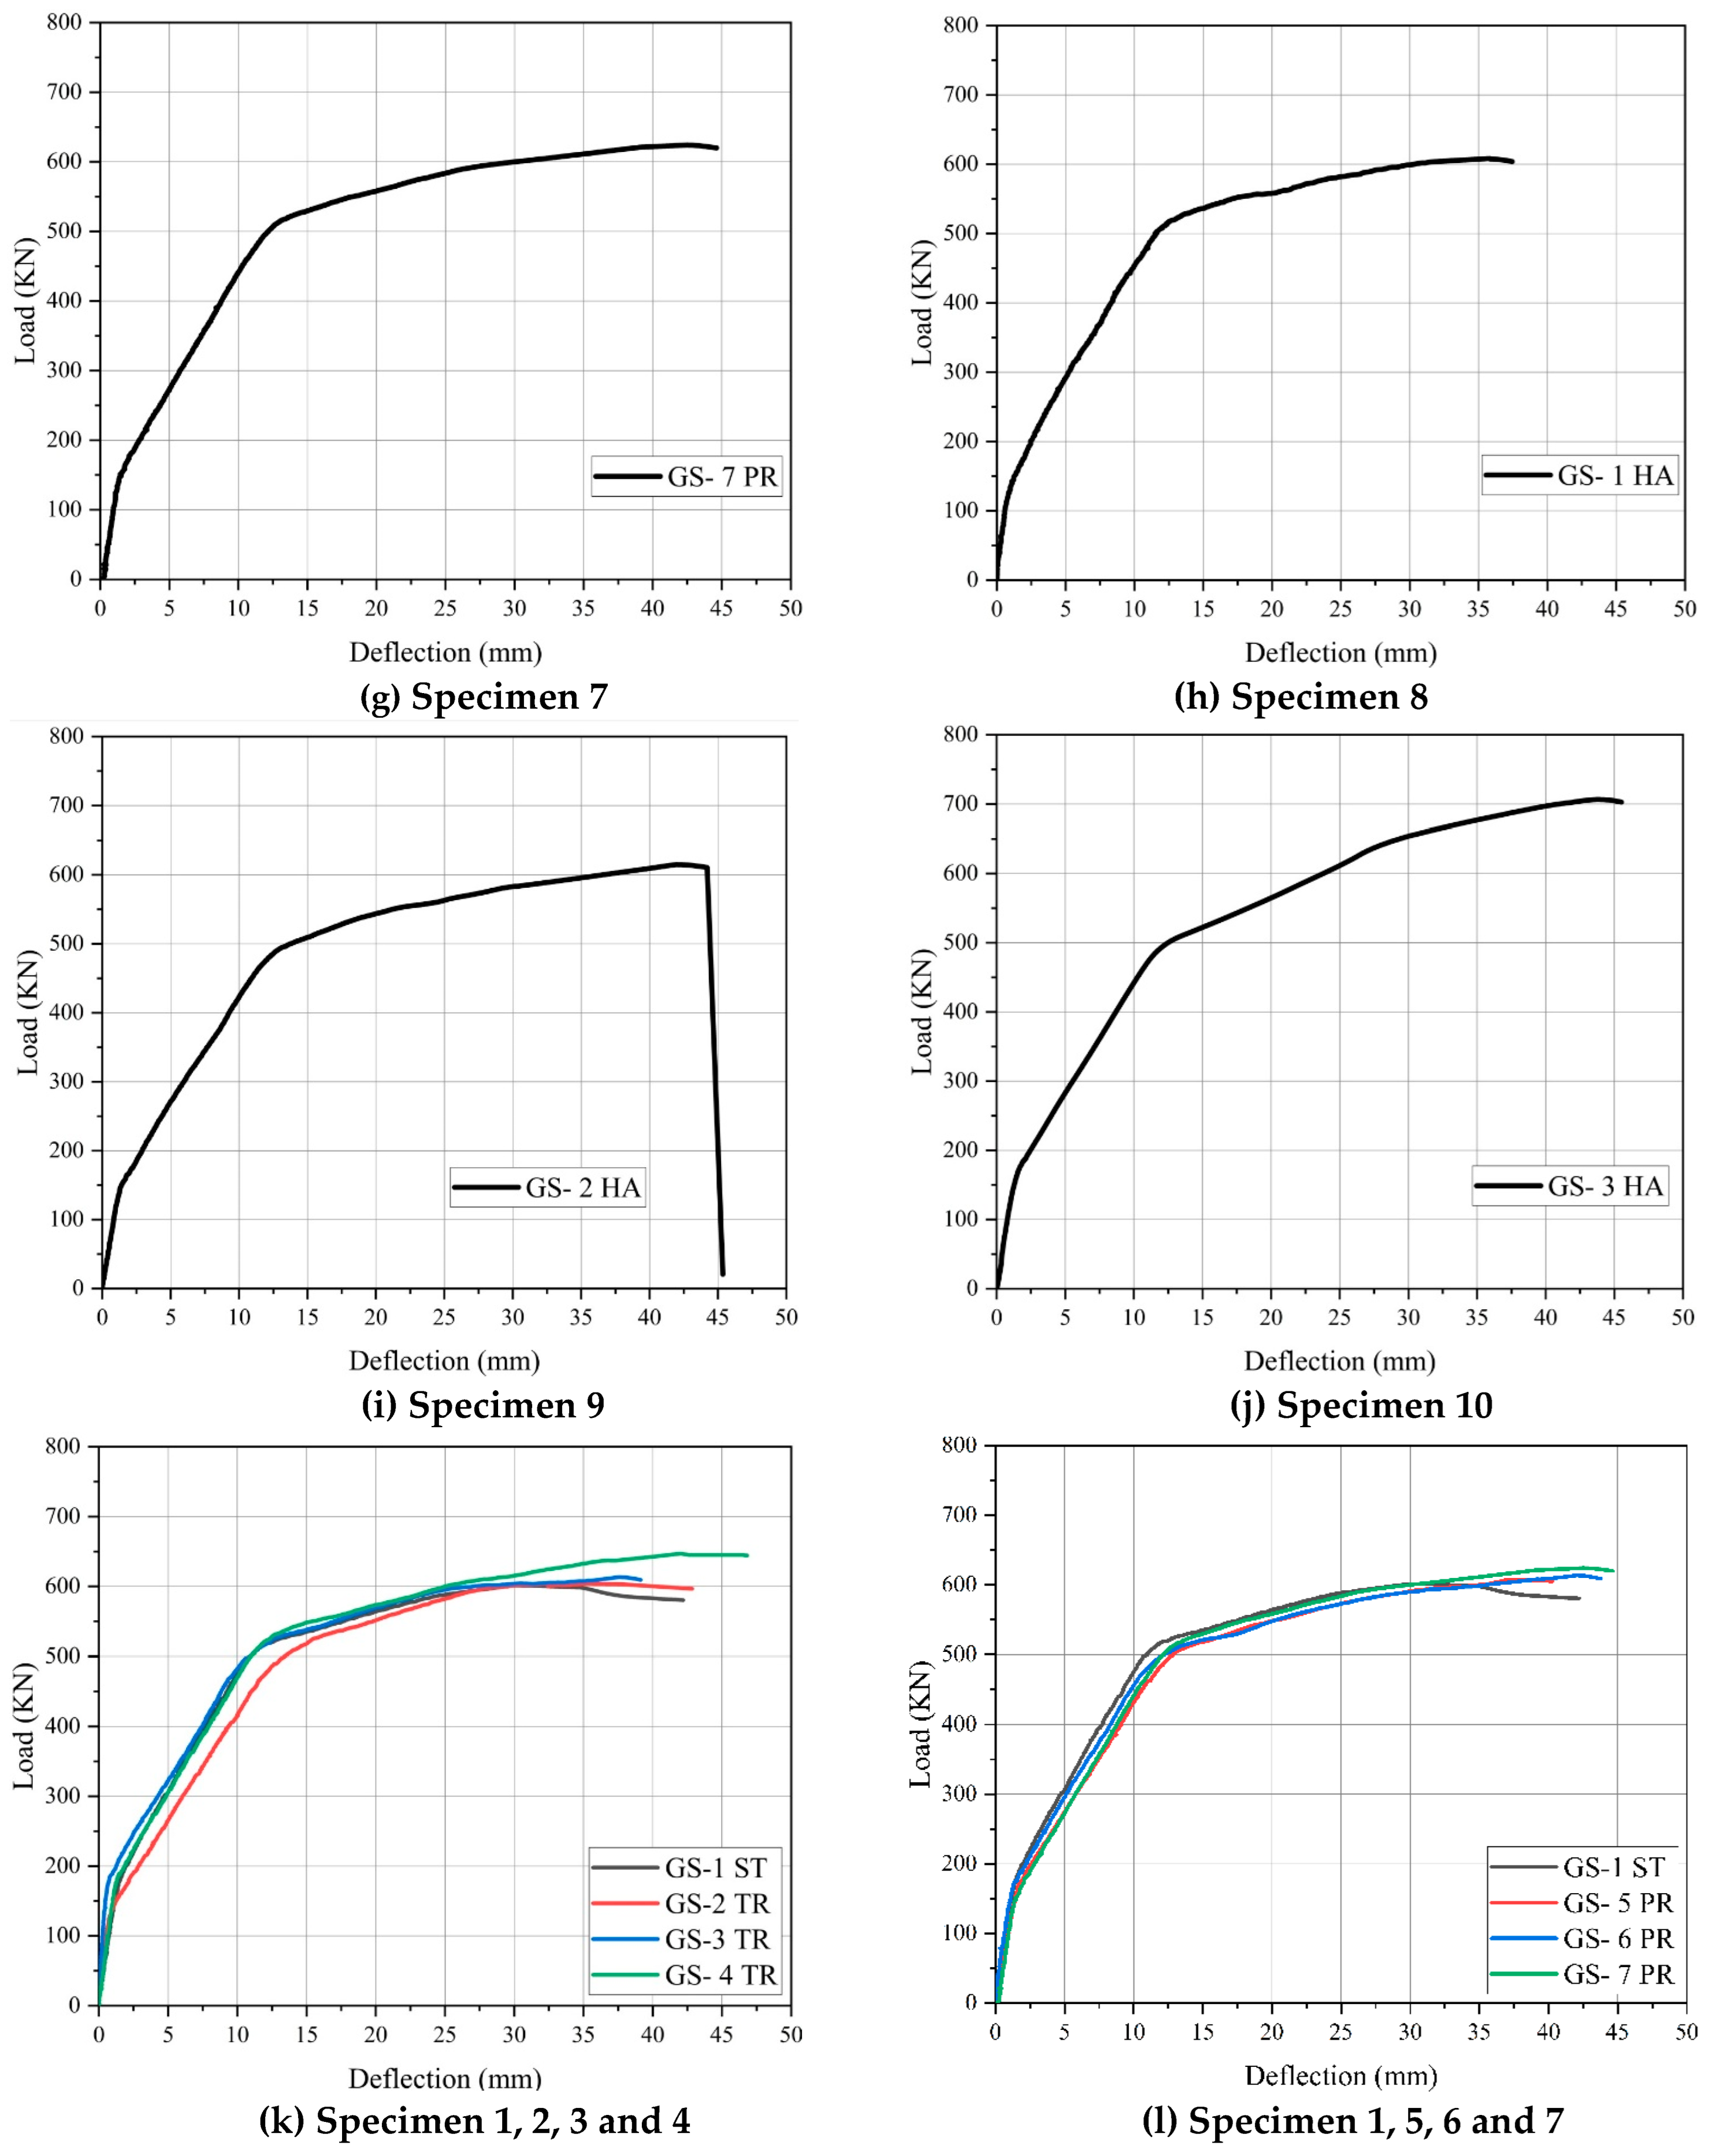
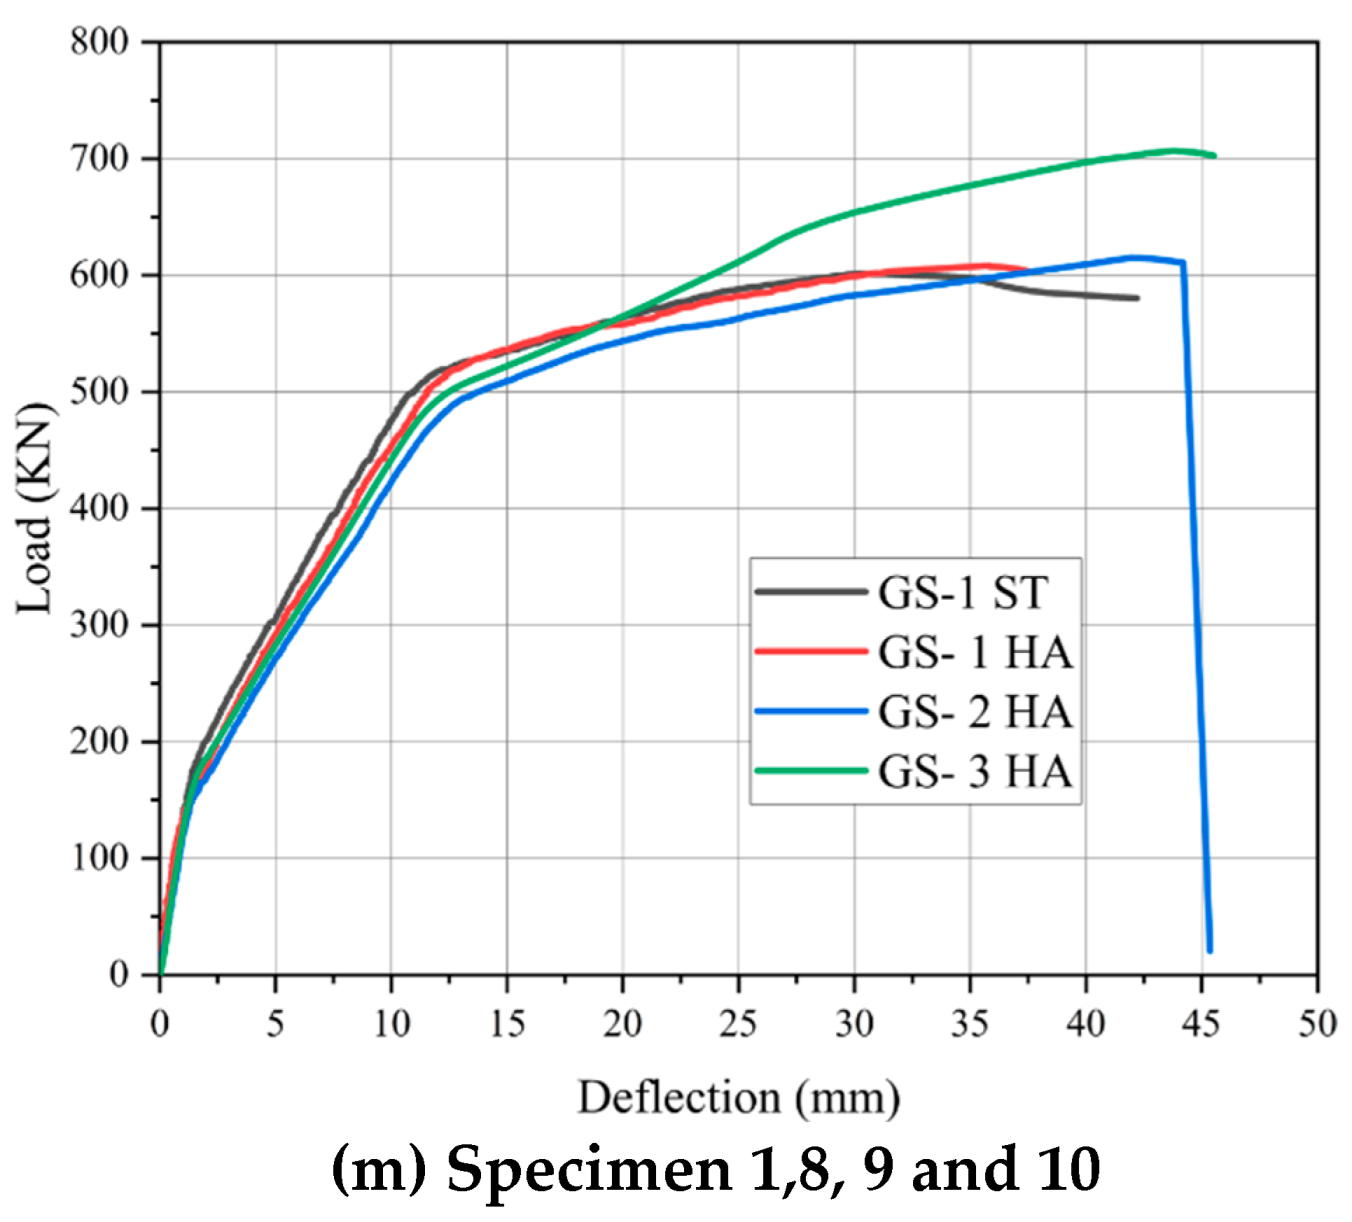
Figure 11.
Crack patterns of the specimens.
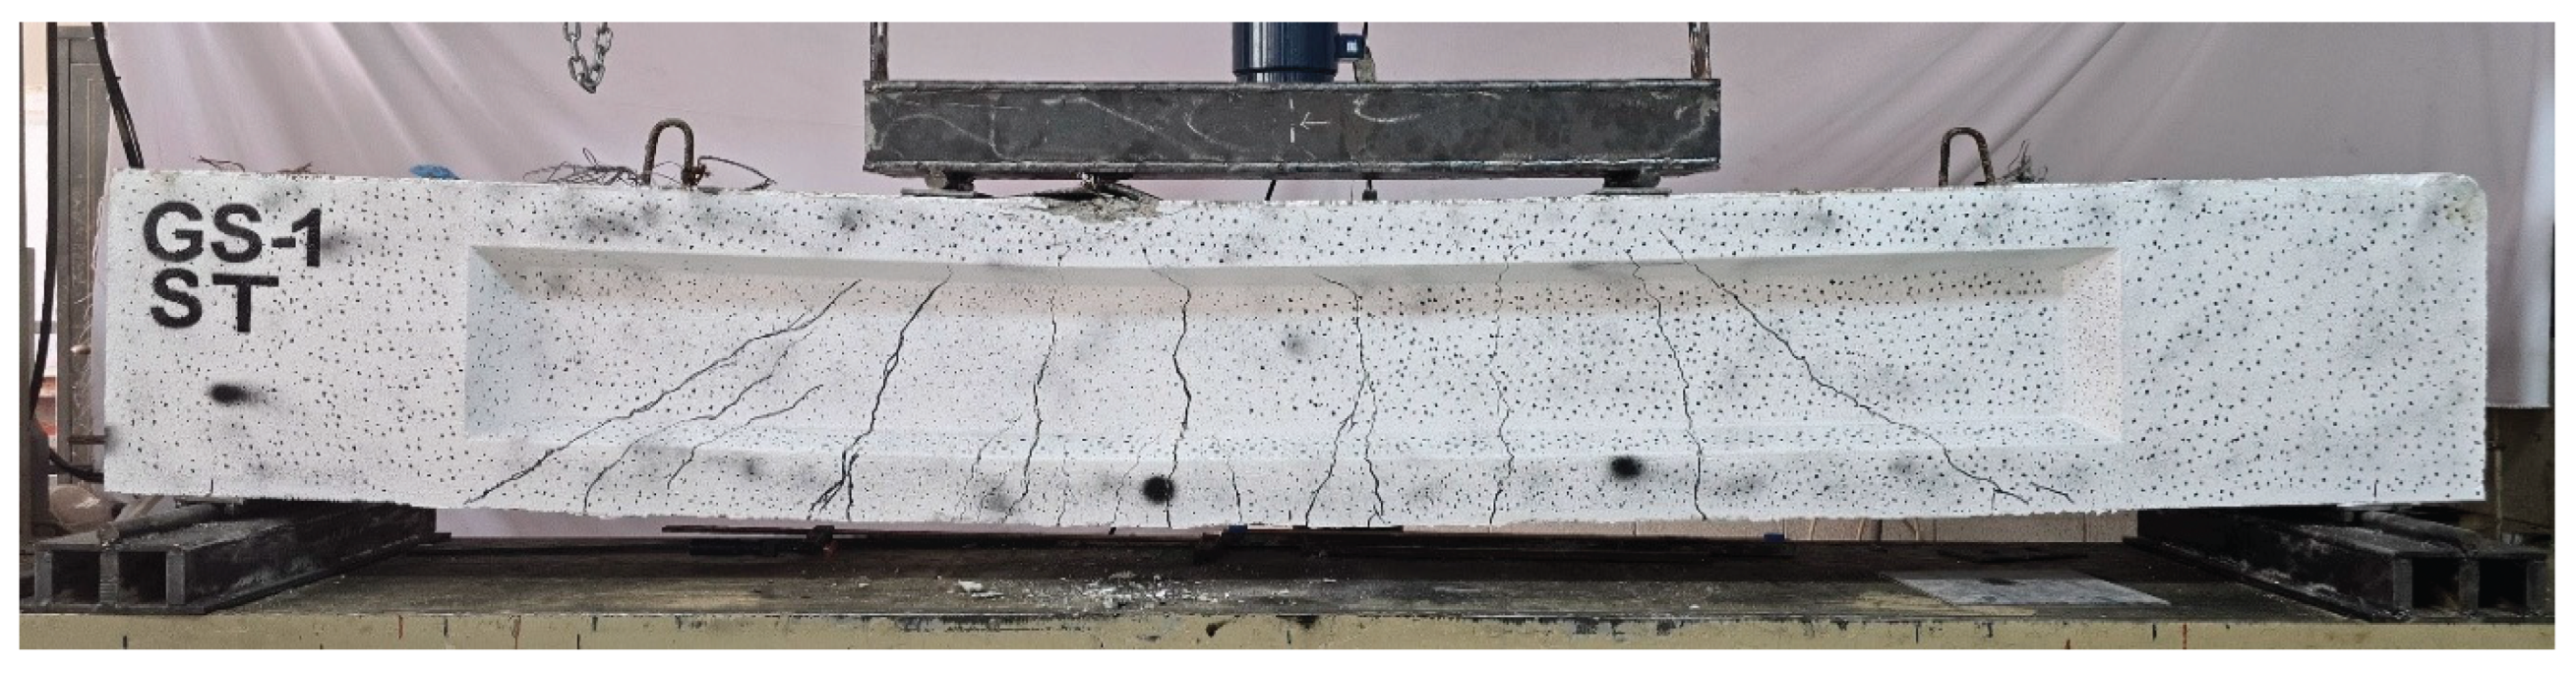
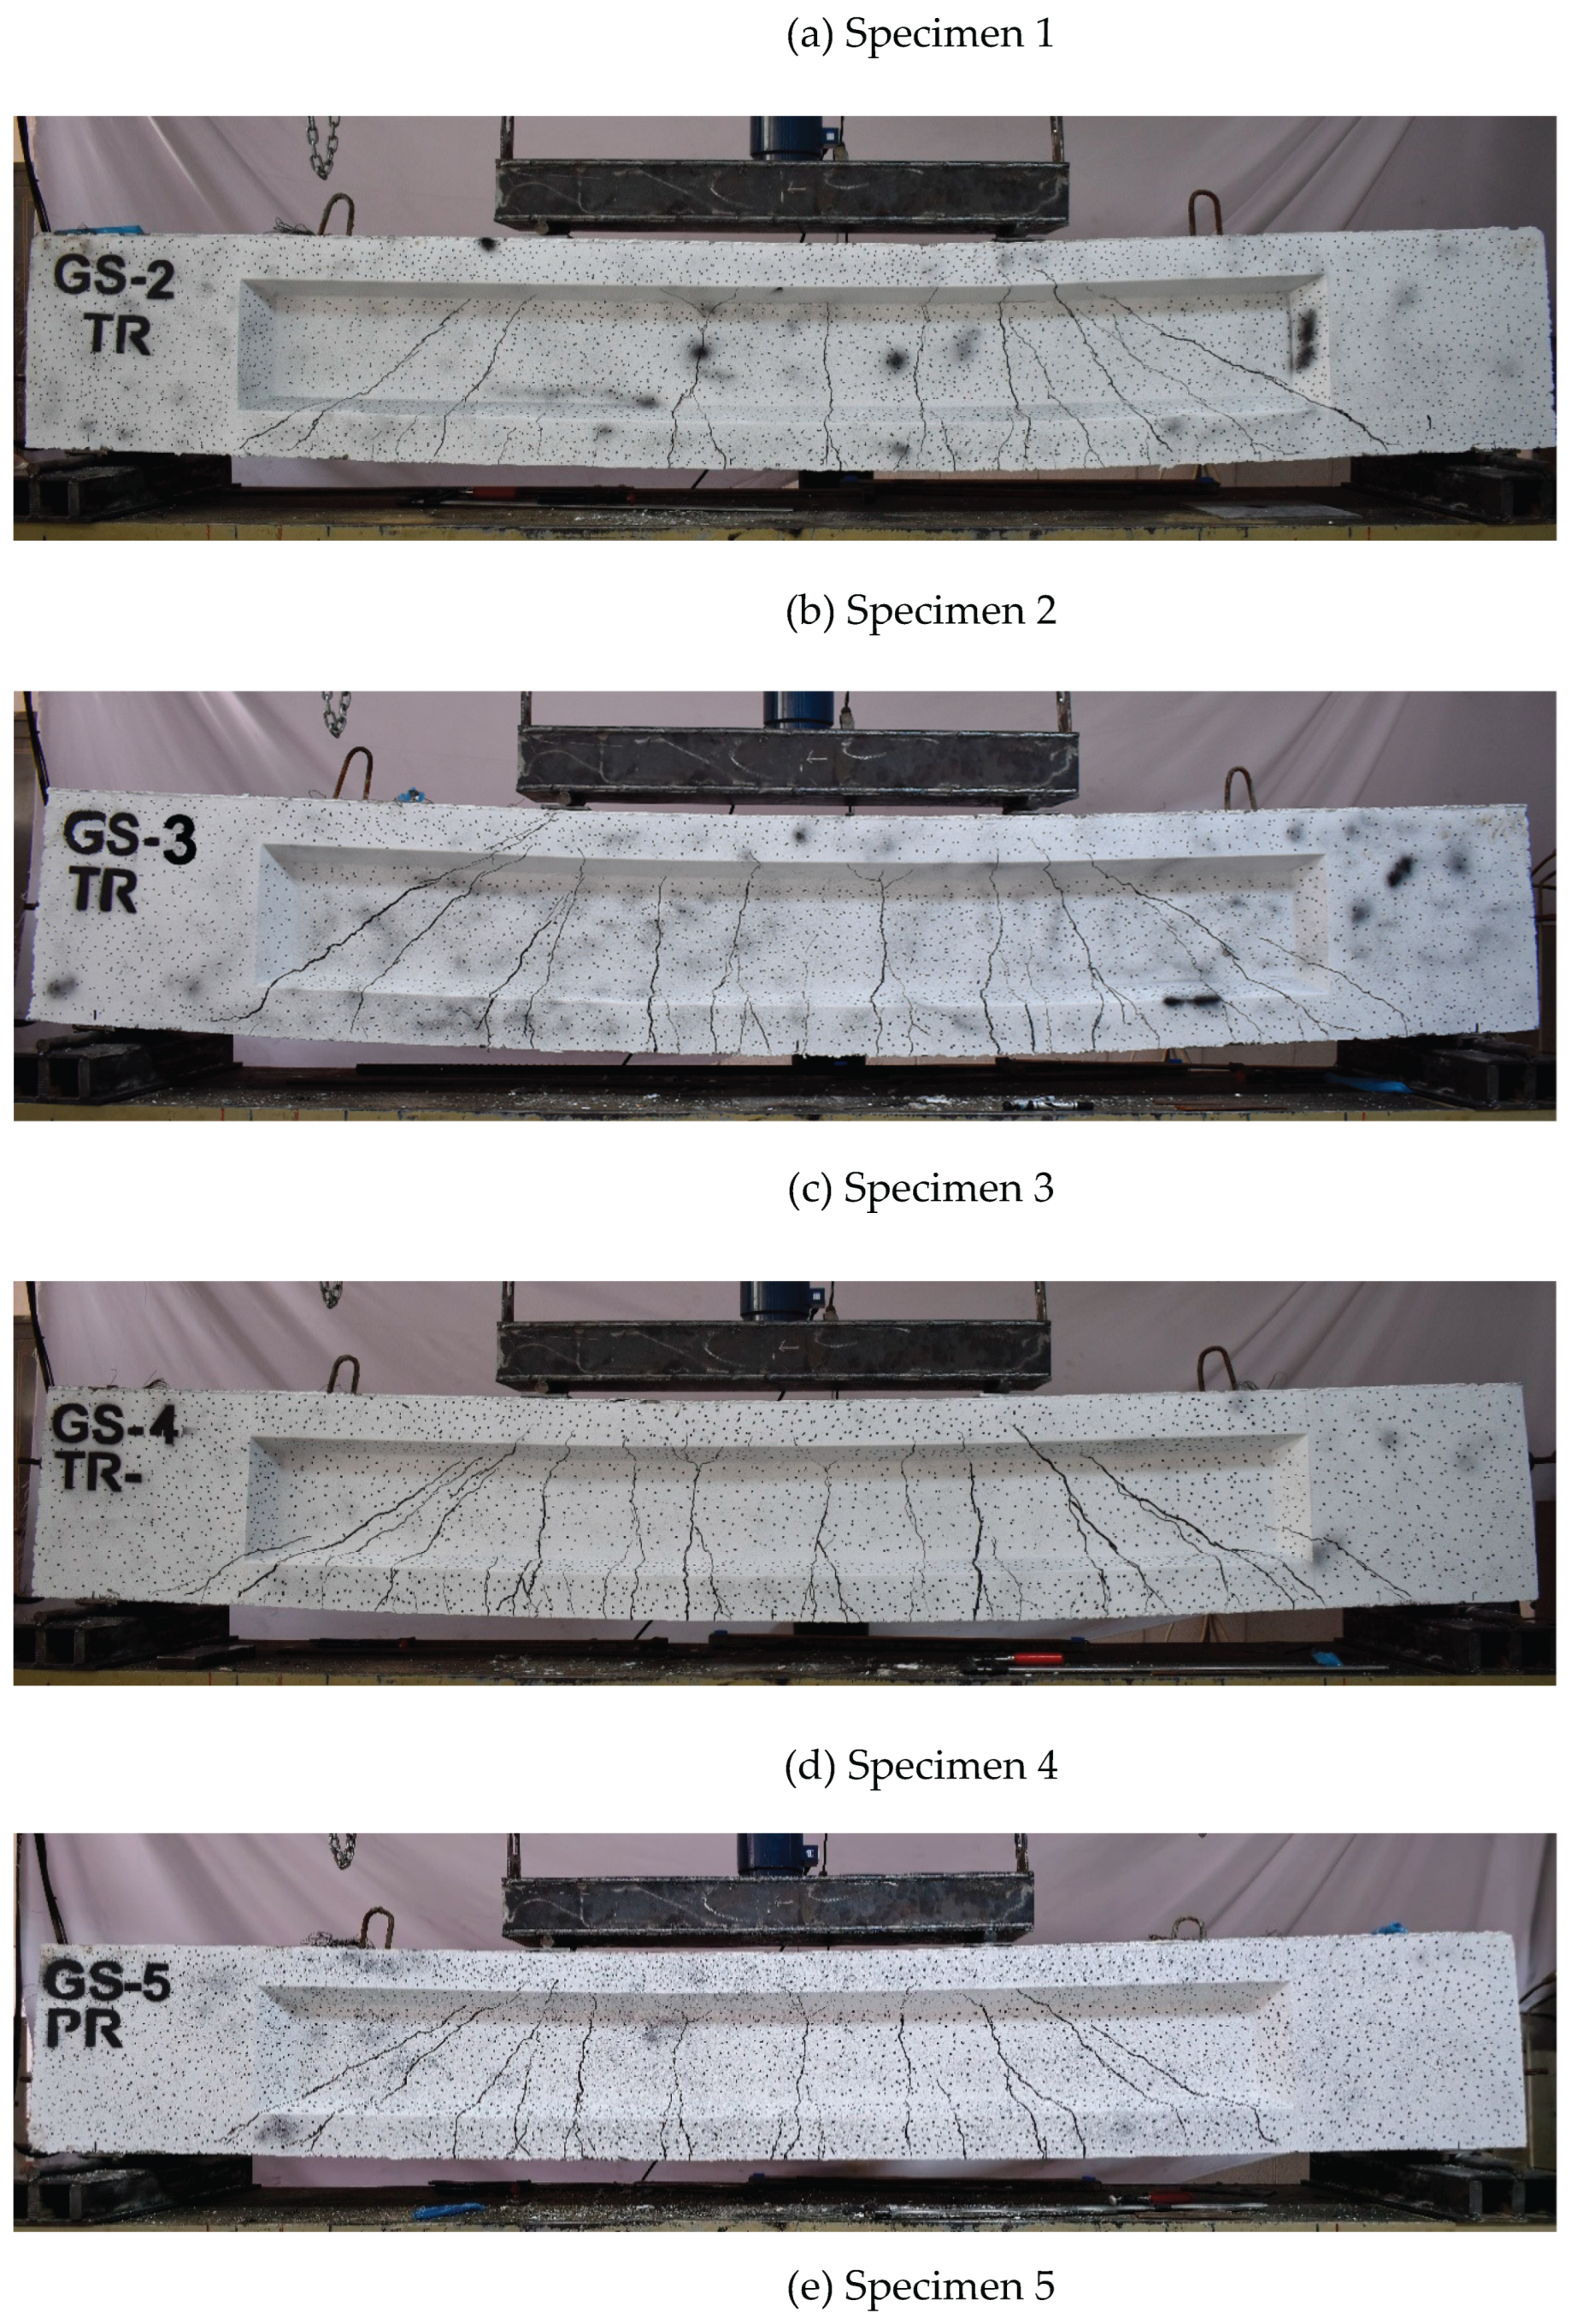
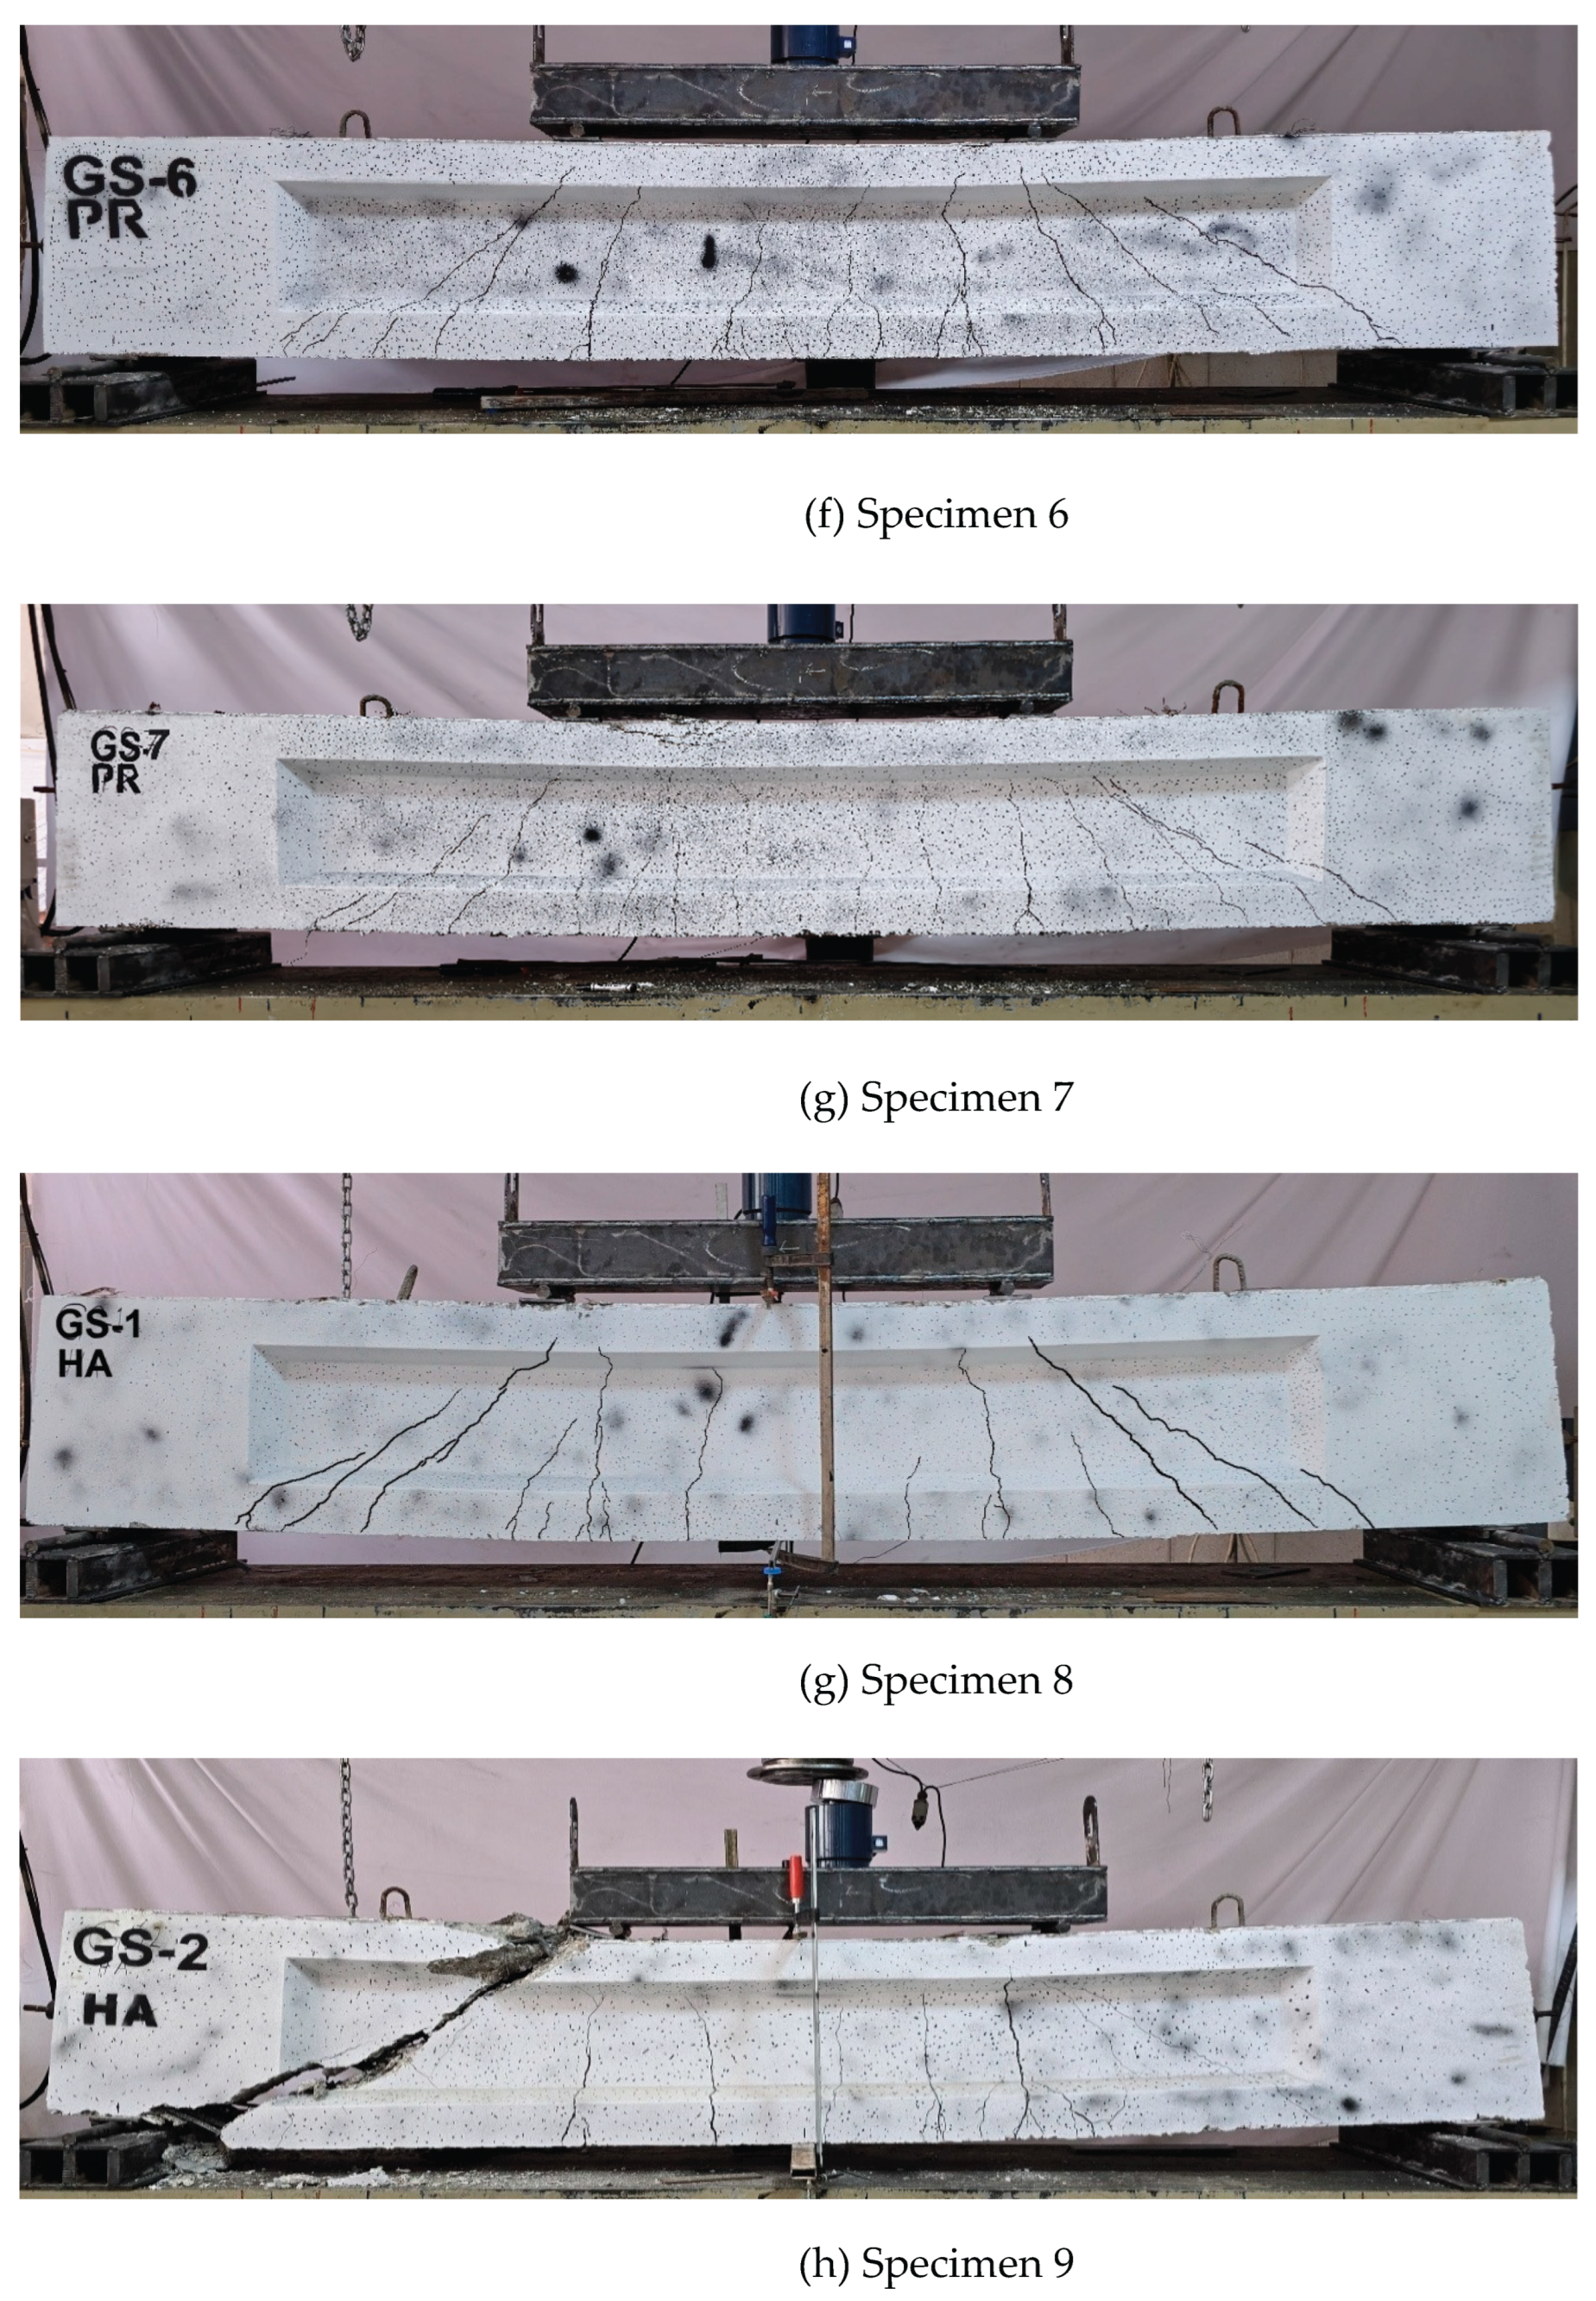
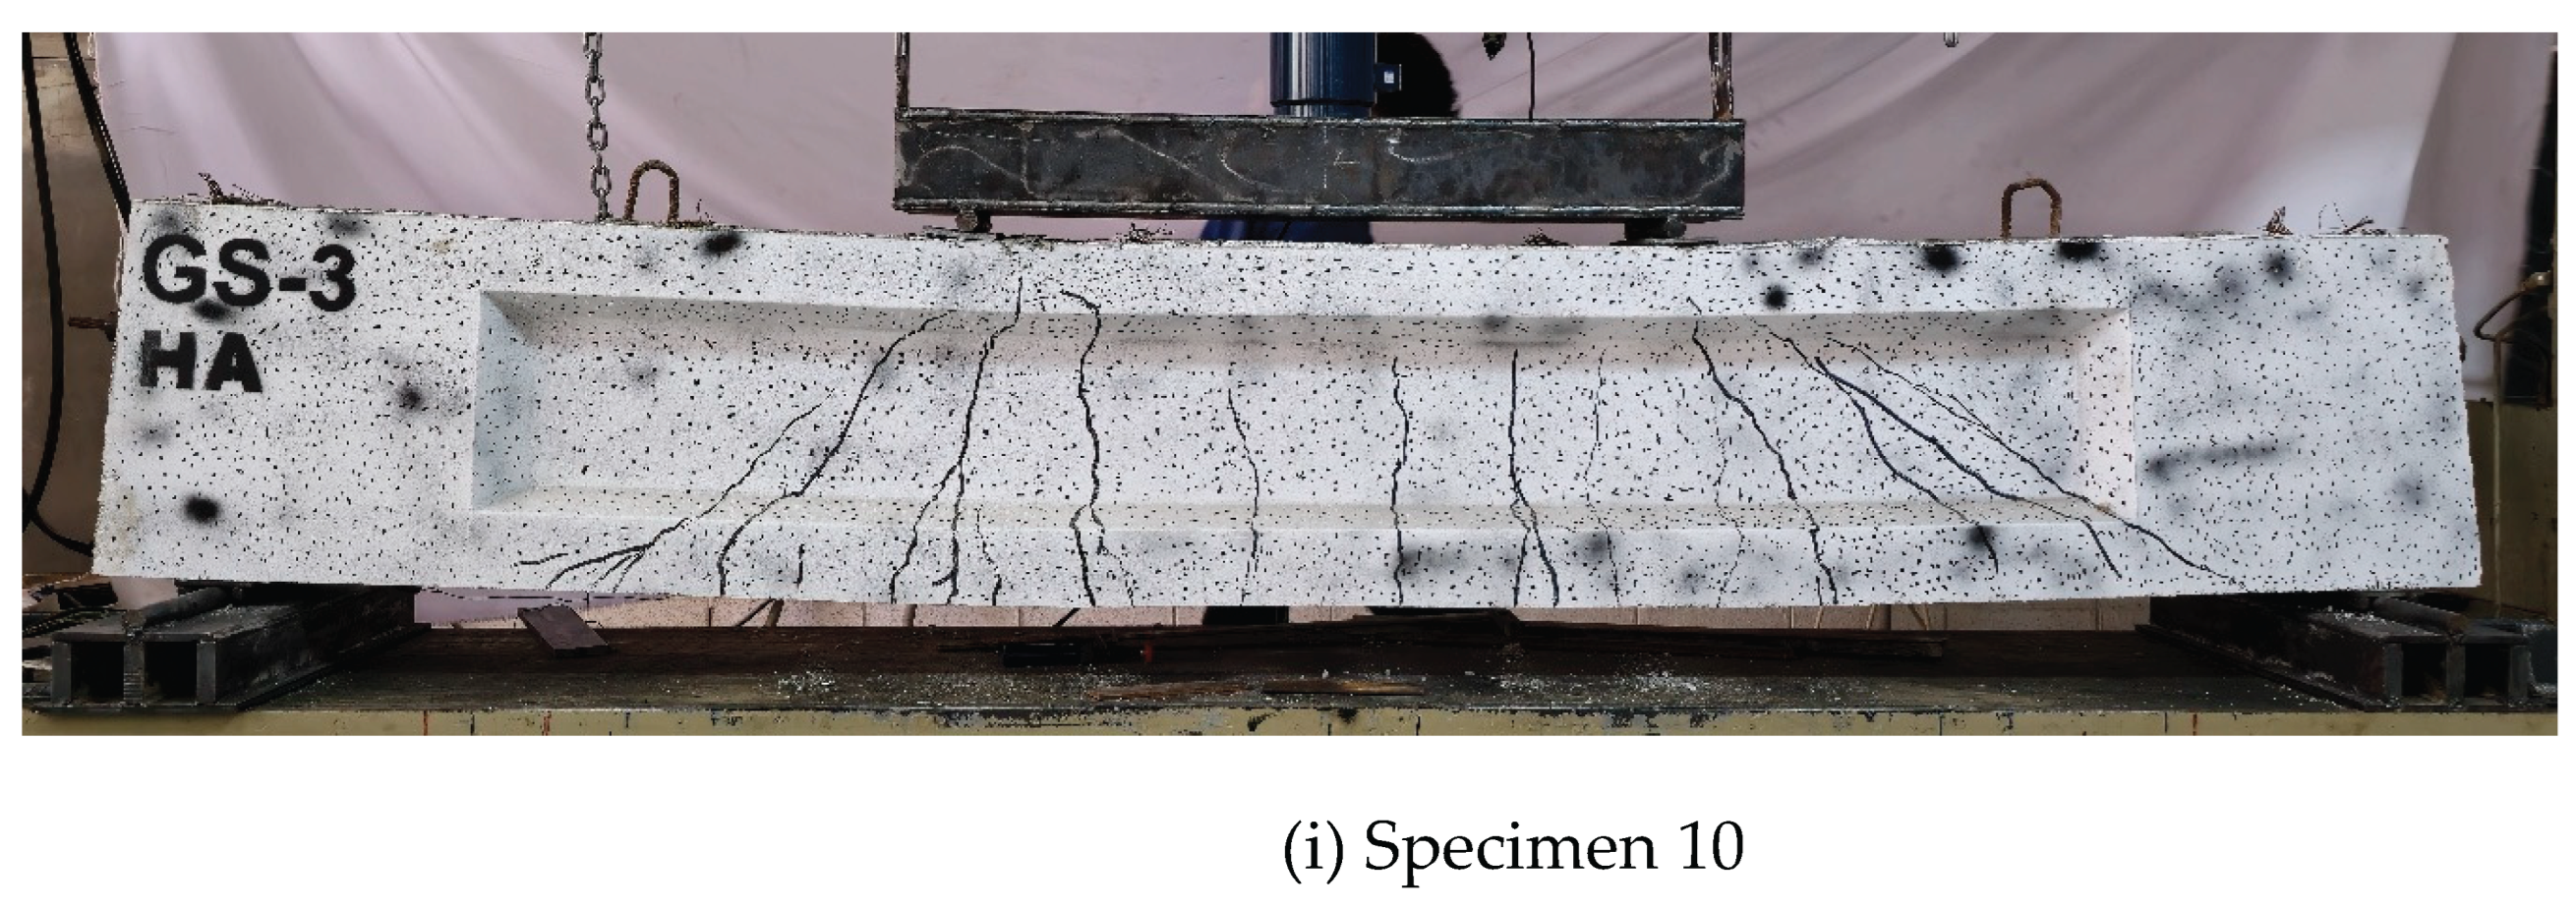

Table 1.
Concrete mix proportions.
| Materials | Quantities |
|---|---|
| Cement (g) | 425 |
| Water (L) | 160 |
| Additive (L) | 4 |
| Fine Aggregate (kg) | 880 |
| Coarse Aggregate (kg) | 910 |
| W/C | 0.38 |
| Slump (mm) | 150-180 |
| Maximum Aggregate Size (mm) | 19 |
Table 2.
Physical property of strand and reinforced bars.
| Type | Diameter (mm) | Area (mm2) |
Yield Stress (MPa) |
Ultimate Strength (MPa) |
Maximum Elongation (%) |
Modulus of Elasticity (MPa) |
Standard |
|---|---|---|---|---|---|---|---|
| Strand | 15.26 | 140.54 | - | 2018 | 4.28 | 196,370 | ASTM A416/A416M |
| Deformed bar | 15.66 | 194.27 | 605 | 696 | 19 | 200,000 | ASTM A615/A615M |
| Deformed bar | 11.74 | 108.28 | 595 | 673 | 20 | 200,000 | ASTM A615/A615M |
| Steel wire | 4.37 | 15 | 700 | 710 | - | 200,000 | ASTM A1068/A1068M |
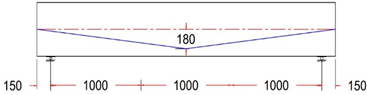
Table 3.
List of specimens with tendon profile layouts.
| Name of the Beam | Name of Tendon Profile | Tendon Profile Layout, Units in (mm) |
|---|---|---|
| G-1 ST Control Beam |
Straight Tendon Profile With e = 180 mm |
 |
| GF-2 TR | Trapezoidal Tendon Profile With ee = +80 mm |
 |
| GF-3 TR | Trapezoidal Tendon Profile With ee = 0 mm |
 |
| GF-4 TR | Trapezoidal Tendon Profile With ee = −80 mm |
 |
| GF-5 PR | Parabolic Tendon Profile With ee = +80 mm |
 |
| GF-6 PR | Parabolic Tendon Profile With ee = 0 mm |
 |
| GF-7 PR | Parabolic Tendon Profile With ee = −80 mm |
 |
| GF-1 HA | Harped Tendon Profile With ee = +80 mm |
 |
| GF-2 HA | Harped Tendon Profile With ee = 0 mm |
 |
| GF-3 HA | Harped Tendon Profile With ee = −80 mm |
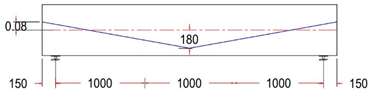 |
Table 4.
Experimental results.
| Specimen Name | First Crack Load (kN) |
First Crack Deflection (mm) |
Ultimate Load (kN) | Ultimate Load Deflection (mm) |
Pcr/Pu % |
Failure Mode |
|---|---|---|---|---|---|---|
| PCR | ∆CR | Pu | ∆u | |||
| GS-1 ST | 167.17 | 1.36 | 601.17 | 30.1 | 27.81% | Shear a |
| GS-2 TR | 137.98 | 0.98 | 603.03 | 42.59 | 22.88% | Shear a |
| GS-3 TR | 184.73 | 0.79 | 613.42 | 37.59 | 30.11% | Shear a |
| GS-4 TR | 188.72 | 1.44 | 647.08 | 42 | 29.16% | Shear a |
| GS-5 PR | 178.60 | 2 | 607.43 | 37.24 | 29.40% | Shear a |
| GS-6 PR | 183.95 | 1.68 | 613.60 | 42.04 | 29.98% | Shear a |
| GS-7 PR | 151.20 | 1.43 | 624 | 42.46 | 24.23% | Shear a |
| GS-1 HA | 126.73 | 0.86 | 608.40 | 35.82 | 20.83% | Shear a |
| GS-2 HA | 145.88 | 1.30 | 615 | 41.95 | 23.72% | Shear a |
| GS-3 HA | 166.48 | 1.52 | 706.5 | 43.81 | 23.56% | Shear a |
a Web-shear crack.
Table 5.
Comparison of the control beam with other specimens at ultimate load and ultimate load deflection.
Table 5.
Comparison of the control beam with other specimens at ultimate load and ultimate load deflection.
| Compared Specimen | Increase in Ultimate Load |
Increase In Ultimate Load Deflection |
||
|---|---|---|---|---|
| (KN) | % | (mm) | % | |
| GS-1 ST and GS-2 TR | 1.86 | 0.31% | 12.49 | 41.50% |
| GS-1 ST and GS-3 TR | 12.25 | 2.04% | 7.49 | 24.88% |
| GS-1 ST and GS-4 TR | 45.91 | 7.64% | 11.9 | 39.53% |
| GS-1 ST and GS-5 PR | 6.26 | 1.04% | 6.79 | 22.56% |
| GS-1 ST and GS-6 PR | 12.43 | 2.07% | 11.94 | 39.67% |
| GS-1 ST and GS-7 PR | 22.83 | 3.80% | 12.36 | 41.06% |
| GS-1 ST and GS-1 HA | 7.23 | 1.20% | 5.72 | 19.00% |
| GS-1 ST and GS-2 HA | 13.83 | 2.30% | 11.85 | 39.37% |
| GS-1 ST and GS-3 HA | 105.33 | 17.52% | 13.71 | 45.55% |
Disclaimer/Publisher’s Note: The statements, opinions and data contained in all publications are solely those of the individual author(s) and contributor(s) and not of MDPI and/or the editor(s). MDPI and/or the editor(s) disclaim responsibility for any injury to people or property resulting from any ideas, methods, instructions or products referred to in the content. |
© 2025 by the authors. Licensee MDPI, Basel, Switzerland. This article is an open access article distributed under the terms and conditions of the Creative Commons Attribution (CC BY) license (http://creativecommons.org/licenses/by/4.0/).
Copyright: This open access article is published under a Creative Commons CC BY 4.0 license, which permit the free download, distribution, and reuse, provided that the author and preprint are cited in any reuse.


