
Submitted:
13 June 2025
Posted:
16 June 2025
You are already at the latest version
Abstract
The gut microbiota is recognized as one of the extrinsic factors that modulate the clinical outcomes of immune checkpoint inhibitors (ICIs) in cancer patients. However, the role of the intestinal barrier, which mutually interacts with the gut microbiota, in shaping anti-cancer immune responses has not been extensively studied so far. Therefore, the primary goal of our study was to investigate the relationship between intestinal barrier functionality and clinical outcomes of anti-PD-1 therapy in patients with advanced melanoma.
Fecal samples were collected from 64 patients before and during anti-PD-1 therapy. The levels of zonulin, calprotectin, and secretory immunoglobulin A (SIgA), which reflect intestinal permeability, inflammation, and immunity, respectively, were measured in fecal samples (n = 115) using ELISA. Moreover, the composition of the immunoglobulin (Ig)-bound (n = 108) and total stool microbiota (n = 117) was determined by the V3-V4 region of 16S rRNA gene sequencing.
ELISA indicated a higher baseline concentration of fecal SIgA in patients with favorable clinical outcomes than those with unfavorable ones. Moreover, high baseline concentrations of intestinal barrier state biomarkers correlated with survival outcomes. In the cases of fecal zonulin and fecal SIgA, there was a positive correlation, while in the case of fecal calprotectin, a negative correlation. Furthermore, there were differences in the microbial profiles of the Ig-bound stool microbiota between patients with favorable and unfavorable clinical outcomes and their changes during treatment.
Collectively, intestinal barrier functionality was associated with clinical outcomes of anti-PD-1 therapy in advanced melanoma patients. Future studies are warranted to elucidate whether intestinal barrier modification could improve ICI efficacy and estimate the clinical value and utility of biomarkers reflecting its state.
Keywords:
intestinal barrier
; secretory immunoglobulin A
; gut microbiota
; advanced melanoma
; immune checkpoint inhibitors
1. Introduction
The association between the gut microbiota composition and clinical outcomes of immune checkpoint inhibitors (ICIs), such as inhibitors targeting cytotoxic T lymphocyte antigen-4 (CTLA-4), programmed death 1 (PD-1), and its ligand (PD-L1), was demonstrated in various cancer cohorts [1,2,3,4,5]. Although the mechanism of gut microbiota-mediated regulation of response to ICIs is not fully understood, the gut microbiota is known to exert a critical impact on local and systemic immunity. It constantly interacts with other components of the intestinal barrier, i.e., the mucus layer, epithelial cells, and lamina propria – a connective tissue containing the gut-associated lymphoid tissue (the largest component of the immune system) [6,7]. In normal physiological conditions, this interaction provides a homeostatic relationship between the intestinal microorganisms and the host. However, the loss of barrier integrity may lead to uncontrolled luminal antigen translocation to the host internal environment and trigger local and systemic inflammation, which, in cancer patients, may affect immune responses at the tumor site and the clinical outcomes of the ICIs.
Despite growing evidence suggesting an involvement of the gut microbiota in shaping immune response in cancer patients undergoing ICI therapy, the intestinal barrier state and mucosal immune system activity in those patients are poorly explored. To date, a limited number of studies have reported the differences in the intestinal barrier function between patients with favorable and unfavorable outcomes of ICIs. For instance, Ouaknine Krief et al. (2019) found that high baseline citrulline level (≥20 μM) in blood plasma, which reflects proper intestinal epithelial cell function, correlated with better response and clinical benefit to the ICI therapy and longer progression-free survival (PFS) and overall survival (OS) in patients with advanced non-small-cell lung cancer (NSCLC) receiving the anti-PD-1 therapy [8]. Another study revealed a higher abundance of inflammatory cells, such as dendritic cells, monocytes, macrophages, and neutrophils, in fecal samples of progressors than non-progressors in a cohort of melanoma patients receiving the anti-PD-1 antibodies, which implies increased activation of inflammatory immune responses within the intestinal mucosa in the subgroup with poor clinical outcomes [2].
The primary goal of the present study was to evaluate the intestinal barrier functionality in advanced melanoma patients undergoing anti-PD-1 therapy and analyze its association with the clinical outcomes of immunotherapy. Therefore, the concentration of zonulin, calprotectin, and secretory immunoglobulin A (SIgA) was measured using enzyme-linked immunosorbent assay (ELISA) in stool samples collected from those patients before the start (at baseline) and during treatment. Zonulin is considered a biomarker of intestinal permeability. It is known as a physiological modulator of intercellular tight junctions (TJs) that are localized near the apical surface of adjacent epithelial cells and control the passage of luminal antigens via the paracellular pathway. Zonulin binding to a specific receptor on the surface of intestinal epithelium activates a cascade of biochemical events that induce TJ disassembly, followed by increased permeability (increased passage of luminal antigens) and activation of mucosal immunity. The zonulin pathway is part of a defensive mechanism that initiates immune responses against antigens to remove them from the microbial ecosystem. Therefore, it may play an important role in maintaining homeostasis in the intestinal mucosa. However, disruption of intestinal barrier integrity (reflected by increased zonulin levels) may also contribute to the development of various chronic inflammatory diseases [9,10,11]. On the other hand, fecal calprotectin is a biomarker reflecting intestinal inflammation. It belongs to the family of calcium-binding proteins constitutively expressed in neutrophils and other cells that regulate inflammatory processes and exhibit antibacterial and antiproliferative activity. During intestinal inflammation, neutrophils are recruited to the intestinal mucosa, and their numbers positively correlate with the concentration of fecal calprotectin [12]. Finally, fecal SIgA is regarded as a biomarker of intestinal immunity. It is the dominant Ig in the mucosal secretions and plays a crucial role in maintaining homeostasis in the intestinal mucosa. Firstly, it protects the intestinal epithelium against pathogens through the process known as ‘immune exclusion’. SIgA stimulates pathogen cross-linking and entrapment in the intestinal lumen, which facilitates their clearance from the gastrointestinal tract through peristalsis. Secondly, SIgA provides homeostasis in the intestinal mucosa through the interaction with commensal microbiota. On the one hand, SIgA coating of non-pathogenic species may prevent their invasion into the intestinal mucosa. On the other hand, it may promote intestinal colonization by commensal species by supporting their adhesion to the mucus layer or acting as a nutritional source [13,14]. Furthermore, SIgA was shown as a key component of the gut environment that shapes the oral tolerance to food proteins, potentially by preventing their translocation through the gut barrier [15].
In the present study, ELISA results indicated that the baseline concentration of fecal SIgA was significantly higher in patients with favorable clinical outcomes than those with unfavorable ones. Moreover, the analyzed biomarkers were elevated in most of the patients (concerning the reference ranges [9,16,17,18]). High baseline concentrations of intestinal barrier state biomarkers significantly correlated with survival outcomes; in the cases of fecal zonulin and fecal SIgA, it was a positive correlation, while in the case of fecal calprotectin, a negative correlation. Taking into account that fecal SIgA level was associated with improved clinical outcomes in the study cohort, the fraction of stool microbiota coated with Igs was purified from the total stool microbiota, and bacterial composition of the Ig-bound stool microbiota fraction and total stool microbiota was characterized using V3-V4 region of 16SrRNA gene sequencing. It was found that the Ig-bound stool microbiota shared a substantial subset of genera with the total stool microbiota, however, at different abundances. Moreover, there were differences in the microbial profiles of the Ig-bound stool microbiota between patients with favorable and unfavorable clinical outcomes and their changes during treatment. Taken together, our findings suggest that the functionality of the intestinal barrier and immunity play a role in shaping the anti-cancer responses in advanced melanoma patients undergoing anti-PD-1 therapy. Future studies that will provide a mechanistic insight into this aspect are warranted.
2. Materials and Methods
2.1. Study Cohort Description and Collection of Clinical Data and Stool Samples
The study cohort comprised 64 patients with histologically confirmed unresectable stage III or stage IV cutaneous melanoma enrolled in treatment with anti-PD-1 therapy, i.e., nivolumab or pembrolizumab (as a part of the Ministry of Health (Poland) drug program [19]). Recruitment to the study was conducted at the Department of Medical and Experimental Oncology, Heliodor Święcicki Clinical Hospital, Poznań University of Medical Sciences (Poznań, Poland) between June 2018 and December 2021. Written informed consent was obtained from all participants. The study was approved by the Bioethics Committee at Poznań University of Medical Sciences (registration number 402/18).
Clinical information, including tumor stage, baseline serum lactate dehydrogenase (LDH) concentration, response, PFS, and OS, was collected from the medical records. Response to the anti-PD-1 therapy was assessed according to the response evaluation criteria in solid tumors (RECIST) v.1.1. Patients were classified as responders – R (complete response (CR) and partial response (PR)) or non-responders – NR (disease stabilization (SD) and disease progression (PD)). Additional classification categorized patients into those who clinically benefited from the anti-PD-1 therapy – CB (CR, PR, and SD) and those who did not – NB (PD). Patients’ categorization into the subgroups at baseline was performed concerning the best overall response they have experienced during treatment. Survival analysis was based on two clinical endpoints, i.e., PFS and OS. PFS was defined as the time from the anti-PD-1 therapy initiation to the first event, i.e., disease progression or death from any cause. OS was defined as the duration of patient survival from initial anti-PD-1 therapy. Baseline characteristics of the study cohort are presented in our previous paper [3].
Stool samples were collected from patients before the anti-PD-1 therapy initiation (T0, at baseline) and during treatment (T1 and Tn, approximately 3 and later than 3 months, mostly about 12 months, from the start of the anti-PD-1 therapy, respectively). The exact procedure of fecal sample collection was described in our previous paper [3]. Briefly, study participants were requested to collect feces according to the stool collection procedure described by Dore et al. (2015) [20] and deliver the samples to the hospital at scheduled time points. Then, the samples were transported to the laboratory, where they were portioned and stored for further analysis.
2.2. Measurement of the Intestinal Barrier State Biomarker Concentration
The concentration of fecal SIgA and fecal calprotectin was measured with commercially available ELISA kits, i.e., IDK® SIgA ELISA Kit and IDK® Calprotectin ELISA Kit (Immundiagnostik AG, Germany), respectively. Fecal zonulin level was measured with a competitive ELISA kit – IDK® Zonulin ELISA (Immundiagnostik AG, Bensheim, Germany). All measurements were performed according to the manufacturer’s protocols.
2.3. Purification of Ig-Bound Stool Microbiota Fraction
The procedure of purification of Ig-bound stool microbiota fraction from the total stool microbiota was based on the methodology described by Madhwani et al. (2016) [21]. Briefly, biotinylated antibodies specific to human Igs (Goat anti-Human IgG, IgM, IgA (H+L), Biotin, Invitrogen, Waltham, MA, USA) were incubated with streptavidin-coated magnetic beads (Streptavidin Magnetic Particles, Roche, Basel, Switzerland). Then, excessive or non-specifically bound antibodies were removed by washing the beads three times with the buffer (20 mM potassium phosphate, 0.15 M sodium chloride, pH 7.5). In the next step, the antibodies coupled with the magnetic beads were incubated with the fecal suspension in the same buffer to separate the stool microbiota fraction coated with Igs from the total stool microbiota. Then, the Ig-bound stool microbiota fraction coupled with the anti-human Igs – magnetic bead complexes were washed three times in the buffer with 0.1% bovine serum albumin and 0.05% Tween 20 to remove non-specifically bound bacteria. These steps were performed using a magnetic separator, MagMAX™ Express (Applied Biosystems, Waltham, MA, USA). After the process, metagenomic DNA was isolated from the purified fraction of Ig-bound stool microbiota using the commercial system DNeasy PowerSoil Pro (Qiagen, Hilden, Germany), following the manufacturer’s protocol.
2.4. Metagenomic DNA Extraction and Sequencing of the V3-V4 Regions in the 16S rRNA Gene
Simultaneously, metagenomic DNA was also extracted from ~250 mg of RNAlater-preserved fecal slurry (total stool microbiota), using DNeasy PowerSoil Pro Kit (Qiagen, Hilden, Germany) according to the kit manual (with an additional step of RNase digestion after the bead-beating; detailed procedure was described in our previous paper [3]). The concentration of metagenomic DNA extracted from total stool and Ig-bound stool microbiota was determined fluorometrically using the QuantiFluor dsDNA System (Promega, Madison, WI, USA), following the manufacturer’s instructions. Then, all DNA templates were diluted to a concentration of ~5 ng × µL−1 before sequencing.
The detailed procedure of library preparation and marker gene sequencing was described in our previous paper [3]. Briefly, the V3-V4 hypervariable regions of the 16S rRNA gene were amplified using the 341F and 785R primers [22] and KAPA HiFi HotStart Ready Mix (Roche, Basel, Switzerland) according to the manufacturer’s instructions. Then, the PCR amplicons were delivered to Genomed S.A. (Warsaw, Poland), where the second stage of library preparation and metagenome sequencing on the Illumina MiSeq PE300 platform was performed.
Subsequently, the sequences of V3-V4 regions in the 16S rRNA gene were processed as reported in our previous paper [3]. However, the taxonomy assigned to each merged sequence was performed using the SILVA SSU database release 138.1 with an emended description of the genus Lactobacillus Beijerinck 1901 [23].
2.5. Statistical Analysis
The Wilcoxon Rank Sum Test was performed to analyze the differences in the intestinal barrier state biomarker levels between study subgroups; the p-value ≤ 0.05 was regarded as significant. The mutual correlations between intestinal barrier biomarkers and their correlations with the Firmicutes to Bacteroides (F/B) ratio in the total stool microbiota were examined with the Spearman’s Rank Correlation Test; the p-value ≤ 0.05 was regarded as significant. The F/B ratio was calculated by dividing the relative abundance of Bacillota (formerly Firmicutes) by the relative abundance of the Bacteroidota (formerly Bacteroides) in the total stool microbiota [24]. Kaplan–Meier curves of the probability of progression-free survival (PFS) and overall survival (OS) according to high and low baseline levels of intestinal barrier biomarkers were compared using the Log-Rank (Mantel-Cox) Test; p-value ≤ 0.05 was regarded as significant. The maximally selected rank statistics were used to determine optimal cut-off points of biomarker levels. The Cox proportional hazards regression analysis was performed to examine the effects of high vs. low baseline concentrations of biomarkers on hazard ratio (HR; HR > 1 indicates an increased risk of disease progression or death, while HR < 1 – a decreased risk); the p-value ≤ 0.05 was regarded as significant.
The Student’s t-test was performed to analyze the differences in the composition of Ig-bound stool microbiota and total stool microbiota at the phylum level; the p-value ≤ 0.05 was regarded as significant. The differential abundance analysis (DAA) was performed with ANOVA-like Differential Expression version 2 (ALDEx2) tool to determine differentially abundant taxa at the genus level in the Ig-bound stool microbiota and total stool microbiota between study subgroups. Statistics were performed with the Wilcoxon Rank Sum Test; the p-value < 0.1 was regarded as significant. Principal coordinates analysis (PCoA) based on the weighted-UniFrac distance metric and the unweighted-UniFrac distance metric [25] was performed to analyze beta diversity between the Ig-bound stool microbiota, total stool microbiota, and circulating cell-free microbial DNA (cfmDNA; published in our previous paper [26]) extracted from blood plasma samples of the study cohort. The Spearman’s Rank Correlation Test was performed to analyze the correlations between relative abundance median values of genera in the Ig-bound stool microbiota and total stool microbiota; the p-value ≤ 0.05 was regarded as significant. The Spearman’s Rank Correlation Test was also performed to analyze the correlations between particular relative abundances of microbial taxa in the Ig-bound stool microbiota and total stool microbiota; the p-value ≤ 0.05 was regarded as significant. The differential correlations between study subgroups were determined with the Differential Gene Correlation Analysis (DGCA) [27]; the p-value ≤ 0.05 was regarded as significant. The data were transformed with the proportion-based ‘The Hellinger’ method [28,29].
All statistical analyses of the data were conducted using R version 4.4.2, and the following R packages were used: phyloseq v.1.50.0, microbiome v.1.28.0, survival v.3.8.3, survminer v.0.5.0, ALDEx2 v1.38.0, and DGCA v1.0.3.
3. Results
3.1. Intestinal Barrier State Biomarkers
The concentration of zonulin, calprotectin, and SIgA in stool samples (n=115) was measured using ELISA kits to evaluate the intestinal barrier functionality in advanced melanoma patients undergoing anti-PD-1 therapy.
3.1.1. A High Baseline Concentration of Fecal SIgA Is Associated with Response and Clinical Benefit from the Anti-PD-1 Therapy
In our study, there were no statistically significant differences in the fecal zonulin and calprotectin concentrations between R vs. NR and CB vs. NB subgroups at baseline and during the therapy (p-value > 0.05, Figure 1A–D). However, the baseline concentration of fecal SIgA was significantly higher in patients with favorable clinical outcomes than those with unfavorable ones (p-value ≤ 0.05, R0 vs. NR0 and CB0 vs. NB0, median values, respectively, 5237 vs. 2539 and 4324 vs. 1671 µg · mL-1, Figure 1E and F). The biomarker levels have not changed significantly during treatment within subgroups with favorable and unfavorable clinical outcomes (p-value > 0.05, Figure 1A–F). Our findings indicate a lack of profound influence of the anti-PD-1 therapy on the intestinal barrier functionality. However, the baseline difference in the fecal SIgA concentrations underlines an increased activation of adaptive immune responses in cancer patients with a favorable outcomes of the immunotherapy.
3.1.2. Elevated Levels of Intestinal Barrier State Biomarkers in Advanced Melanoma Patients
The concentrations of all investigated biomarkers were increased in most of the samples according to the reference ranges indicated by the ELISA kit manufacturer [16,17]. In detail, elevated levels of fecal SIgA (>2040 µg · mL-1) were found in 64%, normal (510 – 2040 µg · mL-1) – in 35%, and subnormal (<510 µg · mL-1) – in 1% of all analyzed samples (i.e., samples collected from all patients regardless of clinical outcome and collection time point). Similarly, calprotectin concentrations were borderline elevated or elevated (≥50 µg · g-1) in 62% of samples. Regarding fecal zonulin, the manufacturer did not indicate the reference range. Therefore, the results were compared to the median level in healthy individuals (61 ng · mL-1) as presented in the manufacturer’s guideline [18] and the cut-off point used by Jendraszak et al. (2022), where a fecal zonulin level >105 ng · mL-1 was regarded as elevated [9]. The fecal zonulin concentrations exceeded those values in 86% and 64% of samples, respectively.
Similar trends were observed in the study subgroups at baseline. Briefly, in the R and CB subgroups, baseline levels of fecal SIgA were elevated in 63% and 68% of patients, respectively, fecal calprotectin in 58% and 59%, respectively, and fecal zonulin (>105 ng · mL-1) in 71% of patients in both subgroups. In the NR and NB subgroups, 58% and 68% of patients had increased levels of fecal SIgA at baseline, 61% and 62% – elevated levels of fecal calprotectin, and 68% and 67% – increased levels of fecal zonulin, respectively. It is worth noting that a subnormal level of baseline fecal SIgA was only detected in one patient with unfavorable clinical outcomes.
At T1, intestinal barrier state biomarkers were also elevated in most of the patients with favorable clinical outcomes. In the R and CB subgroups, approximately 80% of patients had elevated concentrations of fecal SIgA (>2040 µg · mL-1 in 78% and 81% of patients, respectively). Moreover, fecal calprotectin levels (≥50 µg · g-1) were increased in 65% of patients in both subgroups, and fecal zonulin concentrations (>105 ng · mL-1) were raised in 70% and 65% of patients, respectively. In the subgroups of patients with unfavorable clinical outcomes, these trends were more diverse. In the NR subgroup, fecal zonulin, fecal calprotectin, and fecal SIgA levels were increased in 59%, 71%, and 65% of patients, respectively. For comparison, in the NB subgroup, the concentrations of fecal zonulin and fecal calprotectin were also elevated in most patients (67% and 78%, respectively), while fecal SIgA levels were increased only in 44% of patients.
Our results demonstrated increased intestinal barrier permeability, inflammation, and immunity in most advanced melanoma patients before and during anti-PD-1 therapy. However, it is worth noting that fecal SIgA levels were in the normal range in most patients with PD at T1, while in most patients, who benefited from the therapy, they were elevated. This implies an association between enhanced Ig responses in the gut and improved clinical outcomes of the anti-PD-1 therapy.
3.1.3. Mutual Correlations Between Intestinal Barrier State Biomarkers and Total Stool Microbiota Composition
Elevated concentrations of analyzed biomarkers (according to reference ranges [9,16,17,18]) indicated some disturbances in the functioning of the intestinal barrier in the study cohort. As there might be a link between disrupted host-microbe interaction that may lead to increased intestinal permeability, which, in turn, may contribute to gut inflammation and induce mucosal immune responses, the mutual correlations between intestinal barrier state biomarkers were investigated in our study. Moreover, their associations with the F/B ratio in the total stool microbiota (disruptions in the biomarker value may reflect gut microbiota dysbiosis that links with the development of various diseases [30,31]) were analyzed.
In all analyzed samples, fecal SIgA negatively correlated with the F/B ratio in the total stool microbiota (p-value = 0.026, Figure 2A). A similar trend was found in patients with unfavorable clinical outcomes at baseline (p-value ≤ 0.05, Figure 2D and E) and in the NB subgroup at T1 (R = -0.68, p-value = 0.05, Table S1).
In contrast, fecal calprotectin positively correlated with the F/B ratio in the total stool microbiota and fecal zonulin in all analyzed samples (p-value ≤ 0.05, Figure 2B and C). Comparable trends were observed in patients with favorable clinical outcomes. In detail, in the R and CB subgroups, there was a positive correlation between fecal calprotectin and fecal zonulin at baseline (p-value ≤ 0.05, Figure 2H and I), whereas in the R subgroup, fecal calprotectin positively correlated with the F/B ratio in the total stool microbiota at T0 and T1 (p-value ≤ 0.05, Figure 2F and G).
Distinct correlations between analyzed biomarkers in advanced melanoma patients with favorable vs. unfavorable clinical outcomes of anti-PD-1 therapy suggest activation of different mechanisms within the intestinal mucosa in those subgroups that could influence immunotherapy efficacy. The list presenting the Spearman’s ρ values and p-values describing their statistical significance calculated for analyzed biomarkers in all samples (for general trend observation) and study subgroups is available in Supplementary Materials (Table S1).
3.1.4. Baseline Levels of Intestinal Barrier State Biomarkers Are Associated with the Survival Outcomes
The association between baseline concentrations of intestinal barrier state biomarkers and survival outcomes (expressed as PFS and OS) was also examined in our study. Survival analysis indicated that high fecal zonulin and SIgA levels at baseline predicted improved survival outcomes, while high baseline fecal calprotectin levels – the poor ones (Figure 3).
Specifically, there was a significant association between baseline zonulin level and OS probability (p-value = 0.014, Figure 3C), and the concentration of the biomarker higher than 303 ng · mL-1 was significantly associated with decreased risk of death (OS HR 0.29 (0.099 – 0.83), p-value = 0.021, Figure 3D). The median baseline concentrations of fecal zonulin in the R and CB subgroups (281 and 216 ng · mL-1, respectively) were comparable to this predicting longer OS, whereas, in the NR and NB subgroups, the median levels of fecal zonulin at baseline were 160 ng · mL-1 in both subgroups, i.e., ~2 times lower than the estimated cut-off point.
Fecal SIgA level at baseline was also significantly associated with PFS and OS probability (p-value ≤ 0.05, Figure 3I and K). The baseline concentration of fecal SIgA higher than 820 µg · mL-1 was significantly associated with decreased risk of disease progression (PFS HR 0.34 (0.14 – 0.85), p-value = 0.021, Figure 3J) and higher than 5477 µg · mL-1 with decreased risk of death (OS HR 0.27 (0.093 – 0.78), p-value = 0.015, Figure 3L). For comparison, the median concentrations of fecal SIgA in the R and CB subgroups at T0 (5237 and 4324 µg · mL-1, respectively) were ~6 and ~5 times higher, respectively, than the concentration that predicted longer PFS and comparable to the concentration predicting a longer OS. In the NR and NB subgroups, the median concentrations of fecal SIgA at T0 (2539 and 1671 µg · mL-1, respectively) were ~3 and ~2 times higher, respectively, than the concentration associated with longer PFS, whereas ~2 and ~3 times lower, respectively, than the concentration that predicted longer OS.
Moreover, there was a significant association between baseline fecal calprotectin level and PFS and OS probability (p-value ≤ 0.05, Figure 3E and G). The baseline concentration of the biomarker higher than 212 µg · mL-1 was significantly associated with increased risk of disease progression (PFS HR 2.5 (1 – 6), p-value = 0.042, Figure 3F), and there was a borderline significant association with increased risk of death (OS HR 2.6 (0.98 – 7.1), p-value = 0.054, Figure 3H). For comparison, the median concentrations of fecal calprotectin in the R and CB subgroups at T0 were ~4 times lower than the concentration predicting shorter PFS and OS (R0 and CB0, median values, respectively, 55 and 59 µg · mL-1), while in NR and NB, they were ~3 and ~2 times lower, respectively (NR0 and NB0, median values, respectively, 77 and 98 µg · mL-1).
Collectively, the association between the baseline biomarker levels and survival outcomes underlines the role of intestinal barrier functionality (that mutually interacts with the gut microbiota to provide its homeostatic relationship with the host) in shaping anti-cancer immune responses. In line with our previous observations, enhanced Ig responses were associated with improved survival outcomes, supporting our hypothesis that intestinal immunity contributes to activation of the immune system against cancer. In contrast, high calprotectin levels were linked with poor survival outcomes, revealing that increased intestinal inflammation negatively affects systemic immunity and abolishes immunotherapy effects. Unexpectedly, increased intestinal permeability, reflected by high fecal zonulin levels, was related with improved survival outcomes. However, it is worth noting that fecal zonulin may participate in maintaining homeostasis in the intestinal mucosa [10]. Taken together, our findings indicated that intestinal barrier state biomarkers may serve as predictive and prognostic biomarkers in advanced melanoma patients enrolled in the treatment with ICIs.
3.2. The Ig-Bound Stool Microbiota Fraction
SIgA was found to contribute to intestinal homeostasis and regulate the gut microbiota composition [13,14]. In our study, the median concentration of fecal SIgA at baseline was higher in patients with favorable clinical outcomes than those with unfavorable ones (Figure 1E and F), and an increased level of the biomarker was associated with improved survival outcomes (Figure 3I – L). These findings suggest that intestinal immunity may influence the anticancer effects of the anti-PD-1 therapy in advanced melanoma patients, potentially through the interaction with the gut microbiota. Taking this into account, in the present study, the Ig-bound stool microbiota fraction was purified from the total stool microbiota, and composition of the Ig-bound stool microbiota (n=108) and the total stool microbiota (n=117) was characterized using V3-V4 hypervariable regions of 16S rRNA gene sequencing.
3.2.1. The Dominance of Bacillota phylum in the Ig-Bound Stool Microbiota and Changes in the Taxonomic Profile at the Phylum Level over the Study Period
At the phylum level, the Ig-bound stool microbiota was dominated by phylum Bacillota (formerly Firmicutes) in all study subgroups (its relative abundance ranged from 78% to 89% in R/NR subgroups and from 76% to 93% in CB/NB subgroups, Figure 4B and D). For comparison, the total stool microbiota was dominated by phyla Bacillota and Bacteroidota (formerly Bacteroidetes) in all study subgroups (Figure 4A and C). However, the dominance of phylum Bacillota was less remarkable than in the Ig-bound stool microbiota (its relative abundance ranged from 57% to 64% in R/NR subgroups and from 58% to 62% in CB/NB subgroups, Figure 4A and C).
It is worth noting that the relative abundances of particular phyla in the Ig-bound stool microbiota have changed significantly during the anti-PD-1 therapy. Specifically, in the NR subgroup, the relative abundances of phyla Bacteroidota and Pseudomonadota (formerly Proteobacteria) decreased during treatment (p-value ≤ 0.05, NR0 (9.3%) vs. NR1 (3.7%), NR0 (9.3%) vs. NRn (2.9%), Figure 5A; NR0 (4.7%) vs. NRn (0.4%), Figure 5C). In contrast, the relative abundance of phylum Bacillota increased in the NR subgroup at T1 and was significantly higher than at T0 (p-value ≤ 0.05, NR0 (77.9%) vs. NR1 (88.5%), Figure 5D). In patients with favorable clinical outcomes, i.e., in the R and CB subgroups, there was a decrease in the relative abundance of phylum Bacteroidota at Tn (p-value ≤ 0.05, R1 (7.5%) vs. Rn (2.5%), CB0 (6.2%) vs. CBn (2.7%), and CB1 (6.4%) vs. CBn (2.7%), Figure 5A and B). Moreover, at T1, the Ig-bound stool microbiota of the CB subgroup was significantly enriched in phylum Verrucomicrobiota (formerly Verrucomicrobia) members as compared to the NB subgroup (p-value ≤ 0.01, CB1 (2.4%) vs. NB1 (0.2%), Figure 5E). Similarly to trends observed in the Ig-bound stool microbiota, the relative abundance of phylum Pseudomonadota in the total stool microbiota decreased in the NR subgroup during treatment (p-value ≤ 0.0001, NR0 (5.1%) vs. NRn (1.2%), Figure S1E), and the total stool microbiota of the CB subgroup was also enriched in phylum Verrucomicrobiota at T1 (p-value ≤ 0.001, CB1 (1.2%) vs. NB1 (0.1%), Figure S1B). Other statistically significant differences in the relative abundances of particular phyla in the total stool microbiota between study subgroups that were not consistent with those observed in the Ig-bound stool microbiota are shown in Figure S1.
Taken together, the composition of the Ig-bound stool microbiota at the phylum level differed from the total stool microbiota composition, revealing that Igs targeted a specific subset of microbial taxa. Moreover, the abundance patterns at the phylum level in the Ig-bound stool microbiota have changed during anti-PD-1 therapy. Noteworthy, more remarkable alternations were found in the NR subgroup vs. patients with favorable clinical outcomes, suggesting that Ig response modification, potentially associated with the introduction of anti-PD-1 antibodies, could negatively affect clinical outcomes of the immunotherapy.
3.2.2. Differences in the Ig-Bound Stool Microbiota Signatures Between Patients with Favorable and Unfavorable Clinical Outcomes at Baseline (at T0) and During the Anti-PD-1 Therapy (at T1 and Tn)
The DAA was performed at the genus level to determine differentially abundant genera in the Ig-bound stool microbiota between patients with favorable and unfavorable clinical outcomes of the anti-PD-1 therapy before and after its initiation. Statistically significant results (p-value < 0.1) of the DAA are presented in the Figure 6.
At baseline, the DAA indicated 11 differentially abundant genera in the R vs. NR comparison and 10 in CB vs. NB (p-value < 0.1, Figure 6). Among those with the highest statistical significance (p-value ≤ 0.05), there was a higher relative abundance of genus Dorea in the R subgroup. In contrast, in patients with unfavorable clinical outcomes, i.e., in the NR and/or NB subgroup, there was an enrichment in genera Colidextribacter, Intestinimonas, Ruminococcaceae Incertae Sedis, bacterium from family Ruminococcaceae, Desulfovibrio, Escherichia-Shigella, Enterococcus, Odoribacter, Citrobacter, and bacterium from family Enterobacteriaceae (p-value ≤ 0.05). Consistently, a comparable number of differentially abundant genera was indicated in the comparison of the total stool microbiota signatures between those subgroups at baseline (Figure S2). Several genera that were more relatively abundant in the Ig-bound stool microbiota of patients with unfavorable clinical outcomes (p-value < 0.1, Figure 6) were also enriched in their total stool microbiota, such as genera Christensenellaceae R-7 group, Intestinimonas, bacterium from family Ruminococcaceae, Enterococcus, and Ruminococcaceae Incertae Sedis (p-value < 0.1, Figure S2).
At T1, 2 and 6 differentially abundant genera were found in the comparison of R vs. NR and CB vs. NB, respectively (p-value < 0.1, Figure 6). Among those with the highest statistical significance (p-value ≤ 0.05), the genus Akkermansia was enriched in the R and CB subgroups. It is worth noting that its higher relative abundance was also indicated in the total stool microbiota of those subgroups at T1 (p-value ≤ 0.05, Figure S2). The genus Akkermansia is a member of the phylum Verrucomicrobiota, which was also significantly enriched in the Ig-bound and total stool microbiota of the CB vs. NB subgroup at T1 (Figure 5E and Figure S1B). Moreover, in the CB subgroup at T1, there was a higher relative abundance of genus Christensenellaceae R-7 group in the Ig-bound and total stool microbiota (p-value < 0.1, Figure 6B and Figure S2B). On the other hand, genera Intestinibacter and Holdemanella were enriched in the Ig-bound and total stool microbiota of the NB subgroup at T1 (p-value < 0.1, Figure 6B and Figure S2B). Noteworthy, the DAA indicated more differentially abundant genera in the total stool microbiota (i.e., 8 and 13 in the R vs. NR and CB vs. NB comparison, respectively, p-value < 0.1, Figure S2) than in the Ig-bound stool microbiota fraction between those subgroups at T1.
At Tn, there were 5 differentially abundant genera in the comparison between the R and NR subgroups (for comparison, 4 differentially abundant genera were indicated in the total stool microbiota between those subgroups, p-value < 0.1, Figure 6 and Figure S2). Among those with the highest statistical significance (p-value ≤ 0.05), there was a higher relative abundance of genus [Eubacterium] hallii group in the R subgroup and genus [Eubacterium] ventriosum group in the NR subgroup. Interestingly, in the total stool microbiota, the genus [Eubacterium] hallii group was enriched in the NR subgroup at Tn (p-value ≤ 0.05, Figure S2A). On the other hand, there was an enrichment in the genus Fusicatenibacter in the Ig-bound stool microbiota of the NR subgroup at Tn (p-value < 0.1), which was also more relatively abundant in the total stool microbiota of the subgroup (p-value ≤ 0.05, Figure S2A). Due to the low sample size in the NB subgroup, the comparison of the Ig-bound stool microbiota and total stool microbiota signatures between the CB and NB subgroups at Tn was not performed.
The comparison of microbial signatures in the Ig-bound stool microbiota between subgroups of patients with distinct clinical outcomes indicated the highest number of differentially abundant genera at baseline. In contrast, the differences at T1 and Tn between those subgroups were less noticeable. In line with that, there was also a difference in the baseline fecal SIgA concentrations between those subgroups (Figure 1). Together, our findings indicate that baseline intestinal immunity may affect the clinical outcomes of the anti-PD-1 therapy.
3.2.3. Changes in the Ig-Bound Stool Microbiota Signatures During the Anti-PD-1 Therapy in Patients with Favorable and Unfavorable Clinical Outcomes (T0 vs. T1, T0 vs. Tn, and T1 vs. Tn)
The DAA was also performed to analyze the changes in the relative abundances of genera in the Ig-bound stool microbiota during the anti-PD-1 therapy. The microbial signatures of the Ig-bound stool microbiota at particular collection time points (T0 vs. T1, T0 vs. Tn, and T1 vs. Tn) were compared within subgroups with favorable and unfavorable clinical outcomes. Statistically significant results (p-value < 0.1) of the DAA are presented in Figure 6.
In patients with favorable clinical outcomes, there were found few statistically significant changes in the relative abundances of genera during the anti-PD-1 therapy (p-value < 0.1, Figure 6A and B). The relative abundances of genera Bacteroides, Citrobacter (T0 vs. Tn and T1 vs. Tn), and bacterium from family Enterobacteriaceae (T0 vs. Tn) were decreased at Tn in the R and CB subgroups (p-value < 0.1). In contrast, at Tn, enrichment in the genus Oscillospiraceae NK4A214 group was found in the R subgroup (T0 vs. Tn), and in the genus Romboutsia in the R (T1 vs. Tn) and CB (T0 vs. Tn) subgroups (p-value < 0.1). Moreover, there was also a reduction in the relative abundance of genus Clostridium sensu stricto 1at T1 (T0 vs. T1) in the R subgroup and an enrichment in this genus at Tn (T1 vs. Tn) in the R and CB subgroups (p-value < 0.1). Accordingly, there was an increase in the relative abundances of genera Clostridium sensu stricto 1 and Romboutsia in the total stool microbiota of patients with favorable clinical outcomes at Tn (p-value < 0.1, Figure S2A and B). Similarly to trends observed in the Ig-bound stool microbiota signatures, there were few statistically significant changes in the relative abundances of genera in the total stool microbiota during treatment in patients with favorable clinical outcomes (p-value < 0.1, Figure S2A and B).
In contrast, in patients with unfavorable clinical outcomes, the DAA indicated 7 and 8 differentially abundant genera in the NR and NB subgroups, respectively, in the comparison of microbial signatures at T0 vs. T1 (p-value < 0.1). A decrease in the relative abundances of genera Odoribacter, bacterium from family Ruminococcaceae, and Citrobacter and an increase in the genus Dorea was found in the NR and NB subgroups at T1 (p-value < 0.1). Moreover, among taxa with the highest statistical significance (p-value ≤ 0.05), there was also a reduction in the relative abundance of genus Butyricimonas in the NR subgroup, and an enrichment in genera Romboutsia and Agathobacter in the NR and NB subgroups, respectively, at T1. For comparison, in the total stool microbiota, the relative abundance of the bacterium from the family Ruminococcaceae also decreased in the NR subgroup at T1 (p-value < 0.1, Figure S2A). Moreover, similarly to trends observed in the Ig-bound stool microbiota of the NB subgroup (p-value < 0.1), there was a decrease in the relative abundance of genus Christensenellaceae R-7 group and an increase in genus Intestinibacter in the total stool microbiota at T1 both in the NR and NB subgroups (p-value < 0.1, Figure S2).
There were also found 7 and 3 differentially abundant genera in the comparison of microbial signatures at T0 vs. Tn and T1 vs. Tn in the NR subgroup, respectively (p-value < 0.1, Figure 6A). At Tn, there was a decrease in the relative abundance of the genus Lachnospiraceae NK4A136 group and an increase in genera Anaerostipes and [Eubacterium] ventriosum group (T0 vs. Tn and T1 vs. Tn, p-value < 0.1). Moreover, in the comparison of microbial signatures at T0 vs. Tn, there was also a decrease in genera Odoribacter and Citrobacter, among the results with the highest statistical significance (p-value ≤ 0.05). An enrichment in the genus Anaerostipes during treatment was also observed in the total stool microbiota in the NR subgroup (T0 vs. Tn and T1 vs. Tn, p-value ≤ 0.05, Figure S2A). Due to the low sample size in the NB subgroup at Tn, the DAA was not performed to analyze changes in the Ig-bound stool microbiota and total stool microbiota signatures during the anti-PD-1 therapy within the NB subgroup (T0 vs. Tn and T1 vs. Tn).
Collectively, the microbial abundance patterns at the genus level in the Ig-bound stool microbiota have changed during anti-PD-1 therapy in advanced melanoma patients. However, these alterations were more remarkable in the subgroup with unfavorable clinical outcomes, consistently with trends observed at the phylum level (Figure 5). Our findings revealed changes in the specificity of Ig responses that could affect systemic immunity and lead to poor clinical outcomes of the immunotherapy.
3.2.4. The Comparison Between the Ig-Bound and Total Stool Microbiota Composition
Beta diversity analysis with PCoA performed for comparison of the Ig-bound and total stool microbiota indicated that the microbiotas shared a substantial subset of bacterial genera (Figure 7A; as indicated while using weighted-UniFrac) but at different abundances (Figure 7B; as indicated while using unweighted-UniFrac). The circulating cfmDNA extracted from the blood plasma samples of the study cohort (published in our previous paper [26]) was included in the plot to better visualize the relations between microbiotas (Figure 7A and B).
As it was indicated in the beta diversity analysis, a substantial subset of bacterial genera was found both in the Ig-bound and total stool microbiota (from 53% to 65% of all genera detected in those microbiotas in all patients or study subgroups at T0 or T1). However, some taxa were detected only in the total stool microbiota (from 28% to 43%) or in the Ig-bound stool microbiota fraction (from 3% to 8%). The unique genera in the Ig-bound stool microbiota may be associated with the process of fraction purification that could lead to its enrichment in rare microorganisms, enabling their identification in the Ig-bound stool microbiota, but masked by the diversity in the total stool microbiota (amplification bias, signal dilution).
The Spearman’s Rank Correlation Test indicated positive correlations between the relative abundance median values of bacteria (at the genus level) in the Ig-bound and total stool microbiota in all advanced melanoma patients undergoing anti-PD-1 therapy (Figure 8A and B), in the subgroups with favorable clinical outcomes, i.e., in the CB (Figure 8C and D) and R subgroups (Figure S3A and B), and those with unfavorable ones, i.e., the NB (Figure 8E and F) and NR subgroups (Figure S3C and D) at T0 and T1, respectively (p-value ≤ 0.05). It is worth noting that, in the CB subgroup, Spearman’sρ value increased during treatment (Figure 8C and D), while in the NB subgroup, there was an opposite trend (Figure 8E and F). Consistent tendencies were observed in the R and NR subgroups (Figure S3). However, they were less noticeable in the NR than in the NB subgroup (Figure S3C and D).
Furthermore, there were correlations between particular relative abundances of bacteria in the Ig-bound and total stool microbiota (at the amplicon sequence variant (ASV) level) in the R and NR subgroups at T0 (p-value ≤ 0.05). The DGCA indicated that 1201 of these correlations differed between those subgroups and 248 correlations, among them, were opposed (p-value ≤ 0.05, Table S2). For instance, there was a positive correlation between the relative abundances of Christensenellaceae R-7 group sp. in the total stool microbiota and Akkermansia muciniphila in the Ig-bound stool microbiota in the NR subgroup at T0, while in the R subgroups at T0, the correlation between these bacterial taxa was negative. Similarly, the relative abundance of Afipia sp. in the total stool microbiota positively correlated with the relative abundance of Bifidobacterium bifidum in the Ig-bound stool microbiota in the NR subgroup, whereas in the R subgroup - negatively. On the other hand, in the R subgroup, the positive correlations were found, e.g., between the relative abundances of Bacteroides sp. in the total stool microbiota and Bifidobacterium sp. in the Ig-bound stool microbiota or between the relative abundances of Merdibacter sp. and Faecalibacterium prausnitzii (in the total stool microbiota and Ig-bound stool microbiota, respectively). In the NR subgroups, these correlations were negative. Moreover, there were correlations between the relative abundances of identical ASVs in the Ig-bound and total stool microbiota (p-value ≤ 0.05, Table S2). In detail, in the R subgroup at T0, there were strong and positive correlations between the relative abundances of Bacteroides sp., Clostridium sensu stricto 1 sp., Christensenellaceae R-7 group sp., Enterococcus sp., and Bacteroides uniformis in the total stool microbiota and Ig-bound stool microbiota. In the NR subgroup at T0, there was a weak and negative correlation between the relative abundances of Bacteroides sp.in the total and Ig-bound stool microbiota. Furthermore, there was medium and positive correlation between the relative abundances of Clostridium sensu stricto 1 sp. and Faecalibacterium prausnitzii, and strong and positive correlation between the relative abundances of Erysipelotrichaceae UCG-003 bacterium and Parabacteroides distasonis in the total stool microbiota and Ig-bound stool microbiota. The DGCA showed that the correlations between the relative abundances of all those ASVs differed between the R and NR subgroups at T0 (p-value ≤ 0.05, Table S2). It is worth noting that there was an opposite trend in the correlation between relative abundances of Bacteroides sp. in the Ig-bound and total stool microbiota between those subgroups. The DGCA results are available in Supplementary Materials (Table S2).
The comparison of the Ig-bound and total stool microbiota composition corroborated our previous observations that Igs targeted a specific subset of microorganisms, which led to changes in the microbial relative abundance patterns in the Ig-bound stool microbiota vs. total stool microbiota. Interestingly, a decreasing correlation between the relative abundance median values in the Ig-bound and total stool microbiota during anti-PD-1 therapy was observed in patients with PD, while an inverse trend was observed in patients with favorable clinical outcomes. That indicated the differences in the functionality of intestinal immunity between the study subgroups. Moreover, there were correlations between the total stool microbiota and Ig-bound stool microbiota members, which underlined the link between the gut microbiota and intestinal immunity. Their mutual interactions could affect systemic immune responses and, consequently, the clinical outcomes of the immunotherapy.
4. Discussion
Although the association between the gut microbiota composition and clinical outcomes of ICIs was demonstrated in various cohorts of cancer patients [1,2,3,4,5], the influence of the intestinal barrier functionality (that mutually interacts with the gut microbiota) on the immunotherapy efficacy has not been extensively studied so far. Therefore, in our study, the intestinal barrier state biomarkers, fecal zonulin, fecal calprotectin, and fecal SIgA, were quantified in advanced melanoma patients receiving anti-PD-1 therapy, before the start and during treatment, to analyze their association with clinical outcomes. As a result, there were found no statistically significant differences in the intestinal barrier permeability and inflammation (reflected by the concentrations of fecal zonulin [10] and calprotectin [12], respectively) between patients with favorable and unfavorable clinical outcomes (Figure 1A–D). However, the level of fecal SIgA at baseline was significantly higher in the R and CB subgroups as compared to the NR and NB subgroups, respectively (Figure 1E and F), suggesting an association between intestinal immunity and response/clinical benefit from the anti-PD-1 therapy in the study cohort. Moreover, the investigated intestinal barrier state biomarkers were significantly associated with survival outcomes. In detail, high baseline concentration of fecal zonulin predicted longer OS, high baseline fecal SIgA level – longer PFS and OS, whereas high baseline concentration of calprotectin – shorter PFS and OS (Figure 3). In line with our findings, other studies also reported some differences in the functioning of the intestinal barrier between cancer patients with favorable and unfavorable clinical outcomes of ICIs. For instance, it was shown that NSCLC patients with baseline plasma citrulline levels higher than 20 μM (reflecting properly functioning enterocytes) more frequently received clinical benefits from the anti-PD-1 therapy and had longer PFS and OS than those with lower citrulline levels [8]. Moreover, in a cohort of melanoma patients receiving the anti-PD-1 therapy, patients with PD had an increased abundance of inflammatory cells in their fecal samples compared to non-progressors [2]. Another study reported lower baseline fecal calprotectin levels in patients with hepatocellular carcinoma (HCC) who clinically benefited from the ICI therapy (anti-CTLA-4 and/or anti-PD-L1 therapy) in comparison to those with PD [32]. Moreover, trends in the changes of fecal calprotectin levels during treatment in patients with HCC were comparable to those observed in the intestinal permeability biomarkers, i.e., serum zonulin and lipopolysaccharide binding protein (LBP), and opposite to those observed in Akkermansia to Enterobacteriaceae ratio and the gut microbiota alpha diversity. In our study, a positive correlation between fecal zonulin and fecal calprotectin levels was observed in all samples and patients with favorable clinical outcomes at baseline (Figure 2C, H, and I). In line with our findings, Coutzac et al. (2020) found that serum zonulin correlated with serum inflammatory proteins, such as tumor necrosis factor-α (TNFα) and monocyte chemoattractant protein 1 (MCP-1) in metastatic melanoma patients undergoing anti-CTLA-4 therapy [33]. In our cohort, fecal calprotectin also positively correlated with the F/B ratio in the total stool microbiota in all samples and the R subgroup at T0 and T1 (Figure 2B, F, and G). The F/B ratio is considered a biomarker of intestinal homeostasis, and any disruptions in its value may reflect gut microbiota dysbiosis and have been reported in various diseases, such as obesity, inflammatory bowel disease (IBD), and type 2 diabetes (T2D) [30,31]. It is worth noting that the relative abundance of Bacteroidota (formerly Bacteroidetes, Figure S1A) and Bacteroidetes to Firmicutes (B/F) ratio were increased in the baseline total stool microbiota of the R subgroup compared to the NR subgroup (as reported in our previous paper [3]). These findings imply the link between the total stool microbiota enrichment in Bacteroidota phylum members and lower intestinal inflammation and favorable clinical outcomes of anti-PD-1 therapy in the study cohort. In line with that, the association between decreased B/F ratio in the total stool microbiota and intestinal and systemic inflammation (reflected by fecal calprotectin and plasma C-Reactive Protein (CRP) levels, respectively) was indicated in obese subjects [34]. Consistently, several Bacteroidota phylum members were found to possess anti-inflammatory and epithelium-reinforcing properties [35]. On the other hand, the F/B ratio in the total stool microbiota was negatively associated with fecal SIgA in all samples and patients with unfavorable clinical outcomes at baseline (Figure 2A, D, and E). A similar trend was observed in a study on a porcine model [36]. Moreover, another study demonstrated that the Bacteroides ovatus, a member of the Bacteroidota phylum, elicited higher fecal SIgA production in mice than other analyzed species [37]. Noteworthy, the concentration of fecal SIgA tended to be lower after monocolonization with Bacillota, Actinomycetota, or Pseudomonadota phylum representatives compared to Bacteroidota phylum members. These findings revealed that properly functioning intestinal immunity may reduce intestinal inflammation and provide homeostatic interaction between the gut microbiota and host. Overall, there were different trends in the correlation between analyzed biomarkers in patients with favorable and unfavorable clinical outcomes (Figure 2), which implies activation of distinct mechanisms within the intestinal mucosa in those subgroups.
Collectively, our findings indicate that the intestinal barrier may affect treatment efficacy in cancer patients receiving ICIs, potentially through the interaction with the gut microbiota and mucosal immunity, and consequently modulate immune responses at the tumor site. The association between analysed intestinal barrier state indicators and survival outcomes reveals their potential as predictive/prognostic biomarkers in cancer patients undergoing ICI therapy. However, several aspects should be considered during the evaluation of biomarker clinical utility and the establishment of accurate cut-off points for patient stratification. Firstly, in the current study, the biomarker concentrations were elevated in most patients, and estimated biomarker cut-off levels that predicted improved or poor survival outcomes were also increased (from 2.7 to 4.2 times higher than upper limit of the normal range), regarding the reference range [9,16,17], apart from the concentration of fecal SIgA predicting longer PFS, which was within normal limits [16]. These results revealed disrupted intestinal barrier functionality in advanced cancer patients, implying that specific reference ranges should be established for such cohorts. Secondly, elevated concentrations of investigated biomarkers may not only be associated with tumors, but also with coexisting diseases, such as autoimmune, infective, or metabolic diseases [10,12,38]. Thirdly, other factors may change the concentration of intestinal barrier state biomarkers, such as age [9,39], tumor stage [38], and diet [40,41]. On the other hand, the intestinal barrier and immunity may become a therapeutic targets to improve clinical outcomes of ICIs in cancer patients. There are several potential interventions to modulate their functioning, e.g., through pharmaceutical intervention, prebiotics and probiotics, diet and supplements, and fecal microbiota transplantation (FMT) [42]. For instance, Renga et al. (2022), in a study on a murine model of melanoma, demonstrated that indole-3-carboxaldehyde (known to contribute to the maintenance of the intestinal barrier homeostasis) prevented intestinal damage associated with ICI-induced colitis and simultaneously did not interfere with the anticancer activity of anti-CTLA-4 therapy [43].
As baseline concentration of fecal SIgA was increased in patients with favorable clinical outcomes (Figure 1E and F) and its high baseline level correlated with longer PFS and OS (Figure 3I – L) in the study cohort, the Ig-bound fraction of total stool microbiota was purified, and its bacterial composition alongside the total stool microbiota composition was analyzed. The Ig-bound stool microbiota fraction could consist of microorganisms coated with IgA, IgG, and IgM. However, those coated with IgAs should constitute the largest fraction as SIgA is the dominant Ig produced in the intestinal secretions, while both IgG and IgM were found to be produced in much lower amounts in the gut [13].
The analysis indicated that the Ig-bound stool microbiota of advanced melanoma patients undergoing anti-PD-1 therapy was dominated by Bacillota phylum members regardless of clinical outcome or collection time point (Figure 4B and D). For comparison, the Bacillota phylum was also the dominant one in the total stool microbiota; however, its dominance was less evident (Figure 4A and C). Noteworthy, the Bacillota phylum that elicited Ig responses in our cohort, was enriched in the baseline fecal microbiota of metastatic melanoma patients, who benefited from the anti-CTLA-4 therapy and more frequently experienced treatment-induced colitis [44]. These findings demonstrated that Bacillota phylum members influenced intestinal and systemic immunity. Consistently with the trends observed at the phylum level, beta diversity analysis indicated that the Ig-bound stool microbiota and the total stool microbiota shared a substantial subset of bacterial genera (Figure 7A); however, the genera' relative abundance patterns differed between them (Figure 7B). In line with that, some bacterial genera were detected only in the total or Ig-bound stool microbiota. While the presence of unique taxa in the total stool microbiota implies that a subset of bacteria was not coated with Igs, the detection of unique genera in the Ig-bound stool microbiota was unexpected. Differences in the genera’s relative abundance patterns between the microbiotas may resulted from the variations in the induction of Ig responses between bacterial genera, as it was demonstrated by Yang et al. (2020) [37]. On the other hand, they (and the detection of unique genera in the Ig-bound stool microbiota) may be associated with the process of fraction purification that could lead to the enrichment in rare microorganisms. As a result, efficient amplification of their sequences and identification were feasible in the Ig-bound stool microbiota, but masked by the diversity in the total stool microbiota. It was shown that primers used for amplification may preferentially bind to certain sequences, leading to differential amplification efficiency. Consequently, some microbial groups could be overrepresented while others, particularly rare taxa, underrepresented or missed entirely [45]. Furthermore, factors such as the number of PCR cycles, annealing temperatures, and the presence of inhibitors could introduce biases during amplification. Overamplification could lead to the dominance of certain sequences, masking the presence of rare microorganisms [46].
Furthermore, it was found that the relative abundance median values of bacterial genera in the Ig-bound and total stool microbiota correlated positively in all advanced melanoma patients undergoing anti-PD-1 therapy and subgroups of patients with favorable and unfavorable clinical outcomes at T0 and T1 (Figure 8 and Figure S3). However, the Spearman’sρ value have changed during treatment, and trends in the changes were opposite between patients with distinct clinical outcomes (Figure 8 and Figure S3). These findings suggest that the anti-PD-1 therapy may affect Ig production in the intestines. This, in turn, may exert an impact on immune responses at the tumor site and clinical outcomes of the immunotherapy, as the most evident differences were found in the comparison between patients, who benefited from the anti-PD-1 therapy and those, who progressed. The impact of the anti-PD-1 therapy on the Ig production may also trigger the development of late adverse effects. Consistently, changes in the Ig-bound stool microbiota composition were observed during the anti-PD-1 therapy at the phylum (Figure 5) and genus level (the DAA, Figure 6). These changes were more noticeable in patients with unfavorable clinical outcomes than those with favorable ones (Figure 5 and Figure 6). The DAA also revealed that the highest variance in the relative abundance of bacterial genera in the Ig-bound stool microbiota fraction between patients with favorable and unfavorable clinical outcomes was at baseline (expressed as the number of differentially abundant genera); during treatment, the differences in the microbial signatures between subgroups were less evident (Figure 6). Noteworthy, fecal SIgA level was also higher at baseline in patients with favorable clinical outcomes as compared to those with unfavorable ones. These findings also imply that anti-PD-1 therapy could exert an impact on the Ig response. In line with that, previous studies demonstrated the association between PD-1 expression on Peyer’s patches (PPs) T cells and IgA production [47,48,49]. Kawamoto et al. (2012) indicated that PD-1 deficiency was associated with an excessive generation of T follicular helper (TFH) cells with altered phenotypes that lead to impaired selection of IgA+ B cells in the germinal centers (GCs) of PPs [47,48]. As a result, the IgAs produced in PD-1-deficient mice had reduced bacteria-binding capacity. That caused compositional alterations in the gut microbiota (a decrease in the anaerobic bacteria, Bifidobacterium genus, and Bacteroides genus, and an increase in the Enterobacteriaceae family as compared to wild-type mice). Gut microbiota dysbiosis and associated disruption of epithelial integrity resulted in an excessive activation of the whole body immune system and an expansion of self-reactive B and T cells and auto-antibody production. Additionally, Zhang et al. (2015) demonstrated that intestinal ischemia/reperfusion in mice decreased PD-1/PD-L1 interaction on PP CD4+ T cells [49]. Lower PD-1/PD-L1 expression correlated with reduced production of cytokines involved in the proliferation and differentiation of IgA+ B cells, such as transforming growth factor-β1 (TGF- β1) and interleukin-21 (IL-21), impaired intestinal IgA synthesis, and mucosal integrity. Collectively, these findings suggest that PD-1/PD-L signaling plays an important role in the regulation of IgA production and, consequently, affects the composition of the gut microbiota, intestinal barrier, and systemic immunity. All of these factors were found to exert an impact on clinical outcomes of ICIs in cancer patients [8,50]. To our knowledge, the influence of anti-PD-1 therapy on IgA production in the intestinal mucosa and, consequently, its effect on treatment efficacy has not been studied so far. However, changes in the Ig-bound stool microbiota composition during treatment (Figure 5, Figure 6, Figure 8, and Figure S3), especially those observed in patients, who did not respond or benefit from the anti-PD-1 therapy suggest that: firstly, anti-PD-1 antibodies, introduced to advanced melanoma patients, affected SIgA generation, leading to distinct effects in patients with favorable and unfavorable clinical outcomes; secondly, in patients who did not benefit from the immunotherapy, anti-PD-1 antibodies inhibited the PD-1/PD-L interaction in the intestinal mucosa and therefore, affected IgA production; thirdly, changes in the SIgA production affected the gut microbiota composition, and consequently the whole-body immune system and clinical outcomes of anti-PD-1 therapy. In line with that, the composition of the total stool microbiota has changed during treatment, i.e., there were alterations in the relative abundance patterns at the phylum level (Figure S1B, E, and F) and at the genus level indicated in the DAA (Figure S2A and B). Noteworthy, changes in the total stool microbiota composition during the anti-PD-1 therapy, similarly to trends observed in the Ig-bound stool microbiota fraction, were more evident in patients with unfavorable clinical outcomes (Figures S1 and S2), supporting our assumption that anti-PD-1 antibodies could affect the gut microbiota through the disruption of IgA generation. On the other hand, there were found no statistically significant changes in the intestinal barrier state biomarker levels during treatment within study subgroups (Figure 1), which indicates a lack of profound influence of the anti-PD-1 therapy on the intestinal barrier functionality. However, it is worth noting that the median fecal SIgA concentration tended to decrease at Tn (as compared to the baseline median level) in the R subgroup, while in the NR subgroup, it increased ~2 times at T1, being comparable to that observed in the R subgroup at T1, and decreased at Tn, being comparable to that observed at baseline (Figure 1). Accordingly, Kawamoto et al. (2012) reported that despite of reduced bacteria-binding capacity in the PD-1-deficient mice, the concentration of free IgA in intestinal secretions was higher in them than in wild-type mice [47,48].
Taken together, our study demonstrated that alterations in the Ig responses, potentially associated with the introduction of anti-PD-1 antibodies, could affect the composition of the gut microbiota in advanced melanoma patients, and, therefore, influence the clinical outcomes of the immunotherapy. However, intestinal immunity responses could also shape anti-cancer immune responses through the modification of the functional potential of the gut microbiota. It was reported that bacterial antigen coating by SIgA may affect the function of the targeted microbe [51], and not necessarily its abundance. Briefly, Rollenske et al. (2021), in a study on a murine model monocolonized with Escherichia coli, demonstrated that exposure of the intestinal mucosa with a single transitory microbe induced the generation of antigen-specific dimeric SIgA that targeted a wide range of membrane-associated antigens. Monoclonal IgA (mIgA) binding to bacterial antigens exerted distinct alterations in microbial function and metabolism (also when mIgAs targeted the same antigens). The outcome on the target bacterium was shaped by the context and specificity of mIgAs. On the other hand, surface-binding mIgAs induced generic functional effects on the bacteria associated with their motility and susceptibility to bile acids. In our study, we found numerous correlations between the particular relative abundances of bacterial ASVs in the Ig-bound and total stool microbiota in the R and NR subgroups at baseline (Table S2). Moreover, these correlations differed between those subgroups, and a subset of them was opposed. Among bacterial taxa in the Ig-bound stool microbiota that correlated with taxa in the total stool microbiota, and their correlations were opposed in the R vs. NR subgroups, there were those indicated in previous studies as favorable or unfavorable in cancer patients undergoing ICI therapy, such as Akkermansia muciniphila, Faecalibacterium prausnitzii, Bacteroides sp., and Bifidobacterium sp. [52,53,54,55,56]. According the findings of Rollenske et al. (2021) [51], observed correlations indicate that the presence or absence of bacterial taxa does not fully reflect their functional activities and their influence on anti-cancer immune responses (both favorable and unfavorable), as they may be changed by Ig coating. This phenomenon may explain, at least partially, the existing discrepancies between microbiome studies in cancer patients treated with ICIs and extend our understanding of the complexity of host immunity-gut microbiota interaction. To our knowledge, our study is the first one that investigated the composition of the Ig-bound stool microbiota fraction in advanced melanoma patients undergoing anti-PD-1 therapy and shed light on the association between intestinal immunity and clinical outcomes of the immunotherapy. Future studies are required to provide mechanistic insight into the association between PD-1 antibodies and SIgA production and the relationship between intestinal immunity, gut microbiota, and anticancer immune responses. Moreover, it should be also investigated whether the introduction of SIgAs targeting specific microbial antigens (that may induce diverse functional changes [51]) could constrain gut microbes for mutualistic behavior within the host intestine or lead to their eradication from the gastrointestinal tract and serve as a strategy to improve the clinical outcomes of the ICI therapy. Richards et al. (2021) demonstrated that passive oral administration of human recombinant Sal4 SIgA (specific for the O5 antigen of Salmonella enterica serovar Typhimurium lipopolysaccharide) led to the entrapment of the pathogen within the intestinal lumen and remarkably reduced its invasion into the gut-associated lymphoid tissue in mice [57]. This study indicated that specific SIgAs have the potential to combat pathogenic species. If the targeted modification of the gut microbiota through SIgAs was achievable, it would provide an alternative to conventional FMT, which possess several limitations, such as risk of pathogen transfer, stool toxicity, low reproducibility, and transient long-term outcome [58].
Our study has several limitations. Firstly, the study comprised a small number of patients, which limited the power of statistical analyses. Secondly, the V3-V4 region of 16S rRNA gene sequencing, which was performed to analyze the composition of the Ig-bound and total stool microbiota, allowed only for the detection of bacterial and archaeal sequences, while viruses and fungi could also be present in these microbial communities. Therefore, it is recommended to use whole-genome sequencing to provide a comprehensive analysis of the composition and functional potential of the investigated microbiotas. Thirdly, the specificity of Igs, their microbe-binding capacity, and antigens that elicited Ig responses (potential food allergies) were not analyzed in our study. Thus, future mechanistic studies that will extend our understanding of the role of intestinal immunity in shaping anti-cancer immune responses are warranted.
5. Conclusions
The association between intestinal barrier state biomarkers, in particular fecal SIgA, and clinical outcomes of ani-PD-1 therapy in the study cohort revealed an important role of intestinal barrier functionality in shaping anti-cancer immune responses in advanced melanoma patients undergoing anti-PD-1 therapy. Moreover, the link between intestinal immunity, gut microbiota, and potentially whole-body immunity, that affected immune responses at the tumor site, was indicated by the differences in the Ig-bound stool microbiota composition between patients with favorable and unfavorable clinical outcomes of the immunotherapy and changes in the microbiota signatures during treatment. Our findings demonstrated that indicators of intestinal barrier state may serve as potential biomarkers and/or therapeutic targets. However, their clinical value and utility have to be evaluated in future studies.
Supplementary Materials
The following supporting information can be downloaded at the website of this paper posted on Preprints.org. The research paper was prepared using the infrastructure of the Poznań Supercomputing and Networking Center.
Author Contributions
Conceptualization, M.S., J.M. and A.M.; methodology, B.D., Ł.G. and M.S.; software, M.S.; formal analysis, B.D. and M.S.; investigation, B.D., K.T., A.O.-S., Ł.G., J.M., M.K., A.M. and M.S.; resources, B.D., K.T., A.O.-S. and M.S.; data curation, B.D., K.T., Ł.G. and M.S.; writing – original draft preparation, B.D.; writing – review and editing, all authors; visualization, M.S. and B.D.; supervision, M.S.; project administration, M.S.; funding acquisition, M.S. All authors have read and agreed to the published version of the manuscript.
Funding
This work was supported by the National Science Centre, Poland (grant number 2017/25/B/NZ5/01949).
References
- Liu X, Chen Y, Zhang S, Dong L. Gut microbiota-mediated immunomodulation in tumor. Journal of Experimental & Clinical Cancer Research. 2021;40: 221. [CrossRef]
- McCulloch JA, Davar D, Rodrigues RR, Badger JH, Fang JR, Cole AM, et al. Intestinal microbiota signatures of clinical response and immune-related adverse events in melanoma patients treated with anti-PD-1. Nat Med. 2022;28: 545–556. [CrossRef]
- Pietrzak B, Tomela K, Olejnik-Schmidt A, Galus Ł, Mackiewicz J, Kaczmarek M, et al. A Clinical Outcome of the Anti-PD-1 Therapy of Melanoma in Polish Patients Is Mediated by Population-Specific Gut Microbiome Composition. Cancers. 2022;14: 5369. [CrossRef]
- Björk JR, Bolte LA, Maltez Thomas A, Lee KA, Rossi N, Wind TT, et al. Longitudinal gut microbiome changes in immune checkpoint blockade-treated advanced melanoma. Nat Med. 2024; 1–12. [CrossRef]
- Gunjur A, Shao Y, Rozday T, Klein O, Mu A, Haak BW, et al. A gut microbial signature for combination immune checkpoint blockade across cancer types. Nat Med. 2024; 1–13. [CrossRef]
- Li W, Deng Y, Chu Q, Zhang P. Gut microbiome and cancer immunotherapy. Cancer Letters. 2019;447: 41–47. [CrossRef]
- Thursby E, Juge N. Introduction to the human gut microbiota. Biochem J. 2017;474: 1823–1836. [CrossRef]
- Ouaknine Krief J, Helly de Tauriers P, Dumenil C, Neveux N, Dumoulin J, Giraud V, et al. Role of antibiotic use, plasma citrulline and blood microbiome in advanced non-small cell lung cancer patients treated with nivolumab. J Immunother Cancer. 2019;7: 176. [CrossRef]
- Jendraszak M, Gałęcka M, Kotwicka M, Schwiertz A, Regdos A, Pazgrat-Patan M, et al. Impact of Biometric Patient Data, Probiotic Supplementation, and Selected Gut Microorganisms on Calprotectin, Zonulin, and sIgA Concentrations in the Stool of Adults Aged 18–74 Years. Biomolecules. 2022;12: 1781. [CrossRef]
- Fasano, A. All disease begins in the (leaky) gut: role of zonulin-mediated gut permeability in the pathogenesis of some chronic inflammatory diseases. F1000Res. 2020;9: F1000 Faculty Rev-69. [CrossRef]
- Sturgeon C, Fasano A. Zonulin, a regulator of epithelial and endothelial barrier functions, and its involvement in chronic inflammatory diseases. Tissue Barriers. 2016;4: e1251384. [CrossRef]
- Jukic A, Bakiri L, Wagner EF, Tilg H, Adolph TE. Calprotectin: from biomarker to biological function. Gut. 2021;70: 1978–1988. [CrossRef]
- León ED, Francino MP. Roles of Secretory Immunoglobulin A in Host-Microbiota Interactions in the Gut Ecosystem. Frontiers in Microbiology. 2022;13. Available: https://www.frontiersin.org/articles/10.3389/fmicb.2022.880484.
- Pietrzak B, Tomela K, Olejnik-Schmidt A, Mackiewicz A, Schmidt M. Secretory IgA in Intestinal Mucosal Secretions as an Adaptive Barrier against Microbial Cells. Int J Mol Sci. 2020;21: 9254. [CrossRef]
- Smeekens JM, Johnson-Weaver BT, Hinton AL, Azcarate-Peril MA, Moran TP, Immormino RM, et al. Fecal IgA, Antigen Absorption, and Gut Microbiome Composition Are Associated With Food Antigen Sensitization in Genetically Susceptible Mice. Frontiers in Immunology. 2021;11. Available: https://www.frontiersin.org/articles/10.3389/fimmu.2020.599637.
- IDK® sIgA ELISA manual. Available: https://www.immundiagnostik.com/media/pages/portfolio/testkits/k-8870/1d2221d6f2-1716973072/k8870_2022-02-11_siga.pdf.
- IDK® Calprotectin ELISA manual. Available: https://www.immundiagnostik.com/media/pages/portfolio/testkits/k-6927/6559e3eb39-1722607637/k6927_2024-08-01_idk_calprotectin_stuhl_1h.pdf.
- IDK® Zonulin ELISA. Available: https://www.immundiagnostik.com/media/pages/portfolio/testkits/k-5600/14bda1a046-1716973056/k5600_2023-07-25_idk-zonulin-elisa.pdf.
- Szmulski Ł. Obwieszczenie Nr 65 Ministra Zdrowia z Dnia 30 Sierpnia 2019 r. w Sprawie Wykazu Refundowanych Leków, Środków Spożywczych Specjalnego Przeznaczenia Żywieniowego Oraz Wyrobów Medycznych. Off. J. Minist. Health-Pol. 2019, 65, 906–913.
- Dore J, Ehrlich SD, Levenez F, Pelletier E, Alberti A, Bertand L. IHMS_SOP 05 V1: Standard operating procedure for fecal samples preserved in stabilizing solution self-collection, laboratory analysis handled within 24 hours to 7 days (24 hours<x≤ 7 days). Int. Hum. Microbiome Stand.; 2015.
- Madhwani T, McBain AJ. The Application of Magnetic Bead Selection to Investigate Interactions between the Oral Microbiota and Salivary Immunoglobulins. PLOS ONE. 2016;11: e0158288. [CrossRef]
- Klindworth A, Pruesse E, Schweer T, Peplies J, Quast C, Horn M, et al. Evaluation of general 16S ribosomal RNA gene PCR primers for classical and next-generation sequencing-based diversity studies. Nucleic Acids Research. 2013;41: e1. [CrossRef]
- Schmidt, M. DADA2 formatted Silva SSU taxonomic training data (Silva version 138.1) with emended description of the genus Lactobacillus Beijerinck 1901. Zenodo; 2023. [CrossRef]
- Houtman TA, Eckermann HA, Smidt H, de Weerth C. Gut microbiota and BMI throughout childhood: the role of firmicutes, bacteroidetes, and short-chain fatty acid producers. Sci Rep. 2022;12: 3140. [CrossRef]
- Lozupone CA, Hamady M, Kelley ST, Knight R. Quantitative and Qualitative β Diversity Measures Lead to Different Insights into Factors That Structure Microbial Communities. Applied and Environmental Microbiology. 2007;73: 1576–1585. [CrossRef]
- Drymel B, Tomela K, Galus Ł, Olejnik-Schmidt A, Mackiewicz J, Kaczmarek M, et al. Circulating Cell-Free Microbial DNA Signatures and Plasma Soluble CD14 Level Are Associated with Clinical Outcomes of Anti-PD-1 Therapy in Advanced Melanoma Patients. International Journal of Molecular Sciences. 2024;25: 12982. [CrossRef]
- McKenzie AT, Katsyv I, Song W-M, Wang M, Zhang B. DGCA: A comprehensive R package for Differential Gene Correlation Analysis. BMC Systems Biology. 2016;10: 106. [CrossRef]
- Legendre P, Gallagher ED. Ecologically meaningful transformations for ordination of species data. Oecologia. 2001;129: 271–280. [CrossRef]
- Yerke A, Fry Brumit D, Fodor AA. Proportion-based normalizations outperform compositional data transformations in machine learning applications. Microbiome. 2024;12: 45. [CrossRef]
- Kusnadi Y, Saleh MI, Ali Z, Hermansyah H, Murti K, Hafy Z, et al. Firmicutes/Bacteroidetes Ratio of Gut Microbiota and Its Relationships with Clinical Parameters of Type 2 Diabetes Mellitus: A Systematic Review. Open Access Macedonian Journal of Medical Sciences. 2023;11: 67–72. [CrossRef]
- Stojanov S, Berlec A, Štrukelj B. The Influence of Probiotics on the Firmicutes/Bacteroidetes Ratio in the Treatment of Obesity and Inflammatory Bowel disease. Microorganisms. 2020;8: 1715. [CrossRef]
- Ponziani FR, De Luca A, Picca A, Marzetti E, Petito V, Del Chierico F, et al. Gut Dysbiosis and Fecal Calprotectin Predict Response to Immune Checkpoint Inhibitors in Patients With Hepatocellular Carcinoma. Hepatology Communications. 2022;6: 1492–1501. [CrossRef]
- Coutzac C, Jouniaux J-M, Paci A, Schmidt J, Mallardo D, Seck A, et al. Systemic short chain fatty acids limit antitumor effect of CTLA-4 blockade in hosts with cancer. Nat Commun. 2020;11: 2168. [CrossRef]
- Verdam FJ, Fuentes S, de Jonge C, Zoetendal EG, Erbil R, Greve JW, et al. Human intestinal microbiota composition is associated with local and systemic inflammation in obesity. Obesity. 2013;21: E607–E615. [CrossRef]
- Hiippala K, Kainulainen V, Suutarinen M, Heini T, Bowers JR, Jasso-Selles D, et al. Isolation of Anti-Inflammatory and Epithelium Reinforcing Bacteroides and Parabacteroides Spp. from A Healthy Fecal Donor. Nutrients. 2020;12: 935. [CrossRef]
- Rajput M, Momin T, Singh A, Banerjee S, Villasenor A, Sheldon J, et al. Determining the association between gut microbiota and its metabolites with higher intestinal Immunoglobulin A response. Veterinary and Animal Science. 2023;19: 100279. [CrossRef]
- Yang C, Mogno I, Contijoch EJ, Borgerding JN, Aggarwala V, Li Z, et al. Fecal IgA levels are determined by strain-level differences in Bacteroides ovatus and are modifiable by gut microbiota manipulation. Cell Host Microbe. 2020;27: 467-475.e6. [CrossRef]
- Chalkias A, Nikotian G, Koutsovasilis A, Bramis J, Manouras A, Mystrioti D, et al. Patients With Colorectal Cancer Are Characterized by Increased Concentration of Fecal Hb-Hp Complex, Myeloperoxidase, and Secretory IgA. American Journal of Clinical Oncology. 2011;34: 561. [CrossRef]
- Joshi S, Lewis SJ, Creanor S, Ayling RM. Age-related faecal calprotectin, lactoferrin and tumour M2-PK concentrations in healthy volunteers. Ann Clin Biochem. 2010;47: 259–263. [CrossRef]
- Ohlsson B, Roth B, Larsson E, Höglund P. Calprotectin in serum and zonulin in serum and feces are elevated after introduction of a diet with lower carbohydrate content and higher fiber, fat and protein contents. Biomed Rep. 2017;6: 411–422. [CrossRef]
- Marino M, Del Bo’ C, Martini D, Perna S, Porrini M, Cherubini A, et al. A (poly)phenol-rich diet reduces serum and faecal calprotectin in older adults with increased intestinal permeability: the MaPLE randomised controlled trial. BMC Geriatrics. 2024;24: 707. [CrossRef]
- Lopez SH, Jalving M, Fehrmann RSN, Nagengast WB, Vries EGE de, Haan JJ de. The gut wall’s potential as a partner for precision oncology in immune checkpoint treatment. Cancer Treatment Reviews. 2022;107. [CrossRef]
- Renga G, Nunzi E, Pariano M, Puccetti M, Bellet MM, Pieraccini G, et al. Optimizing therapeutic outcomes of immune checkpoint blockade by a microbial tryptophan metabolite. J Immunother Cancer. 2022;10: e003725. [CrossRef]
- Chaput N, Lepage P, Coutzac C, Soularue E, Le Roux K, Monot C, et al. Baseline gut microbiota predicts clinical response and colitis in metastatic melanoma patients treated with ipilimumab. Ann Oncol. 2017;28: 1368–1379. [CrossRef]
- Nearing JT, Douglas GM, Hayes MG, MacDonald J, Desai DK, Allward N, et al. Microbiome differential abundance methods produce different results across 38 datasets. Nat Commun. 2022;13: 342. [CrossRef]
- de la Cuesta-Zuluaga J, Escobar JS. Considerations For Optimizing Microbiome Analysis Using a Marker Gene. Front Nutr. 2016;3. [CrossRef]
- Kawamoto S, Tran TH, Maruya M, Suzuki K, Doi Y, Tsutsui Y, et al. The Inhibitory Receptor PD-1 Regulates IgA Selection and Bacterial Composition in the Gut. Science. 2012;336: 485–489. [CrossRef]
- Maruya M, Kawamoto S, Kato LM, Fagarasan S. Impaired selection of IgA and intestinal dysbiosis associated with PD-1-deficiency. Gut Microbes. 2013;4: 165. [CrossRef]
- Zhang X-Y, Liu Z-M, Zhang H, Li Y-S, Wen S-H, Shen J-T, et al. Decreased PD-1/PD-L1 Expression Is Associated with the Reduction in Mucosal Immunoglobulin A in Mice with Intestinal Ischemia Reperfusion. Dig Dis Sci. 2015;60: 2662–2669. [CrossRef]
- Tomela K, Pietrzak B, Schmidt M, Mackiewicz A. The Tumor and Host Immune Signature, and the Gut Microbiota as Predictive Biomarkers for Immune Checkpoint Inhibitor Response in Melanoma Patients. Life (Basel). 2020;10: 219. [CrossRef]
- Rollenske T, Burkhalter S, Muerner L, Von Gunten S, Lukasiewicz J, Wardemann H, et al. Parallelism of intestinal secretory IgA shapes functional microbial fitness. Nature. 2021;598: 657–661. [CrossRef]
- Frankel AE, Coughlin LA, Kim J, Froehlich TW, Xie Y, Frenkel EP, et al. Metagenomic Shotgun Sequencing and Unbiased Metabolomic Profiling Identify Specific Human Gut Microbiota and Metabolites Associated with Immune Checkpoint Therapy Efficacy in Melanoma Patients. Neoplasia. 2017;19: 848–855. [CrossRef]
- Matson V, Fessler J, Bao R, Chongsuwat T, Zha Y, Alegre M-L, et al. The commensal microbiome is associated with anti-PD-1 efficacy in metastatic melanoma patients. Science. 2018;359: 104–108. [CrossRef]
- Routy B, Le Chatelier E, Derosa L, Duong CPM, Alou MT, Daillère R, et al. Gut microbiome influences efficacy of PD-1–based immunotherapy against epithelial tumors. Science. 2018;359: 91–97. [CrossRef]
- Peters BA, Wilson M, Moran U, Pavlick A, Izsak A, Wechter T, et al. Relating the gut metagenome and metatranscriptome to immunotherapy responses in melanoma patients. Genome Medicine. 2019;11: 61. [CrossRef]
- Derosa L, Routy B, Fidelle M, Iebba V, Alla L, Pasolli E, et al. Gut Bacteria Composition Drives Primary Resistance to Cancer Immunotherapy in Renal Cell Carcinoma Patients. Eur Urol. 2020;78: 195–206. [CrossRef]
- Richards AF, Baranova DE, Pizzuto MS, Jaconi S, Willsey GG, Torres-Velez FJ, et al. Recombinant Human Secretory IgA Induces Salmonella Typhimurium Agglutination and Limits Bacterial Invasion into Gut-Associated Lymphoid Tissues. ACS Infect Dis. 2021;7: 1221–1235. [CrossRef]
- Khan R, Roy N, Ali H, Naeem M. Fecal Microbiota Transplants for Inflammatory Bowel Disease Treatment: Synthetic- and Engineered Communities-Based Microbiota Transplants Are the Future. Sakai E, editor. Gastroenterology Research and Practice. 2022;2022: 1–9. [CrossRef]
Figure 1.
The comparison of intestinal barrier state biomarker concentrations, i.e., fecal zonulin (A and B), fecal calprotectin (C and D), and fecal secretory immunoglobulin A – SIgA (E and F) in advanced melanoma patients before anti-PD-1 therapy initiation – at T0 (0) and during treatment – at T1 and Tn (1 and n, respectively). Patients were classified as responders (R) or non-responders (NR), and patients with clinical benefit (CB) or patients with no clinical benefit (NB), according to the clinical outcome. Statistics were performed using the Wilcoxon Rank Sum Test; p-value ≤ 0.05 was regarded as significant (*: p-values ≤ 0.05). The figures show that a high baseline level of fecal SIgA was associated with response and clinical benefit from the anti-PD-1 therapy in advanced melanoma patients. Statistically significant differences in the biomarker levels between noncorresponding subgroups, i.e., subgroups with distinct clinical outcomes to the anti-PD-1 therapy at different collection time points, are not marked in the figures. PD-1 – programmed death 1.
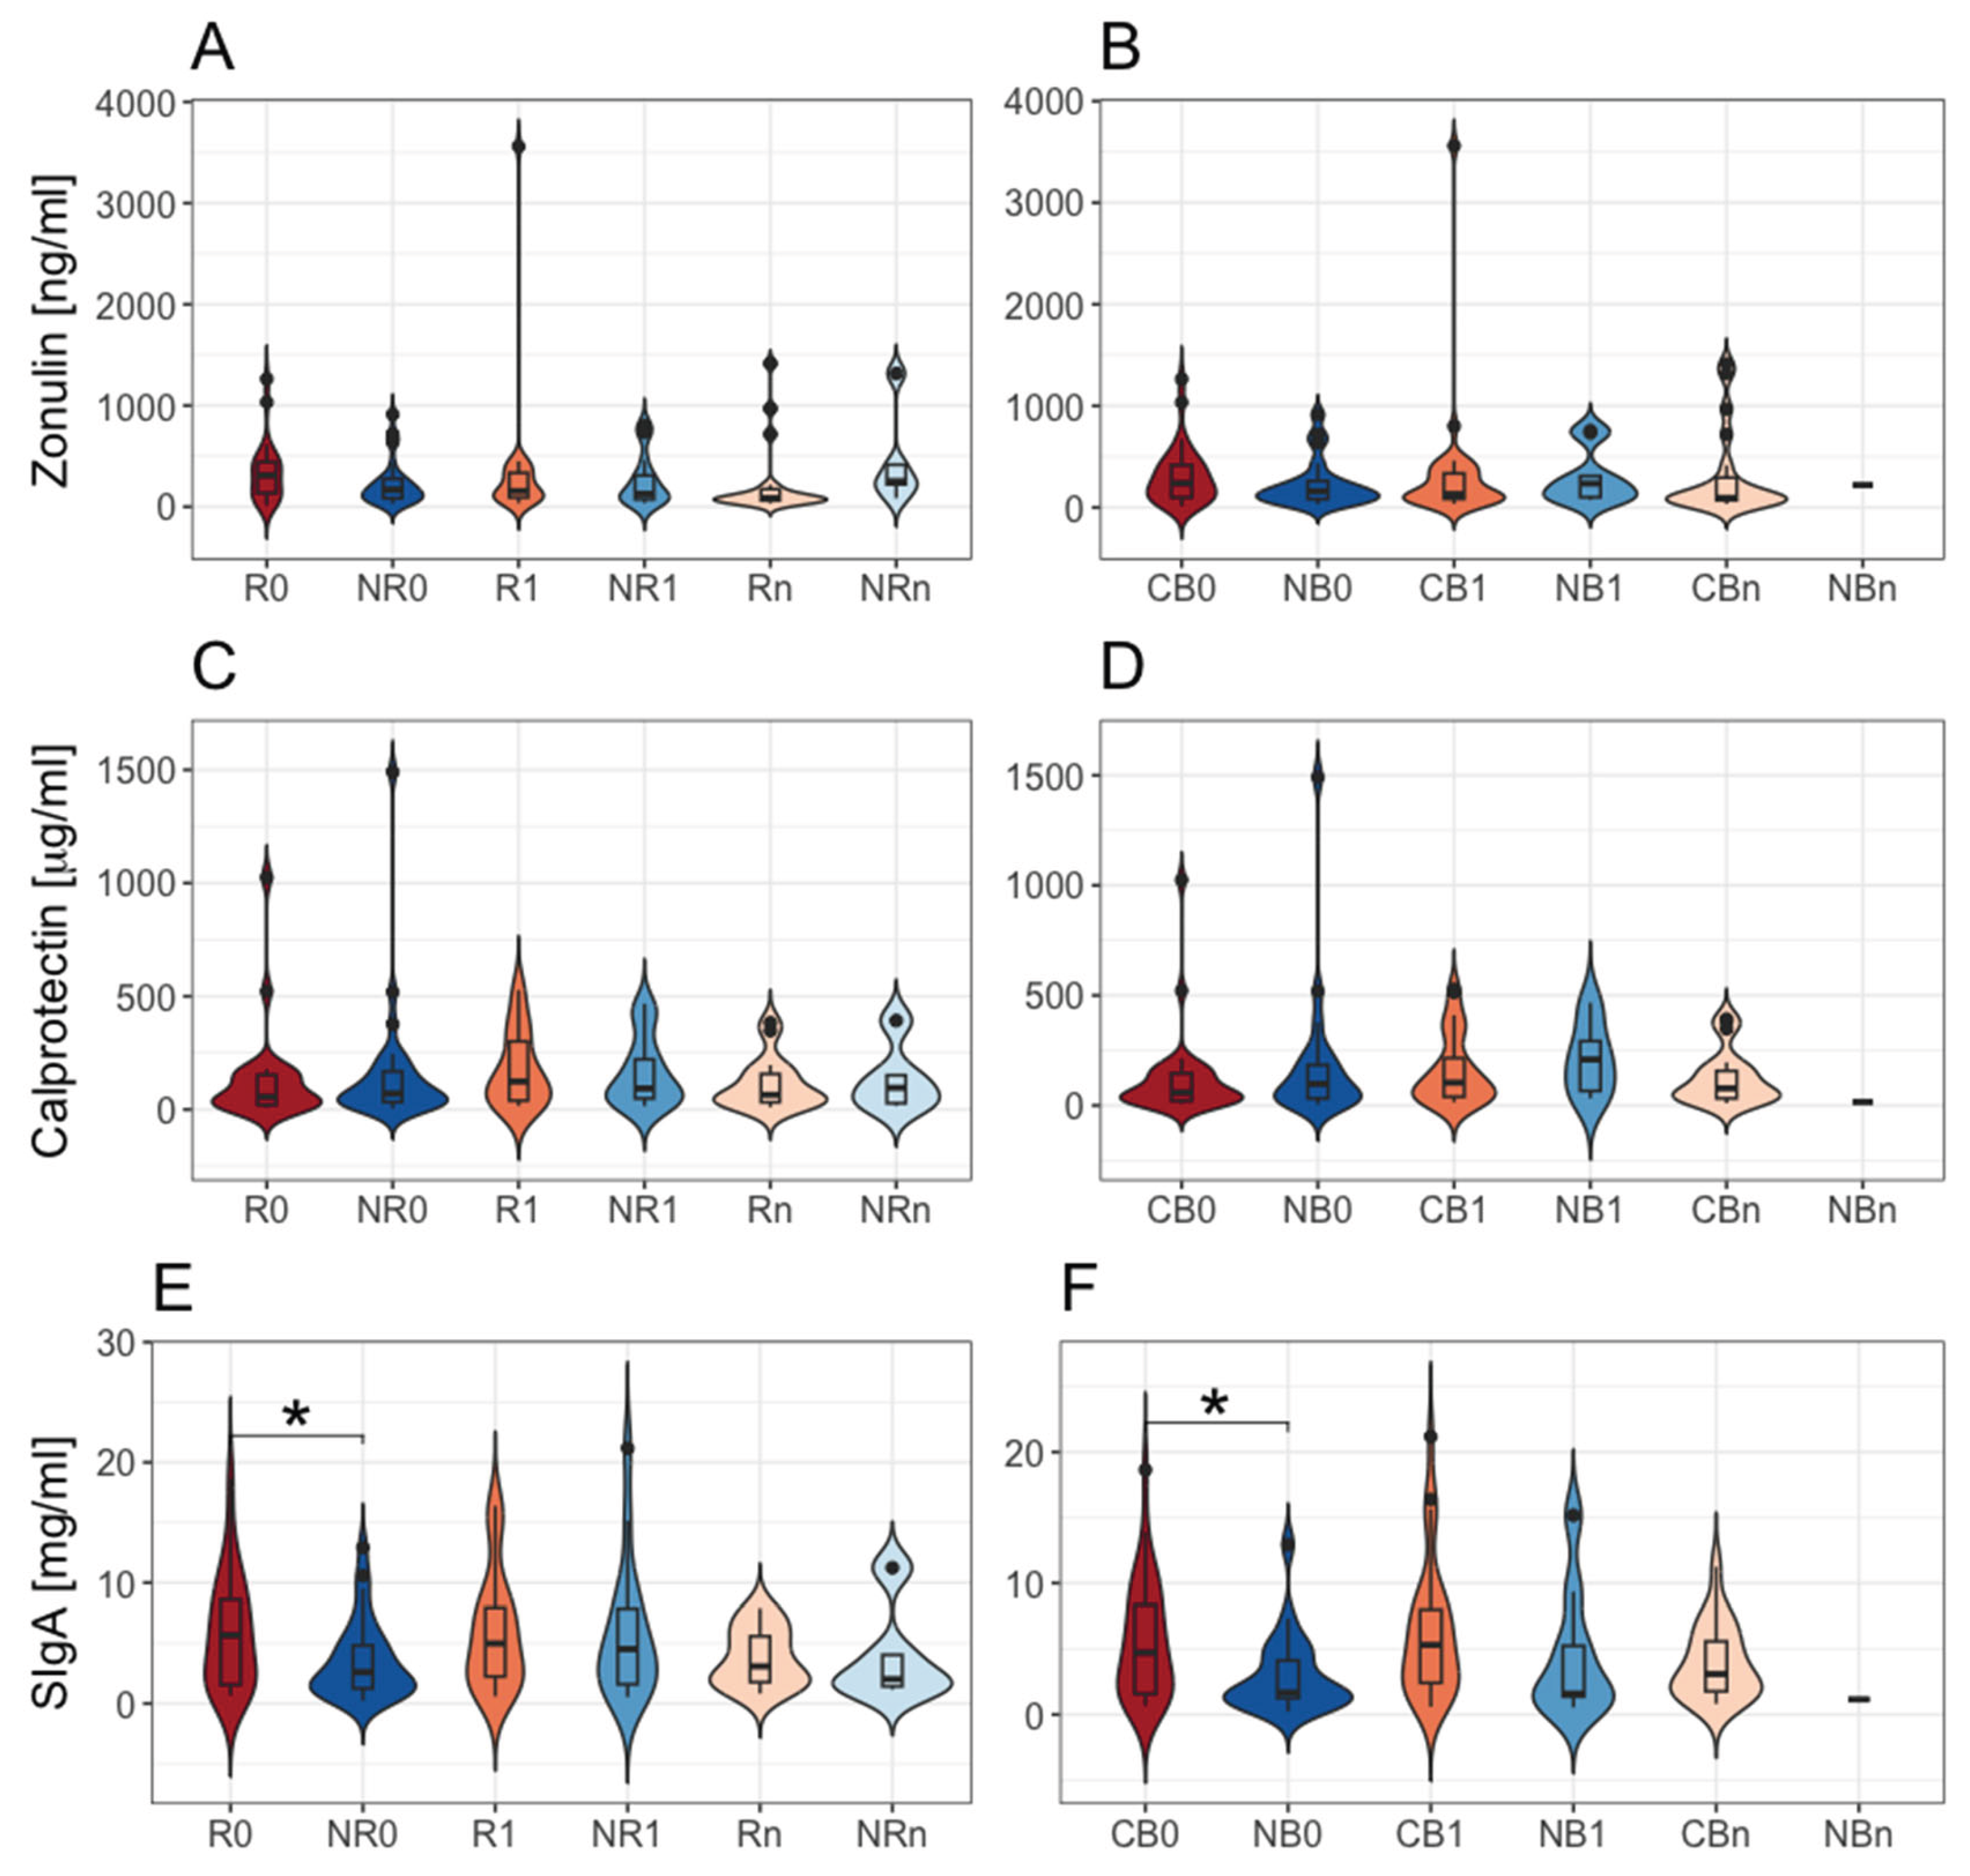
Figure 2.
The mutual correlations between intestinal barrier state biomarkers, i.e., fecal zonulin, fecal calprotectin, and fecal secretory immunoglobulin A (SIgA) and Firmicutes to Bacteroidota (FB) ratio in the total stool microbiota in advanced melanoma patients. The correlations were examined in all analyzed samples and the study subgroups at particular collection time points, i.e., before anti-PD-1 initiation at T0 (0) and during therapy at T1 and Tn (1 and n, respectively). Patients were categorized into subgroups: responders (R) or non-responders (NR) and patients with clinical benefit (CB) or those with no clinical benefit (NB) according to the clinical outcome of the immunotherapy. Statistics were performed using the Spearman’s Rank Correlation Test. The p-value ≤ 0.05 was regarded as statistically significant. Figure 2A–C show the trends observed in all analyzed samples; 2D – in the NR0 subgroup; 2E – in the NB0 subgroup; 2F – in the R0 subgroup; 2G – in the R1 subgroup; 2H – in the R0 subgroup; 2I – in the CB0 subgroup. There were found distinct correlations between analyzed biomarkers in advanced melanoma patients with favorable vs. unfavorable clinical outcomes of anti-PD-1 therapy. PD-1 – programmed death 1.
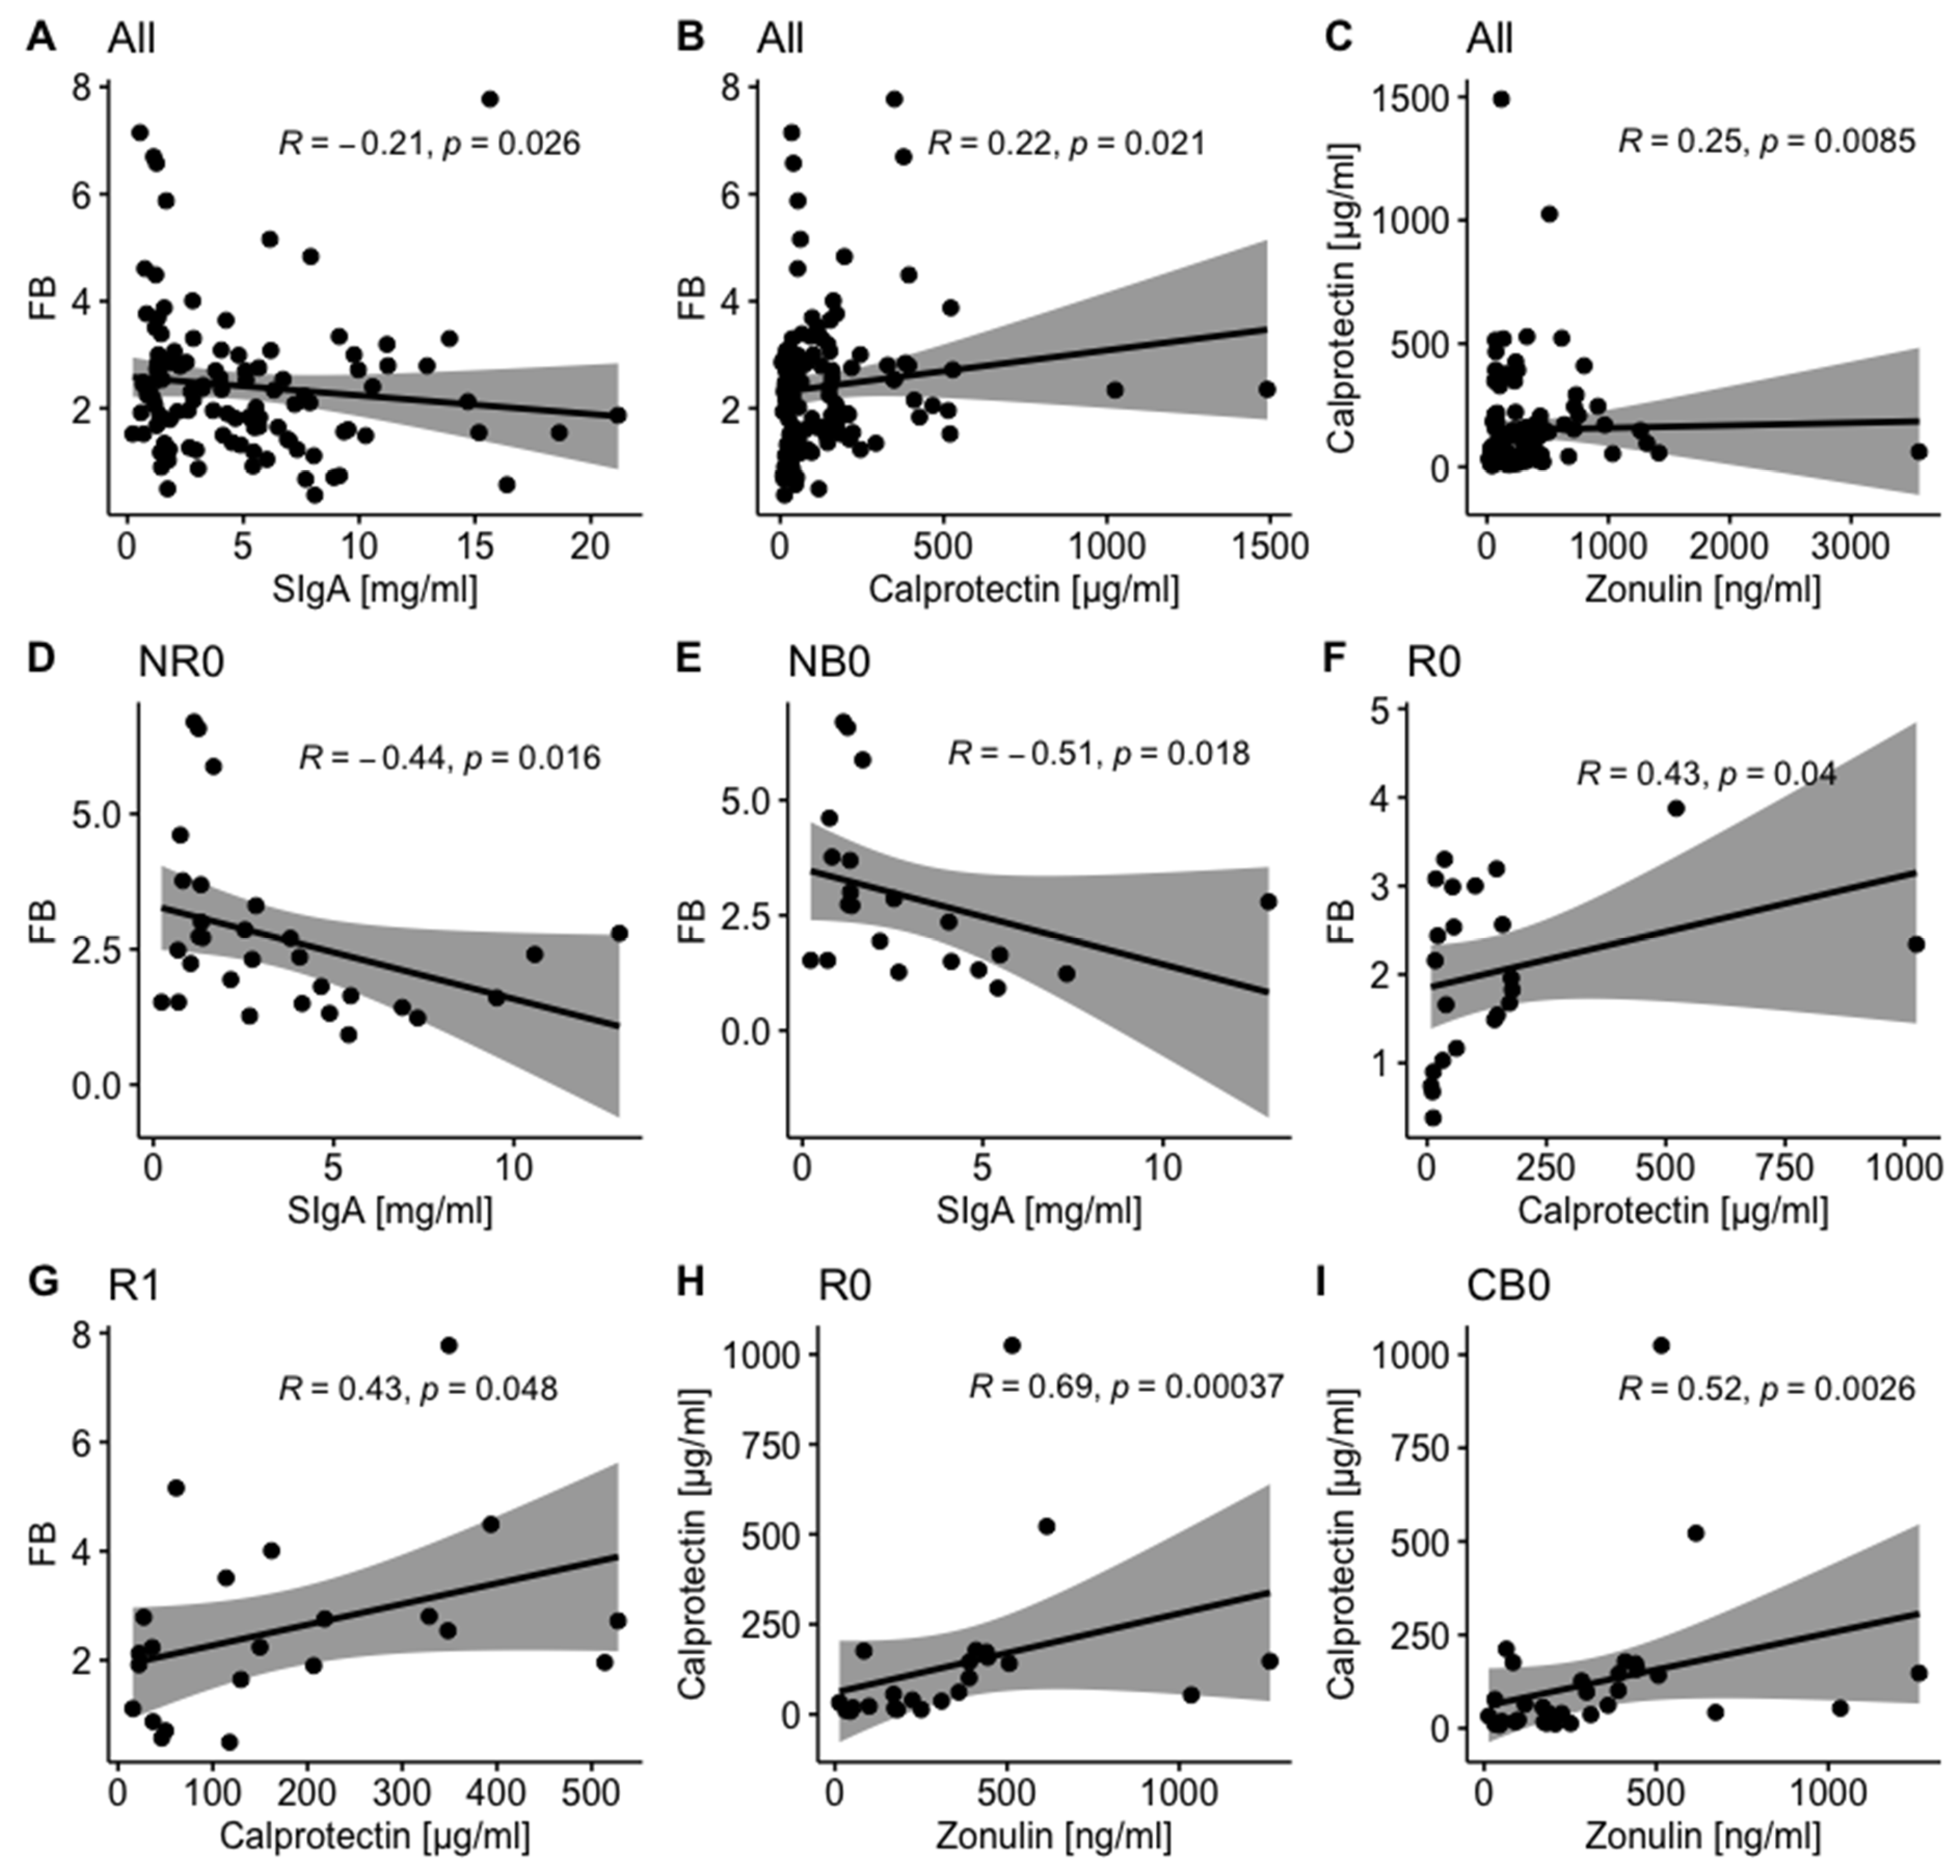
Figure 3.
The association between the baseline concentrations of investigated intestinal barrier state biomarkers, i.e., fecal zonulin (A–D), fecal calprotectin (E–H), and fecal secretory immunoglobulin A – SIgA (I–L) and survival outcomes, expressed as progression-free survival (PFS) and overall survival (OS), in advanced melanoma patients enrolled in the treatment with anti-PD-1 antibodies. On the left side of the graph, there are presented Kaplan–Meier curves of the probability of PFS (A, E, and I) and OS (C, G, and K) according to high and low levels of investigated biomarkers, which were compared using the Log-Rank (Mantel-Cox) Test; p-value ≤ 0.05 was regarded as statistically significant. Vertical ticks show censored data. The central line is the median PFS or OS probability, and the shaded area shows a 95% confidence interval. The maximally selected rank statistics were used to determine optimal cut-off points of biomarker levels. The Cox proportional hazard regression was used to examine the effects of high vs. low baseline concentrations of biomarkers on survival outcomes. On the right side (B, D, F, H, J, and L), there are presented hazard ratio (HR) and score (log-rank) test two-tailed p-value from Cox proportional hazards regression analysis (*: p-value ≤ 0.05). HR > 1 indicates an increased risk of disease progression or death, while HR < 1 – a decreased risk. The figures show that high fecal zonulin and fecal SIgA levels at baseline were associated with improved survival outcomes in advanced melanoma patients undergoing anti-PD-1 therapy, while high baseline fecal calprotectin level – with poor survival outcomes. PD-1 – programmed death 1.
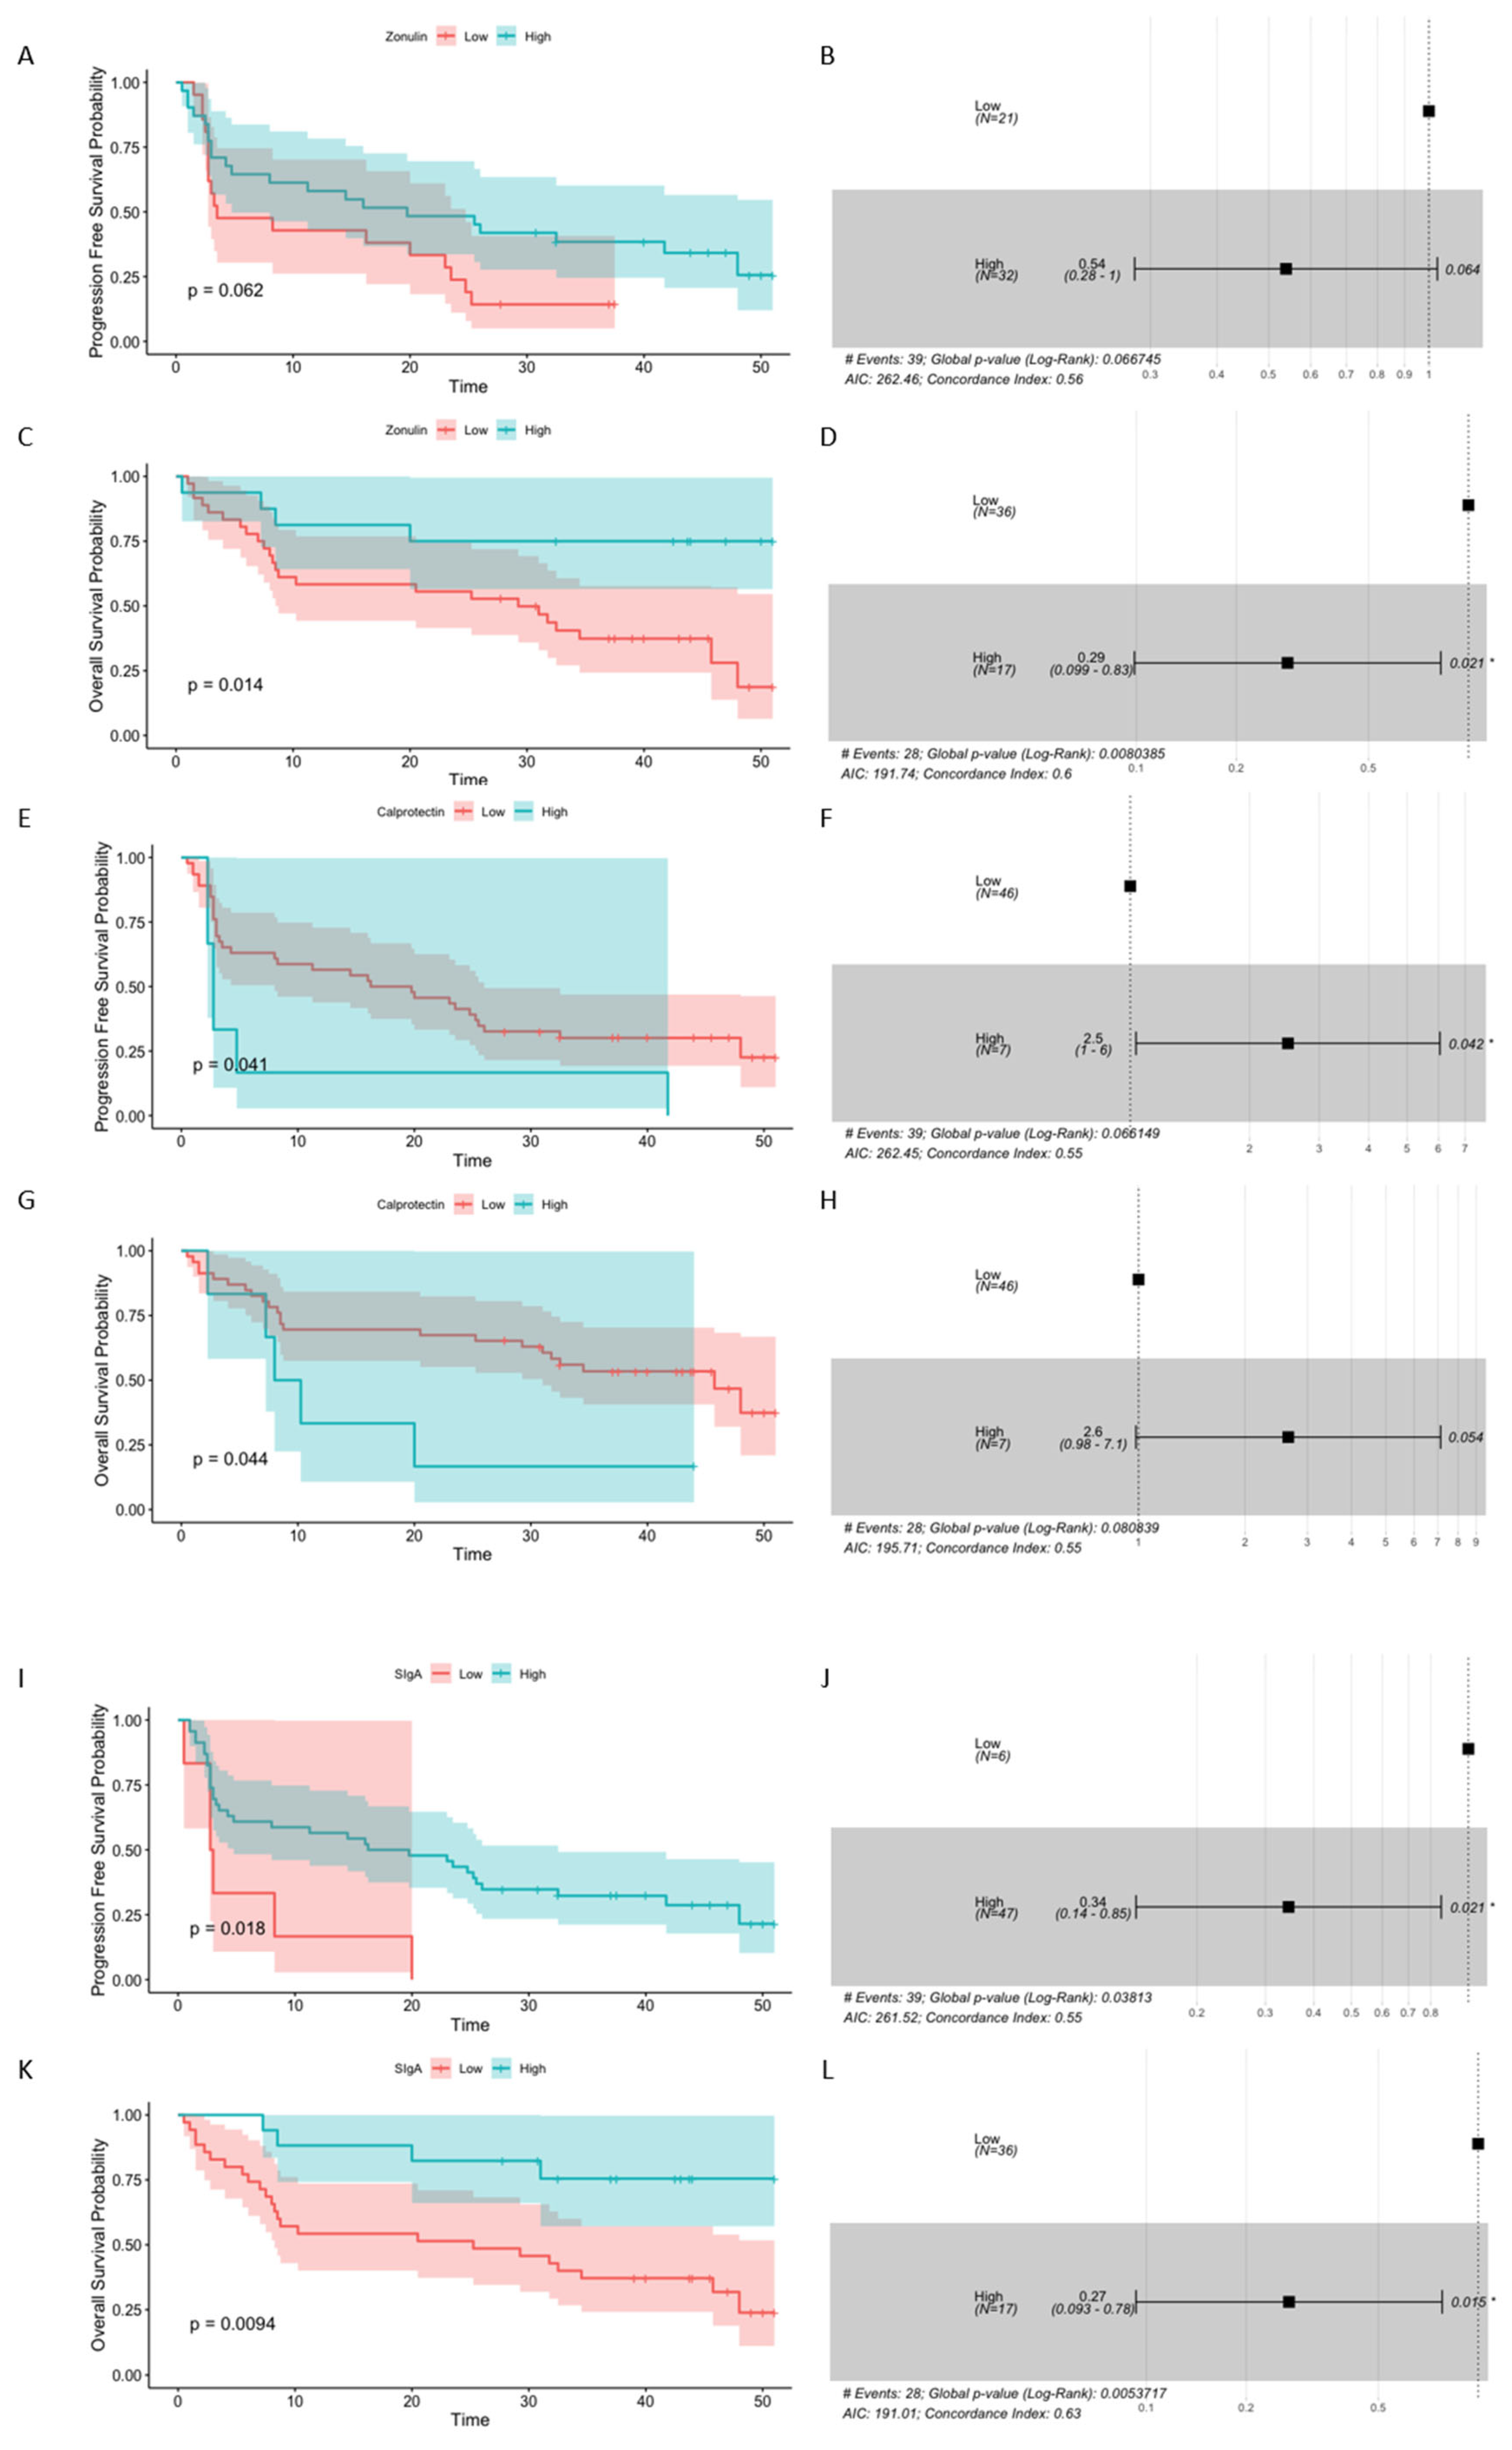
Figure 4.
Taxonomic profiles as averaged relative abundances of bacterial taxa in the total stool microbiota (A and C) and immunoglobulin (Ig)-bound stool microbiota (B and D) at the phylum level in advanced melanoma patients undergoing the anti-PD-1 therapy, before its start – at T0 (0) and during treatment – at T1 and Tn (1 and n, respectively). Patients were classified as responders – R or non-responders – NR (A and B) and as patients with clinical benefit – CB or patients with no clinical benefit – NB (C and D) according to the clinical outcome of the immunotherapy. The total stool microbiota was dominated by phyla Bacillota (formerly Firmicutes) and Bacteroidota (formerly Bacteroidetes), while in the Ig-bound stool microbiota, there was a remarkable dominance of phylum Bacillota members in all study subgroups. PD-1 – programmed death 1.
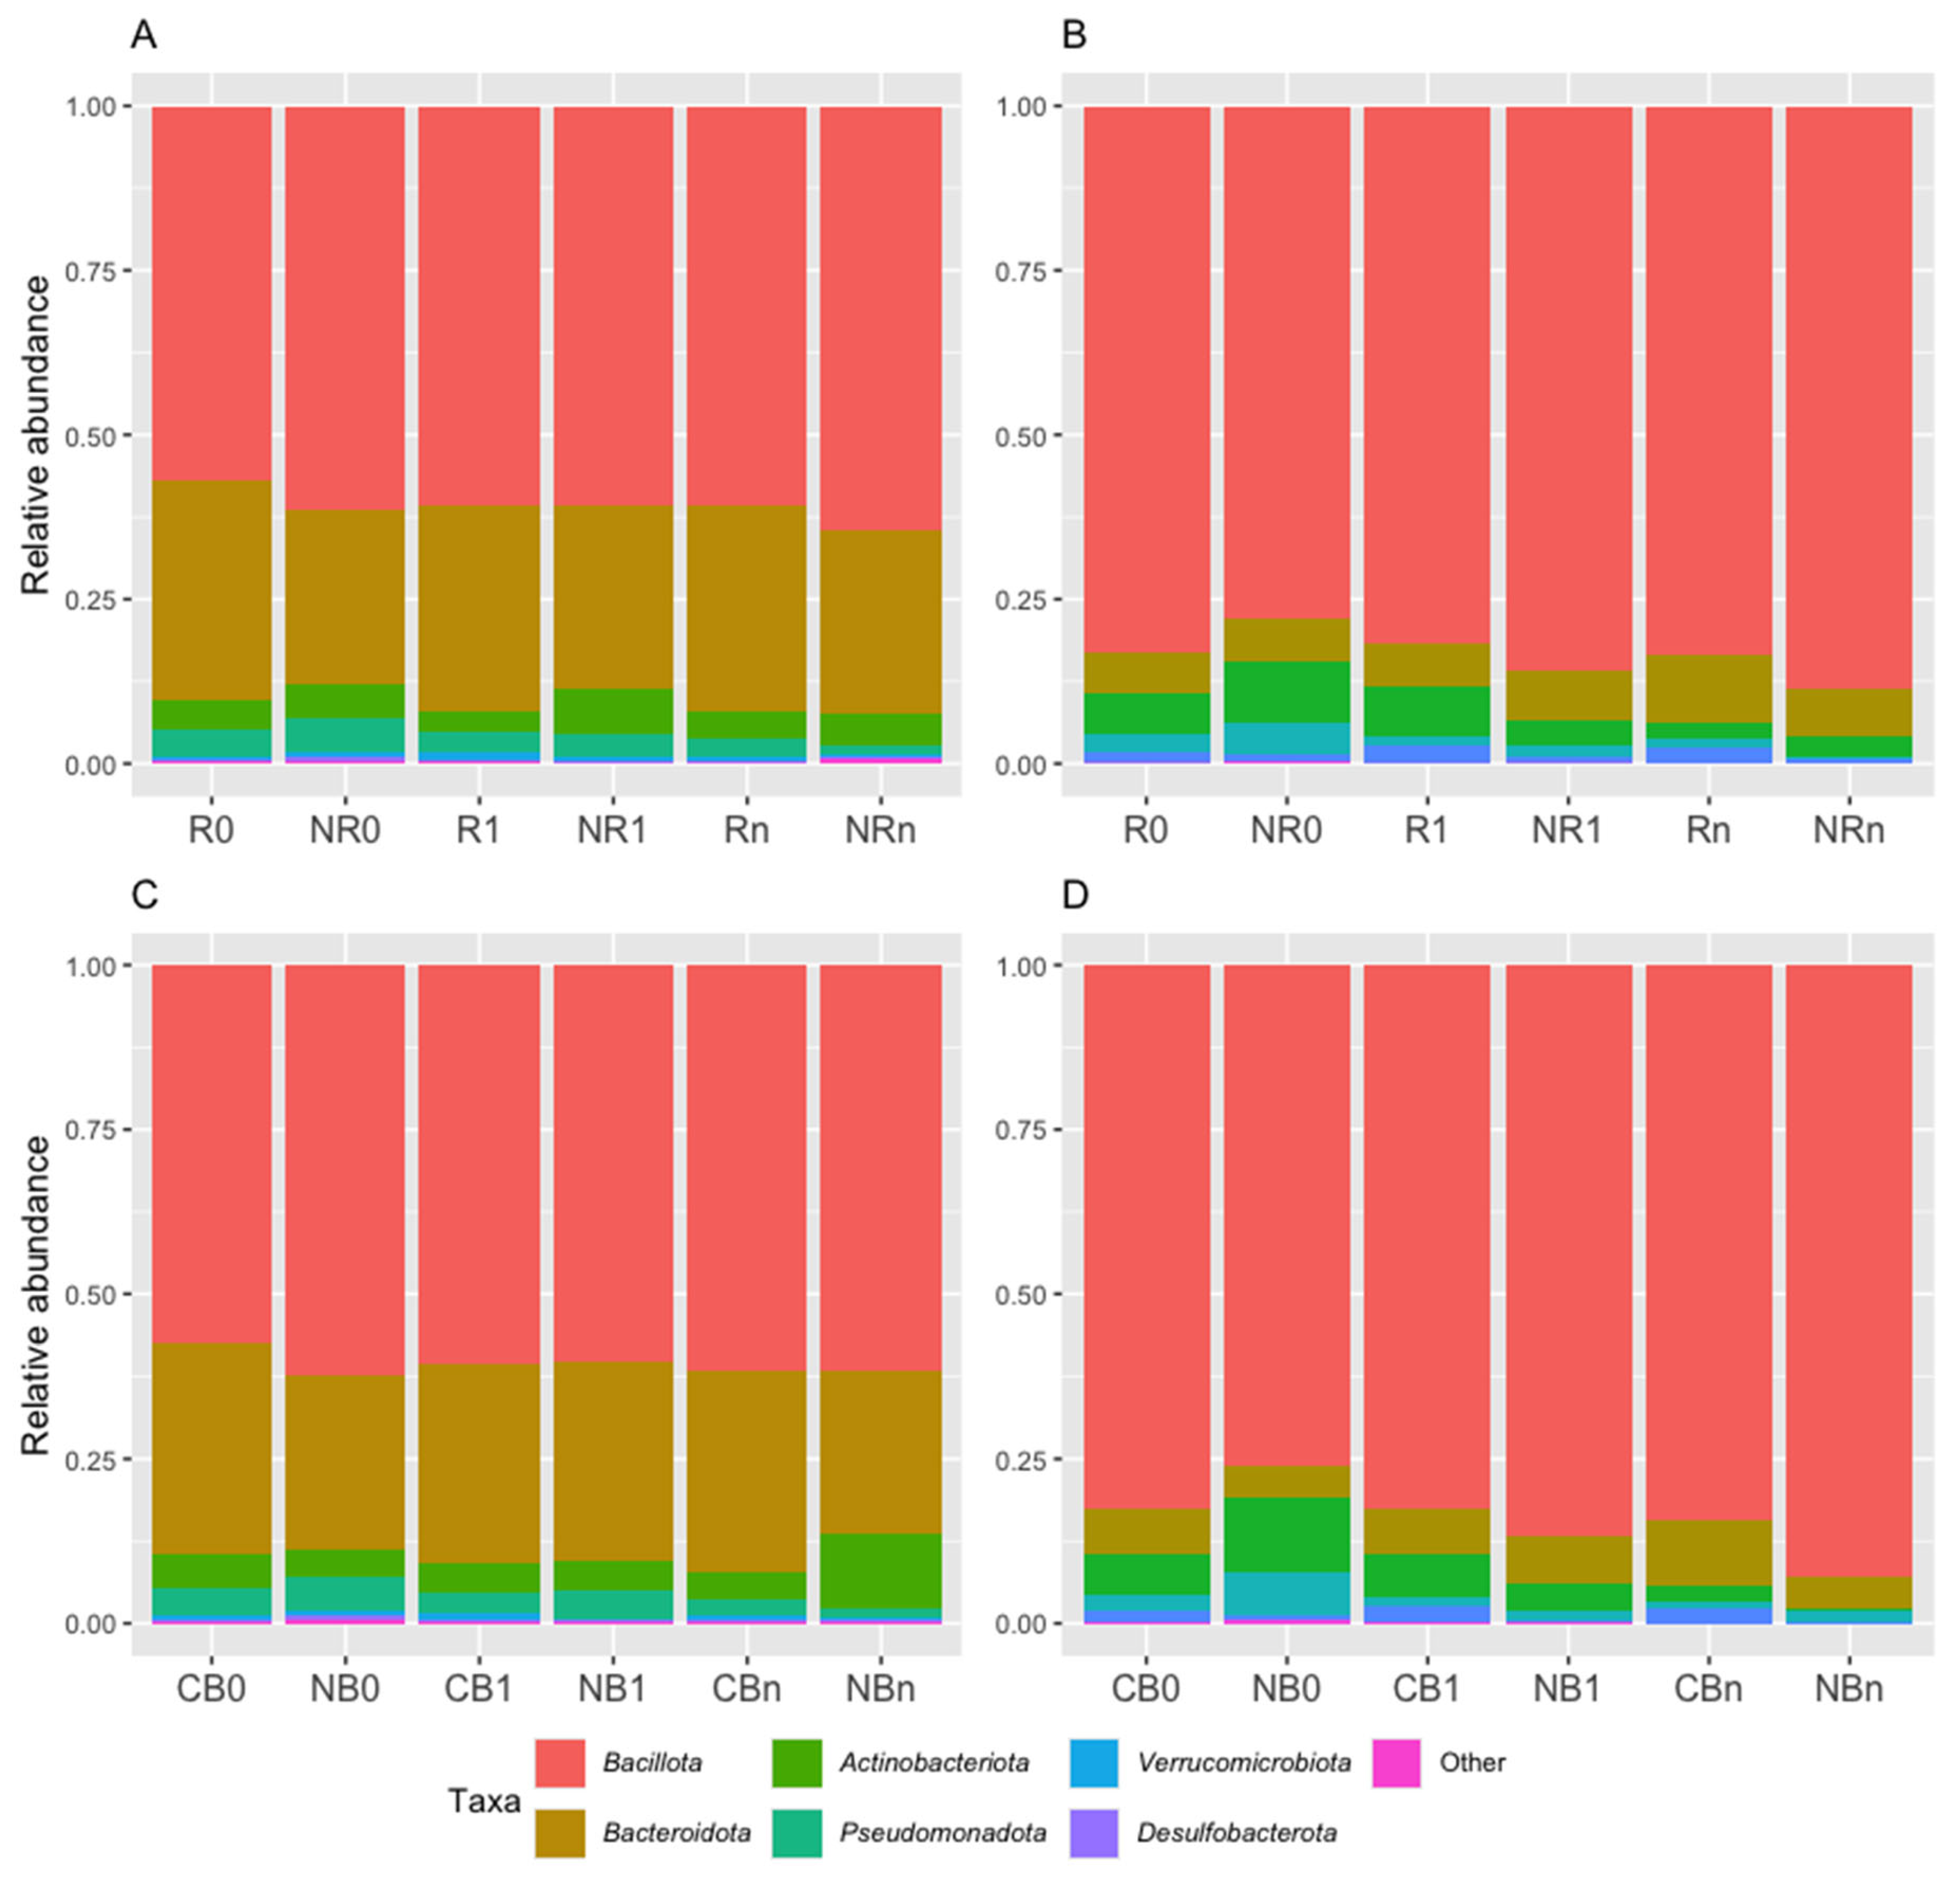
Figure 5.
The comparison of the relative abundances of phyla: Bacteroidota – formerly Bacteroidetes (A and B), Pseudomonadota – formerly Proteobacteria (C), Bacillota – formerly Firmicutes (D), and Verrucomicrobiota – formerly Verrucomicrobia (E) in the immunoglobulin (Ig)-bound stool microbiota between advanced melanoma patients receiving the anti-PD-1 therapy, before the its start at T0 (0) and during treatment at T1 and Tn (1 and n, respectively). Patients were classified as responders – R or non-responders – NR (A, C, and D) and patients with clinical benefit – CB or patients with no clinical benefit – NB (B and E) according to the clinical outcome of the immunotherapy. The p-values describing the statistical significance of the differences in the relative abundances of particular phyla between study subgroups were calculated with the Student’s t-test. The p-value ≤ 0.05 was regarded as significant (*: p-value ≤ 0.05, **: p-value ≤ 0.01). Statistics indicated a decrease in the relative abundances of phyla Bacteroidota and Pseudomonadota and an increase in phylum Bacillota during anti-PD-1 therapy in the NR subgroup. A decrease in the relative abundance of Bacteroidota was also observed in the R and CB subgroups during treatment. Moreover, there was a higher relative abundance of Verrucomicrobiota phylum in the CB vs. NB subgroup at T1. PD-1 – programmed death 1.
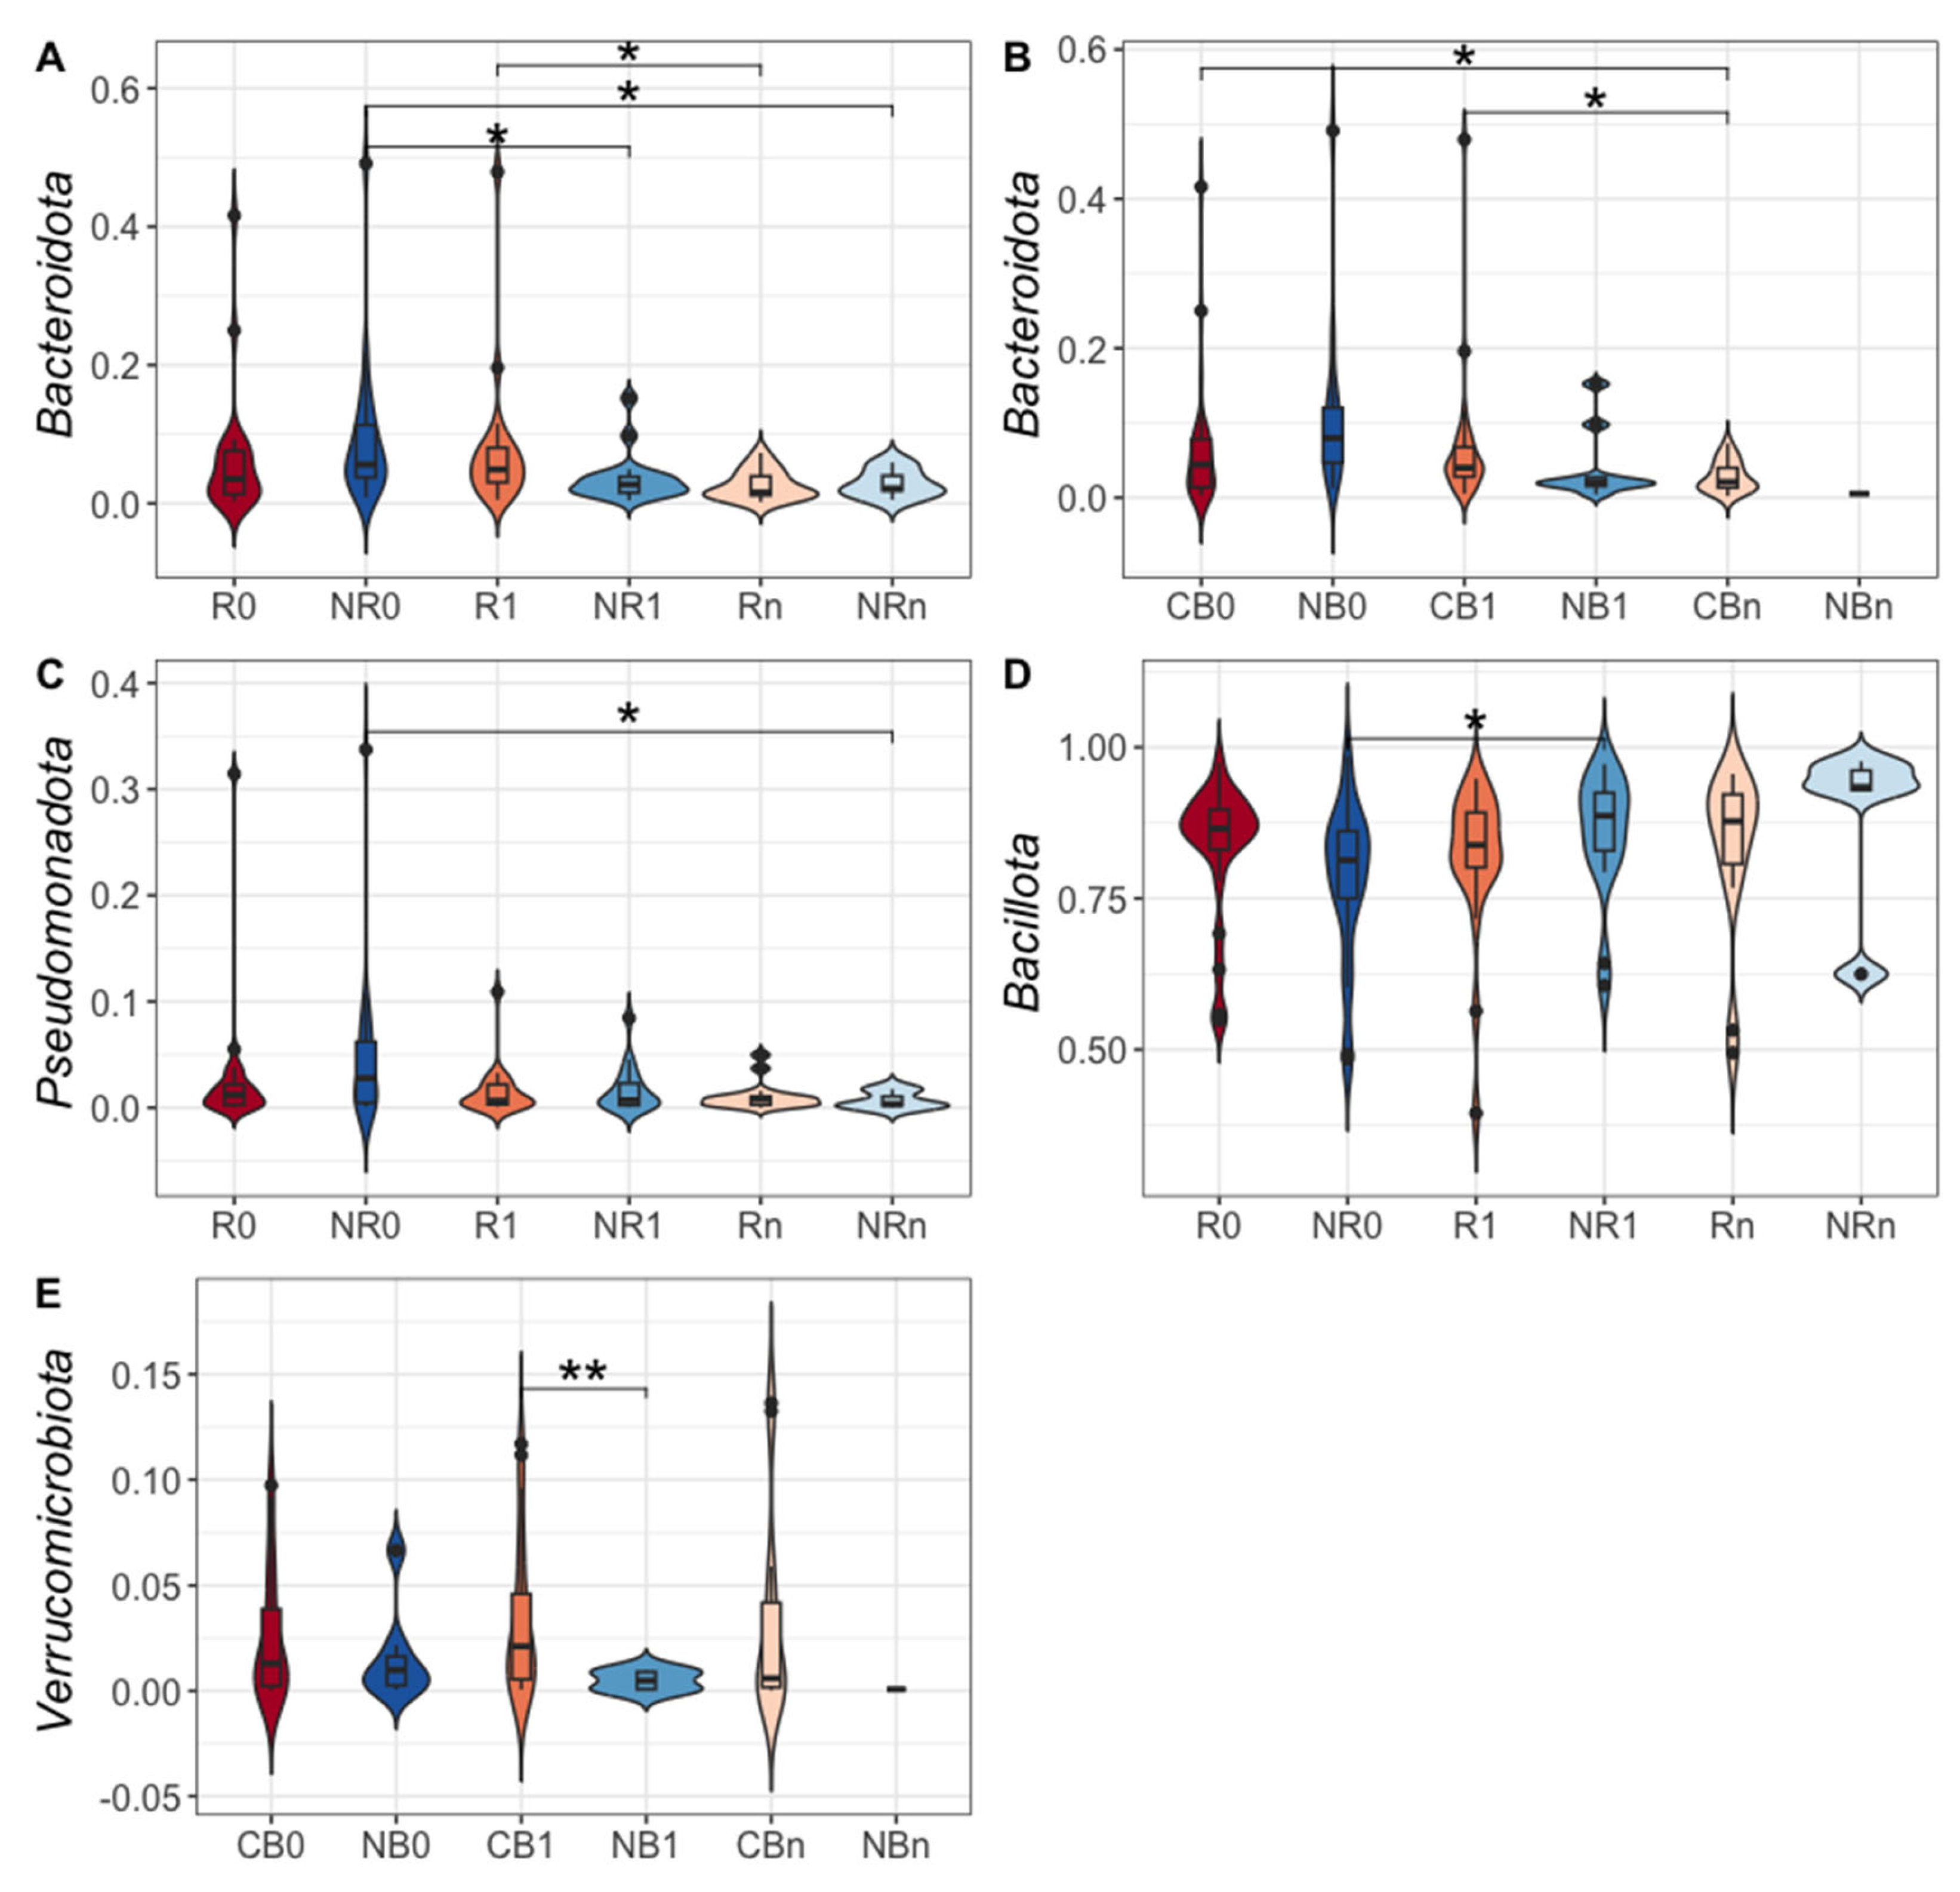
Figure 6.
The differentially abundant genera in the immunoglobulin (Ig)-bound stool microbiota between advanced melanoma patients with favorable vs. unfavorable clinical outcomes of the anti-PD-1 therapy, before its start – at T0 (0) and during treatment – at T1 and Tn (1 and n, respectively) identified in the differential abundance analysis (DAA) performed using ANOVA-like Differential Expression version 2 (ALDEx2) tool. Moreover, changes in the relative abundances of genera during treatment (T0 vs. T1, T0 vs. Tn, and T1 vs. Tn) within those subgroups were also indicated with the DAA. Patients were classified as responders – R or non-responders – NR (A) and as patients with clinical benefit – CB or patients with no clinical benefit – NB (B) according to the clinical outcome of the immunotherapy. The figures illustrate only the statistically significant results (The Wilcoxon Rank Sum Test, p-value < 0.1 was regarded as significant). The p-values describing the statistical significance of the DAA results were placed at the tips of the bars. The direction of changes in the relative abundances of taxa between the two subgroups being compared was assessed based on the effect size values. The first group of the two being compared is considered a reference group, whereas the second one is a tested group (group designations are placed on the left side of the graph at the beginning of the following lines; ‘reference group~tested group’). A positive effect size (red bars) suggests a higher relative abundance of a particular taxon in the tested group compared to the reference group, while negative (blue bars) – lower. Effect size also measures the biological significance of the observed differences (the larger the effect size, the more substantial the difference between subgroups). The names of the differentially abundant taxa are placed on the left side of the graph (next to the subgroup designation). The DAA indicated that the Ig-bound stool microbiota signatures were associated with clinical outcomes of the anti-PD-1 therapy and have changed during treatment. PD-1 – programmed death 1.
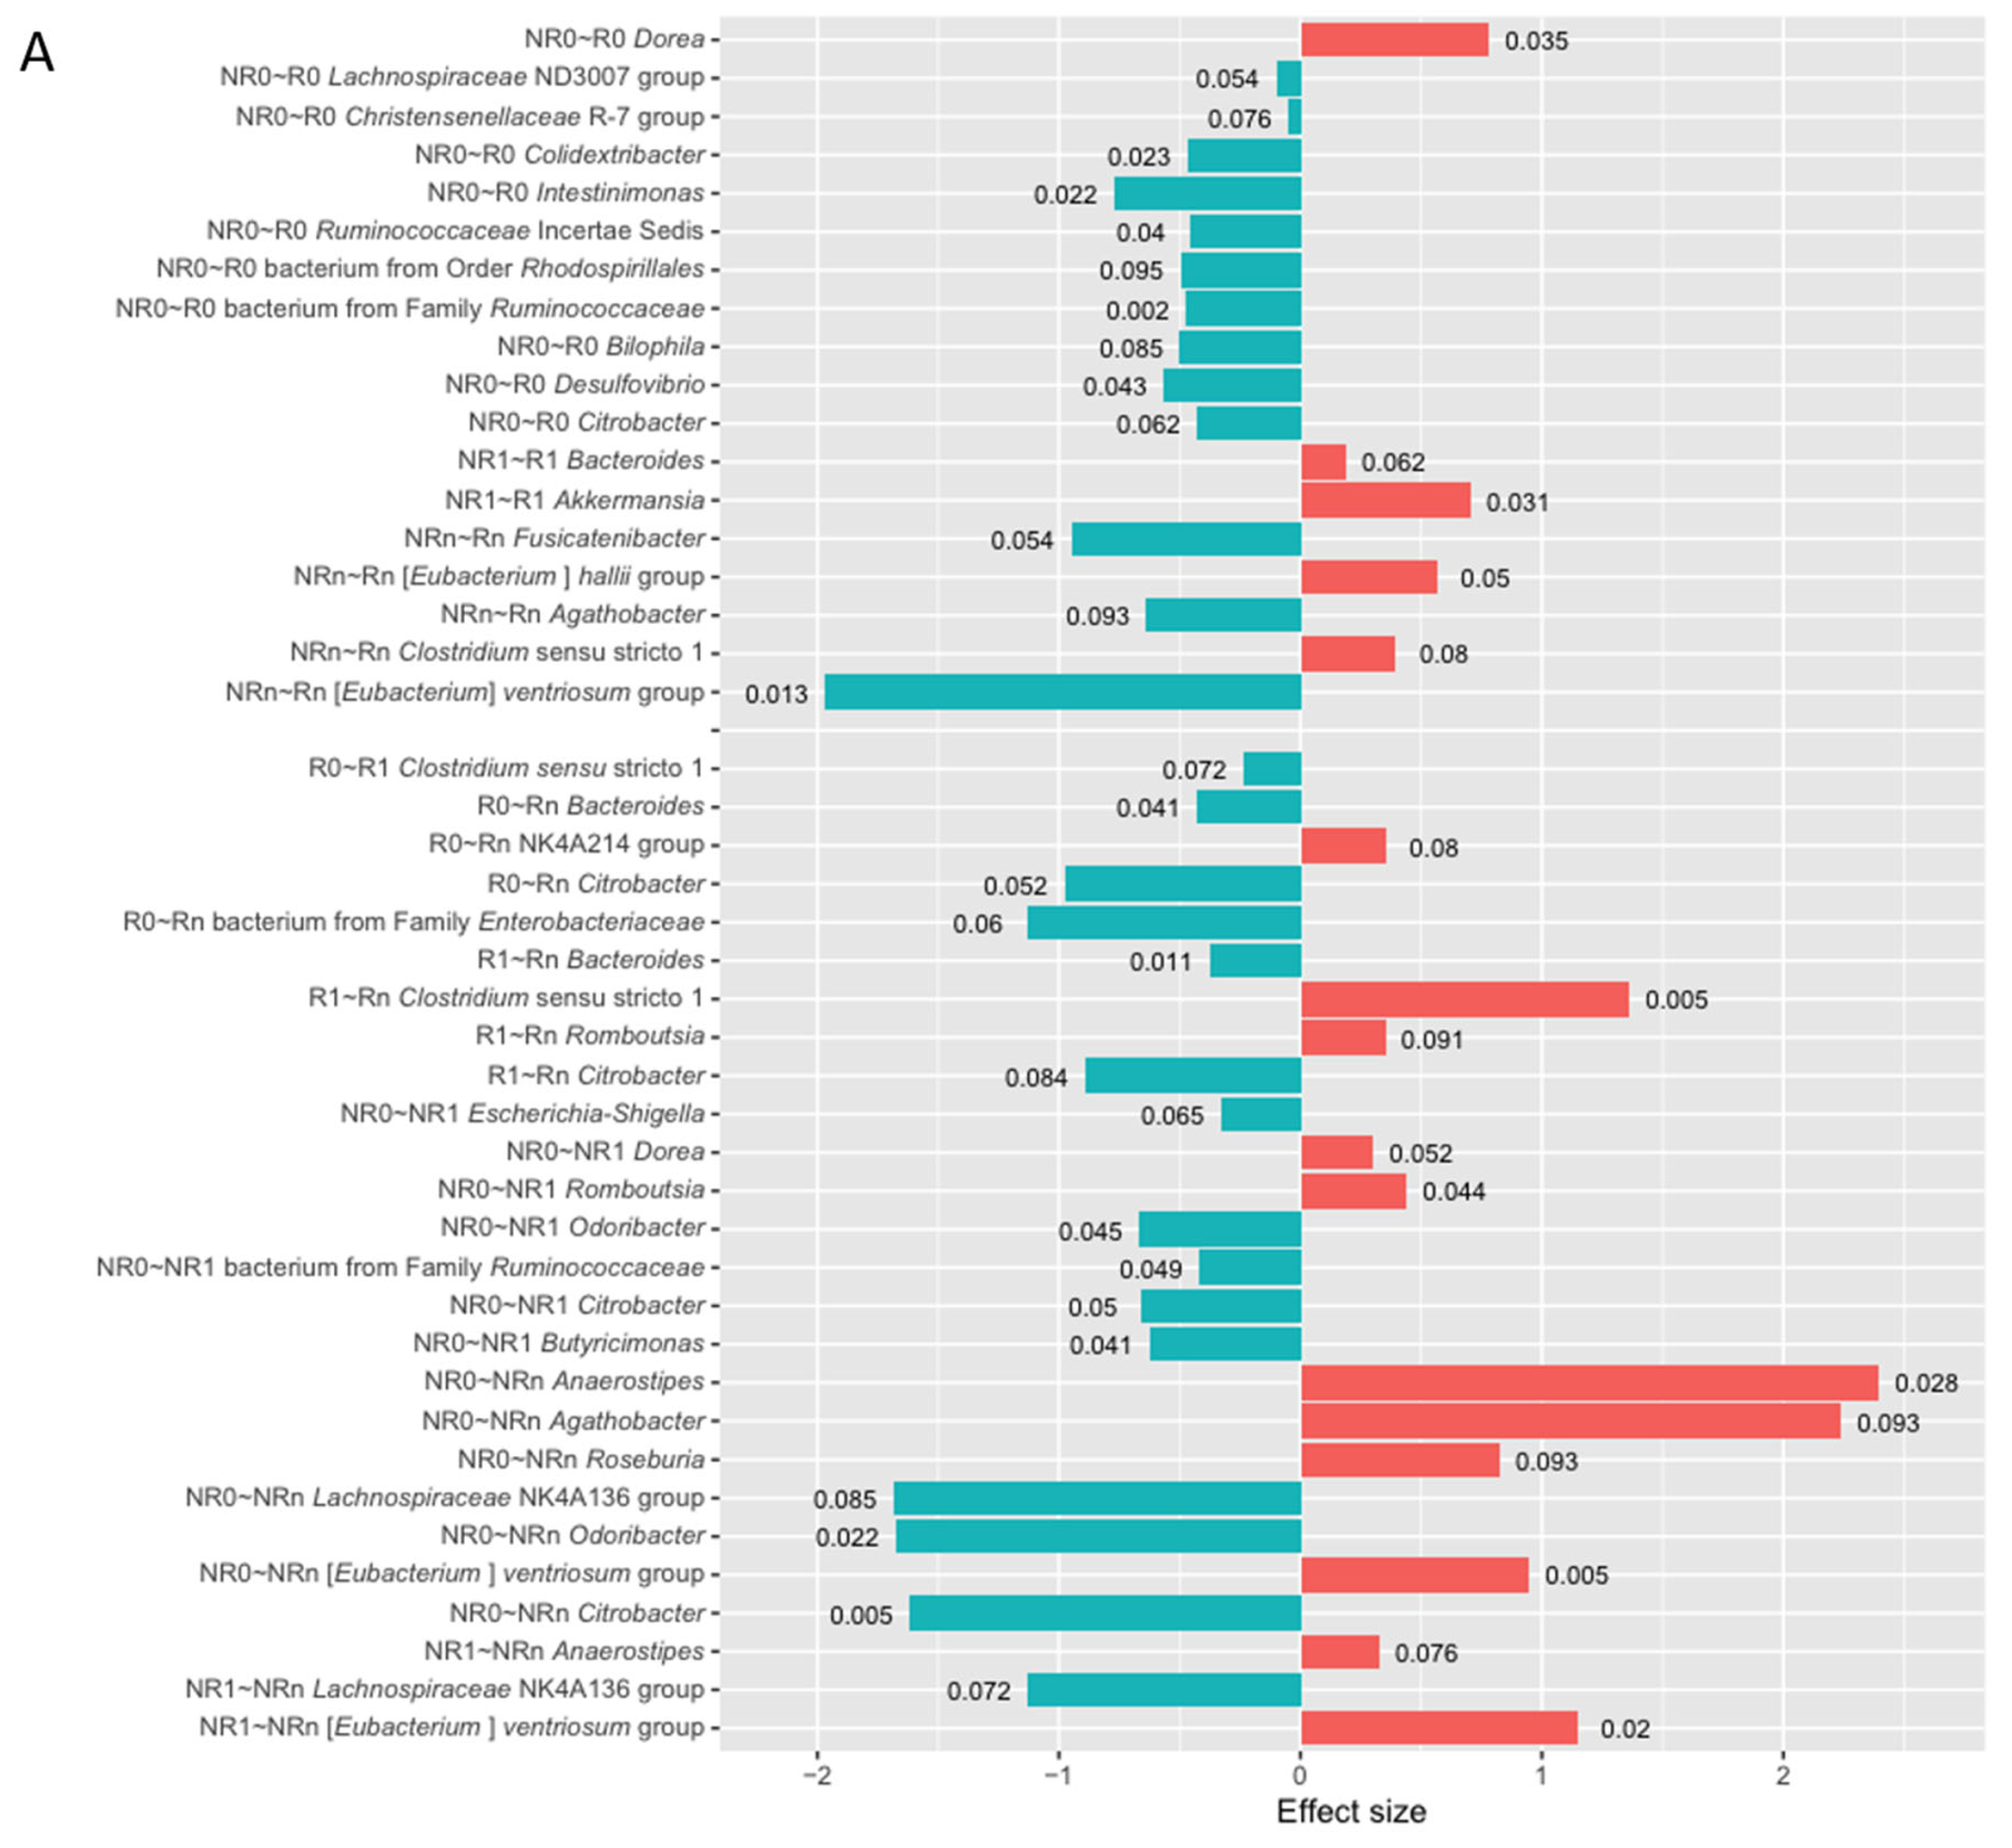
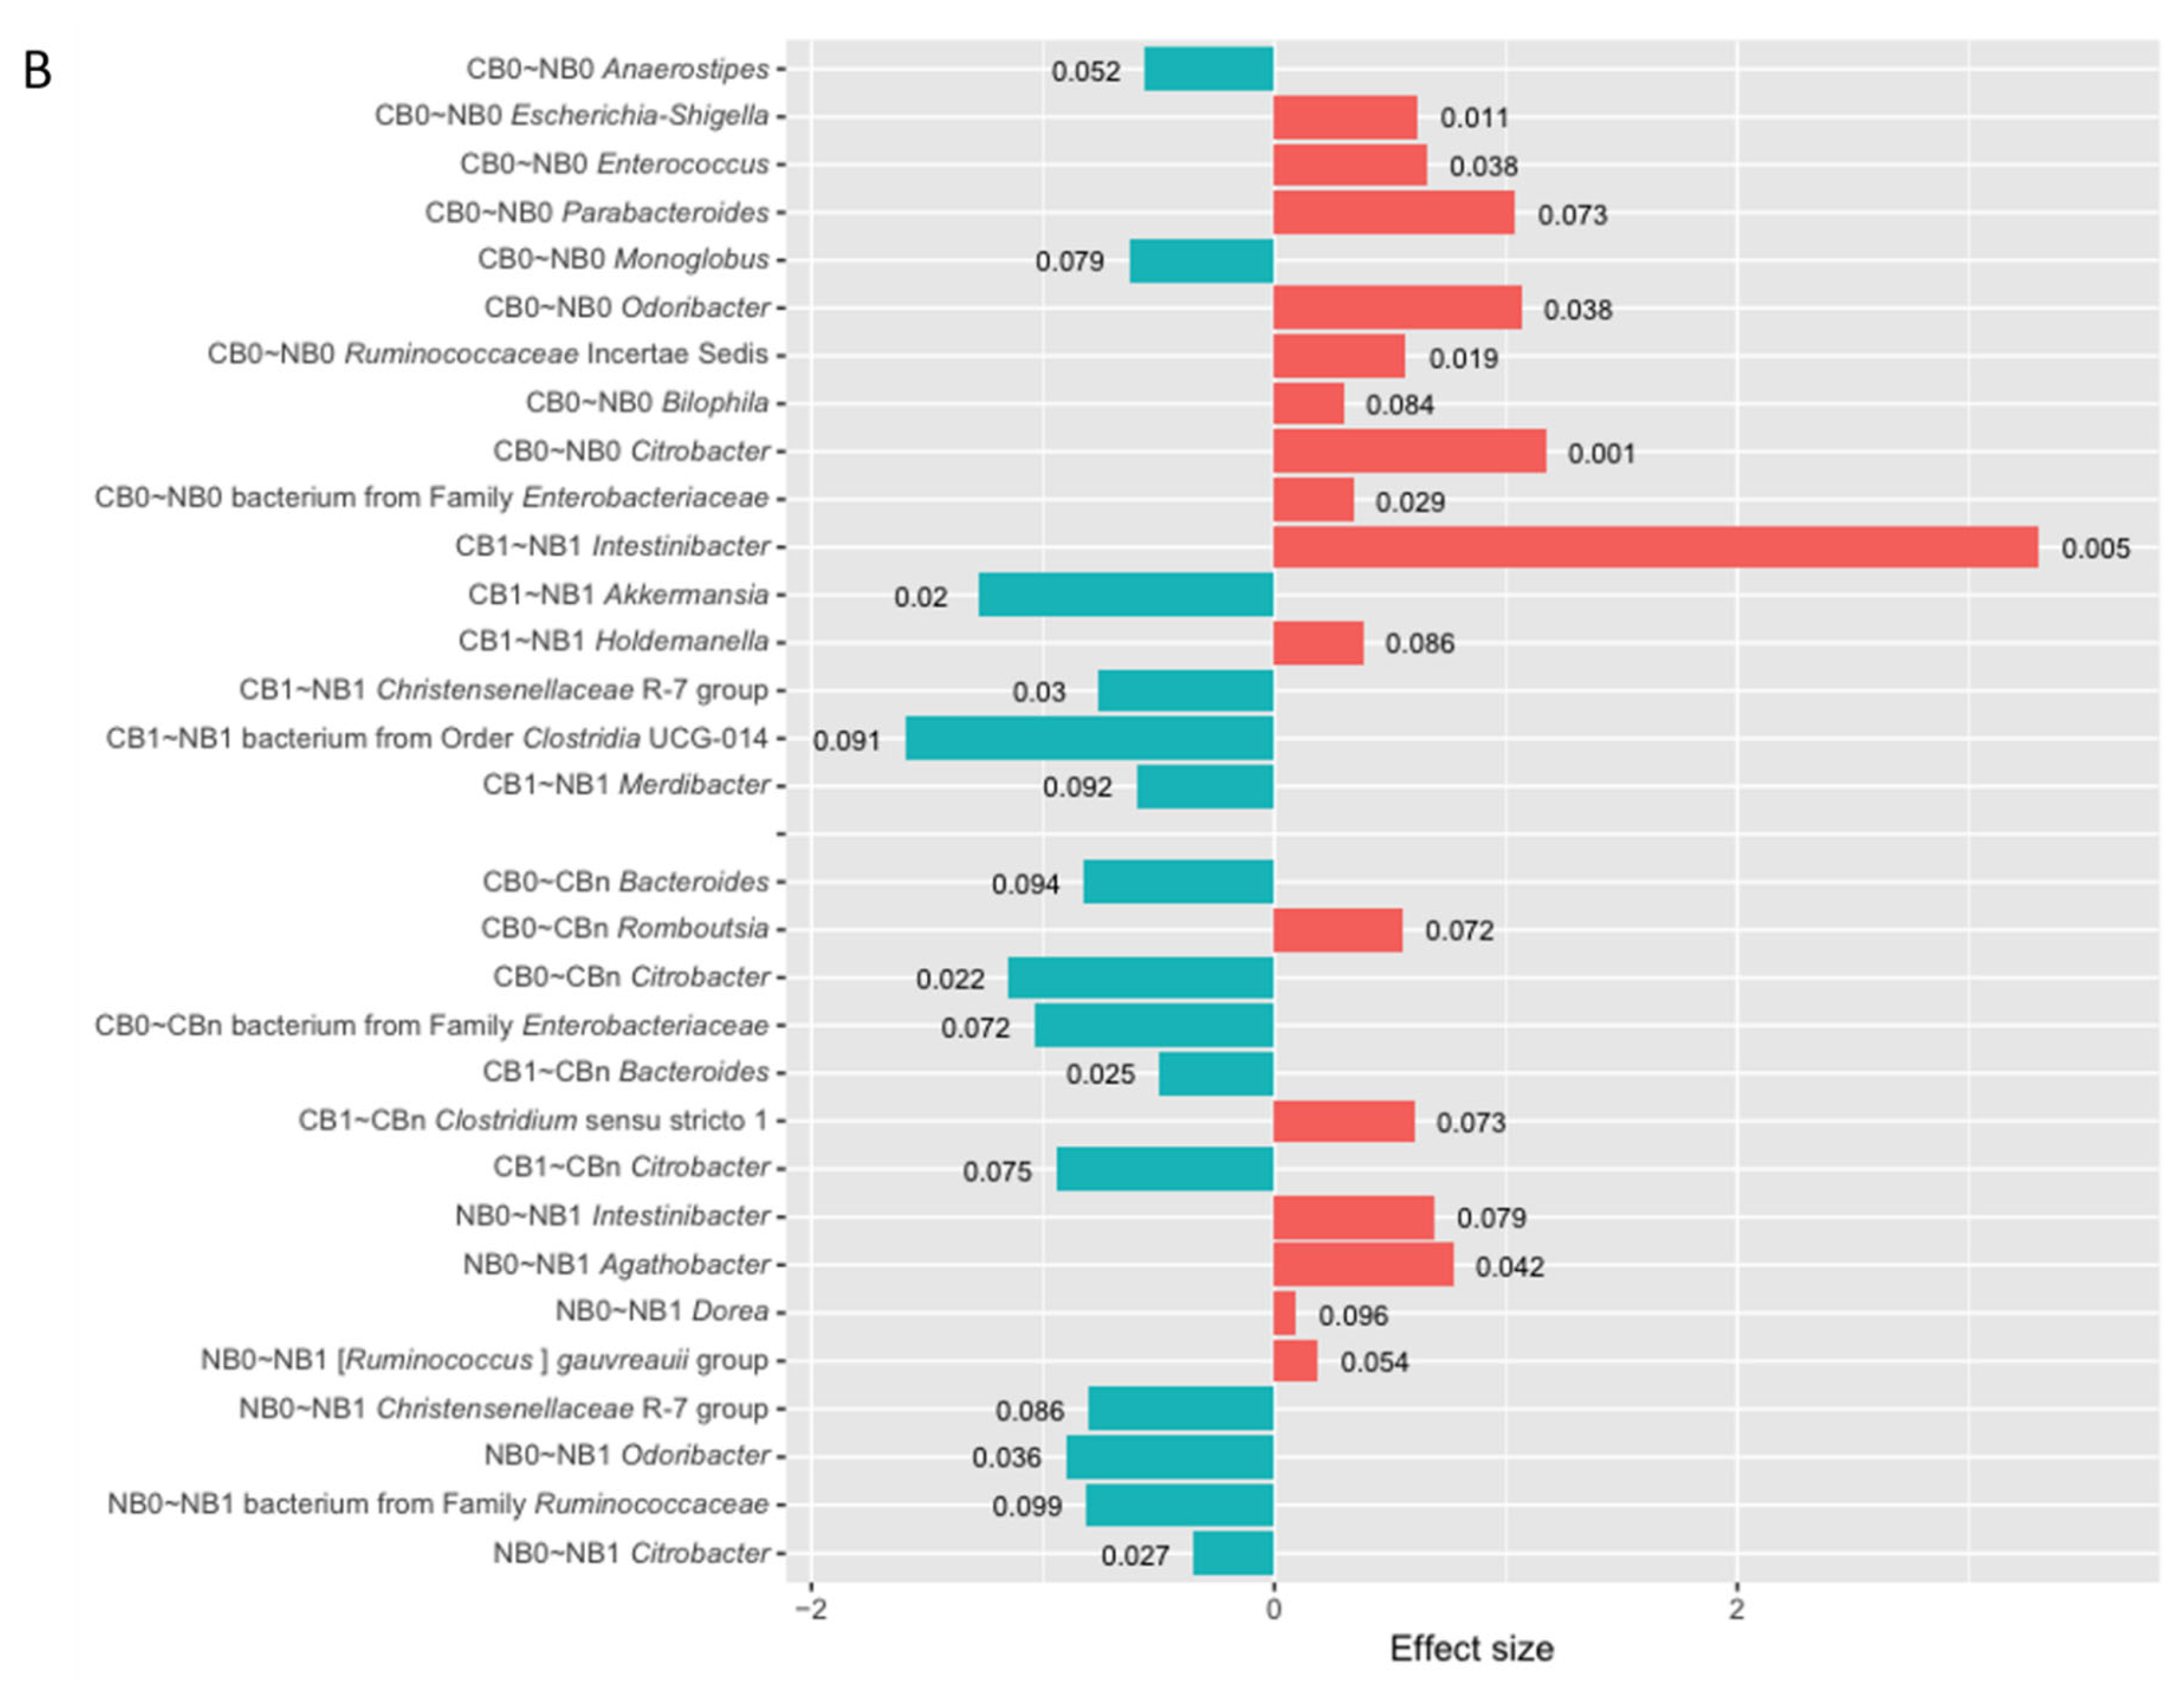
Figure 7.
Principal Coordinates Analysis (PCoA) based on a quantitative distance measures (A; weighted-UniFrac) and a qualitative distance measures (B; unweighted-UniFrac) was performed to compare the similarities and dissimilarities between the immunoglobulin (Ig)-bound stool microbiota (indicated by triangles) and total stool microbiota (indicated by dots) at the genus level (beta diversity analysis). The circulating cell-free microbial DNA – cfmDNA (plasma; indicated by squares) of the same patients (published in a separate paper [26]) was added to the plot for reference purposes to better visualize distances between the microbiotas. The microbiota composition was analyzed in advanced melanoma patients before – at T0 (0) and during anti-PD-1 therapy – at T1 and Tn (1 and n, respectively). Patients were classified as responders (R) or non-responders (NR) according to the clinical outcome of the immunotherapy. The figures demonstrate that the Ig-bound and total stool microbiota shared a subset of taxa (A), but at different abundances (B). Moreover, the Ig-bound and total stool microbiota grouped separately from the circulating cfmDNA (A and B). PD-1 – programmed death 1.
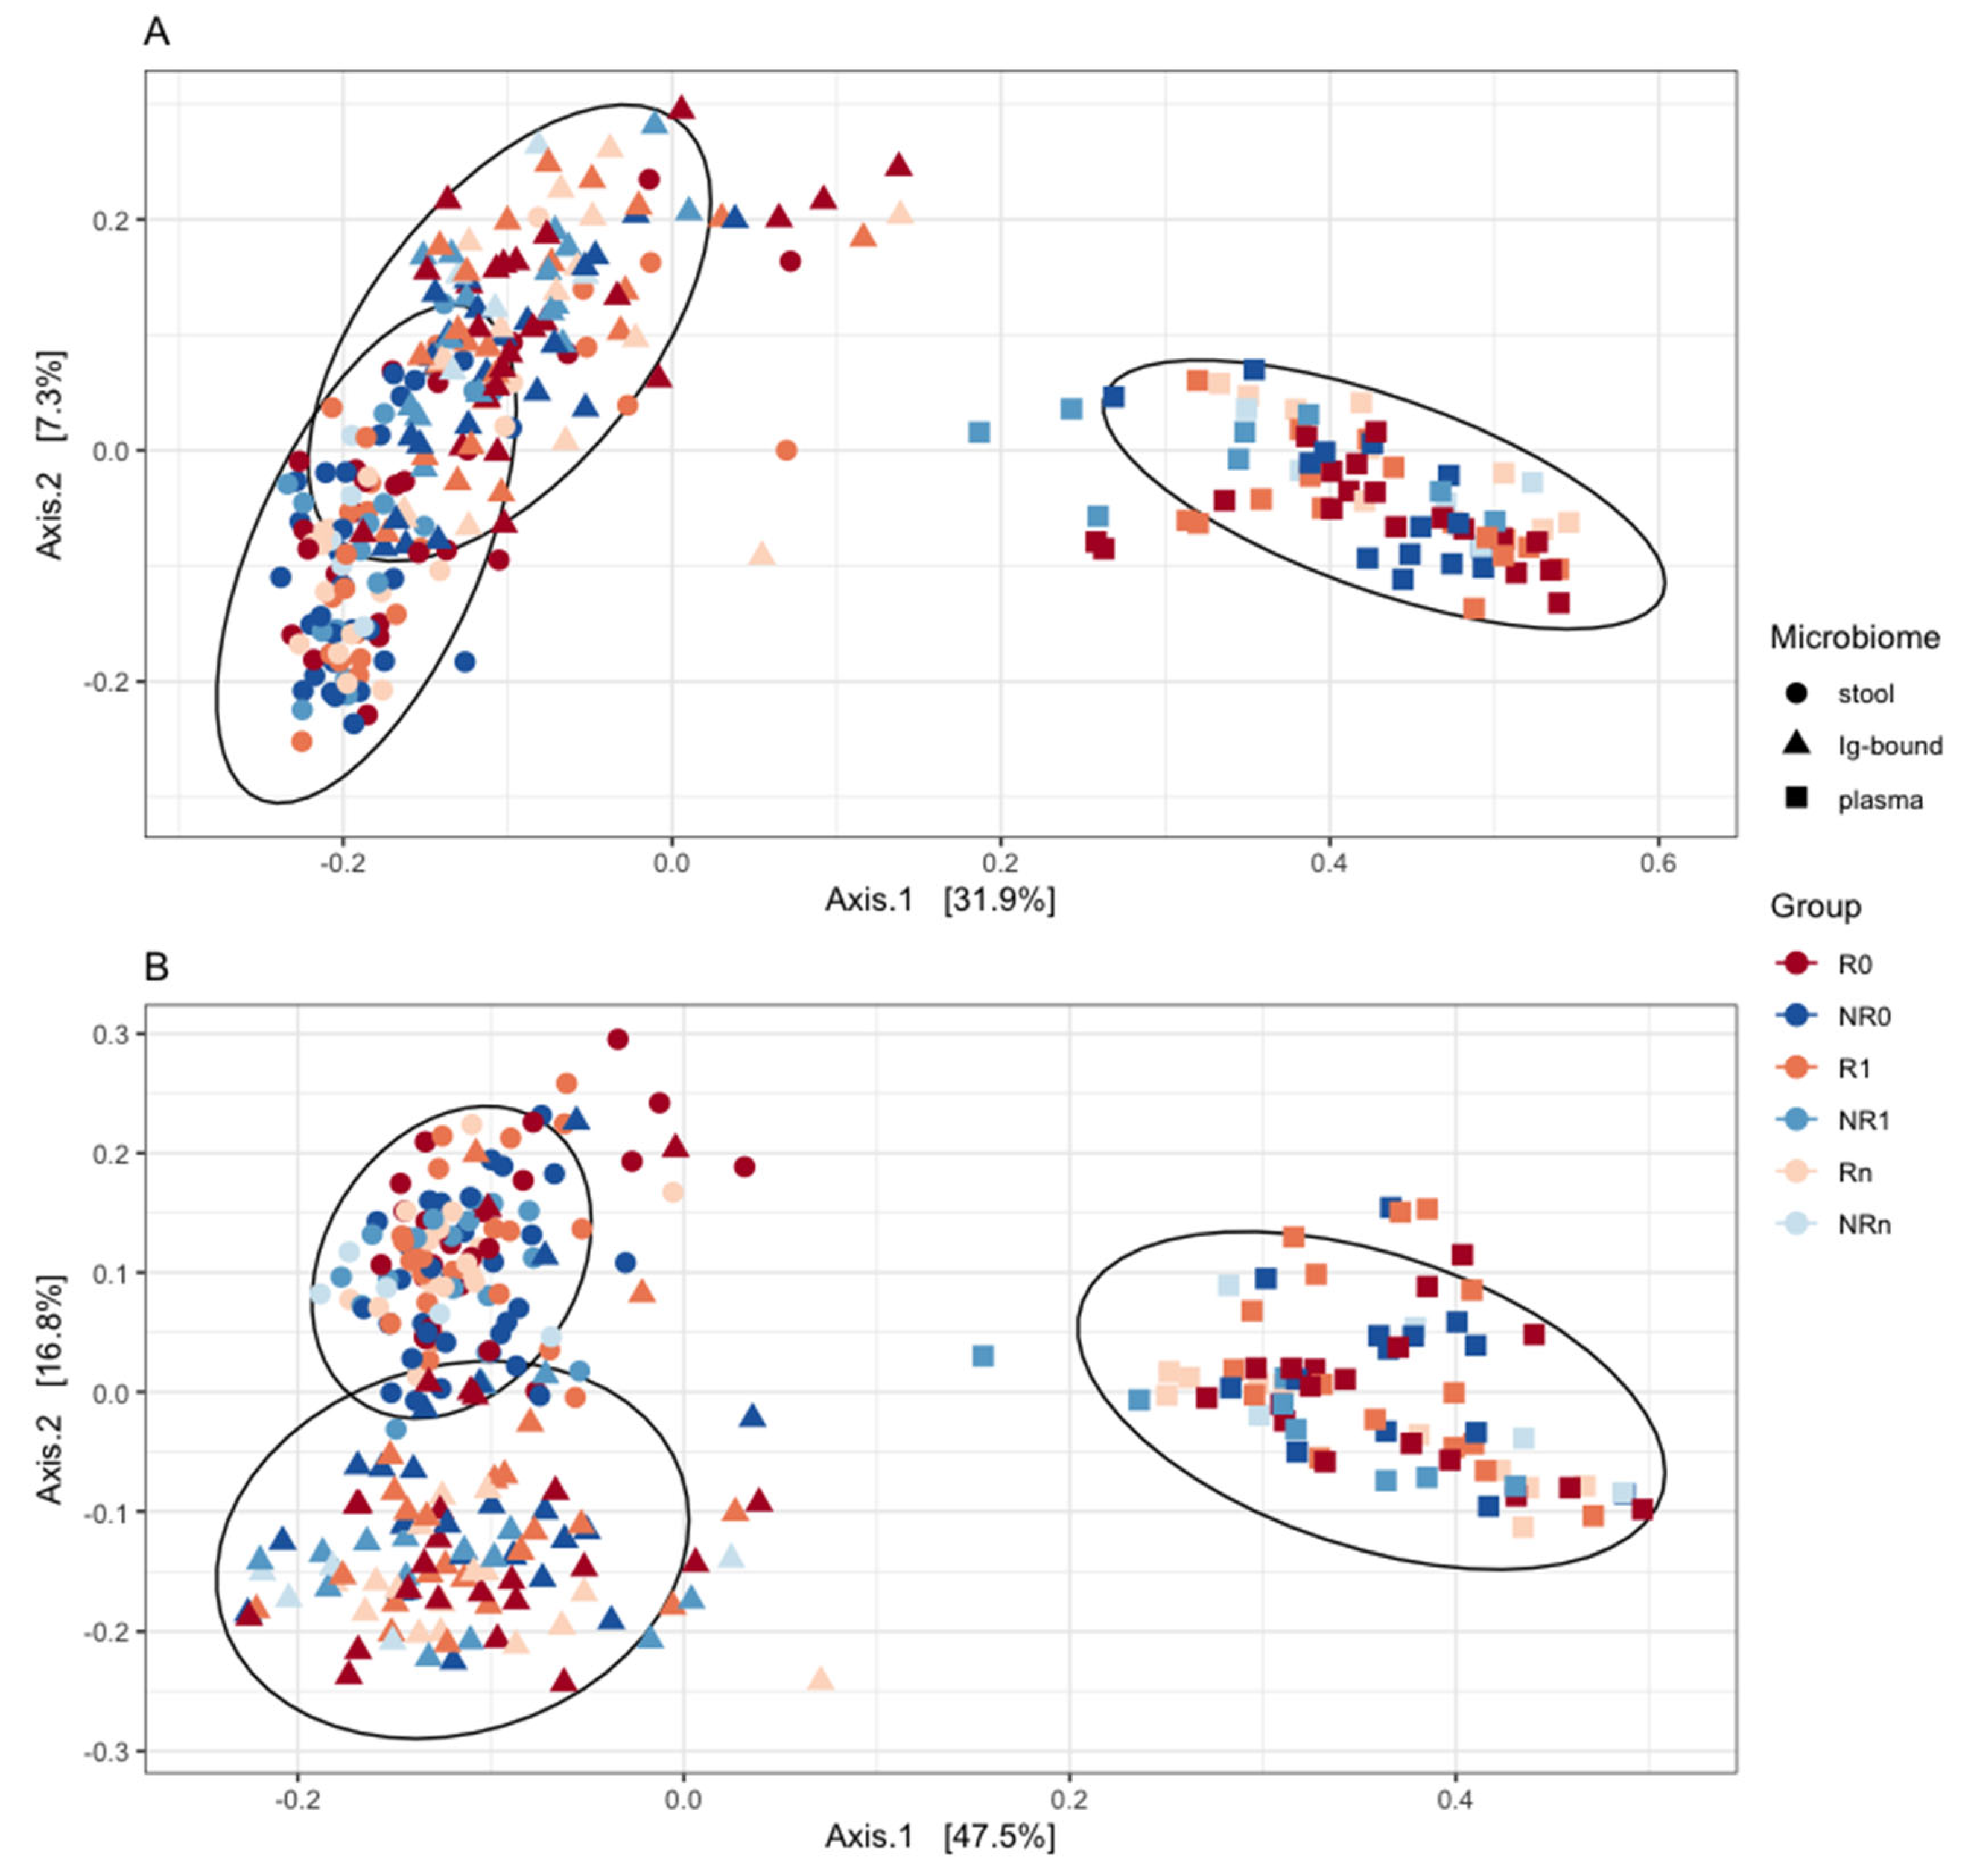
Figure 8.
The correlations between the relative abundance (RA) median values of bacteria (at the genus level) detected in the immunoglobulin (Ig)-bound stool microbiota fraction and total stool microbiota (green dots and line) were analyzed in all advanced melanoma patients undergoing anti-PD-1 therapy (A and B), and subgroups of patients with clinical benefit – CB (C and D) or no clinical benefit – NB (E and F) from the immunotherapy, before its start – at T0 (0; A, C, and E) and during treatment – at T1 (1; B, D, and F). Statistics were performed using the Spearman’s Rank Correlation Test. The p-value ≤ 0.05 was regarded as statistically significant. Figure 8A and B show the trends observed in all patients at T0 and T1, respectively; 8C and D – in the CB0 and CB1 subgroups, respectively; 8E and F – in the NB0 and NB1 subgroups, respectively. Genera detected only in the total stool microbiota (blue dots) or in the Ig-bound stool microbiota fraction (red dots) were also indicated in the figures. The figures demonstrate positive correlations between the RA median values of genera in the Ig-bound stool microbiota and total stool microbiota in all advanced melanoma patients undergoing anti-PD-1 therapy, and the CB and NB subgroups at T0 and T1. In patients with favorable clinical outcomes, there was an increase in the Spearman’s ρ value during treatment, while in those with unfavorable ones, there was an opposite trend. PD-1 – programmed death 1.
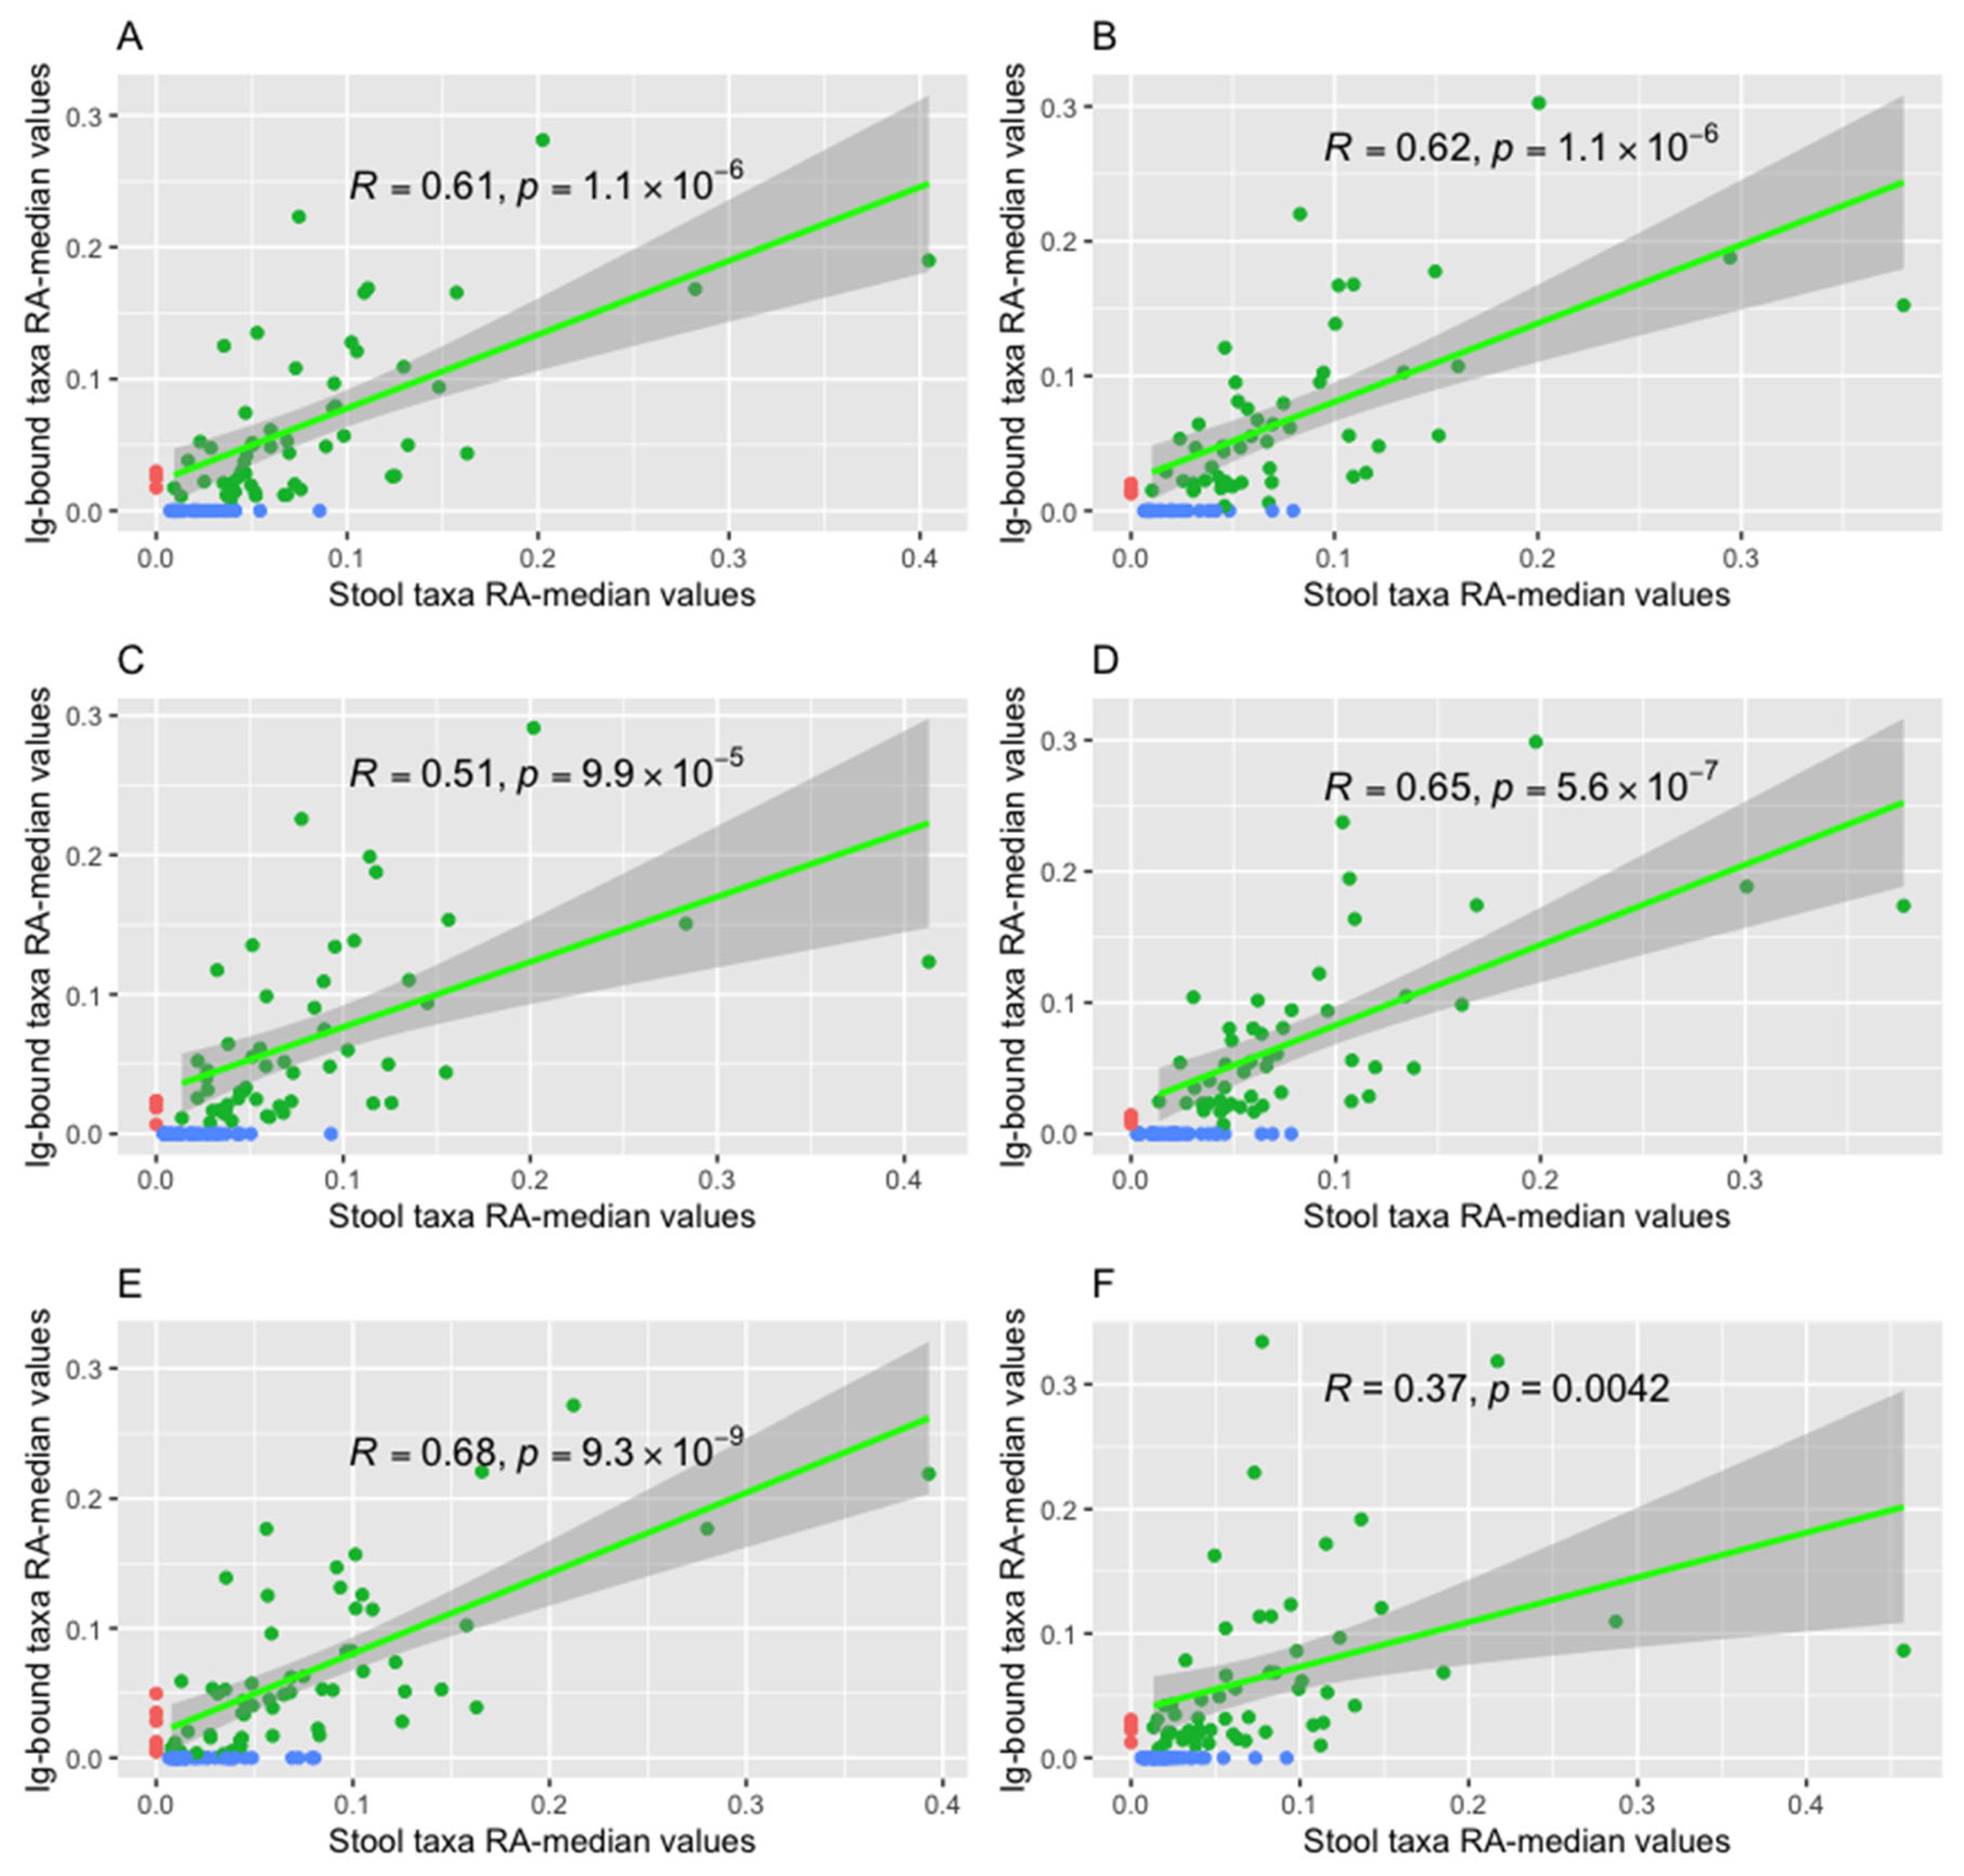
Disclaimer/Publisher’s Note: The statements, opinions and data contained in all publications are solely those of the individual author(s) and contributor(s) and not of MDPI and/or the editor(s). MDPI and/or the editor(s) disclaim responsibility for any injury to people or property resulting from any ideas, methods, instructions or products referred to in the content. |
© 2025 by the authors. Licensee MDPI, Basel, Switzerland. This article is an open access article distributed under the terms and conditions of the Creative Commons Attribution (CC BY) license (http://creativecommons.org/licenses/by/4.0/).
Copyright: This open access article is published under a Creative Commons CC BY 4.0 license, which permit the free download, distribution, and reuse, provided that the author and preprint are cited in any reuse.


