
Submitted:
12 June 2025
Posted:
13 June 2025
You are already at the latest version
Abstract
This research assesses the design efficiency of the future centralized Wastewater Treatment Plant (WWTP) in Prishtina, which also takes into consideration to rapidly expanding suburban areas such as Fushë Kosova, Obiliq, and Graçanica. The focus is on designing and comparing calculation ATV-DVWK-A 131E with dynamic model created in IWASP utilizing the Activated Sludge Model (ASM). The study underscores how dynamic modeling enhances design efficiency by more effectively calculating and results, thereby refining technology selection and operational approaches. It evaluates different scenarios for the design of WWTP into two development phases, covering current nerds and being able to treat wastewater after 2040 for second phase, indicating that dynamic modeling facilitates more precise predictions, especially on treatment phase, which is proved also by calculation with ATV 131. By simulating and calculating multiple design phases and treatment options, the research illustrates how the biological removal of BOD, phosphorus, and nitrogen can be seamlessly integrated into future designs while adhering to environmental standards and lowering operational expenses. The dynamic ASM-based model presents greater flexibility and reliability in planning than traditional methods, leading to more efficient, and cost-effective WWTP designs suited for biological treatment.

Keywords:
Design Efficiency
; IWASP
; ASM model
; ATV-131
; Prishtina
1. Introduction
The sewer system is a very important element of wastewater treatment plants (WWTPs) as it not only has a significant influence on the quality and quantity of the wastewater, which enters these facilities but also leads to great improvements in these respects. The difference is very striking mainly in newly developing parts of the world like the Western Balkans. e.g., Investigations from recent WWTP installations illustrate the difficulties associated with the inlet load parameters; this is often seen in the situation where there is high dilution of wastewater, low levels of BOD and COD, compared to the requirements of the standard biological treatment processes. The activity of the influent in this region makes it clear that we need quite a few design strategies to be invented which are specially devoted to the treatment of both sewer systems and WWTPs, i.e., the design strategies which match the influent characteristics of this region. In the case of Prishtina WWTP to operate successfully, the transition from the combined system to the separate storm and sewer system is a key priority. The preparatory and design stages of the Prishtina WWTP were based on the results of a detailed measurement campaign which revealed the influent design load parameters, and the expected population growth and network improvements were already considered. Besides, the operation of the plant must also comply with the requirements, which outline the treatment steps of the i.e., pre-treatment, the primary treatment of (biological, physical, and chemical processes in the future), secondary, and tertiary treatment for the second phase. Among the first steps, the mission is to take out of the system residues, grit, and grease, going through the process of secondary treatment where there is an emphasis on the removal of organic pollutants and nutrients by using natural ways to deal with them, and ultimately, the tertiary stages are aimed at eradicating the rest of the pathogens and the particles [1]. This systematic plan is required to be followed to meet the legal regulations and have the plant in good working condition. The inflow design data proposed lead to the above, four main points are regarded as the essential factors that should be considered in controlled pollution treatment, namely the prediction of pollution loads per capita and the level of leakage that is estimated to be the same as that of demographic changes. The design specifications outline the details of the required percentage of pollutants, such as BOD, COD and the total suspended solids which all need careful handling to ensure that the plant will operate without any issues when it is installed and commissioned [2,3]. Simply, the successful planning of wastewater treatment depends on a coordinated scheme involving the improvement of sewerage networks and the introduction of new treatment methods. A successful example of WWTP like the one in Prishtina was conducted to serve the purpose of a good practice of wastewater treatment, as it fits the local requirements and at the same time, the long-term maintenance from the utility staff, gives extra weight to the urban sustainable practices of wastewater management [4]. The map on Figure 1, shows Prishtina and surrounding towns, including delineation of catchment zones, discharging into interceptors and trunk mains, namely divided in clusters, starting with C0 which covers the majority of capital city, continuing with C3, C4, C5 and C21, which covers partially on village.
The basic influent data for the future WWTP, are population for design period for 2040, there are 479.8 kPE, with specific water consumption of q=120 l/cap-d, including nondomestic wastewater flow, which is rather low, as there is no heavy industry on the zone. A generalized layout composition of WWTP and the system is presented on Figure 2, including Retention Tanks (RT) and Pumping Stations (PS) acting as inlet Pumping Stations.
The first proposed idea for the WWTP treatment technology was Activated Sludge technology, which later updated to the Conventional Activated Sludge (CAS), as a treatment process which achieves effluent criteria’s with rather lower cost on operation and maintenance, and lower cost for plant surface compared to classic Activated Sludge technology. A single stage CAS is recommended also from the experience context on national level, but as the requirement standard for effluent for the future operation will be additionally for P and N removal, then there will be a need to alternate treatment technology based on results of model-calculation with pre-denitrification process.
The WWTP effluent receiving water body (the Sitnica River) to be considered as non- sensitive, but with possibility for the plant to be extended easily in the future with a tertiary treatment stage for Nitrogen and Phosphorus removal (and comply with a sensitive receiving body)
The effluent requirements regarding urban WWTP as expressed in local Administrative Instruction 30/2014 are Article 4 and 5 with its Annex II, Table 1 and Table 2 (note: both Tables are the same as 91/271/EEC).
Building on the presented criteria, we evaluate how biological treatment processes perform under Prishtina’s influent conditions in aspect of different wastewater models. The ATV-DVWK-A 131E calculation framework alongside dynamic ASM3BioP simulations in the IWASP platform will benchmark conventional activated-sludge designs with alternate activated sludge incorporating anoxic tank for the future development for 2040.
When it comes to effluent compliance, we look at key factors like BOD, COD, nitrogen, and phosphorus removal for each method during the first phase. We also run optimization tests to see how different infiltration rates, influent loads, and operational settings affect the outcomes. Our aim is to forecast capacity expansions up to 2040, considering the growing population and the related energy needs, sludge production, and environmental impacts. Ultimately, the results from these biological treatments will play a crucial role in our comparative scenarios and socio-environmental impact analysis, ensuring we deliver the thorough assessment we raised.
2. Materials and Methods
The initial part to consider on WWTP design are influent and effluent data and requirements. The paper shows real case study on future WWTP for Prishtina, and basic data for further development and calculations are presented on Table 1 with additional input data.
Design Criteria:
The specific water consumption accounted for 120 l/cap-d with additional non- domestic wastewater flow of 20%.
A percentage of 80% of the water consumption flows to the sewerage network.
The specific daily pollutant loads are:
Other design parameters are:
Minimum wastewater design temperature is 12°C;
Maximum wastewater design temperature is 22° C;
Dewatered Sludge (DS) concentration shall be at least 30% to be disposed temporarily at a landfill.
Based on the latest census, the following inflow design data shall be considered:
The effluent requirements regarding urban WWTP as expressed in local Administrative Instruction 30/2014 are Article 4 and 5 with its Annex II, Table 1 & Table 2 (note: such both Tables are the same as of 91/271/EEC).
The discharge requirements for non-sensitive water bodies (Phase I) are as follows:

Table 3.
Design parameters for Effluent according to AI 30/2014.
| Parameter | Concentration | Min. % of reduction |
| BOD5 | 25 mg/l | 70 - 90% |
| COD | 125 mg/l | 75 % |
| TSS | 35 mg/l | 90% |
24 hour average; either concentration or percentage of reduction shall apply).
For sensitive areas water bodies (Phase II), tertiary treatment with enhanced removal of nutrients must be applied, to meet the criteria given below:
Table 4.
Design parameters for sensitive bodies – AI 30/2014.
| Parameter | Concentration | Min. % reduction |
| Total Phosphorus | 1 mg/l | 80% |
| Total Nitrogen | 10 mg/l | 70 - 80% |
(annual averages, either concentration or percentage of reduction shall apply).
When designing and planning the wastewater treatment plant (WWTP) for Prishtina, it’s crucial to carry out a thorough evaluation of relevant parameters and operational features. This ensures that the chosen technology aligns well with the local environment, operational capabilities, and available resources. Key factors to consider include the utility’s ability to handle the selected technology, the availability of essential resources like spare parts and chemicals, and the system’s environmental sustainability. Additionally, the decision-making process is influenced by costs related to final sludge disposal, capital investments, operation and maintenance (O&M) expenses, and land requirements [5,6]
The analysis explored various treatment options, primarily focusing on biological processes that use microorganisms to break down organic pollutants in wastewater. The technologies assessed included Conventional Activated Sludge (CAS), Sequential Batch Reactor (SBR), Moving Bed Biofilm Reactor (MBBR), Membrane Bioreactor (MBR), Submerged Biological Filters, Upflow Anaerobic Sludge Blanket Reactor (UASBR), and Trickling Filters. Among these, the Conventional Activated Sludge process emerged as the most suitable choice for this application, thanks to its proven efficiency and reliability [7,8]
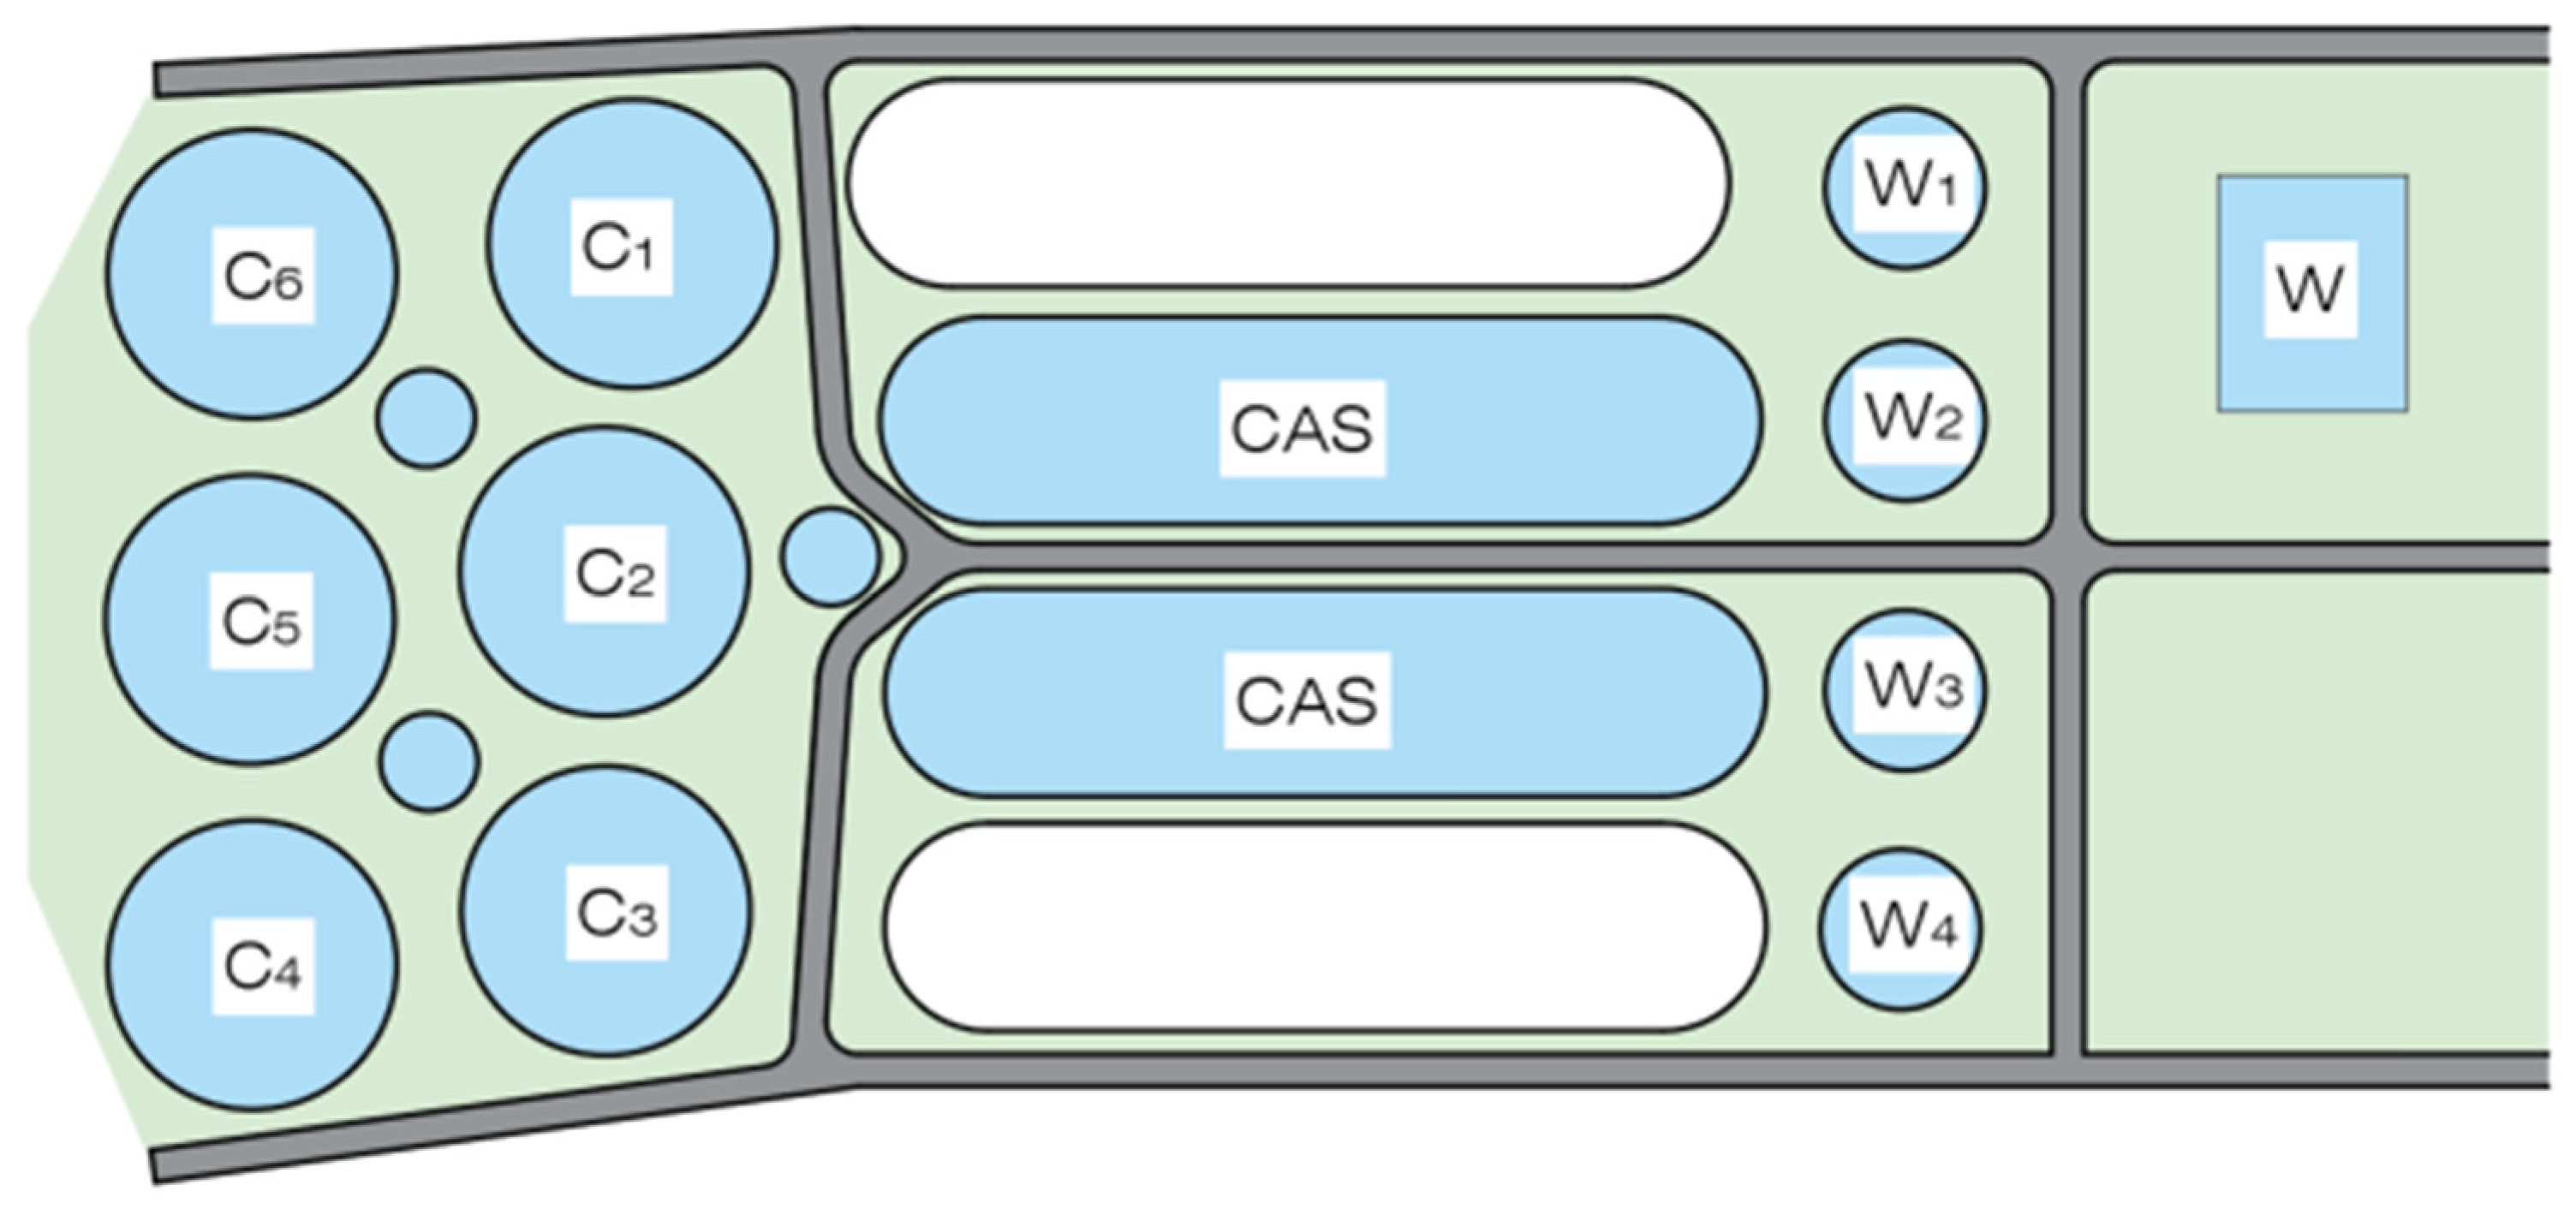
For the initial phase of the project, the layout is proposed based on the actual conditions of the plot area, particularly for the water line.
Figure 3.
Water Line of WWTP – Proposed – Phase I.
Advanced Design Approaches for WWTP: From Conventional to Digital Modeling Tools
The biological treatment process on this research is studied in line with design requirements, according to (ATV-DVWK-A 131E, 2000)([9]. ATV-DVWK-A 131 is a German guideline used for the design and dimensioning of activated sludge wastewater treatment plants, focusing on biological treatment processes based on hydraulic and pollutant loads. It provides standardized methods for calculating key parameters like sludge age, aeration, and nutrient removal. The guideline is published by the DWA (German Association for Water, Wastewater and Waste).
The Wastewater Simulator IWASP
IWASP operates in similar way as commercial wastewater--treatment simulators—such as BioWin, GPS-X, and SIMBA, SUMO—by enabling the construction and dynamic modeling of a full treatment plant. It supports ASM2d, ASM3-bioP, and Barker-Dold reactor models, and offers both one-dimensional clarifier or zero-dimensional phase-splitter modules for primary and secondary settling, thickening, and dewatering units. Beyond its core simulation capabilities, IWASP [10] incorporates an automatic calibration engine that can mirror real--world plant behavior, and it includes prototype tools for the automated design of bioreactors and recirculation streams. A stochastic process-analysis module (Markov Decision Process) further allows users to optimize the programmable logic controllers at existing treatment facilities and to develop new control strategies. Examples of Applicability -Design phase: During preliminary design, simulations can confirm which equipment capacities, layouts and process technologies are most appropriate and cost-effective for the new plant. It becomes possible to predict in advance whether the facility will meet effluent standards under the expected influent loadings and across a range of operating temperatures. Upgrading existing plants: Testing new layouts, process modifications or operational changes in the real plant is invariably more expensive and labor-intensive than running a model. From the very first concept, IWASP can be used to explore alternatives, helping to identify the most cost- and energy-efficient configuration. As a decision-support tool, it brings transparency to plant operation by leveraging detailed process models. We chose ASM3bioP for the Prishtina WWTP simulations because it uniquely combines carbon, nitrogen and phosphorus transformations in a single, mass-balanced framework. Its built-in representation of intracellular storage and flexible phosphorus uptake under both aerobic and anoxic conditions makes it especially reliable when influent composition or recirculation rates change. By capturing the coupled dynamics of organic removal, nitrification–denitrification and bio-P processes, ASM3bioP lets us compare different CAS or pre-denitrification layouts, recirculation strategies and loading scenarios on equal footing. In practice, this means we can confidently assess how each configuration will perform across a range of population equivalents and seasonal temperature swings. Ultimately, using ASM3bioP ensures our design and operational recommendations are grounded in a mechanistic, dynamically responsive model.
ASM3BioP Model
The ASM3 bioP model [11] serves as the foundation for the models presented – it is defined by 17 state variables (wastewater fractions) and 23 governing processes [12] which can be solved numerically as a system of ordinary differential equations. In our work, we have employed the ASM3BioP–EAWAG variant, which describes the removal of organic matter, nitrogen and phosphorus. The organic--matter and nitrogen are sub model of ASM3 is characterized as following: The framework partitions the degradation and transformation of organic carbon and nitrogen into twelve interlinked biological reactions, each governed by its own stoichiometry and kinetic expression. At the outset, particulate biodegradable substrate is enzymatically hydrolyzed into soluble readily biodegradable substrate, a process whose rate depends on the ratio of to active heterotrophs. The readily biodegradable substrate pool of carbon can follow one of two intracellular storage pathways: under aerated conditions, heterotrophs convert SS into internal polymers at a rate modulated by dissolved oxygen, while under anoxic denitrifying conditions a parallel storage reaction proceeds, substituting nitrate/nitrite for oxygen as the electron acceptor. Stored polymer and free substrate then fuel heterotrophic biomass growth. Aerobic heterotrophic growth consumes and dissolved oxygen to build new heterotrophic biomass, simultaneously releasing ammonium and altering alkalinity according to known yield coefficients. Under anoxic conditions, denitrifying heterotrophs similarly assimilate carbonaceous material and nitrate, producing nitrogen gas contributing to alkalinity flux. When external substrates decline, endogenous respiration of heterotrophs takes over: aerobically, cells oxidize their own biomass in the presence of oxygen, whereas anoxic endogenous decay uses nitrate and yields N₂ along with residual soluble by--products. A third set of reactions addresses the fate of the stored polymers themselves: cell storage is respired aerobically, each pathway governed by Monod--type dependence on the respective electron acceptor. Finally, the nitrifying autotrophs perform two linked processes: ammonium oxidation to nitrate (nitrite-nitrate step is not directly modelled). Under substrate scarcity, autotrophic cells undergo endogenous decay releasing nitrogen gas. Together, these twelve reactions—hydrolysis, aerobic and anoxic storage, aerobic and anoxic heterotrophic growth, aerobic and anoxic heterotrophic decay, aerobic and anoxic storage polymer respiration, autotrophic nitrification, and autotrophic decay—form a mass--balanced, dynamically responsive network that underpins the ASM3 model’s ability to predict carbon removal, nitrification, and denitrification in activated--sludge systems.
The ASM3 bioP framework inherits its organic--carbon and nitrogen pathways directly from the standard ASM3 formulation, its treatment of phosphorus diverges from the ASM2d [13] approach in several important respects. First, the readily biodegradable substrate pool remains intact as a single fraction—ASM3 bioP assumes that fermentative hydrolysis never becomes rate--limiting and therefore omits any further subdivision of that pool. Second, under aerobic conditions and in the presence of phosphate--accumulating organisms (PAOs), orthophosphate is actively converted into intracellular polyphosphate, producing a measurable decrease in soluble phosphorus within the aeration basin. Crucially, however, PAO activity is not confined to aerated environments: field observations frequently report higher effluent phosphorus concentrations when nitrate is present, suggesting that either inhibitory effects limit phosphorus release or that PAOs and glycogen--accumulating organisms compete under denitrifying conditions. To capture this behavior, ASM3 bioP explicitly couples anoxic PAO growth to nitrate uptake and denitrification yet retains the rule that phosphate release is solely driven by carbon assimilation
Clarifier Model
In WWTP modeling, clarifiers are typically represented either as idealized separators for the simplest mass-balance calculations or as one-dimensional layer models to capture key vertical settling dynamics. The 1D approach divides the tank into multiple horizontal strata, allowing simulation of solids flux and sludge blanket movement under varying load and flow conditions. This level of physical detail is sufficient to predict effluent TSS performance and assess sludge withdrawal strategies across our ATV- and ASM based scenarios. By using a 1D clarifier model, we maintain computational efficiency while ensuring a robust evaluation of settlement behavior in design-phase simulations.
The depth--dependent concentration profile in a one--dimensional settling tank is governed by the advection–diffusion–reaction equation:
(∂C(z,t))/∂t=-(∂(v(C(z,t))∙ C(z,t)))/∂z+∂/∂z (D(z,t)*∂C(z,t)/∂z)+s(z,t) (1)
To transform this partial differential equation into a system of ordinary differential equations, the tank is discretized in this case into vertical layers—typically at least ten—to form a “layer model.” Each layer falls into one of three categories:
Above--inlet layers, where the withdrawal of treated effluent induces an upward compensating flow.
Inlet layer, where the raw influent is introduced.
Sludge--withdrawal layer, where downward flow associated with solids removal enhances settling.
Within any layer outside the inlet (i.e.,\ for 0≤z<zf0≤z<zf), the rate of change of concentration obeys
here, Vs is the net settling flux (the combined downward flux of particles from the layer above and the upward flux into the layer below), Qe is the effluent flow rate, A(z) is the cross--sectional area of the layer, and zf the elevation of the inlet layer. By convention, no settling flux enters from above the topmost layer. At the inlet layer itself influent addition modifies the balance:
where Qu(t) denotes the sludge withdrawal rate. Below the inlet layer, the mass balance becomes:
(∂C(z,t))/∂t=[V_s (C(z,t),t)-(Q_e (t))/A(z) ]∙C(z,t);0≤z<z_f (2)
(∂C(z,t))/∂t=[V_s (C(z,t),t)-(Q_e (t))/A(z) +Q_u (t)/A(z)]∙C(z,t);z=z_f (3)
(∂C(z,t))/∂t=[V_s (C(z,t),t)+Q_u (t)/A(z)]∙C(z,t);z_f<z≤H (4)
Industrial simulators such as GPS-X, SIMBA, and BioWin generally adopt one--dimensional descriptions on the simplifying assumption that horizontal velocity profiles remain uniform and lateral concentration gradients are negligible. In our simulator IWASP the same methodology is being used. Settling velocities Vs are most often calculated using either the Vesilind equation or the modified double--exponential model of [14] The Takács formulation employs two exponential terms to capture both hindered settling and the more rapid settling of flocculated particles, yielding more accurate predictions of effluent suspended--solids concentrations.
Selection of Treatment Process
The adoption of a Conventional Activated Sludge (CAS), system for the Prishtina WWTP is justified by several inherent benefits. This process is particularly well-suited for the scale and context of the plant, as it generates highly digestible sludge that produces significant amounts of biogas during anaerobic digestion. Furthermore, the CAS process allows for the integration of nutrient removal, ensuring that the resulting effluent meets high-quality standards suitable for environmental discharge [15,16]. The CAS technology is proposed for phase I development as second stage consists also of sensitive water body of effluent by 2040, and needed further analysis as we will present on results section.
Advantages of the Conventional Activated Sludge Process
1. Cost-Effectiveness: CAS systems generally present lower capital and operational costs relative to other treatment technologies [16]
2. Operational Efficiency: This process minimizes head loss throughout the treatment facility, enhancing flow management efficiency.
3. Hygienic Operations: The design minimizes issues related to odors and pests, fostering a safe and manageable operational environment.
Disadvantages
1. Land Requirement: CAS systems typically require more land compared to alternative treatment approaches [17]
2. High Sludge Production: The CAS process generates larger quantities of sludge, necessitating adequate disposal areas [18]
4. Sensitivity: CAS systems can be affected by variations in the characteristics of industrial wastewater, impacting their operational stability [19] but in this case there are no heavy industries.
To address the challenges associated with sudden influxes in flow—such as during storm events—it is designed with two retention tank/basins (RT) in front of inlet pumping station (PS). The current design is primarily focused on carbon removal (Phase I), with future expansion phases planned for nitrogen and phosphorus removal.
3. Results
After running different trials into model, calculation, it resulted that one of the best options is ti use tanks with rectangular bottoms and a water depth of max. 6 meters as per the standards. This setup not only maximizes the oxygen transfer rates but also the premises of the installation are compressed. The new aeration system, which will be implemented to achieve decreased energy consumption, is of its kind and has turbo blowers and fine bubble diffusers as parts of its components. Moreover, the design will be made expandable for future constructions so that the plant can be easily modified as per the changed requirements of the future.
The design parameters supply information on the major factors such as sludge ages of carbon for 5-6 days and nitrogen for 8-10 days that will be required. Our approach to phosphorus removal will be through biological methods with chemical as a backup solution. The design will involve not less than six final clarifiers, an activated sludge (AS) pumping station with proper circulation-rate and system efficiency, as well as a smooth reduced sludge return, which will ensure at least 6 sludge retention times and thus, almost 100% of BOD be removed. To sum up, the Conventional Activated Sludge process is the most suitable method for Phase I development in that it is a combination of efficiency, economy, and eco-friendliness and the system is adapted to the ambient conditions and the resources of the local environment [20].
The computation was done with the help of the ATV-DVWK-A 131 standard, and the findings are tabulated. In addition to that, using a dynamic digital model with IWASP, we modeled the parameters of the treatment steps with the same parameters and the models were found to have all the parameters in the same temperature range. At the same time, we traced the content of the papers showing a comparison of the results taken out of SM1 against the experimental and numerical ones from ASM. This way, we managed to effectively test the model on the capacity of the system to remove phosphorus.
Table 5.
Results on calculation wit ATV-131 Standard for CAS – including second phase!
| Parameter | Value |
| Design PE | 479,879 |
| Average Flow Q | 71888 m³/d |
| BOD5 Load | 28740 kg/d |
| TN Load | 5248 kg/d |
| MLSS | 3,500 mg/L |
| Reactor Volume | ~64,500 m³ |
| HRT Phase I | ~10 hours |
| HRT Phase II | ~21 hours |
| HRT-anoxic | ~5 hours |
| Sludge Retention time (SRT) Phase I | 6 days |
| Sludge Retention time (SRT) Phase II | 10 days |
| Oxygen Demand | ~59,000 kg/d |
| Reactor Depth | 6 m |
| No. of Reactors | 2+1+1 |
| No. of Clarifiers | 6 |
| Clarifiers diameter | 24 (m) |
| Excess Sludge | 11350 kgSS/d |
| Size per Reactor | 110 x 30 x 6 (m), with 0.5 m free height |
| Waste Activated Sludge | 2250 m³/d |
Phases for project development:
Figure 4.
WWTP Water Line Layout for Phase I.
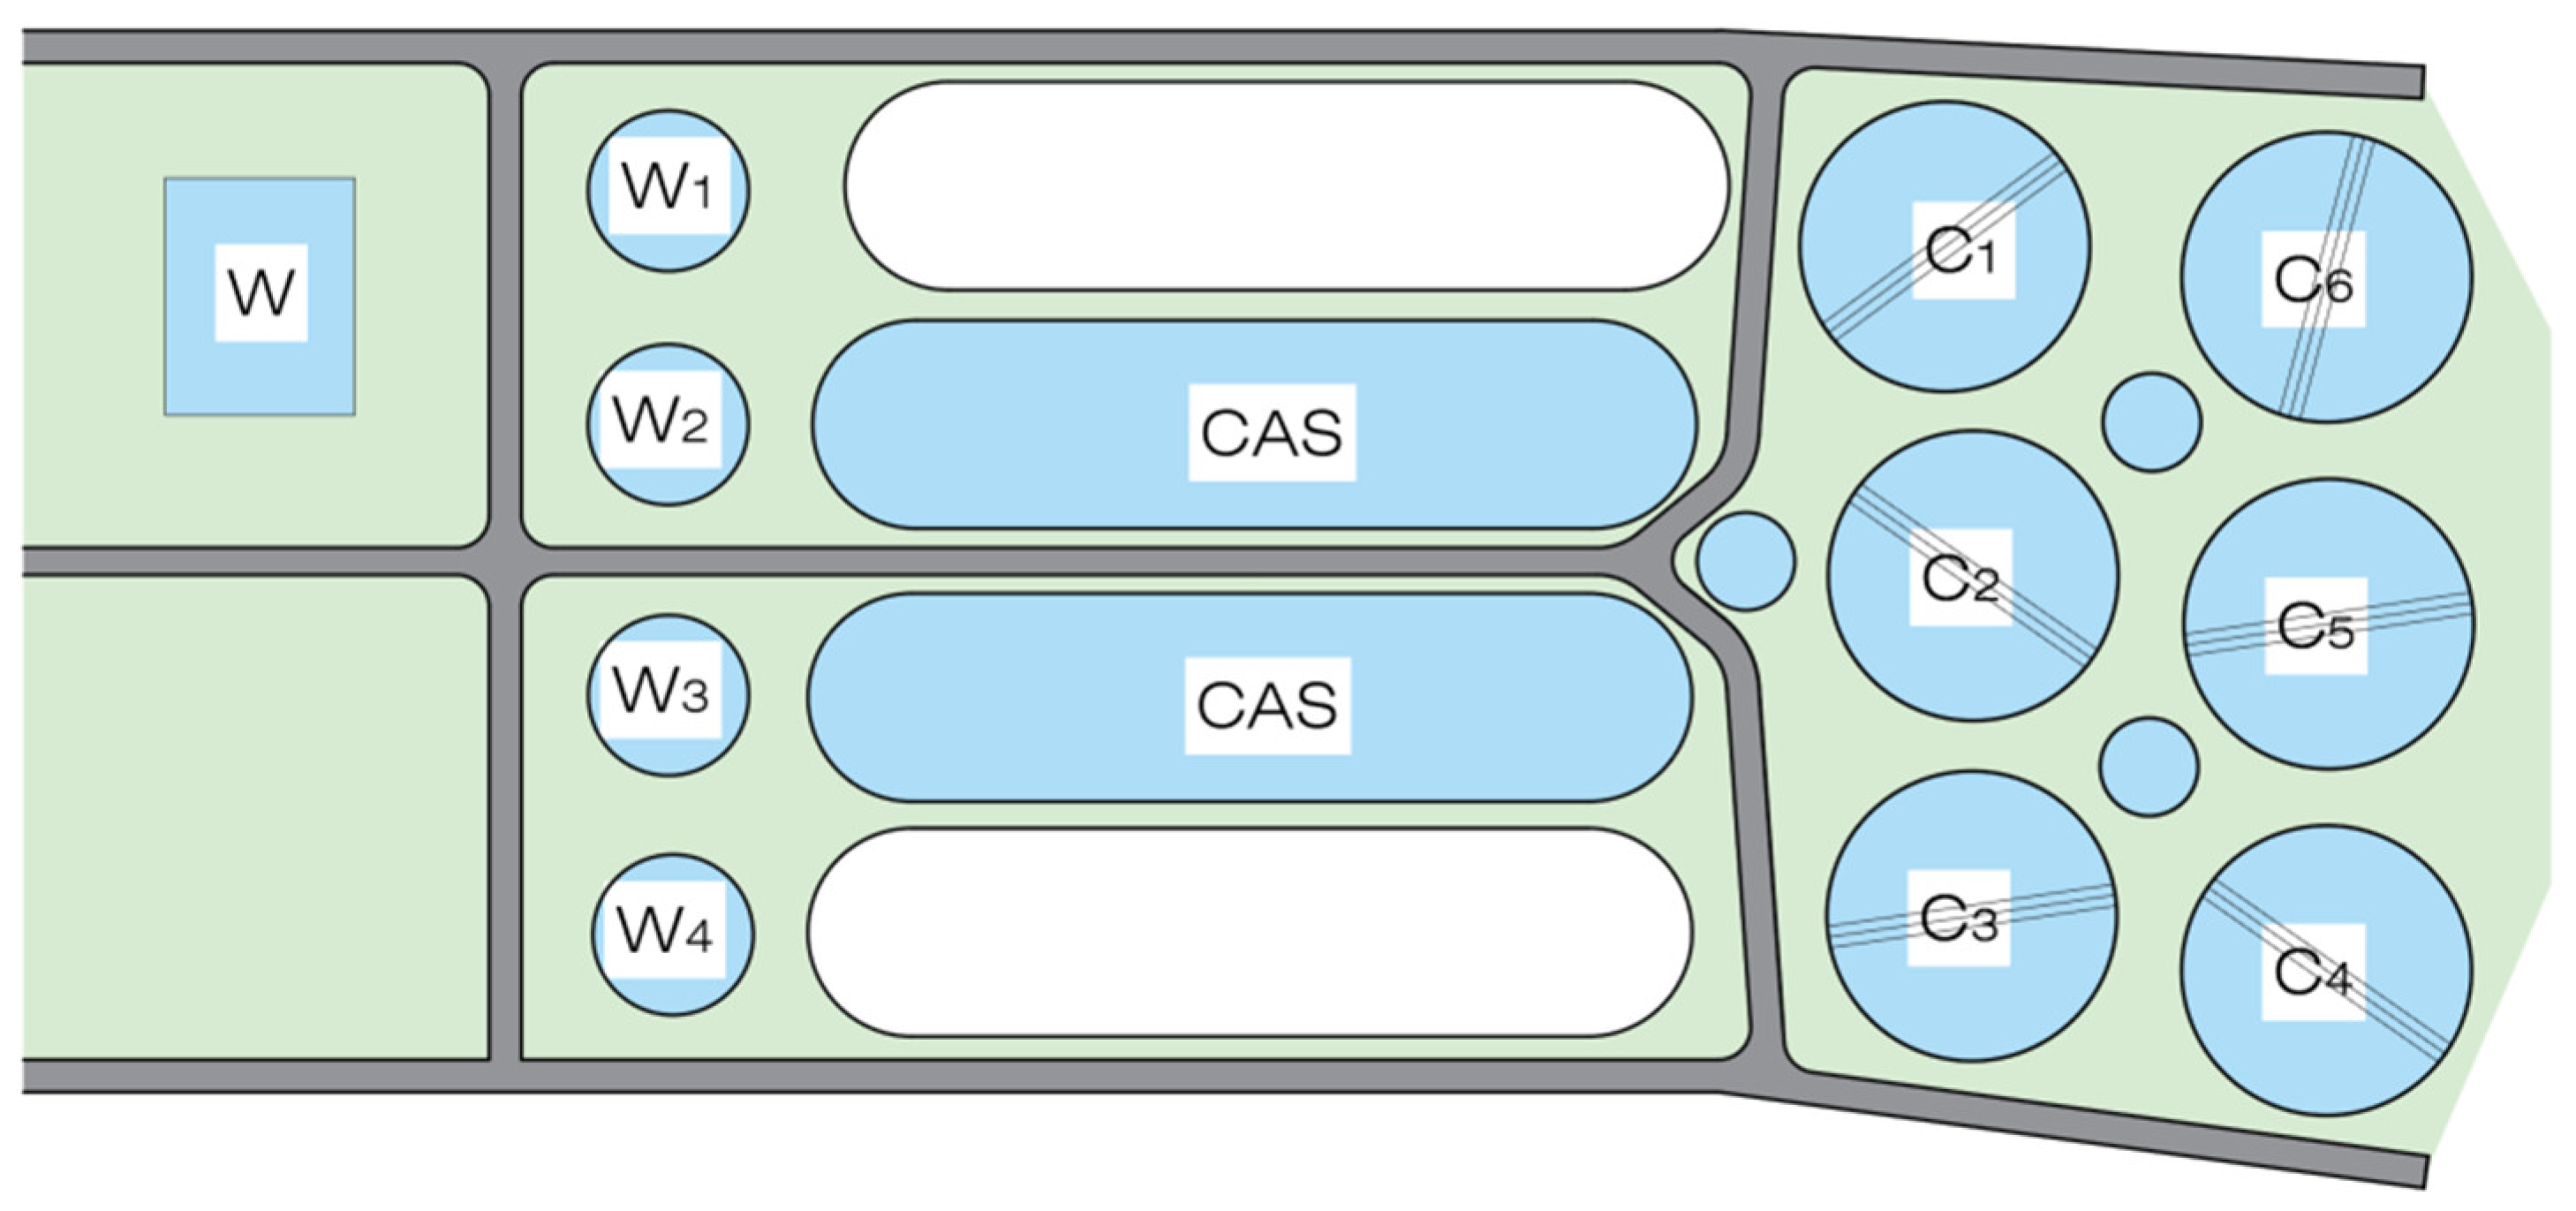
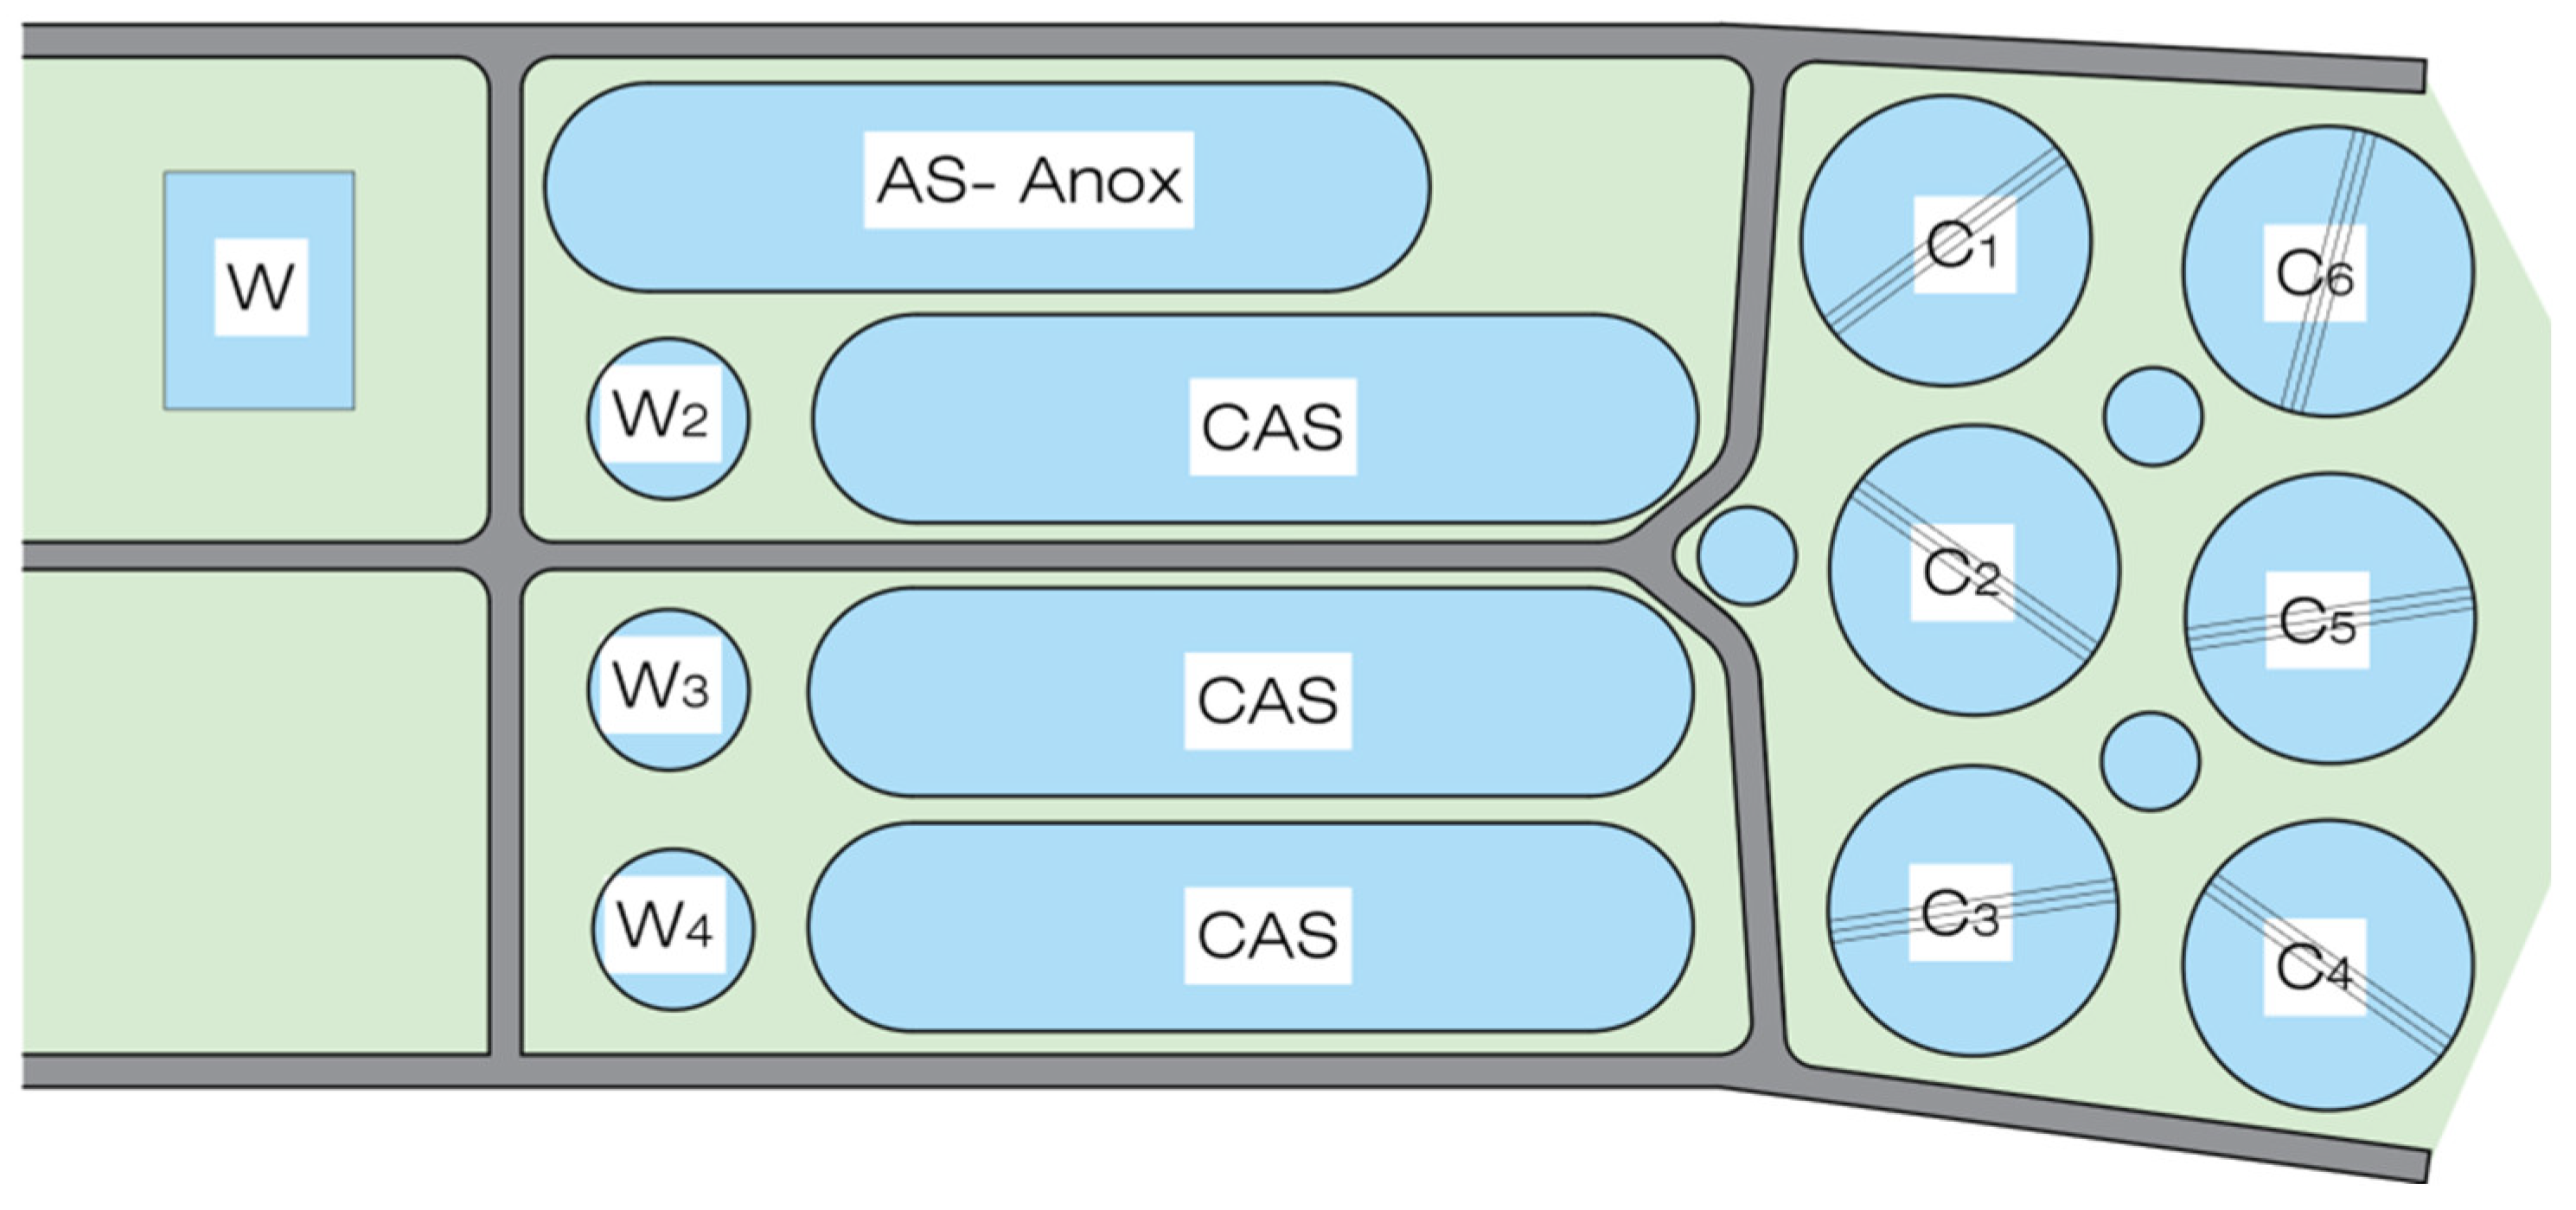
Figure 5.
WWTP Water Line Layout for Phase II.
Model from IWASP - results:
The dynamic model was implemented, generating different scenarios, after running for the period 2040, including the conditions for sensitive water body for effluent discharge the layout is inserted into software.
Figure 6.
Dynamic Model layout from the software, setup of treatment steps.
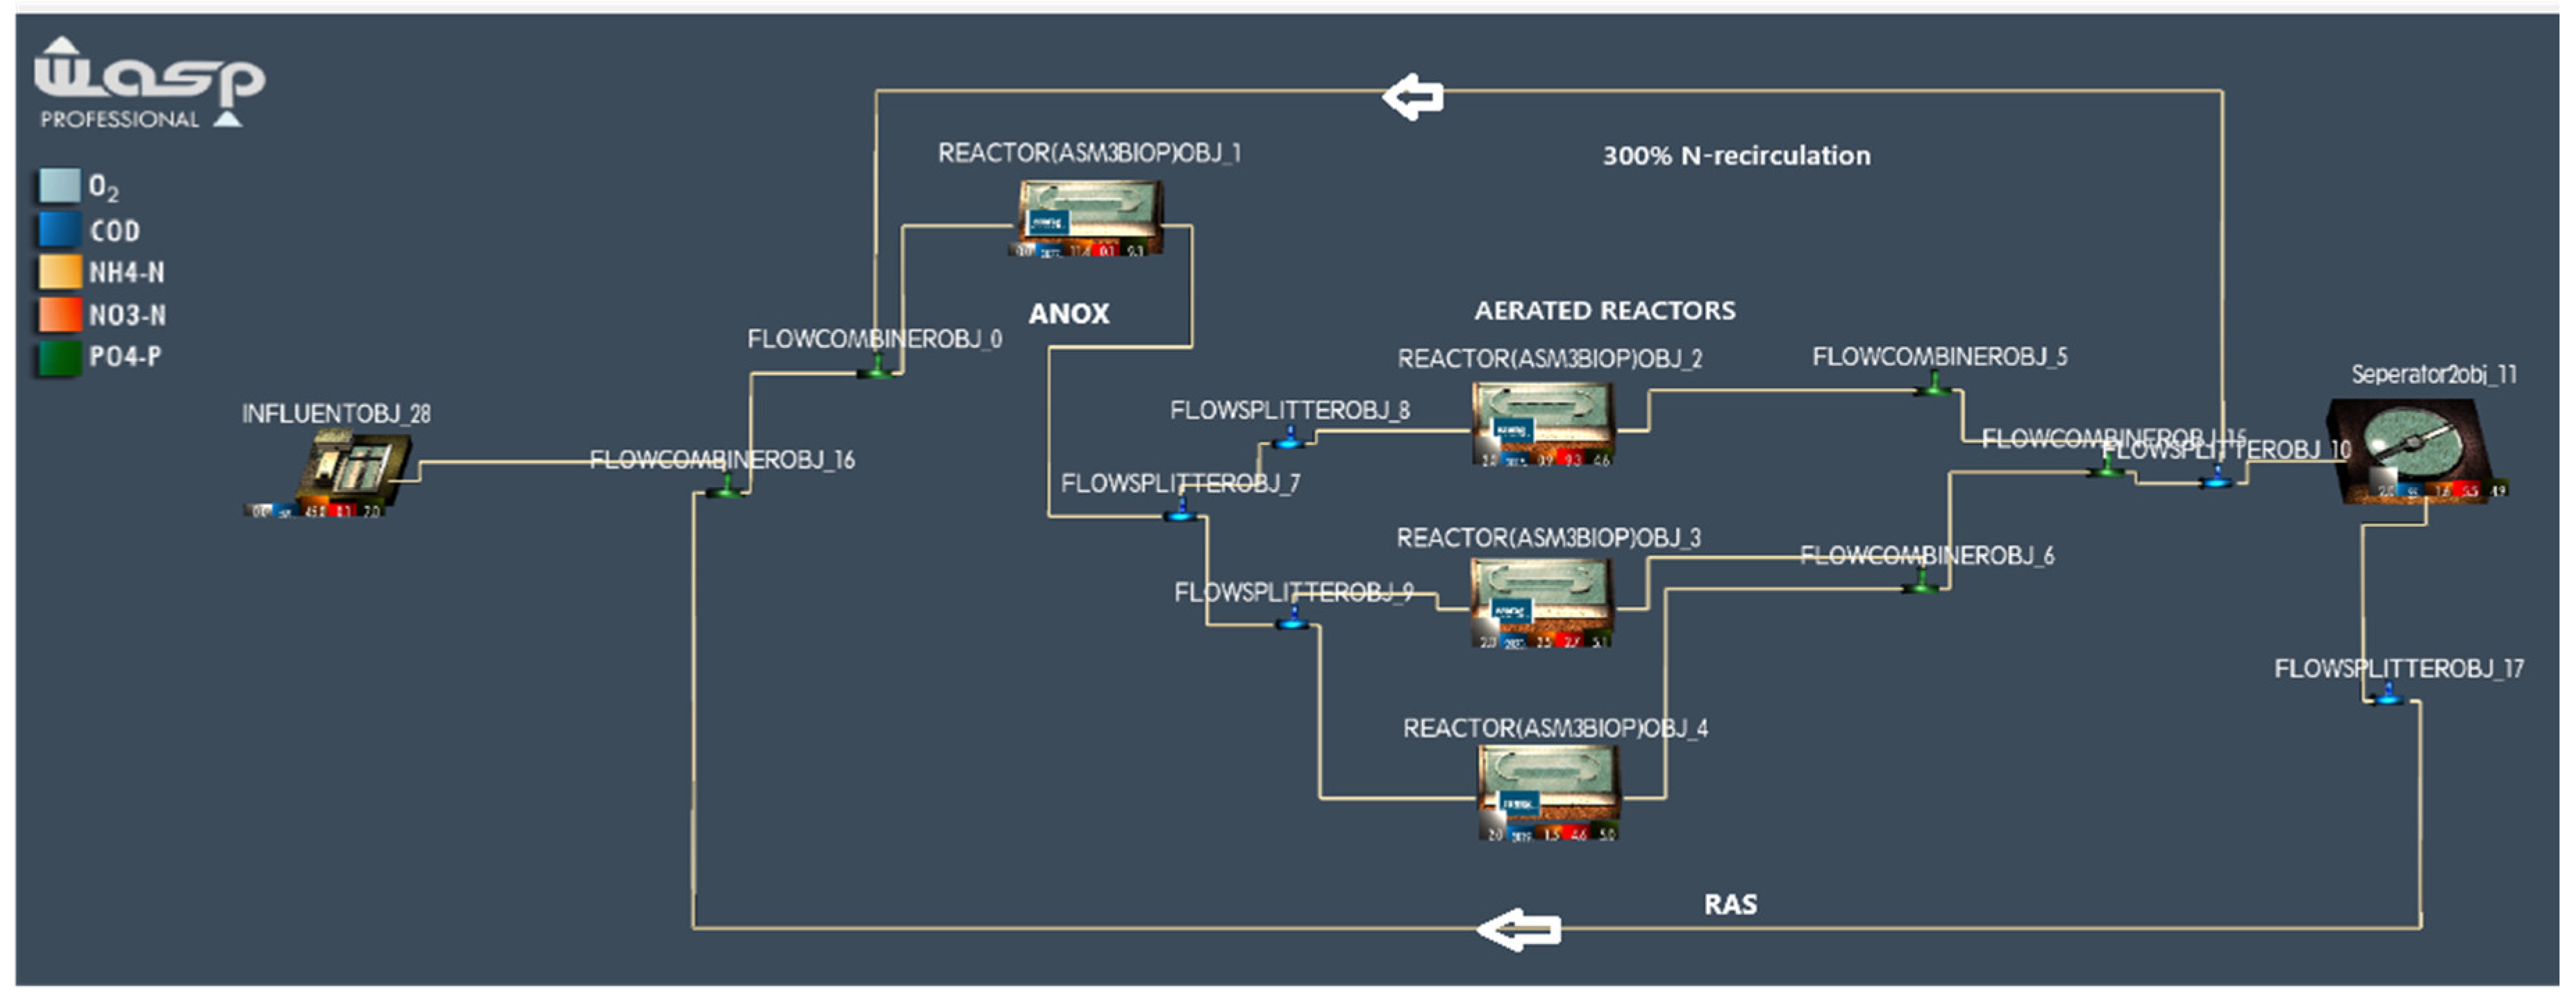
On the software there are several trials, and the result shows the best fit scenario for the respective WWTP and data, in relation to effluent standard requirements.
Figure 7.
Chart with MLSS and WAS Parameters on running regime.
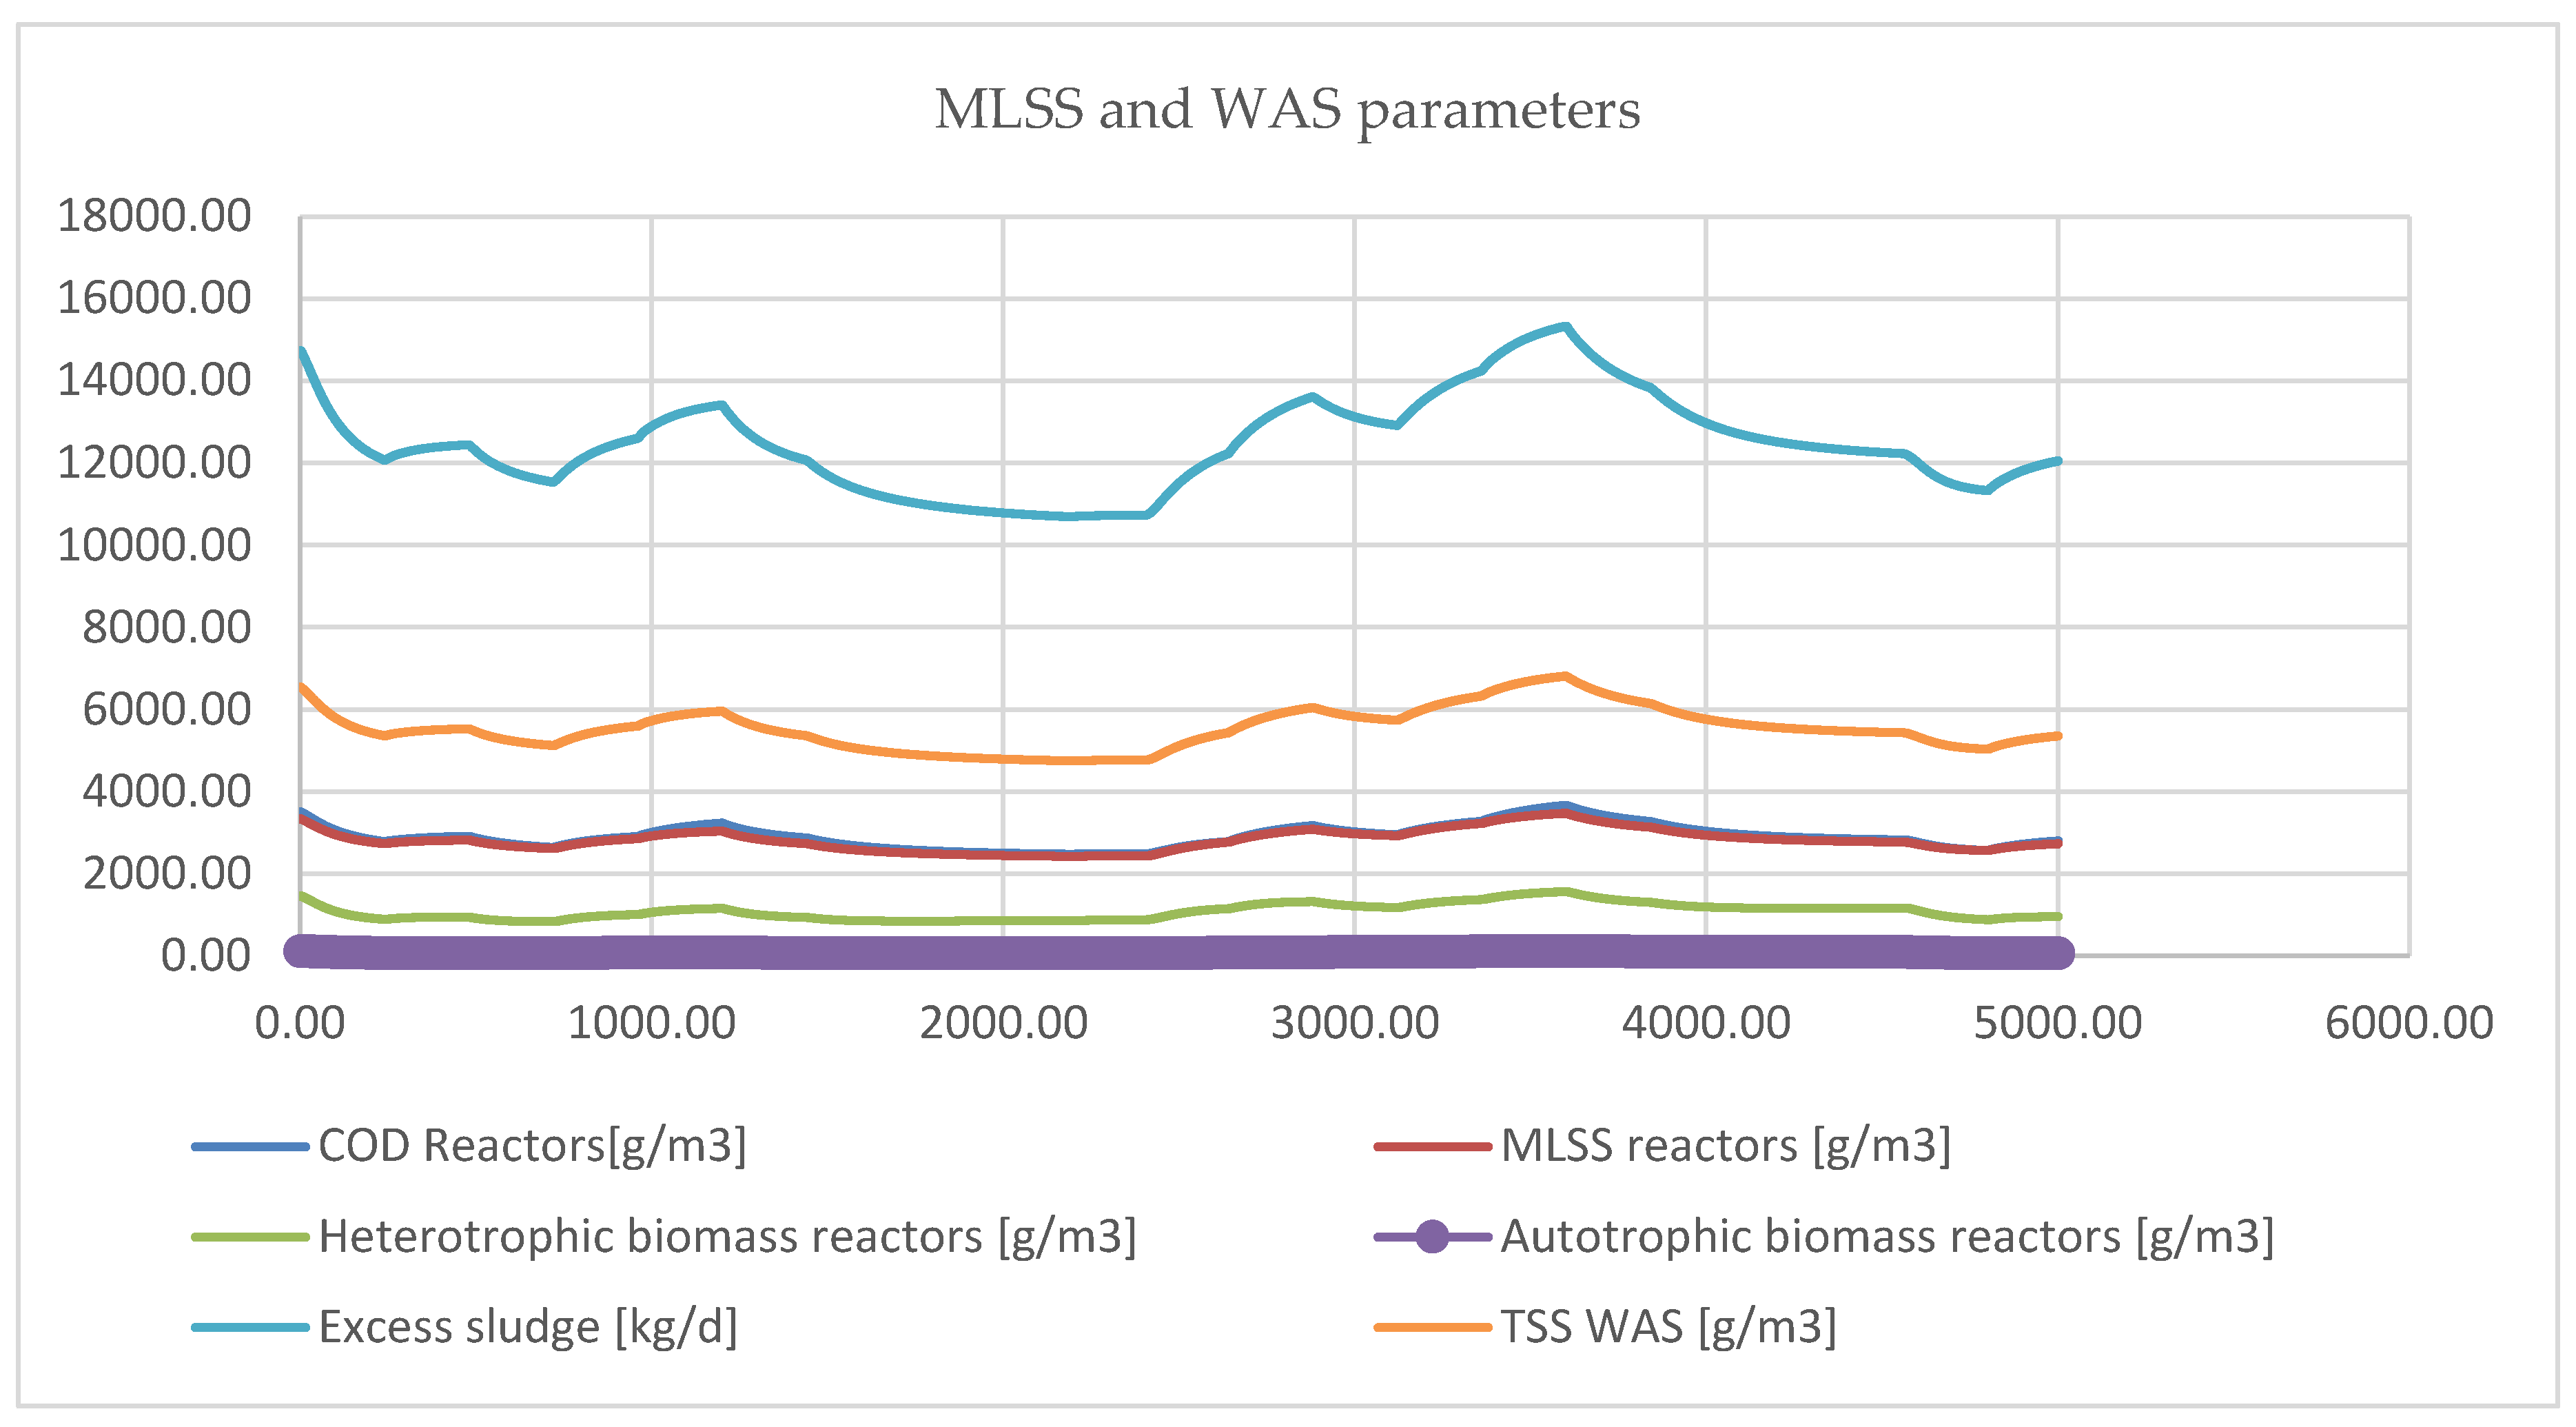
The analysis from the model was from different loads, starting from low to medium and high load, and the results show that for high load it gives better results, which proves also the first necessity for network improvement, to receive high load concentration from the influent. Regarding WAS and MLSS the model gave higher quantity for excess sludge, and it varies from 10000 kg/day – 14000 kg/day. As the influent load for TSS is very low, the model generated more realistic values, including inert presence around 300 mg/l. MLSS 3500 mg/l, settle sludge in clarifier around 4500-6500 mg/l, RAS flowrate was set to 100% of influent.
On this paper there were also parameters analyzed on operational aspect in relation to treatment quality at the water line. The scenarios were deriving after several trials, and in this case from the airflow part we conclude that the best fit, to reach proper results at the reactors, is when we have 3 CAS reactors, 1 fixed aeration and 2 alternating aeration and 1 anoxic.
Figure 8.
Airflow chart on reactors part.
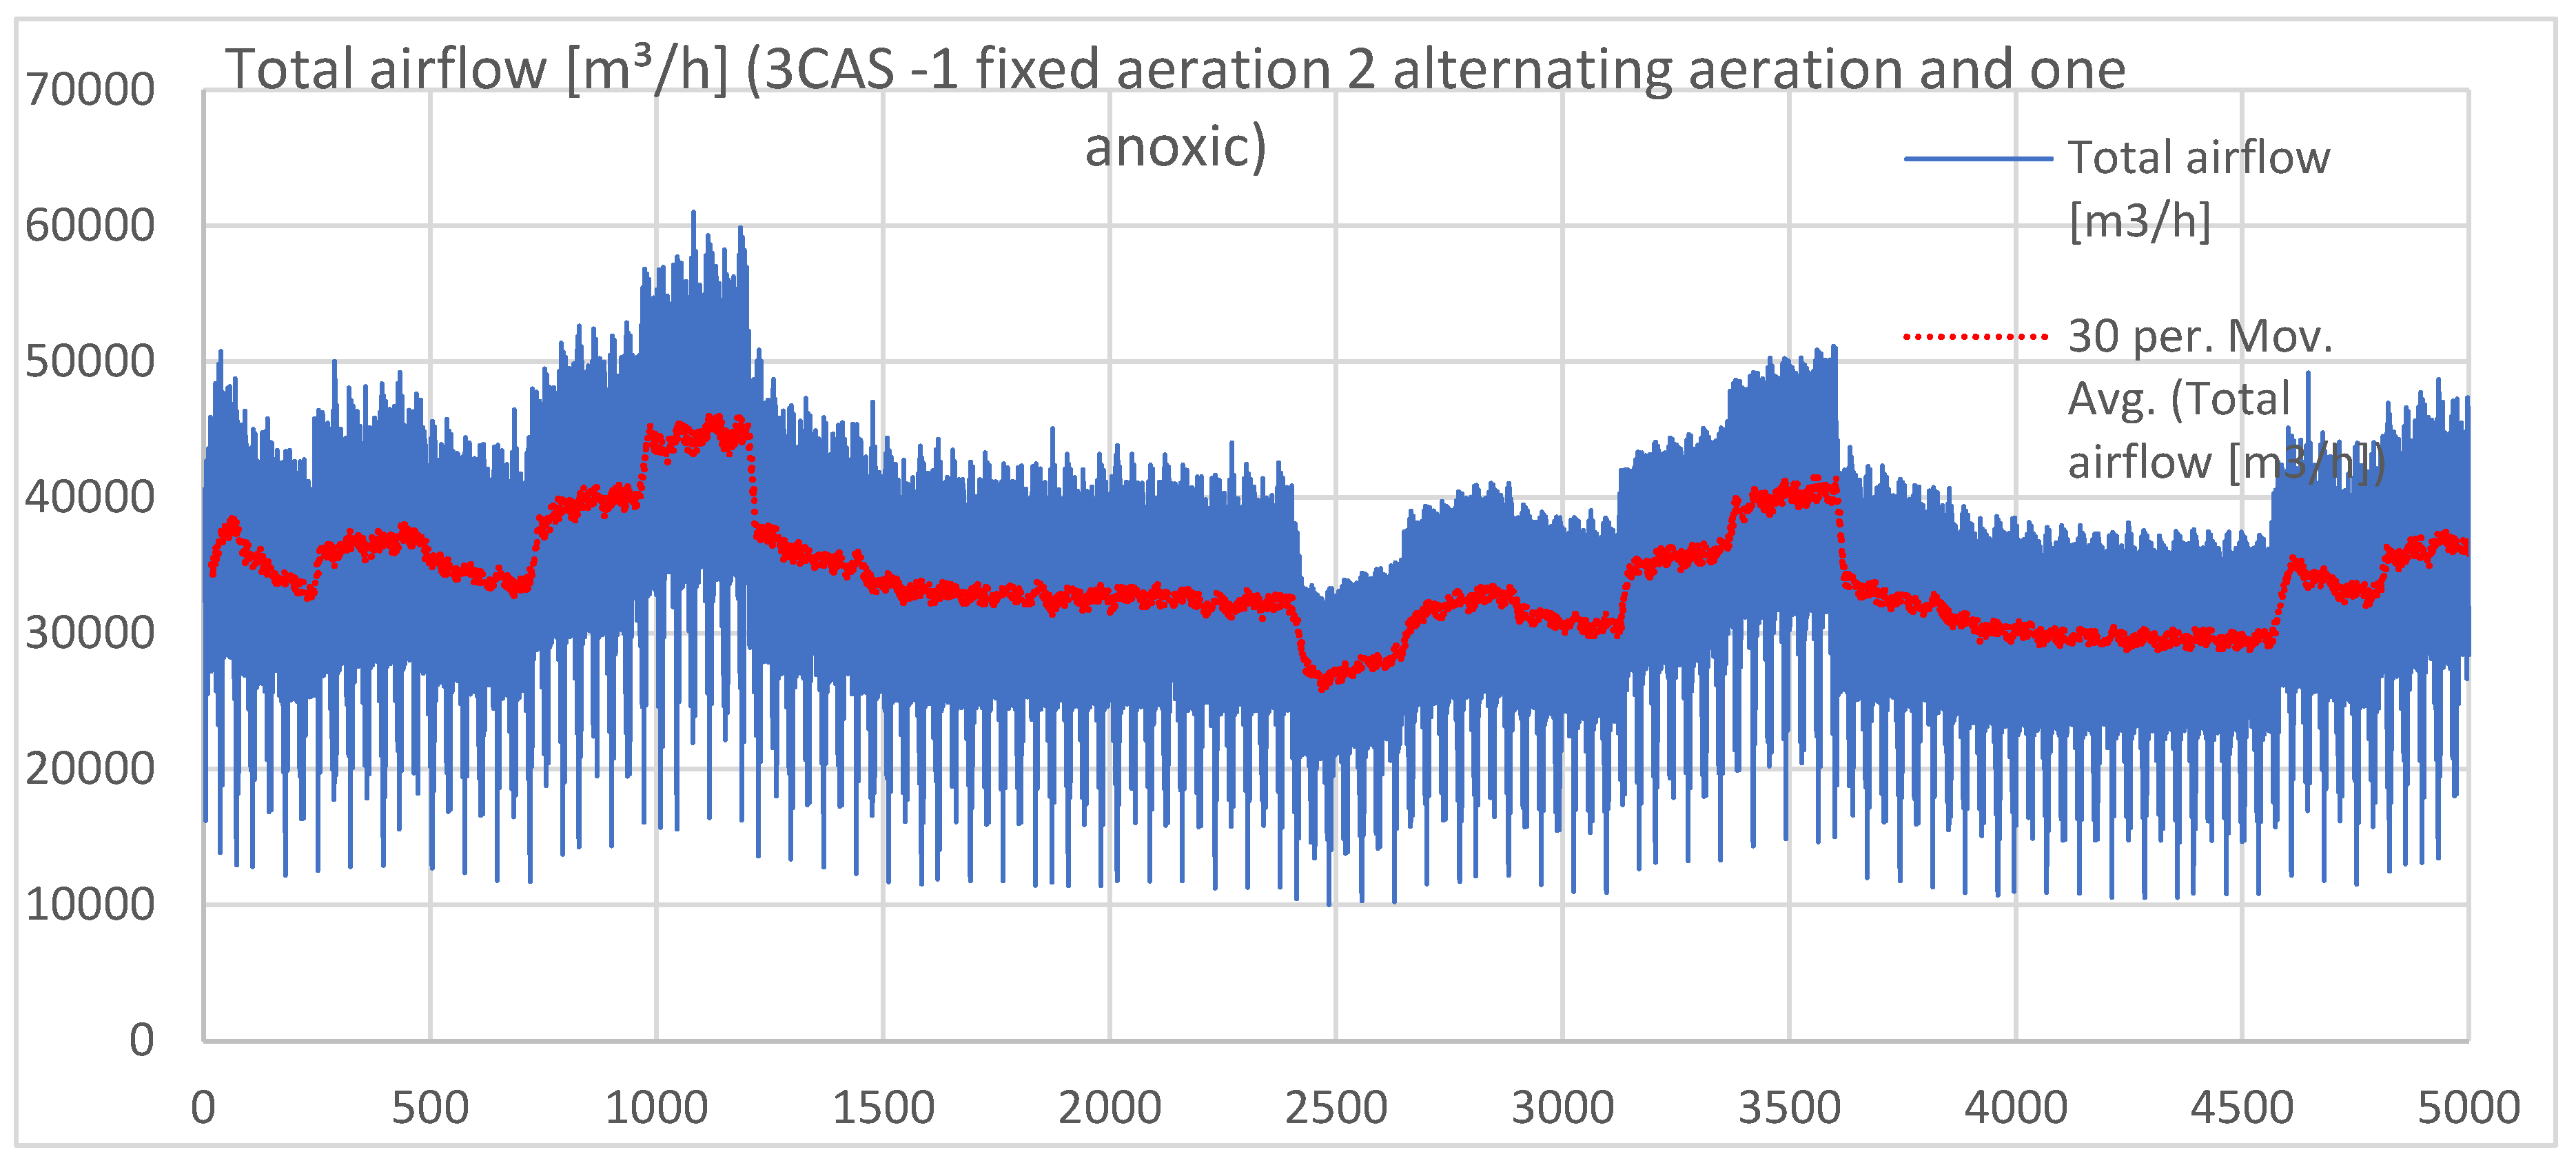
After reactors the treatment process goes to clarifiers where we set proper rules to have good working plant. On these rules we setup pre-denitrification layout, 1 reactor was set to anoxic, which feeds 3 CAS reactors, from which 2 have alternating aeration, one fully aerated, nitrate recirculation is set to 300% of influent, as they may see on Figure 8. Underflow of influent was set to 100%, with WASQ=2550m³/d, SRT around 11 days. It is considered that NH4-n, N03-N, 3% of COD contributes to organic nitrogen. Temperature from 0-2500 h= 20°C, and then from 2500-5000h = 12°C. There were simulations conducted also with 1D clarifiers with different surface are of clarifiers and in both cases the biological part works properly for effluent requirements with regards also to TSS.
Figure 9.
Removal rate of COD and TN.
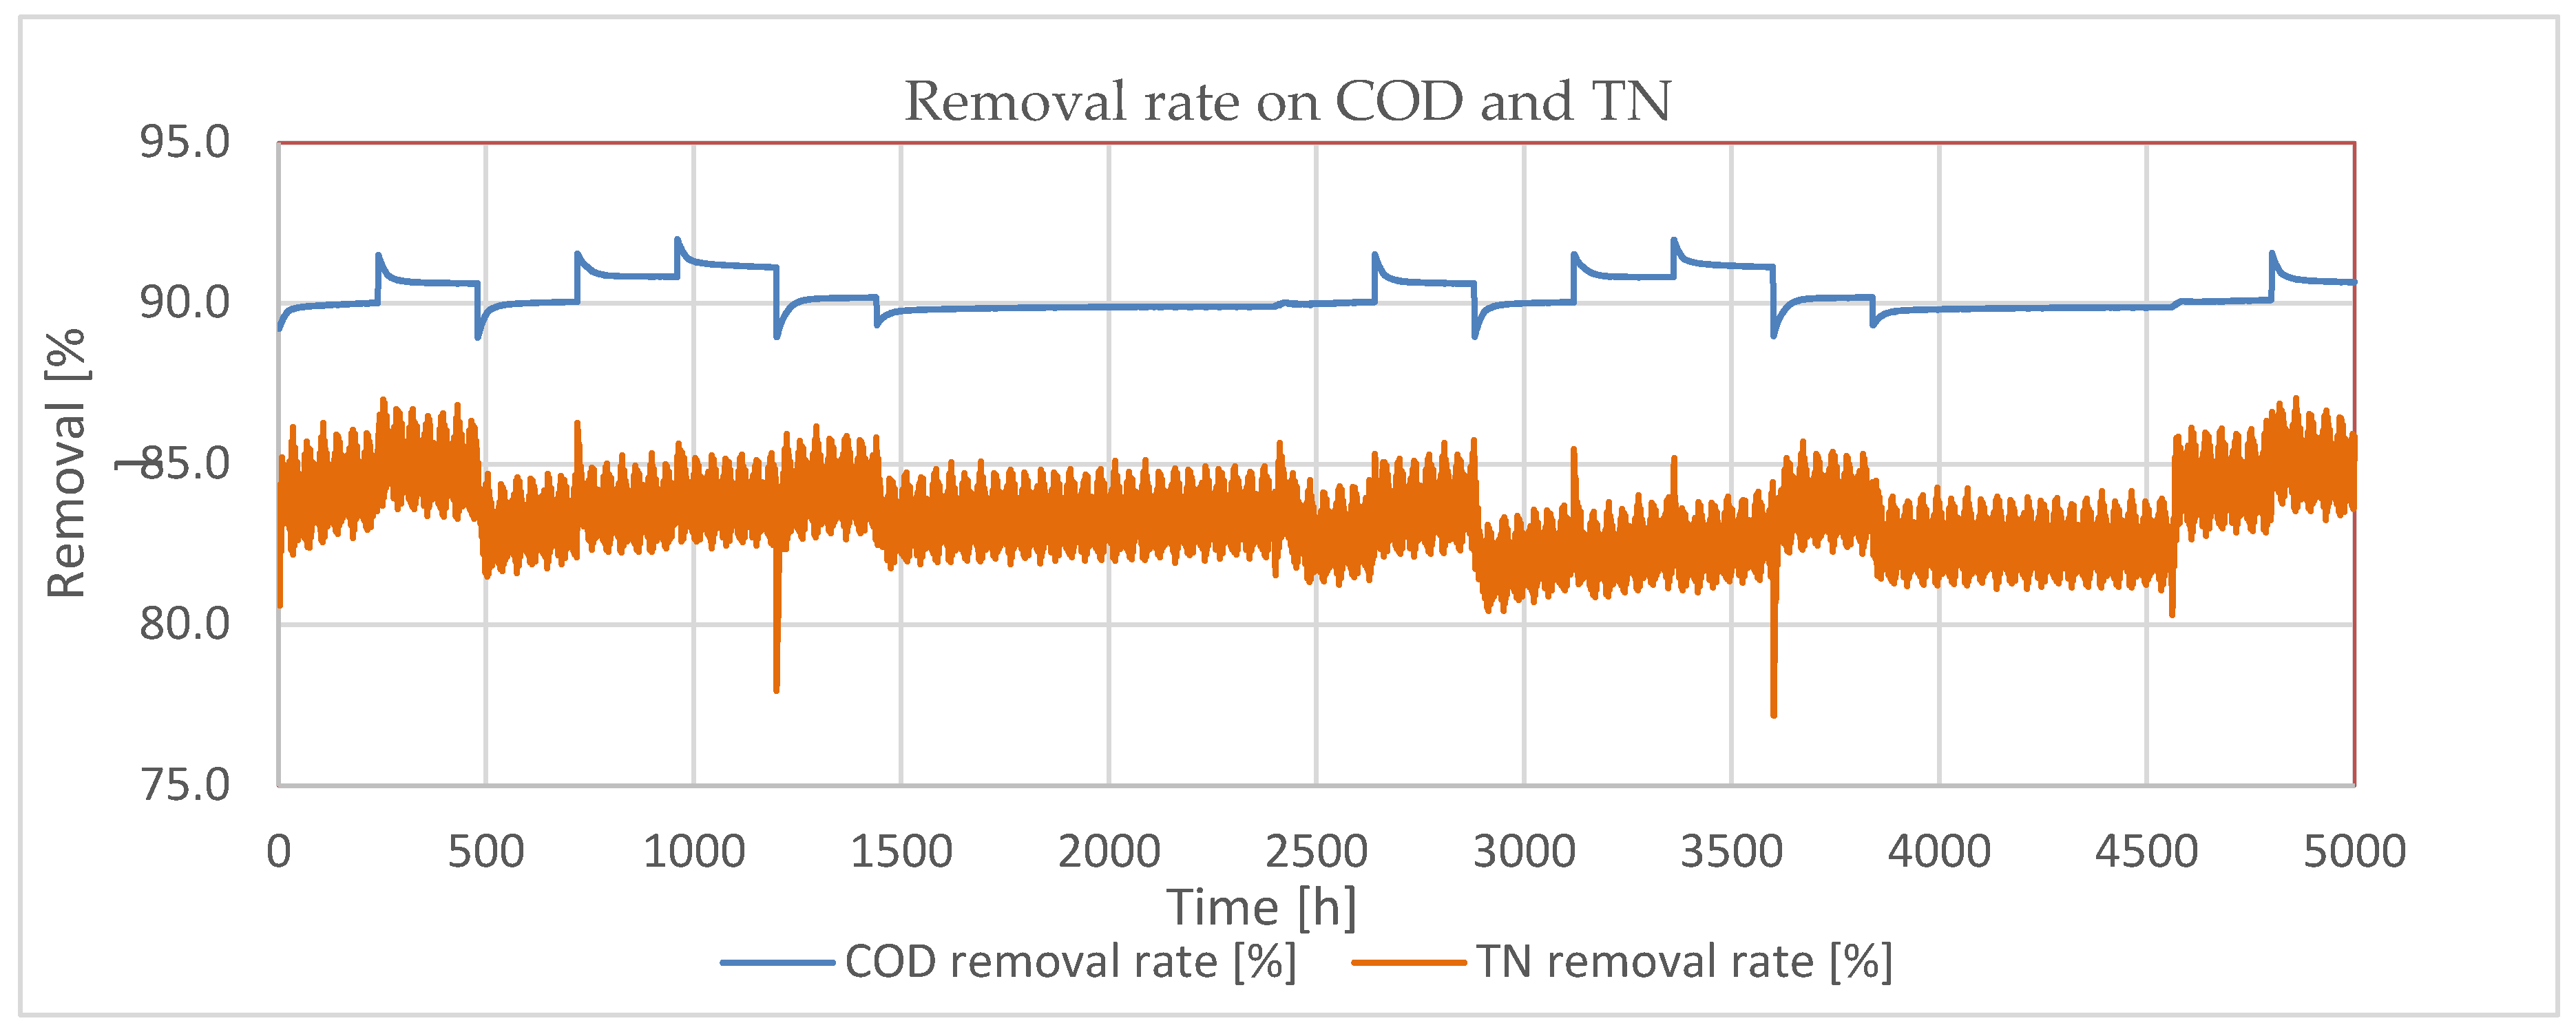
We observed that COD removal is around 90-92%, or 55-65 mg/l, where full biodegradation occurs, which practically is realistic.
N-removal from the simulation resulted in very good values, around 85%, and it can work even for elevated influent COD.
Figure 10.
TN Removal from inlet – outlet.
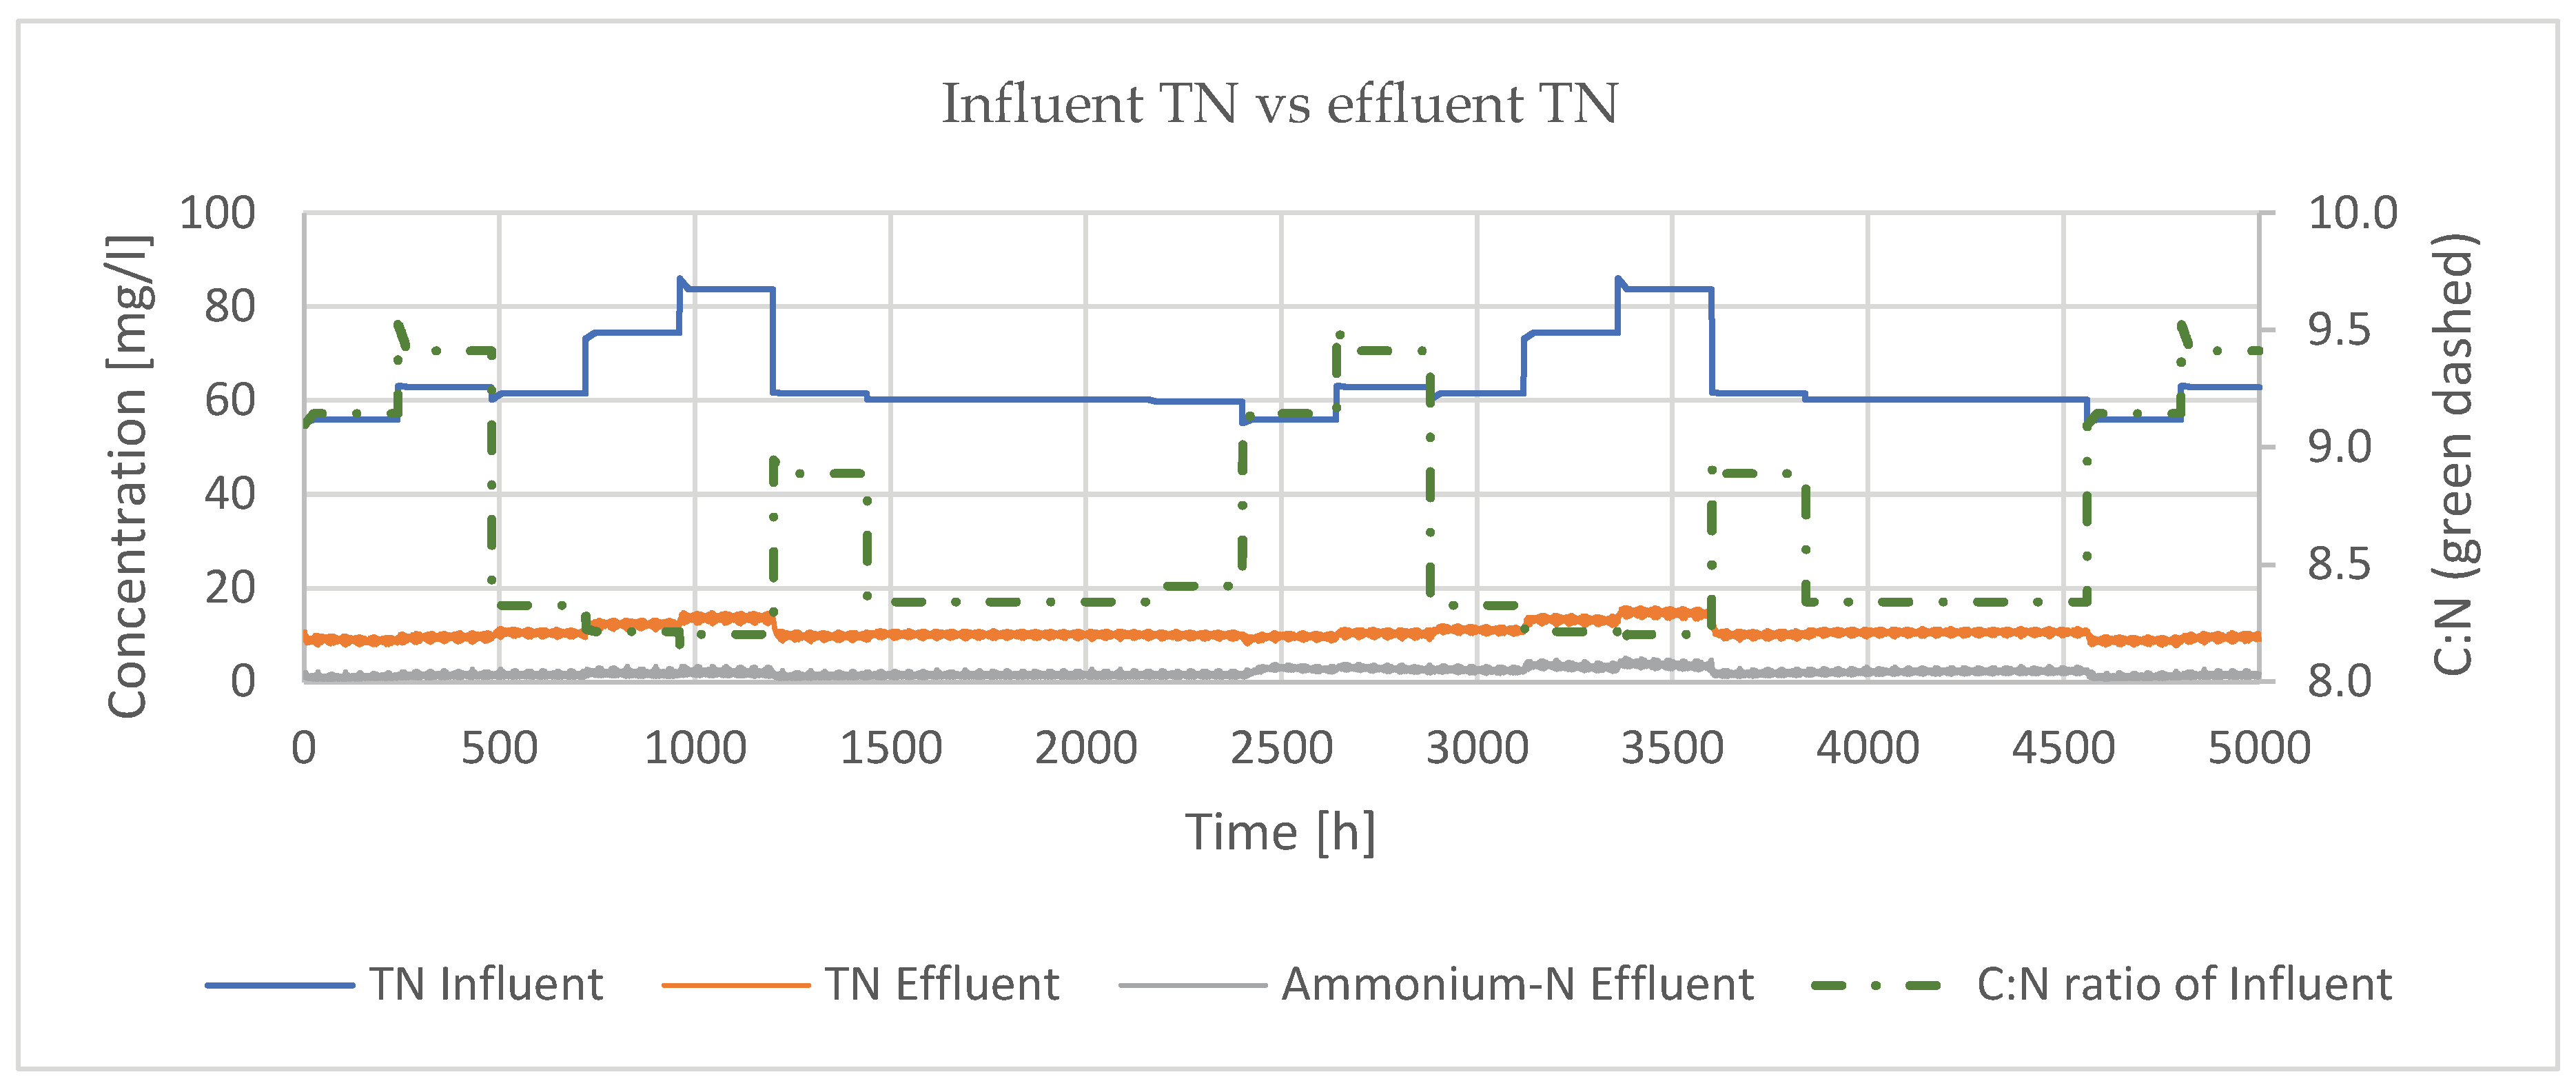
The C:N ratio is an important limiting condition (orange dashed line – right axis) According to the ASM3bioP model, if this is over 8:1 (biodegradable carbon ratio is optimal) the denitrification work properly.
-TN effluent below 10 mg/l can be achieved by this way, as per the requirement on local standard for effluent on TN removal.
- Temperature drop has now visually more effect, nitrification is critical in wintertime and 15 mg/l total N is more realistic in these cases.
After the model run, it was evaluated and compared with conventional calculation according to ATV 131, to compare results, which prove the model software is working properly, including calculated parameters shown on Table 6.
4. Discussion
The study went into detail to analyze both the design and the operational performance of the proposed Prishtina WWTP. It employed not only the traditional standard of ATV-DVWK-A 131E calculations but also innovative dynamic modeling through the IWASP platform. The main objective was to verify the ability of the plant to keep up with the future discharge standards till 2040, especially concerning nitrogen and phosphorus elimination in an efficient way as the population and load would keep growing.
The main challenges on design efficiency measures are related to proper technology setup, treatment steps, in different contexts, from water/sewer quality, quantity fluctuations, regional or local experience. Another key context is Operational and Maintenance part O&M, including energy consumption. Another key point analyzed during the study preparation of the paper was design efficiency in relation with load variability including seasonal changes on load at the inlet of WWTP. At the beginning it was analyzed one of the most priority points, importance of sewer network, and its performance on hydraulic, infiltration and exfiltration from the network.
On design part it was analyzed from different perspectives of technology including CAS, SBR, MMBR, MBR, and resulted that. Finally, it resulted CAS technology offers a balance between cost-effectiveness, simplicity of operation, a process which covers proper removal of high BOD and COD and integration of further stages for the future on phosphorus removal.
The integration and comparison with dynamic models from IWASP, platform with ASM3bioP, was achieved to simulate quite realistic model scenario for Prishtina WWTP. Conventional calculation with ATV DVWK-A 131, was re made after trials on dynamic models, and resulted that it cannot work smoothly on forecasting taking into consideration seasonal and load fluctuations. After all these discussions raised by the team, treated also in this paper we came to the results that the best fit for this specific WWTP would be in the first phase of development to introduce CAS technology with an update during the year, to achieve on 2040 a combination of CAS, with pre-denitrification,
5. Conclusions
Firstly, the plant was furnished with four CAS reactors that were running aerobically and which to some extent effectively contributed to the removal of BOD₅, COD, and TSS. However, it could not suppress the total nitrogen (TN) concentration to less than 10 mg/L, specifically during the cold months of the year. Thus, the revised configuration that deals with the three new CAS reactors was thought over. Out of those, two were running alternate aeration, and one was a completely anoxic tank to make the pre-denitrification stage efficient.
Upgraded 3 CAS + 1 Anoxic reactor configuration (Pre-denitrification):
- Two reactors: alternating aeration
- One reactor: fully anoxic
- Achieved TN removal efficiency of ~85%
- Effluent TN consistently <10 mg/L
IWASP dynamic model advantages:
- Realistic simulation of seasonal variations and load fluctuations
- Improved sludge stabilization and effluent quality
- COD removal: 90–92%
- MLSS maintained around 3,500 mg/L, with stable clarifier performance
Operational and strategic benefits:
- Lower oxygen demand (energy savings)
- Higher flexibility for phosphorus removal (bio-P + chemical)
- Scalable and adaptable layout for future tertiary upgrades
Project Alternative Cost Analysis
Two options of project location compatible with the outcomes of the first step of analysis of the project alternatives and with de the developments of the network component were studied:
- Option 1: The wastewater treatment schema with one main WWTP in Lismir, lower point which will get water from cities and towns (municipalities - here-after called “Option 1 WWTP”), this model was calculated and run in model, as the best scenario.
- Option 2: A treatment schema with a small WWTP in Obiliq (with an Inlet Pumping Station), and a main WWTP in Lismir with two Inlet Pumping Stations (identical flows and heads as option 1) processing the wastewater from Prishtinë, Fushë-Kosovë, Gracanica and Lizmir (here-after called “Option 2 WWTP”).
At the end, Option 1 has been selected, it is the option presented in the research paper and dynamic model as well.
Table 7.
Comparison between option 1 and 2 , CAPEX.
| Description | Option 2 Obiliq | Option 2 Prishtina | Option 1 Centralized |
| Wastewater treatment | 9 025 800 € | 39 488 400 € | 42 460 600 € |
| Sludge dumping areas | 892 300 € | ||
| Sludge thickening | 650 800 € | ||
| Sludge treatment Phase I | 35 921 600 € | 35 921 600 € | |
| Sludge treatment Phase II | 30 530 858 € | 30 530 858 € | |
| Earth works - WWTP platform | 1 693 405 € | 18 936 500 € | 18 936 500 € |
| Other civil works | 338 681 € | 3 784 083 € | 3 784 083 € |
| Transfer main Obiliq-Lizmir | 4 146 780 € | ||
| Obiliq IPS | 3 606 900 € | 4 061 200 € | |
| Fushë-Kosovë IPS | same | Same | |
| Total (excl. VAT) | 15 315 586 € | 129 553 741 € | 139 841 621 € |
| 144 869 327 € | 139 841 621 € |
Table 8.
Comparison between option 1 and 2 , Annual OPEX.
| Description | Option 2 Obiliq WWTP | Option 2 Prishtinë | 1 WWTP Prishtinë |
| Personnel | 102,700 € | 488,105 € | 488,105 € |
| Operational costs for water treatment | 12,780 € | 122,290 € | 127,720 € |
| Reagents | 91,997 € | 695,283 € | 747,279 € |
| Electricity WWTP | 631,806 € | 2,270,721 € | 2,276,311 € |
| By-products | 21,400 € | 256,000 € | 277,400 € |
| Maintenance | 75,580 € | 784,210 € | 849,630 € |
| Analyses - laboratory | 25,000 € | 95,000 € | 95,000 € |
| Operational costs for sludge treatment | 32,540 € | 1,477,599 € | 1,477,599 € |
Author Contributions
First author contributed on data collection, calculation with conventional calculation through ATV DVWK-A 131, preparation of drawings, cost calculations and technology comparison. The second author contributed on IWASP dynamic modelling, including inputs on all calculation and model for IWASP ASM, ASM3 bioP, clarifier calculation, recommendations and discussion. Third author contributed on revision of paper, with proper professional experience and recommendation on technology selection, advantages and disadvantages and discussion.
Data Availability Statement
Main data where from the project preparation phase from Regional Water Company Prishtina j.s.c (RWC Prishtina), their studies through project preparation from 2 consultant companies (SRP, Gopa, and Antea BRLi).
Acknowledgments
I would like to express my sincere gratitude to Professors- authors Dr. Miklós Patziger, and Dr. Tamás Koncsos for their valuable guidance and support on my research study.
Conflicts of Interest
On behalf of authors, we declare that there is no conflict of interest at any stage on this paper preparation or publication. It is sole study within BME (Budapest University of Technology and Economics), and official data from the RWC Prishtina.
Abbreviations
The following abbreviations are used in this manuscript:
| AI | Administrative Instruction |
| ASM | Activated Sludge Model |
| ASM2d | Activated Sludge Model No. 2d |
| ASM3bioP | Activated Sludge Model No. 3 with Biological Phosphorus Removal |
| ATV-DVWK-A 131(E) | Arbeitsblatt ATV-DVWK-A 131 (Guideline for Dimensioning of Single-Stage Activated Sludge Plants) |
| BME | Budapest University of Technology and Economics |
| BOD₅ | Biochemical Oxygen Demand over 5 days |
| CAPEX | Capital Expenditure |
| CAS | Conventional Activated Sludge |
| COD | Chemical Oxygen Demand |
| DS | Dewatered Sludge |
| DWA | German Association for Water, Wastewater and Waste |
| EAWAG | Swiss Federal Institute of Aquatic Science and Technology |
| EPS | Excess Phosphorus Storage |
| EU | European Union |
| HRT | Hydraulic Retention Time |
| IWASP | Integrated Wastewater Simulation Platform |
| IPS | Inlet Pumping Station |
| kPE | kilo Population Equivalent (1,000 PE) |
| MBR | Membrane Bioreactor |
| MDPI | Multidisciplinary Digital Publishing Institute |
| MLSS | Mixed Liquor Suspended Solids |
| MBBR | Moving Bed Biofilm Reactor |
| O&M | Operation and Maintenance |
| OPEX | Operational Expenditure |
| PAO | Phosphate Accumulating Organism |
| PE | Population Equivalent |
| PS | Pumping Station |
| q | Specific Water Consumption |
| RAS | Return Activated Sludge |
| RT | Retention Tank |
| SBR | Sequencing Batch Reactor |
| SIMBA | Simulation of Biofilm Activity |
| SS | Suspended Solids |
| SRT | Sludge Retention Time |
| TN | Total Nitrogen |
| TP | Total Phosphorus |
| TSS | Total Suspended Solids |
| UASB or UASBR | Upflow Anaerobic Sludge Blanket (Reactor) |
| WAS | Waste Activated Sludge |
| WASQ | Waste Activated Sludge Flowrate |
| WWTP | Wastewater Treatment Plant |
References
- A. Papadopoulou, G. Stefanakou, and E. Fougias, “Promotion of environmental projects to conform with UWWTD and integrated water management,” Water Pract Technol, vol. 17, no. 7, pp. 1421–1432, Jul. 2022. [CrossRef]
- M. An, W. He, D. M. Degefu, Z. Liao, Z. Zhang, and L. Yuan, “Spatial Patterns of Urban Wastewater Discharge and Treatment Plants Efficiency in China,” International Journal of Environmental Research and Public Health 2018, Vol. 15, Page 1892, vol. 15, no. 9, p. 1892, Aug. 2018. [CrossRef]
- Q. Li, Y. Qian, Y. Shi, Y. Miao, and M. Luo, “Application of biofilm-membrane bioreactor in municipal wastewater treatment,” Applied Mathematics and Nonlinear Sciences, vol. 9, no. 1, Jan. 2024. [CrossRef]
- S. Pazdar, S. Eslamian, H. Gholami, and K. Ostad-Ali-Askari, “Evaluation of Treated Wastewater in Terms of Environmental Standards,” American Journal of Engineering and Applied Sciences, vol. 12, no. 4, pp. 450–459, Sep. 2019. [CrossRef]
- T. Barcõn, T. Alvarino, M. Gõmez, and F. Omil, “Strategies to minimize the release of endotoxins in effluents from sewage treatment plants,” Environ Prog Sustain Energy, vol. 34, no. 2, pp. 432–436, Mar. 2015. [CrossRef]
- C. Park et al., “Comparative assessment on the influences of effluents from conventional activated sludge and biological nutrient removal processes on algal bloom in receiving waters,” Environmental Engineering Research, vol. 21, no. 3, pp. 276–283, Sep. 2016. [CrossRef]
- G. I. Asibor, E. Oghenekohwiroro, and F. Adeniyi, “Impact of Biologically Treated Effluent on the Physico-chemical Quality of a Receiving Stream in Ile-Ife, Southwest Nigeria,” J Sustain Dev, vol. 8, no. 8, p. p213, Sep. 2015. [CrossRef]
- H. Oweira, I. Lahdou, V. Daniel, J. Schmidt, A. Mehrabi, and M. Sadeghi, “Association of Graft Effluent Parameters with Donor Body Mass Index, Graft Quality, and Post-Transplant Events,” Ann Transplant, vol. 23, pp. 136–143, Feb. 2018. [CrossRef]
- “DWA-A 131E - Dimensioning of Single-stage Activated Sludge Plants - June 2016 (translation May 2022) | PDF | A 131E PDF-16.” Accessed: May 26, 2025. [Online]. Available online: https://shop.dwa.de/DWA-A-131E-Dimensioning-of-Single-stage-Activated-Sludge-Plants-June-2016-translation-May-2022/A-131E-PDF-16.
- T. Koncsos, “Bioreactor Simulation with Quadratic Neural Network Model Approximations and Cost Optimization with Markov Decision Process,” Periodica Polytechnica Civil Engineering, vol. 64, no. 2, pp. 614–622, May 2020. [CrossRef]
- L. Rieger, G. Koch, M. Kühni, W. Gujer, and H. Siegrist, “The eawag bio-p module for activated sludge model no. 3,” Water Res, vol. 35, no. 16, pp. 3887–3903, Nov. 2001. [CrossRef]
- C. Fux, M. Boehler, P. Huber, I. Brunner, and H. Siegrist, “Biological treatment of ammonium-rich wastewater by partial nitritation and subsequent anaerobic ammonium oxidation (anammox) in a pilot plant,” J Biotechnol, vol. 99, no. 3, pp. 295–306, Nov. 2002. [CrossRef]
- M. Henze et al., “Activated Sludge Model No.2d, ASM2D,” Water Science and Technology, vol. 39, no. 1, pp. 165–182, Jan. 1999. [CrossRef]
- I. Takács, G. G. Patry, and D. Nolasco, “A dynamic model of the clarification-thickening process,” Water Res, vol. 25, no. 10, pp. 1263–1271, Oct. 1991. [CrossRef]
- E. Llorens, F. Thiery, S. Grieu, and M. Polit, “Evaluation of WWTP discharges into a Mediterranean river using KSOM neural networks and mass balance modelling,” Chemical Engineering Journal, vol. 142, no. 2, pp. 135–146, Aug. 2008. [CrossRef]
- R. Pretel, A. Robles, M. V. Ruano, A. Seco, and J. Ferrer, “Economic and environmental sustainability of submerged anaerobic MBR-based (AnMBR-based) technology as compared to aerobic-based technologies for moderate-/high-loaded urban wastewater treatment,” J Environ Manage, vol. 166, pp. 45–54, Jan. 2016. [CrossRef]
- D. G. Weissbrodt, C. Holliger, and E. Morgenroth, “Modeling hydraulic transport and anaerobic uptake by PAOs and GAOs during wastewater feeding in EBPR granular sludge reactors,” Biotechnol Bioeng, vol. 114, no. 8, pp. 1688–1702, Aug. 2017.
- H. Kim, O. Purev, K. Cho, N. Choi, J. Lee, and S. Yoon, “Removal of Inorganic Salts in Municipal Solid Waste Incineration Fly Ash Using a Washing Ejector and Its Application for CO2 Capture,” International Journal of Environmental Research and Public Health 2022, Vol. 19, Page 2306, vol. 19, no. 4, p. 2306, Feb. 2022. [CrossRef]
- M. A. A. Razali, Z. Ahmad, M. S. B. Ahmad, and A. Ariffin, “Treatment of pulp and paper mill wastewater with various molecular weight of polyDADMAC induced flocculation,” Chemical Engineering Journal, vol. 166, no. 2, pp. 529–535, Jan. 2011. [CrossRef]
- T. Bersinger, I. Le Hécho, G. Bareille, T. Pigot, and A. Lecomte, “Continuous monitoring of turbidity and conductivity in wastewater networks: An easy tool to assess the pollution load discharged into receiving water,” Revue des Sciences de l’Eau, vol. 28, no. 1, pp. 9–17, Aug. 2015. [CrossRef]
Figure 1.
Cities – Municipalities covered with WWTP – Cluster 0, represents the catchment zone of Prishtina capital city and Fushe Kosova as well and discharging directly to Pumping Station PS, C3-representing major part of Gracanica town, C4- Obilic trunk main, small north part of Prishtina C5- rural areas of Fushe Kosova town.
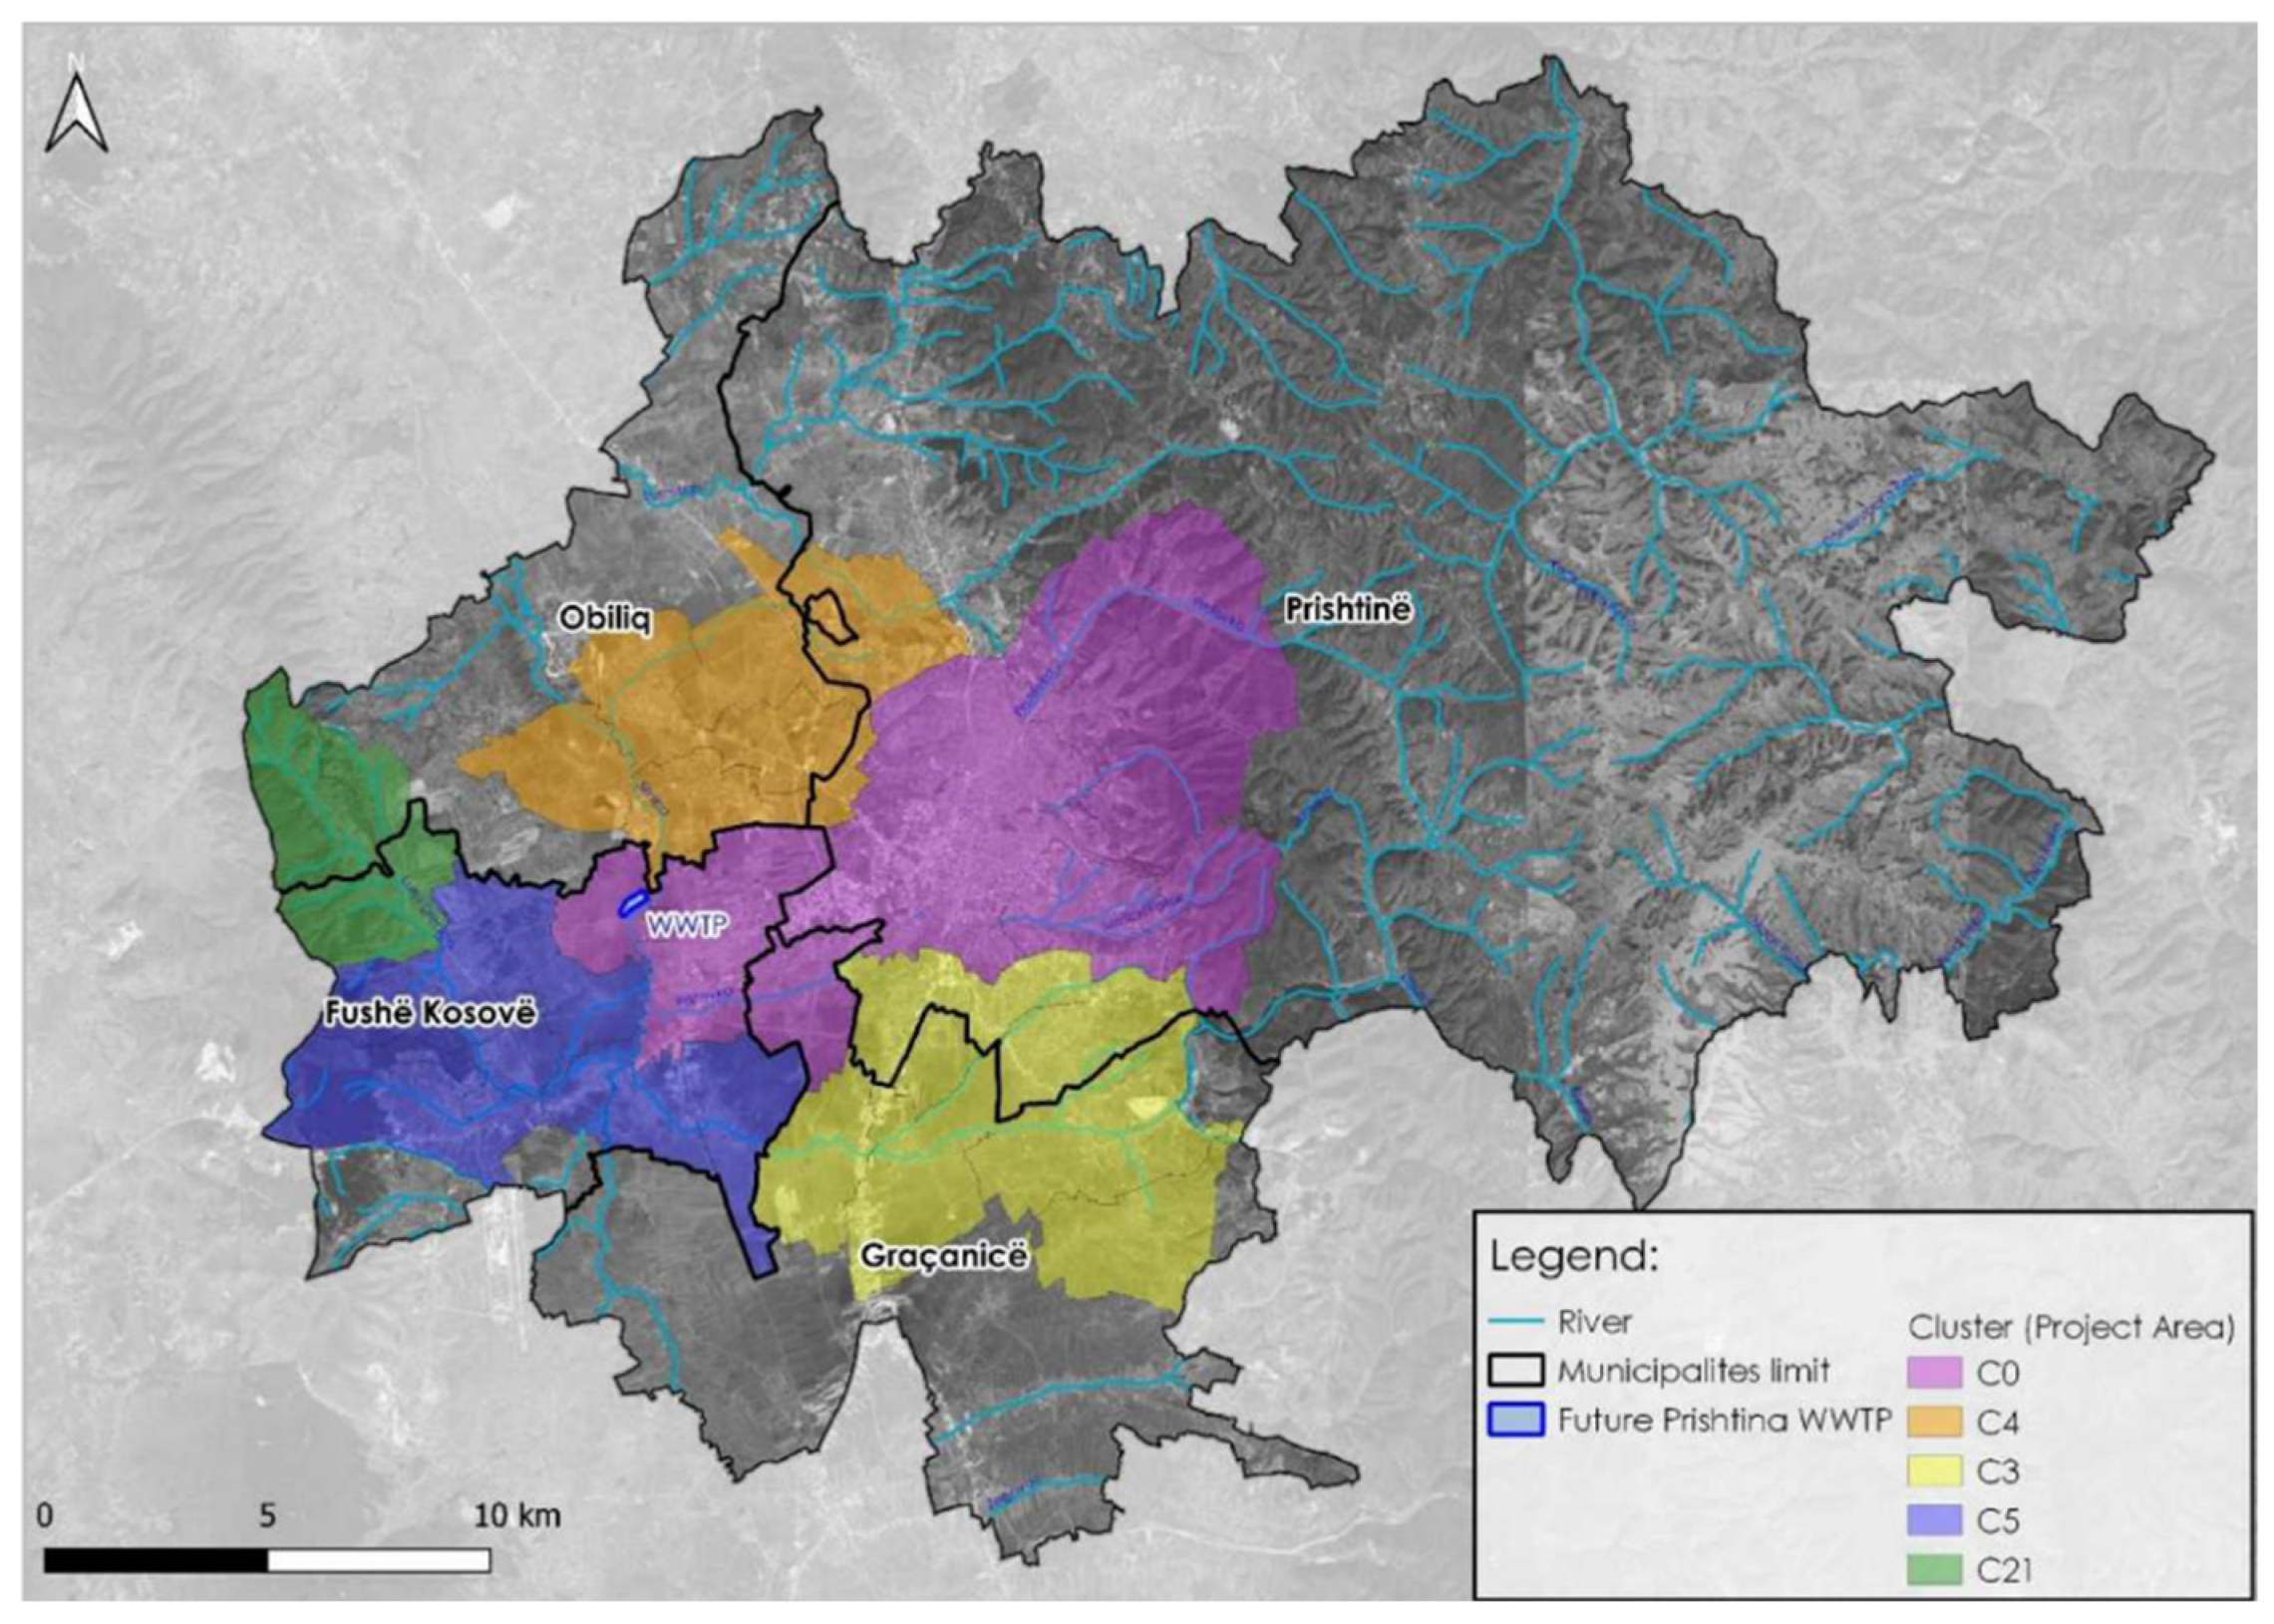
Figure 2.
Cities Schematic flow for future Prishtina WWTP, PS (Pumping Station). RT (Retention Tanks).
Figure 2.
Cities Schematic flow for future Prishtina WWTP, PS (Pumping Station). RT (Retention Tanks).
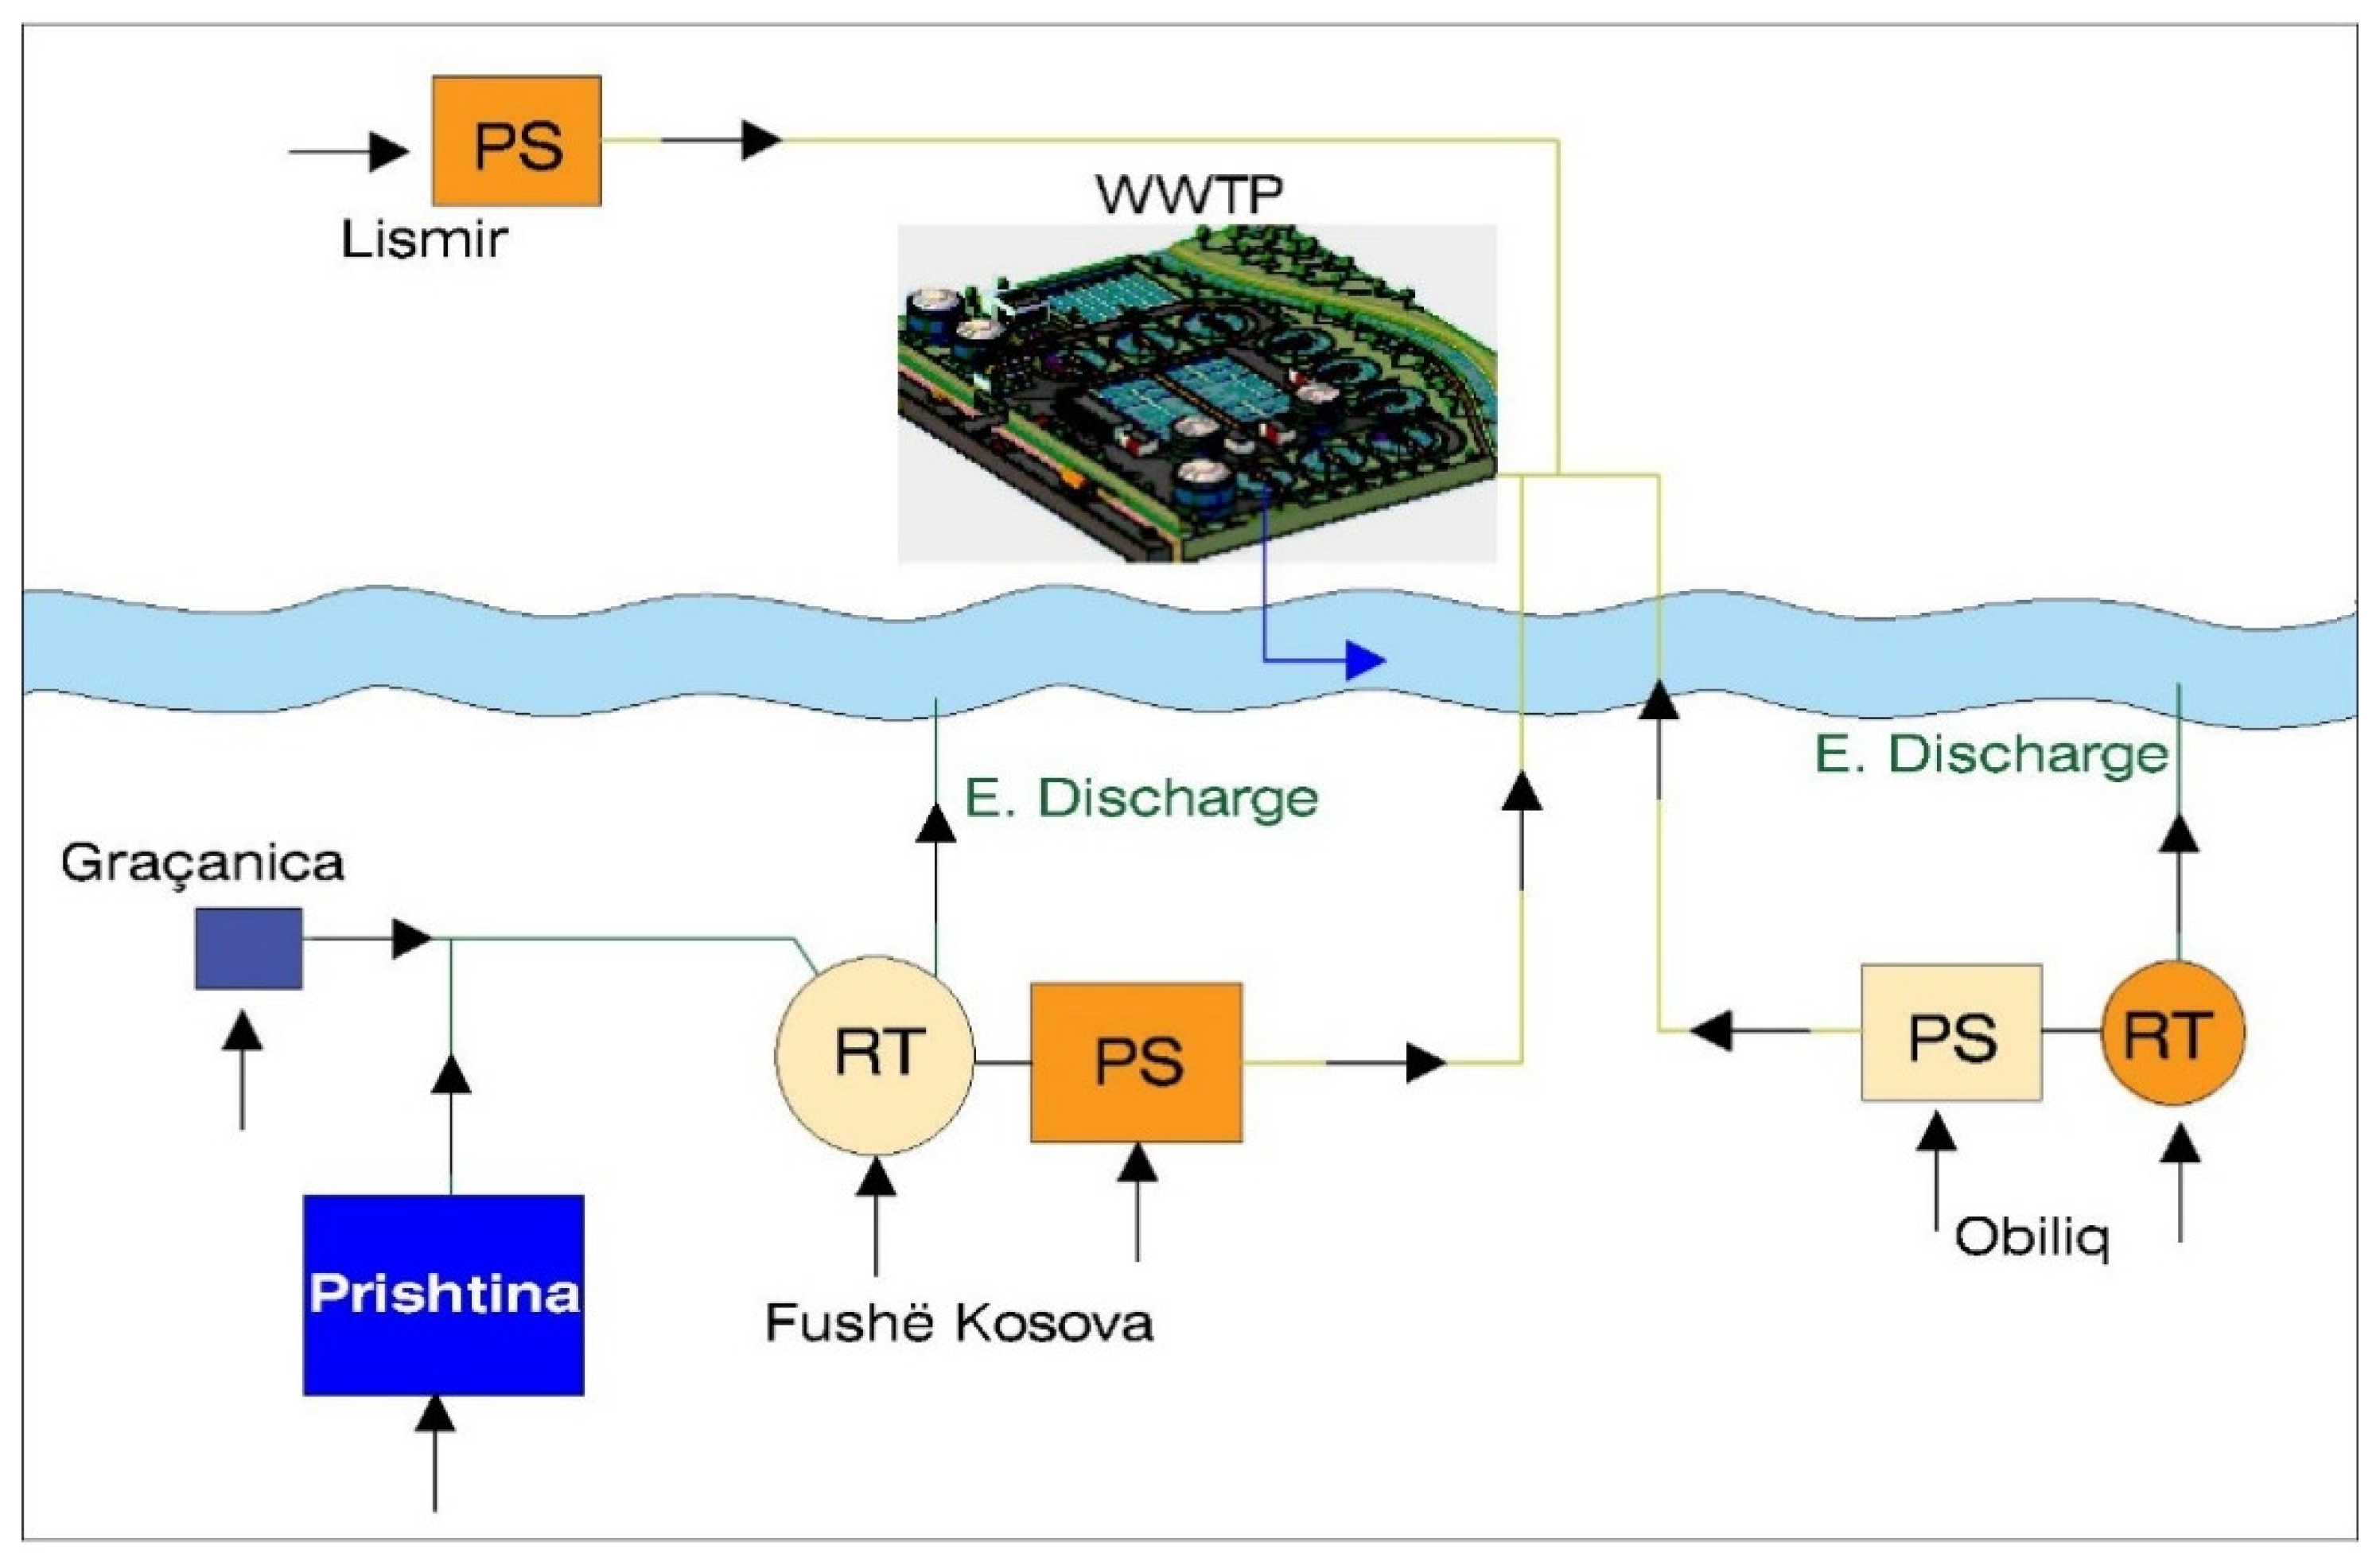
Table 1.
Specific daily pollutant loads.
| Parameter | Load [gr/cap·d] |
| COD | 120 |
| BOD₅ | 60 |
| SS | 70 |
| TN | 11 |
| TP | 2 |
Table 2.
Inflow data of proposed WWTP.
| Overview | Unit | 2025 | 2030 | 2035 | 2040 |
| Population (Septic Tank) | Nos. | 12.678 | 14.209 | 15.714 | 16.818 |
| Population Equivalent | PE | 306.07 | 352.306 | 441.039 | 479.879 |
| Dry Weather Flow | m³/d | 62.314 | 66.42 | 72.814 | 71.888 |
| Average Wet Weather Flow | 1000 m³/a | 48.355 | 50.732 | 56.535 | 52.518 |
| Total Sewerage BOD5 Load | kg/d | 18.328 | 21.096 | 26.414 | 28.74 |
| Total TSS Load | kg/d | 21.277 | 24.496 | 30.689 | 33.395 |
| Total TKN load | kg/d | 3.344 | 3.849 | 4.823 | 5.248 |
| Total TP load | kg/d | 608 | 700 | 877 | 954 |
Table 6.
Compared results between 2 trials, fully CAS and the second on CAS including Pre-DN.
| Feature / Parameter | 4 CAS Reactors (Aerobic) | 3 CAS + 1 Anoxic (Pre-DN) |
| Total Volume | ~64,500 m³ | Slightly less (~60,000 m³ est.) |
| N Removal Capability | Nitrification only | Nitrification + Denitrification |
| Oxygen Demand | High (~59,000 kg/d) | Lower (due to denitrification) |
| Sludge Yield | ~11,350 kgSS/d | ~10,000–14,000 kgSS/d range |
| Energy Use | Higher (all aerobic) | Lower (partial anoxic zones) |
| TN Compliance | Uncertain (borderline) | Achieved (TN ≤10 mg/L) |
| Flexibility (expansion) | Less (requires add-ons) | Higher (bio-P, alternate aeration) |
| Winter Effluent TN | >10–15 mg/L (risk) | ~15 mg/L max (can optimize) |
| Effluent P Removal | Chemical only | Bio-P + chemical (future-ready) |
Disclaimer/Publisher’s Note: The statements, opinions and data contained in all publications are solely those of the individual author(s) and contributor(s) and not of MDPI and/or the editor(s). MDPI and/or the editor(s) disclaim responsibility for any injury to people or property resulting from any ideas, methods, instructions or products referred to in the content. |
© 2025 by the authors. Licensee MDPI, Basel, Switzerland. This article is an open access article distributed under the terms and conditions of the Creative Commons Attribution (CC BY) license (http://creativecommons.org/licenses/by/4.0/).
Copyright: This open access article is published under a Creative Commons CC BY 4.0 license, which permit the free download, distribution, and reuse, provided that the author and preprint are cited in any reuse.


