
Submitted:
03 June 2025
Posted:
03 June 2025
You are already at the latest version
Abstract
The galaxy NGC 7469 is a bright infrared source with an active galactic nucleus (AGN) and an intense star-forming region with a radius of approximately 500 parsecs, where the star formation rate is estimated to be 20–50 M⊙yr−1. This study presents the results of spectral and photometric observations carried out during the period from 2020 to 2024 at the Fesenkov Astrophysical Institute (Almaty, Kazakhstan) and the Nasreddin Tusi Shamakhy Astrophysical Observatory (Shamakhy, Azerbaijan). Photometric data were obtained using B, V, and Rc filters, while spectroscopic observations covered the wavelength range of λ 4000–7000 Å. Data reduction was performed using the IRAF and MaxIm DL Pro6 software packages. An analysis of the light curves revealed that after the 2019–2020 outburst, the luminosity level of NGC 7469 remained relatively stable until the end of 2024. In November–December 2024, an increase in brightness (∼0.3--0.5 magnitudes) was recorded. Spectral data shows variations of the Ha fluxes and an enhancement of them in the end of 2024. On BPT diagrams, the emission line flux ratios [OIII]/H β and [NII]/H α place NGC 7469 on the boundary between regions dominated by different ionization sources: AGN and star-forming regions. The electron density of the gas, estimated from the intensity ratios of the [SII] 6717, 6731 Å lines, is about 800--900cm−3. Continued observations will help to determine whether the trend of increasing brightness and emission line fluxes recorded at the end of 2024 will persist.
Keywords:
Seyfert galaxy
; spectral observations
; photometric observations
; light curves
; emission lines
; broad emission components
1. Introduction
Active galactic nuclei (AGN) emit energy due to the accretion of matter onto supermassive black holes (SMBHs) located at their centers. It is widely accepted that the primary source consists of an optically thick, geometrically thin accretion disk (peaking in the optical/UV range) and a hot region known as the corona in the innermost part of the system, which emits X-rays [1]. The central region is surrounded by two zones: the Broad-Line Region (BLR), which is located closer to the nucleus and is responsible for the formation of broad emission lines, and the Narrow-Line Region (NLR), which extends up to several kiloparsecs and contains gas of lower density [2]. According to the unified model of AGN, the main differences between Seyfert galaxies of types Sy1 and Sy2 are explained by different viewing angles with respect to the observer. Other factors, such as the accretion rate and the influence of the host galaxy, also play a role [3]. The relationship between optical and X-ray spectra, as well as the similarities and differences in the spectral properties of various types of Seyfert galaxies, are discussed in [4,5,6].
The multi-wavelength campaign [7] dedicated to the study of NGC 7469 focuses on the physical structure of the active galactic nucleus (AGN) wind using high–resolution X–ray spectroscopy with Chandra HETGS and photoionization modeling. The authors concluded that variations in the ionizing continuum lead to changes in the ionization state of the wind components [7]. The existence of changing-look active galactic nuclei (CL AGN) is confirmed by the appearance and disappearance of broad emission lines over time intervals of 100–5000 days, which are shorter than those predicted by traditional accretion disk models. The term CL AGN was initially introduced to describe systems that change their spectra from weakly or non-absorbed to heavily absorbed or Compton-thick states [8]. However, in recent years, this term has been widely used to describe changes in optical spectra, particularly variations in the width of emission lines during transitions from type 1 to type 2 (or 1.8, 1.9) and vice versa [9,10]. Such changes impose strict constraints on the physics of the outer accretion disk, the BLR, and the coronal region.
The Seyfert galaxy NGC 7469, located at coordinates , is classified as a type Sy . It exhibits high luminosity in the infrared wavelength range. The central source is surrounded by a star–forming region with a radius of about 500 parsecs and a star formation rate of 20–50 [11,12,13]. The spectral and photometric variability of NGC 7469 has been studied by many authors. In particular, light curves over different time intervals are presented in [14,15,16,17,18]. Observations of NGC 7469 conducted in 2016–2019 with the telescope of the Shamakhy Observatory recorded three flares in the B, V, and filters [19]. Results of spectral studies in the optical range are reported in [20,21,22,23]. The time lag between the response of optical emission lines and changes in and UV radiation allows for an estimation of the size of the BLR region. This parameter has been repeatedly determined by various authors [1,24,25,26,27]. In [1], the authors, during a four–month monitoring campaign, observed variations in the time lag depending on the wavelength and time. One of the reasons for these changes is the varying contribution of short–wavelength emission sources at different epochs–for instance, the involvement or enhancement of emission from the hot corona or the star–forming region. The interaction between the galactic nucleus and the star–forming zone is discussed in [28]. High-angular-resolution imaging and infrared observations showed that the nucleus has minimal influence on the star–forming region. Studies using the VLT/MUSE integral field spectrograph revealed the presence of two types of outflows in the circumnuclear region: a slow one intersecting the star–forming ring and a faster one detected in the [O III] line, likely driven by AGN activity [29]. Recent observations with the James Webb Space Telescope (JWST) identified 36 new star–forming regions in the center of NGC 7469, confirming ongoing star formation activity [30].
This paper presents the results of spectral and photometric observations of NGC 7469 carried out at the Fesenkov Astrophysical Institute (Almaty, Kazakhstan) and the Nasreddin Tusi Shamakhy Astrophysical Observatory (Shamakhy, Azerbaijan).
2. Observations and Data Reduction
The primary spectral observations of NGC 7469 were carried out using the AZT telescope . A diffraction spectrograph equipped with an STT-3200 CCD camera (2184 × 1472) was used. The width of the entrance slit was . The spectral resolution was approximately . For flux calibration, spectra of standard stars with known energy distributions were obtained immediately before or after the object spectrum. The observational data were processed using IRAF [31] software packages, with the application of DARK and FLAT calibration frames. A He–Ne–Ar lamp spectrum was used for wavelength calibration. All results were corrected for atmospheric extinction and redshift. Several spectra of NGC 7469 were also obtained with the -meter AZT-20 telescope at the Fesenkov Astrophysical Institute. Its innovative spectrograph is equipped with volume phase holographic gratings and an EMCCD camera. Additional spectral observations of the galaxy were conducted using the meter telescope at the Shamakhi Astrophysical Observatory.
Since 2016, photometric observations in the optical wavelength range have been conducted at the Tian Shan Astronomical Observatory (TShAO) of the Fesenkov Institute. The meter Carl Zeiss telescope equipped with an Alta F16M CCD camera (4096 × 4096 pixels, 9 ), and a set of BVRc filters has been used. The field of view (FOV) is , with a scale of /pixel. Field stars with known BVRc magnitudes were used as standards for differential photometry (Table 1). Image processing was performed using Dark and Flat frames. The galaxy’s brightness was measured using a aperture and the method of differential photometry with the MaximDL Pro6 [32] software package. To convert instrumental magnitudes to the standard BVRc photometric system, appropriate transformation equations were applied [18].
3. Results of Photometric and Spectral Studies
The results of our photometric observations from 2020 to 2024 are presented in Table 2. The light curve of the galaxy NGC 7469 for the period 2013–2024, based on our data, is shown in Figure 1.
Since 2017, a gradual brightening has been noted, with a significant increase by the end of 2019. A high brightness level persisted until the end of 2020 [22]. Subsequently, the galaxy’s brightness remained stable at a relatively low level until October 2024. An increase of approximately magnitudes occurred during the last two months of the previous year (Figure 1).
Based on the plot shown in Figure 2, it can be concluded that NGC 7469 exhibits a "bluer-when-brighter" (BWB) trend. That is, as the brightness of the object increases (i.e., V magnitude decreases), the color indices decrease, indicating a shift toward the blue end of the spectrum.
Figure 3 zero LAG values obtained from cross–correlation analysis between the B, V, and filters confirm the synchronous brightness variations at different wavelengths. However, the low cadence of observations significantly reduces the accuracy of our estimates.
Spectral observations of the galaxy NGC 7469 were carried out using several telescopes. Figure 4 and 5 show examples of spectra obtained with different instruments. These spectra cover various wavelength ranges and have different resolutions. Data reduction was performed using a unified methodology with the IRAF [31] software package.
Figure 4.
Spectrum of NGC 7469, in the spectral range from Å to Å , obtained at the 2–m telescope (Shamakhy, Azerbaijan).
Figure 4.
Spectrum of NGC 7469, in the spectral range from Å to Å , obtained at the 2–m telescope (Shamakhy, Azerbaijan).
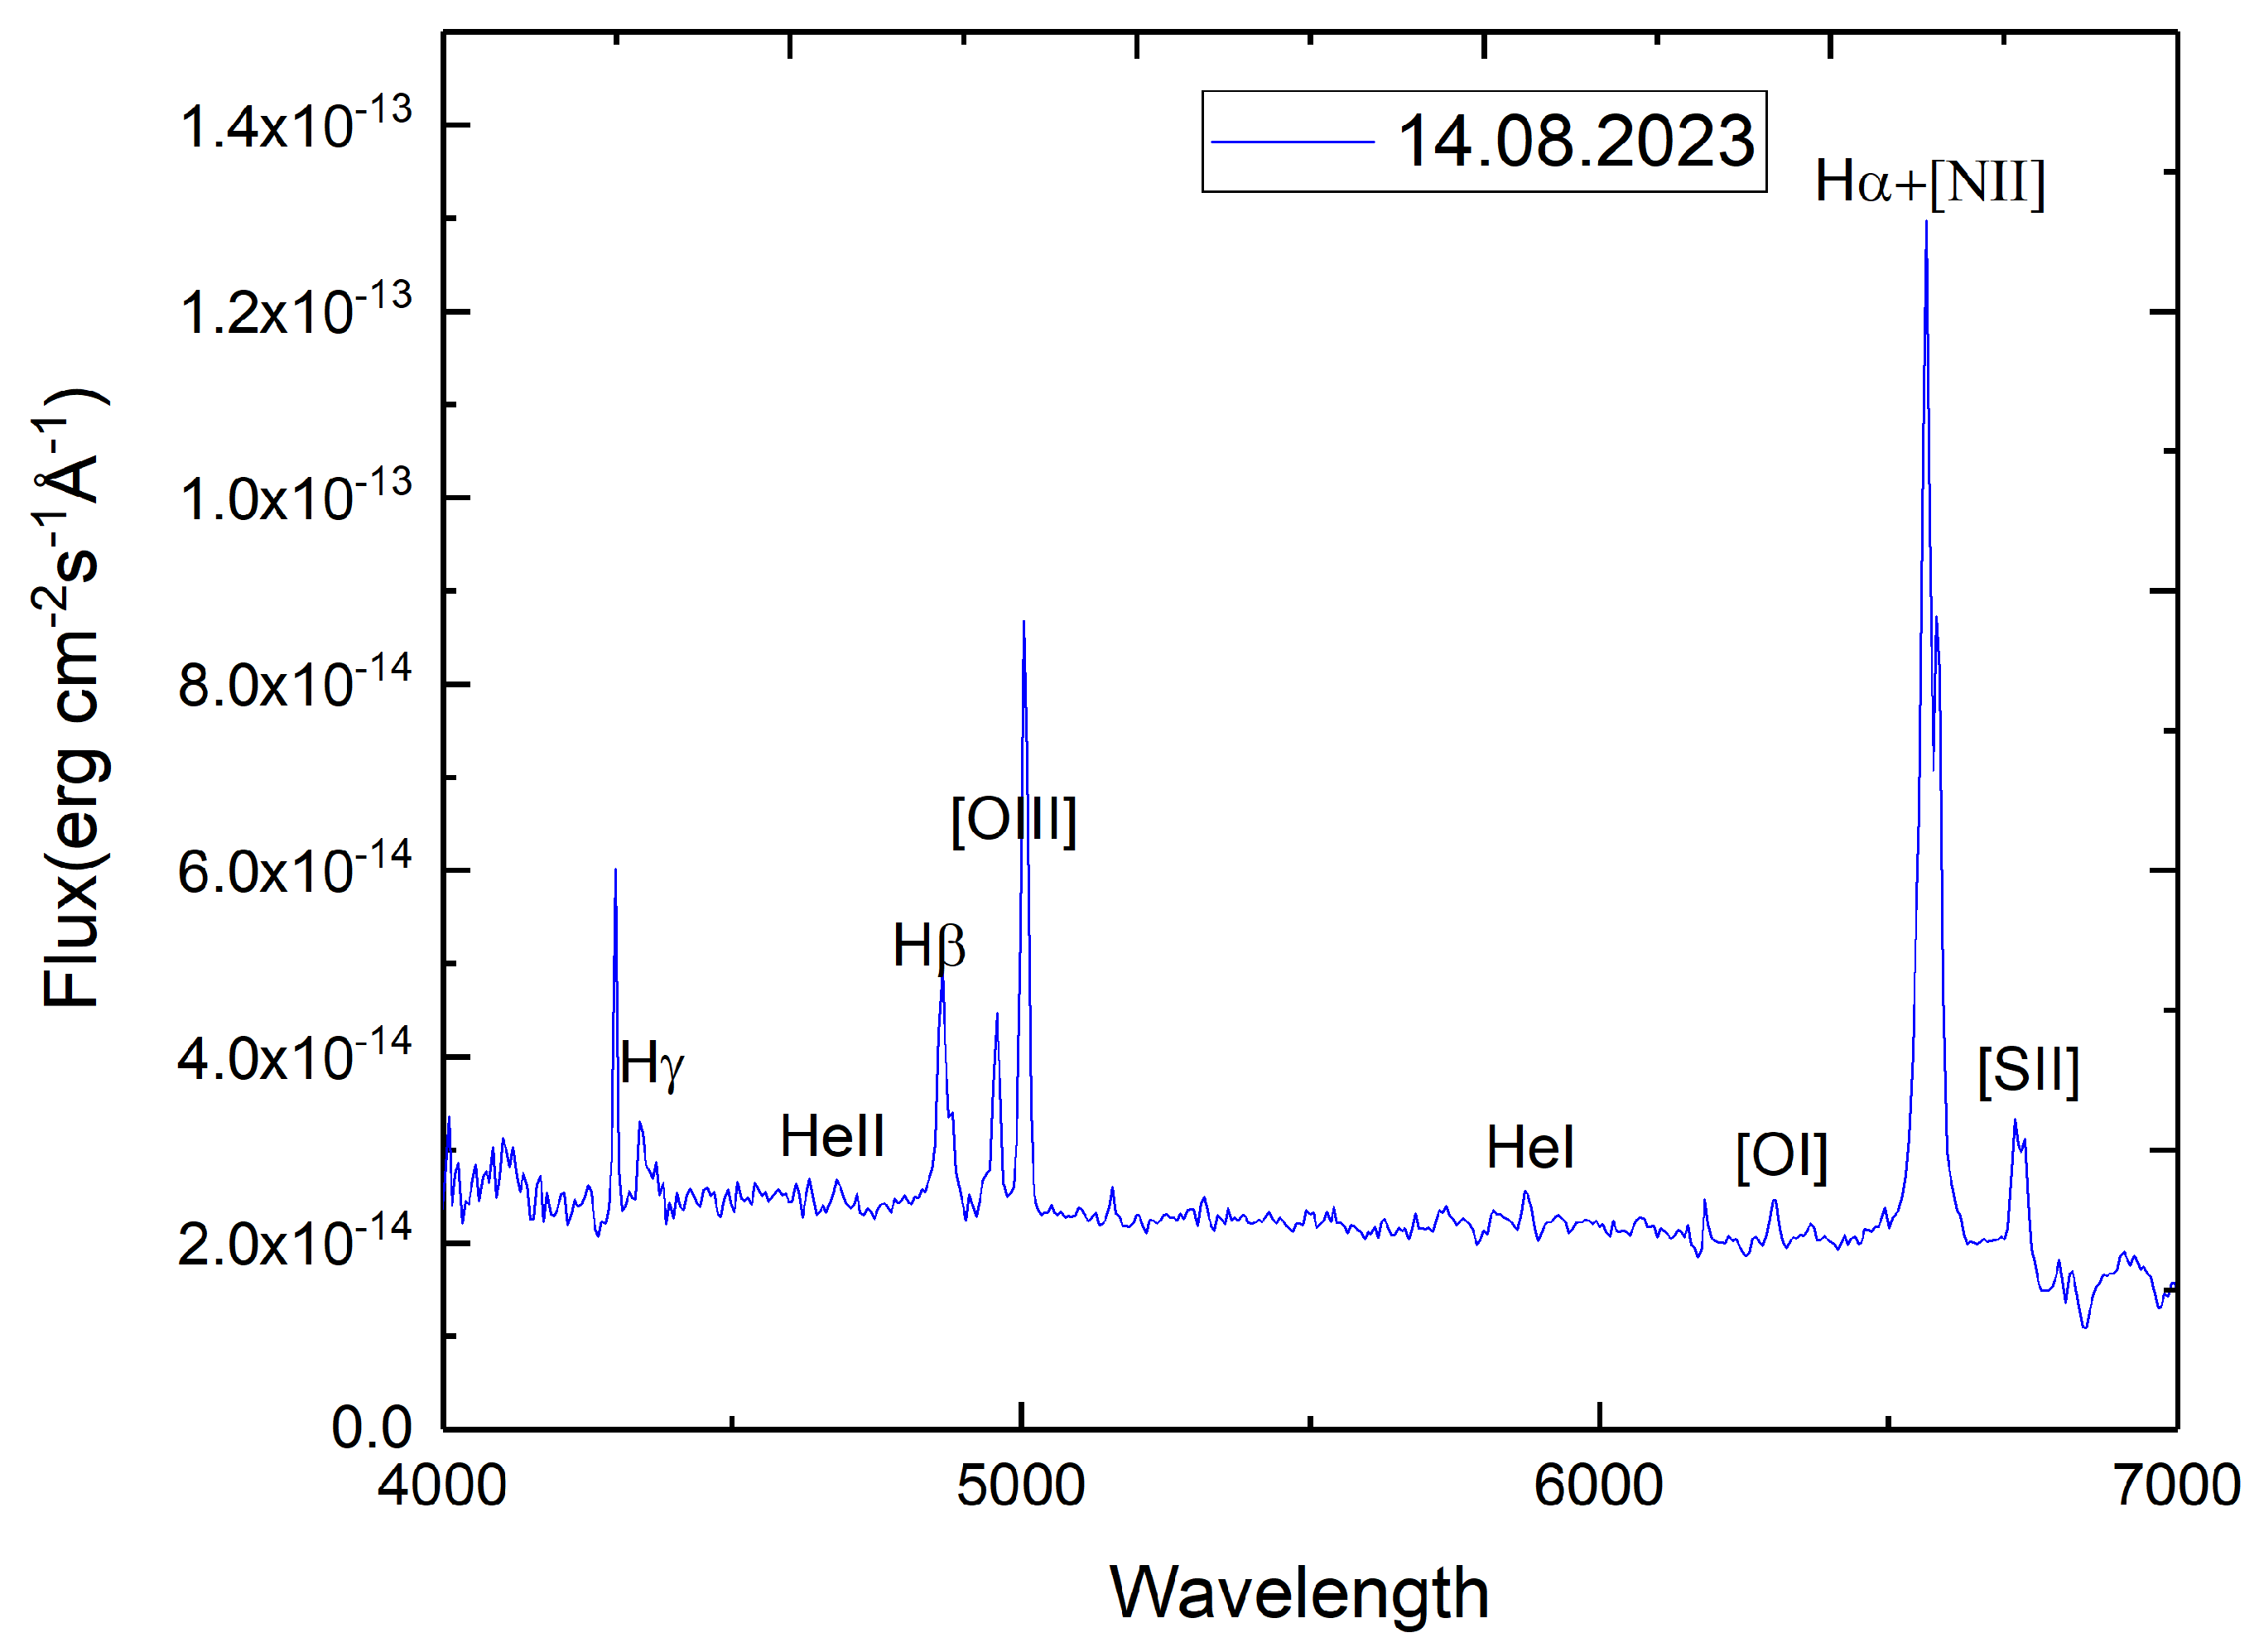
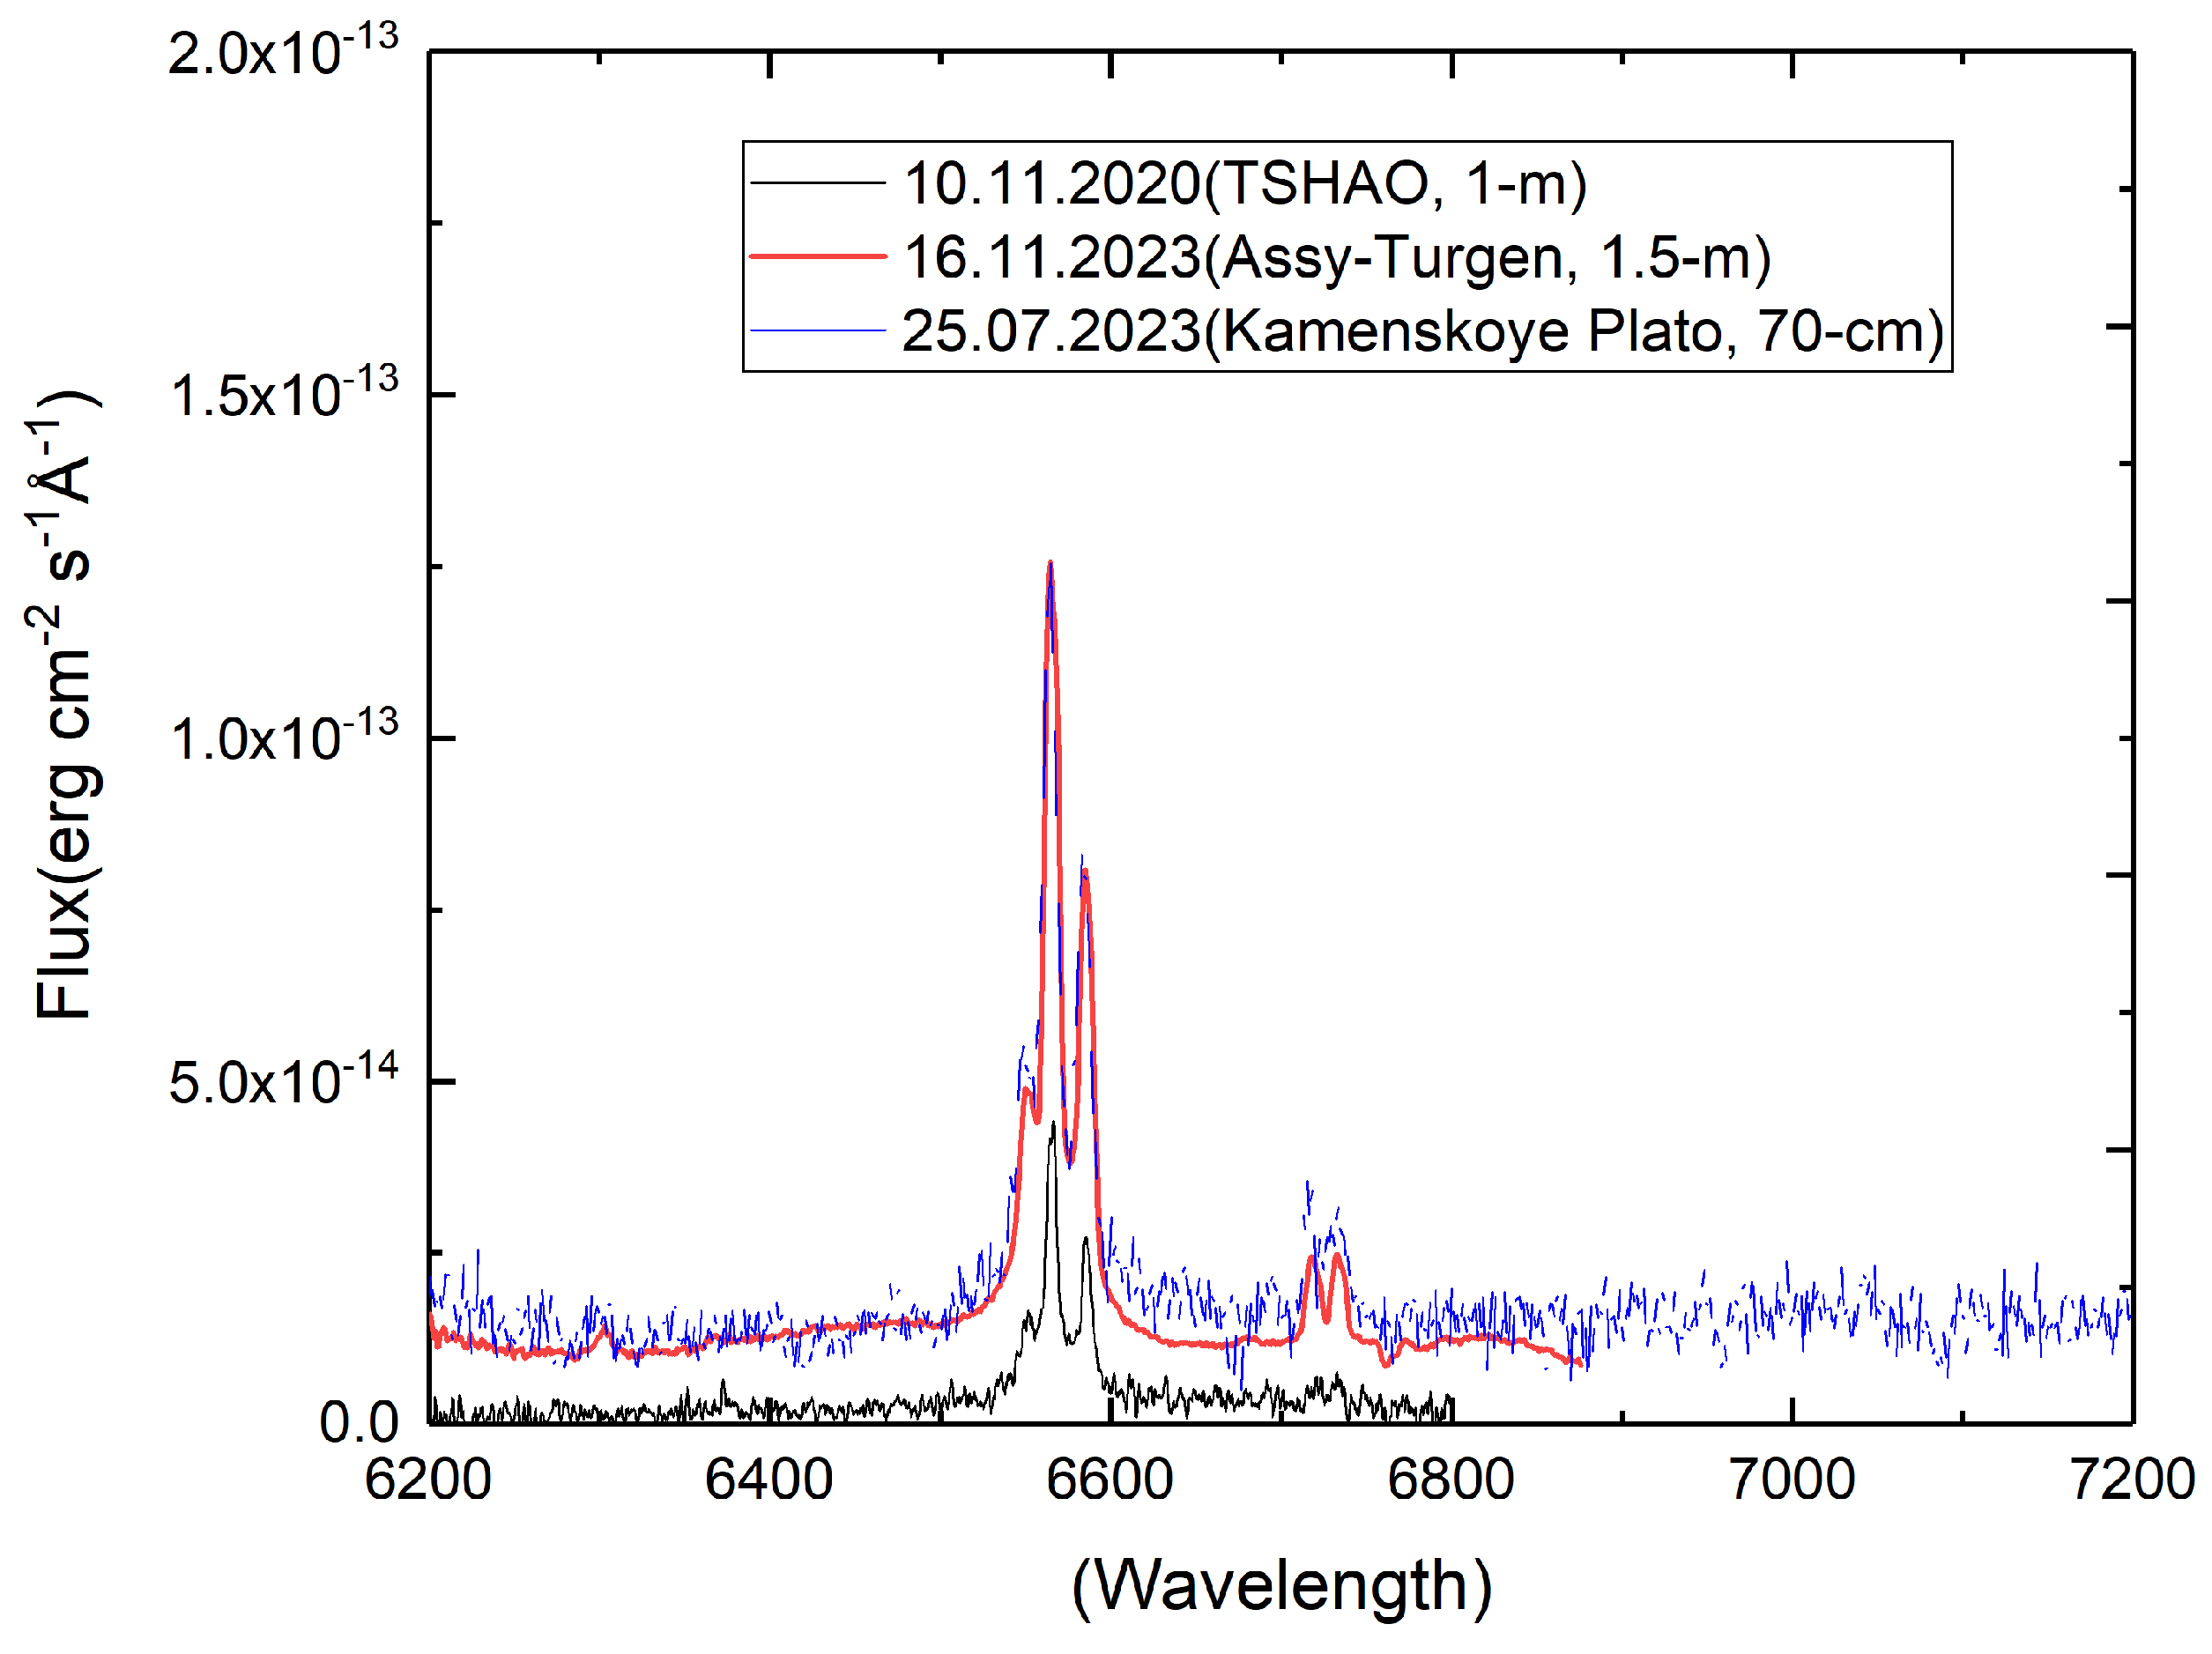
Figure 5.
Spectra of NGC 7469 in the spectral range from Å to Å , obtained at the –m, 70 cm and 1–m telescopes of FAI.
Figure 5.
Spectra of NGC 7469 in the spectral range from Å to Å , obtained at the –m, 70 cm and 1–m telescopes of FAI.
During the processing of the spectral observations, fluxes in the emission lines and the spectrum were obtained.
Figure 6 shows a trend of gradual increase of fluxes in H emission line, that the observed flux variations are driven by variations in the broad components of the emission lines. In the spectrum on November 16, 2023, the [S II] emission lines at 6717 and 6731 Å are well resolved. The electron density, estimated from the intensity ratio of these lines, is 800–900 cm−3.
Figure 6.
Variations in the emission line fluxes of H and H. The X–axis shows Date−2,400,000, and the Y-axis shows absolute fluxes H and H.he H fluxes are shown. The data from Lu et al.[25] are marked with blue asterisks.
Figure 6.
Variations in the emission line fluxes of H and H. The X–axis shows Date−2,400,000, and the Y-axis shows absolute fluxes H and H.he H fluxes are shown. The data from Lu et al.[25] are marked with blue asterisks.
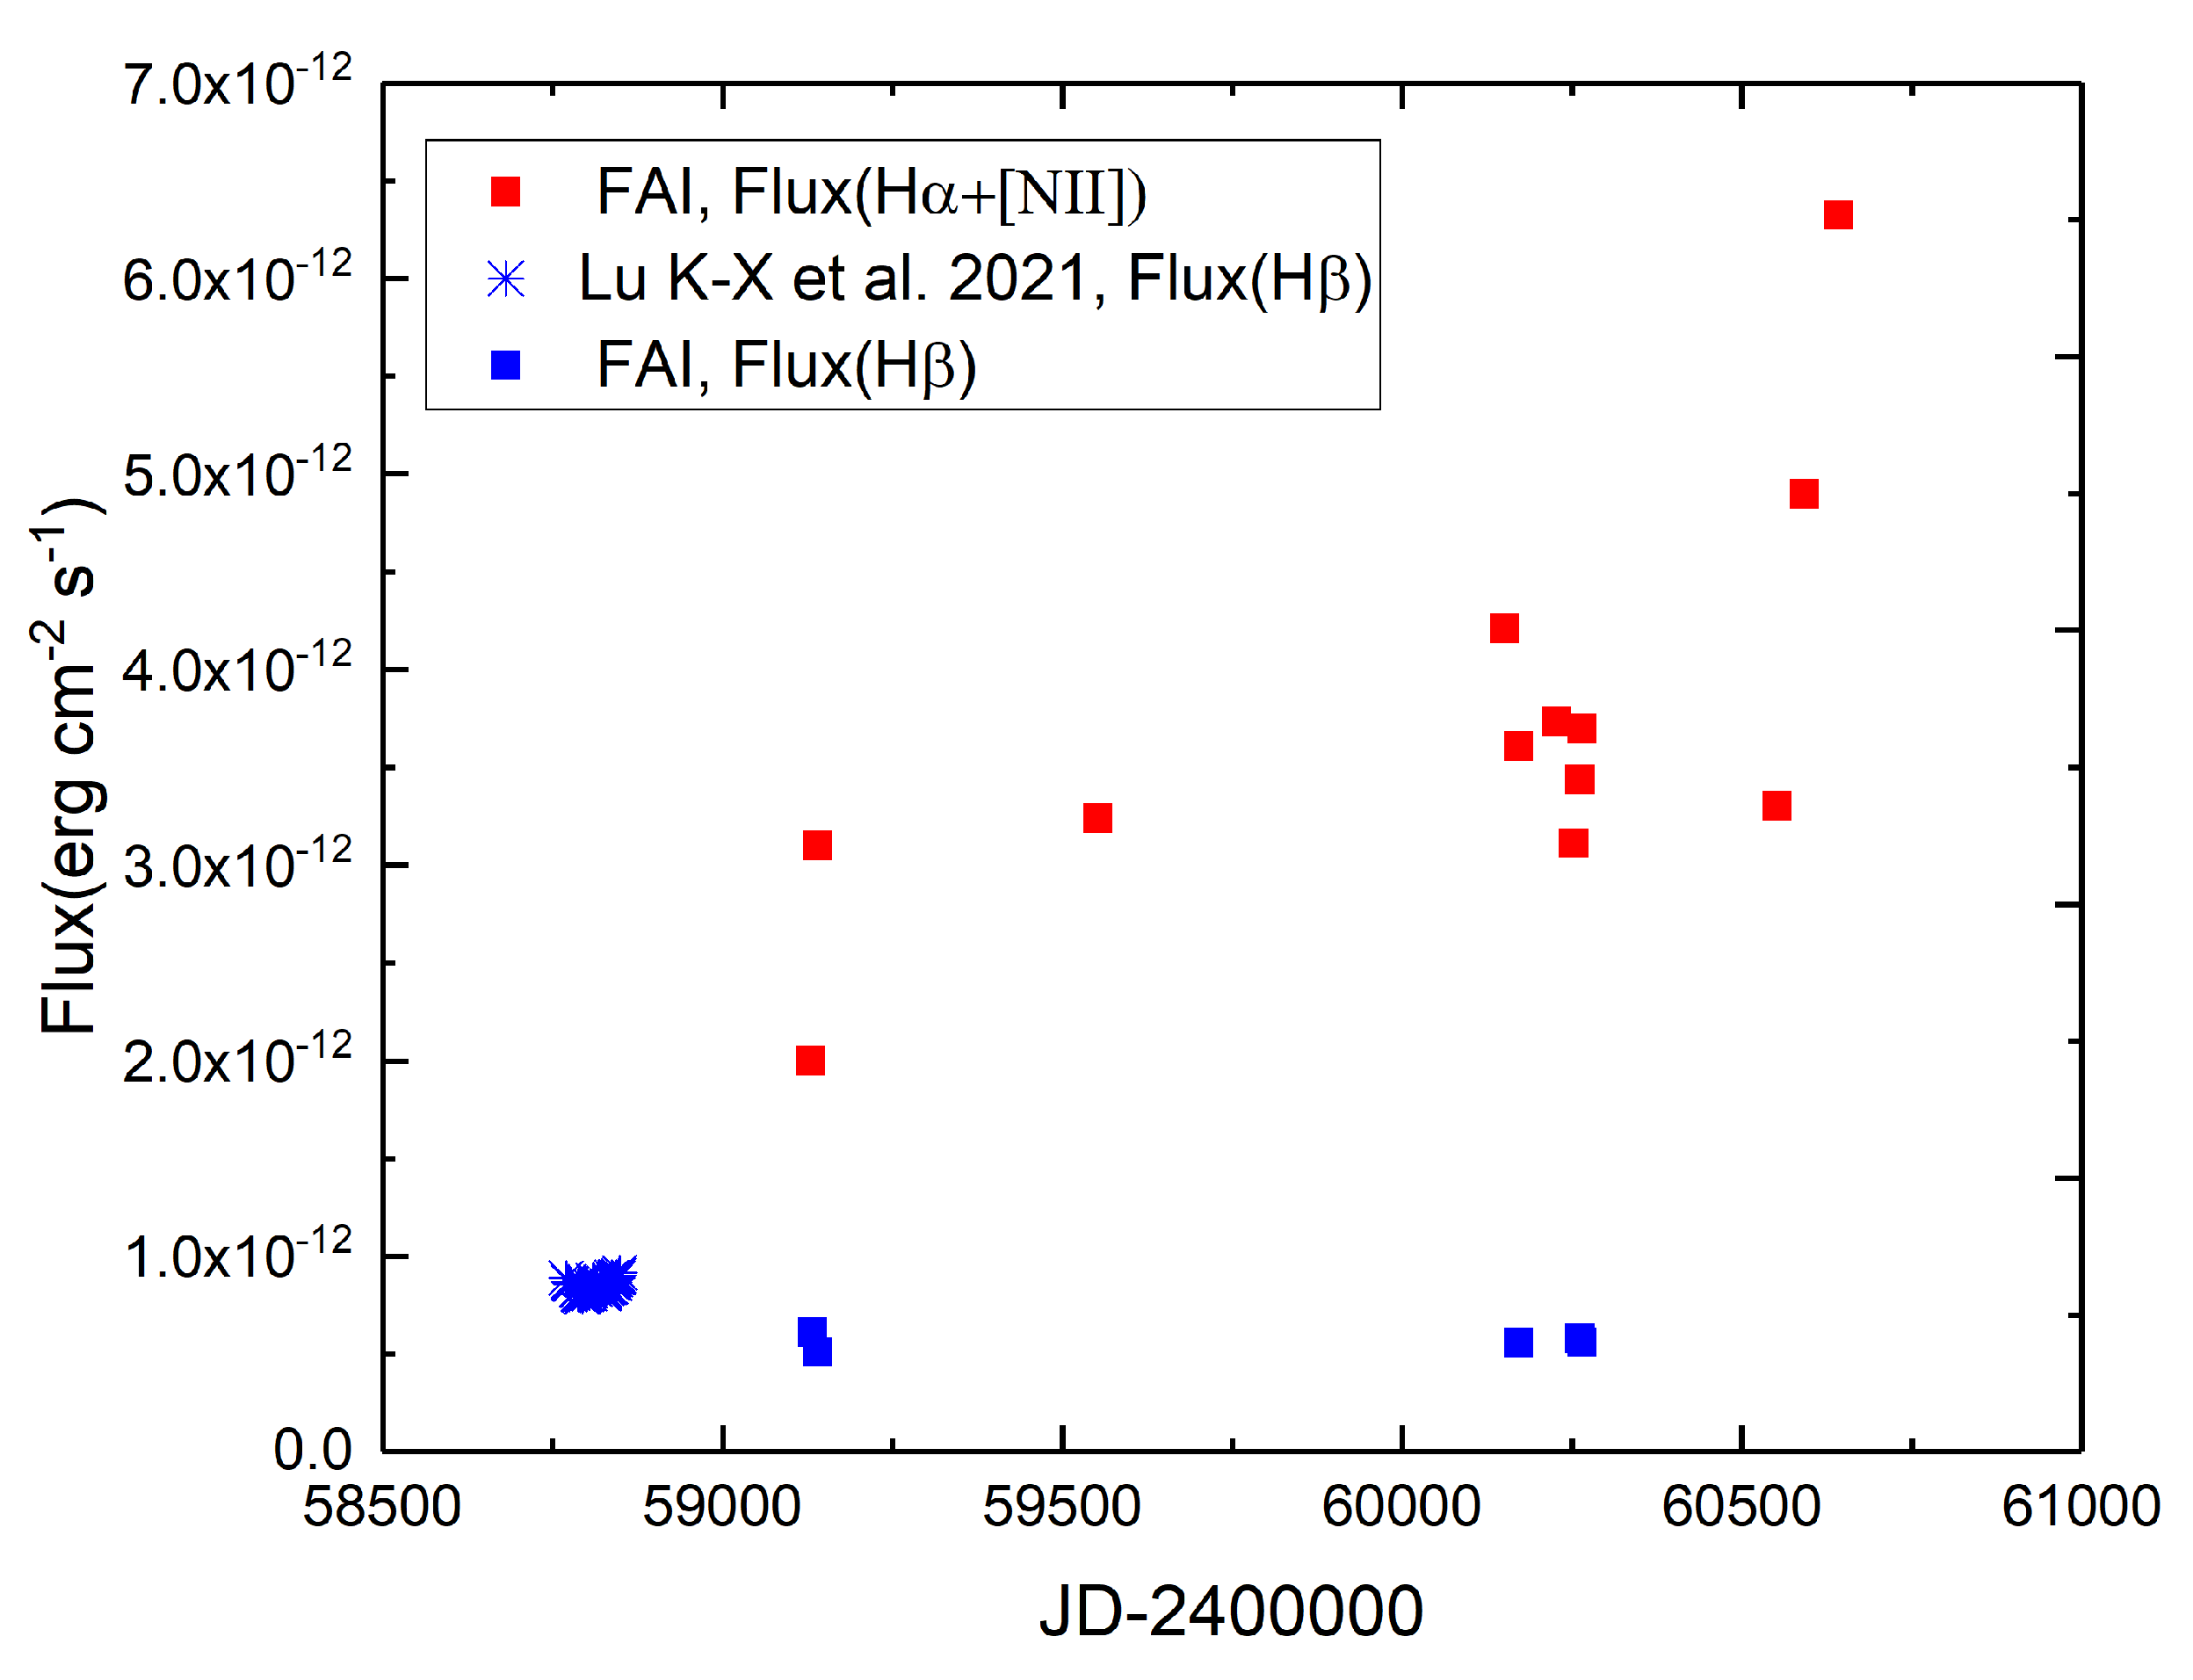
Figure 7.
The spectral energy distribution (SED) of NGC 7469 on different observation dates. The X-axis represents , and the Y-axis represents .
Figure 7.
The spectral energy distribution (SED) of NGC 7469 on different observation dates. The X-axis represents , and the Y-axis represents .
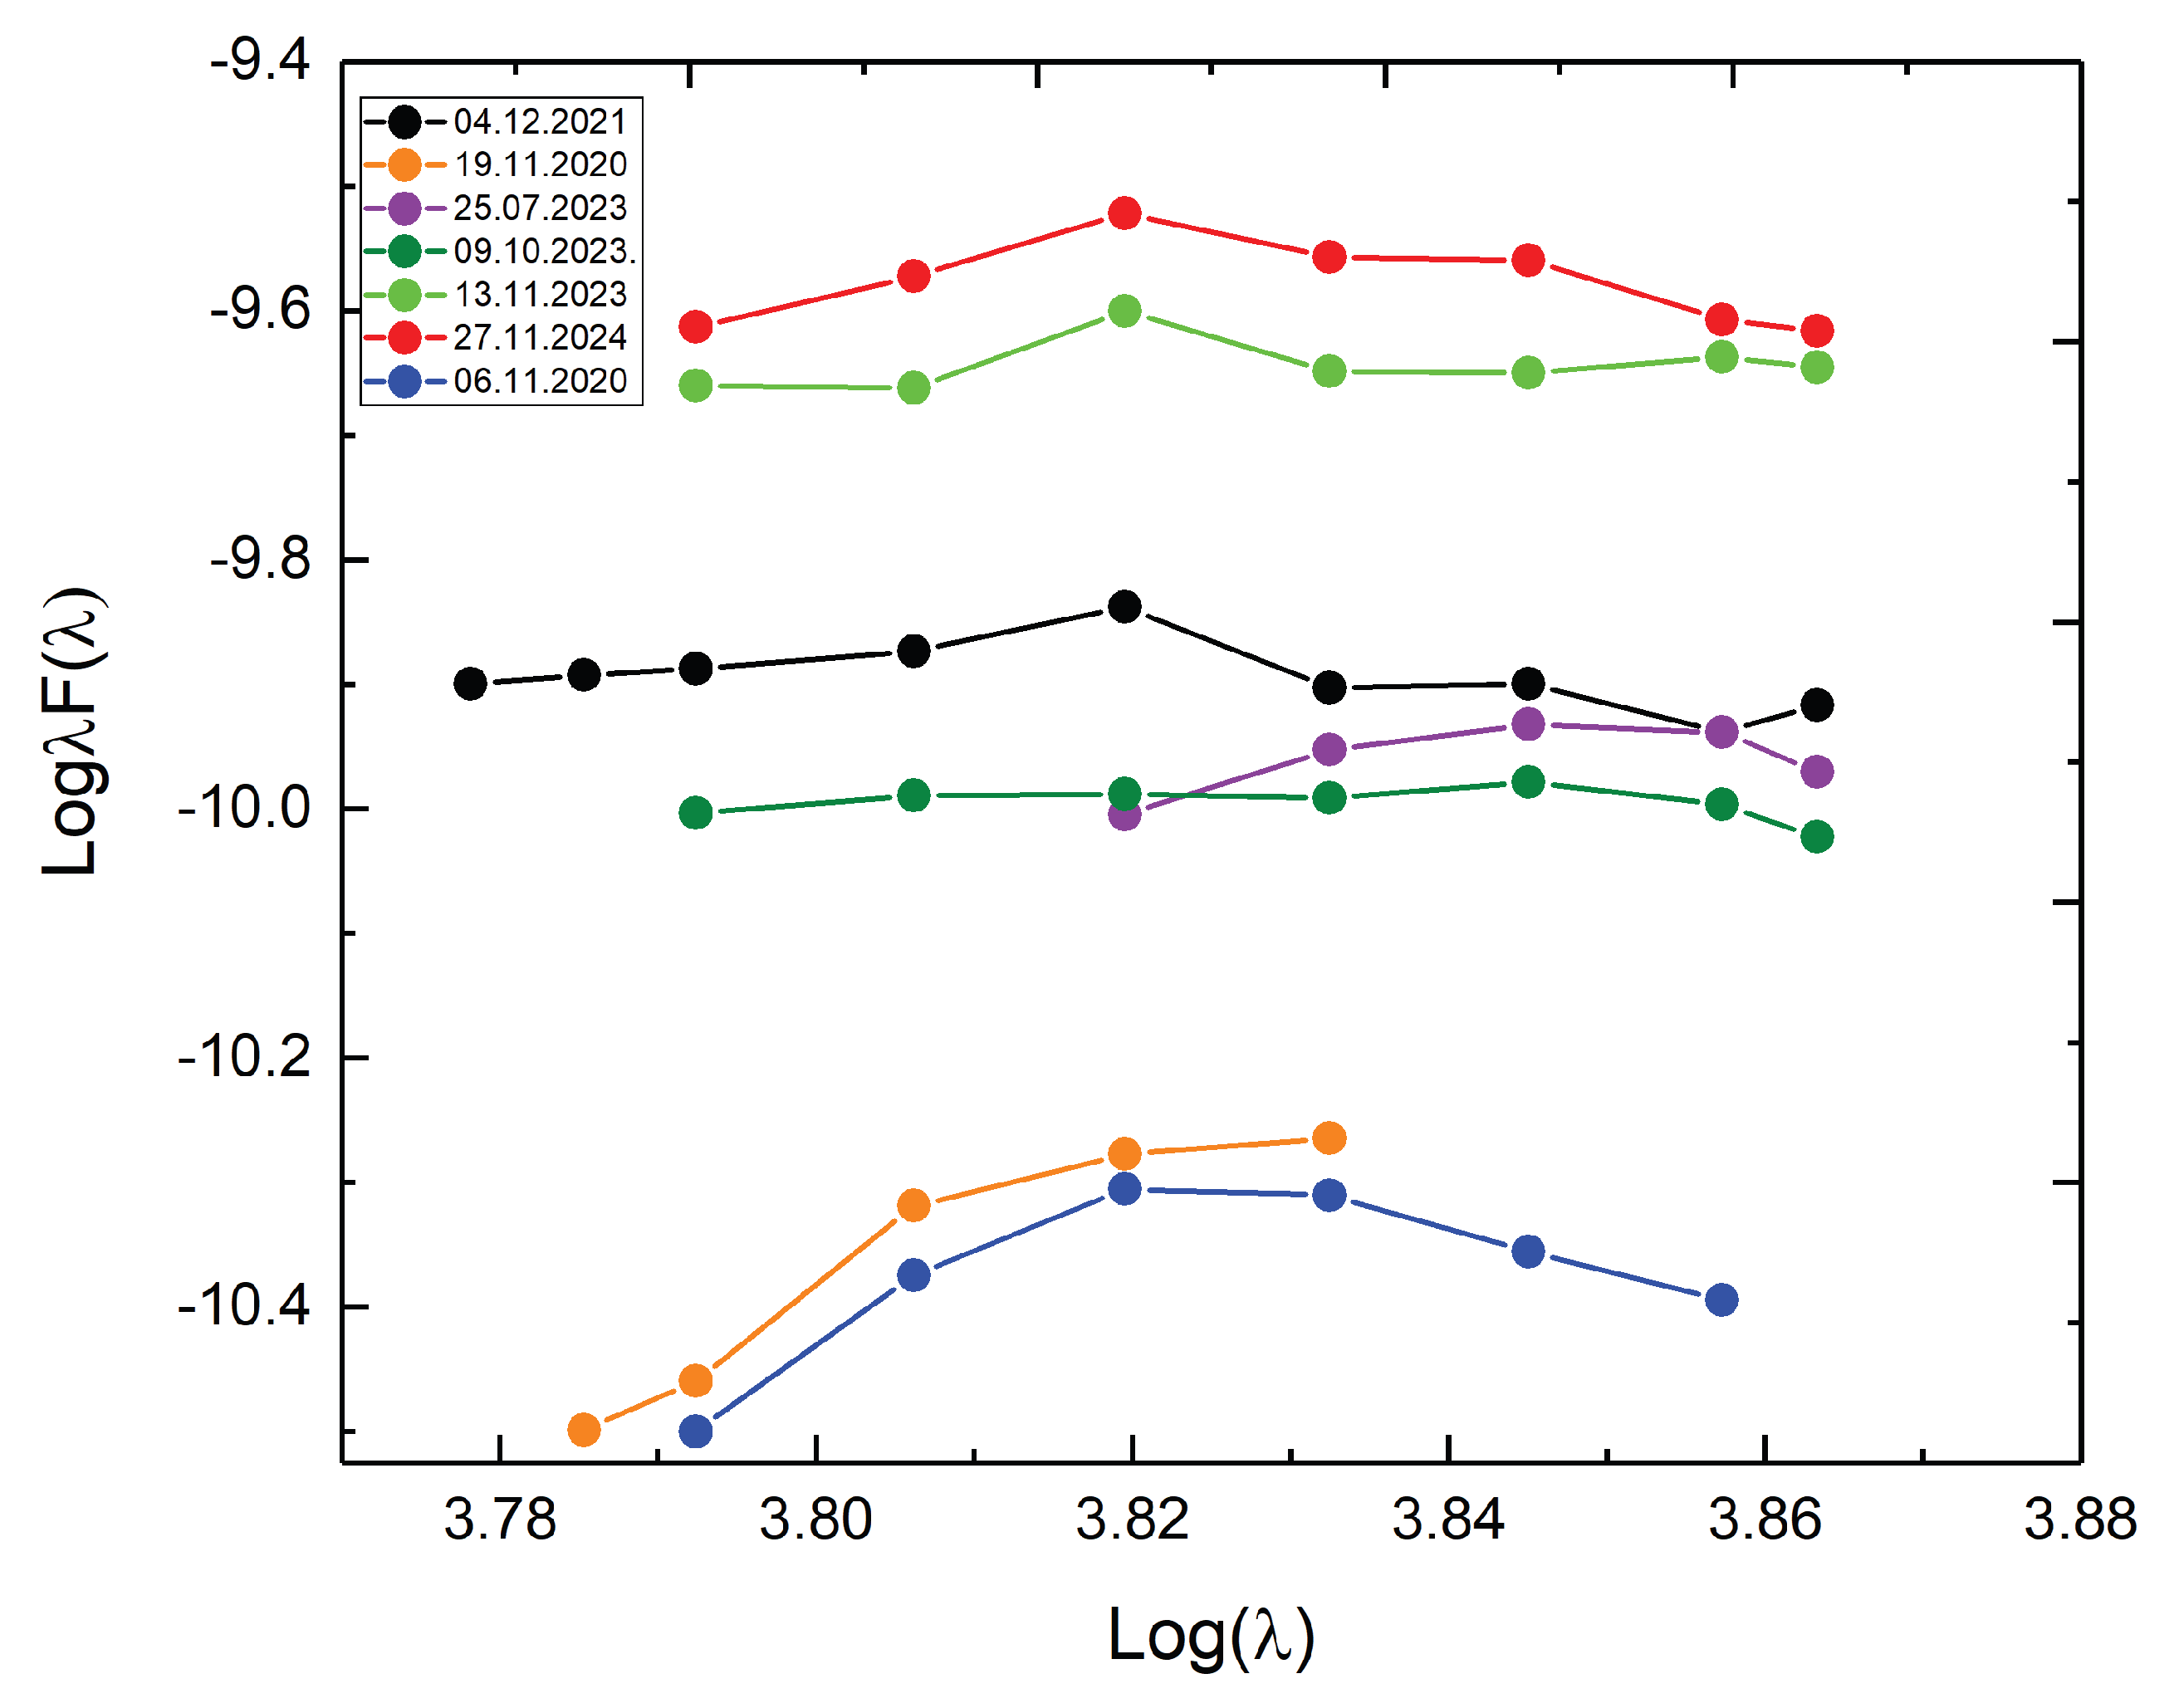
The low continuum level at the end of 2020 corresponds to the photometric measurements and indicates a decline in AGN activity following a flash. Subsequently, in 2022–2023, an increase in the continuum is observed. Finally, during late 2023–2024, the rise in brightness and continuum level, along with the increase in emission line fluxes, may indicate the onset of a new active phase. The galaxy NGC 7469 has a complex circumnuclear structure. The central source is surrounded by a ring–like star–forming region with a radius of about 500 parsecs. One of the challenges associated with such objects is identifying the dominant source of ionizing photons. In addition to the central source, the accretion disk, hot corona, and star–forming region can also contribute to ionization. The BPT diagram is used to identify the main sources of ionization and to investigate the relationship between AGN ionizing radiation and the contribution from star-forming regions [33,34]. Table 4 presents the flux ratios of the emission lines H, H, [O iii] 5007 Å, [N ii] 6583 Å, and [S ii] 6717+6731 Å. These lines were chosen because they are the strongest emission features in AGN spectra, and the corresponding ratios are only weakly affected by extinction.
Figure 8 shows the positions of different classes of objects based on the intensity ratios of the emission lines .
Figure 8.
Relationship between emission line intensity ratios in the spectrum of NGC 7469.
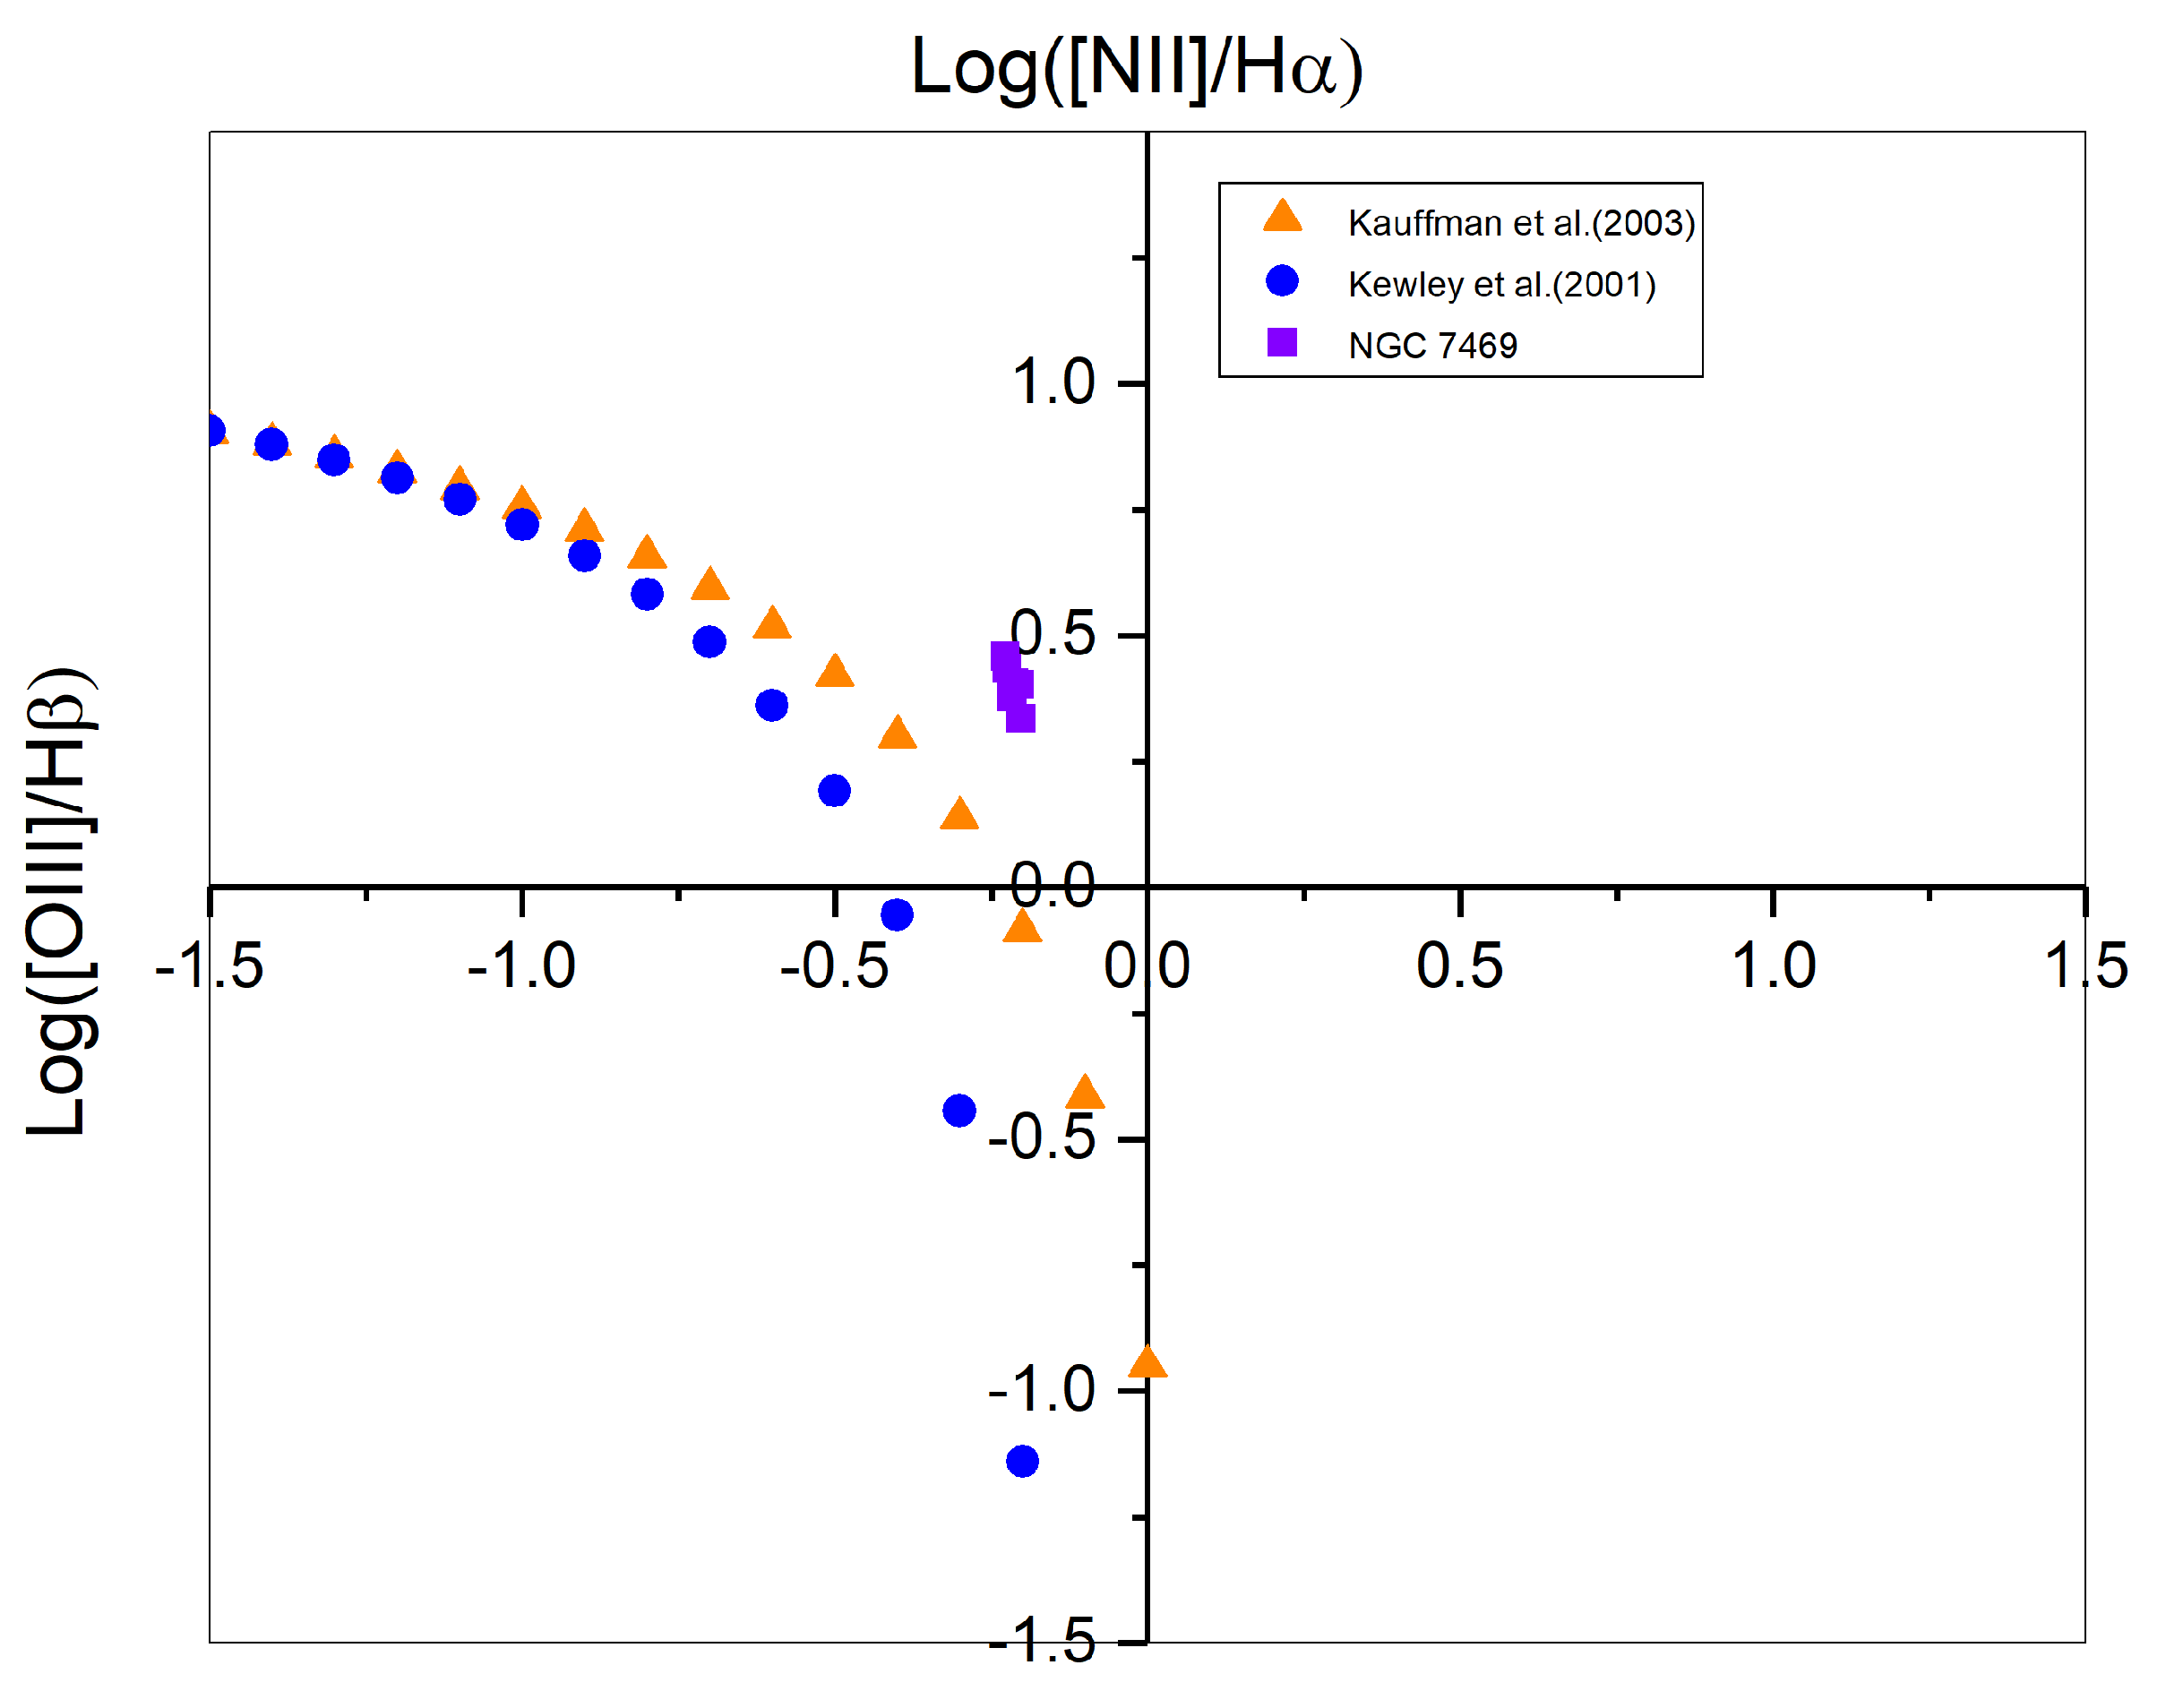
Figure 9.
Relationship between emission line intensity ratios in the spectrum of NGC 7469.
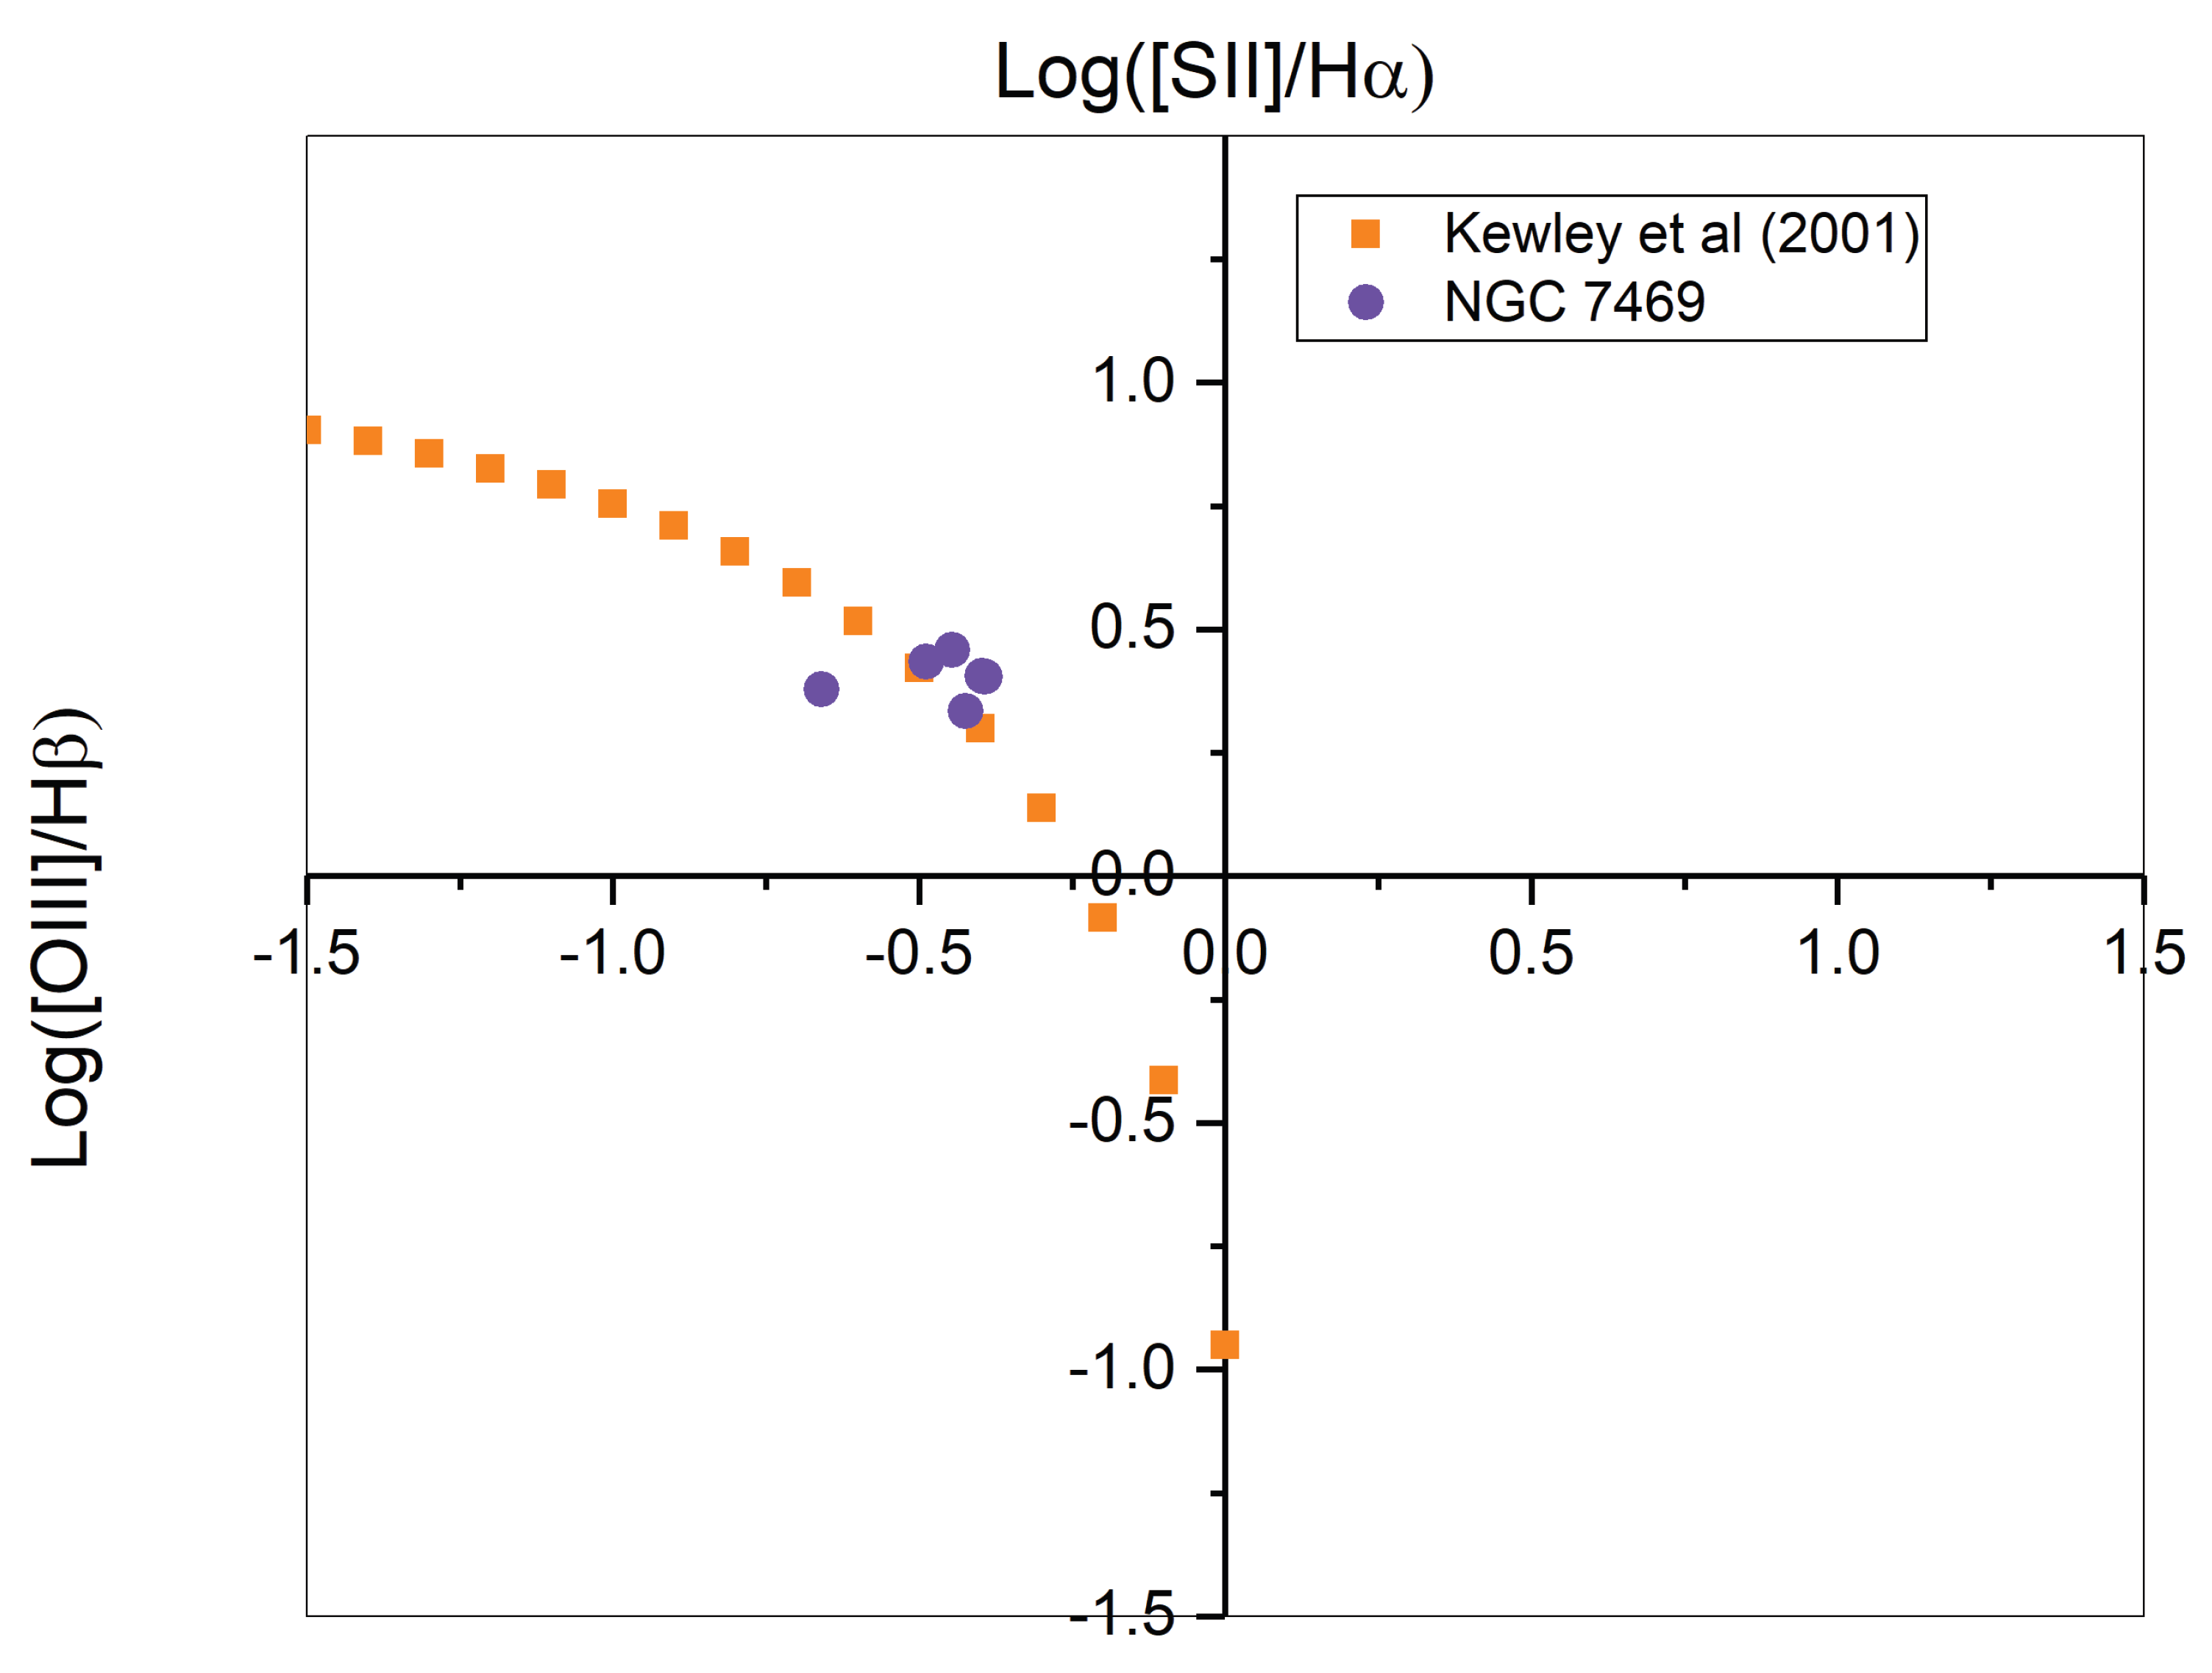
On the BPT diagram, the galaxy NGC 7469 is located slightly above and slightly below the boundary defined by Kauffmann et al. [35], falling within the region of potential model uncertainties indicated by the authors of [36]. This boundary separates objects where either active galactic nuclei or star-forming regions dominate the ionization processes. The position of the studied galaxy suggests that it occupies an intermediate zone. In other words, both ionization sources–AGN and star formation–may contribute equally to the ionization of the emission–line forming regions.
4. Discussion
After the 2019 outburst, the galaxy’s brightness remained at a low level with fluctuations of – mag for three years. During this period, the emission fluxes in the lines and in the continuum experience synchronous fluctuations. At the end of 2024, an increase in the continuum level and an increase in the brightness of the galaxy, accompanied by a decrease in color indices, are observed. This may be the beginning of a new active phase.
The variability of the galaxy NGC 7469 is provoked by the complex multi–component structure of the circumnuclear region. Analysis of possible sources of ionizing radiation in this galaxy revealed at least two sources: AGN and a star–forming region. Their efficiency and relative contribution to gas ionization may change over time. At present, a significant contribution from the active nucleus is supported by the high values of the emission line intensity ratios. On the other hand, the recent increase in the number of newly identified star–forming regions suggests a potentially growing role of star formation in the ionization processes. Moreover, the possible influence of the hot corona on the degree of gas ionization cannot be completely ruled out.
5. Conclusions
This study presents the results of spectral and photometric observations of the active galaxy NGC 7469, carried out primarily during 2020–2024 at the Fesenkov Astrophysical Institute (Almaty, Kazakhstan) and the Nasreddin Tusi Shamakhi Astrophysical Observatory (Shamakhy, Azerbaijan). Analysis of the light curves and spectral characteristics has revealed key features of the galaxy’s behavior in the optical range.
After the 2019 outburst, the galaxy’s brightness decreased to a minimum and remained at this level for about three years with irregular fluctuations within –. Similar behaviour is typical for many Seyfert galaxies. All brightness variations occurred synchronously across three filters, thus the LAG values obtained from cross–correlation analysis between B and V, and V and , were equaled to zero. During this period changes in emission–line fluxes were observed, possibly caused by changes of the broad components of emission profiles H and H . The electron density Ne[SII] of 800– was determined. Analysis of BPT diagrams shows that as AGN and star–formation zone may be the sources of ionizing energy in the galaxy. Active changes in the galaxy: increase in brightness and fluxes in H , began at the end of 2024. Perhaps they mark the beginning of a new active stage in evolution of NGC 7469. Only new observations may confirm or disprove this assumption.
Author Contributions
Conceptualization, methodology and visualization, S.S. and L.K.; formal analysis, L.K. and S.A.; investigation, S.S. and L.K.; resources, V.K., N.H. and I.R.; data curation, S.S. and L.A.; writing—original draft preparation, review and editing, S.S. and L.K.; supervision, project administration and funding acquisition, S.S. All authors have read and agreed to the published version of the manuscript.
Funding
This research is funded by the Ministry of Science and Higher Education of the Republic of Kazakhstan (Grant No. AP22784884 and Grant No. BR24992759 and No. BR24992807).
Acknowledgments
The authors express their gratitude to the SHAO team and the FAI observers for their assistance in organizing and conducting the spectral and photometric observations.
Conflicts of Interest
The authors declare no conflicts of interest. The funders had no role in the design of the study, in the collection, analyses or interpretation of data, in the writing of the manuscript or in the decision to publish the results.
References
- Vincentelli, F.M.; Beard, M.; Hardy, I.M.; Cackett, E.; Horne, K.; Pahari, M. The evolution of the UV /optical lag spectrum of NGC 7469 seen by the Liverpool Telescope. Astronomische Nachrichten 2023, arXiv:astro-ph.HE/2302.09152]344, e20230018. [Google Scholar] [CrossRef]
- Osterbrock, D.E. Astrophysics of gaseous nebulae and active galactic nuclei; 1989.
- Antonucci, R. Unified Models for Active Galactic Nuclei and Quasars. Annual Review of Astronomy and Astrophysics 1993, 31, 473–521. [Google Scholar] [CrossRef]
- Grupe, D. A Complete Sample of Soft X-Ray-selected AGNs. II. Statistical Analysis*. The Astronomical Journal 2004, 127, 1799. [Google Scholar] [CrossRef]
- Sulentic, J.W.; Zwitter, T.; Marziani, P.; Dultzin-Hacyan, D. Eigenvector 1: An Optimal Correlation Space for Active Galactic Nuclei. 2000, 536, L5–L9, [arXiv:astro-ph/astro-ph/0005177]. [CrossRef]
- Xu, D.; Komossa, S.; Zhou, H.; Wang, T.; Wei, J. The Narrow-Line Region of Narrow-Line and Broad-Line Type 1 Active Galactic Nuclei. I. A Zone of Avoidance in Density. 2007, arXiv:astro-ph/0706.2574]670, 60–73. [Google Scholar] [CrossRef]
- Mehdipour, M.; Kaastra, J.S.; Costantini, E.; Behar, E.; Kriss, G.A.; Bianchi, S.; Branduardi-Raymont, G.; Cappi, M.; Ebrero, J.; Di Gesu, L.; et al. Multi-wavelength campaign on NGC 7469. III. Spectral energy distribution and the AGN wind photoionisation modelling, plus detection of diffuse X-rays from the starburst with Chandra HETGS. 2018, arXiv:astro-ph.HE/1803.08525]615, A72. [Google Scholar] [CrossRef]
- Komossa, S. Tidal disruption of stars by supermassive black holes: Status of observations. Journal of High Energy Astrophysics 2015, 7, 148–157. [Google Scholar] [CrossRef]
- Matt, G.; Guainazzi, M.; Maiolino, R. Changing look: from Compton-thick to Compton-thin, or the rebirth of fossil active galactic nuclei. Monthly Notices of the Royal Astronomical Society 2003, 342, 422–426. [Google Scholar] [CrossRef]
- LaMassa, S.M.; Cales, S.; Moran, E.C.; Myers, A.D.; Richards, G.T.; Eracleous, M.; Heckman, T.M.; Gallo, L.; Urry, C.M. THE 229 DISCOVERY OF THE FIRST CHANGING LOOK QUASAR: NEW INSIGHTS INTO THE PHYSICS AND PHENOMENOLOGY 230 OF ACTIVE GALACTIC NUCLEI. The Astrophysical Journal 2015, 800, 144. [Google Scholar] [CrossRef]
- Genzel, R.; Weitzel, L.; Tacconi-Garman, L.E.; Blietz, M.; Cameron, M.; Krabbe, A.; Lutz, D.; Sternberg, A. Infrared Imaging and Spectroscopy of NGC 7469. 1995, 444, 129. [CrossRef]
- Soifer, B.T.; Bock, J.J.; Marsh, K.; Neugebauer, G.; Matthews, K.; Egami, E.; Armus, L. High Spatial Resolution Mid-Infrared Observations of Three Seyfert Galaxies. 2003, 126, 143–152, [arXiv:astro-ph/astro-ph/0304105]. [CrossRef]
- Song, Y.; Linden, S.T.; Evans, A.S.; Barcos-Muñoz, L.; Privon, G.C.; Yoon, I.; Murphy, E.J.; Larson, K.L.; Daz-Santos, T.; Armus, L.; et al. A Comparison between Nuclear Ring Star Formation in LIRGs and in Normal Galaxies with the Very Large Array. The Astrophysical Journal 2021, 916, 73. [Google Scholar] [CrossRef]
- Merkulova, N.I. UBVRI Light Curves of the Seyfert Galaxy NGC 7469 During 1990-1998: Microvariability. The Astronomical Journal 2000, 119, 631. [Google Scholar] [CrossRef]
- Doroshenko, V.T.; Sergeev, S.G.; Efimov, Y.S.; Klimanov, S.A.; Nazarov, S.V. X-ray and optical variability of the seyfert galaxy NGC 7469. Astronomy Letters 2010, 36, 611–633. [Google Scholar] [CrossRef]
- Ugol’kova, L.S.; Artamonov, B.P.; Shimanovskaya, E.V.; Bruevich, V.V.; Burkhonov, O.; Egamberdiev, S.A.; Metlova, N.V. Study of the nuclear activity of the Seyfert galaxy NGC 7469 over the period of observations 2008-2014. Astronomy Letters 2017, arXiv:astro-ph.HE/1707.06290]43, 233–240. [Google Scholar] [CrossRef]
- Shapovalova, A.I.; Popović, L.; Chavushyan, V.H.; Afanasiev, V.L.; Ilić, D.; Kovačević, A.; Burenkov, A.N.; Kollatschny, W.; Spiridonova, O.; Valdes, J.R.; et al. Long-term optical spectral monitoring of NGC 7469. Monthly Notices of the Royal Astronomical Society 2017, 466, 4759–4775. [Google Scholar] [CrossRef]
- Shomshekova, S.A.; Reva, I.V.; Kondratyeva, L. Standardization of the photometric system of the 1-meter telescope on TSHAO. National Academy of Sciences of the Republic of Kazakhstan Physico-Mathematical Series. 2017, 4. [Google Scholar]
- Z.F., B.; I., A.B.; N.A., H. BVRcIc Monitoring of the seyfert galaxy of the first type NGC 7469. Astronomical Journal of Azerbaijan 2023, 18. [CrossRef]
- Kim, D.C.; Sanders, D.B.; Veilleux, S.; Mazzarella, J.M.; Soifer, B.T. Optical Spectroscopy of Luminous Infrared Galaxies. I. Nuclear Data. 1995, 98, 129. [Google Scholar] [CrossRef]
- Peterson, B.M.; Grier, C.J.; Horne, K.; Pogge, R.W.; Bentz, M.C.; De Rosa, G.; Denney, K.D.; Martini, P.; Sergeev, S.G.; Kaspi, S.; et al. Reverberation Mapping of the Seyfert 1 Galaxy NGC 7469. 2014, 795, 149. arXiv:astro-ph.GA/1409.4448]. [CrossRef]
- S.A. Shomshekova, E.D.; R.R Valiullin, A.K.; Reva, I.; Krugov., M. Photometric and Spectral Researches of the seyfert galaxies NGC 4151 and NGC 7469. News of The National Academy Of Sciences Of The Republic Of Kazakhstan Physico-Mathematical Series. 2020, 4.
- Denissyuk, E.K.; Valiullin, R.R.; Shomoshekova, S.A.; Kondratyeva, L.N.; Reva, I.V.; Aimanova, G.A.; Krugov, M.A. Results of Spectral Observations of 15 Seyfert Galaxies. Astrophysics 2022, 65, 447–455. [Google Scholar] [CrossRef]
- Kammoun, E.S.; Papadakis, I.E.; Dovčiak, M. Modelling the UV/optical continuum time-lags in AGN. 2021, 503, 4163–4171. arXiv:astro-ph.HE/2103.04892]. [CrossRef]
- Lu, K.X.; Wang, J.G.; Zhang, Z.X.; Huang, Y.K.; Xu, L.; Xin, Y.X.; Yu, X.G.; Ding, X.; Wang, D.Q.; Feng, H.C. Reverberation Mapping Measurements of Black Hole Masses and Broad-line Region Kinematics in Mrk 817 and NGC 7469. The Astrophysical Journal 2021, 918, 50. [Google Scholar] [CrossRef]
- Pahari, M.; McHardy, I.M.; Vincentelli, F.; Cackett, E.; Peterson, B.M.; Goad, M.; Gültekin, K.; Horne, K. Evidence for variability time-scale-dependent UV/X-ray delay in Seyfert 1 AGN NGC 7469. 2020, 494, 4057–4068. arXiv:astro-ph.HE/2004.07901]. [CrossRef]
- Nandra, K.; Papadakis, I.E. Temporal Characteristics of the X-Ray Emission of NGC 7469. 2001, 554, 710–724, [arXiv:astro-ph/astro-ph/0105238]. [CrossRef]
- Feuillet, L.M.; Kraemer, S.; Meléndez, M.B.; Fischer, T.C.; Schmitt, H.R.; Reeves, J.N.; Trindade Falcão, A. Core Revelations: The Star Formation and Active Galactic Nucleus Connection at the Heart of NGC 7469. 983, 49, arXiv:astro-ph.GA/2409.07665]. [CrossRef]
- Robleto-Orús, A.C.; Torres-Papaqui, J.P.; Longinotti, A.L.; Ortega-Minakata, R.A.; Sánchez, S.F.; Ascasibar, Y.; Bellocchi, E.; Galbany, L.; Chow-Martínez, M.; Trejo-Alonso, J.J.; et al. MUSE Reveals Extended Circumnuclear Outflows in the Seyfert 1 NGC 7469. 906, L6, arXiv:astro-ph.GA/2012.08094]. [CrossRef]
- Bohn, T.; Inami, H.; Diaz-Santos, T.; Armus, L.; Linden, S.T.; U, V.; Surace, J.; Larson, K.L.; Evans, A.S.; Hoshioka, S.; et al. GOALS-JWST: NIRCam and MIRI Imaging of the Circumnuclear Starburst Ring in NGC 7469. 942, L36, arXiv:astro-ph.GA/2209.04466]. [CrossRef]
- Fitzpatrick, M.; Placco, V.; Bolton, A.; Merino, B.; Ridgway, S.; Stanghellini, L. Modernizing IRAF to Support Gemini Data Reduction. arXiv e-prints 2024, p. arXiv:2401.01982, [arXiv:astro-ph.IM/2401.01982]. [CrossRef]
- Astronomical Imaging Software .
- Baldwin, J.A.; Phillips, M.M.; Terlevich, R. CLASSIFICATION PARAMETERS FOR THE EMISSION-LINE SPECTRA OF EXTRAGALACTIC OBJECTS. Publications of the Astronomical Society of the Pacific 1981, 93, 5. [Google Scholar] [CrossRef]
- Veilleux, S.; Osterbrock, D.E. Spectral Classification of Emission-Line Galaxies. 1987, 63, 295. [CrossRef]
- Kauffmann, G.; Heckman, T.M.; Tremonti, C.; Brinchmann, J.; Charlot, S.; White, S.D.M.; Ridgway, S.E.; Brinkmann, J.; Fukugita, M.; Hall, P.B.; et al. The host galaxies of active galactic nuclei. 2003, 346, 1055–1077, [arXiv:astro-ph/astro-ph/0304239]. [CrossRef]
- Kewley, L.J.; Heisler, C.A.; Dopita, M.A.; Lumsden, S. Optical Classification of Southern Warm Infrared Galaxies. 2001, 132, 37–71. [CrossRef]
Figure 1.
Light curves obtained in B (blue), V (green), (red) filters during 2013–2024. The X–axis shows Date−2,400,000, and the Y-axis represents stellar magnitudes. Crosses denote data from [17], other points are FAI data.
Figure 1.
Light curves obtained in B (blue), V (green), (red) filters during 2013–2024. The X–axis shows Date−2,400,000, and the Y-axis represents stellar magnitudes. Crosses denote data from [17], other points are FAI data.
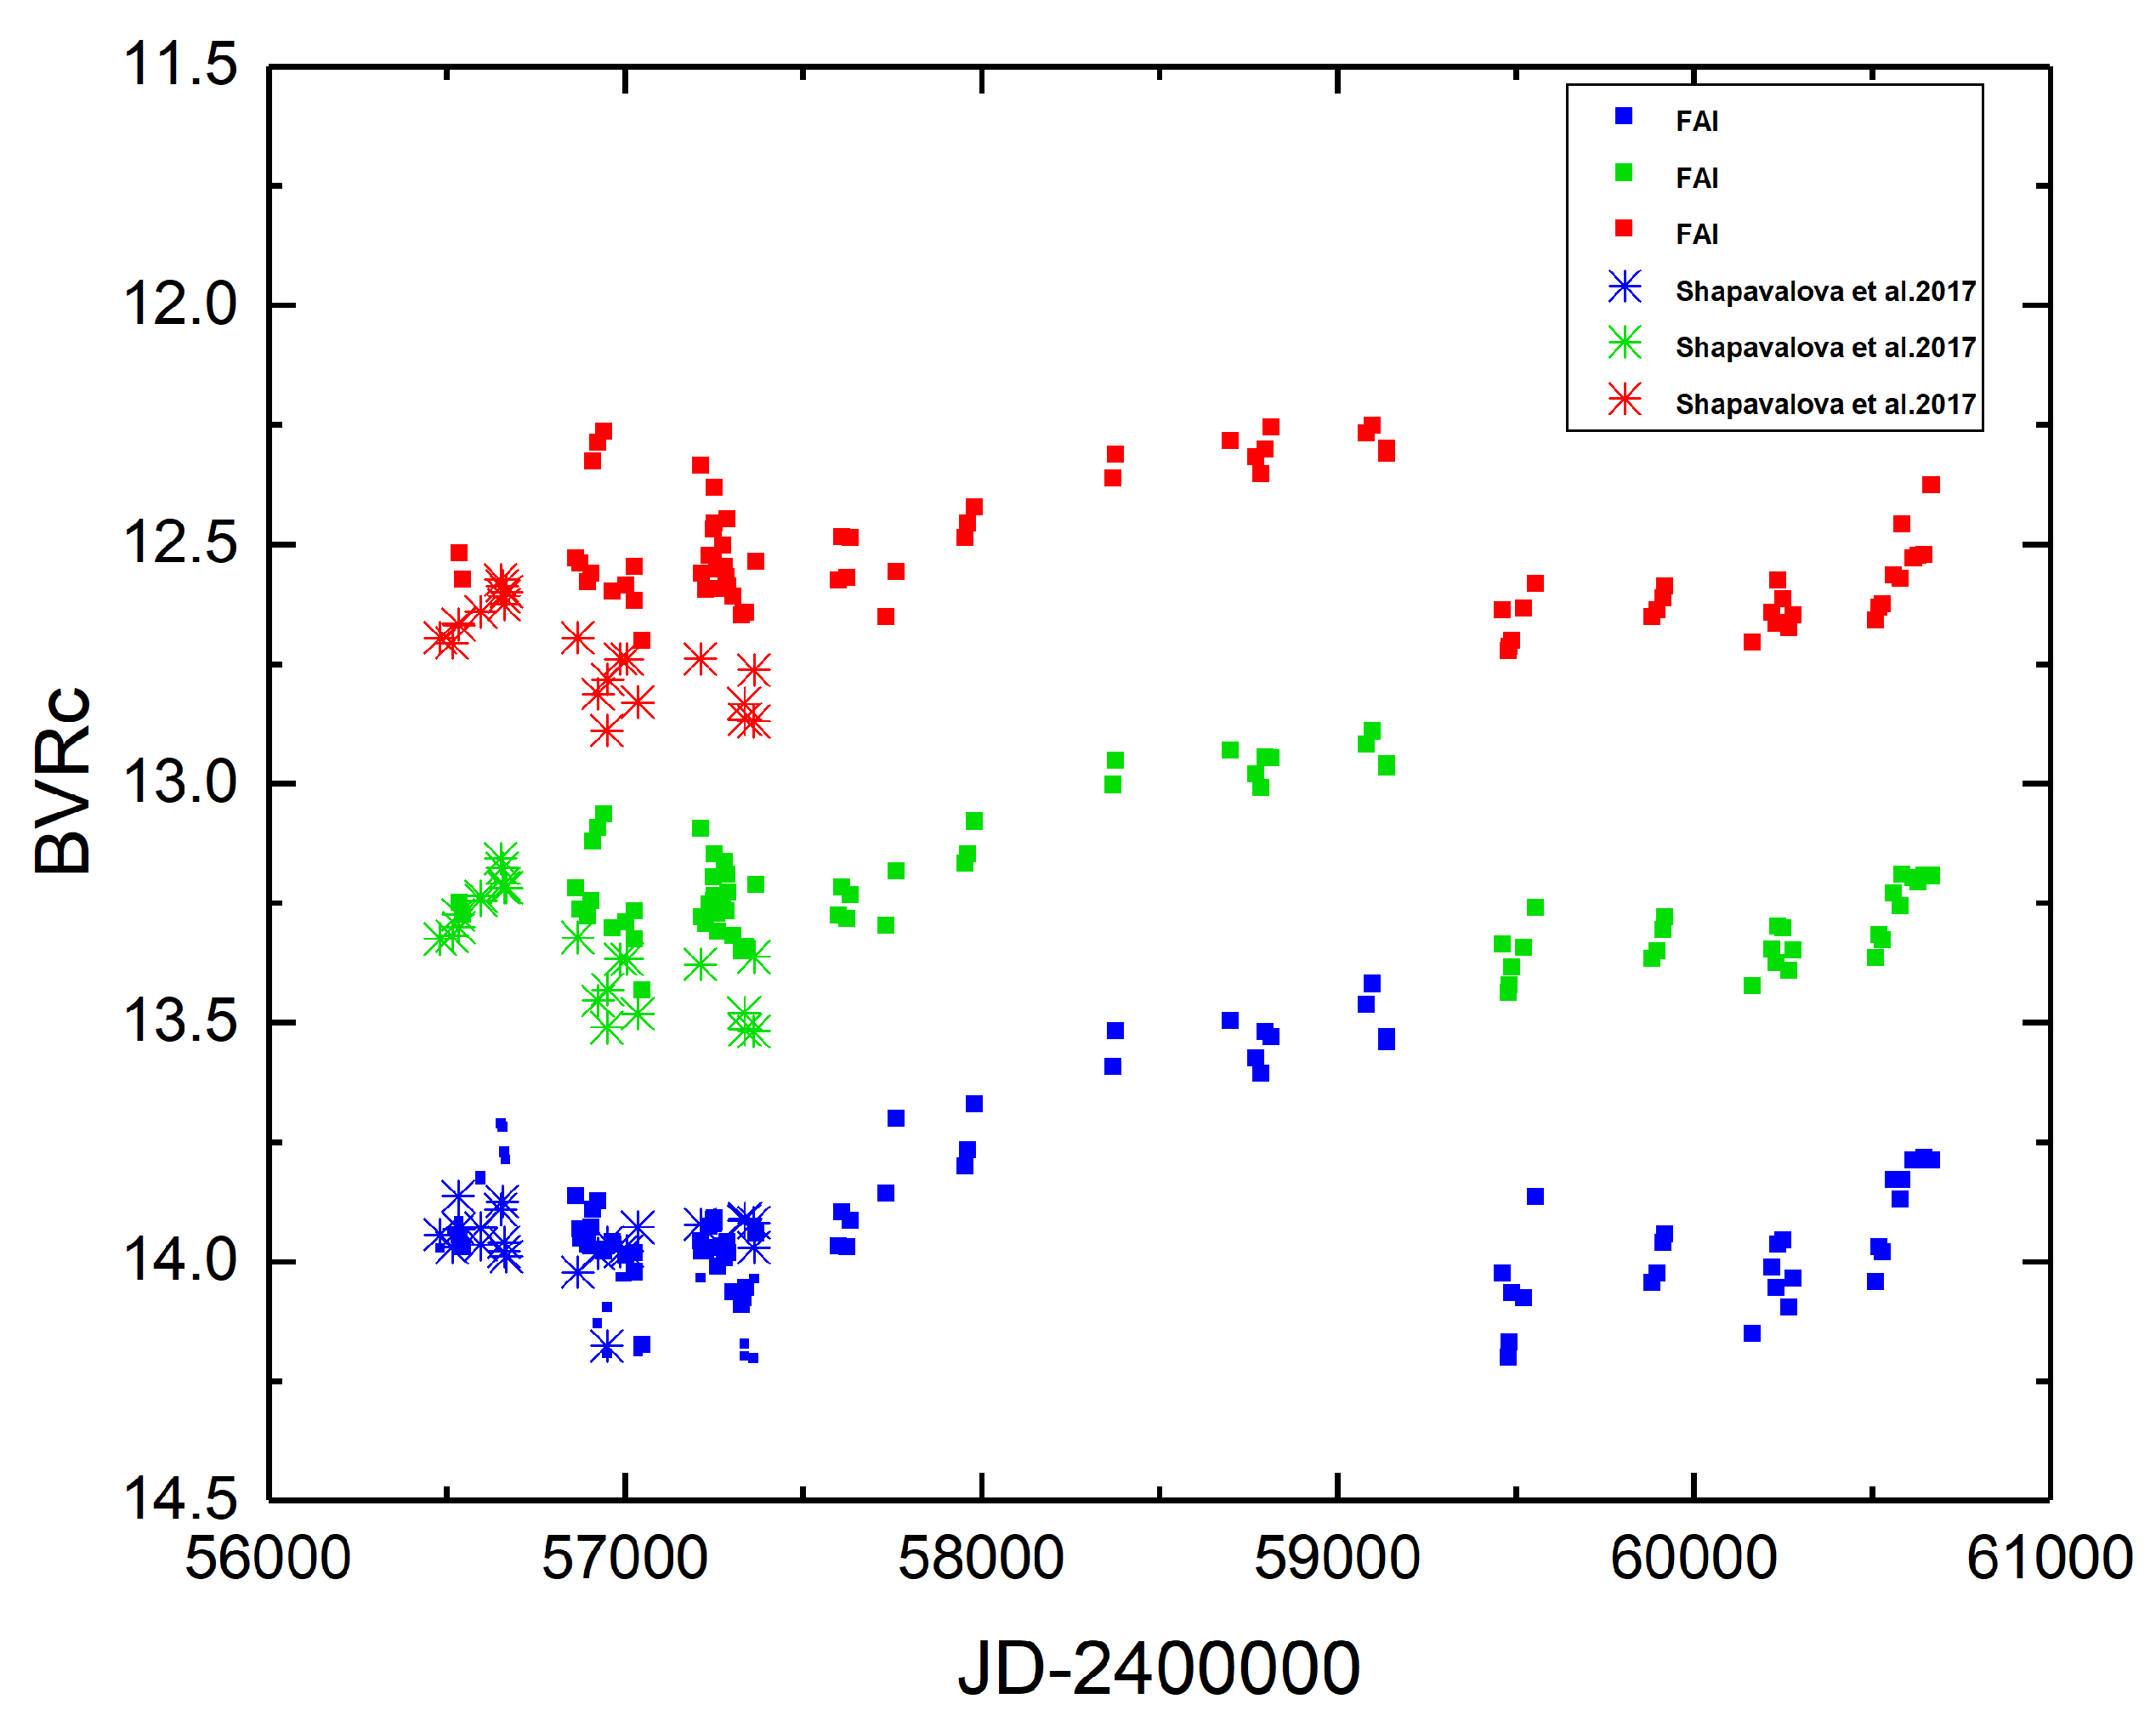
Figure 2.
Dependence of color indices on V magnitudes. X-axis: ; Y-axis: (blue) and (red).

Figure 3.
Lag–correlation between brightness values in the B and V filters, as well as and V, for the galaxy NGC 7469 during the period 2013–2024.
Figure 3.
Lag–correlation between brightness values in the B and V filters, as well as and V, for the galaxy NGC 7469 during the period 2013–2024.
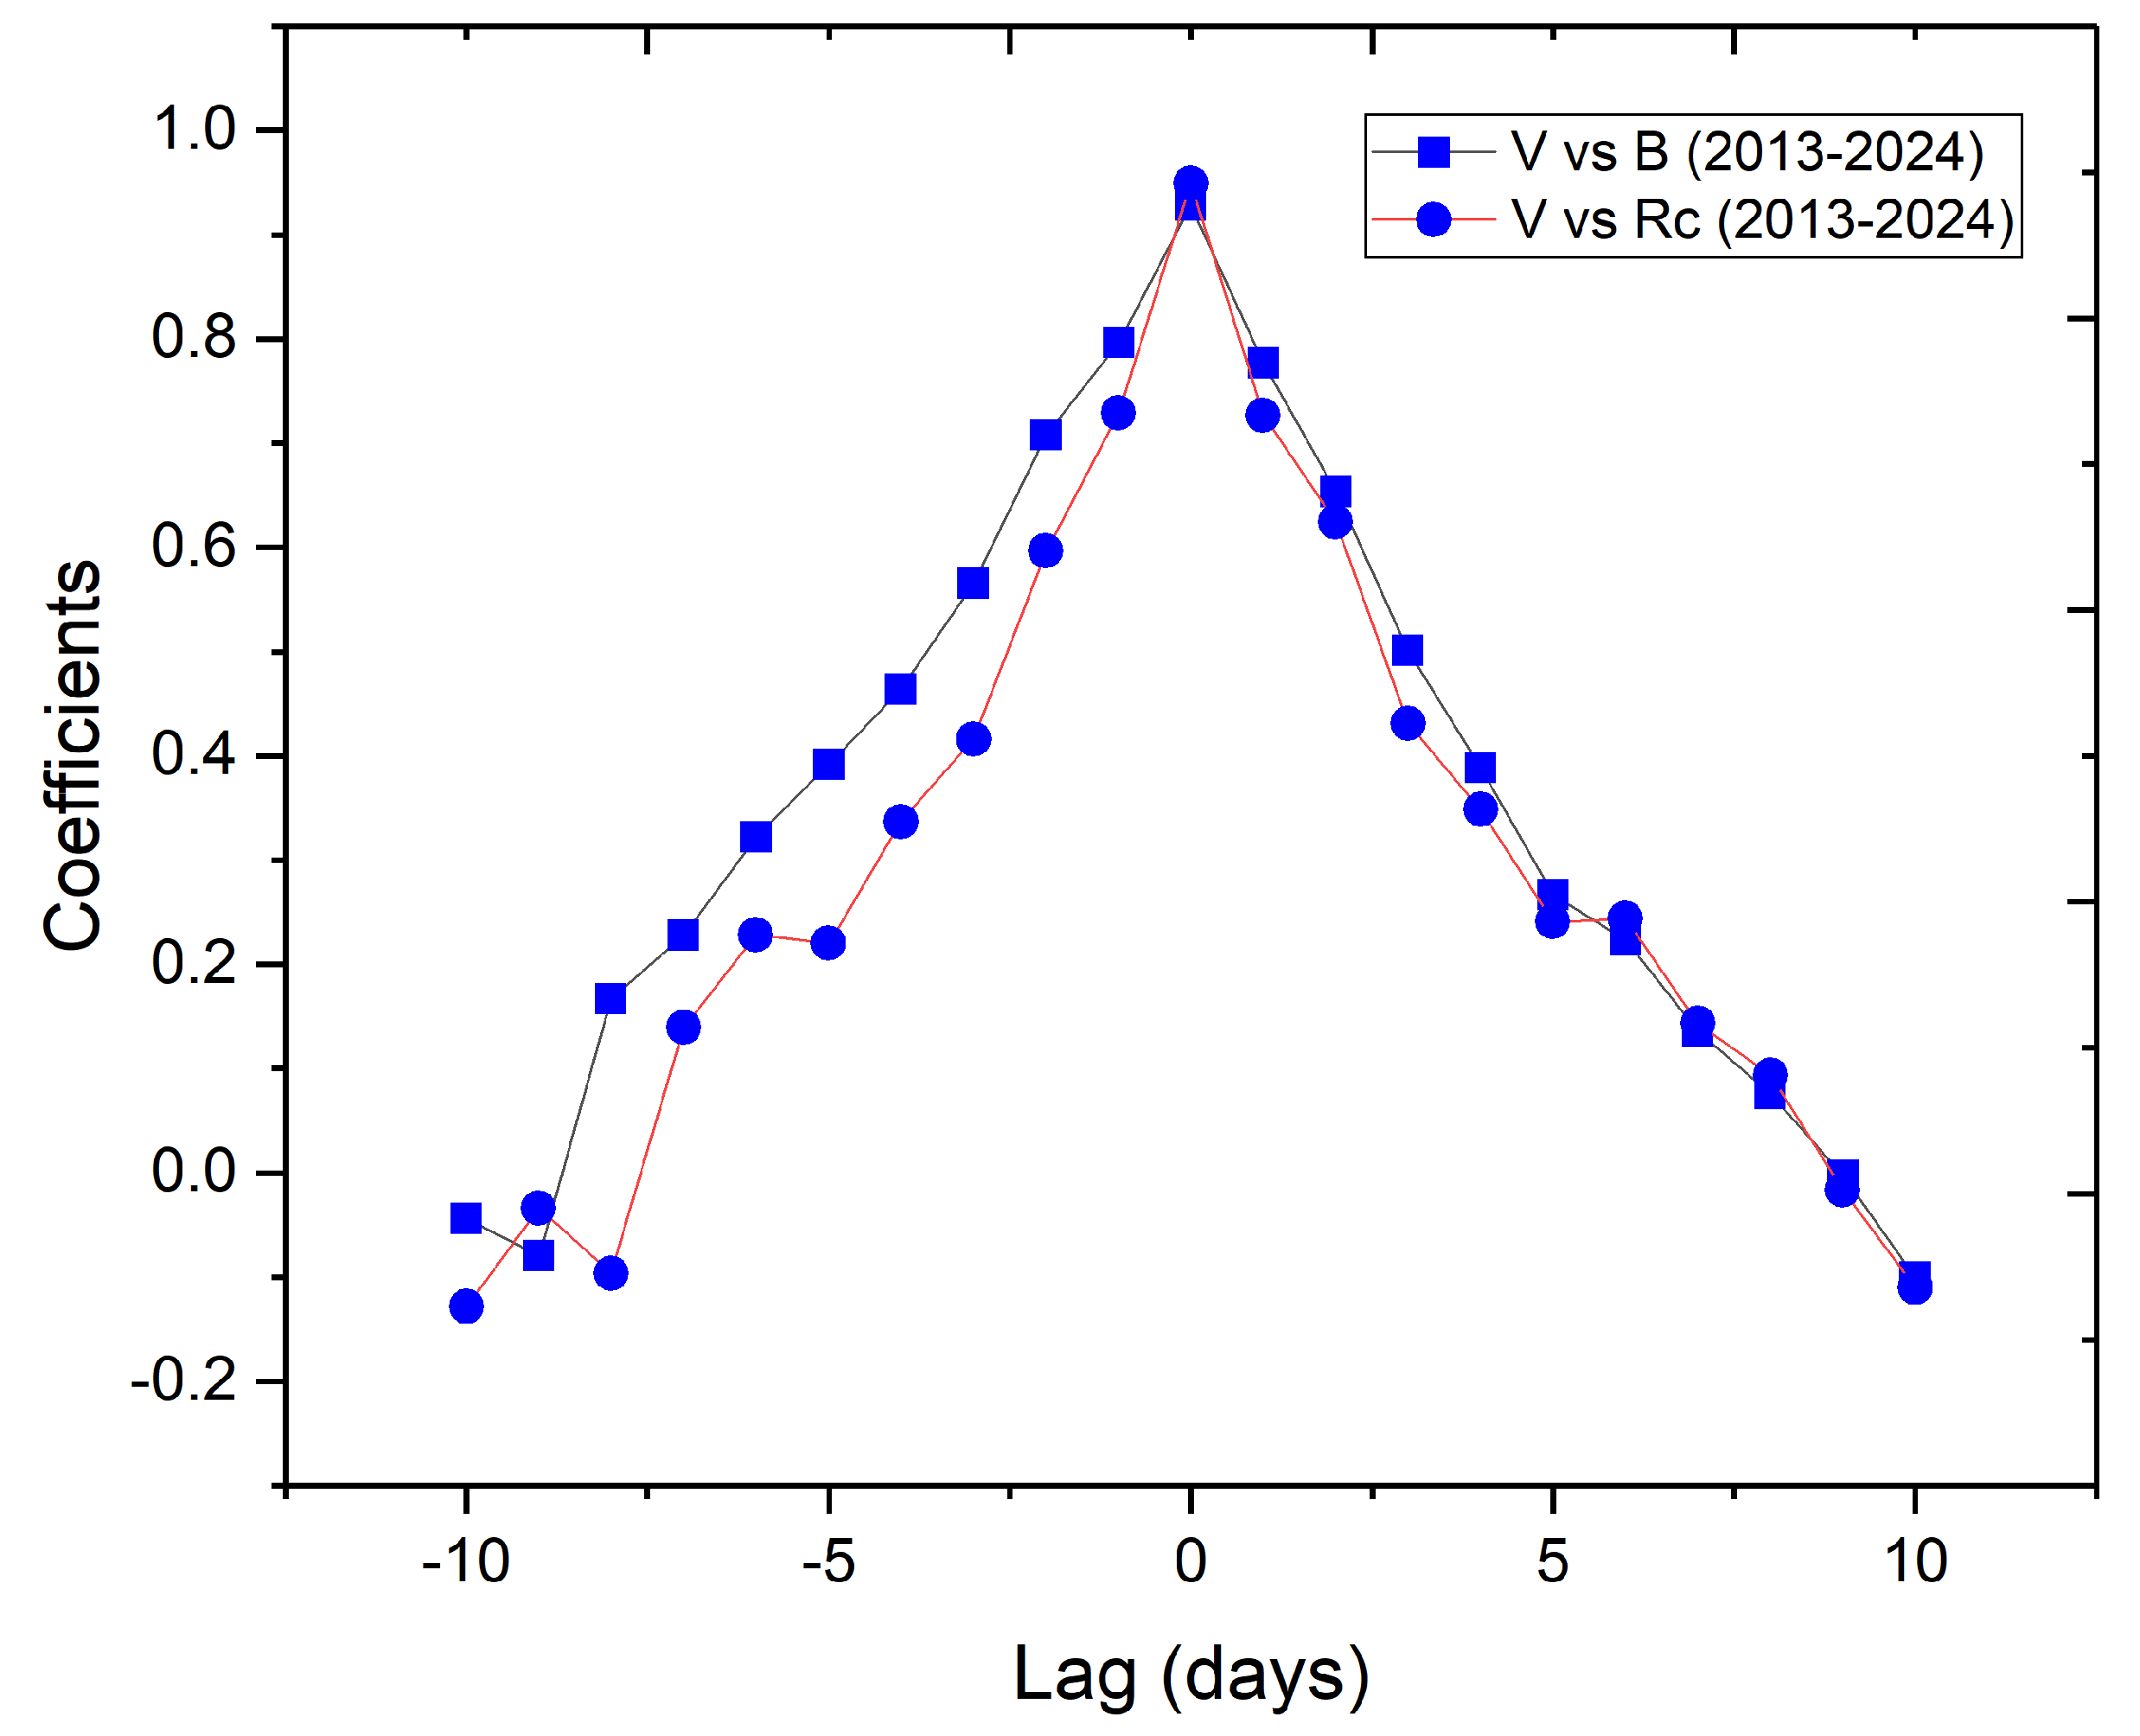

Table 1.
Characteristics of reference stars used for photometric studies of NGC 7469.
| Designation | B | V | R |
|---|---|---|---|
| Reference star | |||
| GSC 1160:1473 (TYC 1160-1473-1) | 12.644 | 11.806 | 11.280 |
| Check stars | |||
| GSC 1160:784 | 13.210 | 12.770 | 12.280 |
| GSC 1160:585 | 14.000 | 13.460 | 13.150 |
Table 2.
B, V, Rc magnitudes of NGC 7469 obtained in 2020–2024.
| Date | JD-2400000 | B | V | Rc | |||
|---|---|---|---|---|---|---|---|
| 19.08.2020 | 59080 | 13.464 | 0.003 | 12.918 | 0.001 | 12.268 | 0.001 |
| 07.09.2020 | 59099 | 13.420 | 0.003 | 12.892 | 0.003 | 12.252 | 0.002 |
| 15.10.2020 | 59137 | 13.530 | 0.001 | 12.959 | 0.003 | 12.300 | 0.002 |
| 17.10.2020 | 59139 | 13.541 | 0.005 | 12.968 | 0.003 | 12.310 | 0.002 |
| 07.09.2021 | 59464 | 14.025 | 0.007 | 13.337 | 0.003 | 12.639 | 0.002 |
| 23.09.2021 | 59480 | 14.200 | 0.019 | 13.439 | 0.004 | 12.723 | 0.002 |
| 25.09.2021 | 59482 | 14.169 | 0.007 | 13.423 | 0.004 | 12.715 | 0.003 |
| 02.10.2021 | 59489 | 14.066 | 0.003 | 13.386 | 0.002 | 12.701 | 0.002 |
| 06.11.2021 | 59524 | 14.076 | 0.009 | 13.345 | 0.008 | 12.635 | 0.007 |
| 09.12.2021 | 59557 | 13.865 | 0.006 | 13.259 | 0.006 | 12.582 | 0.006 |
| 31.10.2022 | 59883 | 14.044 | 0.007 | 13.366 | 0.007 | 12.652 | 0.006 |
| 13.11.2022 | 59896 | 14.026 | 0.006 | 13.351 | 0.007 | 12.638 | 0.006 |
| 02.12.2022 | 59915 | 13.962 | 0.006 | 13.307 | 0.006 | 12.613 | 0.006 |
| 06.12.2022 | 59919 | 13.942 | 0.006 | 13.281 | 0.005 | 12.588 | 0.005 |
| 09.08.2023 | 60165 | 14.152 | 0.009 | 13.425 | 0.009 | 12.706 | 0.007 |
| 03.10.2023 | 60220 | 14.013 | 0.007 | 13.348 | 0.007 | 12.644 | 0.006 |
| 14.10.2023 | 60231 | 14.054 | 0.007 | 13.375 | 0.007 | 12.666 | 0.006 |
| 19.10.2023 | 60236 | 13.964 | 0.009 | 13.299 | 0.010 | 12.576 | 0.009 |
| 02.11.2023 | 60250 | 13.956 | 0.007 | 13.303 | 0.007 | 12.614 | 0.006 |
| 21.11.2023 | 60269 | 14.096 | 0.008 | 13.393 | 0.007 | 12.676 | 0.006 |
| 01.12.2023 | 60279 | 14.036 | 0.007 | 13.350 | 0.008 | 12.649 | 0.007 |
| 19.07.2024 | 60510 | 14.043 | 0.008 | 13.365 | 0.008 | 12.659 | 0.007 |
| 29.07.2024 | 60520 | 13.969 | 0.007 | 13.318 | 0.006 | 12.634 | 0.006 |
| 07.08.2024 | 60529 | 13.980 | 0.005 | 13.327 | 0.004 | 12.625 | 0.004 |
| 07.09.2024 | 60560 | 13.828 | 0.008 | 13.230 | 0.006 | 12.565 | 0.006 |
| 28.09.2024 | 60581 | 13.869 | 0.006 | 13.257 | 0.006 | 12.572 | 0.005 |
| 01.10.2024 | 60584 | 13.829 | 0.007 | 13.191 | 0.009 | 12.459 | 0.008 |
| 03.11.2024 | 60617 | 13.788 | 0.007 | 13.199 | 0.006 | 12.529 | 0.006 |
| 16.11.2024 | 60630 | 13.788 | 0.007 | 13.208 | 0.007 | 12.525 | 0.006 |
| 02.12.2024 | 60646 | 13.783 | 0.008 | 13.193 | 0.006 | 12.523 | 0.005 |
| 22.12.2024 | 60666 | 13.788 | 0.006 | 13.194 | 0.007 | 12.326 | 0.003 |
Table 3.
Fluxes in the emission lines and continuum in the spectrum of NGC 7469.
| Date | Line1 | EQW | FWHM | Telescope, S/N2 | |||
|---|---|---|---|---|---|---|---|
| Å | Å | ||||||
| 06 Nov 2020 | H+[NII] | 290±14 | 37±4 | AZT-8 (70 cm) | |||
| [SII] | 24±1 | 25±3 | |||||
| 10 Nov 2020 | H | 27±1 | 19±2 | TSHAO (1 m) | |||
| [OIII] | 8±0.3 | 5±0.5 | |||||
| [OIII] | 24±0.9 | 6±0.6 | |||||
| H+[NII] | 220±16 | 36±4 | |||||
| [SII] | 32±2 | 34±3 | |||||
| 19 Nov 2020 | H | 38±1.2 | 29±3 | TSHAO (1 m) | |||
| [OIII] | 10±0.3 | 7±0.7 | |||||
| [OIII] | 35±1.1 | 7±0.7 | |||||
| [OI] | 7±0.3 | 9±0.9 | |||||
| H+[NII] | 236±9 | 37±0.6 | |||||
| [SII] | 8±0.3 | 7±0.7 | |||||
| [SII] | 7±0.3 | 6±0.6 | |||||
| 20 Oct 2022 | H | 33±1.5 | 19±2 | AZT-8 (70 cm) | |||
| [OIII] | 13±0.6 | 9±0.9 | |||||
| [OIII] | 39±1.8 | 9.5±0.9 | |||||
| 25 Jul 2023 | [OI] | 10±0.5 | 18±2 | AZT-8 (70 cm) | |||
| H+[NII] | 183±8 | 40±4 | |||||
| [SII] | 25±1.2 | 28±3 | |||||
| 14 Aug 2023 | H | 9±0.3 | 32±3 | ShAO (2 m) | |||
| H | 25±0.9 | 25±3 | |||||
| [OIII] | 12±0.5 | 14±1 | |||||
| [OIII] | 38±1.4 | 13±1 | |||||
| H+[NII] | 175±6 | 38±4 | |||||
| [SII] | 19±0.7 | 19±3 | |||||
| 09 Oct 2023 | [OI] | 4±0.1 | 7±0.7 | AZT-8 (70 cm) | |||
| H+[NII] | 235±6 | 38±4 | |||||
| [SII] | 29±0.8 | 24±2.4 | |||||
| 03 Nov 2023 | [OI] | 9±0.6 | 18±2 | AZT-8 (70 cm) | |||
| H+[NII] | 157±11 | 39±4 | |||||
| [SII] | 29±1.5 | 21±3 | |||||
| 16 Nov 2023 | H | 24±4 | 13±1 | AZT-20 (1.5 m) | |||
| [OIII] | 13±2 | 7±0.7 | |||||
| [OIII] | 40±7 | 7±0.7 | |||||
| [OI] | 6±0.8 | 14±1 | |||||
| H+[NII] | 204±30 | 36.±0.9 | |||||
| [SII] | 11±1.5 | 10±0.9 | |||||
| [SII] | 10±1.5 | 9±0.9 | |||||
| 30 Aug 2024 | H+[NII] | 131±10 | 34±3 | AZT-8 (70 cm) | |||
| [SII] | 22±2 | 23±2 | |||||
| 09 Oct 2024 | H+[NII] | 175±7 | 37±4 | AZT-8 (70 cm) | |||
| [SII] | 30±1 | 30±3 | |||||
| 27 Nov 2024 | H+[NII] | 179±6 | 39±4 | AZT-8 (70 cm) | |||
| [SII] | 18±0.6 | 25±3 |
1 Central wavelengths: H 4340 Å, H 4861 Å, [OIII] 4959 Å and 5007 Å, [FeVII] 6086 Å, H+[NII] 6562 Å, [SII] 6730 Å. 2 AZT-8: S/N = 22–64; ShAO: S/N = 46; AZT-20: S/N = 10–12; TSHAO: S/N = 24–53.
Table 4.
Line ratios and their logarithms for NGC 7469.
| Date | [O iii]/H | Log([O iii]/H) | [N ii]/H | Log([N ii]/H) | [S ii]/H | Log([S ii]/H) |
|---|---|---|---|---|---|---|
| 06.11.2020 | 0.54 | -0.27 | 0.27 | -0.56 | ||
| 10.11.2020 | 2.39 | 0.38 | 0.61 | -0.22 | 0.22 | -0.66 |
| 19.11.2020 | 2.87 | 0.46 | 0.59 | -0.23 | 0.36 | -0.45 |
| 04.12.2021 | 2.16 | 0.33 | 0.63 | -0.20 | 0.38 | -0.42 |
| 20.10.2022 | 2.03 | 0.31 | ||||
| 25.07.2023 | 0.61 | -0.22 | 0.47 | -0.33 | ||
| 14.08.2023 | 2.54 | 0.41 | 0.61 | -0.21 | 0.40 | -0.40 |
| 09.10.2023 | 0.58 | -0.24 | 0.35 | -0.45 | ||
| 13.11.2023 | 2.53 | 0.40 | 0.62 | -0.21 | 0.41 | -0.39 |
| 16.11.2023 | 2.72 | 0.43 | 0.60 | -0.22 | 0.33 | -0.49 |
| 30.08.2024 | 0.65 | -0.19 | 0.46 | -0.34 | ||
| 09.10.2024 | 0.57 | -0.25 | 0.33 | -0.49 | ||
| 27.11.2024 | 0.62 | -0.21 | 0.45 | -0.35 | ||
| Average | 0.39±0.017 | -0.22±0.007 | -0.43±0.05 |
Disclaimer/Publisher’s Note: The statements, opinions and data contained in all publications are solely those of the individual author(s) and contributor(s) and not of MDPI and/or the editor(s). MDPI and/or the editor(s) disclaim responsibility for any injury to people or property resulting from any ideas, methods, instructions or products referred to in the content. |
© 2025 by the authors. Licensee MDPI, Basel, Switzerland. This article is an open access article distributed under the terms and conditions of the Creative Commons Attribution (CC BY) license (http://creativecommons.org/licenses/by/4.0/).
Copyright: This open access article is published under a Creative Commons CC BY 4.0 license, which permit the free download, distribution, and reuse, provided that the author and preprint are cited in any reuse.


