
Submitted:
30 May 2025
Posted:
02 June 2025
You are already at the latest version
Abstract
Spherical magnetic nanoparticles of α-Fe core and iron oxide shell were fabricated by electric explosion of the wire technique (EEW). The structure and magnetic properties of synthesized nanoparticles were experimentally investigated. Magnetic properties of Fe nanoparticles ensemble of individual defect-free non-interacting iron-based nanoparticles with different size were calculated using micromagnetic modeling. Experimental and calculated magnetic hysteresis loops were comparatively analyzed.
Keywords:
magnetic nanoparticles
; electric explosion of wire
; magnetic hysteresis loops
; micromagnetic simulation
; biomedical applications
1. Introduction
Magnetic nanoparticles (MNPs) based on iron (α-Fe) and iron oxides (magnetite Fe3O4) or maghemite (γ-Fe2O3) are used in various biomedical applications. Iron oxides are suitable for diagnostic by the magnetic resonance imaging (MRI), hyperthermia, as carriers for targeted drug delivery and magnetic biodetection of different kinds [1-5]. Fe3O4 and γ-Fe2O3 have the necessary chemical stability and biocompatibility for their multiple missions in biomedicine. Iron nano- and microparticles, in contrary, are characterized by rather high chemical activity and toxicity. However, their advantage is very high saturation magnetization favorable for certain drug delivery protocols and magnetic biosensing [6,7]. In the case of iron particles in order to reduce the cytotoxicity effects, encapsulation or special surface treatments are used for reduction of non-favorable effects [8,9]. In addition, the ability of metallic iron to bind oxygen, taking it away from other components of biological systems, can be used in various treatments, for example as a complementary part of cancer therapy. Namely, the introduction of iron nanoparticles into the tumor area through its blood vessel system can lead to the inhibition of its growth rate due to oxygen starvation caused by the chemical oxidation of iron to its oxides. Similar effect can be obtained in the case treatment of infectious diseases using iron particles [9,10].
For some biomedical applications, for example, in order to increase the efficiency of hyperthermia, magnetic particles with high magnetization and non-zero coercive force are required. Another application in which magnetic materials can be involved is magnetic resonance imaging (MRI). It is a technique used in radiology for obtaining pictures of the organs or processes inside the body employing strong magnetic fields. Sometimes for the contrast enhancement special agents should be used follow oral or intravenous administration. Gadolinium-based contrast agents are dominating at the moment, they shorten the relaxation times of nuclei within body tissues. However, their high toxicity caused continuous search for MRI agents having lower toxicity level even at a cost of the quality of the contrast. Iron oxide nanoparticles were the first candidates for their MRI use in certain conditions [10,12].
The use of pure iron nanoparticles is difficult due to complexity of the control of their current state: high chemical activity and tendency to oxidation are causing these difficulties. As an alternative, it is proposed to use core/shell type particles [1,13,14]and doping of iron oxide particles with rare earth elements (Gd, Tb) [15-17]. Magnetic particles with an Fe core and a Gd shell are of special interest as contrast agents for resonance imaging and as materials for achieving therapeutic effects in radiotherapy. For instance, core-shell magnetic nanoparticles Fe3O4/Gd2O3 are used for T1-T2 dual modal MRI agent [17] that can decrease the risk of pseudo-positive signals in diagnosing lesions [18-21].
Due to the high requirements for nanomedical materials characterized by the state of polydispersity, comprehensive certification of the same parameter using several modern methods is necessary [22]. The fulfillment of the latter requirement is directly related to the batch size of the resulting nanomaterial. The problem can be solved by creating technologies for synthesis of nanoparticles by combining the high-performance electrophysical and physical techniques, which include electric explosion of the wire (EEW), laser target evaporation, and ball milling [23-25]. These methods make it possible to vary the composition, size, and structure of nanoparticles, as well as to obtain core-shell nanocomposites with different compositions and structures of each component [26, 27]. In this case the shell composition is conditioned by the very small additions to the gas atmosphere during MNPs fabrication. The most often used additives as either nitrogen or oxygen.
As iron MNPs might be toxic it is important to ensure the high degree of their surface passivation, which can be done by additional ball milling treatment (BM). Development of complex two-stage production technology (EEW + ball milling) of magnetic nanoparticles requires understanding of magnetic properties of obtained materials including magnetic domains, magnetic hysteresis, ferromagnetic absorption, etc. Experimentally it is impossible to obtain a monodisperse ensemble of MNPs consisting of indistinguishable MNPs and the larger the batch, the more difficult to obtain narrow particle size distribution due to inevitable variations of local conditions of the synthesis.
Micromagnetic simulation can be very helpful in solving this problem and saving time and efforts in the course of detailed understanding of magnetic process which appeared in the particles of different type as well as corresponding to ensembles with different particle size distributions. Of course, obtained predictions of behavior of different batches of MNPs-based materials require experimental verification. However, the successful combination of micromagnetic modeling and experimental verification can significantly simplify the search for optimal solutions.
In this study, experimental ensembles of core-shell Fe/FeOx magnetic nanoparticles were obtained by electric explosion of the wire technique. Magnetic properties, including magnetic structures and magnetic hysteresis loops, of individual magnetic Fe nanoparticles were obtained by micromagnetic simulation techniques for experimental batches of spherical MNPs with measured diameter distribution. The properties of the experimentally studied and calculated magnetic hysteresis loops of an ensemble of magnetostatically non-interacting Fe-based nanoparticles were comparatively analyzed.
2. Materials and Methods
Iron MNPs were synthesized by EEW original equipment designed and fabricated at the Institute of Electrophysics of RAS (Ekaterinburg, RF) [13, 27]. The EEW device included following parts: an explosion chamber, a gas trap for the large particles’ separation from the fine fraction, a filter for the fine MNPs accumulation. The device was filled with argon (70%) and nitrogen (30%) mixture at working pressure of 0.12 MPa. Gas turbine provided the working gas circulation at a flow rate of 150 L min−1.
A steel wire of 0.47 mm diameter having composition with very low carbon additions of about 0.07 wt.%) was continuously fed into the explosion chamber from a reel situated on top of the device. One explosion corresponded to 89 mm portion of the wire and one 30 kV voltage pulse with 2 μs duration. The electrical energy corresponding to each wire exploded portion during each pulse insured 130% excess energy in comparison with the metallic iron sublimation energy (424 KJ mol−1). Wire portion was first vaporized and then condensate as non-agglomerated spherical metallic iron nanoparticles. The synthesized material was collected in the filter where it was passivated by oxygen with a flow rate of 0.5 cm3 s−1 before opening the installation. A detailed description of the EEW method can be found elsewhere [28-30].
X-ray diffraction (XRD) analysis was done using standard diffractometer ((Bruker D8 Discover, Bruker Corporation, Billerica, MA, USA) with a graphite monochromator operating with Cu-Kα radiation with the wave length λ= 1.5418 Å. Quantitative analysis was carried out with TOPAS-3 software. The average size of coherent diffraction domains was estimated follow Scherrer approach [31].
Electron microscopy studies were performed by transmission electron microscopy (TEM) using microscope JEOL JEM2100 (JEOL Corp., Tokyo, Japan) operated at 200 kV. In addition, the specific surface area of the ensemble of nanoparticles was measured by low-temperature nitrogen adsorption technique (Brunauer–Emmett– Teller physical adsorption or BET)).
The magnetic properties of Fe nanoparticles were investigated using vibration sample magnetometer Lake Shore Cryotronics (VSM, Lake Shore 7404, Westerville, OH, USA) at room and liquid nitrogen temperatures. For measurements samples of Fe nanoparticles with and without magnetic texture were obtained using two-magnet system and Ge-varnish (Polyvinyl butyral (PVB)). PVB is a random terpolymer composed of vinyl alcohol and vinyl butyral with relatively small amounts of vinyl acetate [32]. Magnetic texture was formed through the solidification of the polymeric composite samples within an external magnetic field, aligning the axis of cubic magnetic anisotropy of the particles along the direction of the magnetic field.
According to experiment micromagnetic simulations were performed for Fe nanoparticles at a temperature of 293 K. Parameters of simulation are given in Table. 1. It should be mentioned that micromagnetic simulation of large particle requires significant processing power. For example, in this paper micromagnetic simulation of nanoparticles with diameter from 10 nm to 230 nm with 20 nm step took about 1 mouth. Calculation was performed using a computer station based on the SuperMicro 4U 7047A-T server platform (United States) with 128 GB of RAM, 32 cores of an Intel XeonX5 CPU with a rate of 3.3 GHz and Gigabyte Geforce RTX 4060 Ti GPU.
Micromagnetic models were designed using the Mumax3 software by dynamically solving the Landau–Lifshitz–Gilbert equation (1) on a mesh built by finite differences.
where m = M/Ms corresponds to reduced magnetization which has unit length, Ms is magnetization saturation, α is the damping parameter, γ is the gyromagnetic ratio, Heff is the effective magnetic field. Effective field Heff is defined by total free energy E which describing micromagnetic model (see equation 2).
The following contributions to total free energy were taken into account in this work: Zeeman energy, exchange energy, magnetostatic energy, and magnetocrystalline anisotropy energy. A detailed description of the equations and capabilities of the Mumax3 software can be found in the works [33, 34]. Contributions are enabled by setting the appropriate parameters in the program code. In mumax3 geometry of simulated object is defined by mesh of rectangular cuboids cells with the specified size. Within cell magnetic moments must be uniform distributed, otherwise model will be incorrect. It means the size of cell should not be higher than magnetic exchange length lex (see equation 3). This parameter characterizes competition between exchange Aex (it leads to parallel direction of spins in cell) and magnetostatic Kd (it leads to opposite direction of spins in cell) interactions. For magnetic material with dominant crystalline anisotropy and Bloch type domain wall profile, instead of Kd using Kc1, but for iron alpha Kd/Kc1 ≈ 10 [34-36].
with µ0 = 4π∙10-7 Tm A-1 the vacuum permeability.

Table 1.
Magnetic parameters of Fe at different temperatures.
| Material | Aex, pJ/m | Ms, MA/m | Kс1, J/m3 | Kс2, J/m3 | lex, nm |
|---|---|---|---|---|---|
| Fe (293 K) | 21.0 | 1.75 | 52.0∙103 | 0.1∙103 | 3 |
Here, Aex - exchange stiffness constant ; Ms - magnetization saturation; Kс1, Kс2 - first and second order constants for cubic anisotropy of Fe and lex - magnetic exchange length [35-39].
3. Results and Discussion
3.1. Structure and Morphology of Fe nanoparticles
XRD analysis (Figure 1a) shows that the Fe powder consists of 96% α-Fe and 4% of iron oxide FeOx. Iron oxide is intentionally formed on the surface of nanoparticles during production by oxygen addition. Otherwise, powder can explode at the moment of the contact with air due to high level of pyrophoricity. The specific surface area of the Fe MNPs measured by low-temperature nitrogen adsorption was 7.3 m2 g−1. The calculated value of average diameter using BET technique was about 100 nm, i.e. in a good agreement with the median of the PSD and the average size of coherent diffraction domains.
Magnetic nanoparticles had quite spherical shape and had no visible agglomerations. Their size distribution (Figure 1b) was calculated using TEM data. Particle size distributions by number and by weight were calculated through graphical analysis of approximately N₀ = 350 particles [27, 40].
The particle size distribution by number was well approximated by a lognormal function (4) (A, σ, dn – parameters of approximation), which allows for the estimation of the number-averaged mean diameter (dn = 50 nm). Particles of this size are the most frequently found in the batch (Figure 1c). However, since magnetic properties at nanoscale are determined not only by the material itself but also by MNPs size, the particles with the largest total volume will dominate the magnetic properties of the batch. The volume-averaged mean diameter (dw = 130 nm) describes the particles that contribute the most to the magnetic properties. Since the size distribution by weight cannot be approximated by a lognormal function, dw is calculated using equation (5), where di represents the average size of particles in a specific size range, and N(di) is the number of particles with diameter di. The particle size distribution allows for the calculation of the magnetic hysteresis loop for the entire Fe batch, based on the magnetic hysteresis loops for individual particles with specific diameters (Figure 1d).
Here, A – parameter of not normalized lognormal function; σ – standard deviation of the natural logarithm characterizes spread of particle size; dn – number-averaged mean diameter.
3.2. Magnetic properties of Fe nanoparticles: simulation and experiment
The specific magnetic moment of the nanoparticles was measured using vibration sample magnetometry at room temperature of 293 K. The values of the coercivity (Hc), the residual specific magnetic moment (mr) and the specific magnetic moment of technical saturation (ms) defined for the external filed intensity of 1.8 T are shown in the Table 2. In the higher fields, the ms changed less than 2% (Figure 2). The specific magnetic moment of technical saturation of Fe nanoparticles ms = 190 Am2/kg is lower than for pure bulk iron (220 Am2/kg) [41-43]. This reduction arises from the nanoscale decrease of magnetization and due to the presence of iron oxide phases (e.g., Fe₃O₄ or γ-Fe₂O₃) that form shell around α-Fe core. For iron oxides the specific magnetic moment is at least two times smaller in comparison with pure iron case. Iron oxide layer is assumed to be non-magnetic due to the fact that surface atoms lack sufficient neighboring exchange interactions. Diameter of magnetic core dcore is calculated using equation (6) [30], where ρcore = 7.87 g/cm3 (density of α-Fe), ρshell = 5.2 g/cm3 (density of FeOx), d (diameter of nanoparticle), mcore = 220 Am2/kg (specific magnetic moment of saturation α-Fe core). For nanoparticles with d = 50 nm diameter of magnetic core is about 46 nm.
Micromagnetic simulation of the magnetic hysteresis loops was carried out using the magnetic parameters (Table 1) at 293 K. The axes of cubic magnetic anisotropy were directed along coordinate axes (along x, y, z) according to the scheme of particle represented in Figure 3. Micromagnetic simulation was carried out for individual defect-free particles with diameter range from 10 nm to 230 nm with 20 nm step.
Figure 3 shows magnetic structures of selected particles with diameters 10 nm, 30 nm and 50 nm in remnant magnetization state. The magnetic properties of Fe powder depend on the size of the individual particles of ensemble. Iron particles with a diameter of 10 nm are homogeneously magnetized along one of easy magnetization axis (x axis) of cubic magnetic anisotropy in the remanent state. Particles with diameter of 30 nm exhibit rather complex multidomain structure. Particles with 50 nm have a vortex-type magnetic structure with a core aligned along the easy magnetization x axis. Magnetic structure and magnetic hysteresis loops (Fig.4a) for 10 nm, 30 nm, 50 nm were found to be in good agreement with other works [44-47].
Let’s consider simulated magnetization process for individual particle with diameter 50 nm. Figure 4 (a,b) shows magnetic hysteresis loop and Figure 4 (c,d) describes magnetic structures of particle in selected magnetic fields. External magnetic field H is applied along x axis and decreased from 1 T to -1 T (down) and increased from -1 T to 1 T (up). The number asigned to the magnetic structure (Figure 4 c,d) corresponds to number shown for the hysteresis loop (Figure 4b). As the magnetic field is decreasing magnetic structure changes by jump from uniform saturated magnetization state (Fig.4 b,c; the point (1)) to magnetic structure with “core” parallel to magnetic field and “vortex” partially directed along an magnetic field (Fig.4 b,c; the point (2)). “Core” is a central part of particle with magnetic moments are along x-axis (my = mz = 0). “Vortex” is a region with magnetic moments are perpendicular to the x-axes (mx = 0) and form vortex around “core” (Figure 3). Between states (Fig.4 b,c; the point (2)) and (Fig.4 b,c; the point (3)) magnetization process occurs by appearing mx magnetic moment component in “vortex” with opposite direction of external magnetic field. Then, the jump magnetization reversal of “core” is observed at transition from (Fig.4 b,c; the point (3)) to (Fig.4 b,c; the point (4)) states. At the same time, direction of the “vortex” magnetic moments changes from clockwise to counterclockwise. Further magnetization process occurs by rotation of “vortex” magnetic moments along the external magnetic field direction until a state of the uniform magnetization is reached.
Similar behavior was observed for all particles with diameters larger than 50 nm up to the 130 nm case (Figure 4b). For the MNPs with the diameters below 150 nm, as the field decreases, the magnetization evolves smoothly from uniform saturation to a vortex state via domain wall nucleation, without sudden transitions (Fig.4 b,d; the points (6,7)). At zero external magnetic field, the particles are also characterized by a “core” and “vortex” magnetic structure.
Simulated magnetic hysteresis loops of individual magnetic particles and particle size distributions can be used for calculation of magnetic hysteresis loop of ensemble of Fe MNPs following the procedure described below. For this purpose, the relative magnetization hysteresis loops (Figure 4a) for each particle size are multiplied by the weight concentration ratio m/m0 (Figure 1d) of particles with a specific diameter. Weight concentration ratio m/m0 is used because the magnetic properties of an ensemble are primarily determined by particles with the largest total volume. For instance, one particle with a diameter of 150 nm in the considered batch contributes to the magnetic properties equivalently to 30 particles with a diameter of 50 nm. Afterwards all magnetic hysteresis loops for each one of the particle sizes were summarized and hysteresis loop for ensemble was calculated.
Simulated magnetic hysteresis loop of ensemble based on experimental weight concentration ratio m/m0 (Figure 1d) is marked by “1” (Figure 5a, red curve). It characterized by smaller angle of inclination relative to the H axis than experimental magnetic hysteresis loop (Figure 5a, black curve) that is seen by deviations between loops (Fig 5a). According to magnetic hysteresis loop for individual particles (Fig.4a) smaller angle of loop inclination relative to H-axis corresponds to larger nanoparticles. Consequently, ensemble consist of smaller particles than shown by experimental particle size distribution (Figure 1a). It is related with the fact that micromagnetic model describes magnetic properties of α-Fe core without surface layer of FeOx. For instants, nanoparticle (d = 50 nm) with core of α-Fe (dcore = 46 nm) and surface layer of FeOx (thickness 2 nm, expression (6)) corresponds to micromagnetic model with d = 46 nm. Taking this fact into account, refined distribution (Figure 5d) was derived by optimizing the simulated hysteresis loop of ensemble (Figure 5a, blue curve, marked by “2”) to closely match the experimental data. As the magnetic hysteresis loop of an individual nanoparticle is highly size-dependent, this method can be used as an alternative way to electron microscopy for determination of size distribution. Electron microscopy analysis of magnetic particles is limited by the small number of particles analyzed and operator-dependent subjectivity, while magnetic measurements probe a large ensemble of particles. As a result, the calculated size distribution by magnetic measurement accurately represent the entire ensemble. Additionally, magnetic measurements are less costly than electron microscopy.
Simulated magnetic hysteresis loop “2” (Figure 5a, blue curve) based on refined distribution (Figure 5d) is characterized by “step-like” shape. The coercivity values are Hc = 14 mT for the experimental loop and Hc = 30 mT for the simulated one. Starting from 0.2 T the experimental and simulated curves diverge due to expanding of simulated loop. These behaviors can be explained by following reasons. The first reason, discrete number of micromagnetic models with specific diameter step (diameter of micromagnetic models ranges from 10 nm to 230 nm with step 20 nm). The second reason, since the calculation was carried out for the case where the magnetic field H is aligned along one of the cubic magnetic anisotropy axes, the simulation corresponds to an ensemble of nanoparticles with a magnetic texture. However, in the experiment, different orientations of the anisotropy axes relative to the magnetic field are possible. Figure 5b shows simulated magnetic hysteresis loops for N0 nanoparticles with d = 50 nm with random directions of anisotropy axes. Accounting for the dispersion of the axes narrows the hysteresis loop at fields above 0.2 T, while the coercivity decreases from 45 mT to 20 mT. It is shown that N0 = 5 is sufficient to account for the contribution of anisotropy axis dispersion. Thus, calculating the magnetic hysteresis loop while accounting for anisotropy axis dispersion significantly increases the computation time. The third reason is that the simulation does not include the contribution of magnetic interactions between nanoparticles, which leads to a decrease in coercivity and an increase in the angle of inclination relative to the H-axis [48]. Other reason may be related with specific magnetization behavior of nanoparticle shell which consists of nanocrystalline FeOx and spin-frustrated shell [49]. Moreover, magnetic interactions between individual nanoparticles can be neglected in materials with a low nanoparticle concentration (e.g., magnetic polymers) due to the large interparticle distances. In contrast, both dipole-dipole interactions and exchange coupling in core-shell individual particles can play a crucial role in determining the magnetic properties of the ensemble.
It should be noticed that this method not applicable to description of magnetic properties of nanoparticles in superparamagnetic state. The diameter of the superparamagnetic state can be estimated using Eq. (7) [50,51], where T is temperature, kb is the Boltzmann constant, and Kc1 is the cubic magnetocrystalline anisotropy constant. For the parameters listed in Table 1, we find dsp = 15 nm for α-Fe nanoparticles. However, since these particles represent a negligible weight fraction, their impact on the magnetic properties is insignificant.
Refined nanoparticles size distribution by number (Fig.6 c) characterized by lower dispersion σ = 0,36 and number-averaged mean diameter dn = 42 nm comparing with experimental distribution (Figure 1c). The distribution is shifted towards smaller diameters describing only α-Fe core of core-shell Fe/FeOx ensemble. Number-averaged mean diameter is about dn = 42 nm that gives estimation of 4 nm FeOx shell thickness. Size distribution by weight is in good approximation with lognormal function (see equation 4) comparing with experimental distribution (Figure 1d). This may indicate that larger particles are less abundant in the ensemble than the experimental distribution (obtained from a limited number of nanoparticles) suggests.
Modern fabrication techniques allow fabricate batches of magnetic nanoparticles with very different dispersion parameters. For example, ensembles with close value of the specific surface may correspond to quite different particle size distributions and magnetic properties of the materials of the batches. Utilization of the simulation techniques seems to be a very useful instrument for the understanding of the connection between structural and magnetic properties of different ensembles. One of the attractive possibilities of practical usage of these results is a design of the new assemble by mixing particular quantities of the MNPs of different batches with well evaluated properties. This the new assemble of mixed batches can be difficult to obtain by the direct synthesis.
Although of simplification of the micromagnetic model to defect-free, non-interacting magnetic particles, the simulated magnetic hysteresis loops of individual particles can be used to describe the magnetic hysteresis loop of an ensemble. This approach can be applied to determine the particle size distribution by approximating the experimental magnetic hysteresis loop of the ensemble. However, it requires a database of magnetic hysteresis loops and magnetic structures for individual particles across a wide range of sizes. The micromagnetic simulation described in this work is an appropriate method for this purpose.
4. Conclusions
Magnetic nanoparticles consisting of α-Fe core and iron oxide shell of a few nanometers were fabricated by electric explosion of the wire technique (EEW) As a result, ensembles of core-shell Fe/FeO magnetic nanoparticles were obtained. Their structure and magnetic properties were experimentally investigated. Magnetic properties of Fe nanoparticles ensemble of individual defect-free non-interacting iron-based nanoparticles having non-magnetic shell with different diameters from 10 to 230 nm were calculated using micromagnetic modeling. Experimental and calculated magnetic hysteresis loops were comparatively analyzed showing reasonable agreement.
Author Contributions
Conceptualization, G.Yu.M., G.V.K and A.V.S.; methodology, G.Yu.M and. G.V.K; software, G.Yu.M.; validation, G.Yu.M., A.V.S. and G.V.K.; formal analysis, E.A.B and A.V.S.; investigation, E.A.B, A.V.S. G.V.K.; resources, G.V.K.; data curation, G.Yu.M., A.V.S. and E.A.B.; writing—original draft preparation, G.Yu.M. and G.V.K.; writing—review and editing, , G.Yu.M. and G.V.K.; visualization, G.Yu.M. and G.V.K.; supervision, G.V.K.; project administration, G.V.K.; funding acquisition, G.V.K.. All authors have read and agreed to the published version of the manuscript.
Funding
This research was financially supported by the Ministry of Science and Higher Education of the Russian Federation, project no FEUZ-2023-0020.
Institutional Review Board Statement
This work did not involve humans or animals and therefore it did not require the Institutional Review Board Statement and approval.
Informed Consent Statement
Not applicable.
Data Availability Statement
Data available from the corresponding author upon reasonable request.
Acknowledgments
Authors would like to thank I.V. Beketov, A.I. Medvedev, A.M. Murzakaev and Kudukov E.V. for very special support.
Conflicts of Interest
The authors declare no conflicts of interest.
References
- Kamzin, A.S.; Valiullin, A.A.; Khurshid, H.; Nemati, Z.; Srikanth, H.; Phan, M.H. Mössbauer Studies of Core-Shell FeO/Fe3O4 Nanoparticles. Phys. Solid State 2018, 60, 382–389. [Google Scholar] [CrossRef]
- Kurlyandskaya, G. V.; Novoselova, I.P.; Schupletsova, V. V.; Andrade, R.; Dunec, N.A.; Litvinova, L.S.; Safronov, A.P.; Yurova, K.A.; Kulesh, N.A.; Dzyuman, A.N.; et al. Nanoparticles for magnetic biosensing systems. J. Magn. Magn. Mater. 2017, 431, 249–254. [Google Scholar] [CrossRef]
- Golovin, Y.; Golovin, D.; Klyachko, N.; Majouga, A.; Kabanov, A. Modeling drug release from functionalized magnetic nanoparticles actuated by non-heating low frequency magnetic field. J. Nanoparticle Res. 2017, 19. [Google Scholar] [CrossRef]
- Melnikov, G.Y.; Lepalovskij, V.N.; Svalov, A. V.; Safronov, A.P.; Kurlyandskaya, G. V. Magnetoimpedance thin film sensor for detecting of stray fields of magnetic particles in blood vessel. Sensors 2021, 21, 1–17. [Google Scholar] [CrossRef] [PubMed]
- Spizzo, F.; Sgarbossa, P.; Sieni, E.; Semenzato, A.; Dughiero, F.; Forzan, M.; Bertani, R.; Del Bianco, L. Synthesis of ferrofluids made of iron oxide nanoflowers: Interplay between carrier fluid and magnetic properties. Nanomaterials 2017, 7, 1–15. [Google Scholar] [CrossRef] [PubMed]
- Sekino, M.; Kuwahata, A.; Ookubo, T.; Shiozawa, M.; Ohashi, K.; Kaneko, M.; Saito, I.; Inoue, Y.; Ohsaki, H.; Takei, H.; et al. Handheld magnetic probe with permanent magnet and Hall sensor for identifying sentinel lymph nodes in breast cancer patients. Sci. Rep. 2018, 8, 1–9. [Google Scholar] [CrossRef]
- Alphandéry, E. Iron oxide nanoparticles for therapeutic applications. Drug Discov. Today 2020, 25, 141–149. [Google Scholar] [CrossRef]
- Góral, D.; Marczuk, A.; Góral-Kowalczyk, M.; Koval, I.; Andrejko, D. Application of Iron Nanoparticle-Based Materials in the Food Industry. Materials (Basel). 2023, 16, 1–24. [Google Scholar] [CrossRef] [PubMed]
- Colino, C.I.; Millán, C.G.; Lanao, J.M. Nanoparticles for signaling in biodiagnosis and treatment of infectious diseases. Int. J. Mol. Sci. 2018, 19, 3–5. [Google Scholar] [CrossRef]
- Xu, W.; Yang, T.; Liu, S.; Du, L.; Chen, Q.; Li, X.; Dong, J.; Zhang, Z.; Lu, S.; Gong, Y.; et al. Insights into the Synthesis, types and application of iron Nanoparticles: The overlooked significance of environmental effects. Environ. Int. 2022, 158. [Google Scholar] [CrossRef]
- Mahmoudi, M.; Hofmann, H.; Rothen-Rutishauser, B.; Petri-Fink, A. Assessing the in vitro and in vivo toxicity of superparamagnetic iron oxide nanoparticles. Chem. Rev. 2012, 112, 2323–2338. [Google Scholar] [CrossRef] [PubMed]
- Oberdick, S.D.; Jordanova, K. V.; Lundstrom, J.T.; Parigi, G.; Poorman, M.E.; Zabow, G.; Keenan, K.E. Iron oxide nanoparticles as positive T1 contrast agents for low-field magnetic resonance imaging at 64 mT. Sci. Rep. 2023, 13, 1–13. [Google Scholar] [CrossRef] [PubMed]
- Kurlyandskaya, G. V.; Bhagat, S.M.; Safronov, A.P.; Beketov, I. V.; Larrañaga, A. Spherical magnetic nanoparticles fabricated by electric explosion of wire. AIP Adv. 2011, 1, 0–10. [Google Scholar] [CrossRef]
- Koo, C.; Hong, H.; Im, P.W.; Kim, H.; Lee, C.; Jin, X.; Yan, B.; Lee, W.; Im, H.J.; Paek, S.H.; et al. Magnetic and near-infrared derived heating characteristics of dimercaptosuccinic acid coated uniform Fe@Fe3O4 core–shell nanoparticles. Nano Converg. 2020, 7. [Google Scholar] [CrossRef]
- Janani, V.; Induja, S.; Jaison, D.; Meher Abhinav, E.; Mothilal, M.; Gopalakrishnan, C. Tailoring the hyperthermia potential of magnetite nanoparticles via gadolinium ION substitution. Ceram. Int. 2021, 47, 31399–31406. [Google Scholar] [CrossRef]
- Rękorajska, A.; Cichowicz, G.; Cyranski, M.K.; Pękała, M.; Krysinski, P. Synthesis and characterization of Gd 3+ - and Tb 3+ -doped iron oxide nanoparticles for possible endoradiotherapy and hyperthermia. J. Magn. Magn. Mater. 2019, 479, 50–58. [Google Scholar] [CrossRef]
- Morato, Y.L.; Marciello, M.; Chamizo, L.L.; Paredes, K.O.; Filice, M. Hybrid magnetic nanoparticles for multimodal molecular imaging of cancer. Magn. Nanoparticle-Based Hybrid Mater. Fundam. Appl. 2021, 343–386. [CrossRef]
- Guo, H.; Sun, H.; Zhu, H.; Guo, H.; Sun, H. Synthesis of Gd-functionalized Fe3O4@polydopamine nanocomposites for: T 1/ T 2 dual-modal magnetic resonance imaging-guided photothermal therapy. New J. Chem. 2018, 42, 7119–7124. [Google Scholar] [CrossRef]
- Wang, K.; An, L.; Tian, Q.; Lin, J.; Yang, S. Gadolinium-labelled iron/iron oxide core/shell nanoparticles as T1-T2 contrast agent for magnetic resonance imaging. RSC Adv. 2018, 8, 26764–26770. [Google Scholar] [CrossRef]
- Li, F.; Zhi, D.; Luo, Y.; Zhang, J.; Nan, X.; Zhang, Y.; Zhou, W.; Qiu, B.; Wen, L.; Liang, G. Core/shell Fe3O4/Gd2O3 nanocubes as: T 1- T 2 dual modal MRI contrast agents. Nanoscale 2016, 8, 12826–12833. [Google Scholar] [CrossRef]
- Zhang, G.; Zhang, L.; Si, Y.; Li, Q.; Xiao, J.; Wang, B.; Liang, C.; Wu, Z.; Tian, G. Oxygen-enriched Fe3O4/Gd2O3 nanopeanuts for tumor-targeting MRI and ROS-triggered dual-modal cancer therapy through platinum (IV) prodrugs delivery. Chem. Eng. J. 2020, 388, 124269. [Google Scholar] [CrossRef]
- Grossman, J.H.; Mcneil, S.E. IN. 2012.
- Sabik, A. Structural, Magnetic and Heating Efficiency of Ball Milled γ-Fe<sub>2</sub>O<sub>3</sub>/Gd<sub>2</sub>O<sub>3</sub> Nanocomposite for Magnetic Hyperthermia. Adv. Mater. Phys. Chem. 2024, 14, 15–23. [Google Scholar] [CrossRef]
- Kurlyandskaya, G. V.; Burban, E.A.; Neznakhin, D.S.; Yushkov, A.A.; Larrañaga, A.; Melnikov, G.Y.; Svalov, A. V. Structure and Magnetic Properties of Iron Oxide Nanoparticles Subjected to Mechanical Treatment. Phys. Met. Metallogr. 2024, 125, 386–392. [Google Scholar] [CrossRef]
- Svalov, A. V.; Beketov, I. V.; Maksimov, A.D.; Medvedev, A.I.; Neznakhin, D.S.; Arkhipov, A. V.; Kurlyandskaya, G. V. Structure and Magnetic Properties of Gd2O3 Nanoparticles Synthesized by Spark Discharge. Phys. Met. Metallogr. 2023, 124, 870–874. [Google Scholar] [CrossRef]
- Si, P.Z.; Škorvánek, I.; Kováč, J.; Geng, D.Y.; Zhao, X.G.; Zhang, Z.D. Structure and magnetic properties of Gd nanoparticles and carbon coated Gd/GdC2 nanocapsules. J. Appl. Phys. 2003, 94, 6779–6784. [Google Scholar] [CrossRef]
- Beketov, I. V.; Safronov, A.P.; Medvedev, A.I.; Alonso, J.; Kurlyandskaya, G. V.; Bhagat, S.M. Iron oxide nanoparticles fabricated by electric explosion of wire: Focus on magnetic nanofluids. AIP Adv. 2012, 2, 0–24. [Google Scholar] [CrossRef]
- Kotov, Y.A. Electric explosion of wires as a method for preparation of nanopowders. J. Nanoparticle Res. 2003, 5, 539–550. [Google Scholar] [CrossRef]
- Shankar, A.; Safronov, A.P.; Mikhnevich, E.A.; Beketov, I. V.; Kurlyandskaya, G. V. Ferrogels based on entrapped metallic iron nanoparticles in a polyacrylamide network: Extended Derjaguin-Landau-Verwey-Overbeek consideration, interfacial interactions and magnetodeformation. Soft Matter 2017, 13, 3359–3372. [Google Scholar] [CrossRef] [PubMed]
- Beketov, I. V.; Safronov, A.P.; Bagazeev, A. V.; Larrañaga, A.; Kurlyandskaya, G. V.; Medvedev, A.I. In situ modification of Fe and Ni magnetic nanopowders produced by the electrical explosion of wire. J. Alloys Compd. 2014, 586, S483–S488. [Google Scholar] [CrossRef]
- Scherrer, P. Determination of size and inner structure of colloidal particles by X-ray (Bestimmung der Grösse und der inneren Struktur von Kolloidteilchen mittels Röntgenstrahlen). Nachrichten von der Gesellschaft der Wissenschaften zu Göttingen, Math. Klasse 1918.
- Bauer, K.; Garbe, D.; Surburg, H. Ullmann Polyvinyl Compounds, Others. … Encycl. Ind. Chem. 1988. [CrossRef]
- Vansteenkiste, A.; Leliaert, J.; Dvornik, M.; Helsen, M.; Garcia-Sanchez, F.; Van Waeyenberge, B. The design and verification of MuMax3. AIP Adv. 2014, 4, 0–22. [Google Scholar] [CrossRef]
- Leliaert, J.; Dvornik, M.; Mulkers, J.; De Clercq, J.; Milošević, M. V.; Van Waeyenberge, B. Fast micromagnetic simulations on GPU - Recent advances made with mumax3. J. Phys. D. Appl. Phys. 2018, 51. [Google Scholar] [CrossRef]
- Kuz’min, M.D.; Skokov, K.P.; Diop, L.V.B.; Radulov, I.A.; Gutfleisch, O. Exchange stiffness of ferromagnets. Eur. Phys. J. Plus 2020, 135, 1–8. [Google Scholar] [CrossRef]
- Abo, G.S.; Hong, Y.K.; Park, J.; Lee, J.; Lee, W.; Choi, B.C. Definition of magnetic exchange length. IEEE Trans. Magn. 2013, 49, 4937–4939. [Google Scholar] [CrossRef]
- Kuz’min, M.D. Shape of temperature dependence of spontaneous magnetization of ferromagnets: Quantitative analysis. Phys. Rev. Lett. 2005, 94, 16–19. [Google Scholar] [CrossRef]
- Coey, M.; Parkin, S.S.P. Handbook of Magnetism and Magnetic Materials; 2020; ISBN 9783030632083.
- Graham Jr., C.D. Magnetocrystalline Anisotropy Constants of Iron at Room Temperature and Below. Phys. Rev. 2000, 112, 4–7.
- Safronov, A.P.; Beketov, I. V.; Komogortsev, S. V.; Kurlyandskaya, G. V.; Medvedev, A.I.; Leiman, D. V.; Larrañaga, A.; Bhagat, S.M. Spherical magnetic nanoparticles fabricated by laser target evaporation. AIP Adv. 2013, 3, 0–18. [Google Scholar] [CrossRef]
- Carvell, J.; Ayieta, E.; Gavrin, A.; Cheng, R.; Shah, V.R.; Sokol, P. Magnetic properties of iron nanoparticle. J. Appl. Phys. 2010, 107. [Google Scholar] [CrossRef]
- Gangopadhyay, S.; Hadjipanayis, G.C.; Dale, B.; Sorensen, C.M.; Klabunde, K.J.; Papaefthymiou, V.; Kostikas, A. Magnetic properties of ultrafine iron particles. Phys. Rev. B 1992, 45, 9778–9787. [Google Scholar] [CrossRef]
- Schwerdt, J.; F. Goya, G.; Pilar Calatayud, M.; B. Herenu, C.; C. Reggiani, P.; G. Goya, R. Magnetic Field-Assisted Gene Delivery: Achievements and Therapeutic Potential. Curr. Gene Ther. 2012, 12, 116–126. [CrossRef]
- Dimian, M.; Lefter, C. Analysis of magnetization switching via vortex formation in soft magnetic nanoparticles. Adv. Electr. Comput. Eng. 2013, 13, 53–58. [Google Scholar] [CrossRef]
- Ehrmann, A.; Blachowicz, T. Vortex and double-vortex nucleation during magnetization reversal in Fe nanodots of different dimensions. J. Magn. Magn. Mater. 2019, 475, 727–733. [Google Scholar] [CrossRef]
- Betto, D.; Coey, J.M.D. Vortex state in ferromagnetic nanoparticles. J. Appl. Phys. 2014, 115, 2012–2015. [Google Scholar] [CrossRef]
- Vivas, L.G.; Yanes, R.; Berkov, D.; Erokhin, S.; Bersweiler, M.; Honecker, D.; Bender, P.; Michels, A. Toward Understanding Complex Spin Textures in Nanoparticles by Magnetic Neutron Scattering. Phys. Rev. Lett. 2020, 125, 117201. [Google Scholar] [CrossRef] [PubMed]
- Omelyanchik, A.; Varvaro, G.; Gorshenkov, M.; Medvedev, A.; Bagazeev, A.; Beketov, I.; Rodionova, V. High-quality α-Fe nanoparticles synthesized by the electric explosion of wires. J. Magn. Magn. Mater. 2019, 484, 196–200. [Google Scholar] [CrossRef]
- Komogortsev, S. V.; Stolyar, S. V.; Mokhov, A.A.; Fel’k, V.A.; Velikanov, D.A.; Iskhakov, R.S. Effect of the Core–Shell Exchange Coupling on the Approach to Magnetic Saturation in a Ferrimagnetic Nanoparticle. Magnetochemistry 2024, 10. [Google Scholar] [CrossRef]
- Bedanta, S.; Kleemann, W. Supermagnetism. J. Phys. D. Appl. Phys. 2009, 42. [Google Scholar] [CrossRef]
- Wohlfarth, E.P. Magnetic properties of single domain ferromagnetic particles. J. Magn. Magn. Mater. 1983, 39, 39–44. [Google Scholar] [CrossRef]
Figure 1.
XRD analysys of Fe nanoparticles (a); TEM images of Fe nanoparticles (b); Particle size distribution of Fe nanoparticles: (c) by number; (d) by weight (dn and dw number and volume averaged mean diameters, respectively, N0 - number of particle).
Figure 1.
XRD analysys of Fe nanoparticles (a); TEM images of Fe nanoparticles (b); Particle size distribution of Fe nanoparticles: (c) by number; (d) by weight (dn and dw number and volume averaged mean diameters, respectively, N0 - number of particle).
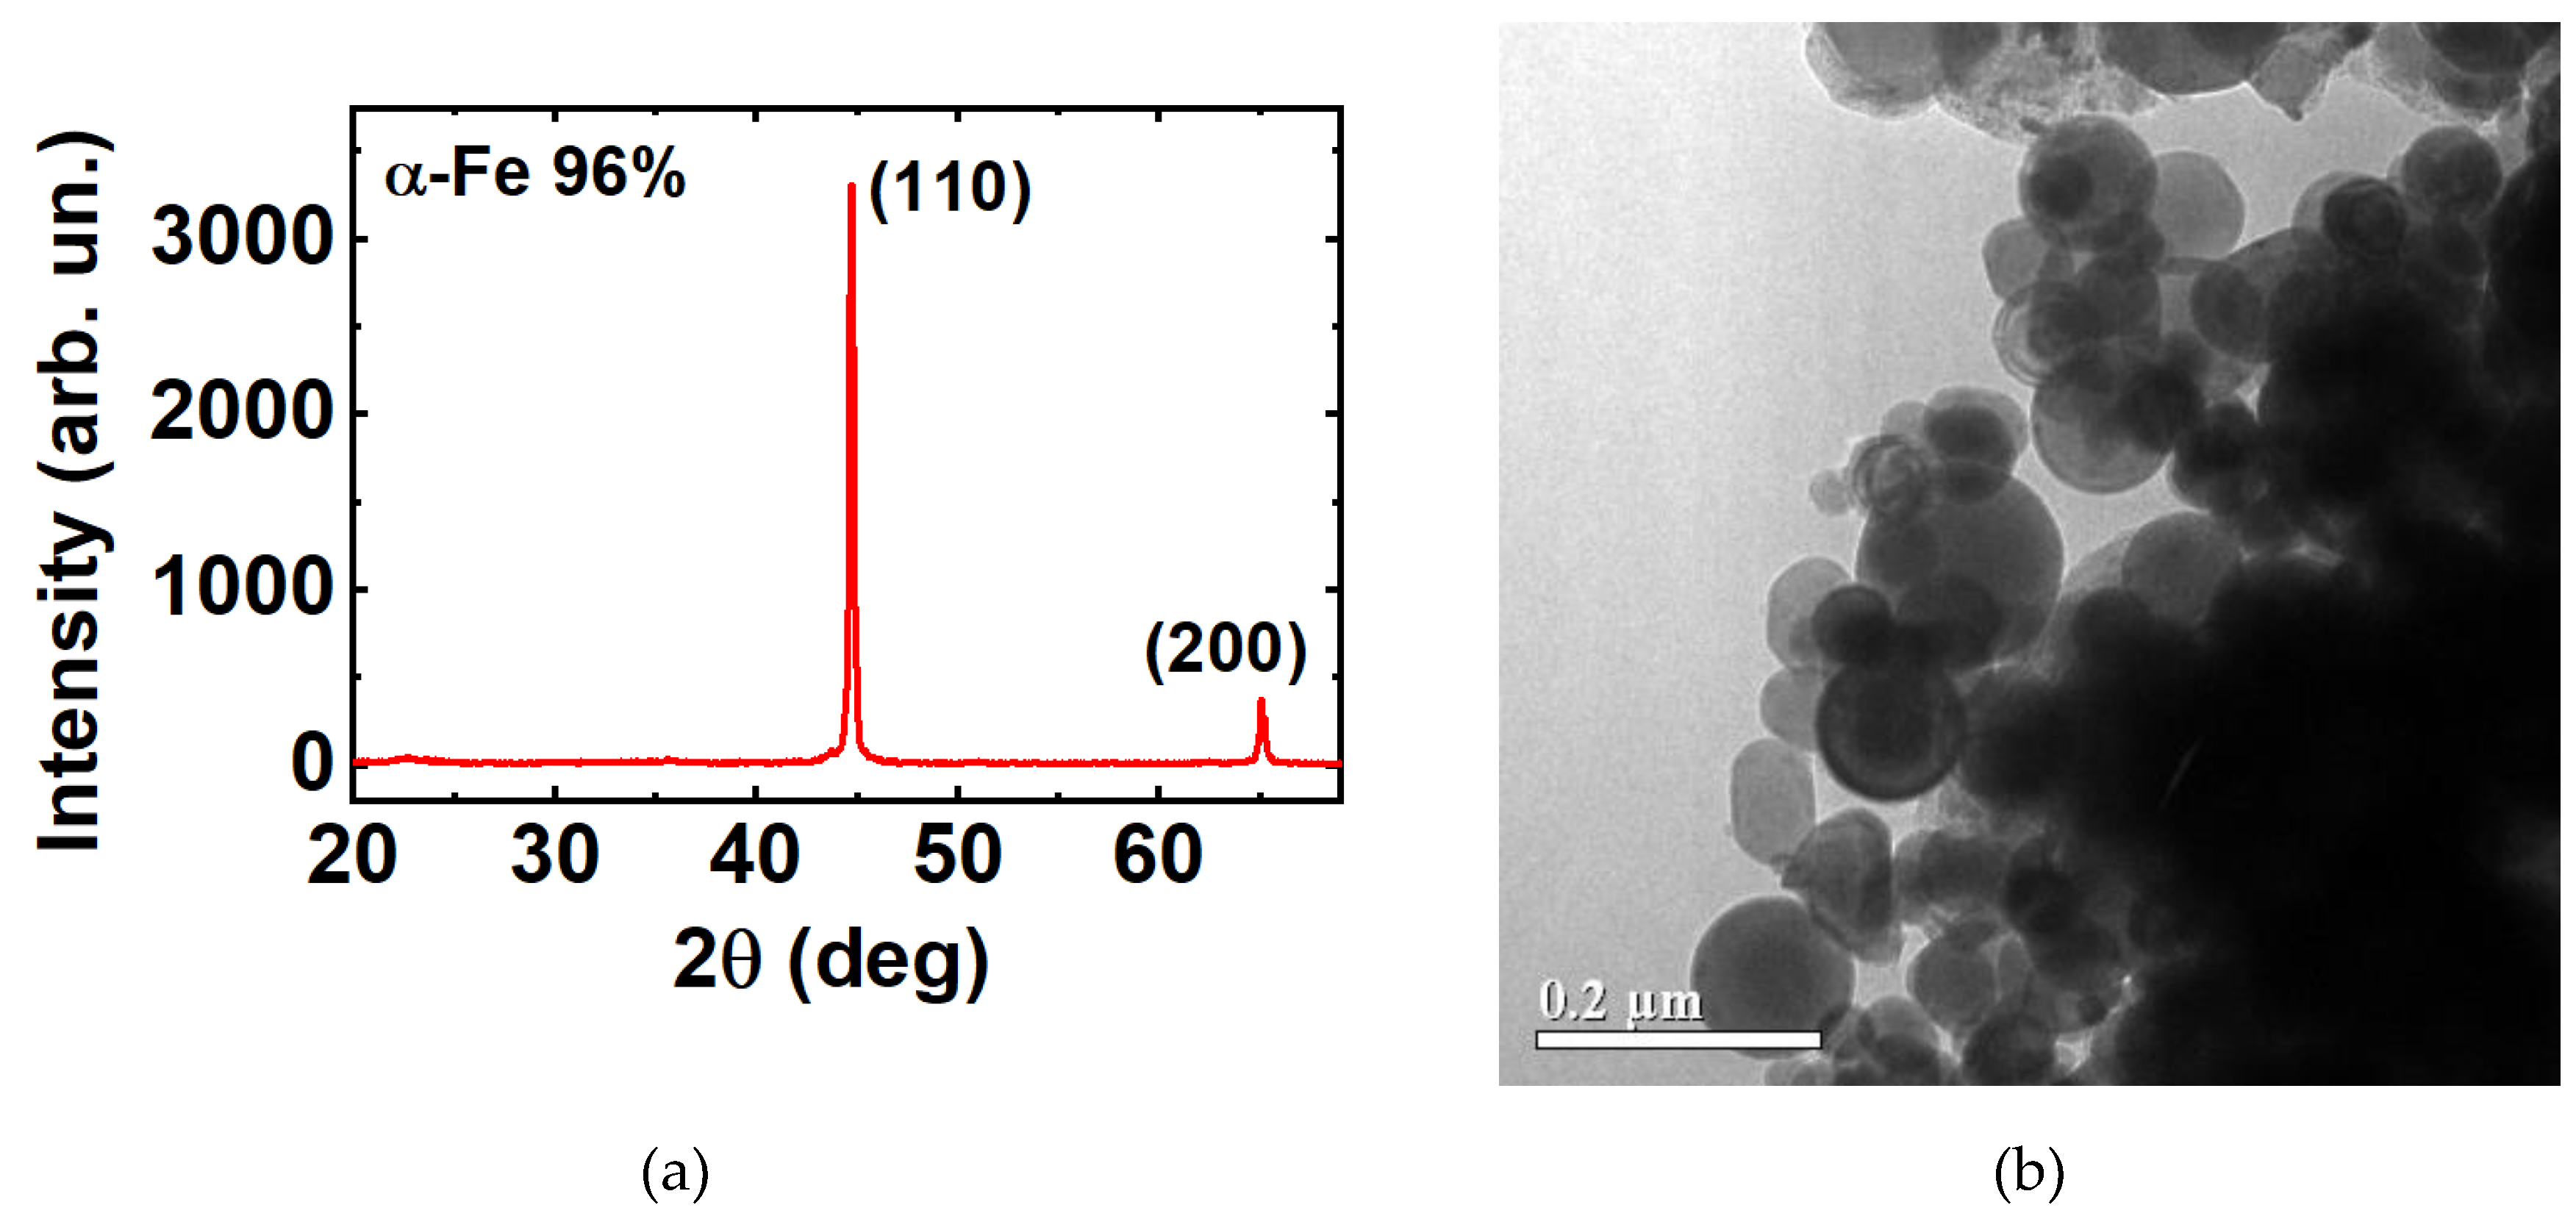
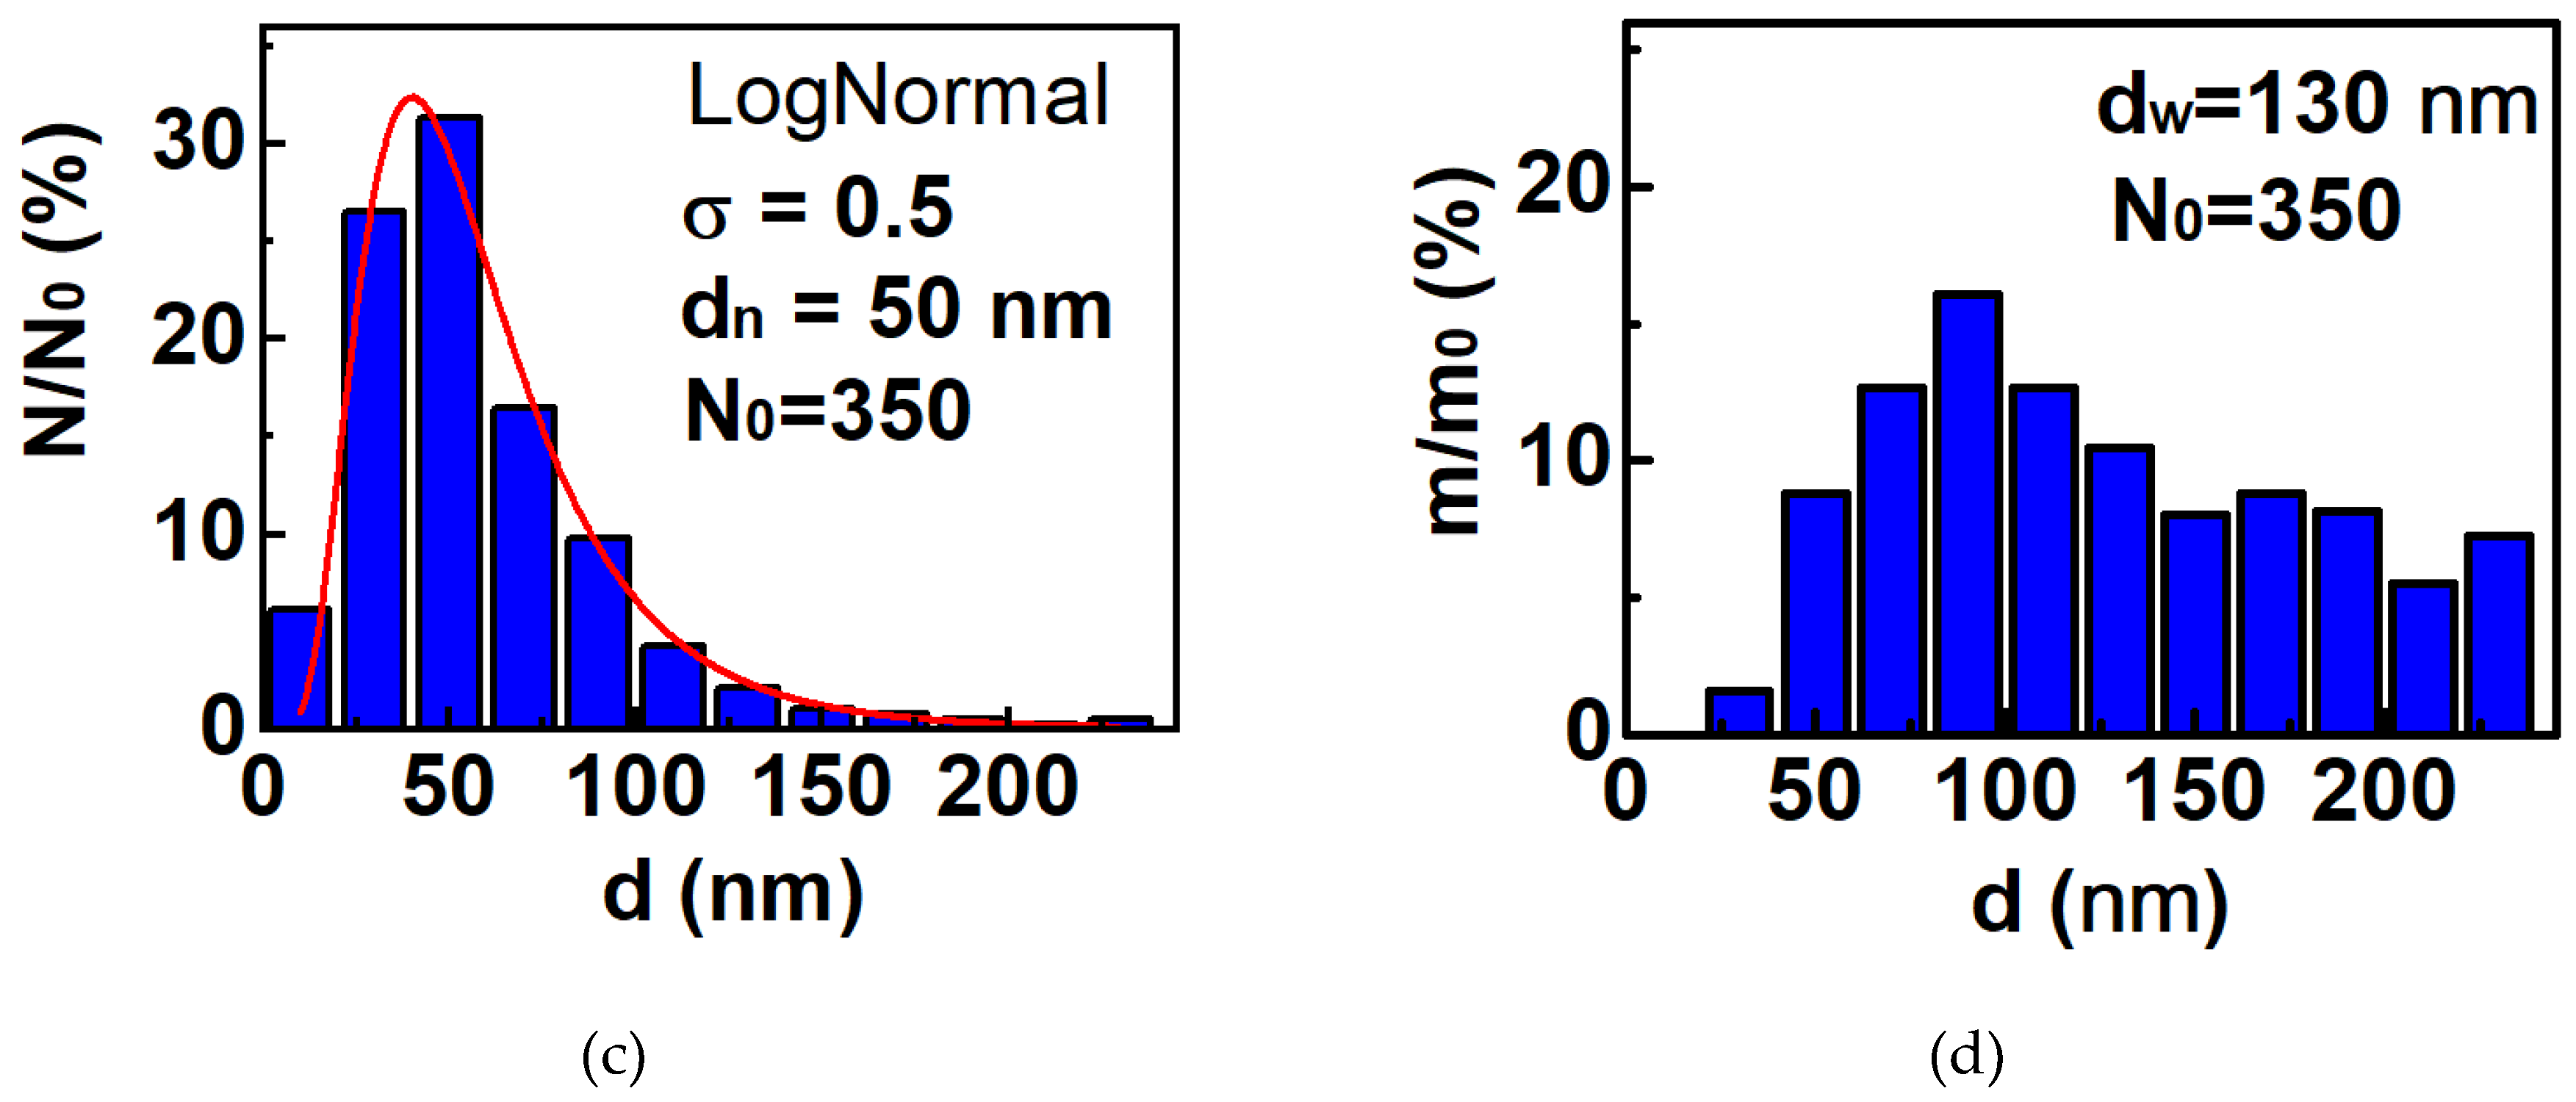
Figure 2.
Magnetic hysteresis loops for Fe/FeOx nanoparticles at the temperature of 293 K: (a) in the range of small magnetic fields; (b) in the range of technical magnetic saturation (in the 1.8 T).
Figure 2.
Magnetic hysteresis loops for Fe/FeOx nanoparticles at the temperature of 293 K: (a) in the range of small magnetic fields; (b) in the range of technical magnetic saturation (in the 1.8 T).
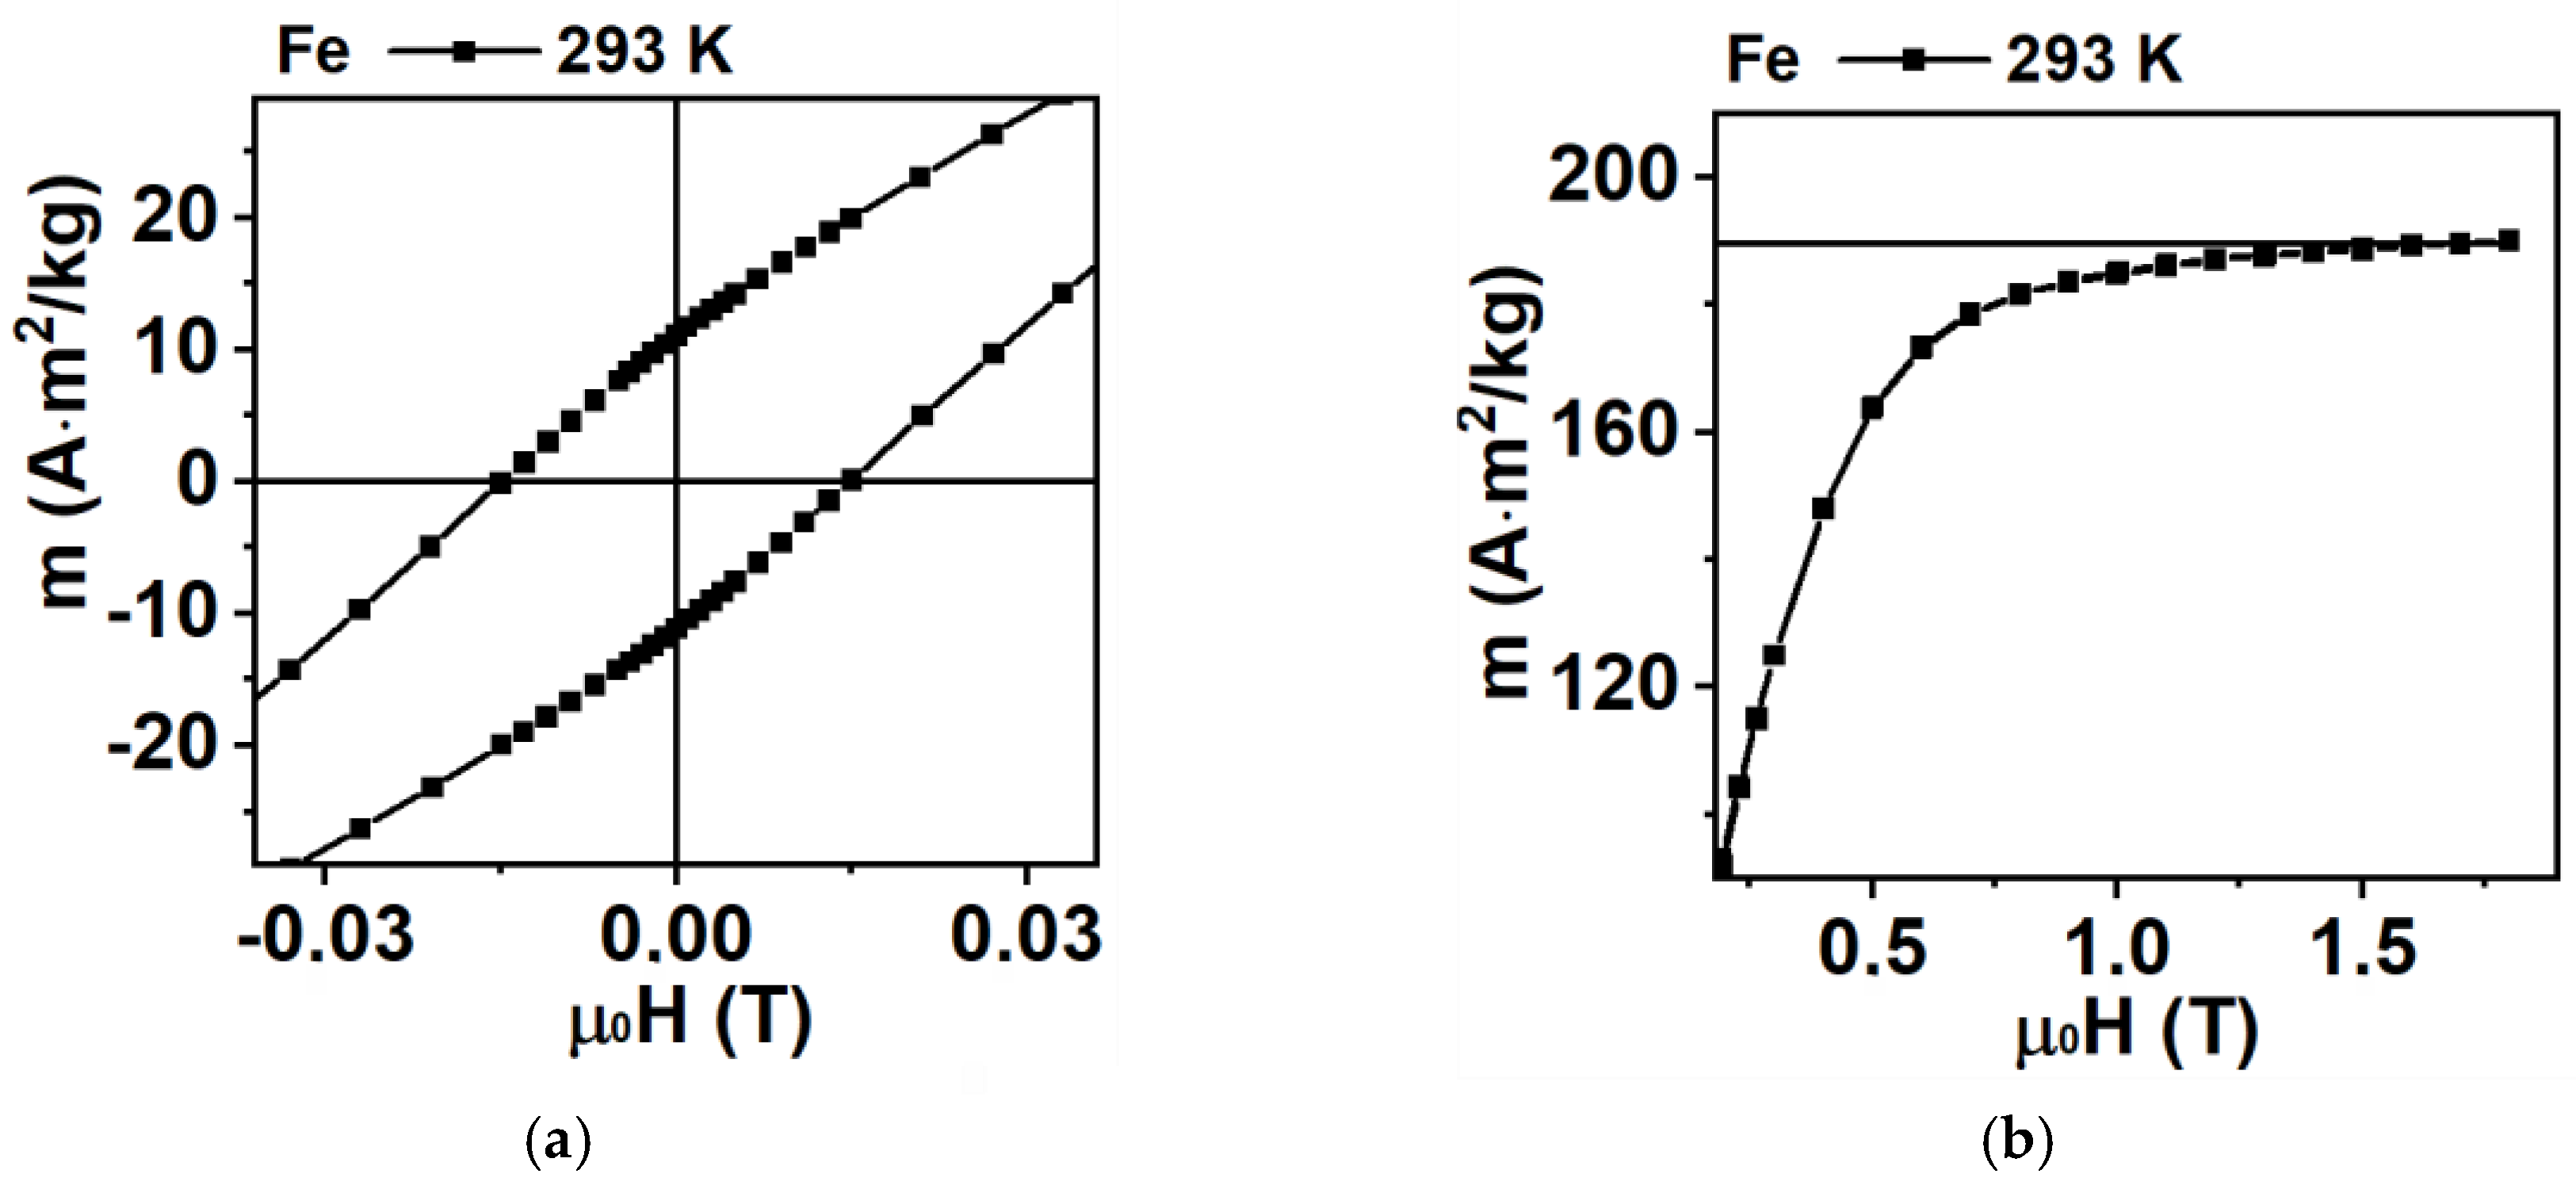
Figure 3.
Micromagnetic model of Fe particles with diameters 10, 30 and 50 nm in remnant magnetization state reached after saturation.
Figure 3.
Micromagnetic model of Fe particles with diameters 10, 30 and 50 nm in remnant magnetization state reached after saturation.
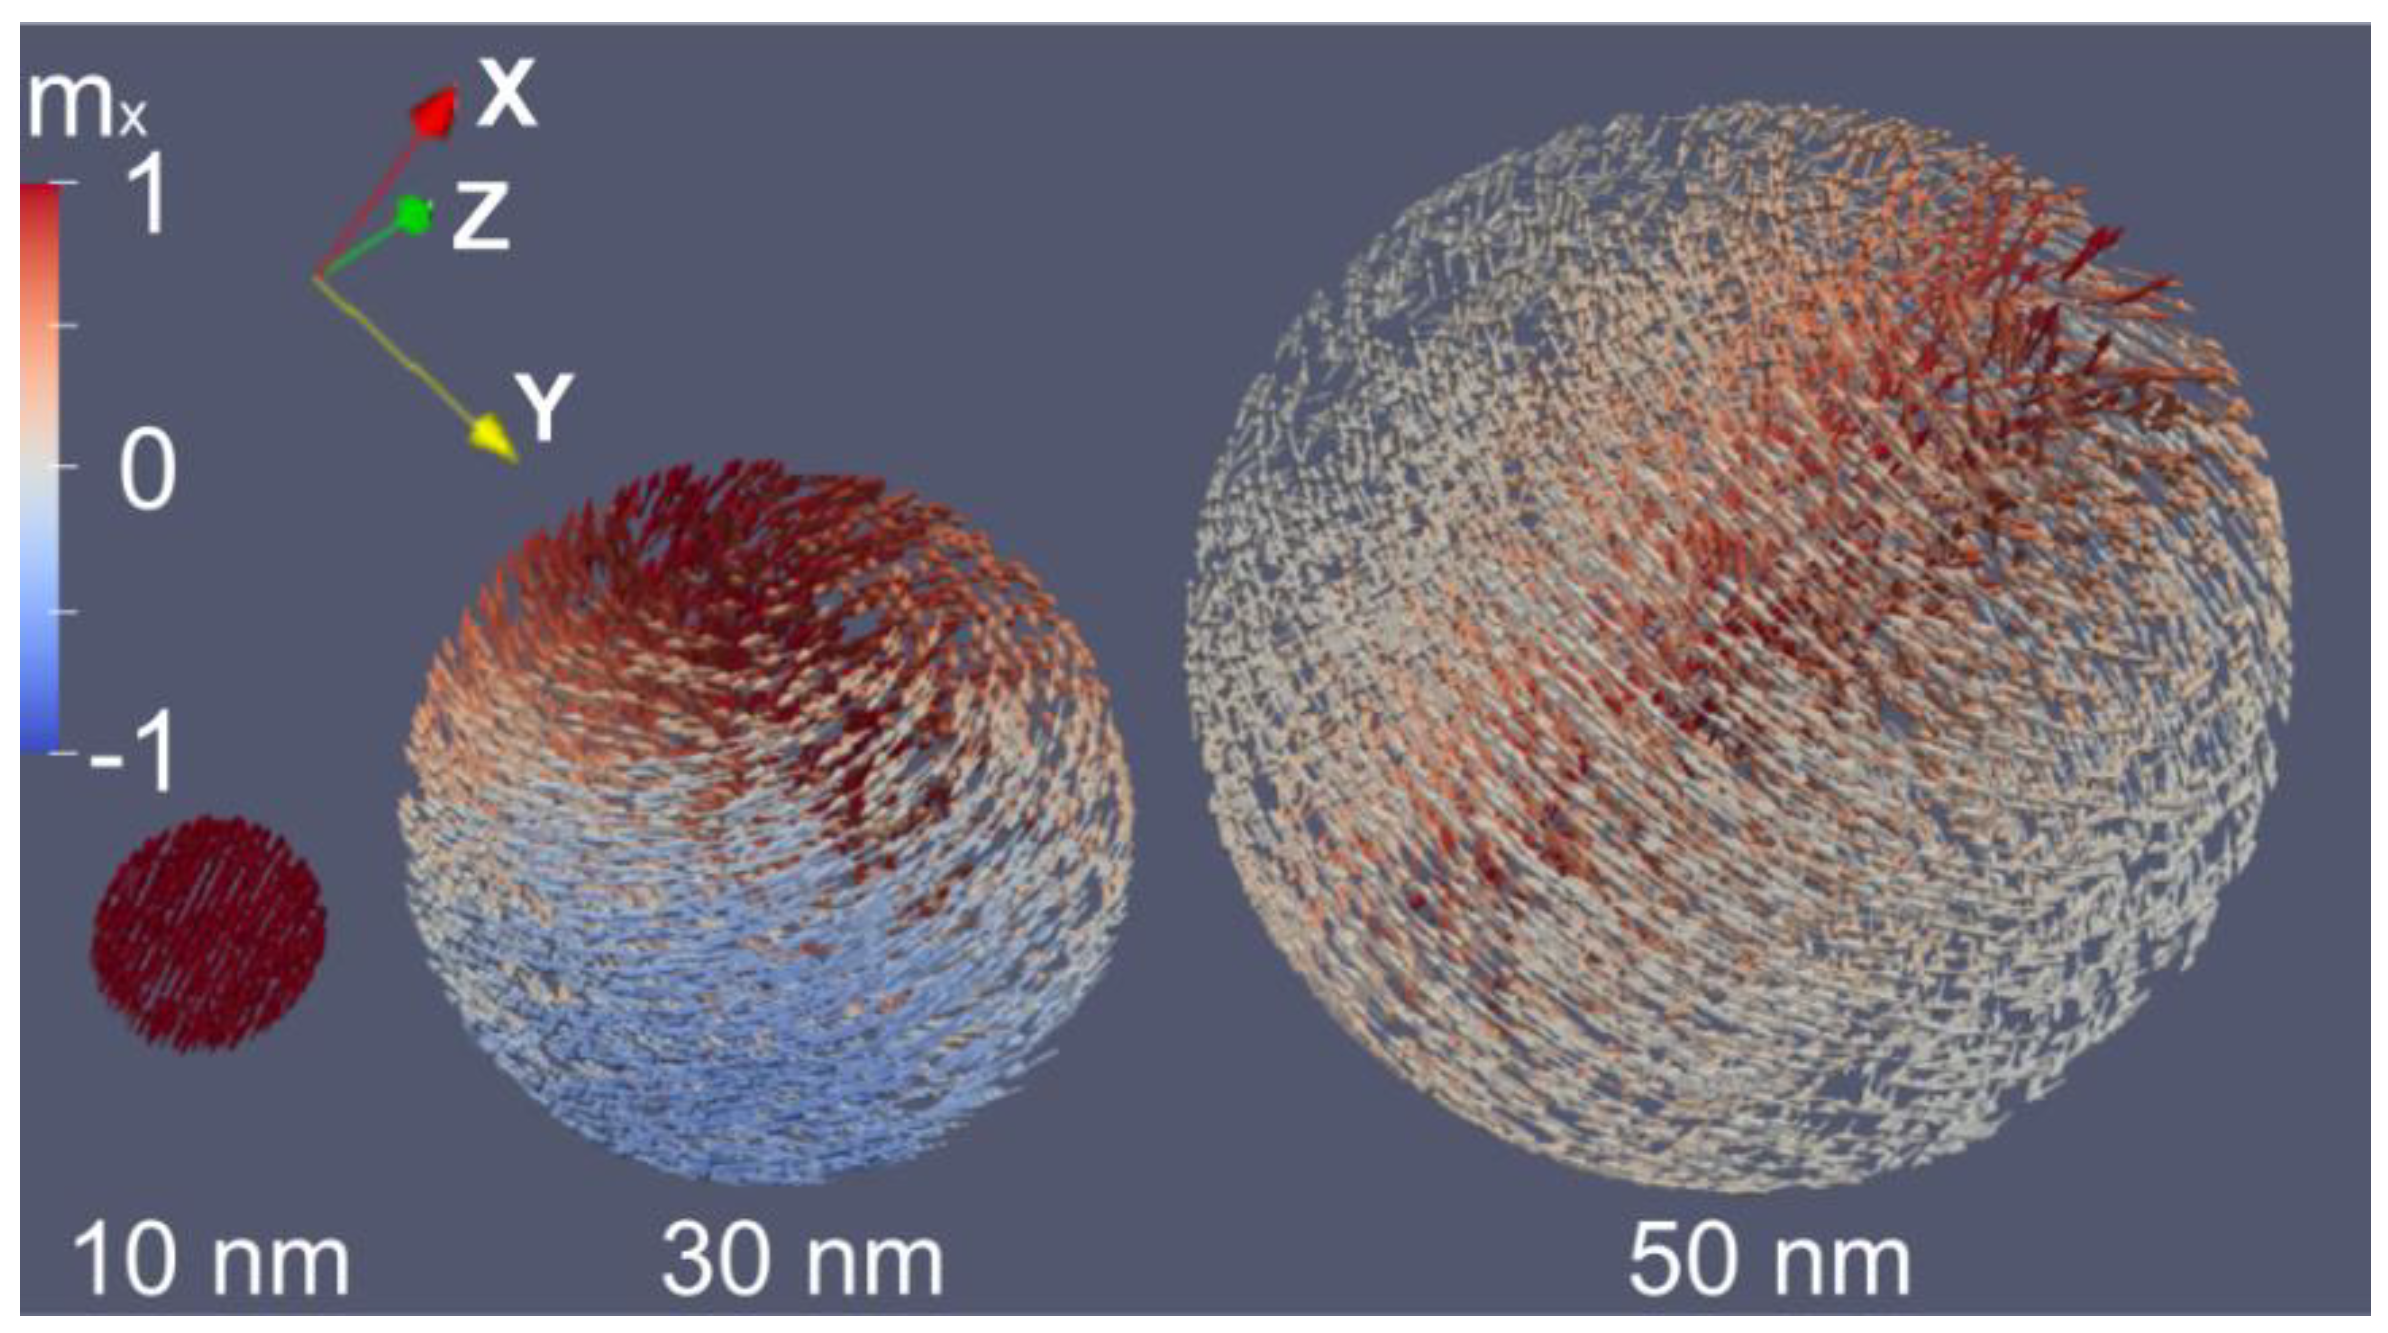
Figure 4.
Magnetic hysteresis loops for individual Fe particles with different diameter (H is directed along one of cubic magnetic anisotropy axis (x)): (a) H from 1 T to -1 T (down) and from -1 T to 1 T (up); (b) H from 1 T to -1 T (down). The numbers correspond to magnetic structures. General view of the magnetic structures of Fe particles (c,d). .
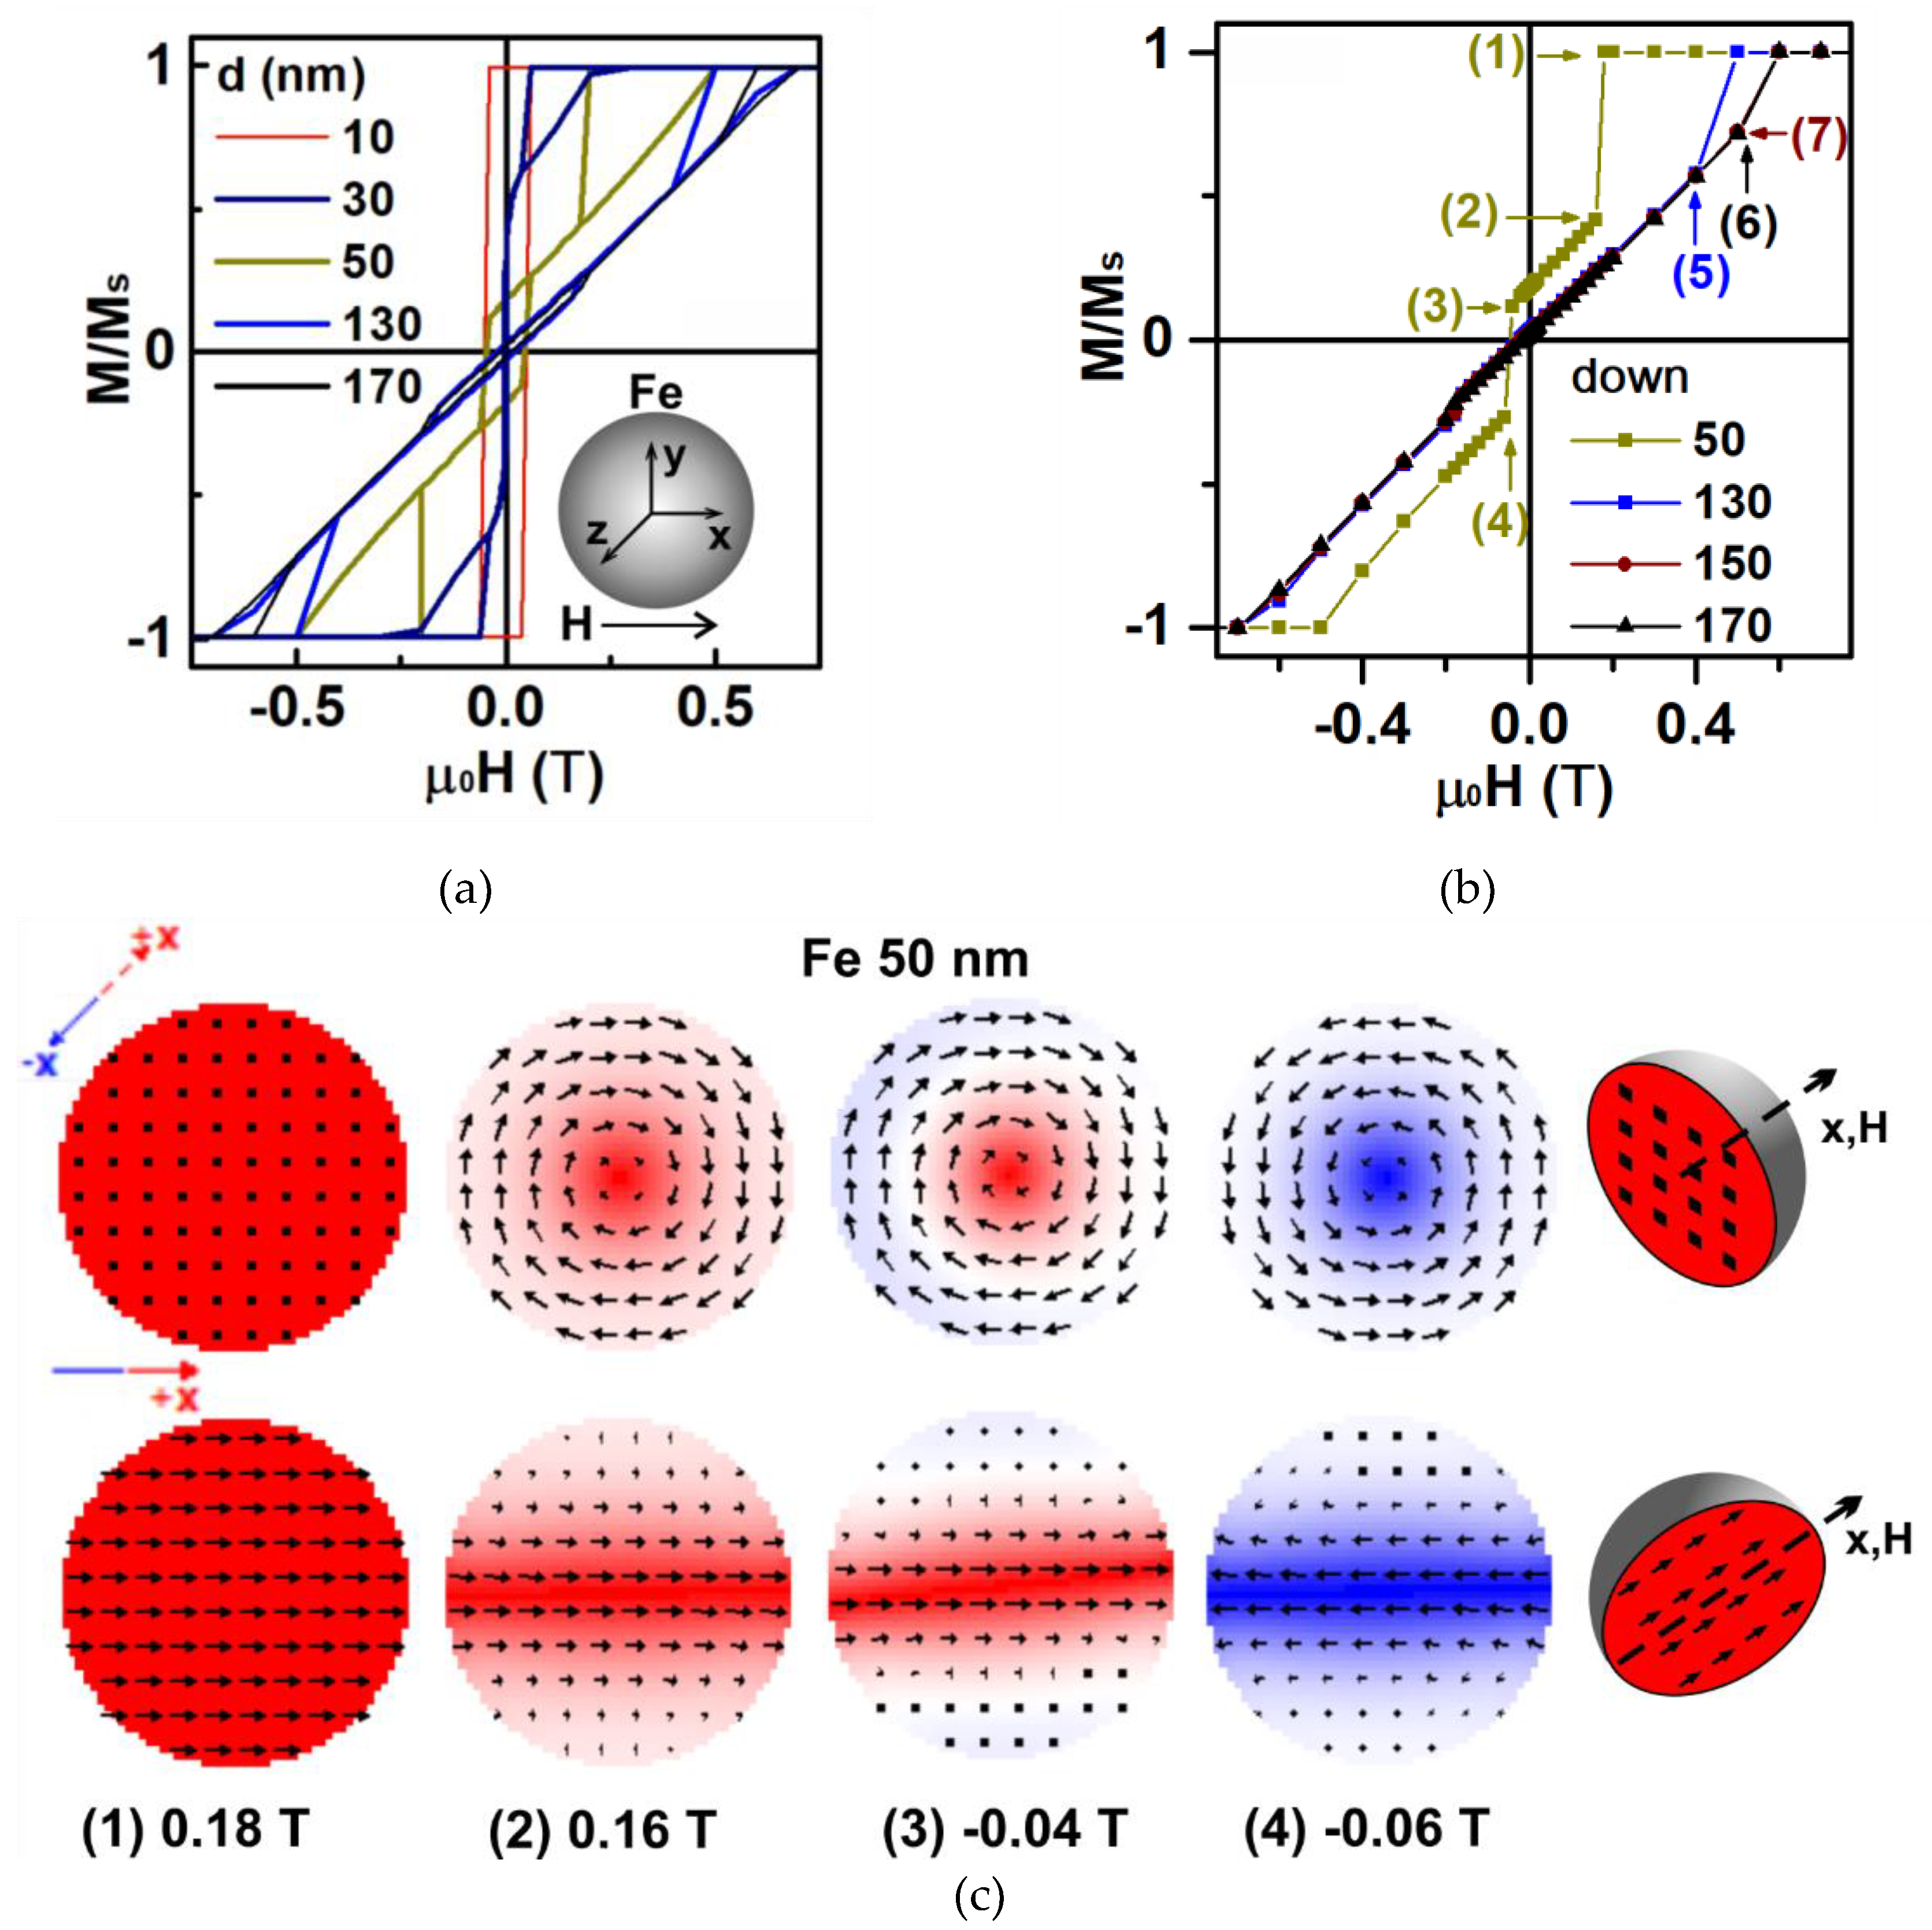
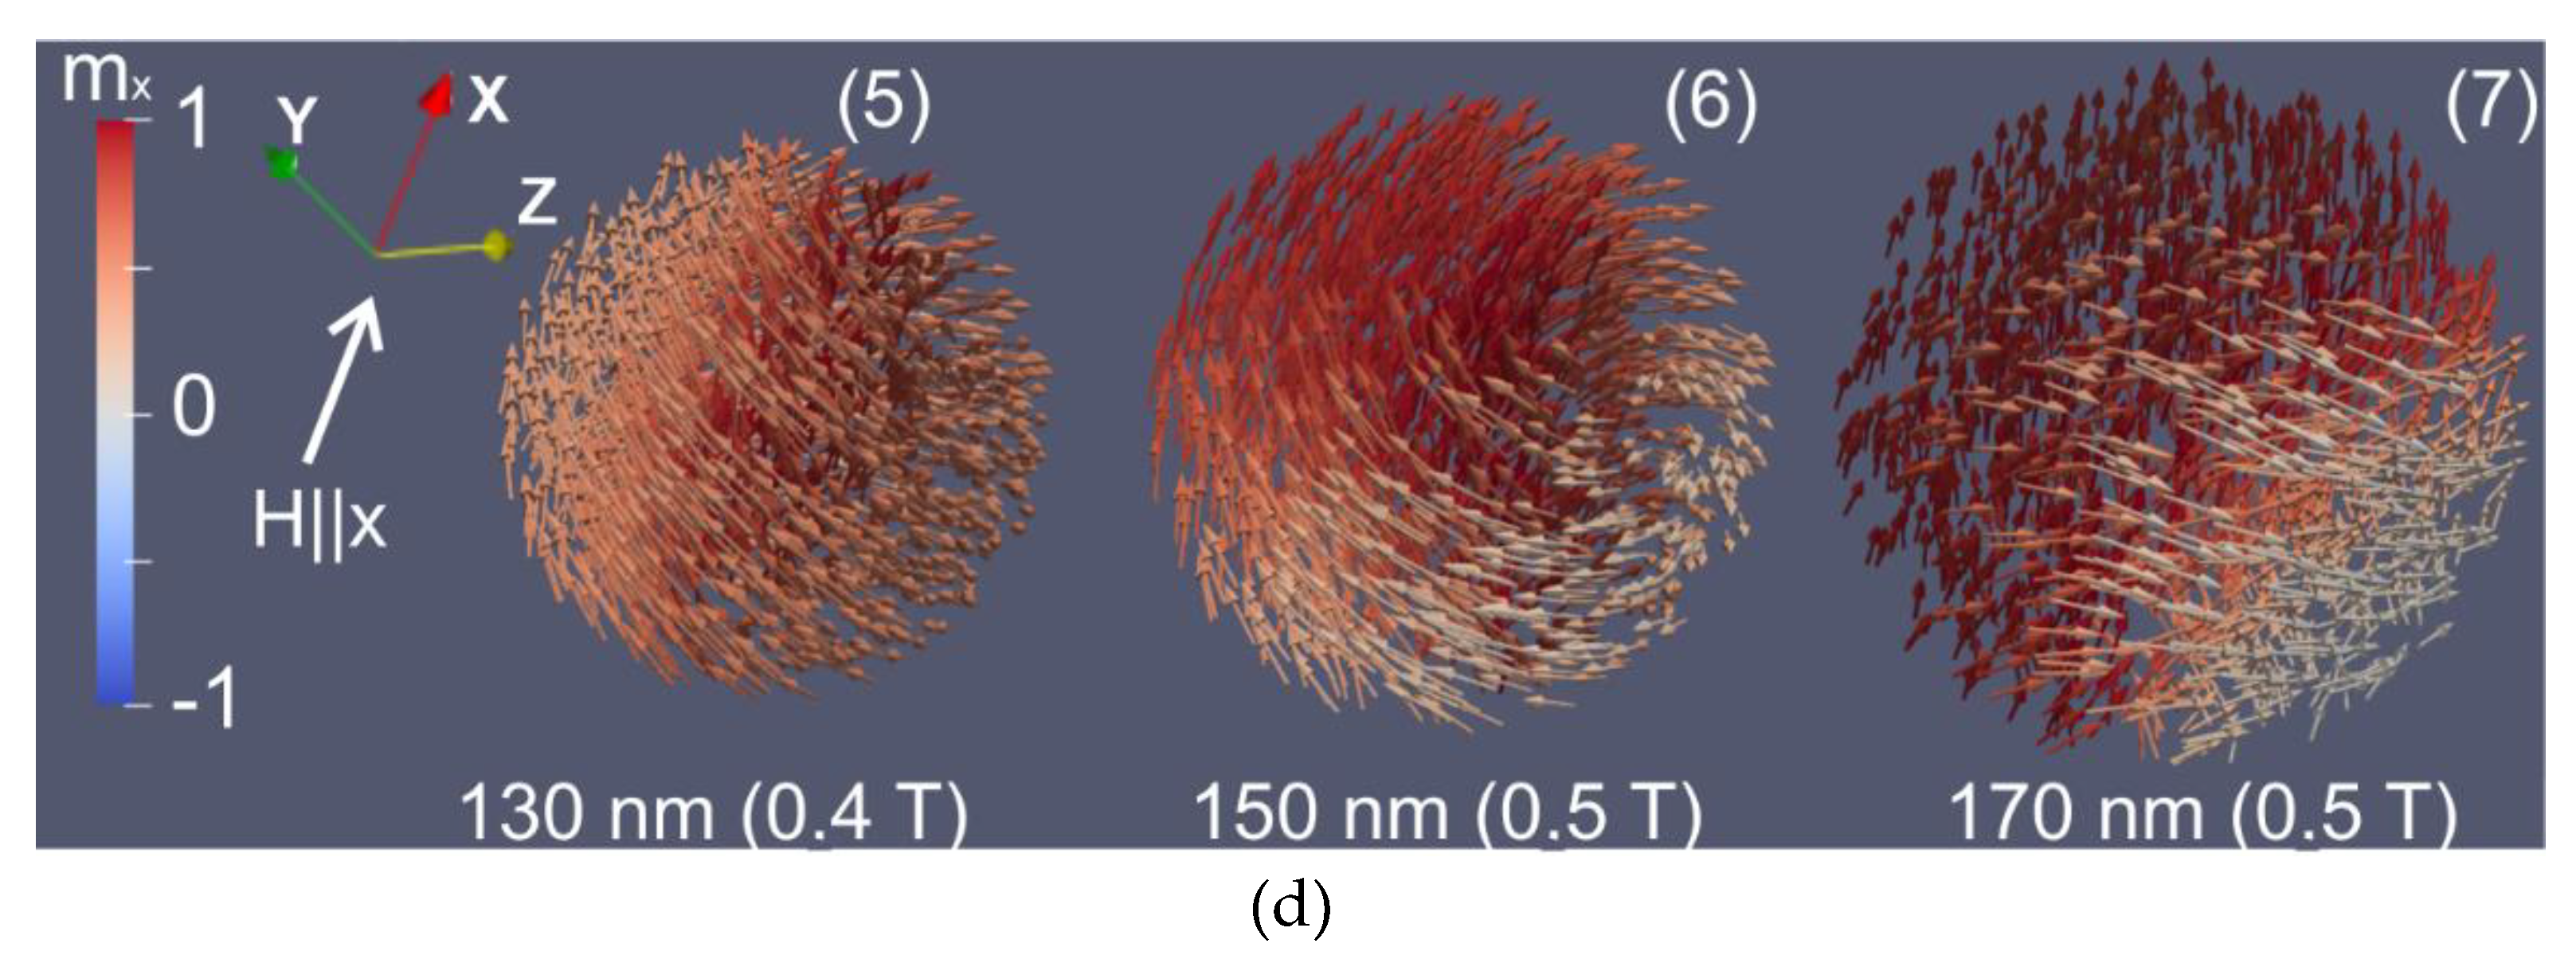
Figure 5.
Magnetic hysteresis loops for ensemble of Fe/FeOx at temperature 293 K: “experiment” – experimental data; “simulation (1)” – simulated magnetic hysteresis loop of ensemble based on experimental weight concentration ratio m/m0 (Figure 1d); “simulation (2)” - simulated magnetic hysteresis loop of ensemble based on refined weight concentration ratio m/m0 (Figure 6d) (a). Simulated magnetic hysteresis loops for N0 nanoparticles with d = 50 nm with random directions of anisotropy axes (b). Refined particles size distribution of Fe/FeOx ensemble: (c) by number; (d) by weight (dn and dw number and volume averaged mean diameters, respectively, N0 - number of particle).
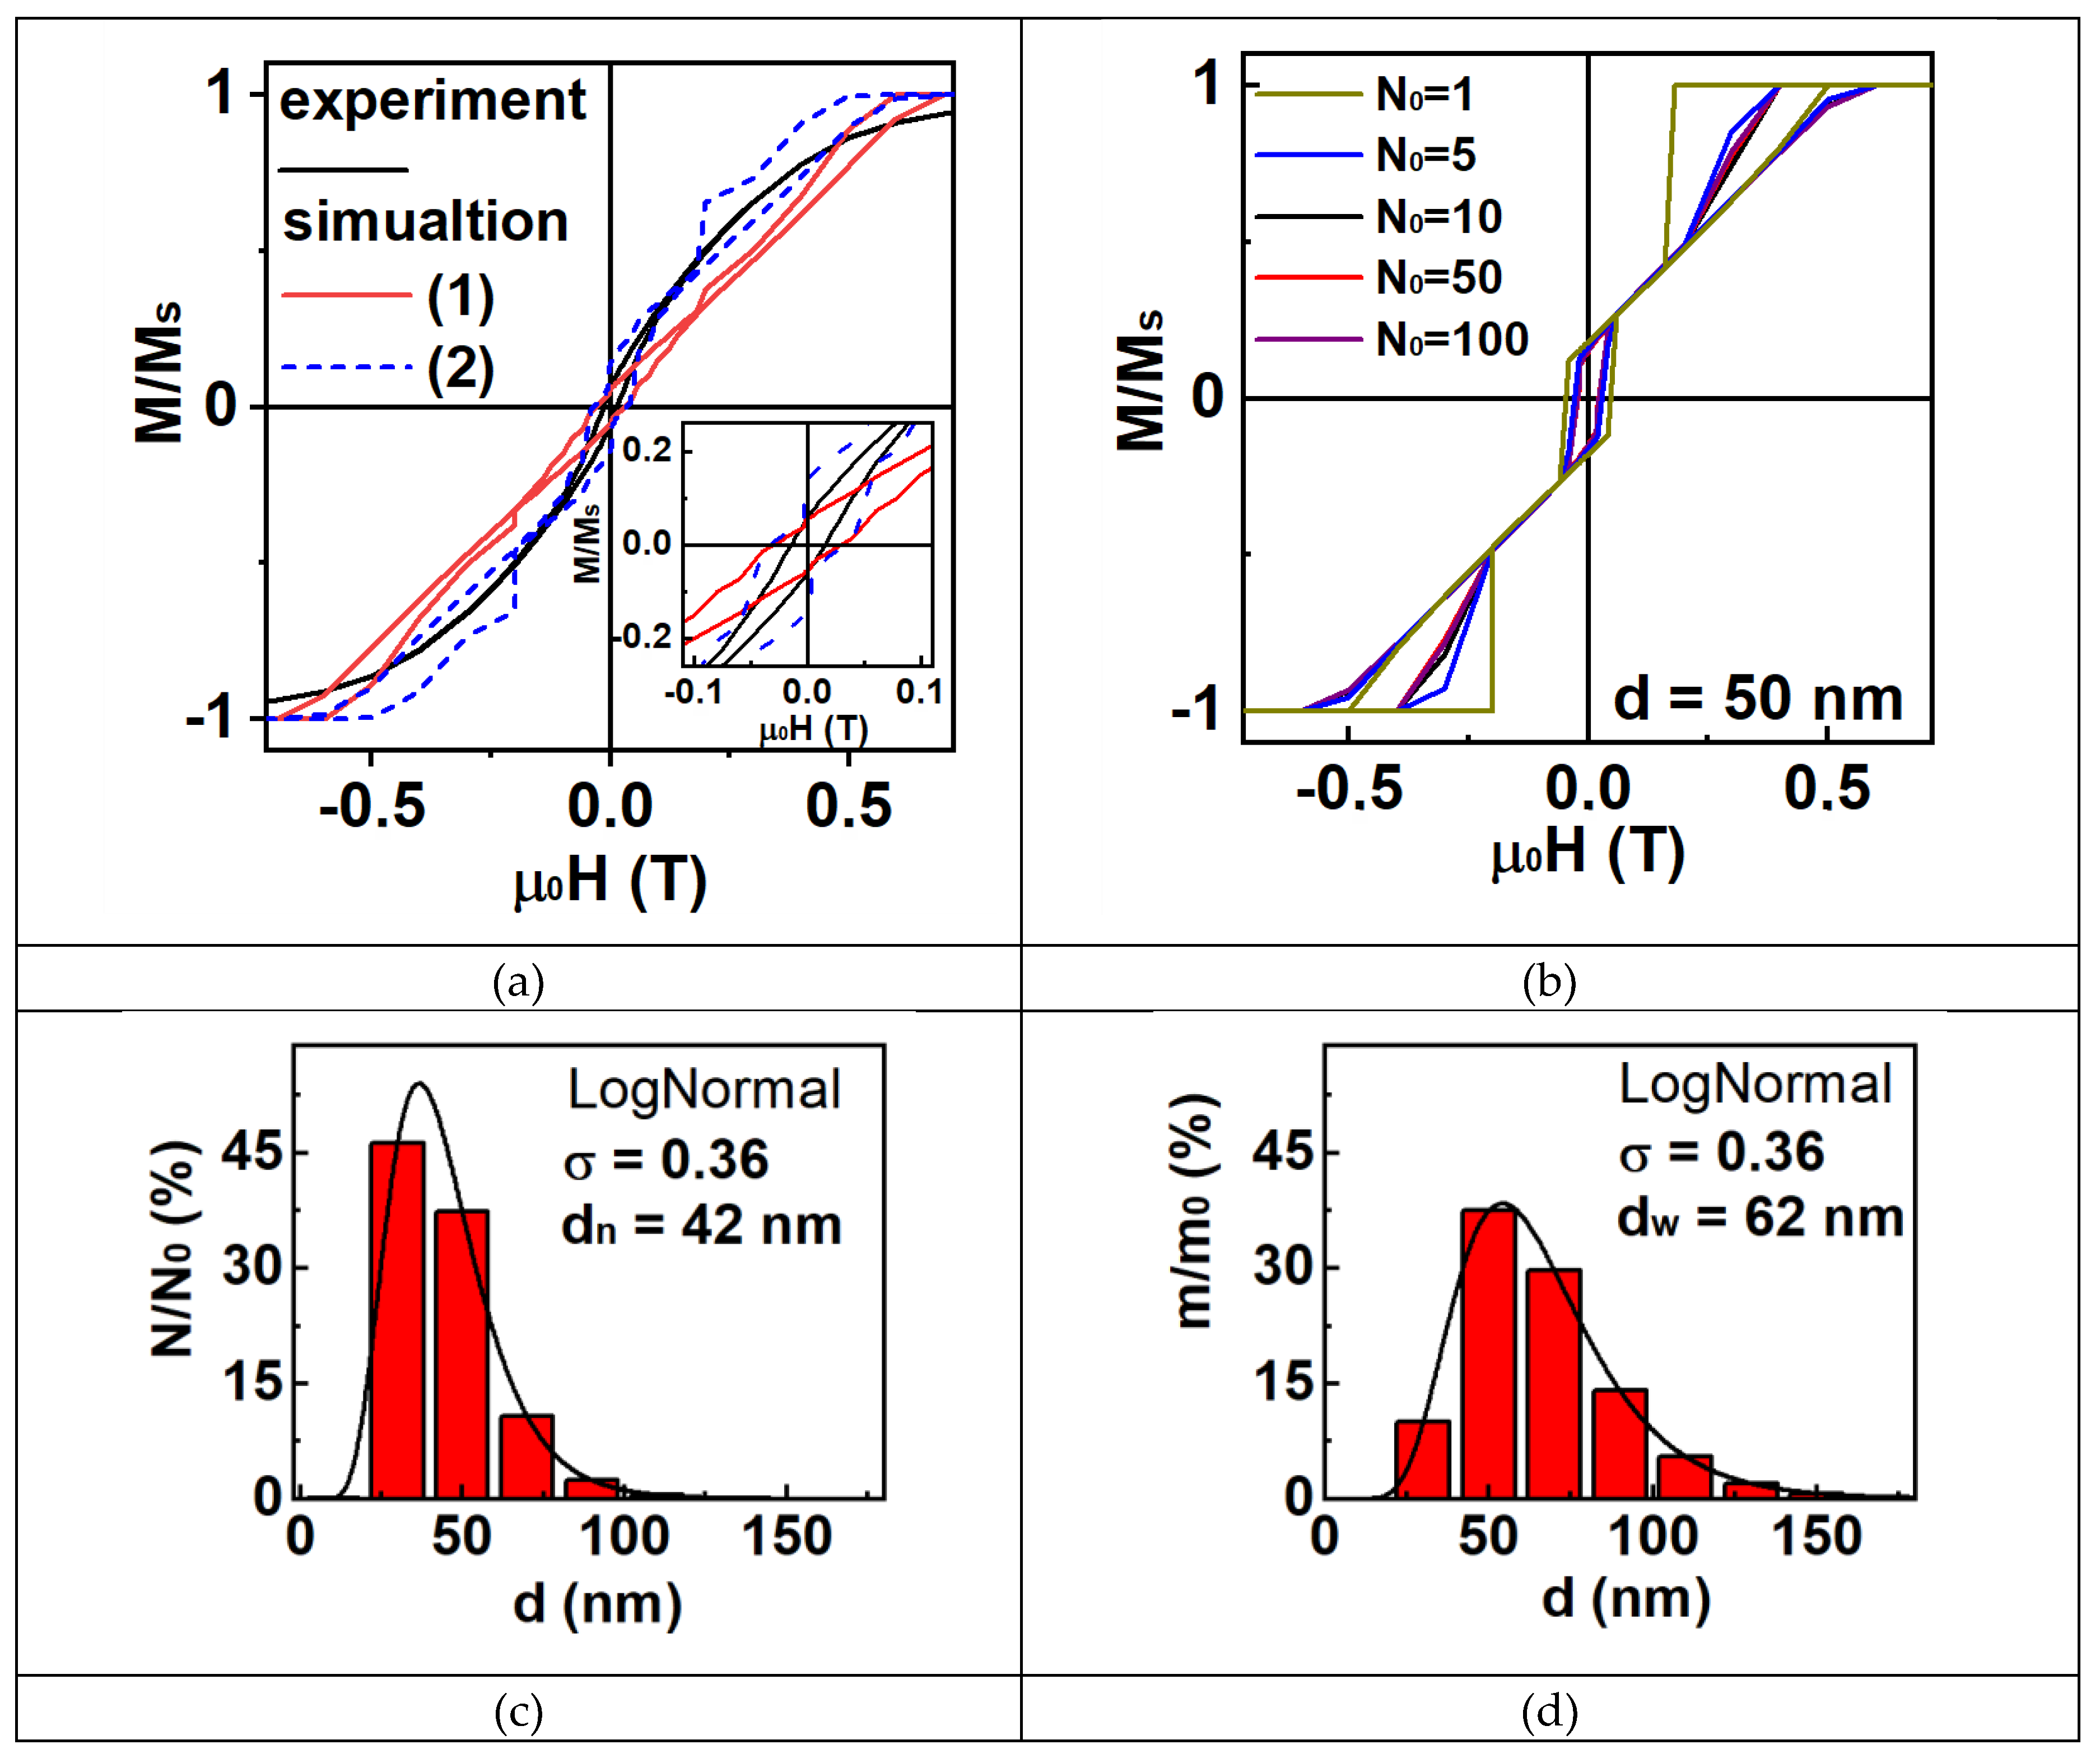
Table 2.
Magnetic properties of Fe powders.
| Batch | ms (H = 1.8 T), Am2/kg | mr, Am2/kg | Hc, mT |
|---|---|---|---|
| Fe (293 K) | 190 | 11 | 15 |
Disclaimer/Publisher’s Note: The statements, opinions and data contained in all publications are solely those of the individual author(s) and contributor(s) and not of MDPI and/or the editor(s). MDPI and/or the editor(s) disclaim responsibility for any injury to people or property resulting from any ideas, methods, instructions or products referred to in the content. |
© 2025 by the authors. Licensee MDPI, Basel, Switzerland. This article is an open access article distributed under the terms and conditions of the Creative Commons Attribution (CC BY) license (http://creativecommons.org/licenses/by/4.0/).
Copyright: This open access article is published under a Creative Commons CC BY 4.0 license, which permit the free download, distribution, and reuse, provided that the author and preprint are cited in any reuse.


