
Submitted:
29 May 2025
Posted:
29 May 2025
You are already at the latest version
Abstract
As urban water network being more and more intelligent, it becomes an urgent problem to solve how to execute resource scheduling and data process in an efficient and adaptable way and not affect real time and service quality. In this paper, we present an Adaptive QoS-Aware Cloud–Edge Collaborative Architecture (A-QCEA) empowered by a combined edge computing), cloud infrastructure, IoT perception network, AI-enhegrated optimization mechanism, and network security strategy to facilitate real-time smart water service management system of next generation. It is highly extended based on the cloud-edge-device three-layer IoT model which exists, and a multi-layer dynamic QoS-aware scheduling scheme and an edge-first data processing strategy are put forward. One is using a small inference engine, which is deployed on the edge device to achieve local data preprocessing and anomaly detection on the water quality and flow rate, thus, reducing data upload delay and cloud load. Second, the cloud layer utilizes flexible containerized computing system, and employs deep reinforcement learning model to forecast the IoT task load and dynamically allocate the computing, storage and network resources according to the different QoS level. Subsequently, low-power IoT communications protocols are implemented for ensuring reliable sensor and pumping station data backhaul to the infrastructure. Thereafter, end-to-end data encryption and edge access control methods are employed in the system, to ensure secure control commands transportation for water utilities. Lastly, in the scheduling core, we innovatively designed a fusion model with graph attention network(GAT) and time-aware LSTM to achieve the context-aware collaborative perception and resource prediction based on multi-source data, and offer the intelligent support for QoS level optimization. Experimental results demonstrate that the developed architecture achieves a remarkable improvement in task response time, resource utilization, and service continuity in the water environment.
Keywords:
edge computing
; cloud–edge collaboration
; smart water management
; QoS optimization
; IoT security
CCS CONCEPTS
Computer systems organization ~ Real-time systems ~ Real-time system architecture
1. Introduction
From the perspective of the wave of digital change and city intelligence, the public infrastructure management system is now being rebuilt. The whole process not only is the dismantling of the information silos resourced from the traditional one, but also the service system must have all-round capabilities including dynamic response, the integration of the multi-source, and flexible scheduling [1]. The critical facility, the water supply network in this case, is not only a public health and ecological security issue, but also a matter of urban operation stability and sustainability. Traditionally, water management is subjected to centralized control and personnel intervention, which limited its dynamic response and emergency disposal capabilities. Especially, in emergencies such as heavy rain sudden rain storms, breakage of the pipe network, and large-scale water pollution incident, the conventional structure of centralized one is hard to implement the short-term effective scheduling and accurate control, so that delay of communication and poor performance of processing become bottleneck [2]. As a result, research on a new water system architecture with the performance characteristics like real-time, distributed, and intelligent has become one of the pressing technical subjects.
With the increase in urban populations and expansion of urban boundaries escalating, urban water resources are being seriously challenged. Meanwhile, more frequent incidents of extreme weather and an increasing danger to water pollution have made matters worse for urban water supply in recent years. For this end, the concept of "smart water" is put forward to achieve the wisdom of the overall process of "perception-transmission-decision-execution" of water resources based on the comprehensive integration of the internet of things (IOT), artificial intelligence (AI), edge computing and cloud service, etc [3]. For one thing, the smart water system has to facilitate the cooperation of massive heterogeneous terminal. On the other hand, it also has to have the functions of intelligent prediction, mining operation rules from the historical data and supporting decision-making optimization on scheduling.
But smart water systems are not without their difficulties as their development and application also encounter several challenges. Firstly, the whole system consists of large scale,high frequency and time varying data collection task, where, the data of different distributed sensing technologies(such as flow meters,water quality sensors,valve condition monitor)are generated constantly within the frequency of second. How to guarantee low communication energy consumption and low latency, when efficient data compression, screening and processing being the central challenge of the system architecture. Second, the business requirements of the water service for QoS are also extremely high [4].Specifically, the control command response of the pumping station must be completed within milliseconds, and any abnormal alarm of the pipe network needs to be real-time and accurate, which requires the system for the response delay is very low, and the reliability is high. End-to-end privacy and security are also needed for data transmission to prevent cyberattacks or control manipulation. When a user is far from the cloud the latency introduced by the network often pushes beyond these tight service metrics of a typical user application.
To address the above challenges, in recent years, academia and industry have started exploring the deep integration direction of the edge computing and the cloud computing. By means of edge computing, data can be transmitted with lower latency and local autonomy can be improved to some extent, because a part of the computing and storage tasks is performed near data sources near the terminals (such as edge nodes of pumping stations, regional gateway, smart sensor and so on) [5]. For instance, when immediate change in water quality is identified, the edge node can make a fast analysis and may enforce an emergency policy locally without waiting on a response from central system. Meanwhile, the global coordinator of the system is also a cloud computing platform, which provides capabilities of large scale modeling and global resource scheduling. With the cloud-edge collaborative scheduling, it not only achieves on-demand resource allocation, but can dynamically adapt to the changes of system load and the difference in service quality level (QoS), to achieve elastic expansion and steady-state maintenance of the overall service. For example, during the 2019 flash flood in London, several urban drainage systems failed due to overwhelmed pumping capacities and delayed alert systems. Similarly, in cities like Mumbai and Jakarta, pipe bursts and undetected water leakages caused by aging infrastructure have led to significant economic losses and public health threats. These cases highlight the urgent need for an intelligent, context-aware water service management architecture capable of responding to real-time fluctuations in water demand and anomalies in distribution networks.
2. Related Work
Above all, Wu et al. [6] designed a high-accuracy digital twin (DT) model structure for the detection and location of anomalies in water networks. By interfacing Digital Thread with several digital models, this work establishes a unified framework to develop a high fidelity digital twin system for smart water networks. Inês Figueiredo et al. [7] the benefits of the Internet of Things and innovations as SCADA, GIS and EPANET, to perform real-time monitoring, decision support and more effective management of the water resources. The system leverages predictive analytics and intelligent control to deliver an enhanced water-energy system and for sustainability optimization of the water system.
Furthermore, Helena et al. [8] proposed a Smart Water Grid (SWG) model using with Digital Twin (DT) technology to enhance monitoring, management, and system efficiency of water distribution networks. Since system parameters including pressure, plant operation, valve operation and headloss are monitored in real-time, DT model can identify various operating conditions and its corresponding state parameters. Krishnan et al. [9] employed along with the IoT -based AI and DL technologies to develop intelligent systems for water management for the sustainable use of fresh water resources. The work evaluates different water-management technologies such as water harvesting, recycling and conservation, and AI-based techniques for water distribution, water quality management and recycling to formulate an effective water management strategy.
Subsequently, Liu et al. [10] highlight the key challenges towards achieving a circular economy for smart water management. Through case studies and fuzzy Delphi techniques, 22 critical barriers were identified which could be classified into three themes: infrastructure and economy, technology, and institutions and governance. Alves et al. [11] proposed intelligent agricultural irrigation management system which uses the concept of the digital twin for the purpose of water conservation. The system communicates with the simulation model by means of real-time communication to simulate the running state of the irrigation system, provide optimized irrigation scheme and save water. Zeng et al. [12] presented an intelligent agriculture water resources management system based on the Internet of Things (IoT) and blockchain. Tag: block chain system Food and water security experts may consider: state agricultural water use monitoring data, in real agricultural water use amount is monitored by a sensor, and through the block chain data in the secure permanent storage, water resource management and effectively ensure the transparency.
3. Methodologies
3.1. Multi-Layer Collaborative Computation and QoS-Aware Optimization
In the real-time management scenario of smart water utilities, the system needs to process sensing data from distributed terminals, such as water quality indicators (such as pH conductivity) and flow data, at a high frequency. Therefore, we build an elastic scheduling architecture based on the cloud-edge-end collaborative computing model, in which the edge layer has preprocessing capabilities, the cloud has learning scheduling strategies, and the terminals realize fine-grained data collection. Let the original index collected by the -th sensor device at time be , and the data vector composed of all devices is recorded as . Edge nodes perform local anomaly detection and compression on to reduce non-critical data uploads. We use the Exponential Weighted Moving Average (EWMA), expressed as Equations 1 and 2:
where is to control the weight of historical information. is the mean of historical data for device i. is the detection residual.
If , the local alarm mechanism is triggered and the upload is prioritized. This mechanism effectively alleviates the pressure on network bandwidth and improves the response efficiency of the edge. At the cloud level, we introduce a reinforcement learning-based resource scheduling model to dynamically manage compute, bandwidth, and storage resources within the system. The system state consists of three parts: device upload load , currently available resource , and quality of service history , which is composed of state vector . The Actor-Critic reinforcement learning structure is used to model the resource scheduling strategy. The Actor Network generates action vectors (resource scheduling decisions), as shown in Equation 3:
where is a policy network with the parameter . The Critic network is used to evaluate the long-term QoS value function in the current state, as shown in Equation 4:
We update the Critic network with the Temporal Difference (TD) error, as shown in Equation 5:
In the meantime, use a strategic gradient to optimize the Actor, as shown in Equation 6:
where is the advantage function, which represents the degree of improvement of the actual return compared to the estimated value. The reinforcement learning mechanism can adaptively sense task density, service level and system load, so as to dynamically allocate resources for different services, especially suitable for burst flow scheduling and edge-cloud collaboration in smart water systems.
3.2. Graph-Attentional and Temporal Context Modeling
In complex water management scenarios, there is a clear structural dependency between various types of equipment such as flow meters, pumps, and valve controllers. In order to improve the global vision of task scheduling, we designed a GAT-LSTM fusion prediction module to extract the spatial topological relationship and time evolution law to assist QoS-driven resource prediction. First, we compose the device into a heterogeneous graph structure , where the node represents an edge device, and the edge indicates a physical or communication link. Each node has a time-varying eigenvector . We use the Graph Attention Network (GAT) to perform the weighted aggregation of adjacent nodes. For any node, its attention score with its neighbor node is defined as Equation 7:
where is the linear transformation matrix. is a vector stitching. is the attention weight vector. The attention coefficient obtained by normalizing is as Equation 8:
The representation of the final node is updated to Equation 9:
In order to fuse the time information, we input for each device maintenance time series and feed it into the LSTM module for modeling, as shown in Equation 10:
where, is the hidden state of time step , which captures the historical trend. We fuse the LSTM output with the GAT representation to obtain joint features, as shown in Equation 11:
It is then input to the multilayer perceptron to predict the next resource requirements (such as bandwidth and computing power) of each node, as shown in Equation 12:
This mechanism enables the system to perceive spatial structure dependence and time evolution dynamics at the same time, which significantly improves the accuracy of resource scheduling under different QoS requirements.
Figure 1 displays the overall deployment of the proposed architecture and its major components including: The edge deployment is situated at top-left in Figure 1, as it is made up of sensors, pumping stations, flow meter, and so on, to perform local preprocessing and early detection of raw water quality and flow data. The preprocessed data is locally encrypted and controlled using the MQTT protocol, and then sent to the cloud. The scheduling core consists of two modules: "Graph Attention" and "Time-aware LSTM" for extracting features from the spatial structure and temporal dynamics degree, respectively.
4. Experiments
4.1. Experimental Setup
Specifically, we use the dataset “Weekly Water Quality Data from the River Thames and its Major Tributaries (2009–2017)”, published by the Environmental Information Data Centre (EIDC) in the UK and collected by British Centre for Ecology and Hydrology (UKCEH), including the water quality indicators (PH, total phosphorus, conductivity, etc.) and their temporal and spatial labels of the Thames River and its major tributaries. It is highly realistic. Here we choose three representative regional locations the sources of the data used to simulate the edge nodes, which are deployed in the architecture of cloud-edge collaboration to verify the QoS-aware scheduling capability as well as the real-time service guarantee performance of system under various traffic and load scenarios.
Each simulation scenario is designed to reflect distinct real-world operating conditions. Specifically, the downtown region reflects a high-density, high-demand environment with frequent fluctuations in consumption, while the industrial park represents irregular but high-load usage patterns due to manufacturing activities. The suburban region, on the other hand, provides a relatively stable, low-intensity demand curve. The data is sampled at 15-minute intervals, and the simulations run continuously for 4 weeks using a hybrid environment of edge nodes emulated on Raspberry 4 (4 GB RAM, Ubuntu) and cloud nodes configured on AWS EC2 t3. The latency, bandwidth consumption, and system stability are recorded across each experiment to evaluate real-world applicability.
To verify the effectiveness of the proposed architecture, four typical comparison methods are chosen:
- Static Cloud-Centric Scheduling (SCS) is a centralized scheduling research, which allows all data to be uploaded to the cloud for direct computing without edge sharing mechanism;
- Edge-Fog Offloading with Heuristic Optimization (EFO-HO) is through heuristic algorithm to optimize task offloading strategy in such a way that a certain degree of resource scheduling self-adaptation is achieved.
- Deep Reinforcement Scheduling Model (DRSM) uses deep reinforcement learning to model the strategy for the resource allocation, with the flexibility and capability of learning and optimization.
- GAT-LSTM without QoS Constraint (GLw/oQ) is to verify the QoS improvement of mechanism that mergers graph neural network and time modeling without integrating QoS constraint.
4.2. Experimental Analysis
QoS Satisfaction Score (QSS) is designed to comprehensively measure whether task latency, bandwidth, computing resources, etc. meet various service levels. As can be seen from the error band Figure 2, the QoS Satisfaction Score of A-QCEA is not only significantly higher than that of the other four comparison methods, but also has a smaller fluctuation range, indicating that it has stronger robustness and stability under different load conditions. Although DRSM is close to A-QCEA at small and medium-sized devices (100–800 units), its performance degradation and volatility are greater than those of A-QCEA as more devices increase. GLw/oQ remains at a medium level in most regions, but its error band width is also large, indicating that the scheduling strategy lacking explicit QoS constraints is not reliable enough in variable scenarios. EFO-HO and SCS have more drastic performance degradation and wider error intervals after the device size exceeds 1000 devices, highlighting the difficulty of traditional and heuristic offloading methods to achieve stable quality of service in large-scale IoT scenarios.
In practice application, the GAT-LSTM fusion model functions in two stages. Specifically, GAT models localized topology correlations between interconnected devices and sends these information on the fly to the cloud scheduler. The LSTM module in parallel pipeline learns the resource usage and task latency of each node in the historical trace. The results from the two branches are then combined to get a single predictive context vector that drives the scheduling engine. This vector drives short-term load balancing as well as long-term resource provisioning. Therefore, the model becomes the foundation of adaptive QoS-driven prediction and cloud–edge orchestration.
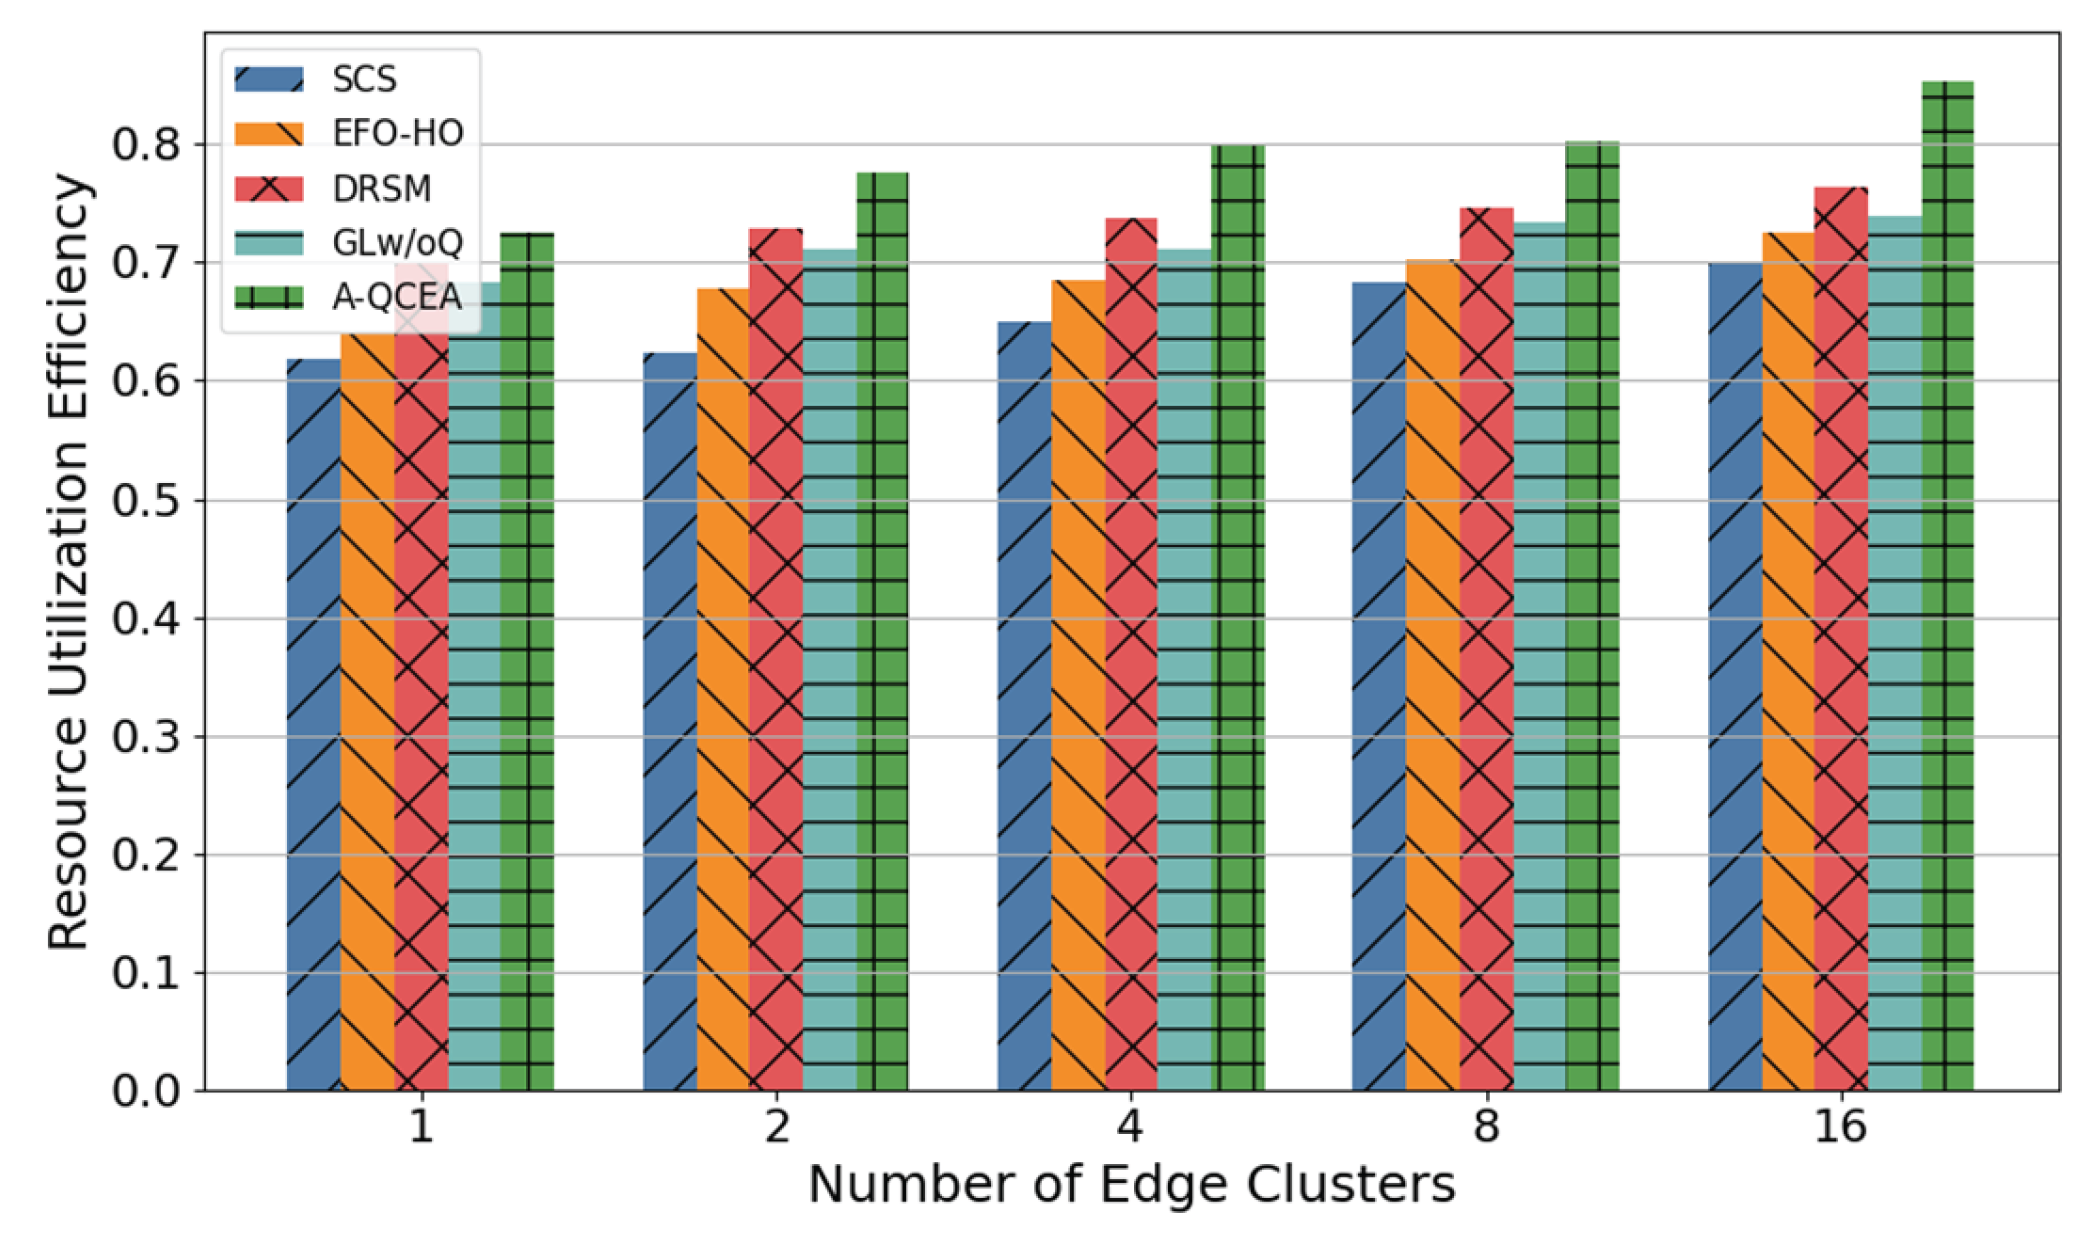
Resource Utilization Efficiency measures the efficiency of the system's use of cloud and edge resources during scheduling, including CPU, memory, and network bandwidth. As the number of edge clusters increased from 1 to 16, the resource utilization efficiency of the five methods showed an upward trend, but the improvement of A-QCEA was the most obvious, reaching more than 0.85 at 16 clusters, which was significantly higher than that of other methods.
DRSM and GLw/oQ followed with final efficiency of about 0.75–0.77, while EFO-HO and SCS grew the most slowly, reaching only about 0.73 and 0.70, respectively. The results in Figure 3 show that the multi-layer dynamic scheduling and context coordination mechanism designed by A-QCEA can more effectively integrate cloud and edge resources when the cluster scales out, and significantly improve the overall utilization efficiency.
5. Discussion
Although A-QCEA shows good performance on current simulation setting, there are still some limitations. Firstly, GAT-based scheduler does not scale well when the number of edge nodes is larger than several thousand, which may hinder global graph construction. Secondly, the current anomaly detection algorithm is based on the stable baseline model, which is not applicable to the occurrence of regime shift. Moreover, edge nodes featuring small memory storage or processing capabilities may not always support light weight inference if new sensory inputs.
6. Conclusions
In conclusion, we propose an A-QCEA model that supports secure end-to-end communication in this environment, allowing for lightweight infer- ence engine, local anomaly detection and data pre-processing on the edge node, and cloud-based elastic resource scheduling through deep reinforcement learning and GAT- LSTM fusion model for multi-source context awareness and forecasting. Experiments are conducted using real weekly water quality data of the Thames River Basin to validate QoS satisfaction, resource utilization improvement and performance superiority over the baseline centralized scheduling, heuristic offloading, pure DRL and non QoS constrained GAT-LSTM schemes in large-scale IoT devices and multi-cluster environments and demonstrates more stability and efficiency than them. In the future, the developed A-QCEA framework may be generalised to address other important public service domains such as smart energy grid, real-time traffic signal control and emergency disaster response networks. These application domains also exhibit common requirements for real-time responsiveness, context awareness, and collaborative resource allocation across edge-cloud-device hierarchies.
References
- Lalle, Y., Fourati, M., Fourati, L. C., & Barraca, J. P. (2021). Communication technologies for Smart Water Grid applications: Overview, opportunities, and research directions. Computer Networks, 190, 107940. [CrossRef]
- Ramos, H. M., Morani, M. C., Carravetta, A., Fecarrotta, O., Adeyeye, K., López-Jiménez, P. A., & Pérez-Sánchez, M. (2022). New challenges towards smart systems’ efficiency by digital twin in water distribution networks. Water, 14(8), 1304. [CrossRef]
- Kavya, M., Mathew, A., & Shekar, P. R. (2023). Short term water demand forecast modelling using artificial intelligence for smart water management. Sustainable Cities and Society, 95, 104610. [CrossRef]
- Jan, F., Min-Allah, N., Saeed, S., Iqbal, S. Z., & Ahmed, R. (2022). IoT-based solutions to monitor water level, leakage, and motor control for smart water tanks. Water, 14(3), 309. [CrossRef]
- Pang, Q., Yang, F., Jiang, Z., Wu, K., Hou, R., & Zhu, Y. (2023). Smart wound dressing for advanced wound management: Real-time monitoring and on-demand treatment. Materials & Design, 229, 111917. [CrossRef]
- Wu, Z. Y., Chew, A., Meng, X., Cai, J., Pok, J., Kalfarisi, R., ... & Wong, J. J. (2023). High fidelity digital twin-based anomaly detection and localization for smart water grid operation management. Sustainable Cities and Society, 91, 104446. [CrossRef]
- Figueiredo, I., Esteves, P., & Cabrita, P. (2021). Water wise–a digital water solution for smart cities and water management entities. Procedia Computer Science, 181, 897-904. [CrossRef]
- Ramos, H. M., Kuriqi, A., Besharat, M., Creaco, E., Tasca, E., Coronado-Hernández, O. E., ... & Iglesias-Rey, P. (2023). Smart water grids and digital twin for the management of system efficiency in water distribution networks. Water, 15(6), 1129. [CrossRef]
- Krishnan, S. R., Nallakaruppan, M. K., Chengoden, R., Koppu, S., Iyapparaja, M., Sadhasivam, J., & Sethuraman, S. (2022). Smart water resource management using Artificial Intelligence—A review. Sustainability, 14(20), 13384. [CrossRef]
- Liu, Q., Yang, L., & Yang, M. (2021). Digitalisation for water sustainability: Barriers to implementing circular economy in smart water management. Sustainability, 13(21), 11868. [CrossRef]
- Alves, R. G., Maia, R. F., & Lima, F. (2023). Development of a Digital Twin for smart farming: Irrigation management system for water saving. Journal of Cleaner Production, 388, 135920. [CrossRef]
- Zeng, H., Dhiman, G., Sharma, A., Sharma, A., & Tselykh, A. (2023). An IoT and Blockchain-based approach for the smart water management system in agriculture. Expert Systems, 40(4), e12892. [CrossRef]
Figure 1.
Adaptive QOS-aware Cloud-Edge Collaborative Architecture.
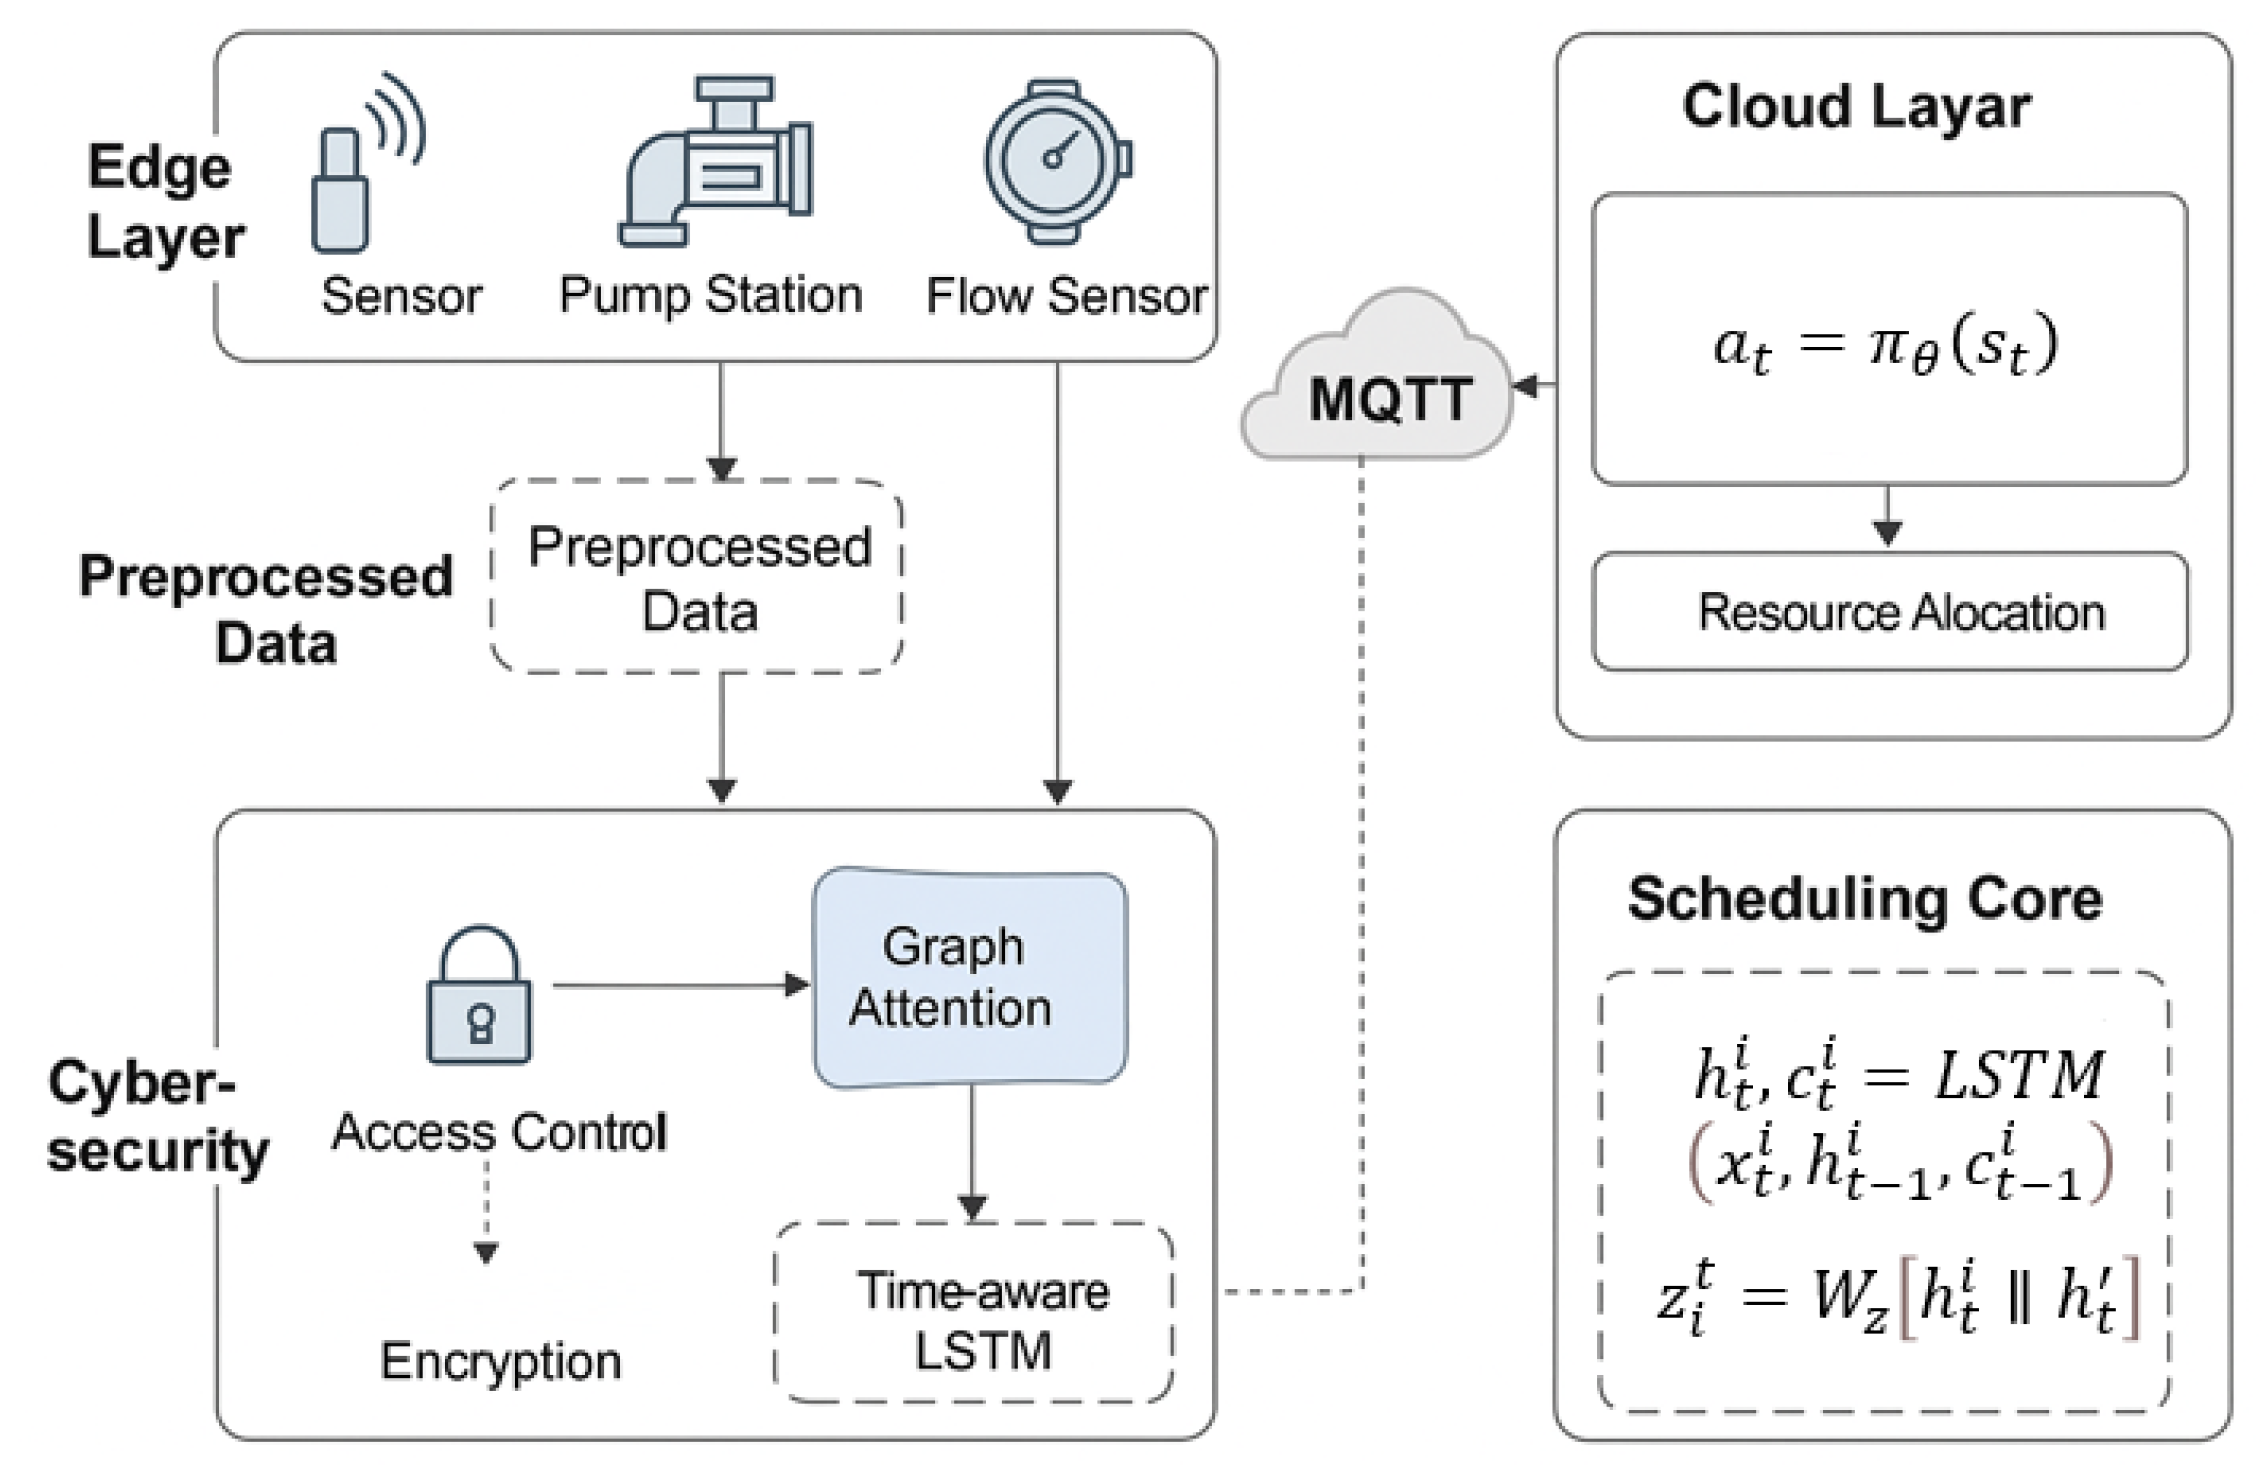
Figure 2.
Comparison of QoS Satisfaction Score with Number of IoT Devices.
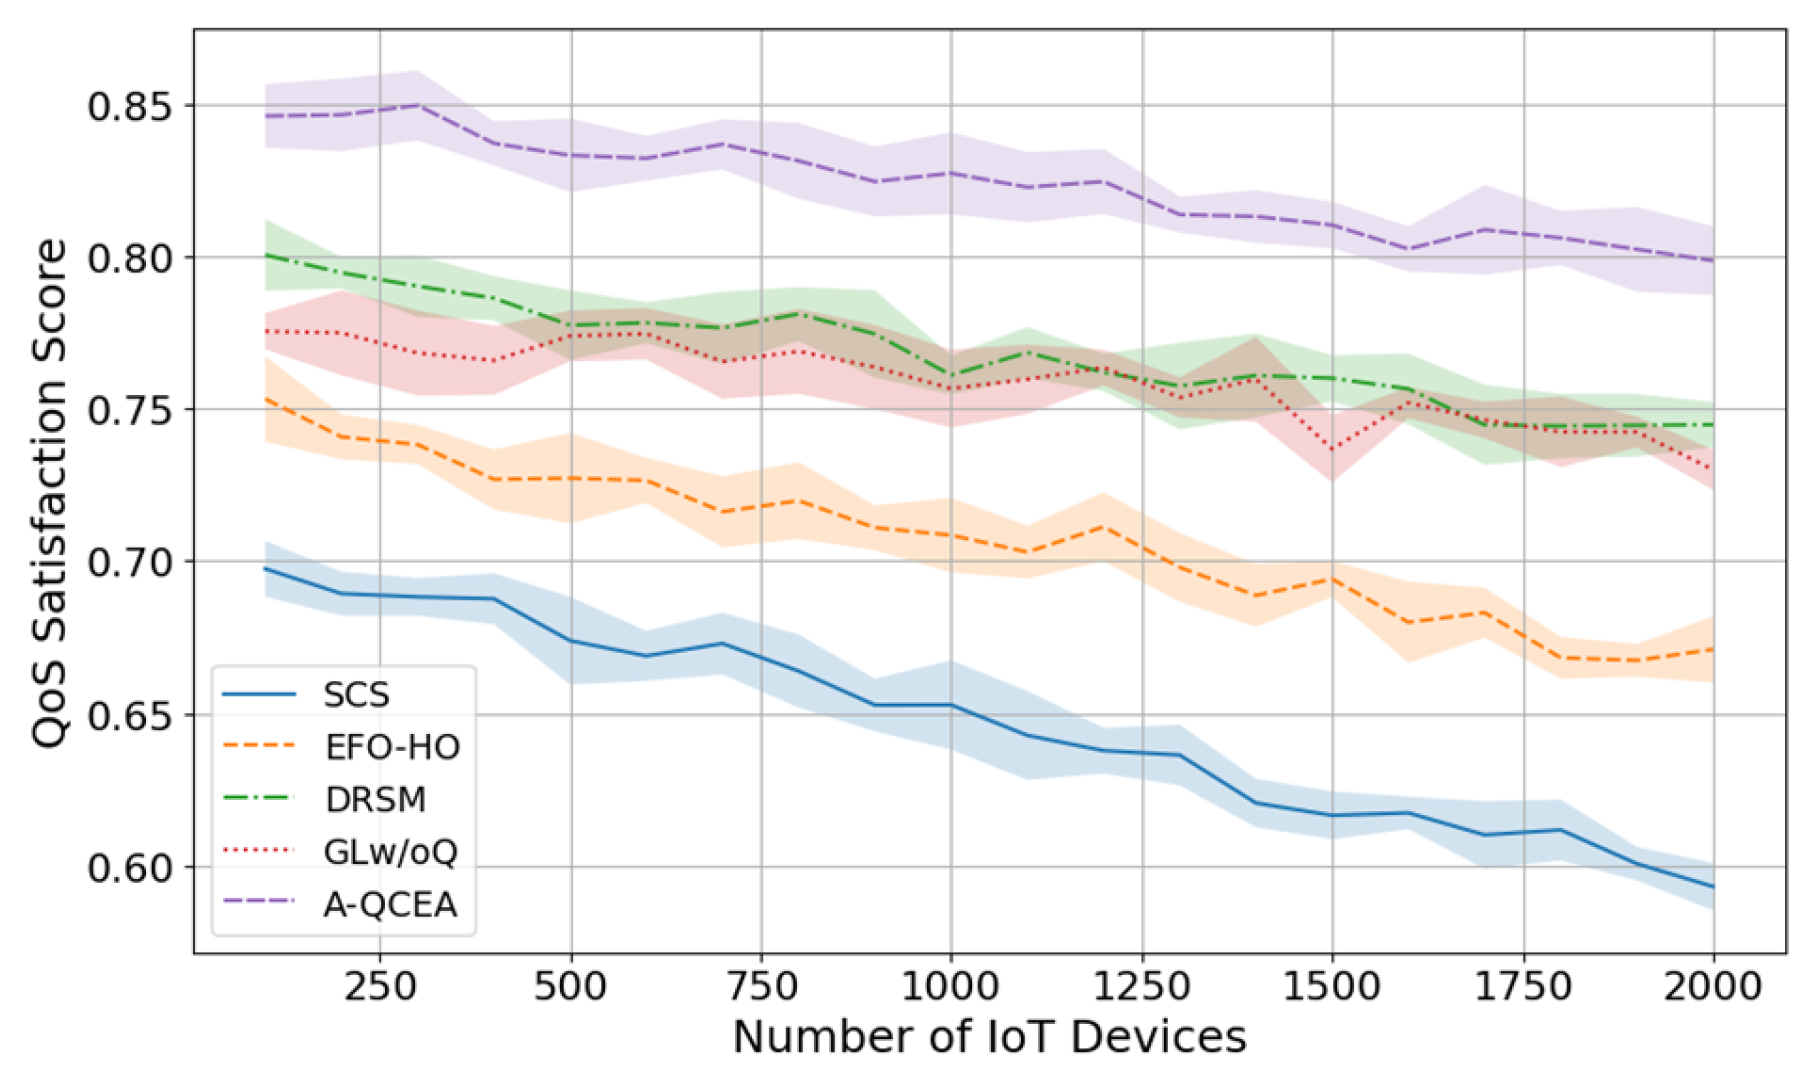
Figure 3.
Resource Utilization Efficiency With Number of Edge Clusters.
Disclaimer/Publisher’s Note: The statements, opinions and data contained in all publications are solely those of the individual author(s) and contributor(s) and not of MDPI and/or the editor(s). MDPI and/or the editor(s) disclaim responsibility for any injury to people or property resulting from any ideas, methods, instructions or products referred to in the content. |
© 2025 by the authors. Licensee MDPI, Basel, Switzerland. This article is an open access article distributed under the terms and conditions of the Creative Commons Attribution (CC BY) license (http://creativecommons.org/licenses/by/4.0/).
Copyright: This open access article is published under a Creative Commons CC BY 4.0 license, which permit the free download, distribution, and reuse, provided that the author and preprint are cited in any reuse.


