
Submitted:
19 May 2025
Posted:
20 May 2025
You are already at the latest version
Abstract
Electrical cabinet fire scenarios constitute a significant risk within nuclear facilities, emphasizing the need to mitigate uncertainties in risk evaluations. This research highlights progress in understanding the parameters that affect the peak heat release rate (HRR) in electrical cabinet fires. A computational fluid dynamics (CFD) model, specifically Fire Dynamics Simulator (FDS), was used to model the ignition source (pre-ignition heating) and flame spread inside of the electrical cabinet (e.g., electrical cables, electrical boards, sensors, transducers, etc.) that influence peak HRR. Owing to the disparate nature of electrical cabinet parameters, only a few factors have been experimentally explored and statistically analyzed to assess their impact on the peak HRR. A simulation matrix was created using statistical experiment design (SED) and ANOVA based statistical analysis to quantify the relative importance of parameters. This resulted in a series of 51 simulations to quantify the impact of cabinet volume, combustible material surface area, cabinet vent area, ignition source, ignition source elevation, and combustible material burning characteristics (e.g., heat release rate per unit area (HRRPUA), burning duration). Additionally, a series of 12 simulations was also conducted to explore how the combustibles arrangement and the ignition source elevation influence the peak HRR inside the electrical cabinet. The findings revealed that the configuration of combustibles and the placement of the ignition source play a pivotal role in determining the peak HRR. The most impactful parameters were ignition source (HRRb), ignition source elevation (zb), HRRPUA, and surface area of combustible materials (walls and ceilings). Among the factors affecting time-to-peak HRR, ignition source (HRRb) and combustible burning duration (tc) were the most significant. A partition screening analysis was performed to determine the conditions under which the parameter-ventilation area becomes more significant. The results indicate strong predictive capability and reliability in capturing the dynamics of fire HRR, representing a significant advancement in the field of nuclear safety.
Keywords:
electrical cabinets
; ignition source
; peak heat release rate
1. Introduction
Electrical cabinet fires represent a significant hazard, often originating from electrical components in nuclear power plants (NPP), chemical industries, telecommunication buildings, and other thermal power plants. A large part of electrical fire hazards is attributed to electrical cabinets as well as safety equipment exposed to a fire environment. These fires can occur in rooms that harbor electrical components, including switchgear, control panels, main control boards, and distribution panels [1], with electrical cabinets being cited as the reason for the vast majority of electrical fires. Based on a statistical analysis conducted on 2,111 fire events, cataloged in the Electric Power Research Institute Updated Fire Event Database (EPRI-FEDB) in [1], about 540 fire events were labeled as challenging, with the fires initiated within an electrical cabinet representing a majority of 40.7 %. This number is especially high considering electrical cabinets are equipped with combustible electrical components and have natural or mechanical ventilation. There is a significant variation in the size and arrangement of combustible components (e.g., cables and computer boards) within electrical cabinets, which can have an impact on a fire’s overall peak HRR. For most fire model applications, the HRR of the fire is the most important parameter to specify. The HRR, measured in kilowatts (kW), is the rate at which the combustion reaction produces heat. Evaluating both the HRR and overall fire propagation behavior is critical for conducting fire risk assessments.
A few experiments conducted previously investigated the influence of cabinet factors on fire conditions and sought to understand their relationship to response variables, such as peak and time-to-peak HRR. Two studies conducted by Valtion Teknillinen Tutkimuskeskus (VTT) and Sandia National Laboratories (SNL) used full-scale electrical cabinets with specific dimensions and varied ventilation areas [14,26]. Closed cabinet layouts with definite sizes were investigated in the VTT testing where the ventilation conditions considered ranged from fully open equipment racks to fully enclosed racks. The tests demonstrated that ventilation into the cabinet has a major impact on peak HRR [6, 7]. Additionally, another study conducted by the Institute de Radioprotection et de Sûreté Nucléaire (IRSN) ascertained that the ventilation area influences cabinet HRR [3]. Avidor et al. employed cabinets of definite size (undivided and shelved) with ventilation openings ranging from 0 to 0.0091 m2 to determine whether fires emanating from a ignition source can be sustained inside a cabinet. It was noted that when cabinet volume was halved by accommodating a shelf, a 50 kW propane fire was sustained with significantly lower vent openings [4].
The aforementioned studies provide a wealth of insight into electrical cabinet fires; however, limited experiments have been conducted in this area to determine the influence of combustible fuel arrangement on the overall HRR of cabinet fires. These experiments usually place combustible fuel in the center of the cabinet or along the side walls and ignite the combustibles with an ignition source. Studies conducted by HELEN, VTT, and SNL [10,14,26] used full-scale electrical cabinets in the fire tests with a range of cabinet sizes and varied combustible fuel configurations of electrical cabinet fires (The HELEN-FIRE program, initiated in 2014, sought to address the lack of experimental data on HRRs in electrical cabinet fires.) A total of 112 full-scale experiments were conducted to measure the HRR of fires in a variety of electrical cabinets typically found in nuclear power plants. Using data from the HELEN-FIRE and other test programs, a new classification system was developed [7] that estimates HRR probabilities based on the cabinet type, volume, combustible content, and ventilation area. This classification is easily established by external visual inspection.
Electrical cabinets with large and medium volumes can be further subdivided according to combustible load, cable materials, and ventilation area so that the expected peak HRR values can be estimated using visual inspection only. However, in operating plants, visually inspecting the interior of an electrical cabinet is often impractical. Thus, developing a simple method to estimate the maximum possible peak HRR for a closed door (with ventilation), without the need to open it, would be beneficial [22, 26]. The HELEN-FIRE tests varied the combustible arrangements by adjusting the number of cables, circuit boards and connectors, and wiring. The results showed that the fire behavior is affected by the combustible fuels and their arrangement inside the cabinet. However, the complexity of the arrangements and lack of detail on the combustible surface area, made it difficult to understand what parameters were the most impactful in these fires. Understanding these parameters would shed light on the critical parameters that influence fire growth and intensity, and improve the design of electrical cabinets, where these fires pose significant risks.
Other electrical cabinet fire experiments have been conducted using simpler, well-defined combustible fuels and arrangements. IRSN conducted a series of 25 electrical cabinet fire experiments under a hood calorimeter to measure the effect of different parameters on target values, including peak HRR, steady state HRR, and time-to-reach flashover conditions [3]. In these experiments, the percentage volume occupied by fuels, such as polymethyl methacrylate (PMMA), polyvinyl chloride (PVC), and polyethylene (PE), were monitored on the cabinet HRR while the total mass occupied by the fuels remained constant at 10 kg [3]. The effect of combustible configuration was also investigated during the experiments; however, the results did not fully capture the impact of different material properties, such as ignition temperature, burning duration, surface area, and HRRPUA. CFD modeling has also been used to explore the impact of different variables on the cabinet fire HRR. FDS was used [5], to predict the effects of combustible fuel details including surface area, HRRPUA, burning duration, ignition temperature, and combustible configuration. While the experiments provided valuable insights into the role of combustible configuration, they lacked the ability to quantify the influence of material properties, which is where computational modeling becomes essential.
1.1. Significance and Objectives
The goal of the current research is to conduct a computational study to quantify the importance of parameters impacting electrical cabinet fire HRR. However, past electrical cabinet fire experiments did not methodically examine the effects of combustible arrangement and the ignition source location (bottom, corner, top) on peak HRR [11]. To address this, a series of simulations were carried out to evaluate how these parameters affect the cabinet peak HRR by changing the position of combustibles. The partition screening is used to analyze HELEN [10] fire data, revealing the specific conditions under which the peak HRR is likely to increase. Additionally, it identified scenarios where the ventilation area becomes a critical factor alongside the combustible surface area, providing an interpretable insight into these relationships within the context of this research. A simulation matrix was developed using fractional factorial statistical experiment design (SED) to screen the relative importance of parameters on peak HRR and time-to-peak HRR for a fixed combustible configuration inside the cabinets. ANOVA were applied to examine the main effects of parameters on the peak HRR. A total of 12 simulations were performed to explore the impact of combustible configuration on peak HRR and time-to-peak HRR.
2. Methodology
Statistical analysis and simulation matrices were developed for the systematic examination of how various parameters affecting both the peak HRR and time-to-peak HRR on fire behavior within the cabinet. Figure 1 (a-f) presents histograms of key cabinet parameters, providing an overview of the dataset used for subsequent simulations and analysis lies in their ability to provide critical input parameters for fire behavior simulations, ensuring realistic modeling.
Datapoint distributions for cabinet volume (height, width, and depth) based on cabinet width, ventilation area, HRRPUA, burning duration, ignition source, and ignition source elevation were developed using data from [1-3,11-14]. The HRRPUA and burning duration of the combustible materials were quantified using reported cone calorimeter test data [6-9]. The geometric details of the cabinets were derived from experimental studies by HELEN, VTT, and Institute de Radioprotection et de Sûreté Nucléaire (IRSN), [10-14,3], which includes the height, width, depth, and total ventilation area of the cabinets along with their combustible surface area. A series of 41 experimental tests were identified, each featuring unique geometric characteristics in Figure 1 (a-c), which also illustrates the distribution of cabinet heights, widths, and depths, respectively. The average depth and width of the cabinets used in the fire experiments were 0.6 m and 0.8 m, respectively. The height of the electrical cabinets ranged from 1.2 m to 2.4 m, and this variation was utilized to adjust the cabinet volume in the simulations. Using this information, the cabinet volume in the simulations will be fixed and vary between 0.72 and 1.25 m3. For variable and fixed configurations, the width will change from 0.6 to 0.9 m and the height will be set at 2 m for the simulations. The ventilation area considered includes both the bottom and top vents of the cabinet. In some cases, the total ventilation area also accounts for door open, door closed, and holes in the cabinet’s ceiling [10,18] ranging from 0.05 to 0.25 m2. Based on the data in Figure 1 (a-c), the ventilation areas considered ranged from 0.04 to 0.16 m2. The combustible surface area was determined from the surface area of the cables and computer board located inside the cabinet during the experiments. The combustible surface area data was determined from 36 experiments with the distribution shown in Figure 1d. The range in the total combustible surface area was taken as 0.6-1.8 m2, which represented 64 % of the data.
Data from HELEN fire experiments were further combined with CHRISTIFIRE experiments to obtain detailed combustible burning information. These experiments provided data on heat release rate per unit area (HRRPUA), burning duration, heat flux, and ignition time. A total of 56 unique experiments were recorded. Majority of the cone calorimeter tests were conducted at a heat flux of 50 kW/m2, whereas some were performed at 25, 35, 75, and 100 kW/m2. Using these data, parameter levels for HRRPUA and burning duration were established from the 50 kW/m2 experiments. Figure 1 (e-f) displays the distributions of burning duration and HRRPUA. For the 10th to 90th percentile range, HRRPUA levels ranged from 90 to 200 kW/m2, while burning duration ranged from 300 to 1800 seconds. Most cabinet fire experiments in the literature used an ignition source in the form initial HRR ranging from 10 to 50 kW, which was used in this research.
2.1. Justification for Statistical Experiment Design (SED)
SED captures interactions between independent variables, which are often overlooked. It was selected over conventional single factors testing for its efficiency, robustness, and capability to analyze complex parameter interactions. By minimizing the number of required experiments while preserving statistical reliability, SED improves prediction accuracy and enables more precise modeling of nonlinear phenomena of fire behavior under diverse conditions. A SED approach using JMP Pro 17 software was employed to developed 51 unique configurations that incorporates eight varying parameters, as shown in Table 1. A cabinet with general specification is illustrated in Figure 2.
2.2. Cabinet Parameter Study
The ANOVA method utilized in this research offers a more effective way to determine the significance of parameters impacting on peak HRR. Sahin et al. [20] leveraged random forest ML models to analyze past spill fire experiments relevant to nuclear power plants. The developed model identified the most critical fire parameters and provided a computationally efficient framework to support probabilistic risk assessments. In contrast to Sobol index-based methods [27], which rely on Monte Carlo simulations— this predictive approach quantifies the impact of variables on HRR, thereby reducing uncertainties in fire risk evaluations. Compared to traditional methods like those in the SFPE Handbook [17], the ML approach better captured complex parameter interactions. Advancements in ML based regression techniques allow a better way to address intricate nonlinear behaviors, including fire dynamics, by capturing complex relationships and enabling more accurate predictions [28].
2.3. Configuration Study
In the configuration study, we set constant parameter values. While it may resemble a cabinet parameter study, only the position of combustibles and the ignition source are varied to assess their impact on peak HRR, as shown in Table 2.
2.3.1. Combustible Configuration in Cabinets
Twelve distinct electrical cabinet configurations were created by varying the position of combustibles, as outlined in Table 3. The corresponding models are shown in Figure 3 through Figure 6, with the results of the combustible configuration study summarized in Table 5.
In configuration 1 (Figure 3a), combustible panels are situated along the lateral walls, with the ignition source positioned at the bottom of the wall. In configuration 2 (Figure 3b), the ignition source is positioned at the bottom of both combustible panels to ensure its direct impact on the panels from the lowest point, influencing the fire’s spread. Configuration 3 (Figure 3c) was designed to study an upward flame spread on the circuit boards. The circuit boards are mounted vertically on the back wall of the cabinet and the ignition source placed directly below them [11].
Figure 3.
(a) Configuration 1: Ignition source at bottom, (b) Configuration 2: Two ignition source at the bottom and, (c) Configuration 3: Ignition source is below the combustible array.
Figure 3.
(a) Configuration 1: Ignition source at bottom, (b) Configuration 2: Two ignition source at the bottom and, (c) Configuration 3: Ignition source is below the combustible array.
In configuration 4 (Figure 4a), combustibles are positioned on the side wall and ceiling along with the ignition source which is placed at the bottom. In configuration 5 (Figure 4b), the ignition source is at the mid-height (0.6 m), and in configuration 6 (Figure 4c), the ignition source is at the top (1.2 m) from the bottom. This setup is considered one of the most conservative configurations.
Figure 4.
(a) Configuration 4: Ignition source located at bottom (b) Configuration 5: Ignition source located at mid-height (c) Configuration 6: Ignition source located at the top of the side wall.
Figure 4.
(a) Configuration 4: Ignition source located at bottom (b) Configuration 5: Ignition source located at mid-height (c) Configuration 6: Ignition source located at the top of the side wall.
In configuration 7 (Figure 5a), combustible panels are arranged along both lateral walls and the posterior wall, with single ignition source placed at the bottom of the wall. In configuration 8 (Figure 5b), combustibles with three ignition sources located at the base of walls. In configuration 9 (Figure 5c), combustibles along one lateral wall, ignition source at the base.
Figure 5.
(a) Configuration 7: Ignition source placed at the bottom of both side walls (b) Configuration 8: Three ignition source placed at the bottom of both side and back walls (c) Configuration 9: Ignition source placed at the bottom of both side walls.
Figure 5.
(a) Configuration 7: Ignition source placed at the bottom of both side walls (b) Configuration 8: Three ignition source placed at the bottom of both side and back walls (c) Configuration 9: Ignition source placed at the bottom of both side walls.
In configuration 10 (Figure 6a), combustible materials are placed along the rear wall and the ignition source placed at the base. The results indicate a significant increase in peak HRR for this configuration, highlighting the critical role of material arrangement in cabinet fires. In configuration 11 (Figure 6b), combustibles are positioned parallel to the lateral wall. This arrangement allows air to circulate around the combustibles both vertically and horizontally, while also allowing the upward movement of air through the upper vent. Proper spacing and strategic placement of combustibles are essential to mitigate these risks ensuring that air can circulate freely and reduce the intensity of any potential fire. In configuration 12 (Figure 6c), is a mirror image of configuration 3, with combustibles on both sides.
Figure 6.
(a) Configuration 10: Combustible arranged on back wall, (b) Configuration 11: Combustibles arranged parallel along the side wall, (c) Configuration 12: Vertical array with combustibles on both sides.
Figure 6.
(a) Configuration 10: Combustible arranged on back wall, (b) Configuration 11: Combustibles arranged parallel along the side wall, (c) Configuration 12: Vertical array with combustibles on both sides.
2.4. Fire Dynamic Simulator (FDS)
FDS-6.9.1 was used to model fire-driven fluid flow, smoke, and heat transfer resulting from an electrical cabinet fire. It simulates key fire aspects, such as turbulent combustion and thermal radiation transport, through a set of governing equations that cover species mass concentration, mass conservation, momentum, energy and the ideal gas law. To solve these equations, FDS uses Large Eddy Simulation (LES), applying a low-pass filter to the transport equations for mass, momentum, and energy to enable a detailed analysis of fire behavior within a defined area [15].
2.4.1. Physical Dimensions
The FDS parameters for the electrical cabinet consist of the volume, vent area (top and bottom), the location of the combustible fuel (PVCWC), ignition source elevation (zb) and ignition source (HRRb). The combustible fuel characteristics include the surface area (wall and ceiling), HRRPUA, and burning duration (tc). This is described in detail in Section 2.4.2. Geometrical parameters are critical in defining the physical structure and layout of the electrical cabinet within an FDS. The electrical cabinet analyzed in this research is constructed from steel with a thickness of 0.0028 m. The steel has specified properties, including a thermal conductivity of 54.0 W/m-K, a specific heat capacity of 0.47 kJ/kg-K, and a density of 7833 kg/m3.
2.4.2. Characteristics of Combustibles
Material ignition in FDS is predicted using the IGNITION TEMPERATURE and CONE HEAT FLUX features. The IGNITION TEMPERATURE feature determines material ignition when the surface temperature surpasses a user-defined ignition point for the material based on the input thermo-physical properties. The CONE HEAT FLUX feature is to predict the burning behavior of the material based on scaling laws and data from the cone calorimeter. The MATL ID and SURF ID features in FDS were used to incorporate the material thermo-physical properties (specific heat, thermal conductivity, density, and thickness). This function requires an HRRPUA curve with time using the RAMP Q feature as well as the exposure heat flux during the sample burning. The exposure heat flux during burning is the heat flux from the heater plus the flame heat flux and excluding the convective losses based on the average of the ignition temperature and steady-state temperature [15]. In this research, HRRPUA data were taken from tests at 40 kW/m2 and a flame heat flux of 25 kW/m2. After accounting for the convective loss term, a CONE HEAT FLUX of 65 kW/m2 entered FDS. With this input, the HRRPUA curve is scaled by FDS based on the exposure heat flux. For example, if the heat flux is higher than the CONE HEAT FLUX, the HRRPUA magnitude increases but the burning duration decreases to conserve energy. The FDS inputs were derived from an analysis of experimental data on PVC [18,25], a widely used cable type in electrical cabinets at NPP facilities. According to the ignition temperature data [11], the ignition temperature was established at 325°C and was kept consistent across all simulations. In this research, the thermal properties (specific heat and thermal conductivity) were optimized in FDS to ensure that the predicted ignition times closely matched the experimentally measured ignition times for PVC [24] under heat flux exposures of 20, 40, and 70 kW/m2 in a cone calorimeter, staying within the experimental error range. The PVC was specified to have a thermal conductivity of 0.10 W/m-K, specific heat capacity of 1.5 kJ/kg-K, and density of 1605 kg/m3, respectively. To define combustible material input burning rate during FDS simulations, the average HRRPUA of 100, 150, and 200 kW/m2 is stylized over a burning duration of 300, 600, and 900 s.
2.4.3. Convergence Study
To establish an optimal spatial resolution that balances computational efficiency with simulation accuracy, a convergence analysis was performed by dividing the FDS domain into three distinct grid sizes. The grid size for the FDS simulations was selected based on the characteristic fire diameter shown in Equation 1.
Where is the characteristic fire diameter, is the expected heat release rate (HRR) of the fire, is the air density, is the specific heat capacity of air, and is the ambient air temperature. The target mesh size is typically selected to achieve a value of approximately 10, ensuring sufficient resolution with several grid cells across the source fire to accurately predict mixing and combustion within the flame region. Figure 7 shows the convergence analysis, which was evaluated based on the HRR calculated from 10% to 90% of the total heat released and the peak HRR versus time curve. The simulations were considered to have adequately converged with a grid spacing of 0.05 m, which was selected for all subsequent FDS simulations. This choice was justified by observing that the difference in peak HRR between the 0.05 m and 0.025 m grids was only 5.5 kW. Moreover, the computational time for the 0.05 m grid was significantly lower than that of the 0.025 m grid, making it the more efficient option. The results of the grid convergence study are presented in Table 4.

Table 4.
Grid cell sizing for the cabinet.
| Grid Spacing (m) | Peak HRR (kW) | Time to Peak HRR (s) | Spatial Resolution (D*/dx) | Simulation Time (hrs) |
|---|---|---|---|---|
| 0.05 | 51.1 | 390 | 18 | 9 |
| 0.025 | 45.3 | 342 | 37 | 22 |
Table 5.
Impact on peak HRR due to combustible configuration and ignition source elevation.
| Config. | Combustible Position | Ignition Source Elevation | Peak HRR (kW) | Time to Peak HRR (s) |
|---|---|---|---|---|
| 1 | Both side walls | Bottom | 5.9 | 1578 |
| 2 | Both side walls | Bottom | 10.5 | 2406 |
| 3 | Back wall array | Bottom | 4.1 | 1350 |
| 4 | Side wall and ceiling | Bottom | 11.5 | 1558 |
| 5 | Side wall and ceiling | Mid | 36.4 | 1910 |
| 6 | Side wall and ceiling | Top | 35.2 | 952 |
| 7 | Three walls | Bottom | 7.6 | 1650 |
| 8 | Three walls | Bottom | 12.3 | 3110 |
| 9 | Side wall | Bottom | 15.0 | 1110 |
| 10 | Back wall | Bottom | 8.1 | 690 |
| 11 | Two parallel | Bottom | 47.6 | 1310 |
| 12 | Back wall array with both side combustible | Bottom | 13.2 | 970 |
3. Results
3.1. Cabinet Parameter Simulations
A structured series of simulations were conducted based on the SED framework to generate 51 unique configurations, as presented in Table 1. The peak HRR was calculated by subtracting the ignition source from the maximum predicted HRR from the electrical cabinet. The resulting peak HRR varied significantly across these configurations, ranging from 1.5 kW to 83.3 kW as shown in Figure 8. The variation in the peak HRR was associated with changing the parameters in Table 1.
The analysis results of 51 SED configurations, summarized in Figure 9, highlight the key parameters that significantly influence the peak HRR. The statistical significance of the main effects and it’s two-way interactions was assessed by comparing each t-ratio to the critical threshold corresponding to a 95% confidence level. Figure 9 presents the outcome of this statistical analysis, with a blue dashed line indicating the significance threshold. Parameters with values above this line are considered to have a strong influence on peak HRR, while those below have a lesser impact. The analysis shows that certain parameters consistently exceed the threshold, underscoring their critical role in determining peak HRR.
Time-to-peak HRR provides valuable insights into fire dynamics, representing the duration it takes for the peak HRR to reach its maximum value during a fire event. Analyzing the time-to-peak HRR allows researchers to better predict fire behavior, optimize safety measures, and design materials with slower ignition and growth rates. The statistical results are presented in Figure 10, revealed that the time-to-peak HRR, the ignition source and combustible burning duration were found to be statistically significant parameters in electrical cabinet fire. However, there were no significant two-way interactions between these parameters, suggesting that their impact on the time-to-peak HRR operates independently. The time-to-peak HRR varied significantly across 51 configurations, ranging from 300 to 3426 seconds, as shown in Figure 11.
3.2. Combustible Configuration Simulations
The arrangement of combustibles and the elevation of the ignition source significantly influences the peak HRR, as shown in Table 5. The configurations outlined in Table 2 are illustrated in Figure 3 through Figure 6. The results of these simulations revealed significant variations in fire behavior (peak HRR and time-to-peak HRR), highlighting the critical role that combustible positioning plays in the electrical cabinets.
Ignition source elevation either increases or decreases the peak HRR in configurations 5 and 6, as shown in Figure 12. Configuration 6, which features the ignition source located at the top, exhibits the highest gas temperature of 836.0°C and the highest heat flux of 47.8 W/m2 with the peak HRR of 35.2 kW, emphasizing the significance of ignition source elevation.
However, in configuration 4, where the ignition source placed at the bottom results in slower time to reach peak HRR, indicating that less of the combustible is involved in the fire. In contrast, configuration 9, where combustibles are positioned along the lateral wall, and configuration 11, exhibit significantly higher peak HRR. Configurations 3 and 12 are nearly identical, with the only difference being that in configuration 12, both sides are exposed to fire, resulting in a 10 kW increase in peak HRR. These configurations suggest a nuanced interplay between the combustible arrangement and ignition source location, contributing to variability in the fire behavior. Table 6 highlights four out of twelve configurations that demonstrate the highest predicted peak HRR along with the gas temperature at the vent (1.8 m) and heat flux (at 2.0 m). The results from Table 6, shown in Figure 13 (a) and Figure 13 (b), allowing for a clearer comparison and analysis of how these factors evolve significantly over time.
Table 6.
Measured maximum outcomes evaluated for gas temperature and heat flux inside the cabinet.
| Configuration | Gas Temperature (°C) | Heat Flux (W/m2) |
|---|---|---|
| 3 | 277.9 | 3.7 |
| 5 | 612.6 | 28.9 |
| 6 | 836.0 | 47.8 |
| 11 | 615.8 | 16.7 |
4. Discussion
The statistical analysis highlighted the most influential parameters, revealing how individual parameters have the greatest impact on the peak HRR in electrical cabinets. The statistical analysis of the simulations in this research indicated that the ventilation area in electrical cabinets was found to be unimportant; however, the ventilation area was expected to be important based on fire dynamics of enclosure fires. To determine the impact of the ventilation area, we performed an additional analysis of experimental data [10].
4.1. Impact of Individual Parameters
Understanding the parameters that influence the peak HRR is crucial for accurately modeling and mitigating fire hazards in electrical cabinets. The peak HRR of an electrical cabinet can be influenced by a single parameter while keeping the other parameters at fixed values. The parameters deemed to have the most significant effect on peak HRR are shown in Figure 14, which include: (a) Ignition source heat release rate of the ignition source (HRRb), (b) Ignition source elevation (zb), (c) HRRPUA, and (d) Area of combustible wall (ACW).
4.2. Ventilation Effects Based on Experimental Data
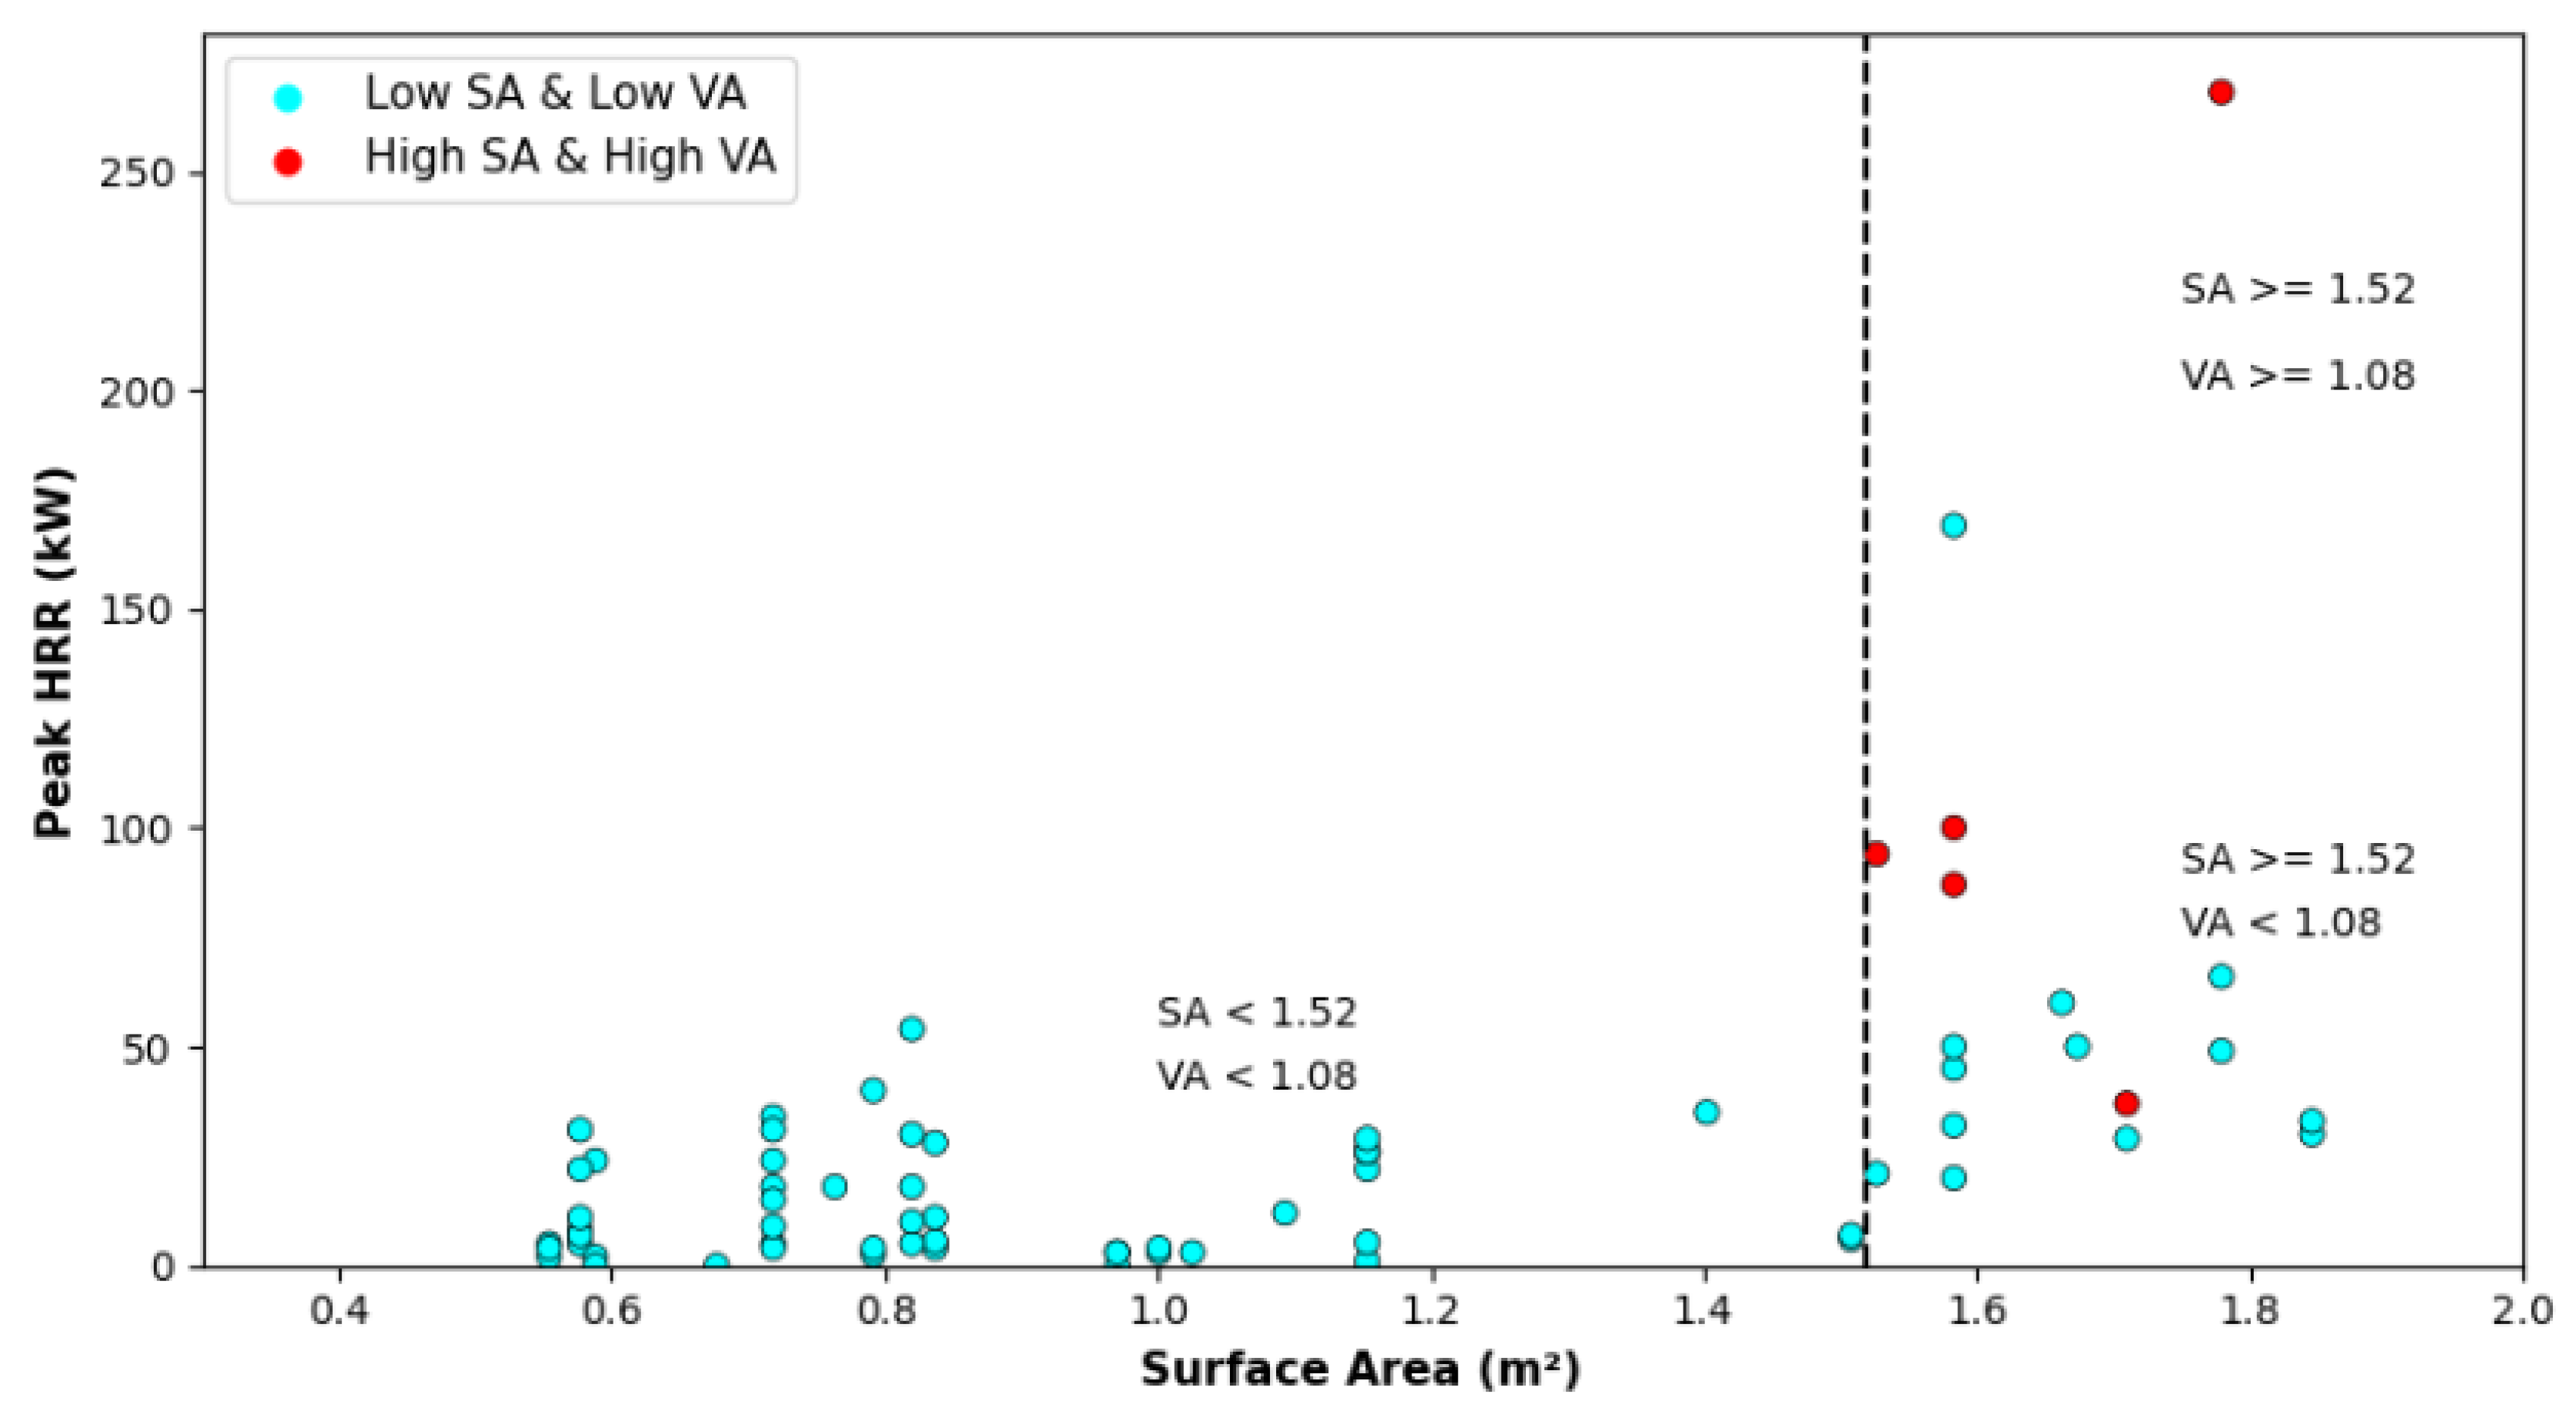
Partition screening analysis was conducted on the HELEN fire dataset [10] to examine the effects of ventilation area that influence peak HRR in electrical cabinet fire scenarios. Partition Screening analysis was performed using JMP Pro 17 software, which relies on splitting criteria within the dataset to assess the significance of the ventilation area (VA). Results of this analysis are shown in Figure 15 plotted against combustible surface area (SA). In this plot, cabinet experiments with lower surface area (<1.5 m2) did not have a wide variation in the peak HRR (1 – 50 kW) while experiments with higher surface area had a large range of peak HRR (1 – 260 kW).
Figure 14.
Impact on peak HRR due to most significant parameters: (a) HRR of ignition source (b) ignition source elevation (c) HRRPUA of combustibles and (d) Area of combustibles on the wall.
Figure 14.
Impact on peak HRR due to most significant parameters: (a) HRR of ignition source (b) ignition source elevation (c) HRRPUA of combustibles and (d) Area of combustibles on the wall.
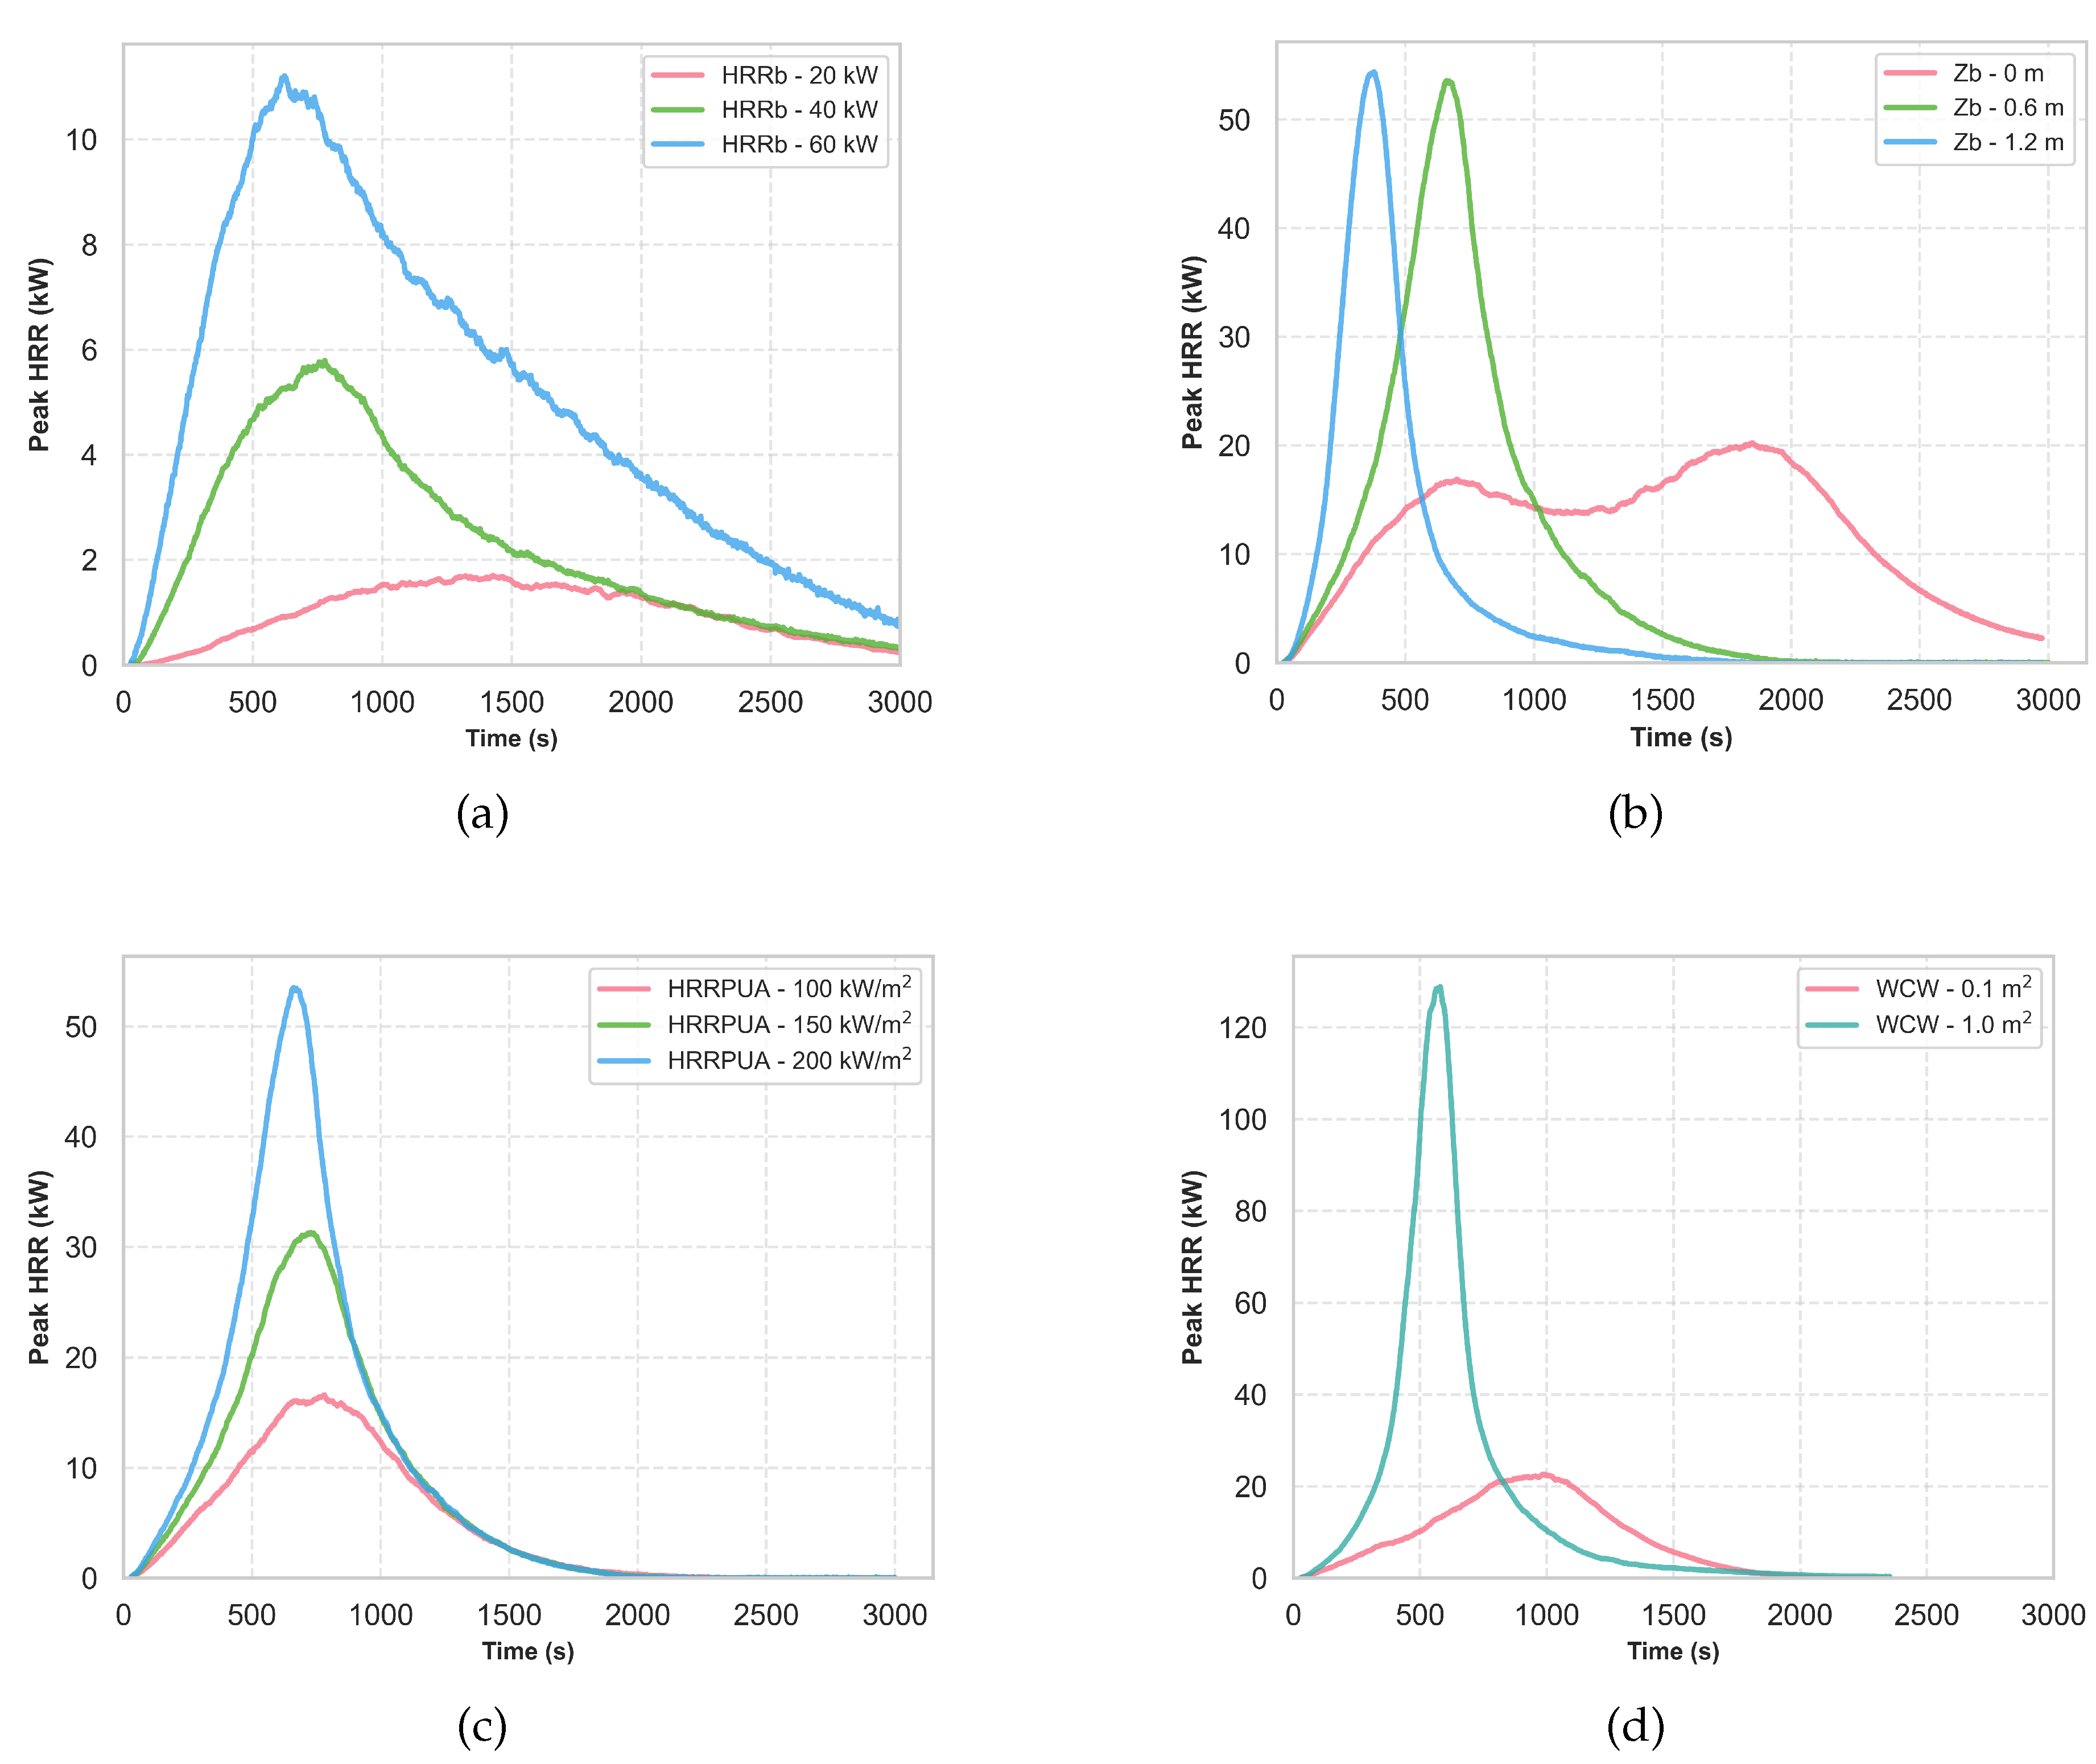
Figure 15.
Peak heat release rate effects due to combustible surface area and ventilation area.
To further highlight the results shown in Figure 15, experiments performed in similar-sized electronic cabinets were selected from HELEN to explore the influence of ventilation area on peak HRR. A summary of the cabinet conditions for the experiments is provided in Table 7 along with the corresponding peak HRR. As seen in this table, experiments with combustible surface area <1.5 m2 (Tests 32, 36, 110) did not result in a large difference in peak HRR when the ventilation area was changed (1.5 – 5.4 kW increase). However, in experiments with a combustible surface area >1.5 m2 (Test 82 and 111) the peak HRR increased significantly with an increase in ventilation area (62 – 219 kW increase). This is consistent with the results shown in Figure 15 where cabinets with higher combustible surface areas (>1.5 m2) had a large variation in the peak HRR, which was in part due to changing the ventilation area. The simulations performed as part of the SED had lower surface areas (<1.5 m2) resulting in a less significant impact of ventilation area on the predicted peak HRR, which is consistent with experimental results in Figure 15 and Table 7. This analysis indicates that ventilation area is a statistically significant parameter in cases where there is a higher combustible surface area.
4.3. Peak HRR Predictions: Numerical Simulations vs. Experimental Data
Numerical simulations, however, predicted a lower peak HRR range of 4.1–47.6 kW under similar conditions compared with experimental data [19]. The difference in the experimental and computational HRR was in part due to lack of detailed information on the surface area of the combustibles inside the cabinet as well as the distribution of these combustibles. Both of these parameters have been shown through numerical study to have an impact on the peak HRR. The RACHELLE-FIRE [19] study established probabilistic HRR distributions and enclosure classifications in nuclear facilities but left critical gaps in understanding how combustible fuel arrangement and ignition source, and other cabinet parameters influence fire HRR. Table 8 presents an analysis between actual experiments and numerical study.
4.4. Limitations
The accuracy of numerical predictions depends heavily on the quality of data input against experimental results. While numerical analysis is a powerful tool, it cannot yet fully replace full-scale fire testing. Full-scale experiments remain essential for validating numerical models and capturing phenomena that are difficult to simulate accurately. However, numerical analysis can serve as a surrogate for preliminary assessments, especially in cases where experimental data is limited or unavailable. For predicting peak HRR with high fuel loading we can strengthen this study by using ML application in fire is provided in [20], and [29], as they applied ML techniques in traditional compartment fire models.
5. Conclusion
The peak HRR in electrical cabinet fires was computed using FDS, which accounts for the enclosure’s geometry and aims to assess the significance of electrical cabinet parameters on the peak HRR fire response. Input parameters included cabinet width, surface area of combustibles, ventilation height, combustible HRRPUA, combustible burning duration, ignition source, and ignition source elevation, all of which were also analyzed statistically. Due to the varied nature of the combustible configurations, two separate analyses were performed: a) cabinet parameters study, and b) configuration study. In the cabinet parameter study, 51 models were generated using a SED-based statistical framework to identify the significant parameters affecting the peak HRR. The SED allowed for ranking both the main effects and two-way interaction effects on peak HRR and the time-to-peak HRR. Through analysis of the simulation results, the most significant parameters were found to be the ignition source, ignition source elevation, combustible HRRPUA, and combustible surface area. The ventilation area was not found to be important in the simulations. The partition screening of the data revealed that the ventilation area will impact the peak HRR when the combustible surface area is larger than approximately 1.5 m2. In configuration study, where series of 12 simulations with a different combustible distribution inside the electrical cabinet was conducted to explore the effects of how varying the combustible position influences the peak HRR. The arrangement of combustibles and the height of the ignition source were found to significantly influence the peak HRR. The configuration with combustibles arranged parallel to the side wall was predicted to have the highest peak HRR among all 12 configurations. Additionally, placing combustibles along the sidewall and ceiling, with the ignition source positioned at mid-height, resulted in a high peak HRR. The elevation of the ignition source, a variable not examined in previous experimental studies, was found to be a significant parameter in this analysis. Proper spacing and strategic placement of combustibles are crucial for fire safety. It helps in maintaining adequate airflow and ventilation within the compartment. This reduces fire intensity and minimizes the risk of rapid fire growth.
Acknowledgments
This research was funded through the U.S. Department of Energy, Office of Nuclear Energy through Award No. DE-NE0008981. This report was prepared as an account of work sponsored by an agency of the United States Government. Neither the United States Government nor any agency thereof, nor any of their employees, makes any warranty, express or implied or assumes any legal liability or responsibility for the accuracy, completeness, or usefulness of any information, apparatus, product, or process disclosed, or represents that its use would not infringe privately owned rights.
References
- U.S. Nuclear Regulatory Commission. EPRI/NRC-RES Fire PRA Methodology for Nuclear Power Facilities – Volume 2: Detailed Methodology; NUREG/CR-6850, 2005.
- Salvi, U.; Lattimer, B. Y.; Alhadhrami, S.; Wang, J.; Sahin, E.; Duarte, J. P. Analysis of historic fires to determine most frequent challenging events. Prog. Nucl. Energy 2022, 146, 104146. [Google Scholar] [CrossRef]
- Plumecocq, W.; Coutin, M.; Melis, S.; Rigollet, L. Characterization of closed-doors electronic cabinet fires in compartments. Fire Saf. J. 2011, 46(5), 243–253. [Google Scholar] [CrossRef]
- Avidor, E.; Joglar-Billoch, F. J.; Mowrer, F. W.; Modarres, M. Hazard assessment of fire in cabinets. Nucl. Technol. 2003, 144(3), 337–357. [Google Scholar] [CrossRef]
- Salvi, U.; Lattimer, B.; Duarte, J. P.; Sahin, E. Statistical Analysis to Determine Significant Parameters that Affect the Heat Release Rate of Electronic Cabinets. In Proc. ANS-ATH Conf., June 2022. 20 June.
- McGrattan, K. B.; Lock, A. J.; Marsh, N. D.; Nyden, M. R. Cable heat release, ignition, and spread in tray installations during fire (CHRISTIFIRE): Phase 1—Horizontal Trays; 2012.
- Matala, A.; Hostikka, S. Pyrolysis modelling of PVC cable materials. Fire Saf. Sci. 2011, 10, 917–930. [Google Scholar] [CrossRef]
- Rao, B. N.; Arunjothi, R. Assessing smoke and heat release during combustion of electric cables using cone calorimeter. In Proceedings of the 9th International Conference on Insulated Cables (JICABLE), Versailles, France, 21–25 June 2015. [Google Scholar]
- Rao, B. N.; Jothi, R. A.; Srinivasan, A.; Sudhindra, A. Heat Release Measurements on FRILS Cables Using Cone Calorimeter—CPRIPg Experience; 2007.
- McGrattan, K. B.; Bareham, S. D. Heat Release Rates of Electronic Cabinet Fires (HELEN-FIRE); 2016.
- Mangs, J.; Paananen, J.; Keski-Rahkonen, O. Calorimetric fire experiments on electronic cabinets. Fire Saf. J. 2003, 38(2), 165–186. [Google Scholar] [CrossRef]
- Nowlen, S. Cabinet environment characterization testing for the base line validation of computer fire simulation codes; Citeseer, 1987.
- Coutin, M.; Guillou, P. Phenomenological description of actual electronic cabinet fires in a free atmosphere. In Interflam, University of London, Royal Holloway College, UK, 2007; pp 3–7.
- Mangs, J.; Keski-Rahkonen, O. Full Scale Fire Experiments on Electronic Cabinets II; Technical Research Centre of Finland, 1996.
- McGrattan, K.; Hostikka, S.; McDermott, R.; Floyd, J.; Weinschenk, C.; Overholt, K. Fire Dynamics Simulator User’s Guide; NIST Special Publication 1019, 6th ed.; National Institute of Standards and Technology: Gaithersburg, MD, USA, 2013; pp. 1–339. [Google Scholar]
- McGrattan, K.; Hostikka, S.; McDermott, R.; Floyd, J.; Weinschenk, C.; Overholt, K. Fire Dynamics Simulator Technical Reference Guide, Volume 1: Mathematical Model; NIST Special Publication 1018, Vol. 1; National Institute of Standards and Technology: Gaithersburg, MD, USA, 2013. [Google Scholar]
- Hurley, M.J.; Gottuk, D.T.; Hall Jr, J.R.; Harada, K.; Kuligowski, E.D.; Puchovsky, M.; Torero, J.L.; Watts Jr, J.M.; Wieczorek, C.J. SFPE Handbook of Fire Protection Engineering, 5th ed.; Springer: New York, NY, USA, 2015. [Google Scholar]
- McGrattan, K.; Leventon, I. Oxygen-Limited Fires Inside Under-Ventilated Cabinets (OLIVE-FIRE); NIST Special Publication; National Institute of Standards and Technology: Gaithersburg, MD, USA, 2022. [Google Scholar]
- Lindeman, A.; Salley, M.H. Refining and Characterizing Heat Release Rates from Electronic Cabinets During Fire (RACHELLE-FIRE), Volume 1: Peak Heat Release Rates and Effect of Obstructed Plume; NUREG-2178; U.S. Nuclear Regulatory Commission: Washington, DC, USA, 2016. [Google Scholar]
- Sahin, E.; Lattimer, B.Y.; Duarte, J.P. Development of HRR Distribution Electrical Enclosure Fire Scenario Through Machine Learning. Fire Technol. 2024. [Google Scholar] [CrossRef]
- Babrauskas, V. Research on electronic electrical fires: The state of the art. In Proceedings of the 9th International Symposium on Fire Safety Science; International Association for Fire Safety Science, 2008; pp. 3–18. [Google Scholar]
- Keski-Rahkonen, O.; Mangs, J. Electronic Ignition Sources in Nuclear Power Plants: Statistical, Modelling and Experimental Studies. Nucl. Eng. Des. 2002, 213, 209–221. [Google Scholar] [CrossRef]
- Keski-Rahkonen, O.; Mangs, J.; Turtola, A. Ignition of and Fire Spread on Cables and Electronic Components; Citeseer, 1999.
- Brebu, M.; et al. Study of the Natural Ageing of PVC Insulation for Electronic Cables. Polym. Degrad. Stab. 2000. [Google Scholar] [CrossRef]
- Drysdale, D. An Introduction to Fire Dynamics, 3rd ed.; Wiley: Hoboken, NJ, USA, 2011. [Google Scholar]
- Chavez, J.M. An Experimental Investigation of Internally Ignited Fires in Nuclear Power Plant Control Cabinets: Part 1: Cabinet Effects Tests; Sandia National Labs, U.S. NRC, 1987. Available online: https://www.osti.gov/biblio/6330689 (accessed on 8 October 2023).
- Sobol’, I.M. On Sensitivity Estimation for Nonlinear Mathematical Models. Mat. Model. 1990, 2, 112–118. [Google Scholar]
- Jin, Y.; Bajorek, S.M.; Cheung, F.-B. Validation and Uncertainty Quantification of Transient Reflood Models Using COBRA-TF and Machine Learning Techniques Based on the NRC/PSU RBHT Benchmark. Nucl. Sci. Eng. 2023, 197, 967–986. [Google Scholar] [CrossRef]
- Brandyberry, M.; Apostolakis, G. Response Surface Approximation of a Fire Risk Analysis Computer Code. Reliab. Eng. Syst. Saf. 1990, 29, 153–184. [Google Scholar] [CrossRef]
Figure 1.
Parameter distribution obtained from previously conducted experiments with varied cabinet input values: a) Height, b) Width, c) Depth, d) Combustible surface area, e) Burning duration, and f) HRRPUA.
Figure 1.
Parameter distribution obtained from previously conducted experiments with varied cabinet input values: a) Height, b) Width, c) Depth, d) Combustible surface area, e) Burning duration, and f) HRRPUA.
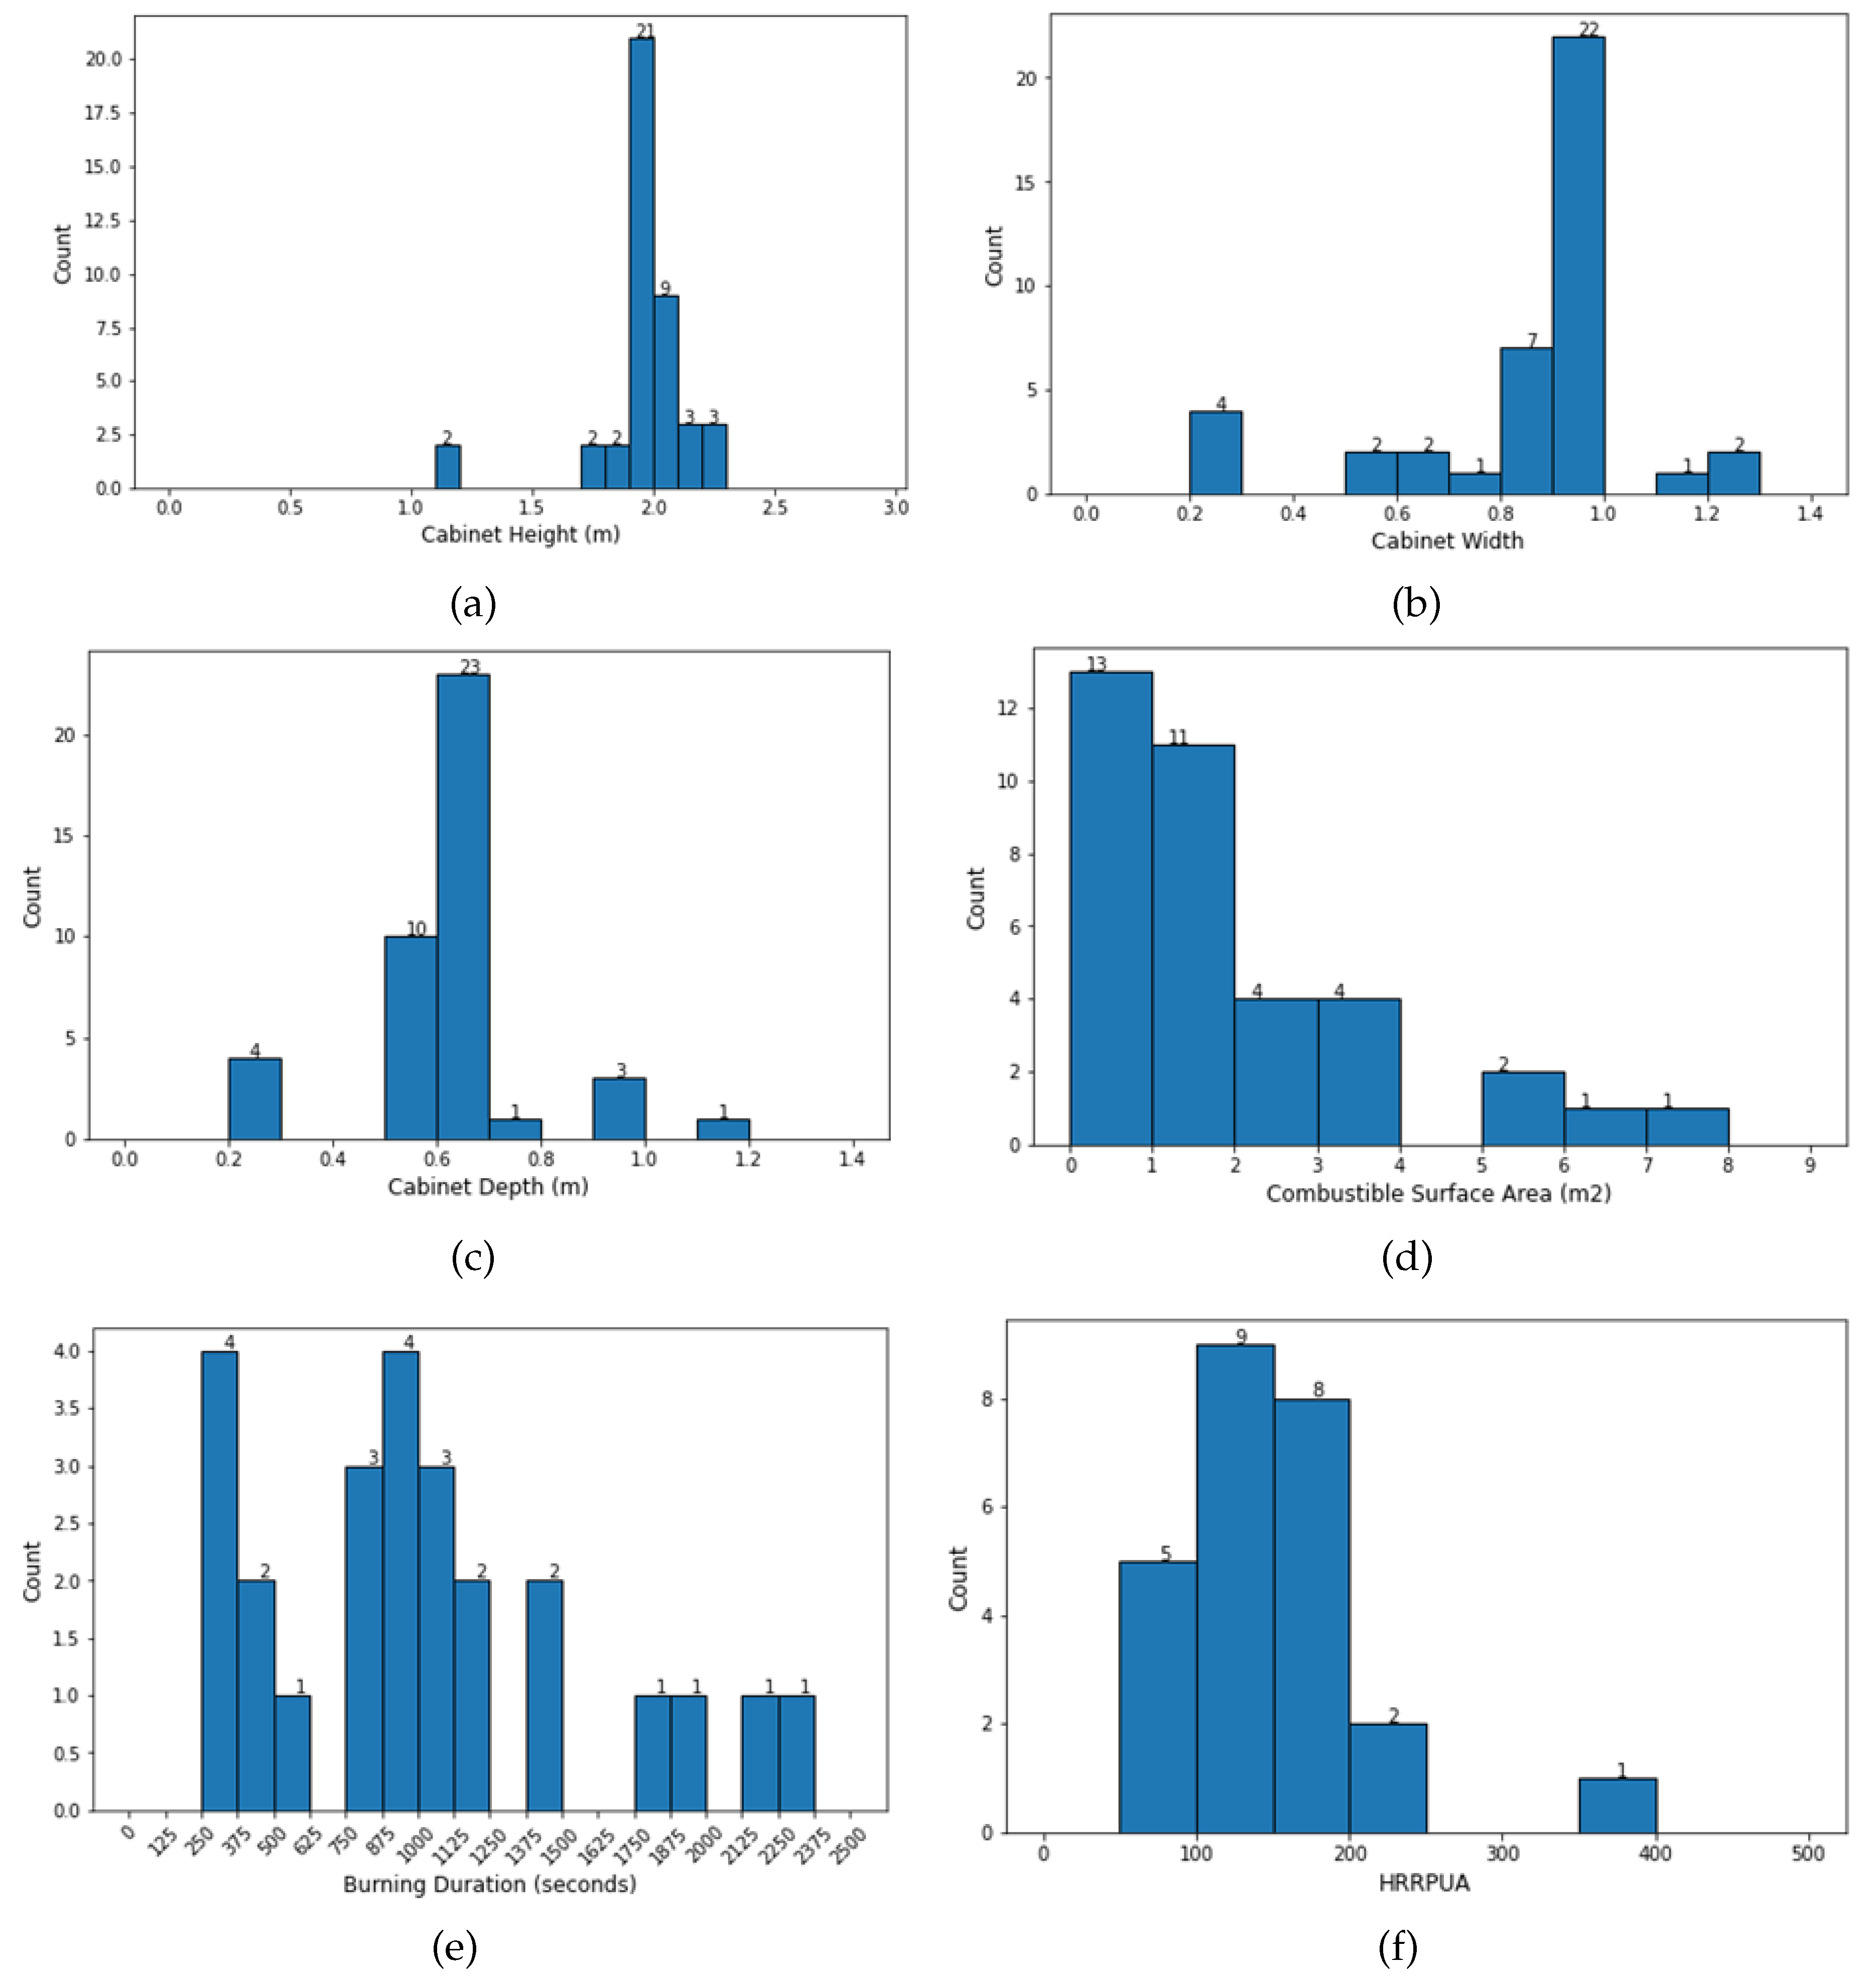
Figure 2.
Electrical cabinet with detailed dimensional specifications.
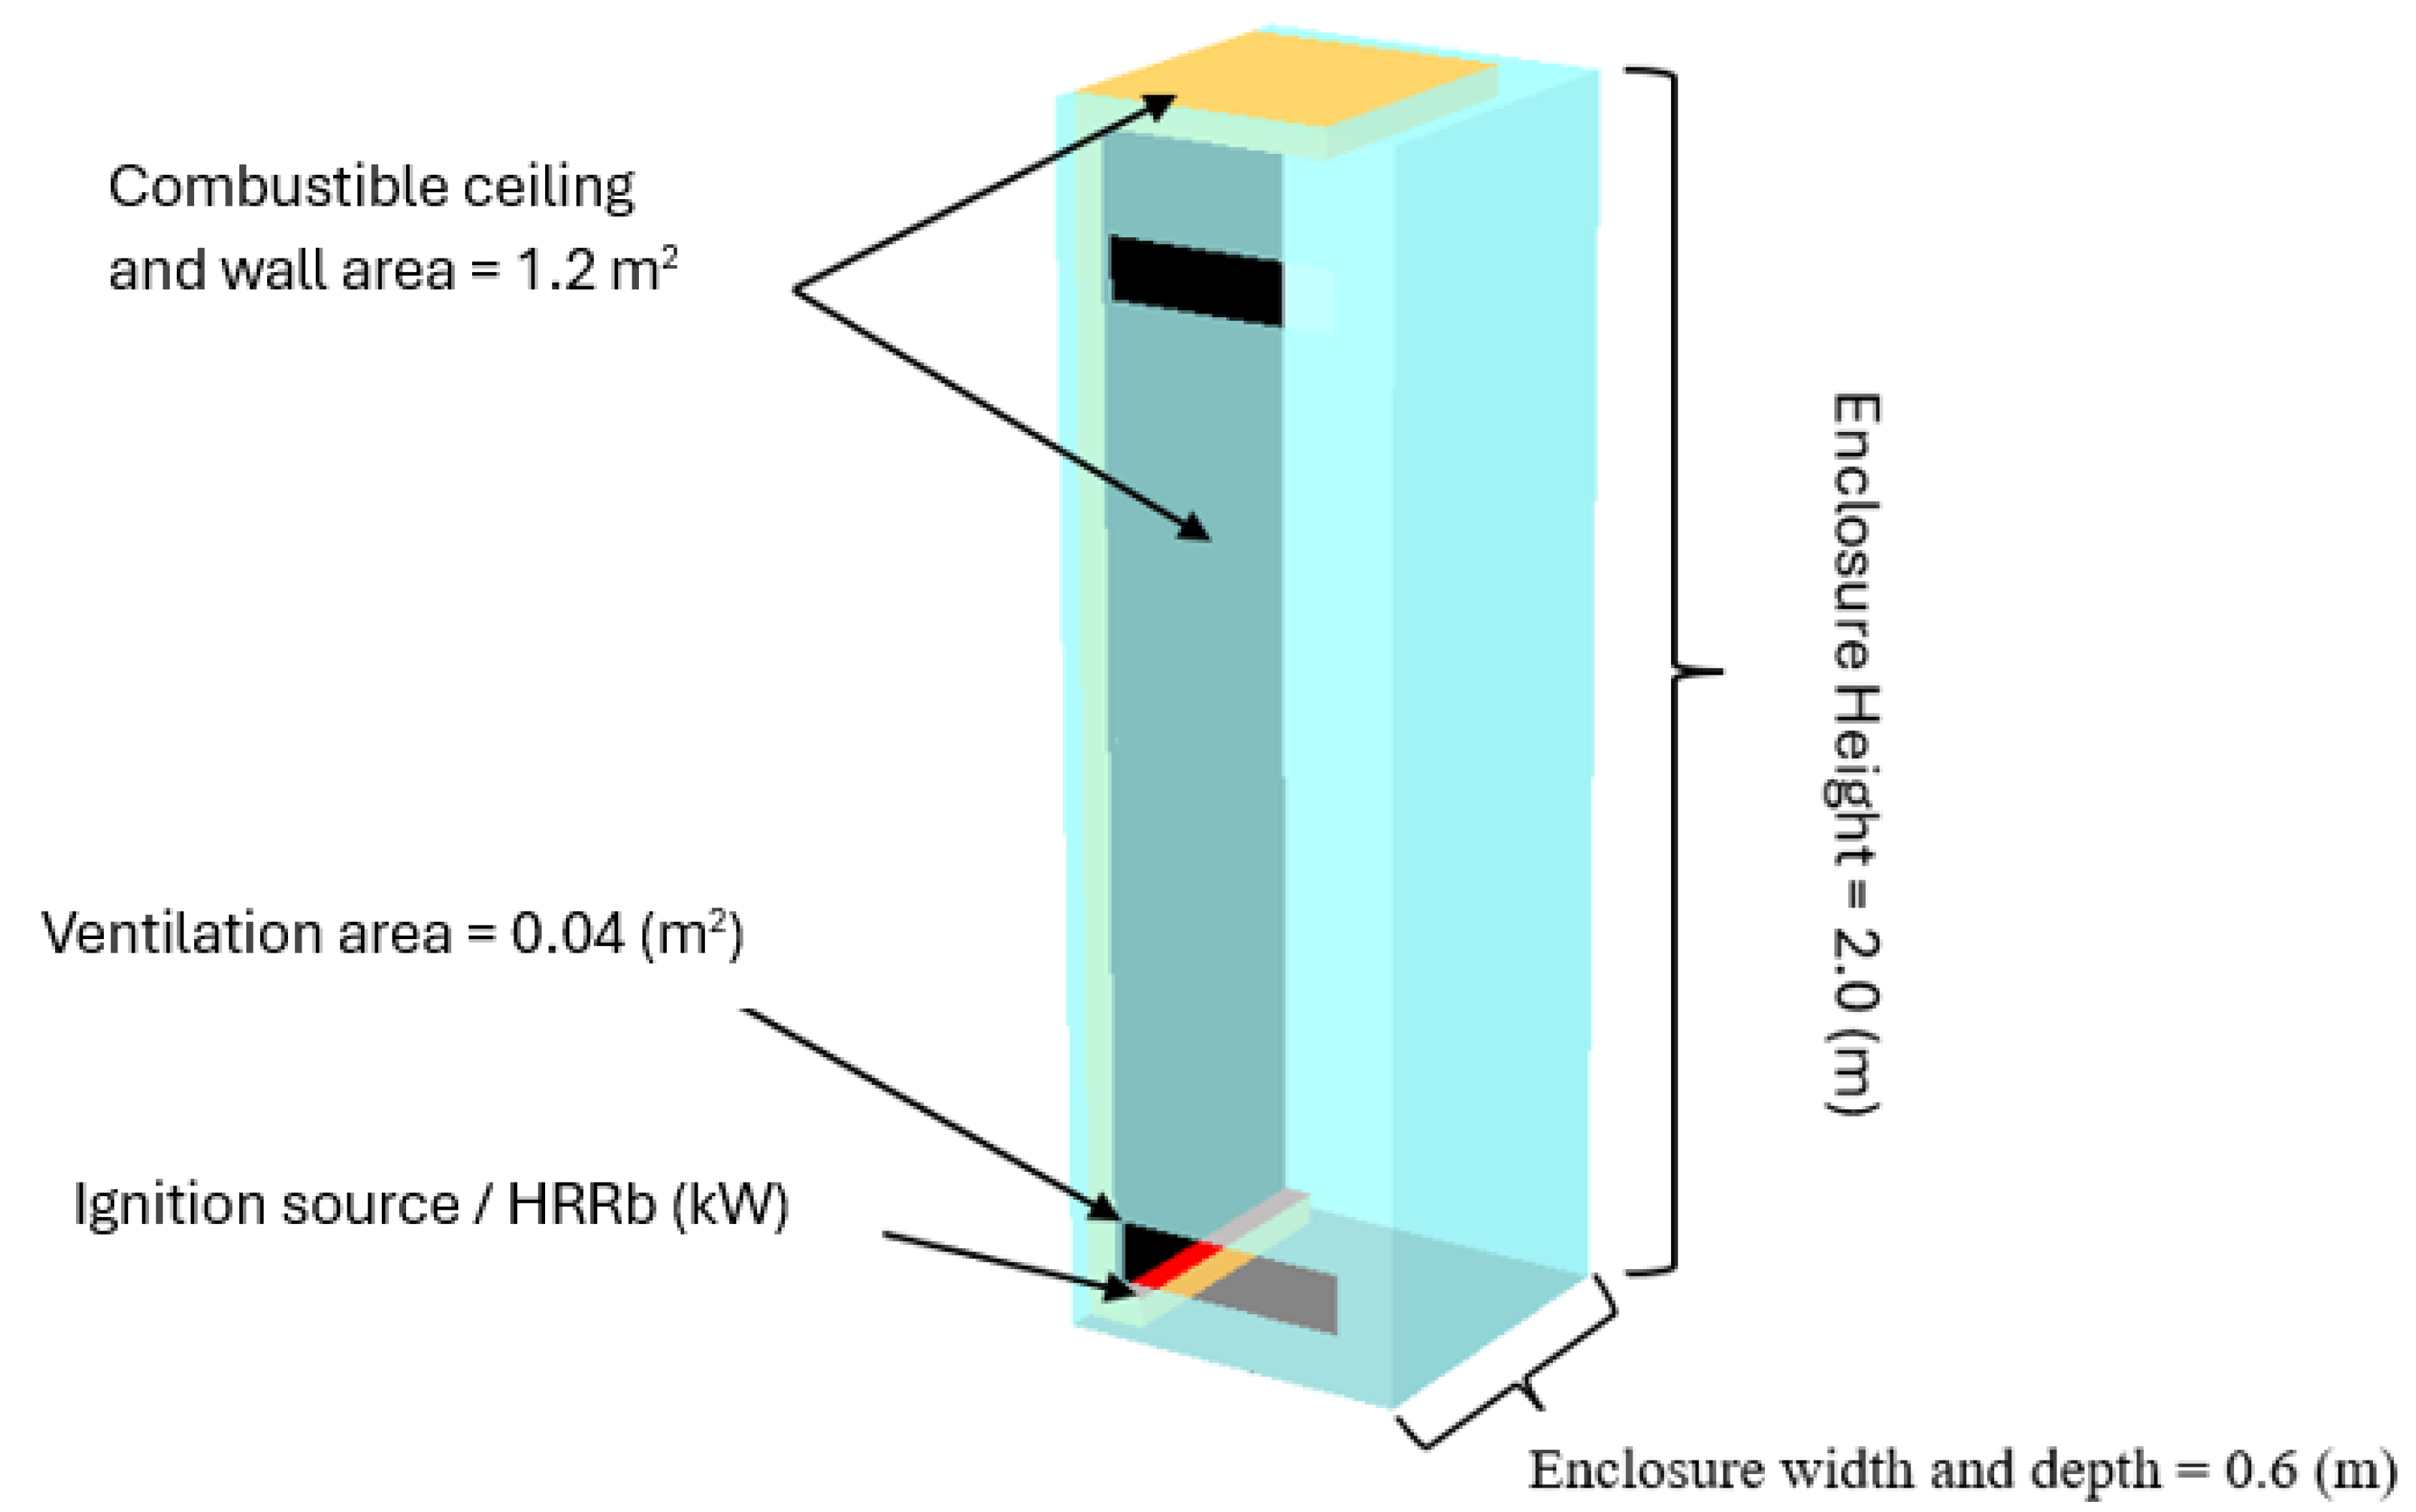
Figure 7.
(a) Schematic representation, and (b) Peak HRR results from mesh convergence study.
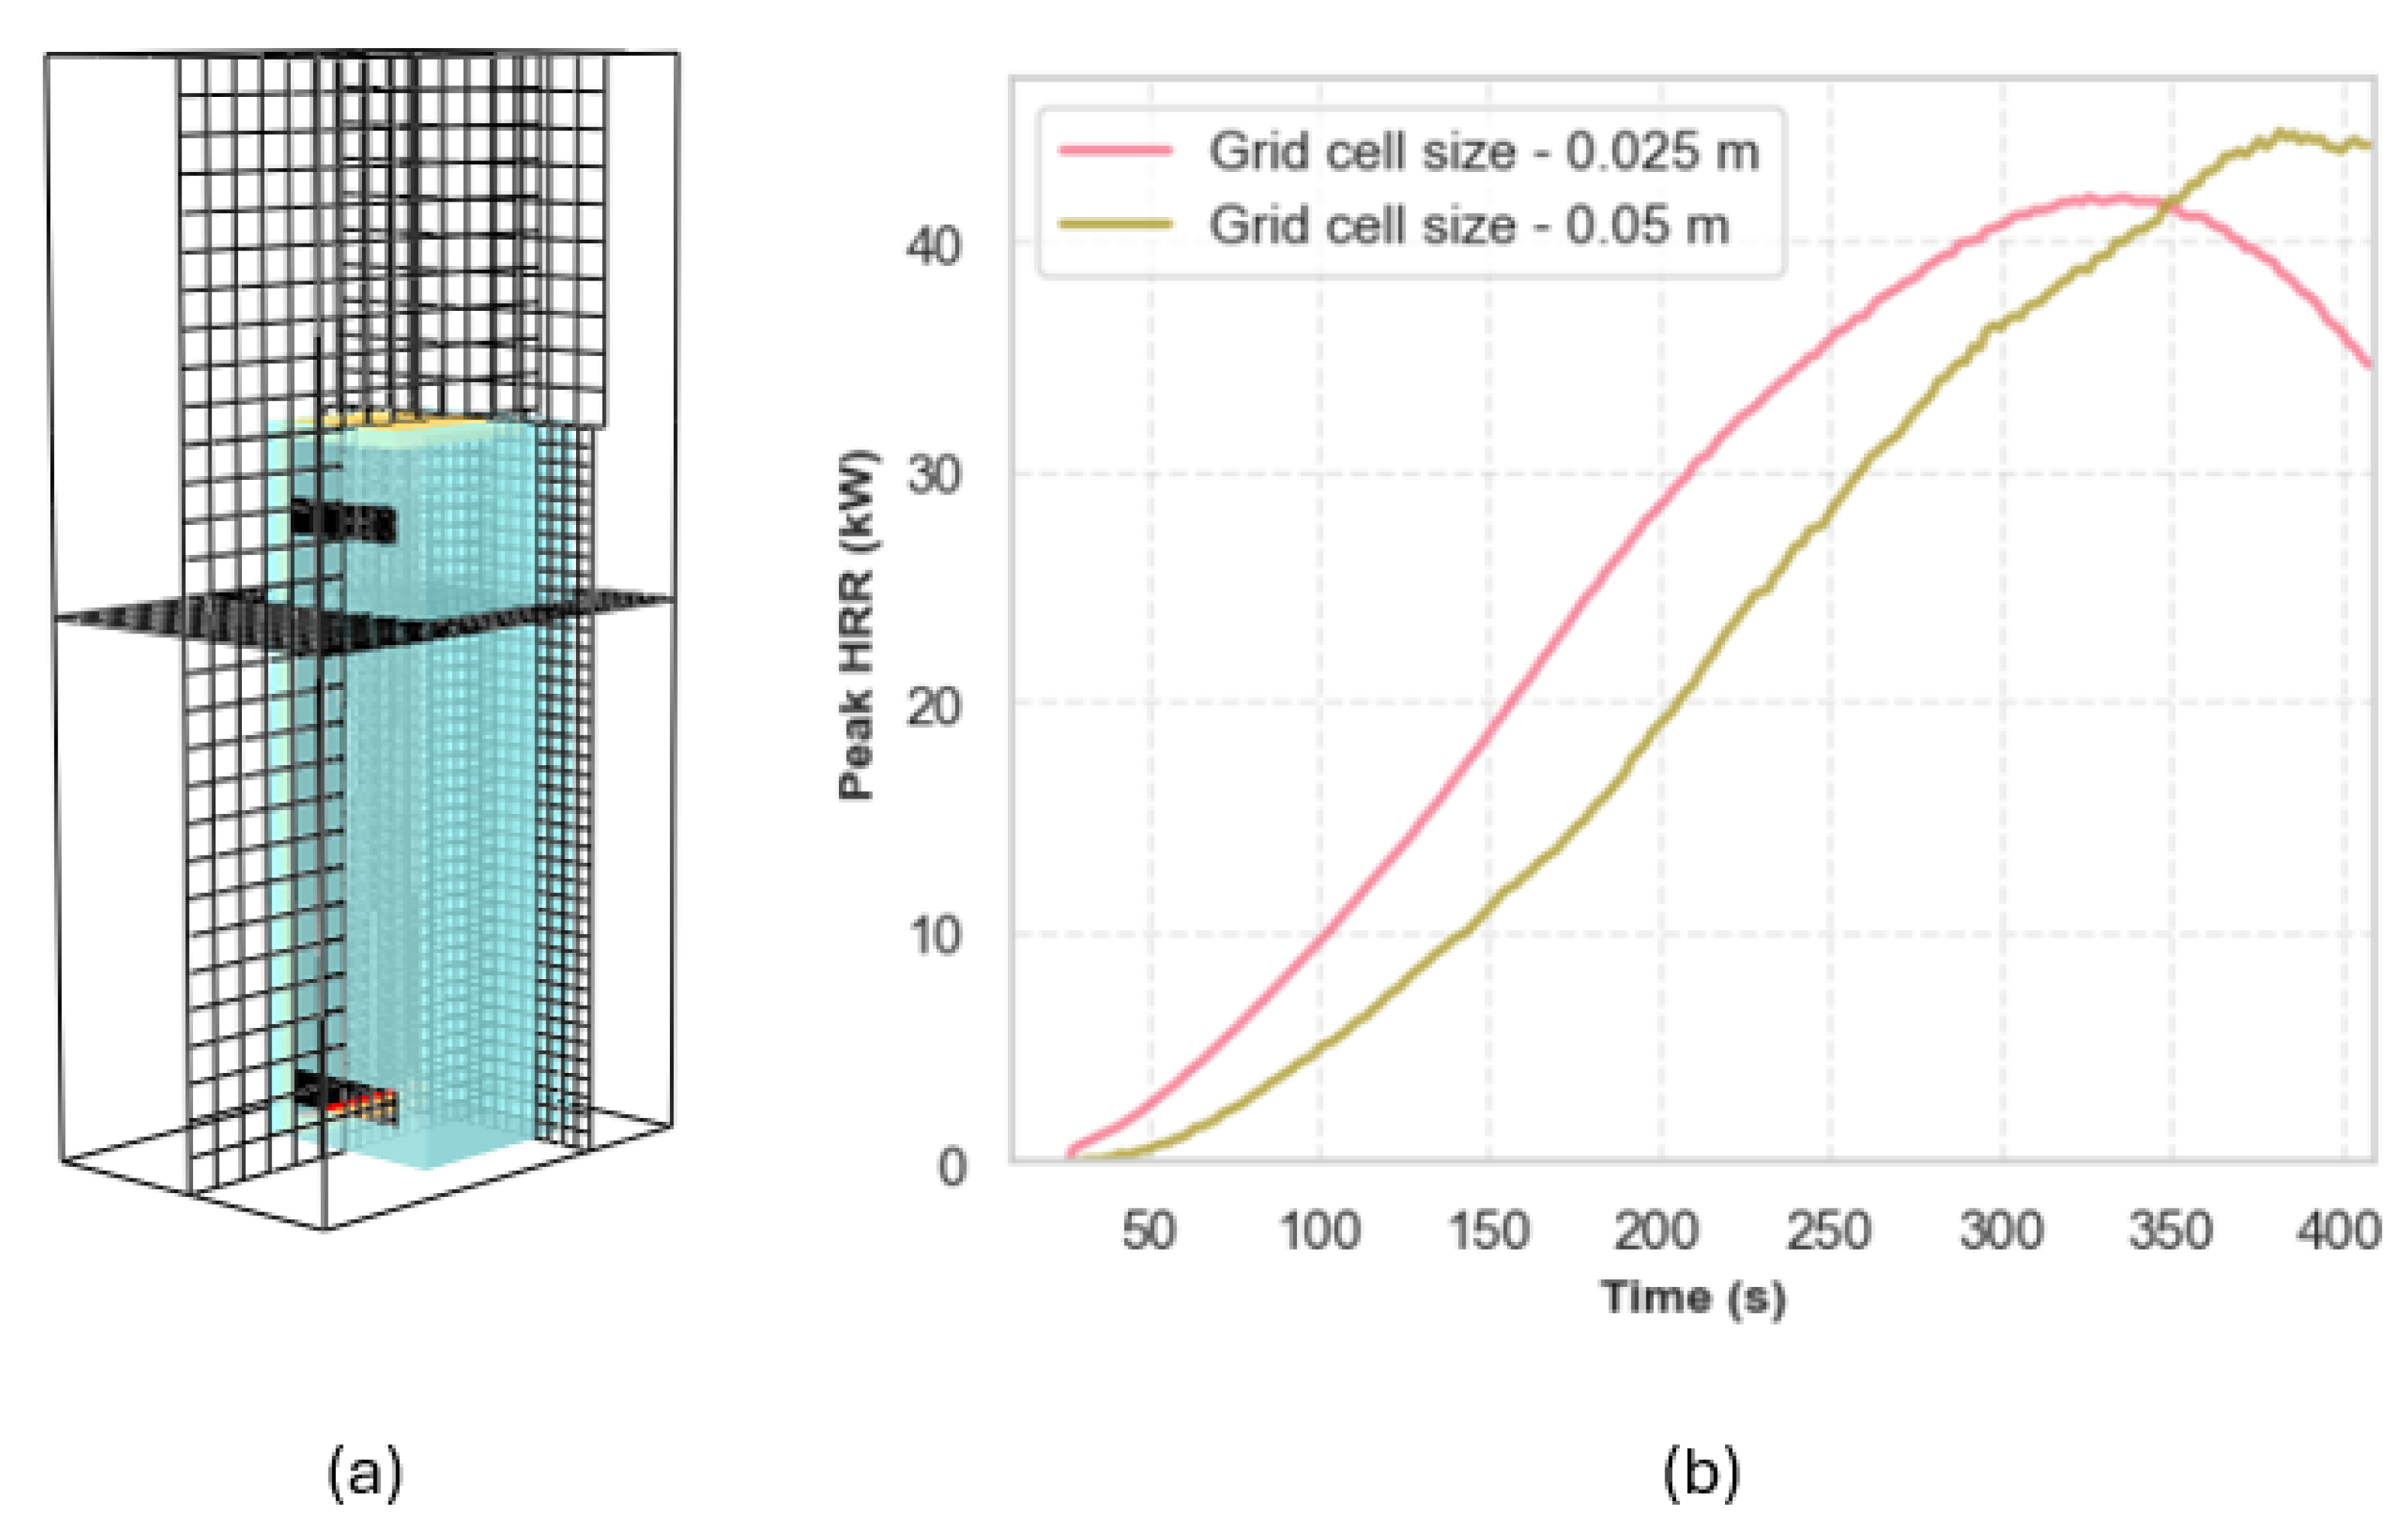
Figure 8.
Variation in the peak HRR of electrical cabinet fire for 51 different configurations.
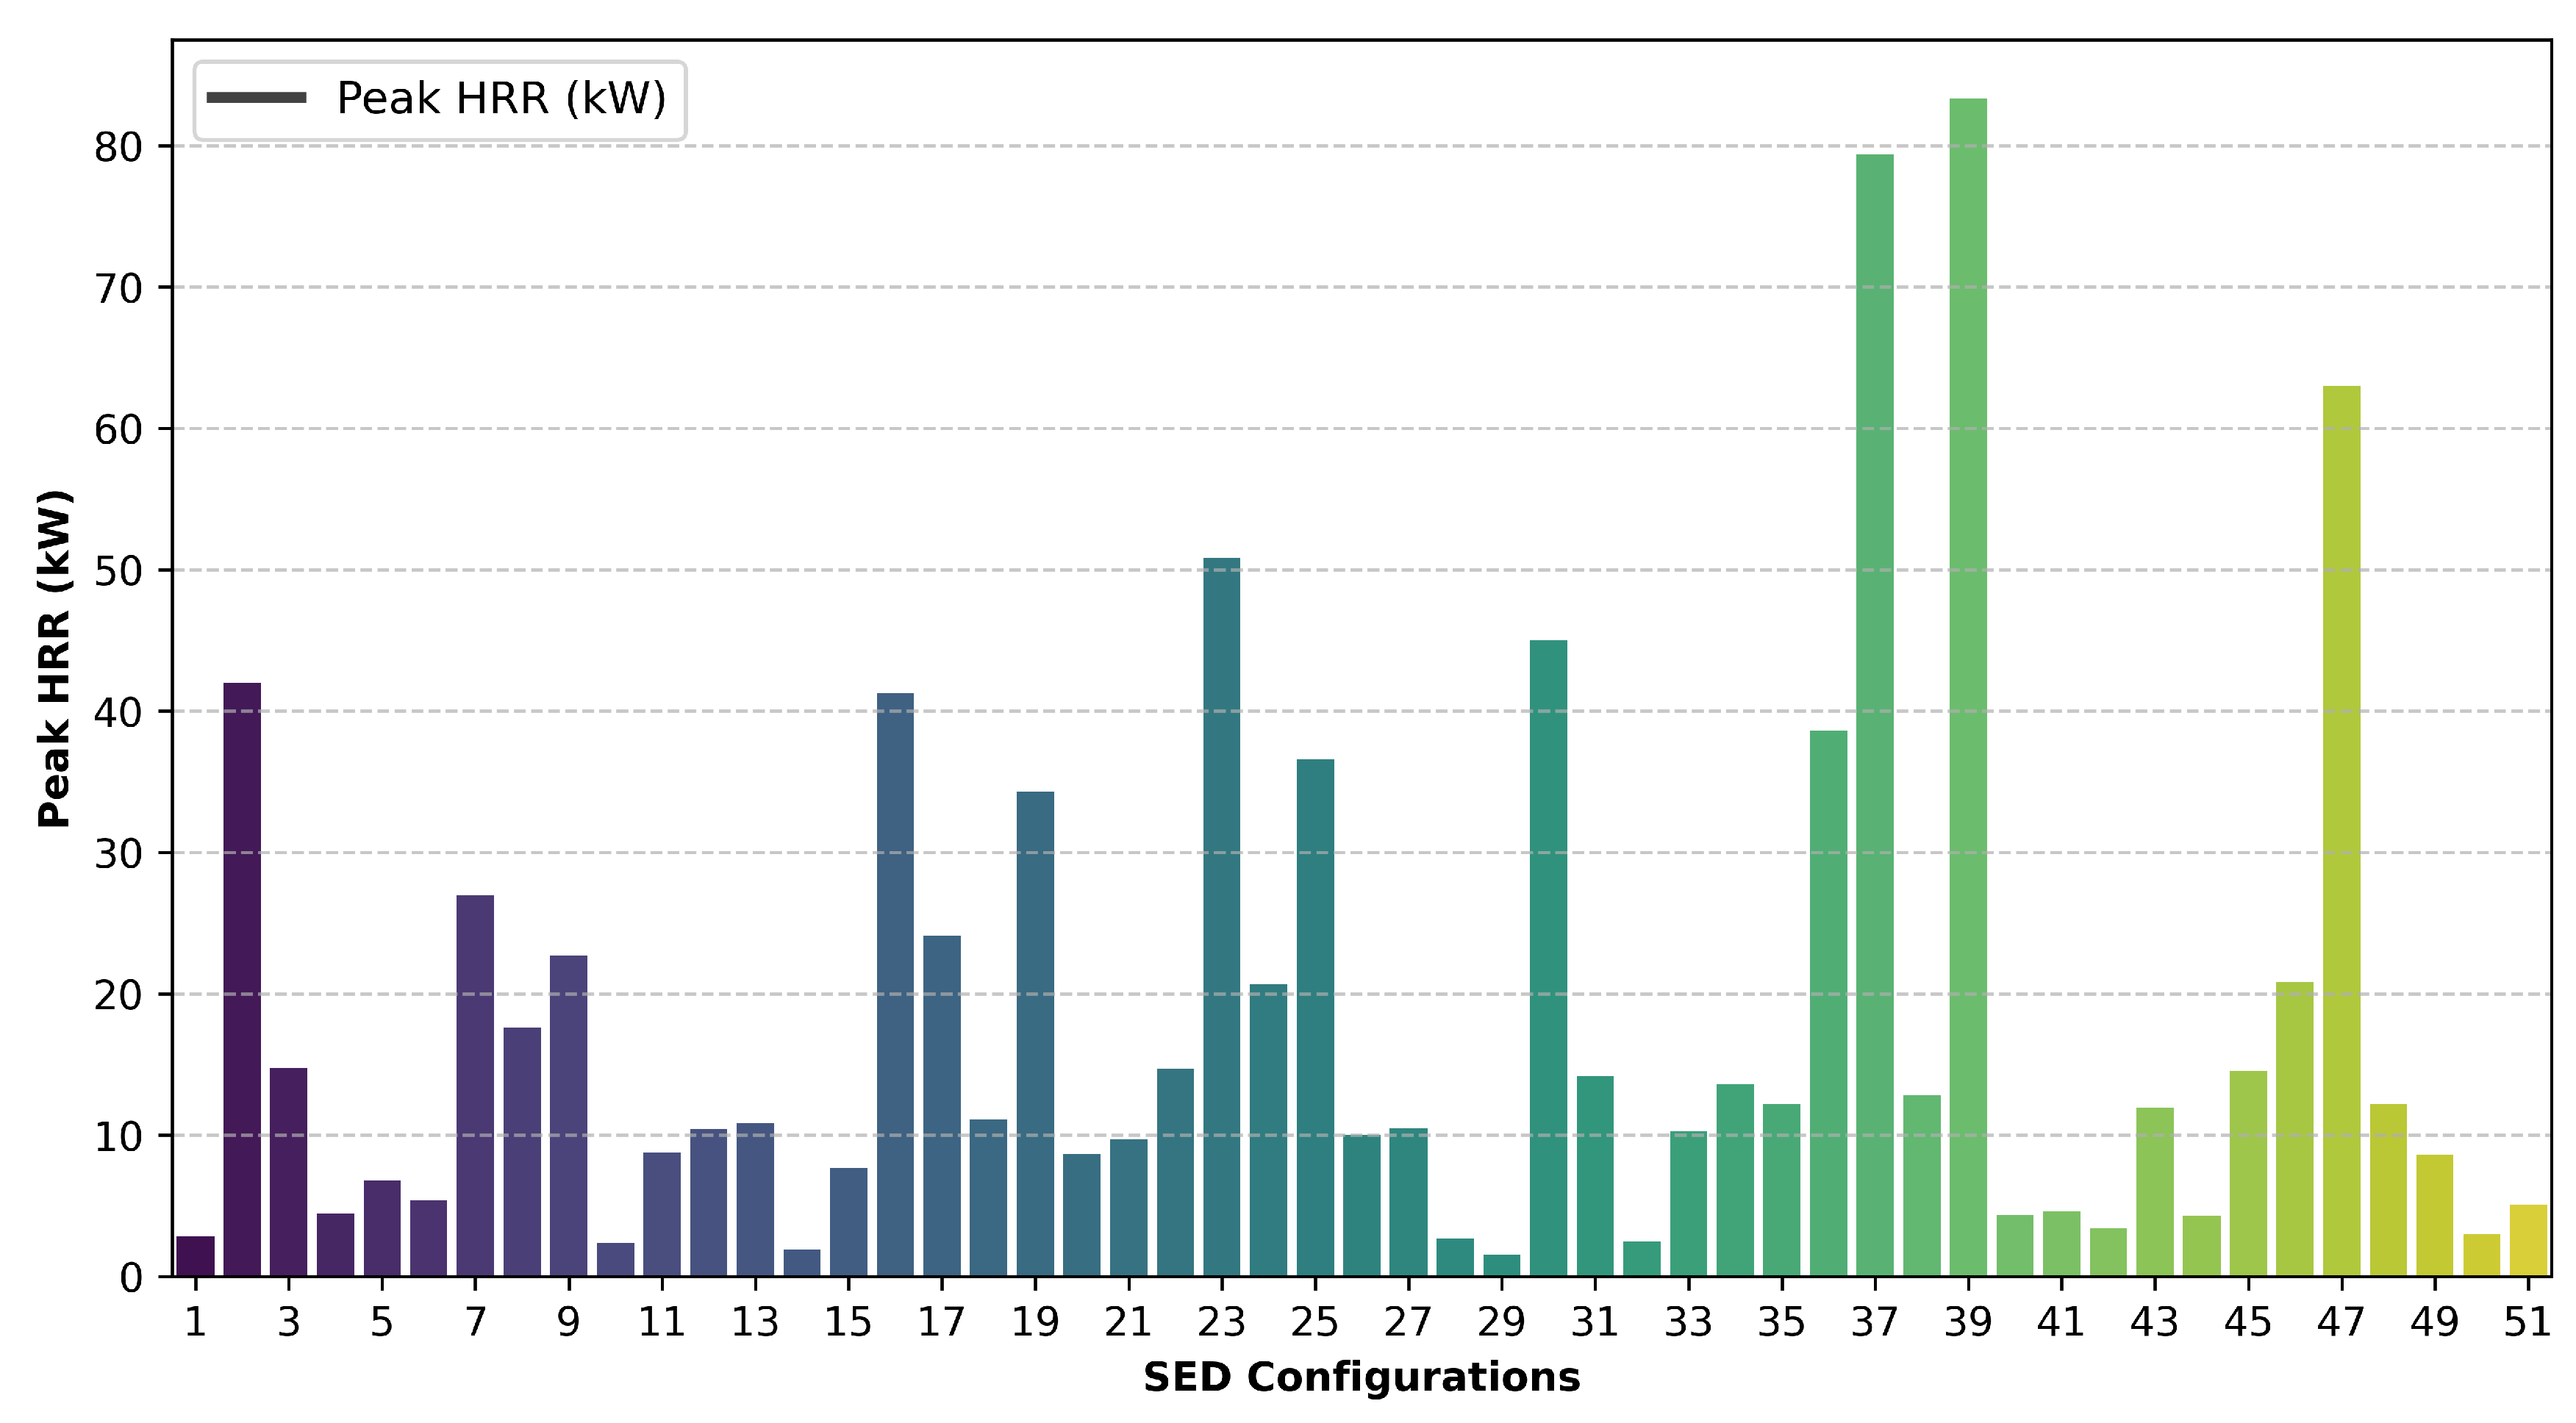
Figure 9.
Influence of key parameters and interactions on peak HRR based on statistical analysis.
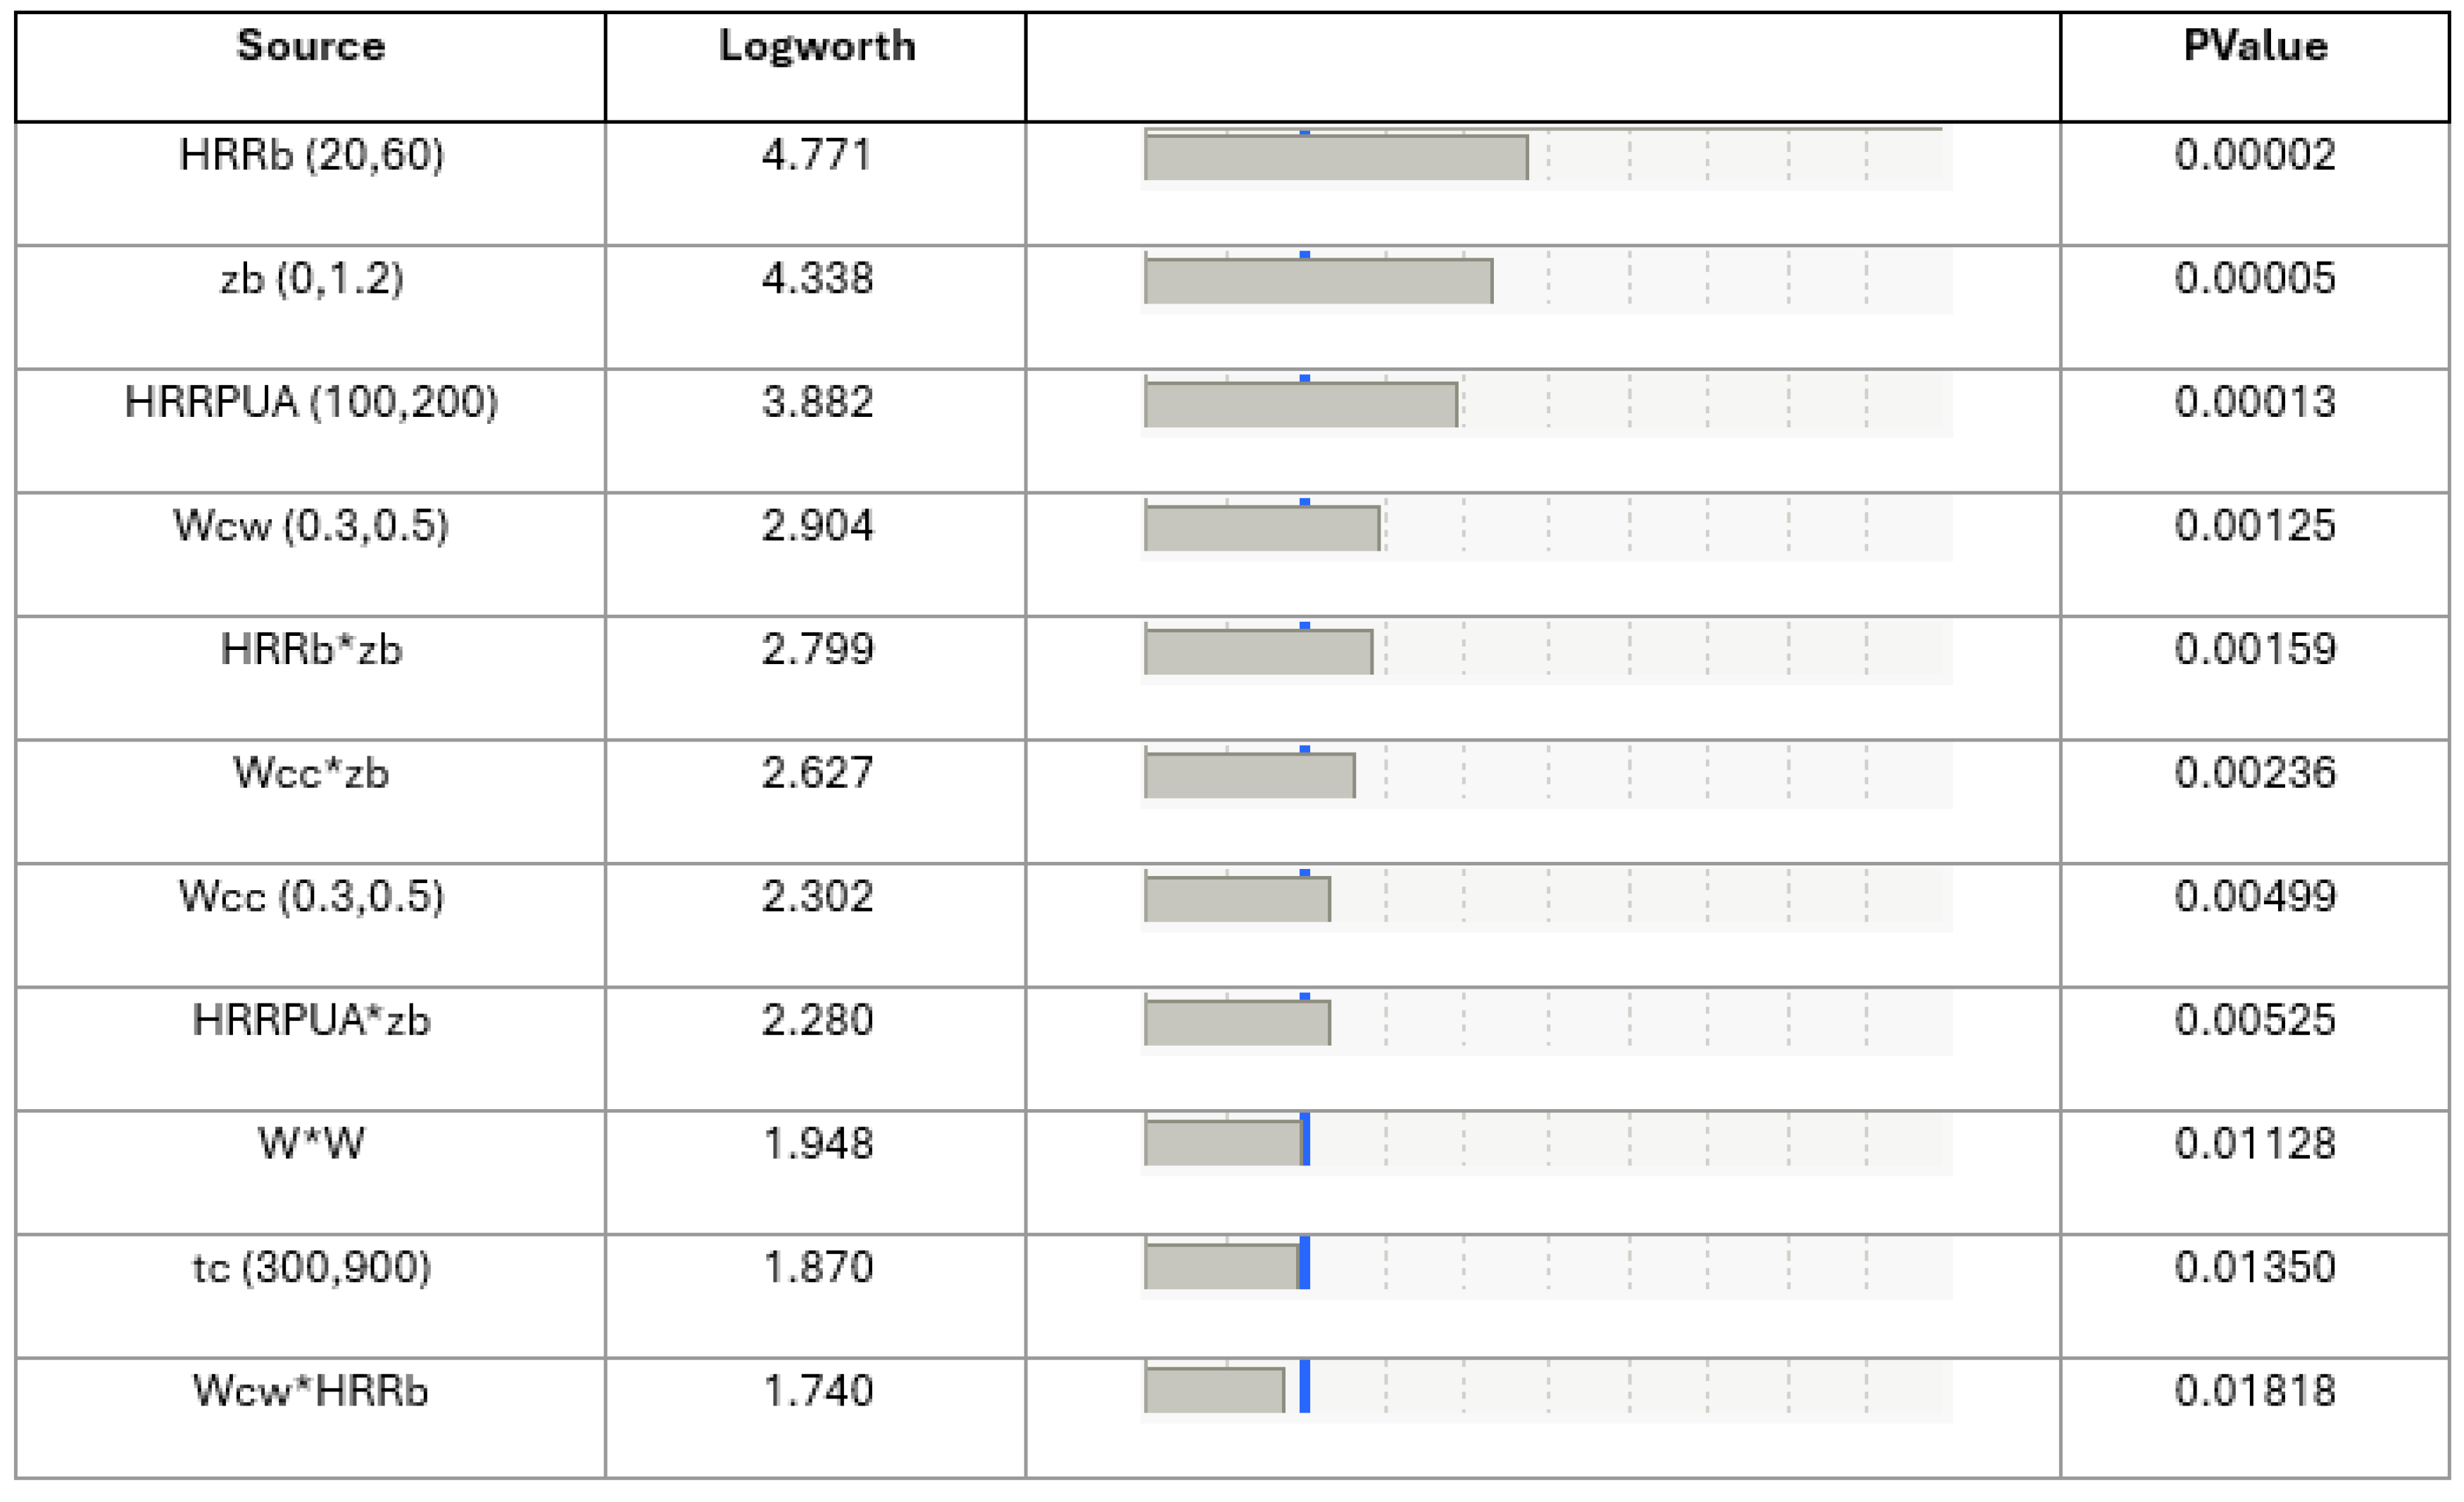
Figure 10.
Influence of key parameters and interactions on time-to-peak HRR based on statistical analysis.
Figure 10.
Influence of key parameters and interactions on time-to-peak HRR based on statistical analysis.
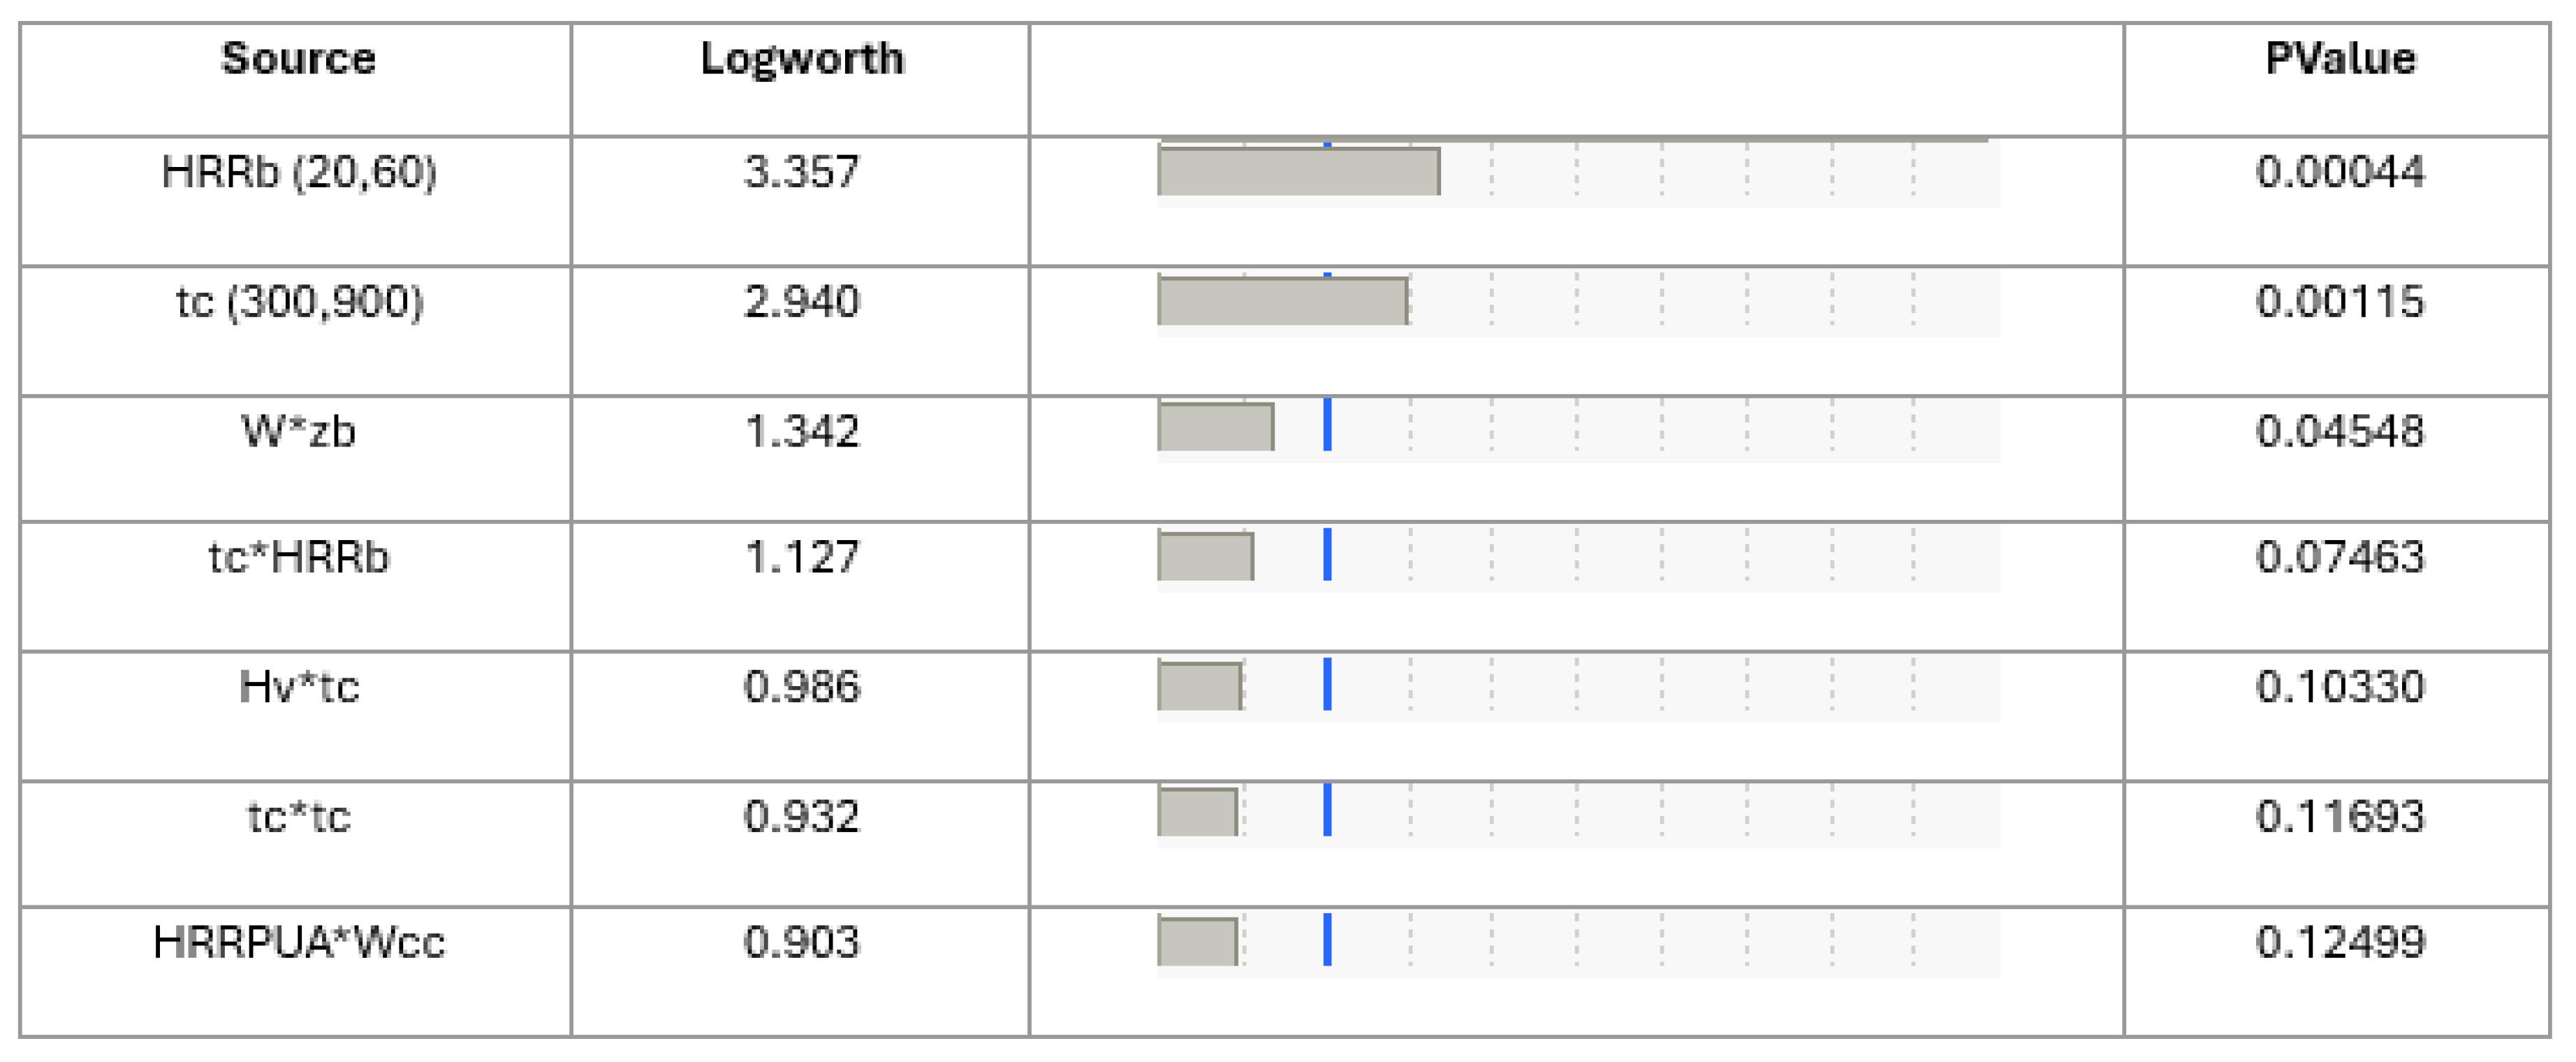
Figure 11.
Time-to-peak HRR for electrical cabinet fires across 51 configurations.
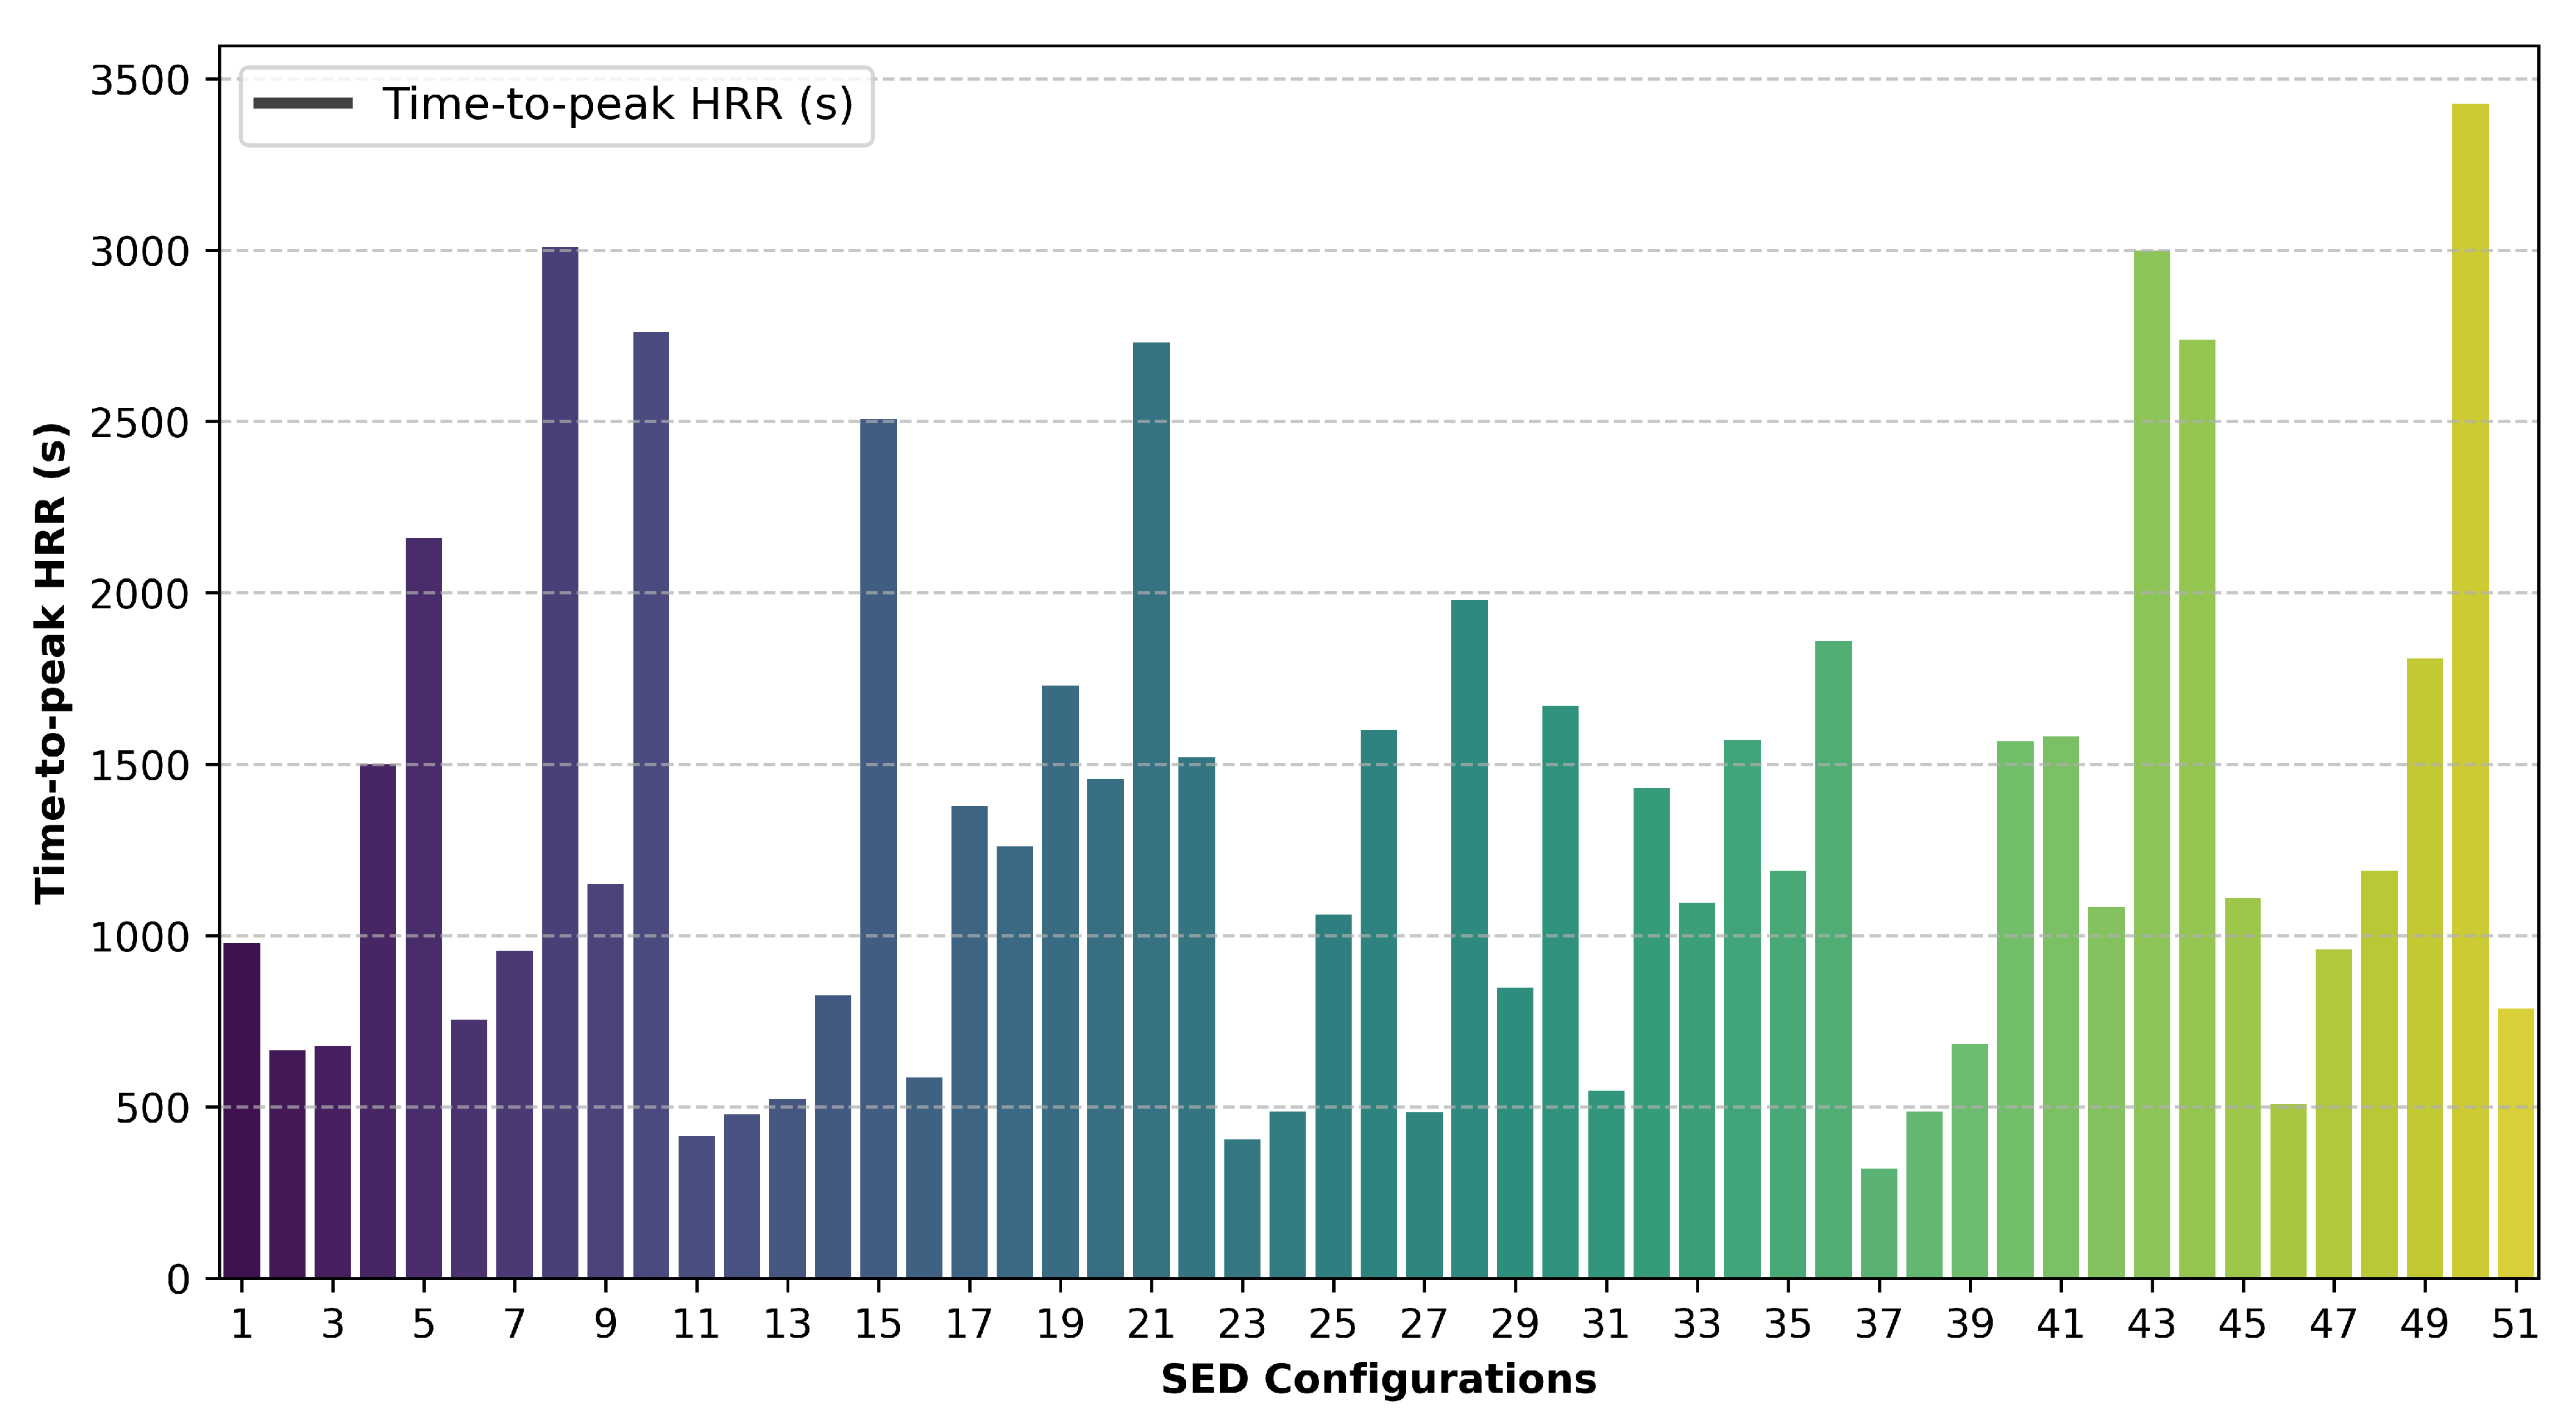
Figure 12.
(a) High peak heat release rate, (b) Low peak heat release rate, resulting from Table 5.
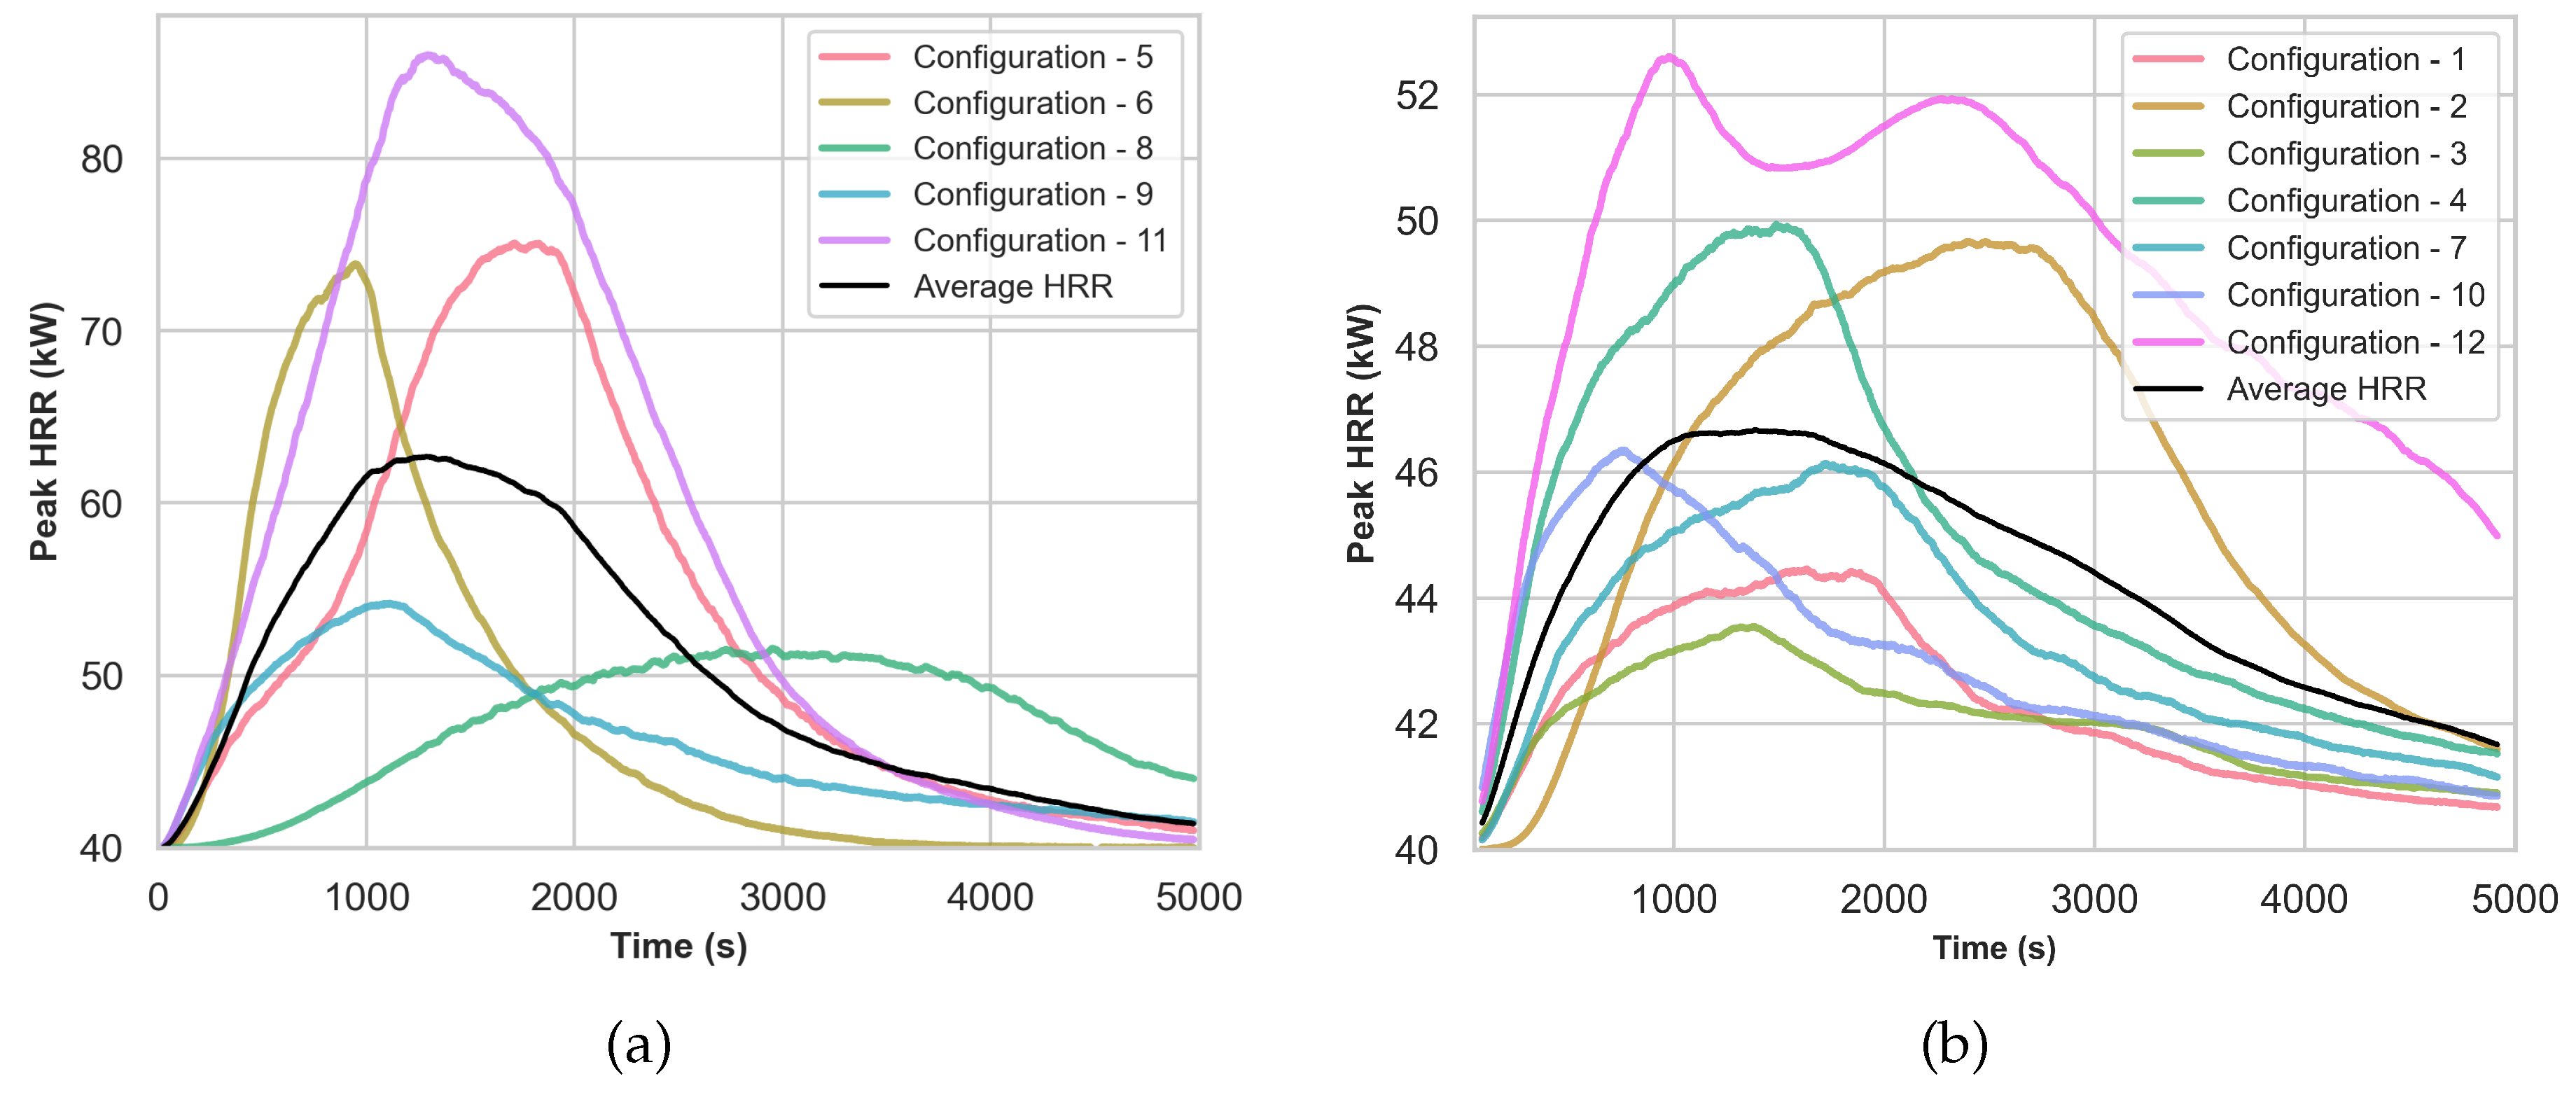
Figure 13.
a) Gas Temperature and b) Heat Flux, for configurations that show high peak HRR.
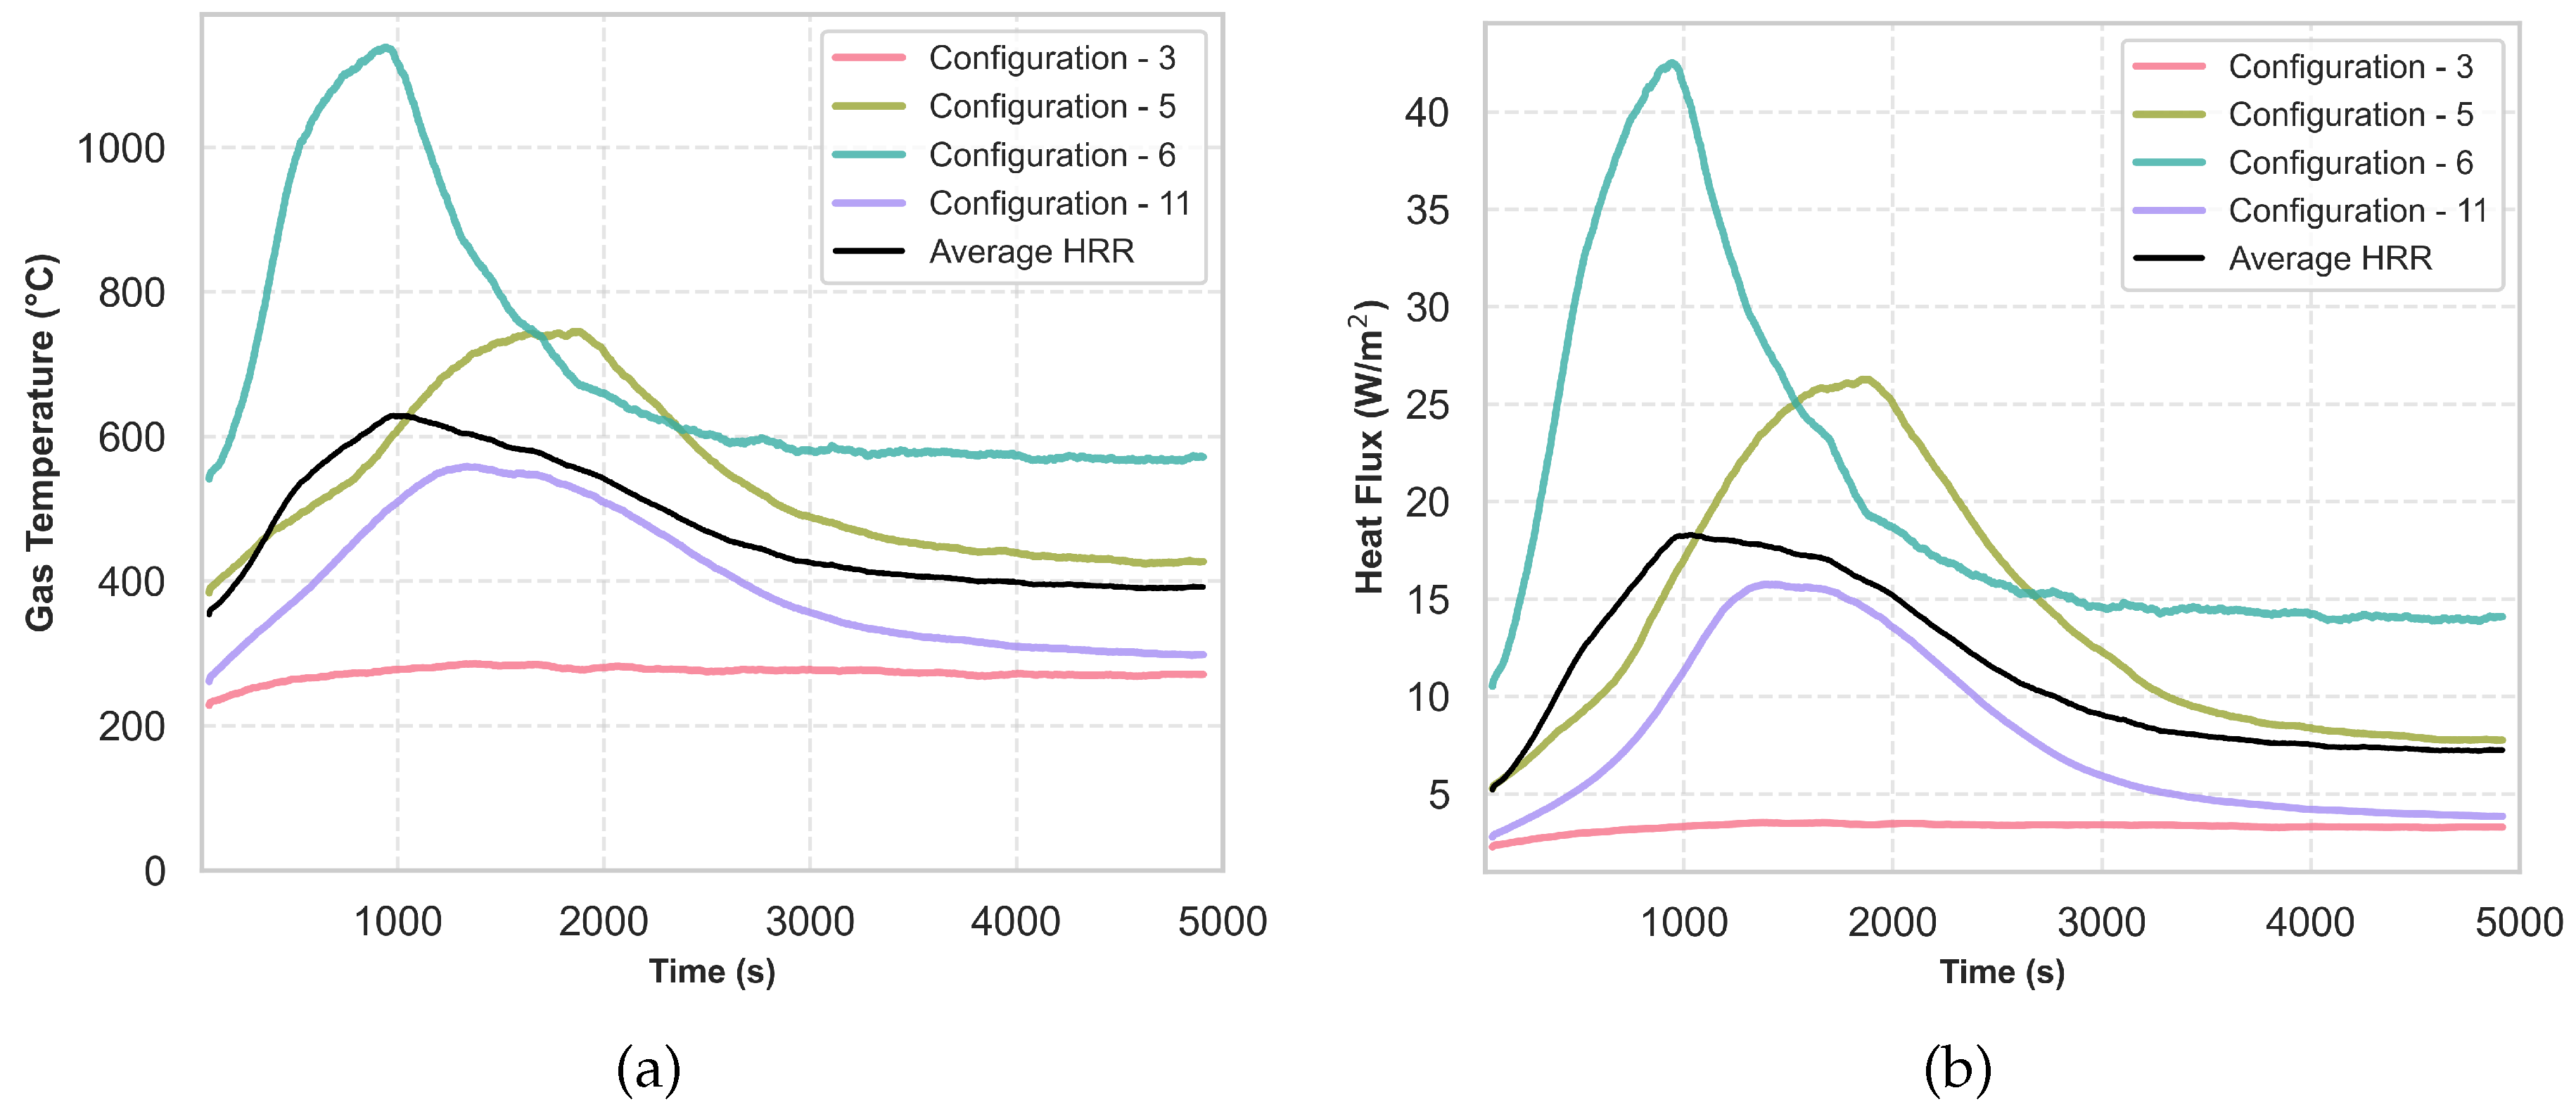
Table 1.
Range of cabinet parameters included in SED.
| Parameter | Symbol | Least | Median | Maximum | Unit |
|---|---|---|---|---|---|
| Volume | V | 0.72 | 1.17 | 1.62 | m3 |
| Ventilation Area | 0.04 | 0.10 | 0.16 | m2 | |
| HRRPUA | HRRPUA | 100 | 150 | 200 | kW/m2 |
| Combustible Burning Duration | 300 | 600 | 900 | s | |
| Combustible Wall Width | 0.3 | 0.4 | 0.5 | m | |
| Combustible Ceiling Width | 0.3 | 0.4 | 0.5 | m | |
| Ignition Source | HRRb | 20 | 40 | 60 | kW |
| Ignition Source Elevation | 0.0 | 0.6 | 1.2 | m |
Table 2.
Configurations with fixed cabinet parameters.
| Parameters | Symbol | Maximum |
|---|---|---|
| Volume | V | 0.72 m3 |
| Ventilation Area | 0.08 m2 | |
| HRRPUA | HRRPUA | 150 kW/m2 |
| Combustible Burning Duration | 300 s | |
| Combustible Wall Width | 0.5 m | |
| Combustible Ceiling Width | 0.5 m | |
| Ignition Source | HRRb | 40 kW |
| Ignition Source Elevation | 1.2 m |
Table 3.
Configurations with varying combustible positions.
| Configurations | Combustible Position | Ignition Source Elevation |
|---|---|---|
| 1 | Both side walls | Bottom |
| 2 | Both side walls | Bottom |
| 3 | Back wall array | Bottom |
| 4 | Side wall and ceiling | Bottom |
| 5 | Side wall and ceiling | Mid |
| 6 | Side wall and ceiling | Top |
| 7 | Three walls | Bottom |
| 8 | Three walls | Bottom |
| 9 | Side wall | Bottom |
| 10 | Back wall | Bottom |
| 11 | Two parallel | Bottom |
| 12 | Back wall array with both side combustible | Bottom |
Table 7.
Electrical cabinet fire parameters measured in actual experiments.
| Test | IHRR | HRRPUA | BD | CV | SA | VA | Peak HRR | Door Position |
|---|---|---|---|---|---|---|---|---|
| [kW] | [kW/m2] | [s] | [m3] | [m2] | [m2] | [kW] | ||
| 32 | 5.5 | 143.68 | 962.95 | 0.76 | 0.83 | 0.64 | 5.6 | Closed |
| 5.5 | 143.68 | 962.95 | 0.76 | 0.83 | 1.77 | 11 | Open | |
| 36 | 4.0 | 145.98 | 1289.18 | 0.79 | 0.79 | 0.10 | 2.5 | Closed |
| 4.0 | 145.98 | 1289.18 | 0.79 | 0.79 | 1.08 | 4.0 | Open | |
| 82 | 1.6 | 111.69 | 771.50 | 0.79 | 2.33 | 0.10 | 1.0 | Closed |
| 1.6 | 111.69 | 771.50 | 0.79 | 2.33 | 1.08 | 63 | Open | |
| 110 | 5.5 | 111.69 | 771.50 | 0.76 | 0.57 | 0.64 | 7.0 | Closed |
| 5.5 | 111.69 | 771.50 | 0.76 | 0.57 | 1.77 | 11 | Open | |
| 111 | 5.5 | 143.68 | 962.95 | 0.76 | 1.77 | 0.64 | 49 | Closed |
| 5.5 | 143.68 | 962.95 | 0.76 | 1.77 | 1.77 | 268 | Open |
Table 8.
Comparison of actual experiments and numerical study.
| Aspect | RACHELLE-FIRE Study | Parameters and Configuration Study |
|---|---|---|
| Methodology | Expert elicitation, probabilistic peak HRR distributions | Computational SED, FDS simulations |
| Key parameters | Cabinet size, fuel loading (default/low) | Combustible configuration, ignition location |
| Outcomes | Risk-optimized HRR percentiles | Parameter-specific mitigation strategies |
Disclaimer/Publisher’s Note: The statements, opinions and data contained in all publications are solely those of the individual author(s) and contributor(s) and not of MDPI and/or the editor(s). MDPI and/or the editor(s) disclaim responsibility for any injury to people or property resulting from any ideas, methods, instructions or products referred to in the content. |
© 2025 by the authors. Licensee MDPI, Basel, Switzerland. This article is an open access article distributed under the terms and conditions of the Creative Commons Attribution (CC BY) license (https://creativecommons.org/licenses/by/4.0/).
Copyright: This open access article is published under a Creative Commons CC BY 4.0 license, which permit the free download, distribution, and reuse, provided that the author and preprint are cited in any reuse.


