
Submitted:
14 May 2025
Posted:
15 May 2025
You are already at the latest version
Abstract
This study investigates the complex relationship between the performance of logistics and Environmental, Social, and Governance (ESG) performance drawing upon the multi-methodological framework of combining econometric with state-of-the-art machine learning approaches. Employing IV panel data regressions, viz. 2SLS and G2SLS, with data from a balanced panel of 163 countries covering the period from 2007 to 2023, the research thoroughly investigates how the performance of the Logistics Performance Index (LPI) is correlated with a variety of ESG indicators. To enrich the analysis, machine learning models—models based upon regression, viz. Random Forest, k-Nearest Neighbors, Support Vector Machines, Boosting Regression, Decision Tree Regression, and Linear Regressions, and clustering, viz. Density-Based, Neighborhood-Based, and Hierarchical clustering, Fuzzy c-Means, Model Based, and Random Forest—were applied to uncover unknown structures and predict the behaviour of LPI. Empirical evidence suggests that higher improvements in the performance of logistics are systematically correlated with nascent developments in all three dimensions of the environment (E), the social (S), and the governance (G). The evidence from econometrics suggests that higher LPI goes with environmental trade-offs such as higher emissions of greenhouse gases but cleaner air and usage of resources. On the S dimension, better performance in terms of logistics is correlated with better education performance and reducing child labour, but also demonstrates potential problems such as social imbalances. For G, better governance of logistics goes with better governance, voice and public participation, science productivity, and rule of law. Through both regression and cluster methods, each of the respective parts of ESG were analyzed in isolation, allowing to study in-depth how the infrastructure of logistics is interacting with sustainability research goals. Overall, the study emphasizes that while modernization is facilitated by the performance of the infrastructure of logistics, this must go hand in hand with policy intervention to make it socially inclusive, environmentally friendly, and institutionally robust.
Keywords:
Logistics Performance Index (LPI)
; Environmental Social and Governance (ESG) Indicators
; Panel Data Analysis
; Instrumental Variables (IV) Approach
; Sustainable Economic Development
1. Introduction
In the globalized world of today, logistics systems’ productivity and resilience are essential drivers of competitiveness at the national level as well as of economic development and sustainability. The empirical organization of supply chains, developments in technology and global trade intensification have brought the performance of logistics to the forefront of both economic policy and corporate decision-making. In parallel to these developments has been the rise of the Environmental, Social, and Governance (ESG) paradigm as the leading framework used to evaluate sustainable economic performance, transcending conventional financial measurements to consider broader societal and environmental consequences (Rodionova, Skhvediani, & Kudryavtseva, 2022; Tsang, Fan, & Feng, 2023). In the midst of these twin evolutions, a recurring and relatively unexamined question sits at its core:
- How do the interactions between the quality of logistics performance and each of the ESG pillars vary by country?
In contrast to the expanding real-world applicability of both ESG and logistics globally, academic work connecting the two is relatively rare. Most research on the Logistics Performance Index (LPI) targets economic metrics like trade levels, industrial competitiveness, and infrastructure quality (Nenavani et al., 2024), whereas ESG scholarship is typically centered around firm-level sustainability, ethical investment practices, and policy at a high level (Lee, 2024). Consequently, our knowledge base is missing a systematic exploration of how logistics capabilities impact environmental sustainability, social fairness, and governance quality at the country level. That is a stark deficiency, given how essential sustainable logistics has become to attainment of the United Nations Sustainable Development Goals (SDGs) (Rodionova et al., 2022). This article has as its objective bridging that gap through a data-driven examination of how disaggregated ESG indicator variables correlate with logistics performance. In contrast to research using composite ESG indices, however, the paper takes a disaggregated framework and looks at how infrastructure and efficiency in operations independently impact environmental (E), social (S), and governance (G) dimensions (Tsang et al., 2023). The research question is simple but fundamental:
- Does better logistics performance systematically have a positive impact on ESG results—and if so by which mechanisms?
In doing this, the research contributes to the growing nexus of sustainable development and logistics management and provides policy-relevant insights to policymakers, international development organizations, and global business executives. One of the fundamental strengths of the research is its multi-methodological design synthesizing advanced econometric modeling and machine learning (ML) methods. In addressing concerns of endogeneity, we employ instrumental variable (IV) panel regression models—namely, Two-Stage Least Squares (2SLS) and Generalized Two-Stage Least Squares (G2SLS)—on a balanced panel of 163 countries from 2007 to 2023. The models assist in ensuring causal robustness by controlling against omitted variable and reverse causality biases and firming up the validity of our results.
Besides using conventional econometric methods, the research makes use of advanced machine learning (ML) methods—supervised including Random Forest, k-Nearest Neighbors, and Support Vector Machines and unsupervised including Density-Based, Fuzzy C-Means, Hierarchical, Model-Based, and Neighborhood Clustering algorithms. These are used not only as robustness tests but also as tools to reveal challenging-to-detect nonlinear associations and unobserved dependencies missed by conventional econometric models. The utilization of ML to research on sustainability is on the rise and presents a solid complement to statistical inference by improving predictability and revealing unobserved patterns in high-dimension data (Binzaiman et al., 2024; Gupta, Sharma, & Gupta, 2021).
This two-methodological design significantly enhances internal validity and the generalizability of the results to the external environment. Apart from this, the research occupies the nascent tradition of scholarship adopting a rigorously combined integration of ML and econometric techniques to the scholarship on ESG incidents, a strand of scholarship still relatively underdeveloped but increasingly relevant (Ali & Zafar, 2024). In contrast to the conventional research loosely linking the performance of logistics to aggregate sustainability outcomes—basically measuring it by aggregate variables like carbon emissions or regulatory scores—is the precise decomposition of the ESG framework and identification of how each component of it contributes independently to the performance of logistics.
More concretely, the study looks at how the Logistics Performance Index (LPI) interrelates with different environmental, social, and governance variables. Environmental concerns are addressed through levels of greenhouse gas emissions, levels of air pollution, and land use patterns. Social concerns are addressed by means of indicators on the levels of education, provision rates of public services, levels of income, and levels of child labor. Governance concerns are addressed by way of measurements of government effectiveness, rule of law, regulatory quality, and a country’s scientific innovation capabilities. Breaking ESG down into its building blocks allows such a study to look deeper than a composite index and to better comprehend the nuances surrounding the means by which logistic systems might serve—or harm—sustainable development objectives.
A close examination of the existing literature confirms that none of the previous studies has conducted such a comprehensive and methodologically advanced exploration of the intersection of ESG and logistics on such a vast temporal and spatial scale. Most academic studies on the topic are restricted to narrow case studies and fail to employ causal identification techniques or consider ESG as a homogeneous undifferentiated concept without considering the heterogeneity of its environmental, social, and governance features (Gupta et al., 2021; Binzaiman et al., 2024). The empirical data is in line with the multi-dimensioned nature of such interactions. Logistics performance improvements as reflected by the LPI are consistently associated with positive and negative environmental effects both in terms of contributing to industrial emissions on the one hand and improved resource efficiency and reduction of particular pollutants on the other hand. Socially, increased logistic performance is associated with improved educational levels and decrease in child labor but also some evidence on possible aggravation of existing gaps. In governance terms, improved logistic competence is associated with improved government effectiveness as well as voice and accountability and scientific productivity. Simultaneously, however, such consequences also add a note of caution: efficient logistics foster sustainable development but are open to causing environmental degradation or exacerbating socio-economic disadvantage if left without appropriate regulatory and institutional safeguarding. These data support the significance of policy fixes that are comprehensive to bring together logistic development to serve global ESG purposes and long-term United Nations Sustainable Development Goals vision.
The paper is organized as follows. Section 2 reviews the existing literature, identifying the main conceptual frameworks and empirical findings to date. Section 3 presents the data sources, sample characteristics, and the econometric and machine learning methodologies employed. Sections 4, 5, and 6 are dedicated respectively to the analysis of the relationships between LPI and the Environmental, Social, and Governance components, detailing both the regression-based and clustering-based results. Section 7 concludes with a discussion of policy implications, limitations, and directions for future research.
2. Literature Review
The existing literature presents informed but incomplete insights into the interrelation between ESG outcomes and logistic performance tending to lack the level of systemic integration and granularity desired by this article. The research by Nenavani et al. (2024) and Lee (2024) has as its main objective assessing the financial impact of adopting ESG in the case of logistic firms but does not reveal its investigation to wider systemic interactions unfolding from country-wide metrics such as the Logistics Performance Index (LPI). While suggesting that the impact of ESG schemes is mediated by logistic performance and economic results, Park (2023) does fail to differentiate the ESG pillars and does not treat direct causality, a concern treated by this research. The issue of ESG challenges and opportunities in the post-COVID-19 context is broached by Juvvala et al. (2025) and Tsang et al. (2023), albeit in a way failing to integrate results systematically to transportation efficiency metrics such as the LPI. In the same spirit, research by Fan et al. (2025) and Rodionova et al. (2022) analyzes ESG’s impact on competitiveness and on stock performance but falls short of considering logistic infrastructure as country-wide driver of sustainability. Leogrande (2024) and Barykin et al. (2023) deal with smart and digitalized logistic as ESG enablers and participate in thematic add-ons short of adopting serious quantitative research practices like in the research presented here. The effect on firm performance of green logistic action is demonstrated by Kim et al. (2021) and Kim et al. (2024), and by Xie (2021), the latter focused on the dimension of ESG transparency but both are subject to micro perspectives. The use of technology is analyzed by Zhang et al. (2023), Bo (2024), and Moreira and Rodrigues (2023) but short of structural embedding of country-wide logistic performance in ESG effect. The research by Martto et al. (2023) and Dos Santos and Pereira (2022) generalizes ESG discourse to maritime and seaport logistic industries but fails to systematically analyze environmental, social, and governance dimensions separately vis-à-vis the LPI as it does in this article.
Pham et al. (2022), andŠulentić et al. (2022) acknowledge transport and logistic firms to be influenced by ESG but reduce ESG to aggregate scores and fail to identify pillar-specific effects as identified here. Błaszczyk and Le Viet-Błaszczyk (2024), Lee and Lee (2022) discuss communication and perception dimensions of ESG in the logistic sector but fail to attain econometric robustness. Stan et al. (2023), Gündoğdu et al. (2023) discuss impact of ESG on supply chains but by a generalised application by qualitative methods and non-dynamic panel data methods or by using machine learning algorithms. Shakil et al. (2024), and Chien (2023) include governance variables like board diversity but fail to capture how the impact of logistic infrastructure performance on ESG is systematically captured. Kudryavtseva et al. (2022), Lee et al. (2023), Yang et al. (2024), and Rapdecho and Aunyawong (2024) associate ESG and operation efficiency and productivity in the supply chain but to firm-specific or industry-specific studies and to system levels in countries by using LPI. Altın et al. (2023) associate climate policy uncertainty and logistic stock returns and ESG scores but fail to include pillar disaggregation. Chiang (2024), Zeng et al. (2022) document sustainable optimisation of the logistic industry but fail to document how optimisation practices are associated with larger ESG systems in countries. Zheng and Wang (2025) calculate competitiveness on efficiency of the logistic sector but their work does not systematically rule out environmental and social spillovers identified here. Shen et al. (2024) discuss digitization and benefits to ESG and Borisova and Pechenko (2021) discuss sustainable infrastructure but both fail to utilize instrumental variable panel data methods or machine learning regressions.
Research by Govindan et al. (2023) and Mutambik (2024) focuses on sustainability and governance in logistics companies but lacks generalizability at a country level. Yu et al. (2024) and Sun et al. (2024) design ESG assessment models but work primarily at conceptual or firm levels and lack the cross-country and long-dimensioned data included in this article. Kanno (2023) and Wu and Xie (2024) connect ESG to credit risk at the firm level but do not conceptualize the firm as a fundamental unit of analysis as they do so. Skhvediani et al. (2024) and Tian et al. (2025) acknowledge the role supply chain digitalization plays in improving ESG but do not systematically tie it to LPI measurements. Das (2024) and Burcă et al. (2024) emphasize the predictive ability of sustainability initiatives and ESG outcomes but fail to discuss drivers exclusive to the logistics sector at the country level. Kurniawan et al. (2024) and Niu et al. (2024) equate ESG with efficiency at the terminals and ports and get close to LPI issues but keep to a sectorial scope. Li and Wang (2024) and Fatimah et al. (2023) discuss procurement benefits and circular economy models but fail to consider logistics performance as a systemic driver. Together, this article is the first to combine both econometric and machine learning approaches to reveal LPI to be a first-order determinant of ESG outcomes and not a secondary measure and to do so across countries, filling gaps in existing research.
3. Data and Methodology
One of the main methodological difficulties faced in the current research stems from the non-existence of a continuous historical time series of the Logistics Performance Index (LPI). The available LPI data intermittently between the period of 2007-2023 pose a number of missing values by country and year and thereby complicate the creation of a full and balanced panel dataset adequate to perform rigorous econometric and machine learning analysis. In a bid to overcome this problem and maintain the consistency and integrity of the data’s longitudinal form, a polynomial-regression-based interpolation scheme was utilized. Polynomial fitting was used to fill in missing values on a country-wise basis to rebuild realistic historical traces of the LPI values and avoid risks of injecting spurious biases using simpler linear interpolation methods. The methodology is informed by existing research suggesting the benefits of using imputation as well as advanced interpolation methods in LPI research ranging from genetic algorithm-based weights to imputation methods using regression (Gürler et al., 2024). The second core analytic decision concerns ESG disaggregation. In contrast to keeping ESG as a combined or aggregate indicator, the research systematically breaks up the model into its three pillars—Environmental (E), Social (S), and Governance (G)—and studies the interrelation of LPI across each of these dimensions in turn. The pillar-wise design allows a finer and more detailed understanding of how the interactions between logistics performance and sustainability outcomes unfold than has been the case with prior research which tended to work with ESG as a uniform block. The research design is aligned with contemporary research underlining the different and diverging influence of a particular ESG dimension on firm and sector performance (Nenavani et al., 2024; Taskin et al., 2025). In keeping with the research question’s adverseness to simplicity, the analytic design follows both conventional econometric and sophisticated ML approaches. The econometric analysis was conducted by using Instrumental Variables (IV) panel regressions comprising both Two-Stage Least Squares (2SLS) and Generalized Two-Stage Least Squares (G2SLS) models to rigorously contend with endogeneity issues and ascertain causal interpretation of the estimated coefficients. Complementarily to the above, machine learning methodologies were implemented in both the regression and clustering tasks—utilizing Random Forest, k-Nearest Neighbors, Support Vector Machines, Decision Tree Regression, Boosting Regression, and Lasso in the case of the former and Density-Based Clustering, Fuzzy c-Means, Model-Based Clustering, Neighborhood Clustering, Random Forest Clustering, and Hierarchical Clustering in the case of the latter. The interplay between the econometric and machine learning models facilitates both the verification of outcomes by means of different methodological perspectives and the determination of nonlinear and latent patterns likely to pass under the radar of conventional regression analysis. These combined methodological options respond to the requirements of data constraints but also intensify the robustness, exhaustiveness, and novelty of the research’s empirical contribution to the extant literature on the topic of logistic performance and sustainable development.
4. Environmental Sustainability and Logistics Efficiency: A Multi-Method Analysis Using IV Regressions, Predictive Algorithms, and Clustering
This section examines the interplay between the Environmental (E) component of the ESG framework and the Logistics Performance Index (LPI) using a two-methodological framework involving Instrumental Variable (IV) panel models and machine learning (ML) models. IV models eliminate issues of endogeneity and enable causal inference of how environmental indicators such as PM2.5, nitrous oxide emissions, heat exposure levels, and agricultural land cover are determinative of logistics performance. This framework is a following of Wan et al. (2022), in which they emphasize controlling for environmental-economic interactions when measuring LPI, and particular emphasis on the dimensions of green innovation, renewable energy, and global integration. ML models—such as used by Gholami et al. (2020) in environmental hazard predictions—are applied to best achieve predictive power and to compare the relative effect of environmental variables. The clustering methods following Wang et al. (2023), who used functional regression-based clustering of air pollution data, identify latent country profiles through shared environmental-logistics patterns and add richness to the ensuing analysis.
4.1. Causal Estimation of Environmental Determinants of Logistics Performance Within the ESG Framework
This section investigates the impact of environmental and land-use variables on the Logistics Performance Index (LPI) across 163 countries from 2007 to 2023. Using fixed-effects two-stage least squares (TSLS) and generalized two-stage least squares (G2SLS) models, the analysis addresses endogeneity by employing a broad set of instrumental variables. Key factors examined include nitrous oxide emissions, PM2.5 pollution, extreme heat exposure, agricultural land share, and agricultural value added. The results reveal that environmental degradation and land use dynamics significantly influence logistics performance, underscoring the need to integrate environmental considerations into logistics development strategies aligned with ESG objectives.
Specifically we have estimated the following model:
- t=[2007;2023]
The results are indicated in the following Table 1.
This research examines the determinants of the Logistics Performance Index (LPI) in 163 countries between 17 years using a panel data set of 2,771 observations. The scope focuses on the impact of environmental stressors—namely nitrous oxide emissions, PM2.5 air pollution, and exposure to extreme temperatures—alongside land-use variables like the agricultural land share and the value added by agriculture, forestry, and fishing on logistics performance. This research methodology is consistent with recent research highlights on the nexus between environmental quality and logistics systems with better LPI linked to increases in environmental costs like rising carbon emissions as against improvements in technological innovation and urbanization (Magazzino et al., 2021). The authors deal with concerns of endogeneity by using a solid methodology framework by applying fixed-effects two-stage least squares (TSLS) and generalized two-stage least squares (G2SLS) random effects models. These methods capture unobservables across countries as well as utilize a rich collection of external instruments. Among the instrumental variables used are living standards indicators (access to clean fuels, clean fuel use, managed sanitation services), demographic and health indicators (life expectancy, fertility rate, mortality rates), governance indicators (rule of law, strength of legal rights), educational indicators (school enrollment, adult and youth literacy), and economic indicators (GDP growth rate, poverty hadcount, and Gini index). The model framework takes the cue from recent empirical work combining spatial and panel econometric approaches to better capture LPI determinants heterogeneity as shown by Xiao et al. (2022), who utilized geographically weighted regression models to reveal spatial differences in drivers of logistics performance (Xiao et al., 2022). The selection and diversity of the choice of instruments seem to suffice. Most of the indicators are sufficient to plausibly influence environmental and agricultural variables but are less likely to directly impact logistics performance save through their mediated effect and thereby fulfill the exclusion restriction principle. That the range of the set of instruments is so extensive means concerns of possible overidentification are always real and call for a careful interpretation. This is aligned with research from recent case studies like Xuan et al. (2023), which emphasized the necessity to control endogeneity and heterogeneity in panel models when measuring the effect of determinants of logistics across different countries and through time (Xuan et al., 2023).
The empirical outcomes are tractably consistent with both estimation methods and corroborate the robustness of the conclusions. All the five endogenous variables have statistically significant impacts on logistics performance, even though the global model fit as reflected by very low R-squared values seems to imply considerable unexplained variance. Of main conclusions to note are nitrous oxide emissions (NOE), which exhibit a positive and significant correlation with LPI. In both models, the estimated coefficient is around 0.0038 and is statistically significant at the 1% level. This finding seems to imply higher emissions are linked to improved logistics performance. While counterintuitive initially, it might be because of the fact that development of logistics—like the widening of the network of roads, warehouses, and supply chains—is closely associated with industrial activity also causing increased emissions. In developing economies particularly, fast expansion of the logistics sector typically co-exists with environmental degradation and may imply a trade-off best addressed by careful balancing by policymakers. Complementary mechanisms have been identified in the literature whereby the development of logistics is a mediating factor between increased economic complexity and increased levels of pollution (Constăngioară & Florian, 2023), and higher scores on LPI are found empirically associated with higher carbon emissions, especially in the case of emerging and transitional economies (Karaduman et al., 2020). PM2.5 exposure to air air pollution has a negative and statistically significant impact on logistics performance. The coefficients around -0.1099 and statistically significant at the 5% level imply the result is more in line with expectations. Poor air quality has the effect of lowering labor productivity, increase absenteeism on account of ill-health concerns, and cause disruptions to transport systems and thereby overall decrease logistic efficiency. This finding reinforces the policy relevance of environmental quality to both public health and economic infrastructure efficiency. In corroboration of this finding, recent research has established greenhouse gas emissions and other pollution indices significantly degrade logistic efficiency in Asian economies and highlight the case for climate-responsible logistics planning (Akram et al., 2023). The heat index above thirty-five degrees Celsius (HI35) also has a positive and statistically significant correlation with logistic performance. The estimated coefficient of around 0.0082 and statistically significant at the 1% level is a somewhat unexpected result. One reason that comes to mind is that nations with high exposure to heat have optimized their logistic operations to these environments through investment in technology (e.g., climate-resilient infrastructure, night-time logistic operations). Another interpretation is that some hot climate nations like the nations of the Middle East have advanced logistic infrastructure as part of general economic diversification plans. In terms of land use, a larger percentage of agricultural land (ALPA) is negatively related to logistic performance. The estimated coefficient is approximately -0.0058 and is statistically significant at the 5% level. This finding is as would be expected: countries with economies controlled by agriculture might have less advanced logistic networks with infrastructure focused more on local than on international or high value chains.
Conversely, the economic value of the agricultural sector as captured by the value added by agriculture, forestry, and fishing (AFFVA) has a positive impact on the performance of the logistic sector. The coefficient (~0.0831) is large and highly significant at the 1% level. This indicates that commercialization of agriculture and it becoming a serious GDP contributory sector spurs investments in logistic infrastructure like cold stores, export logistic hubs, and rural transport networks. This hypothesis is supported by evidence: agricultural commercialization-led expansion of cold-chain logistics has been found to play a vital role in product preservation, waste reduction, and rural incomes and livelihoods, in particular through innovations like phase change materials in storage systems (Zhao et al., 2022). Similarly, agricultural logistic production models like predictive routing of perishables also demonstrate how investment in the logistic sector improves efficiency and profitability in the agri-food industry (Liang et al., 2024). High-end agricultural system modeling work like Brazil’s soybean system also demonstrates how export-focused agricultural development drives advanced logistic capabilities like multimodal infrastructure and inter-stakeholder coordination (Filassi et al., 2022). Comparing the two models demonstrates a remarkable stability of results with virtually negligible differences in coefficients and z-statistics. The consistency of results across fixed and random effects specification implies that the core findings are unaffected by model selection. The Wald chi-square statistics are jointly significant at the 1% level in both models as a check on the joint significance of the regressors. Nonetheless, the extremely low R-squared levels (approximately 0.00017) imply that whereas the identified explanatory variables are statistically significant, they account for a virtually negligible share of the total variance in logistic performance. This result reflects the multifactorial nature of the development of logistics as influenced by a myriad of variables other than the environmental and land use variables used in this study. In summary, the research contributes to the insights on how environmental variables, land use, and the performance of the logistic sector interrelate. This demonstrates the important trade-offs in the interplay between economic development and environmental conservation and also calls for joint policies supporting logistic infrastructure and environmental protection concerns at the same time. Such nations should not overlook the environmental price paid by industrialization and also underestimate the role of commercialization through sustainable agriculture in promoting the advancement of logistics.
Causality. The fixed-effects two-stage least squares (TSLS) and generalized two-stage least squares (G2SLS) applications allow a causally robust interpretation of the correlation between environmental variables and logistics performance. Leveraging a dense set of instrumental variables that influence environmental and land-use patterns but plausibly exogenous to the domain of logistics performance, the analysis manages to evade common issues of endogeneity like omitted variable bias and reverse causality. The methodology is aligned with recent empirical work which has utilized the TSLS and G2SLS framework to separate causal effects in the presence of complicated interdependencies and confounders, particularly in studies of environmental and economic performance (Okanda et al., 2025). Similarly, in environmental quality and green logistics as well, Li et al. (2021) demonstrated how two-stage estimation methods are influential in capturing delicate interactions between logistics performance and sustainability outcomes across a variety of economies (Li et al., 2021). Consequently, the positive effects of nitrous oxide emissions and agricultural value added and the negative effects of PM2.5 air pollution and agricultural share of land are causal effects and pure associations. The research is thus more policy-relevant because it means environmental quality and land management directly impact a country’s ability to perform logistics. The low R-squared values do however reveal that even though remarkable influence is exerted by these variables on logistics performance, they capture only a fraction of the complicated determinants driving it.
Impact of the results within the E-Environmental Component within the ESG model. Empirical evidence elucidates a two-side and multifaceted relationship between environmental consequences and the performance of logistics. While on the first side, improved LPI scores are typically associated with greenhouse emissions such as nitrous oxide evidencing the environmental impact of widespread transport, warehouse operation, and industrial production. This presents a time-tested trade-off in development-environment terms: more developed infrastructure of logistics produces a superior level of economic development but also accelerates environmental degradation if it is uncontrolled. More contemporary research has identified systems of logistics such as third-party and heavy goods-associated systems as prominent producers of emissions unless practices of sustainability are implemented (Nawurunnage et al., 2023). Environmental degradation per se as well as air pollution (exposure to PM2.5) on the other hand negatively impinges on the efficiency and dependability of logistics. Pollution reduces productivity by labor, makes transport flows difficult and damages public health all of which impair the efficiency and dependability of logistics. Apart from environmental degradation per se, exposure to climate extremes such as hot days also underscores building climate-resililent systems of logistics. Adaptive practices such as green chains of supply, energy-efficient services and products as well as eco-friendly infrastructure are necessary to render logistics operations climate-resilent to climate risks. All of the above solutions are now increasingly implemented by models of logistics worldwide ranging from electric fleets and renewable sources to tracking emissions by blockchain in the supply chain (Onukwulu et al., 2022). The relationship between land use and logistics also confirms the role of the environment. Land economies with a high share of agricultural land have weaker performance of logistics while economies commercialized with sustainable land management are capable of developing stronger infrastructure of logistics. This is a part of a general transition towards a sustainable phase change in the development of logistics whereby firms are increasingly viewing green logistics as a source of competitive power to avoid the costs of emissions and to enhance resilience as opposed to a constraint (Nagy & Szentesi, 2024). Overall, incorporating strong environmental concerns into planning logic of logistics is now a requirement and not a choice but necessary to become competitive in the long term. Aligning LPI developments to Environmental pillar of ESG requires proactive investment in green logistics, regulatory transformation and sustainable innovation to ensure development of logistics complements and does not compromise global environmental goals.
4.2. Environmental Determinants of Logistics Efficiency: Evidence from Machine Learning Analysis Under ESG Standards
This section explores the application of various machine learning regression algorithms to predict the Logistics Performance Index (LPI) based on environmental and land-use variables. Models such as Boosting Regression, Decision Tree Regression, k-Nearest Neighbours, Linear Regression, Random Forest, Lasso, and Support Vector Machine (SVM) are compared using standard performance metrics including MSE, RMSE, MAE, MAPE, and R². The analysis identifies Random Forest Regression as the most robust model, offering the best trade-off between accuracy and generalizability. Further, variable importance measures from Random Forest highlight the critical role of environmental factors in shaping logistics performance across countries and over time (Table 2).
The relative performance of different algorithms on performance metrics offers useful insights on the most suitable model to utilize in predicting the Logistics Performance Index (LPI). Of the models tested—Boosting Regression, Decision Tree Regression, k-Nearest Neighbours (k-NN) Regression, Linear Regression, Random Forest Regression, Lasso, and Support Vector Machine (SVM)—the most balanced and stable option proves to be Random Forest Regression (Sun et al., 2024; Thummala & Baskar, 2023). A closer look at the results reveals the maximum R² value lies with Random Forest at a value of 0.29. This means that although the overall explanatory power was relatively low, Random Forest accounts for a larger percentage of the variance in the dependent variable compared to the other models. The larger R² value implies a better ability of the model to identify the underlying data complexity and non-linearities inherent in the data common in large datasets generally and with global-scale datasets like the one used in measuring logistics performance (Jomthanachai et al., 2022). Considering error measurements, Random Forest has a very competitive Mean Squared Error (MSE) of 464.679 and keenly follows Decision Tree Regression at a slightly better value of 435.315. Random Forest speeds past Decision Trees by providing better model stability and protection against the risk of overfitting and thus a better generalizability of the prediction (Sun et al., 2024). The Root Mean Squared Error (RMSE) of Random Forest is 21.556 and demonstrates a low prediction error on average expressed in practical terms and proves the predictability prowess of the model. Although Decision Tree Regression and k-Nearest Neighbours report slightly lower Mean Absolute Error (MAE) values than Random Forest, their overall robustness is less. Despite having a lower MAE value, Decision Trees are prone to overfitting and are more so if deep trees are used and data is noisy (Thummala & Baskar, 2023). K-Nearest Neighbours perform exceptionally well on MAE and MAPE (Mean Absolute Percentage Error) but fall flat when data structure is sparse or when variables are ill-scaled. Besides, k-NN is less interpretable and scalable and challenges are posed in its applicability to larger scale logistics or policy contexts (Jomthanachai et al., 2022).
The inconsistencies in Support Vector Machine (SVM) performance also serve to illustrate the relative stability of Random Forest Regression. Although SVM enjoys a remarkably low Mean Absolute Percentage Error (MAPE) of 24.52%, the performance appears inconsistent when compared to weak Mean Squared Error (MSE) and R² figures. Inconsistencies of this type are a common indicator of lack of stability in SVM models explained by unsuited scaling coefficients, ill selection of linearization or kernel functions, and insufficient parameter adjustment—issues also found in comparative ML studies such as Kocabaş et al. (2024), in which SVM had variable performance across tasks. Therefore, SVM is a risky option except in conjunction with excessive preprocessing and adjustment. Simpler linear models such as Linear Regression and Lasso consistently underperform on all the performance metrics evaluated. Their high MSE and Root Mean Squared Error (RMSE), in addition to low R² values, reveal a failure of interactions among governance, environmental, and economic variables and logistics performance to represent as anything else but non-linear interactions—a problem long established in broader comparative studies on using machine algorithms to perform regression (Al Bony et al., 2024). While understandable models such as linear models fail to capture required expressiveness in the given communication context, Boosting Regression, which typically excels base learners such as decision trees by learning refinement through multiple iterations and realignment of learners through boosting parameters, does not do any better here. While even optimized hyperparameters and large policy datasets are usually adequate in making the boost very powerful indeed, its less than optimal performance here may result from excessive fine-tuning with too little data or impact failure to capture non-linear interactions without additional fine-tuning. These problems are evocative of others found on other forums of assessment using machine learning where applying the boost backfires on the analyst when used on noisy and more unbalanced datasets (Hasanah, Soleh, & Sadik, 2024). By contrast to all this, however, we notice a more stable and solid performance by the Random Forest Regression on all of the main performance metrics. A good balancing of having low prediction error while balancing the requirement to stay interpretable makes it a strong model with none of its most important performance measures having a weak area. The design of the ensemble model makes it capable of catching non-linearity of interactions, linear or high-dimensioning data if required, and combat overfit by means of averagining out—it is perfectly placed to capture the Logistics Performance Index. These strengths as proven by recent empirical benchmarks (Al Bony et al., 2024; Kocabaş et al., 2024) also make it a better option when it comes to using predictive analytics in modeling logistics performance. Applying the Random Forest Regression we have the following results as showed in Table 3:
Applying the Random Forest process to the specified dataset unveiled pertinent information on the relative importance of explanatory variables to predict the Logistics Performance Index (LPI). The three importance metrics of Mean Decrease in Accuracy, Total Increase in Node Purity, and Mean Dropout Loss all recognize a core group of predictors key to determining the performance of both countries and times. The evidence shows agricultural land (ALPA) with a maximum Mean Decrease in Accuracy of 294.265 and is hence the most predictive variable on prediction accuracy. Removing or permuting ALPA causes the most harm to the performance of the Random Forest model. ALPA also tops Total Increase in Node Purity at a value of 98,796,892. This indicates how ALPA makes decision nodes purer with each split in the forest and contributes to its key determination of distinguishing better and worse performing logistics (Figure 1).
Nitrous oxide emissions (NOE) and PM2.5 air pollution exposure (PM2.5AE) also appear as vital predictors. NOE shows a Mean Decrease in Accuracy of 277.497 and a very high Total Increase in Node Purity (114,677,766), and it is arguably the second most influential variable following ALPA. PM2.5AE is close on its heels with a Mean Decrease in Accuracy of 224.074 and a comparable magnitude of increase in node purity. These results imply environmental degradation—the capture of which through air pollution and greenhouse gas emissions—contributes to influencing the outcomes of logistics significantly, possibly through its impact on the quality of infrastructure, productivity of labor, and general resilience of the economy. Recent research employing Random Forest models corroborates nitrous oxide emissions as a predictive force in environmental and agricultural modeling with their strong influence on a range of ecological and operationally focused outcomes (Samy et al., 2024; Maier et al., 2022). The Heat Index above 35°C (HI35) also shows a considerable predictive importance with a Mean Decrease in Accuracy of 237.642 and a considerable node purity contribution (77,966,120). This finding indicates the expanding role of climate-exacerbated stress drivers on the functioning of logistic systems as a result of which extreme heat events condition more and more the efficiency and resilience of transport and supply chains. In contrast, value added by agriculture, forestry, and fisheries (AFFVA) has much less importance by all measurements. Its Mean Decrease in Accuracy (16.990), Total Increase in Node Purity (30,634,277), and higher Mean Dropout Loss combined serve to indicate that though a factor, the impact on the functioning of the logistic system is much weaker compared to environmental degradation and land cover patterns. The figures of Mean Dropout Loss also further back up the interpretation lent by the two aforementioned measurements. ALPA and NOE share the maximum dropout losses and so imply when permutated, the root mean squared error (RMSE) of the model increases much as a result of their crucial role in correct predictions. PM2.5AE and HI35 also report high values of dropout losses and serve to emphasize how strong they are as drivers. These results are seconded by environmental prediction studies employing Random Forests to simulate PM2.5 responses to emission reductions and validating the model’s sensitivity to air quality and drivers (Shang et al., 2023). AFFVA ranks low on this scale again as expected given its weak predictive power. Overall, the Random Forest result shows environmental and land use variables to be among the best predictors of logistics performance with secondary influence by sectoral GDP contributions. These results indicate eventual improvements in systems of logistics to also hinge on addressing environmental issues and adapting to climate change.
4.3. Identifying Country Profiles: A Cluster Analysis of LPI and Environmental Indicators
This section explores the clustering of countries based on environmental factors influencing the Logistics Performance Index (LPI) within the ESG framework. Using six different clustering algorithms—including Density-Based, Fuzzy C-Means, Hierarchical, Model-Based, Neighborhood, and Random Forest clustering—we assess model quality through key metrics such as Dunn Index, Silhouette score, Pearson’s gamma, and entropy. The goal is to identify homogeneous groups that reveal distinct patterns between environmental variables and logistics performance. Among the evaluated methods, Density-Based Clustering emerges as the most robust, offering well-separated, compact, and interpretable clusters that deepen understanding of the environmental dimension’s impact on LPI outcomes (Table 4).
The multiple evaluation on multiple normalizer scores offers a good overview of relative performance of varied clustering algorithms. We compared density based clustering, Fuzzy C-Means clustering, hierarchical clustering, model based clustering, neighborhood clustering, and random forest clustering on a set of key measurements like maximum diameter, minimum separation, Pearson’s gamma, Dunn Index, Entropy, Calinski-Harabasz Index, R², AIC, BIC, and Silhouette score. The best to choose depends on judicious evaluation of the interpretation and relative weight of each of the above metrics. High values of minimum separation, Pearson’s gamma, Dunn Index, Calinski-Harabasz Index, R², and Silhouette are indicative of better performance on clustering quality while low values of Entropy, AIC, and BIC are favorable as they represent larger cluster purity and are terms penalized against excessive model complexity. Comparing the scores against each other, the best choice is obvious because it possesses the best and consistently good performance on the most notable clustering quality scores. It normalizes best on minimum separation and Dunn Index scores as two of the most noted measurements of good-separated and close clusters. Most notably its best minimum separation score demonstrates it maximizes inter-cluster distance between nearest cluster points as much as possible and is a good attribute in good clustering to minimize inter-cluster overlaps. In addition, best Dunn Index demonstrates that density based clustering has good intra-cluster distance to inter-cluster distance trade-off to produce both separated and close clusters. These strengths are also seen in modern empirical work where density based clustering (e.g., DBSCAN) has out-performed Fuzzy C-Means on real data with improved Silhouette Scores and better cluster separation (Auliani et al., 2024). Density-Based clustering also has good performance on model simplicity and cluster purity as indicated by its best-observed AIC and best-observed BIC values normalizing. Since both AIC and BIC are terms penalized against model complexity, low real values corresponding to high normal values indicate that density based clustering does not compromise on simplicity and risk overfitting but instead has good cluster separation. Value of Entropy normalizing to zero (best case) also validates the fact that clustering has very clean groups with little internal chaos. In clustering issues, a near-to-zero value of entropy is a positive indicator of good clustering and is a requirement when using clustering on real-life heterogeneous datasets. Fuzzy C-Means has flexibility to do soft clustering but optimizations in recent times were essential to overcome its drawback of dealing with overlapping and initialization sensitivity. More advanced models such as the ones with fractional order derivatives and regularization with entropy are found to outperform clustering on measures such as the Dunn and Silhouette indices and which also validate the argument of more adaptive algorithms in real-life scenarios in dealing with complex environments (Safouan et al., 2024). Likewise, intuitionistic fuzzy extensions have enhanced FCM’s robustness to noise and ambiguity in data by maximising feature weightings and initialization schemes to yield better values of entropy and Silhouette (Wang et al., 2021).
While Density Based Clustering fails to get the absolute best score on every metric, it is consistently good on the most important dimensions. While it may not have the maximum Pearson’s gamma, it has a decent and substantially better score than Model Based Clustering and Random Forest Clustering and a good correlation between data proximity structure and resulted clustering. The Silhouette score may also fall short compared to Hierarchical Clustering but is good and better than most methods and demonstrates internally cohesive and separated clusters supported by the fact that it confirms internally cohesive and separated structures by verifying it against a number of internal validity indices like Silhouette and Dunn Index (Syed, 2021). In considering options, Hierarchical Clustering has extremely good scores on Pearson’s gamma and Silhouette but is weak on other important dimensions like Minimum Separation, Dunn Index and simplicity measurements like AIC and BIC scores. While Hierarchical Clustering has good internal cohesion and correlation to data proximity, it fails on cluster separation robustness and has high on penalization metrics as a result and thus proves to be a weaker option overall against Density Based Clustering. This is consistent with evidence that validity indices—albeit good on their own in a single evaluation—do not necessarily map to genuinely good cluster structures when considering overall efficacy (Gagolewski et al., 2021). Neighborhood Clustering seems initially appealing with its best score on the Calinski-Harabasz Index and R². A close look at it though shows it has very low Minimum Separation and Dunn Index scores as well as very high Entropy and internally appears to have weakly separated and impure clusters. While a high Calinski-Harabasz Index and R² are preferable, they do nothing to overcome inherent defects in clustering structure fundamental to the type when separation and purity of the clusters are lost. As noted by Modak (2023), newer clustering validity measurements born out of density estimation are better than conventional single-measure testing like Calinski-Harabasz or Silhouette if the aim is to evaluate genuine structural clarity in dense data settings (Modak, 2023). In reality, low separation and excessive internal disorder may result in misleading or virtually unusable clusters whenever used in decision-making or pattern identification applications.
Model-Based Clustering and Fuzzy C-Means perform worse across most of the metrics. Fuzzy C-Means is acceptable on Entropy and Silhouette but severely underperform on Minimum Separation and Dunn Index, both pivotal in measuring cluster cohesion and separability. In addition to these two methods having weaker R² values and poor performance on model complexity measures, it indicates that they fit the data poorly or do so at the expense of excessive model complexity. These are amply documented in recent comparative research, whereby Fuzzy C-Means consistently underperformed in detecting structural variation in data and required considerable modification or hybridization to hold its own (Ghezelbash et al., 2025). In real-life clustering tasks, when scalability and interpretability are considerations, such performance deficits are intolerable. In terms of overall performance, Random Forest Clustering fairs the worst. It has very poor scores on Minimum Separation, Pearson’s gamma, Dunn Index, and Silhouette score as well as only fair scores on other metrics. Together with its high Entropy and poor cluster separation score, it shows that Random Forest Clustering generates poorly defined and internally disordered clusters—a defect also discovered by hybrid forecasting research needing to compensate for the technique’s shortcomings by using extra ensemble or even pre-processing methods (Zhang et al., 2024). This further excludes it as a serious contender as best algorithm in the comparison. Back to Density-Based Clustering, its obvious strength lies in obtaining a rare blend of well-separated, tight, pure, and simple groups. The ability to maintain uniform strength on multiple types of evaluation metrics as well as a balancing act among separation, cohesion, purity, and simplicity is undertaken elegantly by it. Such a varied and multi-dimensioned strength is exactly what is desired in clustering analysis, whereby excessive importance given to any single metric risks drawing incorrect conclusions about model quality. Further, it is amply documented in the literature as having the ability to detect arbitrarily shaped groups and robustness to noise and both of these increase its practical utility and extend its range of applicability to a wide range of datasets from dense and structured to noisy and complicated ones. Thus, by a detailed and unified inspection of all the given normalized measurements considering both theoretical expectation and practical reasoning, the optimal clustering algorithm here is Density-Based Clustering. It beats all the others by not necessarily having the best value on each particular measurement but by having a superior overall balance best fulfilling clustering’s fundamental objectives of creating separated, internally coherent, simple, and pure groups of data objects.
Using Density Based Clustering we have the following results (Table 5):
The clustering analysis produced three main clusters, with an additional group of noise points. The clusters show a highly unbalanced distribution: Cluster 1 includes 2517 observations, Cluster 2 only 8 observations, and Cluster 3 has 238 observations. The model explains approximately 19.3% of the total variance, as indicated by the ratio between the Between Sum of Squares (3099.35) and the Total Sum of Squares (16040.08), suggesting that the clustering captures only a moderate proportion of the overall variability. Cluster 1, which contains the majority of observations, shows variables close to the overall average, with all standardized means oscillating between approximately -0.3 and +0.3. The silhouette score for this cluster is 0.382, reflecting moderate internal cohesion and a less clear separation from other clusters (Figure 2).
This cluster may be interpreted as representing the general or “baseline” population. Cluster 2, with its very small size (8 observations), has a very high silhouette rating of 0.791, showing good cohesion and distinction from the remaining groups. The means reveal positive NOE emissions (+0.423), very low PM2.5 exposure (-2.623), very restricted agricultural land (-2.766), and a high added value from agriculture, forestry, and fishing (+0.843). This implies Cluster 2 represents countries or regions with high agricultural productivity and clean air condition despite relatively high nitrous oxide emissions (Noviandy et al., 2024). Cluster 3 with 238 cases is typified by a high Heat Index 35 (+3.250), meaning high exposure to heat stress as well as positive NOE emission (+0.684) and PM2.5 exposure (+0.606) deviances. The value of the silhouette score is 0.523, showing good but unspectacular cluster separation. This cluster seems to represent countries or regions with both high heat exposure and increased air pollution exposure levels--a finding consistent with results of recent semi-supervised analyses of PM2.5 clustering and patterns in air pollution at the regional level (Zhu & Liu, 2024; Nakhjiri & Kakroodi, 2024). In terms of clustering quality, silhouette values range from 0.382 to 0.791 across clusters and imply acceptable but imperfect partitioning of the data. The sum of squares within a cluster is very high for Cluster 1 (12160.403), suggesting internal fragmentation, while it is incredibly low in Cluster 2 (3.617), representing the tight clustering of this small group (Table 6). Overall, the model is successful in identifying discrete groups at the extremes of data distribution but with most values falling into a large and heterogeneous middle group (Noviandy et al., 2024).
5. Exploring the Interaction Between Social Factors and LPI in an ESG Context
This part examines the causality between the Logistics Performance Index (LPI) and the Social (S) pillar of the ESG framework in 163 nations from the period 2007 to 2023. Employing two-stage least squares (TSLS) and generalized two-stage least squares (G2SLS) techniques, the research looks at how important social variables like water and sanitation accessibility, education, population structure, income distribution and labor conditions influence the efficiency of logistics. Accounting for endogeneity by using a comprehensive set of instrumental variables, the outcomes show social development drivers to be important influencers of logistic performance and prove why socially inclusive approaches are required to boost supply chain systems everywhere.
5.1. Analyzing the S-Social Component’s Impact on Logistics Performance
This section explores the relationship between the Logistics Performance Index (LPI) and the Social (S) pillar of the ESG model. Using fixed-effects two-stage least squares (TSLS) and generalized two-stage least squares (G2SLS) methods, the study investigates how social factors—such as access to basic services, education, income distribution, labor market conditions, and demographic structures—impact logistics performance. The results reveal that improvements in social indicators can have both positive and negative effects on LPI, highlighting the intricate connections between human development, equity, and logistics efficiency within a sustainable growth framework.
We have estimated the following model:
- t=[2007;2023].
Results are indicated in Table 7.
This research examines the determinants of the Logistics Performance Index (LPI) of 163 countries over a period of 17 years using fixed-effects two-stage least squares (TSLS) and generalized two-stage least squares (G2SLS) models with random effects. The framework includes a broad range of instruments capturing economic, demographic, governance, and environmental data. One key finding from the research has a direct bearing on the Social (S) component of the ESG framework. The endogenous variables — i.e., access to safely managed drinking water (PSMWS) and sanitation services (PSMS), elderly population percentage (PA65A), primary school enrollment (SEP), employment of children (CET), prevalence of overweight adults (POA), and income share held by the poorest 20% (ISL20) — all are dimensions of social development considered essential. The correlation unfolds as follows: More widespread provision of simple services like water and sanitation is somewhat counterintuitively negatively related to the variable of logistics performance. While statistically robust, however, the effect is small and implies high-performance social service provision may be related to more rigorous regulatory systems or greater operational costs marginally impacting the effectiveness of logistics. Demographic issues are also seen: a larger percentage of aging population and more enrollment in schools is negatively related to LPI. This may represent the effects of changing labor market fundamentals, whereby aging societies and higher education enrollment fewer youth in the workforce temporarily limit the labor available to the heavily labor-intensive industries like logistics. The opposite effect is identified in the case of the prevalence of child labor (CET), which has a strong positive effect on LPI — a worrying indicator. This indicates improving the performance of logistics in less developed economies may depend partly on exploitative employment arrangements. This has a fundamental social sustainability issue at its core: efficiency gains at the expense of youth welfare and human rights are unacceptable if it goes against the core tenet under the Social pillar of ESG. Equally, the positive effect of overweight prevalence (POA) on the variable of logistics performance is likely a reflection of deeper patterns of economic prosperity and consumerism requiring more sophisticated systems of logistics. This also has social concerns related to modern lifestyles and unjust food systems. The negative correlation of income inequality (ISL20) and the variable of logistics performance is a fundamental finding. In economies in which the bottom 20% of the population possess less income, logistics systems look less efficient. More economic inequality contributes to fragmented markets, stagnant mobility, and lower human capital, all of which contribute to less smooth logistics operations. From an ESG-Social stance, this result confirms that more inclusive economic development bolsters better-performing logistics and supply chain systems. The extensive range of tools utilized — and range of indicators including internet penetration and rule of law, female labor force participation and governance — also highlight social and institutional environments as the determinants of the performance of logistics. More robust social structures, improved legal protections and more inclusive labor markets are not social goods alone but also efficiency enablers of global supply chain operations. In general, this examination makes it evident that social development underpins the performance of logistics. Education, services provision, equality of condition, labor quality and provision of health services all play important parts. Logistics infrastructures policies to enhance them must be strongly integrated with social investment plans to guarantee progress in the area of logistic infrastructures does not happen at the expense of the development of humanity but hand in hand with it and in full coherence with ESG-S objectives.
Causality. The causal identification strategy employed—fixed-effects TSLS and G2SLS with a rich instrument set—permits a strong identification of the causal impact of social variables on the Logistics Performance Index (LPI). The coefficients imply the causal influence of variations in social development indicators on logistics performance and do not simply correlate with it. In particular, better access to safely managed water (PSMWS) and sanitation (PSMS), a larger elderly population percentage (PA65A), and increased school enrollment (SEP) are causally associated with a marginally declining LPI, possibly through augmented regulatory costs or labor force shortages. More troublingly, the causal positive effect of child labor (CET) on LPI illustrates how, in certain settings, improving the efficiency of logistics depends on unsustainable and ethically challenged forms of labor. The causal negative effect of income inequality (ISL20) on LPI also shows how more equal income distribution facilitates the efficiency of the logistics system. Significantly, the instrumental variables technique enhances the causal assertions by reducing endogeneity generated by reverse causality or missing variable bias. Nevertheless, low R² values signify how social variables have statistically significant causal impacts but account for a minimal share of overall variance in the performance of the logistics system and argue in favor of combining social interventions with more general economic and infrastructural reforms.
Overall impact of the S-Social component within the ESG model. The evidence presents unequivocal empirical proof that the Social (S) pillar of the ESG framework has a causal and sizable yet multifaceted effect on the performance of logistics. Social improvements in indicators have a positive or negative impact on the Logistics Performance Index (LPI), highlighting the subtle tradeoff between operational efficiency and human development. The provision of fundamental services such as safely managed drinking water (PSMWS) and sanitation (PSMS), demographic transitions like population aging (PA65A), and increased enrollment in schools (SEP) are causally linked to declines of minor magnitude in the performance of logistics, probably indicative of increased regulatory costs or labor shortage. The worrying causal positive effect of child labor (CET) on LPI also indicates the persistence of socially unsustainable patterns supporting the efficiency of logistics in some economies. The positive causal effect of overweight prevalence (POA) on LPI also shows stronger consumer-led logistic requirements, while income inequality (ISL20) has a negative effect on logistic efficiency and highlights the importance of equalized growth. Although the causal evidence is statistically strong because a rich list of instrumental variables was used, the low values of R² reveal a minimal share of variance explained by social variables. Summing up, the development of logistic performance has to be coordinated with socially sustainable development policies completely aligned with ESG-S principles.
5.2. Machine Learning Estimation of Socio-Economic Impacts on Logistics Performance
This section applies machine learning methods to estimate the relationship between socio-economic variables and the Logistics Performance Index (LPI). Several algorithms—including Boosting, Decision Trees, Random Forests, and Support Vector Machines—are evaluated based on normalized performance metrics. The K-Nearest Neighbors (KNN) algorithm emerges as the most accurate and robust model, achieving the lowest prediction errors and the highest explanatory power. Further analysis identifies key social predictors, such as school enrollment, overweight prevalence, and child labor incidence, highlighting the critical influence of human development factors on logistics performance. These results underline the complex interplay between social structures and logistic efficiency (Table 8).
This cluster is seen to represent the overall or “baseline” population. Cluster 2, though having very small number of observations (8), also has a very high silhouette value of 0.791 as a testament to good clustering and separation between groups. The average values confirm positive NOE emissions (+0.423), very low PM2.5 exposure levels (-2.623), very low agricultural land usage (-2.766), and high value added from agriculture, forestry, and fishing (+0.843). This proves that Cluster 2 consists of countries or regions with high productivity in terms of agriculture and good air quality despite relatively high nitrous oxide emissions (Noviandy et al., 2024). Cluster 3 with 238 has a high Heat Index 35 (+3.250), indicating extreme exposure to hot air and heat stress, with associated positive departures of NOE emissions (+0.684) and PM2.5 exposure (+0.606). The silhouette value of 0.523 indicates good but imperfect separation of the groups. This group appears to represent countries or regions with both high exposure to heat and air pollution levels as per conclusions drawn in recent semi-supervised PM2.5 clustering and air pollution patterns by region by Zhu & Liu (2024) and by Nakhjiri & Kakroodi (2024). Within the quality of clustering, the silhouette values range from 0.382 to 0.791 across groups and are representative of an acceptable but imperfect data partitioning. The within-cluster sum of squares is very high on Cluster 1 (12160.403), as a marker of data variability internally in the group and is very low on Cluster 2 (3.617), as an indication of the closeness of the small group. Generally, the model is capable of separating groups at the extremes of data distribution but a majority of the data fall into a very large heterogeneous core group (Noviandy et al., 2024).
Using the K-Nearest Neighbors (KNN) algorithm to forecast the Logistic Performance Index (LPI) on the basis of socio-economic and demographic variables produces results both statistically robust and informative in terms of substance. Primary school enrollment (SEP) is the most significant predictor identified by feature importance assessment expressed as mean dropout loss (28.085), followed by adult overweight prevalence (POA, 26.403) and child labor (CET, 26.196). Other variables, such as access to safely managed sanitation services (PSMS), population percentage aged 65 and above (PA65A), income share of the lowest 20% (ISL20), and percentage of population with access to safely managed drinking water services (PSMWS), are also contributory but to a lesser magnitude. These results imply educational level, labor and public health indicators are fundamental determinants of logistic capacities at the national level (Figure 3).
The additive feature attribute analysis of the test dataset better represents the effects of single predictors on the model’s predictions. In all scenarios, the base prediction, the model’s prediction when particularized feature effects are removed, is a fixed value of 10.241. Deviations from the baseline represent the subtle interactions among variables: School enrollment (SEP) has a consistent strong positive effect on LPI predictions everywhere, especially in cases 1 to 4. Contrariwise, access to drinking water services (PSMWS) consistently has a negative effect, especially in cases 2, 3, and 4, and represents a mediated association with logistic performance by other infrastructural or governance variables. The negative effects of overweight prevalence (POA) and child labor (CET) also demonstrate the adverse effect of labor market distortions and healthcare on logistic efficiency. These inferences are consistent with recent studies using SHAP (Shapley AddExPlanations), which demonstrate the capacity of the technique to identify the marginal effect of predictors on models with a high degree of complexity (Gebreyesus et al., 2023; Mohanty et al., 2024). Overall, the KNN model not only makes good LPI predictions but also allows better interpretation by quantifying the marginal effects of key socio-economic variables, in a manner analogous to the SHAP-based explanations used in the prediction of the attrition of employees and diagnostics in healthcare (Varkiani et al., 2025; Mohanty et al., 2024). These inferences demonstrate interdependencies between logistic output and human development indicators and represent the significance of social policy considerations in logistic performance maximization plans (Figure 4).
5.3. Clustering to Verify the Relationship Between LPI and the S-Social Component of the ESG Model
This article examines the predictive correlation between the Logistics Performance Index (LPI) and a range of socio-economic and demographic variables using machine learning regression methods. Comparing different algorithms using normalised performance measurements highlights K-Nearest Neighbors (KNN) as the optimal technique to capture the underlying variance in logistics performance. Not only does KNN perform better in terms of predictive precision, but it also provides innovative insights into relative importance values of important social variables like education, health, and labor conditions. The investigation underscores how socio-economic development indicators play a pivotal role in determining logistics outcomes, thus supporting socially inclusive logistics approaches in the ESG framework (Table 9).
Based on normalised performance measurements, Neighborhood-Based Clustering is the most suitable out of the methods considered. This is evident in better performance on a set of core clustering validity measurements. Notably, it has the best R² value with a higher percentage variance explained compared to other methods. Moreover, it has a high Silhouette score, reflecting good internal cohesion and good separation between groups—properties of paramount importance to measuring the quality of a clustering structure (Syed, 2022). In addition to that, its strategically low maximum diameter and acceptable minimum separation values further attest to Neighborhood-Based Clustering to effectively minimize within-cluster dispersion and maintain different groups separated. Though it fails to achieve the best AIC and BIC values to evaluate model simplicity and goodness of fit, its performance remains competitive considering the merit of structural clarity and interpretableness to clustering analysis (Syed, 2022). Density-Based Clustering approaches, for example, despite having best scores on maximum diameter and Dunn index scores, register poor Silhouette values and weaker R² values and demonstrate weaker model robustness in the respective setting of this type of application (Fu et al., 2022). Likewise, while targeted metrics have good performance by Random Forest Clustering, it does not outperform consistently on all dimensions. Although it has good performance on certain dimensions of the clustering problem, its stability and interpretableness are unstable on different datasets (Bicego & Escolano, 2021). Neighborhood-Based Clustering therefore has the best trade-off among the considered methods between separation and compactness and model explanatory power and stability. Overall performance also means it is best suited to applications requiring consistent group distinction as well as internal consistency to exist and best used in the setting of the current investigation.
Applying Neighborhood-Based Clustering to the chosen socio-economic and demographic variables confirms a significant splitting of the dataset into ten groups with different profiles by logistic performance and corresponding indicators of human development. The silhouette values are mostly average but confirm acceptable cohesion among the groups, with cluster groups 8 and 10 sharing the highest internal consistency (0.450 and 0.430 respectively), suggesting consistency in relatively homogeneous patterns in the data (Yıldırım, 2023). The explained percentage of heterogeneity among the groups further confirms adequacy in the model, as in Cluster 5, the low percentage of heterogeneity (0.041) and a high cluster center LPI value (3.309) pick out a distinctive group with high logistic performance. Clusters 5 and 10 are indeed the most differentiated structural groups and show much higher Logistic Performance Index values compared to other groups with central values around negative LPIs (Kara, 2023). A look at the cluster centers picks out significant socio-economic contrasts. The groups found to have a higher LPI values are predominantly marked by improved coverage in terms of sanitation (high scores on PSMS), relatively higher proportions of elderly population (PA65A), improved coverage of safely managed drinking water (PSMWS), and more balanced income distribution (ISL20). The groups found to have low LPI centers (now classified as groups 3 and 7) are marked by negative performance in all of the above dimensions combined with increased prevalence of child labor (CET) and decreased enrolment in schools (SEP), suggesting structural weaknesses (Yıldırım, 2023). Surprisingly, Cluster 8 has a positive logistic profile even though it has low scores on water service indicators, implicating the hypothesis that education and income distribution may in this group make up deficits in infrastructure. These patterns amplify the importance of the inclusion of socio-economic dimensions in clustering methods in the case of logistics and infrastructure evaluation, as shown in previous examples of clustering in supply chain and logistic environments (Bicego & Escolano, 2021).Overall, the results demonstrate that logistic performance is closely intertwined with broader social determinants, including education access, labor market conditions, health outcomes, and basic service provision, confirming the multi-dimensional nature of logistics capacity within national and regional contexts (Kara, 2023).
Results are showed in Table 11.
6. Governance and Logistics Performance: An Empirical Assessment within the ESG Framework
The chapter examines the interconnection between governance quality and logistics performance in the ESG framework. By using fixed-effects two-stage least squares (TSLS), generalized two-stage least squares (G2SLS), machine learning models, and clustering methods on data from 163 countries between the period 2007-2023, the study documents how five key indicators of governance—government effectiveness, regulatory quality, political stability, rule of law, and scientific innovation—affect the Logistics Performance Index (LPI). The findings highlight the importance of robust, transparent, and accountable institutions to underpin efficient logistics systems but also the multifaceted and dynamic character of governance impacts on global supply performance.
6.1. The Role of Institutional Governance in Shaping Logistics Efficiency: An ESG Perspective
This section analyzes the causal impact of governance quality on logistics performance within the ESG framework, using an instrumental variables (IV) panel data approach. Drawing on a balanced dataset of 163 countries from 2007 to 2023, and applying fixed-effects TSLS and G2SLS estimators, the study isolates the effects of key governance dimensions—such as government effectiveness, regulatory quality, voice and accountability, and rule of law—on the Logistics Performance Index (LPI). By addressing potential endogeneity and omitted variable bias, the analysis provides robust evidence that governance factors are not merely correlated with, but causally linked to, sustainable logistics performance under the ESG model.
- t=[2007;2023].
Results are synthetized in Table 12.
The results prove insightful and straightforwardly strong on the premier role of governance in supporting logistics performance. Government Effectiveness (GEE) has a direct and very powerful impact on Logistics Performance Index (LPI), both with a coefficient of around 0.0152 and a significance of the 1% level. This shows competent, transparent, and efficient governments support the development of logistic systems in better managing infrastructures, providing services, and putting in force policies—a correlation also found in research on governance and economic development across regions (Effiong, Udofia, & Garba, 2023; Pinjaman et al., 2025). Regulatory Quality (RQE), to our surprise, has a very low but negative and statistically significant impact. Although the impact size is low, the result may signify a case of excessive restraint by overly burdensome or ill-designed regulatory systems to exact unintended costs or frictions on logistic operations in environments with excessive bureaucracy or controls stifling innovation and flexibility (Sadriu & Balaj, 2024). The Economic and Social Rights Performance Score (ESRPS) is inversely associated with the performance of logistics. The result means a structural problem: in nations heavily concentrated on generous social protections, regulatory heaviness or resource redistributive mechanisms may unwittingly limit investments or operational efficiencies core to logistic networks. It highlights a thin line between social progress and logistic efficiency (Baciu, 2023). Voice and Accountability (VAE) has a strong and significant correlation with LPI and indicates nations with freer media, better civic engagement, and accountable government have better logistic performance because they have better visibility, are more responsive to the marketplace, and less corrupt (Rawat, 2025). Science and Technical Journal Articles (STJA) grow LPI positively and show a role of innovation, research power, and tech creation to advance efficient and modern logistic fields. Political Stability and Absence of Violence (PSAOV), though modeled using very small coefficients, has a positive and a statistically significant correlation with LPI and means stability brings safety and predictability to assure local and foreign supply chains and thus avert risks and operational interruption—an inference supported by research on the impact of political governance on the economy in different nations (Rawat, 2025). Finally, Rule of Law (RLE) shows a positive and tangible impact in supporting the argument that solid legal institutions, protection of property rights, and adherence to contracts are essential pillars to support good logistic networks (Sadriu & Balaj, 2024). Statistically, the importance of the models is reflected in the Wald chi-square statistics as very high and confirm the joint appropriateness of the variables included. Although the R-squared values of approximately 0.0093 are low and express that variables of governance alone describe a relatively small percentage of the overall variance in logistic performance, their effect is statistically relevant and economically considerable. The use of a range of environmental indicators as a basis includes a range of indicators such as CO₂ emissions, exposure to PM2.5, consumption of energy, and climate variables, which adds richness to the model. While they are secondary to the objectives here but are relevant to any broader consideration of environmental issues and are remnants from our investigation of the environmental systemic shocks to the governance and the standards of logistics, their inclusion makes identification stronger by capturing risks on a higher level indirectly affecting governance and logistic environments. These results confirm good governance as a building block to the efficient logistic standards. Stable and efficient government, transparent and innovative as it is, will empower nations to build and maintain efficient logistic chains integral to competitiveness in a globalized economy. The results also alert, however, social and regulatory ambitions to be developed thoughtfully to avoid unwanted trade-offs with efficiency of operation. In the ESG framework, research supports that the Governance (G) pillar is not an ancillary variable but a direct determinant of infrastructure quality and efficiency of economy in logistics and sustainable development (Baciu, 2023; Pinjaman et al., 2025).
Causality. The results strongly confirm the causal association with the performance of logistics and the quality of governance in the ESG framework. The empirical approaches using an instrumental variables (IV) panel data methodology—fixed-effects two-stage least squares (TSLS) and generalized two-stage least squares (G2SLS) estimators—are used to address concerns on endogeneity problems such as reverse causation and specification of a relevant variable. The used econometric approaches are consistent with recent research on causal inference using IVs in data setups with a high level of data complexity (Cheng et al., 2023; Long et al., 2023). The robust coefficients on governance metrics such as Government Effectiveness (GEE), Voice and Accountability (VAE), and the Rule of Law (RLE) provide strong evidence to confirm the premise that improvements to governance institutions are linked to but do not merely correlate with improving logistics performance. The careful selection of the instrumental set of variables such as environmental and macro-structural drivers (e.g., CO₂ emissions and PM2.5 exposure and energy consumption), removes confounding exogenous variation in governance quality and thereby bolsters identification. The subject modelling selections are consistent with stronger and distributionally robust IV estimation methods now suggested in available literature (Qu & Kwon, 2024). This provides support to the overall finding that institutional efficiency, accountability, transparency, and stability are key drivers to efficiency in logistics in any confounding macroeconomic environments. Although the relatively low R-squared values indicate that governance contributes partially to variance in logistics outcomes, the strongly significance Wald chi-square statistics confirm the combined significance of the governance predictors. The study thus presents robust causal evidence supporting the inclusion of governance reforms as a key prescription to leverage logistics systems under the ESG framework (Cheng et al., 2023; Long et al., 2023).
Overall effects of G-Governance elements in the ESG framework on Logistic Performance Indicators. The evidence confirms the Governance (G) pillar of the ESG model as having a causal and pivotal impact on country differences in logics performance. Applying an instrumental variables (IV) panel data framework with fixed-effects TSLS and G2SLS estimators to avoid endogeneity issues, the research highlights the effect on governance quality independently. Results indicate higher government effectiveness, rule of law, and voice and accountability are significantly and positively related to improved logics outcomes, whereas excessively complicated regulatory environments and redistributive social policy options on occasion may bring in unnecessary inefficiencies. While governance on its own accounts for a relatively small percentage of the variance in logics performance, its effect exists and is both statistically and economically significant. These results are consistent with existing research on the importance of good governance practices improving both logics capacity and financial performance in logics firms and markets—particularly ESG-aware markets (Nenavani et al., 2024; Lee, 2024). In addition, they complement research evidence that ESG integration, and in particular good governance mechanisms to facilitate it, may represent a performance catalyst even in financial markets—highlighting the strategic importance of governance to investor confidence and sectoral returns (Rodionova et al., 2022). Overall, the research demonstrates transparent, stable, and efficient institutions as essential drivers to sustainable and competitive logics systems and confirms the centrality of the Governance pillar of the ESG model to public policy and infrastructure and also to private sector logics strategy and investor behavior (Lee, 2024; Nenavani et al., 2024).
6.2. Machine Learning Regressions LPI and G-Governance
In a range of multiple regression algorithms including Boosting Regression, Decision Tree Regression, k-Nearest Neighbors Regression, Linear Regression, Random Forest Regression, and Support Vector Machine Regression, models were systematically compared against a range of statistical performance metrics: Mean Squared Error (MSE), Root Mean Squared Error (RMSE), Mean Absolute Error (MAE), Mean Absolute Percentage Error (MAPE), and the coefficient of determination (R²). Of the models tested, the k-Nearest Neighbors (k-NN) Regression algorithm consistently outperformed its peers with the best values for MSE (215.583), RMSE (14.683), and MAE (5.779), and the relatively high R² as a result of 0.619. These combined to confirm k-NN Regression as having the best ability to minimize prediction error while also having the ability to maintain a high percentage of variance of the response variable. The same has been seen in uses of k-NN to predict solar radiation and cryptocurrency prices where it maintained competitive accuracy and stability (Troncoso et al., 2023; Jenifel et al., 2024). While the Support Vector Machine (SVM) model had an anomalous low MAPE (18.16%), its severely low R² value (0.024) highlights a serious lack of explanatory power and consequently makes it inadvisable to maintain robust predictive model suitability in the case. The result concurs with issues identified in other areas of research using SVM as its sensitivity to data distribution has resulted in unstable estimates despite low error values (Maheshwari et al., 2024). While Random Forest Regression had the best value of R² (0.628), it had marginally higher error values than k-NN and was subsequently unable to outrank it in terms of predictive ability. These trade-offs demonstrate typical practice using ensemble learning whereby reductions in variance might result in increases in small levels of bias (Jenifel et al., 2024). Combined, these results confirm k-Nearest Neighbors Regression to have the most optimal mixture of both minimalism on both sides and optimally ensuring both correctness as well as generalizability. As such, it is hereby proposed as the best methodology to be adopted in predictive work in datasets of similar behaviour (Table 13).
Within the proposed study, the k-Nearest Neighbors (k-NN) regression model was used to probe the impact of the “Governance” (G) component of the ESG framework on the Logistic Performance Indicator (LPI). The research used a range of governance-focused predictors to include Government Effectiveness Estimate (GEE), Regulatory Quality Estimate (RQE), Economic and Social Rights Performance Score (ESRPS), Voice and Accountability Estimate (VAE), Scientific and Technical Journal Articles (STJA), Political Stability and Absence of Violence Estimate (PSAOV), and Rule of Law Estimate (RLE). Feature importance was constructed using mean dropout loss metrics to reveal STJA (29.515) and VAE (28.538) as the most vital variables on the predictive capability of the model. This result implies the importance of elements associated with scientific output as well as with participatory governance as key drivers in the governance dimension on logistic system efficiency—a finding concordant with recent research on the contributions to investment climates and institutional performance from innovation and democratic accountability (Sadriu & Balaj, 2024; Mukhtar, 2023). ESRPS (23.916) and RLE (20.574) also proved to have substantial importance to identify the instrumental role of leveled-up rights protection and legal pillars. This concurs with existing work pointing to the prediction power of legal-institutional variables in performance modeling in industries such as infrastructure and building (Peiman et al., 2023). GEE (20.056), RQE (17.422), and PSAOV (16.924), on the other hand, had comparatively low but non-zero impacts. These outcomes highlight the non-uniformity of the governance dimension whereby all governance indicators do not have equal impact on logistic performance. Specifically, the empirical data highlight the disparate influence of knowledge production and accountability mechanisms compared with more conventional governance metrics (Table 14). These add to a finer-grained comprehension of the “G” component’s operationalization of ESG-led logistic performance models and impart strategic insights into policy design and institution building to augment logistic system capability through governance reforms (Mukhtar, 2023; Sadriu & Balaj, 2024).
Following the global feature importance analysis, additive explanation outputs were utilized to dissect the individual contributions of each governance-related predictor toward the Logistic Performance Indicator (LPI) across specific test cases within the k-Nearest Neighbors (k-NN) regression model framework. The base score (i.e., the predicted outcome without the influence of any predictors) remained constant at 10.678 across all instances, allowing for a direct comparison of feature impacts. The use of additive interpretability methods is increasingly recognized as essential for understanding the nuanced behavior of ML models, particularly in k-NN and SVM contexts (Boukrouh et al., 2024). Across all five cases analyzed, the Economic and Social Rights Performance Score (ESRPS) consistently exhibited the most substantial negative contributions, with reductions ranging from -16.067 to -14.116. This indicates a strong inverse relationship between perceived human rights performance and logistic efficiency under the conditions observed—possibly reflecting a trade-off between social equity measures and operational productivity in constrained institutional environments. Simultaneously, the Voice and Accountability Estimate (VAE) demonstrated large positive contributions (ranging from approximately +7.964 to +9.862), reaffirming its pivotal role as a driver of logistic performance within the governance dimension. The findings support existing literature that links participatory governance with improved infrastructure and service delivery outcomes (Ilyas, 2024). Scientific and Technical Journal Articles (STJA) presented a more nuanced pattern, occasionally contributing positively (e.g., +0.773 in Case 3) or negatively (e.g., -5.932 in Case 5), suggesting a context-dependent influence, potentially moderated by other institutional or sector-specific factors not captured in the model. Such complex and dynamic relationships are often uncovered through interpretable ML frameworks in health and policy analytics, where variable interactions depend heavily on contextual moderators (Guo et al., 2025). Conversely, Government Effectiveness Estimate (GEE) and Regulatory Quality Estimate (RQE) exhibited minor, mostly near-zero impacts on the predicted LPI values, with a notable exception in Case 5, where GEE contributed positively (+2.120) and RQE negatively (-1.209). This implies that governance efficacy and regulatory oversight may exert influence only under specific institutional or structural conditions (Boukrouh et al., 2024). Political Stability and Absence of Violence (PSAOV) and Rule of Law Estimate (RLE) consistently produced modest effects, albeit with variability in direction and magnitude, highlighting their secondary but non-trivial role. Overall, the additive explanations reinforce the existence of a differentiated structure within the Governance component of the ESG model, where participatory governance (captured through VAE) emerges as the primary positive driver, while human rights considerations (ESRPS) represent a critical constraint. This nuanced insight emphasizes the necessity of selective governance interventions, tailored not merely to improve aggregate institutional scores but to strategically enhance the most impactful subdimensions for logistic system optimization (Table 15).
6.3. Clustering Governance Profiles and Their Impact on Logistics Performance
This section examines the relationship between governance quality and logistics performance through an advanced clustering analysis. Using a comprehensive dataset spanning 163 countries from 2007 to 2023, multiple clustering algorithms—including Density-Based, Fuzzy C-Means, Hierarchical, Model-Based, Neighborhood, and Random Forest clustering—were compared across several internal and external validation metrics. Among these, Neighborhood Clustering demonstrated superior performance, achieving the highest R² and Calinski-Harabasz scores, alongside strong compactness and separation properties, reflecting the method’s effectiveness in identifying stable and interpretable clusters (Guo et al., 2025). The application of Neighborhood Clustering revealed ten distinct clusters characterized by varying governance and logistics performance profiles. Some clusters, particularly those with high government effectiveness, regulatory quality, and voice and accountability, were associated with better logistics outcomes—a pattern consistent with prior spatial and regional analyses emphasizing the link between governance infrastructure and logistics development in economically integrated zones (Tao et al., 2022). However, other clusters showed that strong governance indicators alone do not always guarantee superior logistics performance, suggesting the presence of additional mediating factors such as technological capacity, regional integration, or socio-economic disparities. This observation reinforces the need for interpretability and contextual sensitivity in unsupervised learning applications to ensure that model outputs reflect real-world complexities and policy-relevant dynamics (Guo et al., 2025). Overall, the clustering analysis underscores the complex, multifaceted relationship between the Governance (G) pillar of ESG and the Logistics Performance Index (LPI), highlighting that institutional quality interacts with a broader set of structural and operational variables to shape outcomes (Table 16).
The comparative assessment of clustering models was established using multiple internal and external validation indices, such as Maximum Diameter, Minimum Separation, Pearson’s γ, Dunn Index, Entropy, Calinski-Harabasz Index, R², AIC, BIC, and Silhouette Score. Each index highlights different clustering performance aspects and therefore provides a multi-aspect basis for model selection (Gagolewski et al., 2021). From the assessment, Neighborhood Clustering had better overall performance on most of the key indices. It had the best R² value (0.702), which shows the best explanatory strength compared to other models, and had an extraordinary Calinski-Harabasz Index (721.077), indicating exceptional cluster closeness and distinctiveness. In addition to that, Neighborhood Clustering had a good Silhouette Score (0.250), which indicates relatively cohesive clustering structure. The low values of AIC and BIC also reveal high model simplicity and fit and are a strong aspect conducive to its applicability in real-life scenarios requiring simplicity of models (Sarmas et al., 2024). Hierarchical Clustering also had competitive performance, but especially outshines on Pearson’s γ (0.618) and the Dunn Index (0.064), revealing good intra-cluster coherence and inter-cluster separation. Nonetheless, its relatively low R² and high values of information criteria in comparison to Neighborhood Clustering might confine it to a second option in scenarios requiring maximal predictive stability. The above finding aligns with other comparative research evincing the trade-offs associated with hierarchical approaches (Hossen & Auwul, 2020). In contrast to the above findings, algorithms like Random Forest Clustering and Model-Based Clustering had multiple shortcomings. Random Forest Clustering had the poorest Silhouette Score (-0.170) and relatively weak R² (0.267), which indicates less cohesive cluster formation and weaker explanatory power. Although Model-Based Clustering had relatively good performance on some indices, its negative Silhouette Score (-0.030) is a concern as it questions the clarity of cluster interpretation, a concern commonly espoused when model assumptions fail to match data structure (Gagolewski et al., 2021). Density-Based Clustering and Fuzzy c-Means Clustering had varied performance results. While a good Silhouette and Pearson’s γ were returned by the Density-Based Clustering model, it had a weaker R² and Calinski-Harabasz Index and thus less optimal cluster structures. Fuzzy c-Means Clustering, although having a relatively high Calinski-Harabasz Index, reflected poor cohesion (Silhouette Score = 0.120) and separation (Dunn Index = 0.004), revealing weaker clustering behavior (Sarmas et al., 2024). Overall, on a balanced comparison of cohesion, separation, model fit, and predictive power, Neighborhood Clustering proves to be the best fit algorithm best suited to start with the dataset. The fact that it has been found superior on more than one dimension validates its suitability, especially in applications requiring structural simplicity, model stability, and explanatory power (Hossen & Auwul, 2020; Sarmas et al., 2024).
So applying Neighborhood Clustering we have the following results as showed in Table 17.
The clustering analysis, which was used with the aim to investigate the association of governance indicators and the Logistic Performance Indicator (LPI), demonstrates a sophisticated and subtle form across ten different groups of observations. Each of the groups is identified not merely by size but also by distinctive governance and institutional profiles as indicated by the cluster centers (Yıldırım, 2023). The most distinctive group is Cluster 3 with its very high LPI center (3.251) and positive centers of GEE (0.415), RQE (0.237), ESRPS (0.657), VAE (0.075), and PSAOV (0.273). The configuration indicates better improvements in different dimensions of governance—such as government effectiveness, regulatory quality, performance in terms of human rights, and stability in politics—are aligned with much superior logistic performance. The relatively high silhouette score of Cluster 3 (0.263) also confirms its internal consistency. These developments are in line with larger research evidence connecting governance quality with better logistic outcomes when governance is combined with technological and administrative advancement (Slezák, 2023). In contrast, most other groups (Clusters 1, 2, 4, 5, 6, 7, 8, 9, and 10) have negative LPI centers and thus depict inferior logistic performance. In all such groups, governance indicators are often both negative and extremely polarized. In Cluster 2, despite positive centers of GEE (1.256), ESRPS (1.169), and VAE (1.378), the LPI center is negative (-0.282). The inconsistency implies that even though indicators of governance are good-looking, other underlying variables such as quality of infrastructure or geographical location unexplained in the model may damp down logistic efficiency (Pehlivan et al., 2024). Cluster 5 and Cluster 6 are of particular concern. Cluster 5 has the maximum RQE center (2.339) and a maximum PSAOV center (5.663), which demonstrates high regulatory quality and stability in politics. The corresponding LPI center is still negative (-0.276), which indicates a mismatch between governance improvement and logistic outcomes possibly caused by lag effects or sectoral inefficiencies. Cluster 6 has a small group (n=9) with a maximum silhouette score (0.684), which demonstrates very good internal constancy. Although the group has high stability in politics and relatively neutral profiles of governance indicators, its LPI center is negative (-0.277), showing that even under highly homogeneous circumstances logistic performance is poor. This result confirms that rule of law by itself is insufficient to guarantee logistic success but requires complementarity by economic or infrastructural variables (Yıldırım, 2023). Cluster 7 presents a remarkable pattern with a strongly positive RLE (4.396) but yet a negative LPI (-0.307), indicating the rule of law as vital but insufficient in itself to guarantee logistic success (Table 18). Generally, the clustering solution documents that rule of law variables are vital but exert complicated and mediated effects on logistic performance. The finding emphasizes the necessity to pursue a multidimensional approach towards logistic success models by complementing rule of law reforms with focused investments in infrastructure, education, and a diversified economy (Pehlivan et al., 2024; Slezák, 2023).
The cluster means analysis presents differentiated governance and logistic performance profiles among the ten identified groups. The best mean LPI of Cluster 2 (1.169) is accompanied by strong positive governance indicators such as Government Effectiveness (GEE = 1.256) and Voice and Accountability (VAE = 1.378), even with as yet marginally negative Regulatory Quality (RQE = -0.282). These are in line with previous work on the strong performance of groups with high civic engagement and high social capital as regards filling up logistic indices (Pehlivan et al., 2024). Similarly, Cluster 5 also presents a high LPI mean (0.830), supported by outstanding scores in Economic and Social Rights Performance (ESRPS = 5.663) and Regulatory Quality (RQE = 2.339) and shows the significance of improved protection of rights and better regulation as drivers to advanced logistic performance—akin to patterns seen in general policy and general supply chain clustering research (Yıldırım, 2023), (Figure 5).
While Cluster 3 has the best RQE (3.251), it has a marginally high increase in LPI (only 0.657), which validates the fact that the quality of regulation by itself, without concomitant increases in other dimensions of governance, does not holistically optimize logistic performance (Ulkhaq, 2023). Cluster 6 has the maximum divergence in Scientific and Technical Journal Articles (STJA = 15.237), but its LPI mean is near zero (almost), and it shows that scientific production as desirable may have to be accompanied by better governance to contribute meaningfully to logistic system improvements. Clusters 1, 9, and 10 are characterized by low means in LPI (-0.480, -1.892, and -0.185) and by overall poor governance indicators. In particular, Cluster 9 has the pessimistic profile with strongly negative values on all the variables GEE, RQE, ESRPS, VAE, and RLE and demonstrates the synergies of low governance to logistic low efficiency (Ulkhaq, 2023). Interestingly, Cluster 7 positions itself strongly positive on RLE (RLE = 4.396) but has a negative LPI mean (-0.178), and it shows that legal structures by themselves are insufficient to propel logistic performance because other dimensions of governance are missing. Finally, Cluster 8 is a comparatively balanced configuration with a relatively high LPI (0.543) and mean scores on all dimensions of governance and has a more integrated model of governance (Yıldırım, 2023). All of these combined outcomes verify the multifaceted character of logistic performance as a phenomenon in which discrete governance elements make a non-uniform contribution and require synergistic enhancement to make noticeable improvements (Pehlivan et al., 2024), (Figure 6).
7. Policy Implications
The implications of the results of this research are important to policymakers interested in linking logistics performance improvements to more general Environmental, Social, and Governance (ESG) goals. The results show how improvements in Logistics Performance Index (LPI) are interwoven with the core elements of the ESG framework. This finding indicates how goods and services traditionally associated with a sector or operations domain are a much more integral part of pursuing sustainable and fair development objectives (Sharawi et al., 2025). From a governance standpoint, the empirical results highlight the importance of good institutions capable of supporting regulatory quality as well as government effectiveness. Enhanced performance in logistics is positively related to better regulatory practices and governmental institutions, as evidenced by the striking correlation between LPI and Government Effectiveness (GEE) and Regulatory Quality Estimate (RQE) variables (Göçer et al., 2022). Policymakers are thus implored to pursue strengthening transparency, efficiency, and accountability in public sector organizations and to recognize how such improvements are likely to have spillover effects on the efficiency of logistic networks as well as on overall national competitive power. Social considerations are addressed by the research in showing how greater efficiency in logistic networks contributes significantly to a better realization of broader social rights outcomes like Economic and Social Rights Performance Score (ESRPS). More efficient logistic networks are likely to promote greater accessibility to essential goods and services and to promote fairness in social development. National development policies are thus urged to address the role of logistic infrastructure as more than an economic imperative but as a social imperative. Logistics investments are to be planned with clear social objectives to ensure the benefits from improvements in efficiency in the supply chain are shared equitably across various social classes and among different regions. Environmental consequences also appear as essential from the research. While the LPI does not directly capture environmental outcomes as a measurable variable, decomposition of ESG elements by the research shows how the impact of efficiency improvements in the logistic networks has to be accompanied by proactive environmental regulation and incentive arrangements motivated by a reduction in the environmental footprint of logistic chains. Governments are thus urged to contemplate adopting convergence to green logistic standards and promoting green transport practices as well as providing incentives to adopt low-emission technologies in the logistic industries.
Beyond borders, the interconnection of global supply chains necessitates global cooperation. The countries with high LPI scores promote trade both domestically and in a broader region. This emphasizes the functioning and efficiency of regional organizations and trade agreements in aligning the standards of logistics and sustainability policies (Sharawi et al., 2025). Policymakers thus need to pursue diplomatic efforts enshrining ESG issues in trade and transport agreements to avoid making efficiency in logistics a price paid at the expense of causing harm to the environment and social exclusion. Furthermore, the cluster analysis in this research exhibits heterogeneous patterns in countries’ performance regarding both logistics and ESG outcomes to support research on the spatial heterogeneity of supply chain efficiency and governance performance (Yıldırım, 2023).
This result highlights the necessity of differentiated policy responses. One-size-fits-all policies are unlikely to succeed with the differentenciing institutional, economic, and infrastructural circumstances across countries. Countries with low LPI scores and poor ESG indicators are best focused on core governance and infrastructure reforms, while countries in higher-performing groups might fine-tune their logistics ecosystems towards even higher levels of environmental and social sustainability (Lee, 2024). Further, the established causual dynamics connecting scientific output, as a proxy by the scientific and technical journal articles count (STJA), and logistics performance imply that policy on innovation has to accompany any policy on logistics. Governments need to promote research and development work focused on improving the features of logistics technologies, promoting the digitalization of the supply chains and the design of sustainable transport options. Government investment in advanced research and education on logistic issues will enhance LPI scores but also support the overall ESG agenda—an increasingly identified dynamic in recent research on ESG and logistics (Nenavani et al., 2024). The component of political stability as captured by the Political Stability and Absence of Violence/Terrorism (PSAOV) estimate also has a pertinent impact on the performance of logistics. Stable politics facilitates efficient and stable systems of logistics which in turn facilitate trade, economic progress, and social welfare. This shows that policy focused on improving political stability, dampening corruption and conflict are part and parcel of policy on logistics as well. In reality, transport and trade and also social and environmental affairs ministries have to collaborate much more cooperatively and across disciplines. Sectoral boundaries are likely to interfere with the type of across-the-board policymaking the results of this research call for. Cross-sectoral data analysis and evidence-supported assessment informed policy framework plans of action have to become the rule and not the exception. Lastly, also international development agencies and multilaterals and financial institutions should realign part of their investments in logistic infrastructures by tying ESG appraisal parameters to their evaluation methodology. Financing development has the power to become a potent driver in improving the performance of logistics and reaching ESG targets as long as it is aligned to the required standards of sustainability (Rodionova et al., 2022). In summary, the findings of this research locate the role of logistics performance as a key lever of sustainable development. Policy design has to acknowledge the multifarious nature of the impact of logistics on governance quality, social entitlements, green sustainability, and economic dynamism. Policymaking in the future has to be holistic, strategic, and responsive to context to release the full power of logistics as a source of ESG-compatible development (Nenavani et al., 2024; Lee, 2024).
8. Conclusions
This research undertakes a systemic examination of the multifaceted relationship between ESG outcomes and logistics performance and makes a valuable addition to the available research by combining econometric panel data methods with machine learning algorithms. Contrary to prior research and its tendency to typically discuss logistics and sustainability as two distinct areas or to limit itself to aggregate indices, this research breakingly examines the ESG dimensions separately and analyzes how infrastructures of logistics are interwoven with and influence each pillar in a large sample of countries during a long period. Empirical estimates derived from instrumental variable (IV) regressions demonstrate systematically how a higher Logistics Performance Index (LPI) is related to multiple aspects of sustainable development. In the environmental pillar area, better logistics performance exhibits a twofold character: in addition to promoting resource efficiency and mitigating certain types of pollution, it also correlates with higher levels of greenhouse gas emissions and thus with environmental dimensions as a consequence of infrastructure expansion and industry development. In the social pillar area, better logistics performance correlates with better education, less child labor, and wider accessibility to basic services but risks causing negative effects related to inequalities as well. In terms of governance, more robust logistics systems are found to support better institutional quality and more scientific productivity, more robust rule of law and more participative governance arrangements. The use of machine learning models, i.e., of Random Forest and k-Nearest Neighbors algorithms by applying them to regression and Neighborhood-Based and Density-Based clustering to unsupervised modeling, supports and confirms the results of the econometric models. These methodologies confirm both the predictive power of key ESG indicators but also reveal latent data structures and enhance the multifaceted interconnection between logistic capabilities and targets of sustainable development. The clustering analysis in particular identifies the presence of diverging country profiles where certain groups of countries achieve both better logistics performance and better ESG outcomes at the same time and others are caught in a vicious circle of low efficiency in logistics and weak sustainability indicators. Most importantly, the research indicates that while the development of logistics is a necessary condition to modernize the economy and integrate into the global economy, it does not necessarily translate into good ESG outcomes. Unless complemented by policies on environmental protection, social inclusion, and good governance, gains in the performance of logistics would risk making existing sustainability issues worse. The findings therefore highlight the imperatives of coordinated policy schemes to align investments in logistics with ESG priorities to guarantee that investments in improving infrastructures are used to increase economic efficiency as much as to bring about fair, resilient, and sustainable development. In conclusion, it underlines the importance of logistics systems as more than technical or economic enablers but as key drivers of larger sustainability pathways. Future studies will need to delve deeper into causal processes by which the interplay between logistics and ESG results occurs with possibly more detailed data by region or industry and further expanding the methodology to dynamic machine learning methods and causal inference models. Policymakers and inter-national organizations need to acknowledge that investment in sustainable logistic infrastructures is a strategic means towards fulfilling the United Nations Sustainable Development Goals and enabling a shift towards a more sustainable and environmentally responsible global economy.
Abbreviations
| LPI | Logistic Performance Index |
| AAGRPCI | Annualized average growth rate in per capita real survey mean consumption or income, total population (%) |
| ACFTC | Access to clean fuels and technologies for cooking (% of population) |
| AFFVA | Agriculture, forestry, and fishing, value added (% of GDP) |
| AFWT | Annual freshwater withdrawals, total (% of internal resources) |
| ALPA | Agricultural land (% of land area) |
| ASFD | Adjusted savings: net forest depletion (% of GNI) |
| ASNRD | Adjusted savings: natural resources depletion (% of GNI) |
| CDD | Cooling Degree Days |
| CET | Children in employment, total (% of children ages 7–14) |
| CO2E | CO2 emissions (metric tons per capita) |
| CODCDMPN | Cause of death, by communicable diseases and maternal, prenatal and nutrition conditions (% of total) |
| EILPE | Energy intensity level of primary energy (MJ/$2017 PPP GDP) |
| ESRPS | Economic and Social Rights Performance Score |
| EU | Energy use (kg of oil equivalent per capita) |
| FFEC | Fossil fuel energy consumption (% of total) |
| FPI | Food production index (2014–2016 = 100) |
| FRT | Fertility rate, total (births per woman) |
| GDPG | GDP growth (annual %) |
| GEE | Government Effectiveness: Estimate |
| GEET | Government expenditure on education, total (% of government expenditure) |
| GHGLUCF | GHG net emissions/removals by LUCF (Mt of CO2 equivalent) |
| GI | Gini index |
| HB | Hospital beds (per 1,000 people) |
| HDD | Heating Degree Days |
| HI35 | Heat Index 35 |
| ISL20 | Income share held by lowest 20% |
| IUI | Individuals using the Internet (% of population) |
| LEBT | Life expectancy at birth, total (years) |
| LFPRT | Labor force participation rate, total (% of population ages 15–64) (modeled ILO estimate) |
| LRAT | Literacy rate, adult total (% of people ages 15 and above) |
| LST | Land Surface Temperature |
| LWS | Level of water stress: freshwater withdrawal as a proportion of available freshwater resources |
| MRU5 | Mortality rate, under-5 (per 1,000 live births) |
| MST | Mammal species, threatened |
| NM | Net migration |
| NOE | Nitrous oxide emissions (metric tons of CO2 equivalent per capita) |
| PD | Population density (people per sq. km of land area) |
| PHRNPL | Poverty headcount ratio at national poverty lines (% of population) |
| PM2.5AE | PM2.5 air pollution, mean annual exposure (µg/m³) |
| POA | Prevalence of overweight (% of adults) |
| PSAOV | Political Stability and Absence of Violence/Terrorism: Estimate |
| PSHWNP | Proportion of seats held by women in national parliaments (%) |
| PSMS | People using safely managed sanitation services (% of population) |
| PSMWS | People using safely managed drinking water services (% of population) |
| REC | Renewable energy consumption (% of total final energy consumption) |
| RFMLFPR | Ratio of female to male labor force participation rate (%) (modeled ILO estimate) |
| RLE | Rule of Law: Estimate |
| RQE | Regulatory Quality: Estimate |
| SEP | School enrollment, primary (% gross) |
| SLRI | Strength of legal rights index (0=weak to 12=strong) |
| SPEI | Standardised Precipitation-Evapotranspiration Index |
| STJA | Scientific and technical journal articles |
| TMPA | Terrestrial and marine protected areas (% of total territorial area) |
| VAE | Voice and Accountability: Estimate |
Appendix A. Hyper Parameters of Regression Algorithms
Support Vector Machine Hyperparameters
| Category | Option | Setting |
| Data Split Preferences | Holdout Test Data - Sample | 20% of all data |
| Training and Validation Data - Sample | 20% for validation data | |
| Training Parameters | Weights | Linear |
| Degree (for polynomial kernel) | 3 | |
| Gamma parameter | 1 | |
| r parameter | 0 | |
| Tolerance of termination criterion | 0.001 | |
| Epsilon | 0.01 | |
| Scale features | ✔️ Enabled | |
| Set seed | 1 | |
| Costs of Constraints Violation | Costs settings | Optimized |
| Max. violation cost | 5 |
Regularized Linear Regression Hyperparameters
| Data Split Preferences | Holdout Test Data - Sample | 20% of all data |
| Training and Validation Data - Sample | 20% for validation data | |
| Training Parameters | Penalty | Lasso |
| Include intercept | ✔️ Enabled | |
| Scale features | ✔️ Enabled | |
| Set seed | 1 | |
| Lambda (λ) Settings | Selection | Optimized |
| Fixed value (if selected) | 1 (not selected) | |
| Largest λ within 1 SE of min | ❌ Disabled |
Random Forest Regression Hyper parameters
| Split Preferences | Holdout Test Data - Sample | 20% of all data |
| Training and Validation Data - Sample | 20% for validation data | |
| Training Parameters | Training data used per tree | 50% |
| Features per split | Auto | |
| Scale features | ✔️ Enabled | |
| Set seed | 1 | |
| Number of Trees | Tree selection | Optimized |
| Maximum number of trees | 100 |
Linear Regression Hyperparameters
| Category | Option | Setting |
| Data Split Preferences | Holdout Test Data - Sample | 20% of all data |
| Add generated indicator to data | ❌ Disabled | |
| Test set indicator | None (not selected) | |
| Training Parameters | Include intercept | ✔️ Enabled |
| Scale features | ✔️ Enabled | |
| Set seed | 1 |
K-Nearest Neighbors Regression Hyperparameters
| Category | Option | Setting |
| Data Split Preferences | Holdout Test Data - Sample | 20% of all data |
| Add generated indicator to data | ❌ Disabled | |
| Test set indicator | None (not selected) | |
| Training and Validation Data | Validation Sample | 20% for validation data |
| K-fold | ❌ Disabled | |
| Leave-one-out | ❌ Disabled | |
| Training Parameters | Weights | Rectangular |
| Distance | Euclidean | |
| Scale features | ✔️ Enabled | |
| Set seed | 1 | |
| Number of Nearest Neighbors | Selection Method | Optimized |
| Max. nearest neighbors | 10 | |
| Fixed nearest neighbors | ❌ Disabled |
Decision Tree Regression-Hyperparameters
| Category | Option | Setting |
| Data Split Preferences | Holdout Test Data - Sample | 20% of all data |
| Add generated indicator to data | ❌ Disabled | |
| Test set indicator | None (not selected) | |
| Training and Validation Data | Validation Sample | 20% for validation data |
| K-fold | ❌ Disabled | |
| Leave-one-out | ❌ Disabled | |
| Training Parameters | Min. observations for split | 20 |
| Min. observations in terminal node | 7 | |
| Max. interaction depth | 30 | |
| Scale features | ✔️️ Enabled | |
| Set seed | 1 | |
| Tree Complexity | Penalty Type | Optimized |
| Max. complexity penalty | 1 | |
| Fixed complexity penalty | ❌ Disabled (value: 0.01 grayed out) |
Boosting Regression Hyperparameters
| Category | Option | Setting |
| Data Split Preferences | Holdout Test Data - Sample | 20% of all data |
| Add generated indicator to data | ❌ Disabled | |
| Test set indicator | None (not selected) | |
| Training and Validation Data | Validation Sample | 20% for validation data |
| K-fold cross-validation | ❌ Disabled | |
| Training Parameters | Shrinkage | 0.1 |
| Interaction depth | 1 | |
| Minimum observations in node | 10 | |
| Training data used per tree | 50% | |
| Loss function | Gaussian | |
| Scale features | ✔️️ Enabled | |
| Set seed | 1 | |
| Number of Trees | Tree selection | Optimized |
| Maximum number of trees | 100 | |
| Fixed number of trees | ❌ Disabled (value: 100 grayed out) |
Appendix B. Hyper Parameters of Clustering Algorithms
Density Based Clustering hyper parameters
| Parameter | Value | Description |
| Epsilon neighborhood size | 2 | Maximum distance to include points in a point’s neighborhood (ε) |
| Min. core points | 5 | Minimum number of points required to form a core point |
| Distance | Normal | Type of distance used (likely Euclidean) |
| Scale features | Enabled | Features are scaled (normalized or standardized) |
| Set seed | Disabled | No seed set for result reproducibility |
Fuzzy C-Means Clustering hyper parameters
| Category | Parameter | Value | Description |
| Algorithmic Settings | Max. iterations | 25 | Maximum number of iterations allowed during optimization |
| Fuzziness parameter | 2 | Degree of fuzziness in fuzzy clustering (e.g., Fuzzy C-Means) | |
| Scale features | Enabled (✓) | Features are scaled (standardized or normalized) | |
| Set seed | Disabled (✗) | No random seed set for reproducibility | |
| Cluster Determination | Determination method | Optimized according to BIC | Number of clusters determined by Bayesian Information Criterion (BIC) |
| Max. clusters | 10 | Maximum number of clusters to consider in optimization | |
| Clusters (Fixed) | 3 (disabled) | Fixed cluster number is not used |
Hierarchical Clustering hyper parameters
| Parameter | Value | Description |
| Epsilon neighborhood size | 2 | Maximum distance to include points in a point’s neighborhood (ε) |
| Min. core points | 5 | Minimum number of points required to form a core point |
| Distance | Normal | Type of distance used (likely Euclidean) |
| Scale features | Enabled | Features are scaled (normalized or standardized) |
| Set seed | Disabled | No seed set for result reproducibility |
Model based Clustering hyper parameters
| Parameter | Value | Description |
| Center type | Means | Type of cluster center used (centroids) |
| Algorithm | Hartigan-Wong | Algorithm variant used for clustering (K-Means method) |
| Distance | Euclidean | Distance metric used for clustering |
| Max. iterations | 25 | Maximum number of iterations allowed |
| Random sets | 25 | Number of random initializations for better clustering |
| Scale features | Enabled (✓) | Features are scaled (standardized or normalized) |
| Set seed | Disabled (✗) | No random seed set for reproducibility |
| Cluster determination | Optimized (BIC) | Number of clusters determined using Bayesian Information Criterion (BIC) |
| Max. clusters | 10 | Maximum number of clusters to evaluate |
| Fixed clusters | Disabled (3 shown) | Fixed number of clusters not selected |
Neighbourhood Based
| Parameter | Value | Description |
| Model | Auto | Automatically selects the best clustering model |
| Max. iterations | 25 | Maximum number of iterations for model fitting |
| Scale features | Enabled (✓) | Features are scaled (standardized or normalized) |
| Set seed | Disabled (✗) | No seed set for reproducibility |
| Cluster determination | Optimized (BIC) | Number of clusters selected based on Bayesian Information Criterion (BIC) |
| Max. clusters | 10 | Maximum number of clusters to evaluate |
| Fixed clusters | Disabled (3 shown) | Fixed number of clusters not used |
Random Forest Clustering hyper parameters
| Parameter | Value | Description |
| Model | Auto | Automatically selects the best clustering model |
| Max. iterations | 25 | Maximum number of iterations for model fitting |
| Scale features | Enabled (✓) | Features are scaled (standardized or normalized) |
| Set seed | Disabled (✗) | No seed set for reproducibility |
| Cluster determination | Optimized (BIC) | Number of clusters selected based on Bayesian Information Criterion (BIC) |
| Max. clusters | 10 | Maximum number of clusters to evaluate |
| Fixed clusters | Disabled (3 shown) | Fixed number of clusters not used |
Appendix C. E-Enviromental Summary Statistics
| LPI | NOE | PM2.5AE | HI35 | ALPA | AFFVA | |
| Valid | 2771 | 2771 | 2771 | 2771 | 2771 | 2771 |
| Missing | 0 | 0 | 0 | 0 | 0 | 0 |
| Mode | 100.000 | -21.265 | 5.179 | 67.170 | 100.000 | 83.890 |
| Median | 2.760 | -21.265 | 4.830 | 67.170 | 72.900 | 83.890 |
| Mean | 10.854 | -21.265 | 5.177 | 67.169 | 65.608 | 83.909 |
| Std. Error of Mean | 0.497 | 1.688 | 0.054 | 0.330 | 0.686 | 0.154 |
| 95% CI Mean Upper | 11.828 | -17.955 | 5.283 | 67.817 | 66.954 | 84.211 |
| 95% CI Mean Lower | 9.880 | -24.576 | 5.071 | 66.521 | 64.262 | 83.607 |
| Std. Deviation | 26.155 | 88.873 | 2.852 | 17.387 | 36.134 | 8.104 |
| 95% CI Std. Dev. Upper | 26.862 | 91.277 | 2.929 | 17.857 | 37.111 | 8.324 |
| 95% CI Std. Dev. Lower | 25.484 | 86.593 | 2.779 | 16.941 | 35.207 | 7.897 |
| Coefficient of variation | 2.410 | -4.179 | 0.551 | 0.259 | 0.551 | 0.097 |
| MAD | 0.380 | 0.000 | 1.250 | 0.000 | 27.100 | 0.000 |
| MAD robust | 0.563 | 0.000 | 1.853 | 0.000 | 40.178 | 0.000 |
| IQR | 0.940 | 26.786 | 2.210 | 0.000 | 64.900 | 0.000 |
| Variance | 684.069 | 7.898.371 | 8.133 | 302.294 | 1.305.643 | 65.683 |
| 95% CI Variance Upper | 721.575 | 8.331.421 | 8.579 | 318.868 | 1.377.229 | 69.284 |
| 95% CI Variance Lower | 649.425 | 7.498.366 | 7.721 | 286.985 | 1.239.520 | 62.356 |
| Skewness | 2.986 | -4.217 | 2.322 | -1.261 | -0.650 | -3.304 |
| Std. Error of Skewness | 0.047 | 0.047 | 0.047 | 0.047 | 0.047 | 0.047 |
| Kurtosis | 6.984 | 26.820 | 7.759 | 3.475 | -1.067 | 18.588 |
| Std. Error of Kurtosis | 0.093 | 0.093 | 0.093 | 0.093 | 0.093 | 0.093 |
| Shapiro-Wilk | 0.336 | 0.551 | 0.796 | 0.754 | 0.826 | 0.483 |
| P-value of Shapiro-Wilk | < .001 | < .001 | < .001 | < .001 | < .001 | < .001 |
| Range | 99.810 | 1.044.803 | 23.950 | 100.000 | 99.800 | 77.688 |
| Minimum | 0.190 | -944.893 | 1.110 | 0.000 | 0.200 | 22.312 |
| Maximum | 100.000 | 99.910 | 25.060 | 100.000 | 100.000 | 100.000 |
| 25th percentile | 2.460 | -21.265 | 3.380 | 67.170 | 35.100 | 83.890 |
| 50th percentile | 2.760 | -21.265 | 4.830 | 67.170 | 72.900 | 83.890 |
| 75th percentile | 3.400 | 5.521 | 5.590 | 67.170 | 100.000 | 83.890 |
| 25th percentile | 2.460 | -21.265 | 3.380 | 67.170 | 35.100 | 83.890 |
| 50th percentile | 2.760 | -21.265 | 4.830 | 67.170 | 72.900 | 83.890 |
| 75th percentile | 3.400 | 5.521 | 5.590 | 67.170 | 100.000 | 83.890 |
| Sum | 30.076.280 | -58.926.381 | 14.345.898 | 186.125.522 | 181.800.321 | 232.511.799 |
Covariances
| NOE | PM2.5AE | HI35 | ALPA | AFFVA | LPI | |
| NOE | 7.898.371 | -26.637 | -119.086 | 5.641 | -36.715 | -23.566 |
| PM2.5AE | -26.637 | 8.133 | -7.922 | -22.657 | -2.142 | -3.410 |
| HI35 | -119.086 | -7.922 | 302.294 | 245.815 | 17.297 | 86.509 |
| ALPA | 5.641 | -22.657 | 245.815 | 1.305.643 | 88.102 | 209.274 |
| AFFVA | -36.715 | -2.142 | 17.297 | 88.102 | 65.683 | 11.491 |
| LPI | -23.566 | -3.410 | 86.509 | 209.274 | 11.491 | 684.069 |
Correlations
| NOE | PM2.5AE | HI35 | ALPA | AFFVA | LPI | |
| NOE | 1.000 | -0.105 | -0.077 | 0.002 | -0.051 | -0.010 |
| PM2.5AE | -0.105 | 1.000 | -0.160 | -0.220 | -0.093 | -0.046 |
| HI35 | -0.077 | -0.160 | 1.000 | 0.391 | 0.123 | 0.190 |
| ALPA | 0.002 | -0.220 | 0.391 | 1.000 | 0.301 | 0.221 |
| AFFVA | -0.051 | -0.093 | 0.123 | 0.301 | 1.000 | 0.054 |
| LPI | -0.010 | -0.046 | 0.190 | 0.221 | 0.054 | 1.000 |
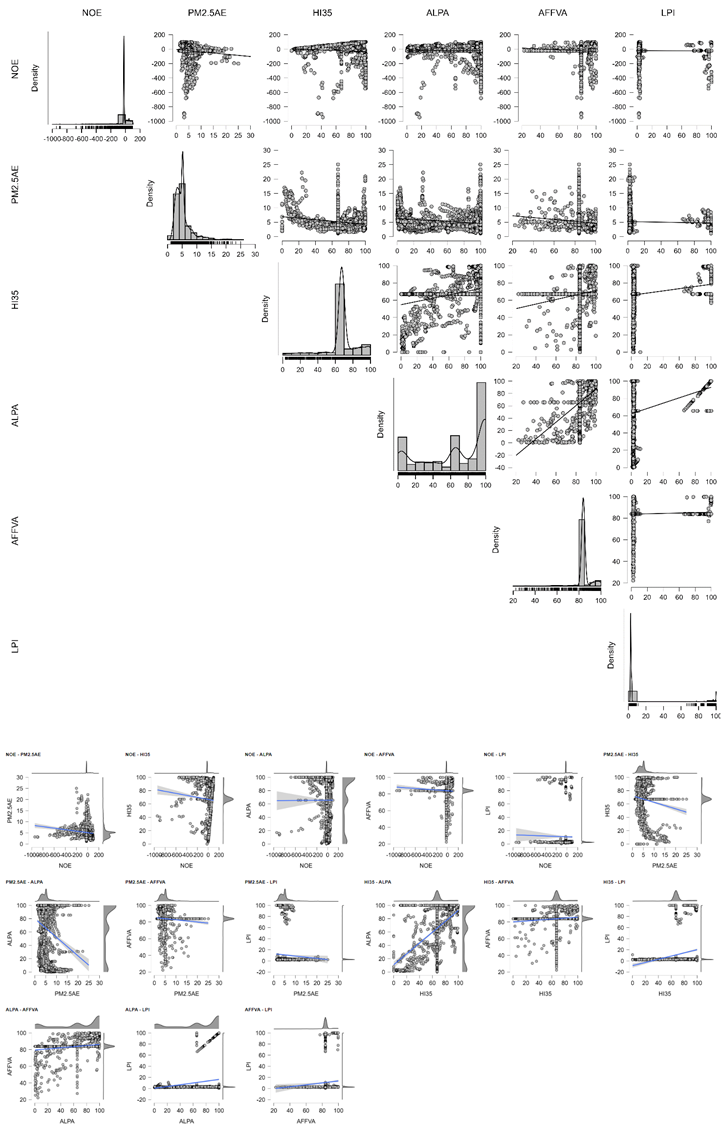
Q-Q Plots
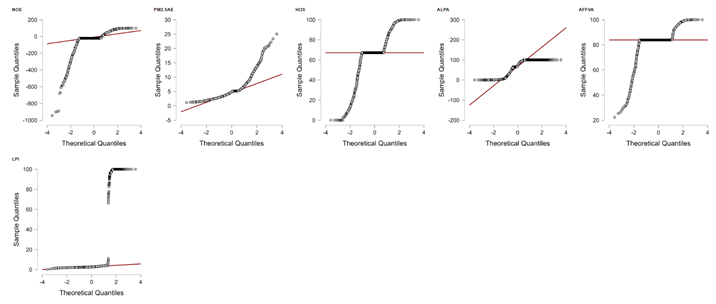
Boxplots
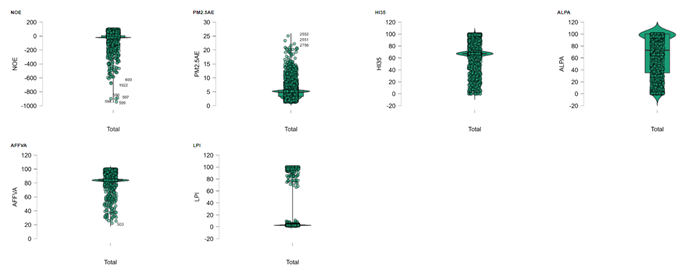
Distribution plots
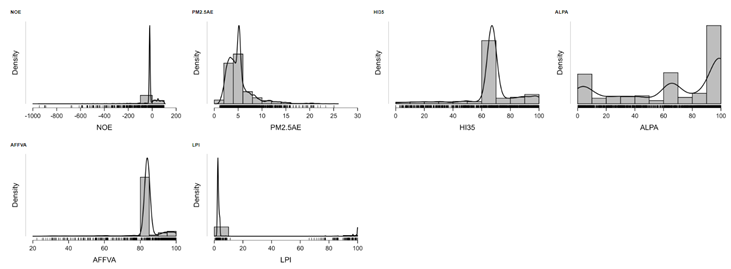
Interval plots
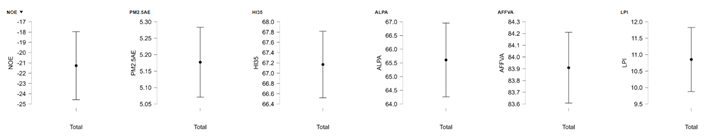
Dot plots
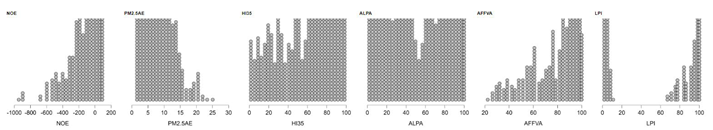
Appendix D. S-Social Summary Statistics
Descriptive Statistics
| LPI | PSMWS | PSMS | PA65A | SEP | CET | POA | ISL20 | |
| Valid | 2771 | 2771 | 2771 | 2771 | 2771 | 2771 | 2771 | 2771 |
| Missing | 0 | 0 | 0 | 0 | 0 | 0 | 0 | 0 |
| Mode | 100.000 | 2.500 | 70.660 | 7.346 | -0.176 | -0.115 | 21.092 | -0.046 |
| Median | 2.760 | 8.700 | 75.890 | 5.759 | -0.175 | -0.256 | 20.800 | -0.089 |
| Mean | 10.854 | 10.523 | 70.649 | 7.346 | -0.176 | -0.115 | 21.081 | -0.046 |
| Std. Error of Mean | 0.497 | 0.188 | 0.368 | 0.102 | 0.018 | 0.019 | 0.218 | 0.019 |
| 95% CI Mean Upper | 11.828 | 10.892 | 71.370 | 7.547 | -0.141 | -0.079 | 21.508 | -0.010 |
| 95% CI Mean Lower | 9.880 | 10.154 | 69.928 | 7.146 | -0.212 | -0.152 | 20.654 | -0.083 |
| Std. Deviation | 26.155 | 9.899 | 19.355 | 5.380 | 0.950 | 0.983 | 11.467 | 0.978 |
| 95% CI Std. Dev. Upper | 26.862 | 10.167 | 19.879 | 5.526 | 0.976 | 1.009 | 11.777 | 1.005 |
| 95% CI Std. Dev. Lower | 25.484 | 9.645 | 18.859 | 5.242 | 0.925 | 0.958 | 11.173 | 0.953 |
| Coefficient of variation | 2.410 | 0.941 | 0.274 | 0.732 | -5.389 | -8.514 | 0.544 | -21.161 |
| MAD | 0.380 | 5.700 | 10.464 | 2.491 | 0.635 | 0.644 | 7.526 | 0.686 |
| MAD robust | 0.563 | 8.451 | 15.514 | 3.693 | 0.941 | 0.955 | 11.158 | 1.017 |
| IQR | 0.940 | 9.400 | 23.747 | 5.737 | 1.279 | 1.352 | 14.860 | 1.381 |
| Variance | 684.069 | 97.998 | 374.634 | 28.946 | 0.902 | 0.966 | 131.488 | 0.957 |
| 95% CI Variance Upper | 721.575 | 103.371 | 395.175 | 30.533 | 0.952 | 1.019 | 138.698 | 1.010 |
| 95% CI Variance Lower | 649.425 | 93.035 | 355.661 | 27.480 | 0.857 | 0.917 | 124.829 | 0.909 |
| Skewness | 2.986 | 2.056 | -1.021 | 1.417 | -0.582 | 0.424 | 0.612 | 0.153 |
| Std. Error of Skewness | 0.047 | 0.047 | 0.047 | 0.047 | 0.047 | 0.047 | 0.047 | 0.047 |
| Kurtosis | 6.984 | 5.374 | 0.578 | 1.875 | 0.053 | -0.490 | 0.238 | -0.539 |
| Std. Error of Kurtosis | 0.093 | 0.093 | 0.093 | 0.093 | 0.093 | 0.093 | 0.093 | 0.093 |
| Shapiro-Wilk | 0.336 | 0.768 | 0.919 | 0.873 | 0.970 | 0.966 | 0.971 | 0.985 |
| P-value of Shapiro-Wilk | < .001 | < .001 | < .001 | < .001 | < .001 | < .001 | < .001 | < .001 |
| Range | 99.810 | 68.400 | 99.177 | 28.880 | 4.933 | 4.716 | 63.750 | 4.800 |
| Minimum | 0.190 | 2.500 | 7.345 | 0.100 | -3.313 | -2.591 | 0.000 | -2.548 |
| Maximum | 100.000 | 70.900 | 106.522 | 28.980 | 1.620 | 2.125 | 63.750 | 2.252 |
| 25th percentile | 2.460 | 2.500 | 60.459 | 3.688 | -0.714 | -0.823 | 12.531 | -0.741 |
| 50th percentile | 2.760 | 8.700 | 75.890 | 5.759 | -0.175 | -0.256 | 20.800 | -0.089 |
| 75th percentile | 3.400 | 11.900 | 84.206 | 9.425 | 0.566 | 0.529 | 27.391 | 0.640 |
| 25th percentile | 2.460 | 2.500 | 60.459 | 3.688 | -0.714 | -0.823 | 12.531 | -0.741 |
| 50th percentile | 2.760 | 8.700 | 75.890 | 5.759 | -0.175 | -0.256 | 20.800 | -0.089 |
| 75th percentile | 3.400 | 11.900 | 84.206 | 9.425 | 0.566 | 0.529 | 27.391 | 0.640 |
| Sum | 30.076.280 | 29.159.833 | 195.768.244 | 20.356.604 | -488.409 | -319.845 | 58.416.354 | -128.115 |
| ᵃ The mode is computed assuming that variables are discreet. | ||||||||
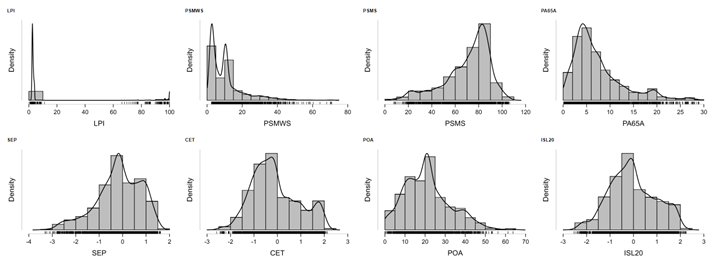
Correlation plot.
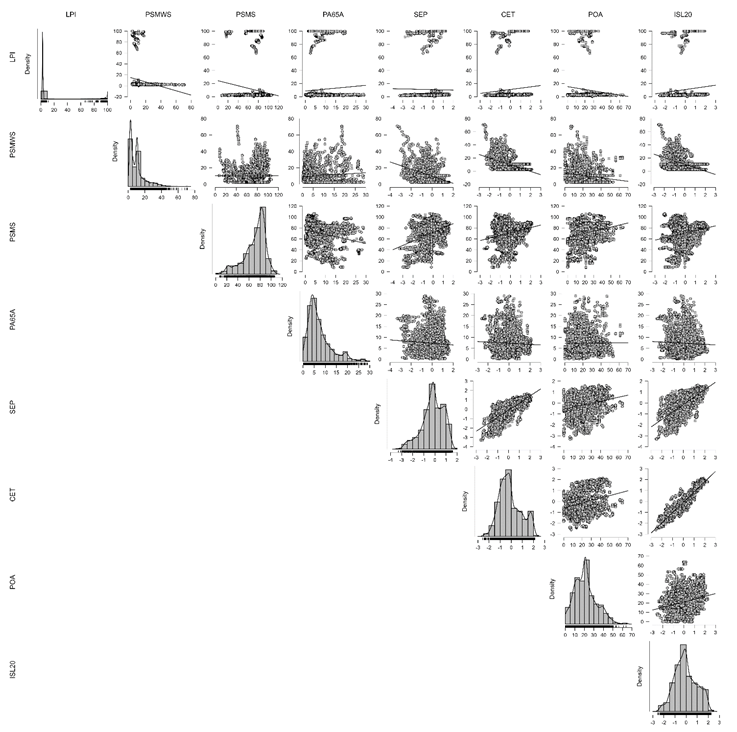
Box Plots
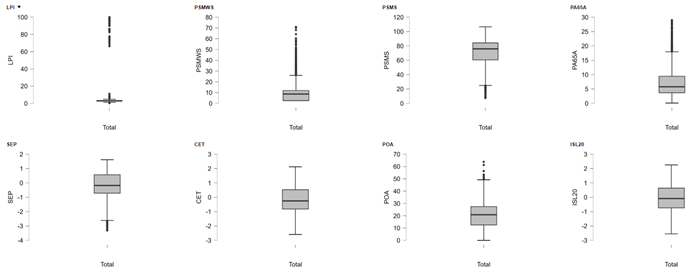
Q-Q PLOTS.
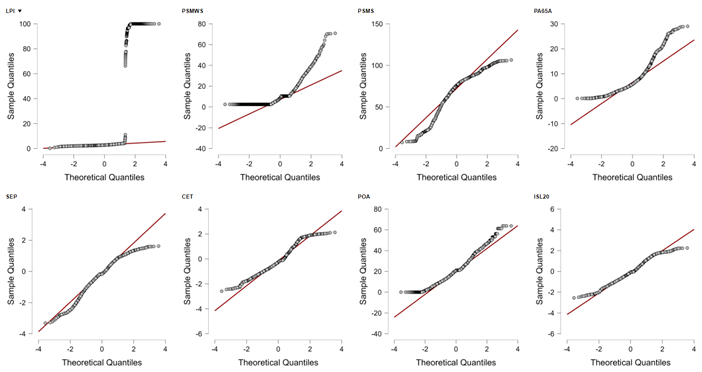
Scatter plots
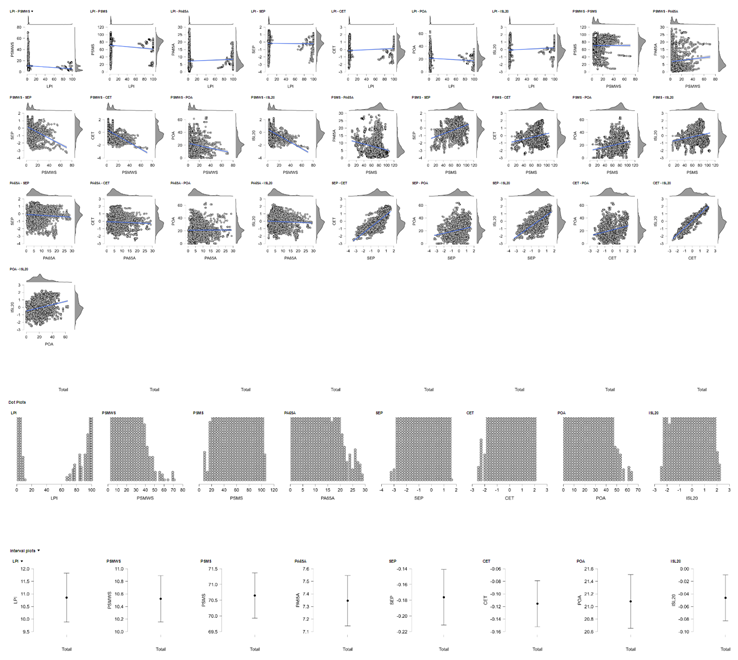
Covariances
| LPI | PSMWS | PSMS | PA65A | SEP | CET | POA | ISL20 | |
| LPI | 684.069 | -39.318 | -71.754 | 8.334 | -0.339 | 1.931 | -28.347 | 2.105 |
| PSMWS | -39.318 | 97.998 | 0.399 | 4.457 | -3.922 | -4.956 | -18.778 | -4.947 |
| PSMS | -71.754 | 0.399 | 374.634 | -24.405 | 7.209 | 4.557 | 49.932 | 4.168 |
| PA65A | 8.334 | 4.457 | -24.405 | 28.946 | -0.350 | -0.248 | 0.497 | -0.241 |
| SEP | -0.339 | -3.922 | 7.209 | -0.350 | 0.902 | 0.725 | 2.395 | 0.652 |
| CET | 1.931 | -4.956 | 4.557 | -0.248 | 0.725 | 0.966 | 2.941 | 0.899 |
| POA | -28.347 | -18.778 | 49.932 | 0.497 | 2.395 | 2.941 | 131.488 | 2.807 |
| ISL20 | 2.105 | -4.947 | 4.168 | -0.241 | 0.652 | 0.899 | 2.807 | 0.957 |
Correlations.
| LPI | PSMWS | PSMS | PA65A | SEP | CET | POA | ISL20 | |
| LPI | 1.000 | -0.152 | -0.142 | 0.059 | -0.014 | 0.075 | -0.095 | 0.082 |
| PSMWS | -0.152 | 1.000 | 0.002 | 0.084 | -0.417 | -0.509 | -0.165 | -0.511 |
| PSMS | -0.142 | 0.002 | 1.000 | -0.234 | 0.392 | 0.240 | 0.225 | 0.220 |
| PA65A | 0.059 | 0.084 | -0.234 | 1.000 | -0.069 | -0.047 | 0.008 | -0.046 |
| SEP | -0.014 | -0.417 | 0.392 | -0.069 | 1.000 | 0.776 | 0.220 | 0.702 |
| CET | 0.075 | -0.509 | 0.240 | -0.047 | 0.776 | 1.000 | 0.261 | 0.935 |
| POA | -0.095 | -0.165 | 0.225 | 0.008 | 0.220 | 0.261 | 1.000 | 0.250 |
| ISL20 | 0.082 | -0.511 | 0.220 | -0.046 | 0.702 | 0.935 | 0.250 | 1.000 |
Appendix E. G-Governance Summary Statistics
Descriptive Statistics
| LPI | GEE | RQE | ESRPS | VAE | STJA | PSAOV | RLE | |
| Valid | 2771 | 2771 | 2771 | 2771 | 2771 | 2771 | 2771 | 2771 |
| Missing | 0 | 0 | 0 | 0 | 0 | 0 | 0 | 0 |
| Mode | 100.000 | 45.761 | 16.506.420 | 67.641 | -0.137 | 25.367 | 912.876 | 0.543 |
| Median | 2.760 | 45.761 | 8.307.000 | 67.641 | -0.137 | 26.437 | 912.876 | 0.422 |
| Mean | 10.854 | 45.766 | 16.506.423 | 67.641 | -0.137 | 25.367 | 918.963 | 0.543 |
| Std. Error of Mean | 0.497 | 0.562 | 1.410.965 | 0.469 | 0.018 | 0.171 | 3.626.689 | 0.011 |
| 95% CI Mean Upper | 11.828 | 46.868 | 19.273.072 | 68.562 | -0.101 | 25.702 | 8.030.249 | 0.564 |
| 95% CI Mean Lower | 9.880 | 44.665 | 13.739.773 | 66.721 | -0.174 | 25.032 | -6.192.324 | 0.521 |
| Std. Deviation | 26.155 | 29.572 | 74.273.596 | 24.706 | 0.970 | 8.989 | 190.909.935 | 0.578 |
| 95% CI Std. Dev. Upper | 26.862 | 30.372 | 76.282.556 | 25.374 | 0.997 | 9.232 | 196.073.687 | 0.594 |
| 95% CI Std. Dev. Lower | 25.484 | 28.814 | 72.368.406 | 24.072 | 0.945 | 8.758 | 186.012.907 | 0.563 |
| Coefficient of variation | 2.410 | 0.646 | 4.500 | 0.365 | -7.064 | 0.354 | 207.745 | 1.065 |
| MAD | 0.380 | 26.861 | 8.199.420 | 15.044 | 0.756 | 5.062 | 13.807.876 | 0.139 |
| MAD robust | 0.563 | 39.825 | 12.156.460 | 22.305 | 1.121 | 7.504 | 20.471.557 | 0.207 |
| IQR | 0.940 | 53.576 | 16.340.420 | 27.922 | 1.505 | 11.438 | 26.629.000 | 0.289 |
| Variance | 684.069 | 874.520 | 5.517×10+9 | 610.394 | 0.942 | 80.803 | 3.645×10+10 | 0.334 |
| 95% CI Variance Upper | 721.575 | 922.468 | 5.819×10+9 | 643.861 | 0.993 | 85.233 | 3.844×10+10 | 0.353 |
| 95% CI Variance Lower | 649.425 | 830.231 | 5.237×10+9 | 579.481 | 0.894 | 76.711 | 3.460×10+10 | 0.318 |
| Skewness | 2.986 | 0.077 | 13.755 | -0.715 | -0.015 | -0.688 | -2.333 | 3.636 |
| Std. Error of Skewness | 0.047 | 0.047 | 0.047 | 0.047 | 0.047 | 0.047 | 0.047 | 0.047 |
| Kurtosis | 6.984 | -1.196 | 221.461 | -0.002 | -0.881 | 0.577 | 45.528 | 16.473 |
| Std. Error of Kurtosis | 0.093 | 0.093 | 0.093 | 0.093 | 0.093 | 0.093 | 0.093 | 0.093 |
| Shapiro-Wilk | 0.336 | 0.944 | 0.141 | 0.894 | 0.977 | 0.957 | 0.478 | 0.609 |
| P-value of Shapiro-Wilk | < .001 | < .001 | < .001 | < .001 | < .001 | < .001 | < .001 | < .001 |
| Range | 99.810 | 99.783 | 1.427×10+6 | 94.525 | 4.034 | 49.571 | 3.740×10+6 | 4.964 |
| Minimum | 0.190 | 0.217 | 1.000 | 5.475 | -2.259 | -5.258 | -2.290×10+6 | 0.018 |
| Maximum | 100.000 | 100.000 | 1.427×10+6 | 100.000 | 1.775 | 44.313 | 1.449×10+6 | 4.982 |
| 25th percentile | 2.460 | 18.005 | 166.000 | 61.593 | -0.909 | 19.500 | -17.033.000 | 0.254 |
| 50th percentile | 2.760 | 45.761 | 8.307.000 | 67.641 | -0.137 | 26.437 | 912.876 | 0.422 |
| 75th percentile | 3.400 | 71.581 | 16.506.420 | 89.516 | 0.596 | 30.938 | 9.596.000 | 0.543 |
| 25th percentile | 2.460 | 18.005 | 166.000 | 61.593 | -0.909 | 19.500 | -17.033.000 | 0.254 |
| 50th percentile | 2.760 | 45.761 | 8.307.000 | 67.641 | -0.137 | 26.437 | 912.876 | 0.422 |
| 75th percentile | 3.400 | 71.581 | 16.506.420 | 89.516 | 0.596 | 30.938 | 9.596.000 | 0.543 |
| Sum | 30.076.280 | 126.817.792 | 4.574×10+7 | 187.434.549 | -380.677 | 70.291.471 | 2.546×10+6 | 1.504.306 |
| ᵃ The mode is computed assuming that variables are discreet. | ||||||||
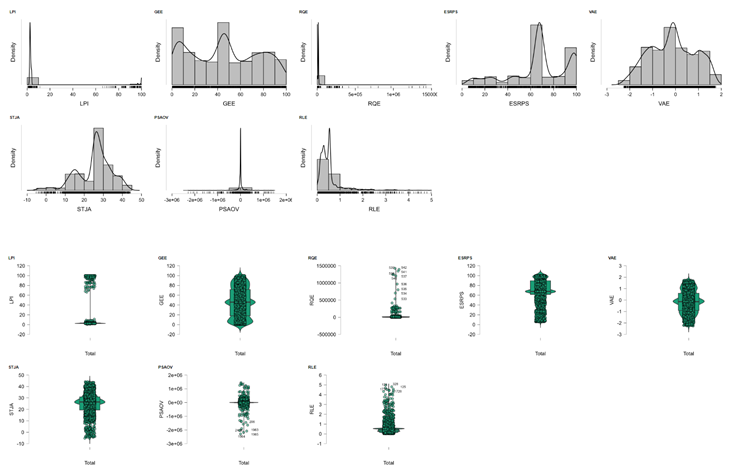
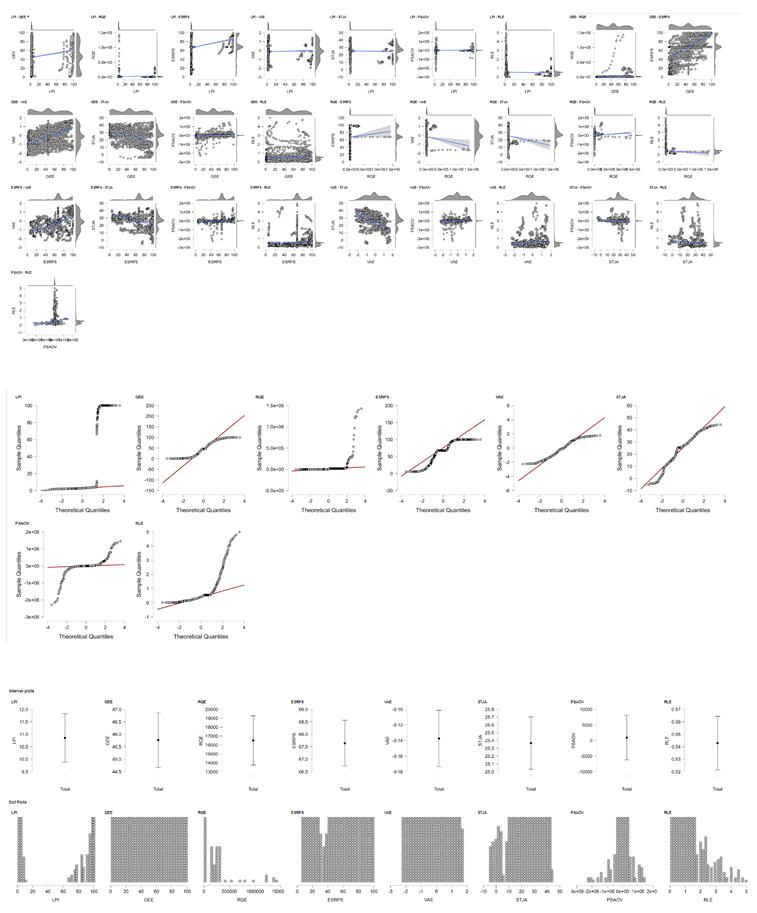
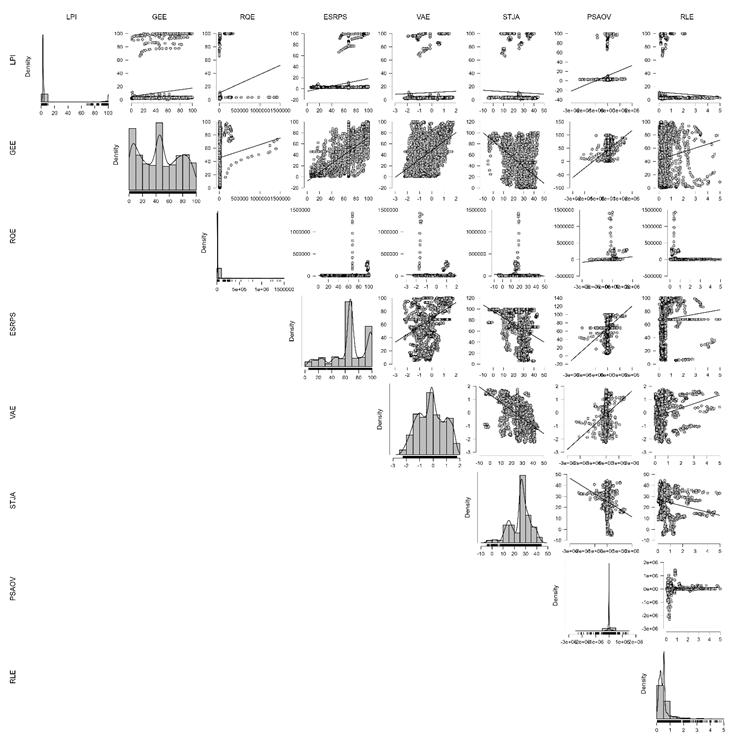
References
- Akram, M. W. , Hafeez, M., Yang, S., Sethi, N., Mahar, S., & Salahodjaev, R. (2023). Asian logistics industry efficiency under low carbon environment: policy implications for sustainable development. Environmental Science and Pollution Research, 30(21), 59793-59801. [CrossRef]
- Al Bony, M. N. V. , Das, P., Pervin, T., Shak, M. S., Akter, S., Anjum, N.,... & Rahman, M. K. (2024). COMPARATIVE PERFORMANCE ANALYSIS OF MACHINE LEARNING ALGORITHMS FOR BUSINESS INTELLIGENCE: A STUDY ON CLASSIFICATION AND REGRESSION MODELS. Frontline Marketing, Management and Economics Journal, 4(11), 72-92.
- Ali, H. , & Zafar, M. B. The ESG Code: A Multi-Method Review of Ai in Sustainable Finance. Available at SSRN 5205753.
- Altın, F. G. , Gürsoy, S., Doğan, M., & Ergüney, E. B. (2023). The Analysis of the Relationship Among Climate Policy Uncertainty, Logistic Firm Stock Returns and ESG Scores: Evidence from the TVP-VAR Model. İstatistik Araştırma Dergisi, 13(2), 42-59.
- Auliani, S. N. , Novita, R., & Afdal, M. (2024). Implementation of Density-Based Spatial Clustering of Applications with Noise and Fuzzy C–Means for Clustering Car Sales. The Indonesian Journal of Computer Science, 13(4). [CrossRef]
- Baciu, L. E. (2023). The impact of governance upon sustainable development. Empirical evidence. Studia Universitatis Babes Bolyai-Oeconomica, 68(2), 73-86. [CrossRef]
- Barykin, S. E. , Strimovskaya, A. V., Sergeev, S. M., Borisoglebskaya, L. N., Dedyukhina, N., Sklyarov, I.,... & Saychenko, L. (2023). Smart city logistics on the basis of digital tools for ESG goals achievement. Sustainability, 15(6), 5507. [CrossRef]
- Bicego, M. , & Escolano, F. (2021, January). On learning random forests for random forest-clustering. In 2020 25th International Conference on Pattern Recognition (ICPR) (pp. 3451-3458). IEEE.
- Binzaiman, F. , Edhrabooh, K. M., Alromaihi, M., & AlShammari, M. (2024, October). Predicting Environmental, Social, and Governance Scores with Machine Learning: A Systematic Literature Review. In 2024 5th International Conference on Data Analytics for Business and Industry (ICDABI) (pp. 117-122). IEEE.
- Błaszczyk, A. , & Le Viet-Błaszczyk, M. (2024). The role of social media marketing of ESG in warehouse logistics. Zeszyty Naukowe. Organizacja i Zarządzanie/Politechnika Śląska. [CrossRef]
- Bo, P. (2024). The Impact of Digital Technology Application on Logistics Enterprise ESG Performance in VUCA Environment: Base on the Moderated Mediation Model. Journal of Roi Kaensarn Academi, 9(11), 1530-1548.
- Borisova, V. , & Pechenko, N. (2021). Sustainable Development of Logistic Infrastructure of the Region. In E3S Web of Conferences (Vol. 295, p. 01042). EDP Sciences.
- Boukrouh, I. , Tayalati, F., & Azmani, A. (2024, August). Comparative SHAP Analysis on SVM and K-NN: Impacts of Hyperparameter Tuning on Model Explainability. In 2024 IEEE International Conference on Artificial Intelligence in Engineering and Technology (IICAIET) (pp. 194-198). IEEE.
- Bowden, J., Bornkamp, B., Glimm, E., & Bretz, F. (2021). Connecting Instrumental Variable methods for causal inference to the Estimand Framework. Statistics in medicine, 40(25), 5605-5627. [CrossRef] [PubMed]
- Burcă, V. , Bogdan, O., Bunget, O. C., Dumitrescu, A. C., & Imbrescu, C. M. (2024). Financial Implications of Supply Chains Transition to ESG Models. Exploring ESG Challenges and Opportunities: Navigating Towards a Better Future, 127-143.
- Cheng, D. , Xu, Z., Li, J., Liu, L., Liu, J., & Le, T. D. (2023). Conditional instrumental variable regression with representation learning for causal inference. arXiv:2310.01865.
- Chiang, K. L. (2024). Delivering Goods Sustainably: A Fuzzy Nonlinear Multi-Objective Programming Approach for E-Commerce Logistics in Taiwan. Sustainability, 16(13), 5720. [CrossRef]
- Chien, F. (2023). The role of corporate governance and environmental and social responsibilities on the achievement of sustainable development goals in Malaysian logistic companies. Economic research-Ekonomska istraživanja, 36(1), 1610-1630. [CrossRef]
- CONSTĂNGIOARĂ, A. , & Florian, G. L. Is Logistics Mediating The Relationship Between Pollution And Economic Complexity?
- Coto-Millán, P. , Paz Saavedra, D., de la Fuente, M., & Fernandez, X. L. (2024). Integrating Logistics into Global Production: A New Approach. Logistics, 8(4), 99. [CrossRef]
- Das, A. (2024). Predictive value of supply chain sustainability initiatives for ESG performance: a study of large multinationals. Multinational Business Review, 32(1), 20-40. [CrossRef]
- Dos Santos, M. C., & Pereira, F. H. (2022). ESG performance scoring method to support responsible investments in port operations. Case Studies on Transport Policy, 10(1), 664-673. [CrossRef]
- Dou, X. , & Yin, S. (2024). The impact of ESG on corporate financial performance: Based on fixed effects regression model. Journal of Computational Methods in Science and Engineering, 24(4-5), 2719-2731. [CrossRef]
- Effiong, U. E. , Udofia, L. E., & Garba, I. H. (2023). Governance and economic development in West Africa: Linking governance with economic misery. Path of Science, 9(6), 2009-2025. [CrossRef]
- Fan, M. , Tang, Y., Qalati, S. A., & Ibrahim, B. (2025). Can logistics enterprises improve their competitiveness through ESG in the context of digitalization? Evidence from China. The International Journal of Logistics Management, 36(1), 196-224. [CrossRef]
- Fatimah, Y. A. , Kannan, D., Govindan, K., & Hasibuan, Z. A. (2023). Circular economy e-business model portfolio development for e-business applications: Impacts on ESG and sustainability performance. Journal of Cleaner Production, 415, 137528. [CrossRef]
- Filassi, M. , Oliveira, A. L. R. D., Elias, A. A., & Braga Marsola, K. (2022). Analyzing complexities in the Brazilian soybean supply chain: a systems thinking and modeling approach. RAUSP Management Journal, 57, 280-297. [CrossRef]
- Fu, X. , Feng, L., & Zhang, L. (2022). Data-driven estimation of TBM performance in soft soils using density-based spatial clustering and random forest. Applied Soft Computing, 120, 108686. [CrossRef]
- Gagolewski, M. , Bartoszuk, M., & Cena, A. (2021). Are cluster validity measures (in) valid?. Information Sciences, 581, 620-636. [CrossRef]
- Gebreyesus, Y. , Dalton, D., Nixon, S., De Chiara, D., & Chinnici, M. (2023). Machine learning for data center optimizations: feature selection using Shapley additive exPlanation (SHAP). Future Internet, 15(3), 88. [CrossRef]
- Ghezelbash, R. , Daviran, M., Maghsoudi, A., & Hajihosseinlou, M. (2025). Density based spatial clustering of applications with noise and fuzzy C-means algorithms for unsupervised mineral prospectivity mapping. Earth Science Informatics, 18(2), 217. [CrossRef]
- Gholami, H. , Mohammadifar, A., Bui, D. T., & Collins, A. L. (2020). Mapping wind erosion hazard with regression-based machine learning algorithms. Scientific Reports, 10(1), 20494. [CrossRef]
- Göçer, A. , Özpeynirci, Ö., & Semiz, M. (2022). Logistics performance index-driven policy development: An application to Turkey. Transport policy, 124, 20-32. [CrossRef]
- Govindan, K. , Karaman, A. S., Uyar, A., & Kilic, M. (2023). Board structure and financial performance in the logistics sector: Do contingencies matter?. Transportation Research Part E: Logistics and Transportation Review, 176, 103187. [CrossRef]
- Gündoğdu, H. G. , Aytekin, A., Toptancı, Ş., Korucuk, S., & Karamaşa, Ç. (2023). Environmental, social, and governance risks and environmentally sensitive competitive strategies: A case study of a multinational logistics company. Business Strategy and the Environment, 32(7), 4874-4906. [CrossRef]
- Guo, J., Dong, R., Zhang, R., Yang, F., Wang, Y., & Miao, W. (2025). Interpretable machine learning model for predicting the prognosis of antibody positive autoimmune encephalitis patients. Journal of Affective Disorders, 369, 352-363. [CrossRef] [PubMed]
- Gupta, A. , Sharma, U., & Gupta, S. K. (2021, December). The role of ESG in sustainable development: An analysis through the lens of machine learning. In 2021 IEEE international humanitarian technology conference (IHTC) (pp. 1-5). IEEE.
- Gürler, H. E. , Özçalıcı, M., & Pamucar, D. (2024). Determining criteria weights with genetic algorithms for multi-criteria decision making methods: The case of logistics performance index rankings of European Union countries. Socio-Economic Planning Sciences, 91, 101758. [CrossRef]
- Hasanah, U., Soleh, A. M., & Sadik, K. (2024). Effect of Random Under sampling, Oversampling, and SMOTE on the Performance of Cardiovascular Disease Prediction Models. Jurnal Matematika, Statistika Dan Komputasi, 21(1), 88-102. [CrossRef]
- Hossen, M. B. , & Auwul, M. R. (2020). Comparative study of K-means, partitioning around medoids, agglomerative hierarchical, and DIANA clustering algorithms by using cancer datasets. Biomedical Statistics and Informatics, 5(1), 20-25.
- Ilyas, M. (2024). Unveiling the education paradox: Conflict, pandemic and schooling in Kashmir. International Review of Education, 1-23. [CrossRef]
- Jenifel, M. G. , Jasmine, R. A., & Umanandhini, D. (2024, June). Bitcoin Price Predictive Dynamics Using Machine Learning Models. In 2024 15th International Conference on Computing Communication and Networking Technologies (ICCCNT) (pp. 1-6). IEEE.
- Jomthanachai, S. , Wong, W. P., & Khaw, K. W. (2022). An application of machine learning regression to feature selection: a study of logistics performance and economic attribute. Neural Computing and Applications, 34(18), 15781-15805. [CrossRef]
- Juvvala, R. , Sangle, S., & Tiwari, M. K. (2025). Post-Covid challenges and opportunities: rethinking ESG performance in the logistics sector. International Journal of Production Research, 63(4), 1256-1274. [CrossRef]
- Kanno, M. (2023). Does ESG performance improve firm creditworthiness?. Finance Research Letters, 55, 103894. [CrossRef]
- Kara, K. (2023). Clustering of Developing Countries in Terms of Logistics Market Development with Fuzzy Clustering and Discriminant Analysis. Yaşar Üniversitesi E-Dergisi, 18(69), 19-40. [CrossRef]
- Karaduman, H. A. , Karaman-Akgül, A., Çağlar, M., & Akbaş, H. E. (2020). The relationship between logistics performance and carbon emissions: an empirical investigation on Balkan countries. International Journal of Climate Change Strategies and Management, 12(4), 449-461. [CrossRef]
- Kim, D. , Na, J., & Ha, H. K. (2024). Exploring the impact of green logistics practices and relevant government policy on the financial efficiency of logistics companies. Heliyon, 10(10). [CrossRef]
- Kim, J., Kim, M., Im, S., & Choi, D. (2021). Competitiveness of E Commerce firms through ESG logistics. Sustainability, 13(20), 11548. [CrossRef]
- Kocabaş, M. B. , Tashan, W., Shayea, I., & Alibek, M. (2024, December). Comparative Analysis of One-Dimensional Regression Techniques. In 2024 IEEE 16th International Conference on Computational Intelligence and Communication Networks (CICN) (pp. 1365-1370). IEEE.
- Kudryavtseva, T. , Rodionova, M., & Skhvediani, A. (2022, April). Event Study on the Stock Performance: The Case of US Logistics Companies. In International Scientific Conference “Digital Transformation on Manufacturing, Infrastructure & Service” (pp. 218-229). Cham: Springer Nature Switzerland.
- Kurniawan, F. , Musa, S. N., Nurfauzi, B., Ferdian, R., & Khair, F. (2024). Container Terminal Performance: System Dynamic Approach with Port Capacity Constraints and ESG Integration. Jordan Journal of Mechanical & Industrial Engineering, 18(1). [CrossRef]
- Lee, E. S. (2024). Evaluation of the Impact of ESG Practices on Financial Performance in Korean Small and Medium Logistics Companies. Asia-pacific Journal of Convergent Research Interchange (APJCRI), 237-248. [CrossRef]
- Lee, J. W. , & Lee, H. S. (2022). An Analysis of ESG keywords in the logistics industry using SNA methodology: Using news article and sustainable management report. Korea Trade Review, 47(2), 121-132.
- Lee, J., Lee, J., Lee, C., & Kim, Y. (2023). Identifying ESG trends of international container shipping companies using semantic network analysis and multiple case theory. Sustainability, 15(12), 9441.
- Leogrande, A. (2024). Integrating ESG Principles into Smart Logistics: Toward Sustainable Supply Chains.
- Li, W. , & Wang, Y. (2024). A procurement advantage in disruptive times: New perspectives on ESG strategy and firm performance. Available at SSRN 4817562.
- Li, X. , Sohail, S., Majeed, M. T., & Ahmad, W. (2021). Green logistics, economic growth, and environmental quality: evidence from one belt and road initiative economies. Environmental Science and Pollution Research, 28, 30664-30674. [CrossRef]
- Liang, Y. , Ge, X., Jin, Y., Zheng, Z., Zhang, Y., & Jiang, Y. (2024). Economic optimization of fresh logistics pick-up routing problems with time windows based on gray prediction. Journal of Intelligent & Fuzzy Systems, 46(4), 10813-10832. [CrossRef]
- Long, J. P., Zhu, H., Do, K. A., & Ha, M. J. (2023). Estimating causal effects with hidden confounding using instrumental variables and environments. Electronic journal of statistics, 17(2), 2849. [CrossRef]
- Magazzino, C. , Alola, A. A., & Schneider, N. (2021). The trilemma of innovation, logistics performance, and environmental quality in 25 topmost logistics countries: A quantile regression evidence. Journal of Cleaner Production, 322, 129050. [CrossRef]
- Maheshwari, A. , Malhotra, A., Hada, B. S., Ranka, M., & Basha, M. S. A. (2024, September). Towards an Improved Model for Stability Score Prediction: Harnessing Machine Learning in National Stability Forecasting. In 2024 IEEE North Karnataka Subsection Flagship International Conference (NKCon) (pp. 1-7). IEEE.
- Maier, R. , Hörtnagl, L., & Buchmann, N. (2022). Greenhouse gas fluxes (CO2, N2O and CH4) of pea and maize during two cropping seasons: Drivers, budgets, and emission factors for nitrous oxide. Science of the Total Environment, 849, 157541. [CrossRef]
- Martto, J. , Diaz, S., Hassan, B., Mannan, S., Singh, P., Villasuso, F., & Baobaid, O. (2023, October). ESG strategies in the oil and gas industry from the maritime & logistics perspective-opportunities & risks. In Abu Dhabi International Petroleum Exhibition and Conference (p. D041S129R004). SPE.
- Masuarah, Y., Suhendra, I., & Umayatu Suiroh, S. (2021). The Impact of Economic and Social Factors on ASEAN Logistics Performance. Jurnal Ekonomi dan Studi Pembangunan, 13, 1. [CrossRef]
- Mazzuto, G. , Antomarioni, S., Ciarapica, F. E., & Bevilacqua, M. (2021). Health Indicator for Predictive Maintenance Based on Fuzzy Cognitive Maps, Grey Wolf, and K-Nearest Neighbors Algorithms. Mathematical Problems in Engineering, 2021(1), 8832011. [CrossRef]
- Miklin, N. , Gachechiladze, M., Moreno, G., & Chaves, R. (2022). Causal inference with imperfect instrumental variables. Journal of Causal Inference, 10(1), 45-63. [CrossRef]
- Modak, S. (2023). A new measure for assessment of clustering based on kernel density estimation. Communications in Statistics-Theory and Methods, 52(17), 5942-5951. [CrossRef]
- Mohanty, P. K., Francis, S. A. J., Barik, R. K., Roy, D. S., & Saikia, M. J. (2024). Leveraging Shapley Additive Explanations for Feature Selection in Ensemble Models for Diabetes Prediction. Bioengineering, 11(12), 1215. [CrossRef]
- Moreira, O. J. , & Rodrigues, M. C. M. (2023). Sourcing third party logistics service providers based on environmental, social and corporate governance: a case study. Discover Sustainability, 4(1), 36. [CrossRef]
- Mukhtar, M. (2023). Unravelling Structural Underdevelopment: Is Governance Quality the Key? (Doctoral dissertation).
- Mutambik, I. (2024). Digital Transformation as a Driver of Sustainability Performance—A Study from Freight and Logistics Industry. Sustainability, 16(10), 4310. [CrossRef]
- Nagy, G. , & Szentesi, S. (2024). Green logistics: Transforming supply chains for a sustainable future. Advanced Logistic Systems-Theory and Practice, 18(3), 29-42. [CrossRef]
- Nakhjiri, A. , & Kakroodi, A. A. (2024). Air pollution in industrial clusters: A comprehensive analysis and prediction using multi-source data. Ecological Informatics, 80, 102504. [CrossRef]
- Nawurunnage, K. R. , Prasadika, A. P. K. J., & Wijayanayake, A. N. (2023, February). TQM and Green Supply Chain Management Practices on Supply Chain Performance of Third-Party Logistics Services in Sri Lanka: A Systematic Review of Literature. In 2023 3rd International Conference on Advanced Research in Computing (ICARC) (pp. 274-279). IEEE.
- Nenavani, J. , Prasuna, A., Siva Kumar, S. N. V., & Kasturi, A. (2024). ESG measures and financial performance of logistics companies. Letters in Spatial and Resource Sciences, 17(1), 5. [CrossRef]
- Niu, B. , Dong, J., & Wang, H. (2024). Smart port vs. port integration to mitigate congestion: ESG performance and data validation. Transportation Research Part E: Logistics and Transportation Review, 191, 103741. [CrossRef]
- Noviandy, T. R. , Hardi, I., Zahriah, Z., Sofyan, R., Sasmita, N. R., Hilal, I. S., & Idroes, G. M. (2024). Environmental and economic clustering of indonesian provinces: insights from K-Means analysis. Leuser Journal of Environmental Studies, 2(1), 41-51. [CrossRef]
- Okanda, T. L. , Zhang, J., Sarfo, P. A., & Amankwah, O. (2025). Exploring the Nexus between Debt Financing and Firm Performance: A Robustness Analysis Using Instrumental Variables. International Journal of Advanced Engineering Research and Science, 12(02).
- Onukwulu, E. C., Agho, M. O., & Eyo-Udo, N. L. (2022). Advances in green logistics integration for sustainability in energy supply chains. World Journal of Advanced Science and Technology, 2(1), 047-068. [CrossRef]
- Park, B. (2023). The Impact of ESG Frameworks on Economic Performance: The Mediating Role of Logistics Performance and Liner Shipping Connectivity. Journal of Korea Port Economic Association, 39(4), 163-190. [CrossRef]
- Pehlivan, P. , Aslan, A. I., David, S., & Bacalum, S. (2024). Determination of Logistics Performance of G20 Countries Using Quantitative Decision-Making Techniques. Sustainability, 16(5), 1852. [CrossRef]
- Peiman, F. , Khalilzadeh, M., Shahsavari-Pour, N., & Ravanshadnia, M. (2023). Estimation of building project completion duration using a natural gradient boosting ensemble model and legal and institutional variables. Engineering, Construction and Architectural Management. [CrossRef]
- Pham, T. N., Tran, P. P., Le, M. H., Vo, H. N., Pham, C. D., & Nguyen, H. D. (2022). The effects of ESG combined score on business performance of enterprises in the transportation industry. Sustainability, 14(14), 8354. [CrossRef]
- Pinjaman, S. , Thani, M. A. M., Bakar, M., & Hadi, S. (2025). The Nexus between Governance Quality and Economic Growth of Malaysia: Short-And Long-Run Analyses. International Journal of Research and Innovation in Social Science, 9(15), 115-129. [CrossRef]
- Qu, Z. , & Kwon, Y. (2024). Distributionally Robust Instrumental Variables Estimation. arXiv:2410.15634.
- Rapdecho, C. , & Aunyawong, W. (2024, March). THE RELATIONSHIP AMONG OPERATIONAL EFFICIENCY, ESG IMPLEMENTATION, GREEN SUPPLY CHAIN MANAGEMENT, AND SUSTAINABLE SUPPLY CHAIN PERFORMANCE. In INTERNATIONAL ACADEMIC MULTIDISCIPLINARY RESEARCH CONFERENCE IN FUKUOKA 2024 (pp. 186-193).
- Rawat, D. S. (2025). Political Governance and Stock Market Performance: An Autoregressive Distributed Lag Analysis of the Nepalese Market. KMC Journal, 7(1), 272-294. [CrossRef]
- Rodionova, M. , Skhvediani, A., & Kudryavtseva, T. (2022). ESG as a booster for logistics stock returns—evidence from the us stock market. Sustainability, 14(19), 12356. [CrossRef]
- Runhua Xiao, I., Jaller, M., Phong, D., & Zhu, H. (2022). Spatial analysis of the 2018 logistics performance index using multivariate kernel function to improve geographically weighted regression models. Transportation research record, 2676(2), 44-58. [CrossRef]
- Sadriu, M. , & Balaj, D. (2024). ASSESSING THE ROLE OF GOVERNANCE INDICATORS ON FOREIGN DIRECT INVESTMENT: INSIGHTS FROM SOUTHEASTERN EUROPEAN COUNTRIES. Journal of Governance and Regulation/Volume, 13(4). [CrossRef]
- Safouan, S. , El Moutaouakil, K., & Patriciu, A. M. (2024). Fractional Derivative to Symmetrically Extend the Memory of Fuzzy C-Means. Symmetry, 16(10), 1353. [CrossRef]
- Samy, S. , Jaini, K., & Preheim, S. (2024). A Novel Machine Learning-Driven Approach for Predicting Nitrous Oxide Flux in Precision Managed Agricultural Systems. Available at SSRN 4976901. [CrossRef]
- Sarmas, E. , Fragkiadaki, A., & Marinakis, V. (2024). Explainable AI-Based Ensemble Clustering for Load Profiling and Demand Response. Energies, 17(22), 5559. [CrossRef]
- Shakil, M. H. , Munim, Z. H., Zamore, S., & Tasnia, M. (2024). Sustainability and financial performance of transport and logistics firms: Does board gender diversity matter?. Journal of Sustainable Finance & Investment, 14(1), 100-115. [CrossRef]
- Shang, Y. J. , Mao, Y. H., Liao, H., Hu, J. L., & Zou, Z. Y. (2023). Response of PM 2.5 and O 3 to Emission Reductions in Nanjing Based on Random Forest Algorithm. Huan Jing ke Xue= Huanjing Kexue, 44(8), 4250-4261.
- Sharawi, H. , Alsaadi, L., & Alsagri, M. (2025). The impact of LPIs’ indicators on the global logistics performance index: Global perspective. Multidisciplinary Science Journal, 7(7), 2025361-2025361. [CrossRef]
- Shen, Y. , Ma, J., & Wang, W. (2024). Supply chain digitization and enterprise ESG performance: a quasi-natural experiment in China. International Journal of Logistics Research and Applications, 1-23. [CrossRef]
- Singh, J. , & Gosain, A. (2024). Revolutionizing Missing Data Handling with RFKFCM: Random Forest-based Kernelized Fuzzy C-Means. Procedia Computer Science, 233, 66-76. [CrossRef]
- Skhvediani, A. E. , Gutman, S. S., Rodionova, M. A., & Perfilova, J. A. (2024). Being green as an instrument for increasing firm value: case of US transport and logistics companies. International Journal of Logistics Systems and Management, 47(1), 105-124.
- Slezák, J. (2023). Relations between Development of E-Government and Government Effectiveness, Control of Corruption and Rule of Law in 2010–2020: a Cluster Analysis. Acta VŠFS-ekonomické studie a analýzy, 17(2), 161-187. [CrossRef]
- Srisuradetchai, P. , & Suksrikran, K. (2024). Random kernel k-nearest neighbors regression. Frontiers in big Data, 7, 1402384. [CrossRef]
- Stan, S. E., Țîțu, A. M., Mănescu, G., Ilie, F. V., & Rusu, M. L. (2023). Measuring supply chain performance from ESG perspective. Available at SSRN 5093491. [CrossRef]
- Šulentić, T. , Rakić, E., & Kavran, K. M. Z. (2022, May). ESG management-the main factors of sustainable business in the postal logistics sector. In FIRST INTERNATIONAL CONFERENCE ON ADVANCES IN TRAFFIC AND COMMUNICATION TECHNOLOGIES (p. 9).
- Sun, X. , Kuo, Y. H., Xue, W., & Li, Y. (2024). Technology-driven logistics and supply chain management for societal impacts. Transportation Research Part E: Logistics and Transportation Review, 185, 103523. [CrossRef]
- Sun, Y. , Li, Y., Jia, Y., Yang, J., Peng, Y., & Guo, X. (2024, October). A Random Forest-based Model for Cargo Volume Prediction and Personnel Scheduling in Logistics Sorting Centers. In 2024 3rd International Conference on Data Analytics, Computing and Artificial Intelligence (ICDACAI) (pp. 289-294). IEEE.
- Syed, M. (2021). Neighborhood density information in clustering. Annals of Mathematics and Artificial Intelligence, 90, 855–872.
- Syed, M. N. (2022). Neighborhood density information in clustering. Annals of Mathematics and Artificial Intelligence, 90(7), 855-872.
- Tao, Y. , Wang, S., Wu, J., Zhao, M., & Yang, Z. (2022). Logistic network construction and economic linkage development in the Guangdong-Hong Kong-Macao Greater Bay Area: An analysis based on spatial perspective. Sustainability, 14(23), 15652. [CrossRef]
- Taskin, D. , Sariyer, G., Acar, E., & Cagli, E. C. (2025). Do past ESG scores efficiently predict future ESG performance?. Research in International Business and Finance, 74, 102706. [CrossRef]
- Thummala, G. S. R. , & Baskar, R. (2023, May). Prediction of Heart Disease using Random Forest in Comparison with Logistic Regression to Measure Accuracy. In 2023 International Conference on Advances in Computing, Communication and Applied Informatics (ACCAI) (pp. 1-5). IEEE.
- Tian, L. , Tian, W., & Guo, M. (2025). Can supply chain digitalization open the way to sustainable development? Evidence from corporate ESG performance. Corporate Social Responsibility and Environmental Management, 32(2), 2332-2346. [CrossRef]
- Troncoso, J. A. , Quijije, Á. T., Oviedo, B., & Zambrano-Vega, C. (2023). Solar Radiation Prediction in the UTEQ based on Machine Learning Models. arXiv:2312.17659.
- Tsang, Y. P. , Fan, Y., & Feng, Z. P. (2023). Bridging the gap: Building environmental, social and governance capabilities in small and medium logistics companies. Journal of environmental management, 338, 117758. [CrossRef]
- Ulkhaq, M. M. (2023). Clustering countries according to the logistics performance index. JATISI (Jurnal Teknik Informatika dan Sistem Informasi), 10(1).
- Varkiani, S. M., Pattarin, F., Fabbri, T., & Fantoni, G. (2025). Predicting employee attrition and explaining its determinants. Expert Systems with Applications, 126575. [CrossRef]
- Wan, B. , Wan, W., Hanif, N., & Ahmed, Z. (2022). Logistics performance and environmental sustainability: Do green innovation, renewable energy, and economic globalization matter?. Frontiers in Environmental Science, 10, 996341. [CrossRef]
- Wang, F. , Geng, Y. , & Zhang, H. (2021). An improved fuzzy C-means clustering algorithm based on intuitionistic fuzzy sets. In Proceedings of the 9th International Conference on Computer Engineering and Networks (pp. 333-345). Springer Singapore. [Google Scholar]
- Wang, T., Qin, L., Dai, C., Wang, Z., & Gong, C. (2023). Heterogeneous Learning of Functional Clustering Regression and Application to Chinese Air Pollution Data. International Journal of Environmental Research and Public Health, 20(5), 4155. [CrossRef]
- Wu, M., & Xie, D. (2024). The impact of ESG performance on the credit risk of listed companies in Shanghai and Shenzhen stock exchanges. Green Finance, 6(2), 199. [CrossRef] [PubMed]
- Xie, T. (2021). ESG transparency on firm performance: an empirical research of Covid-19 in global logistics firms.
- Xuan, T. T. T. , Quach, P. H., Van Thinh, N., Hoa, T. T., & Tu, N. T. (2023). The efficiency and the performance of the logistics global supply chain activities to Vietnam exportation: An empirical case study. International Journal of Professional Business Review: Int. J. Prof. Bus. Rev., 8(4), 48. [CrossRef]
- Yang, F. , Chen, T., Zhang, Z., & Yao, K. (2024). Firm ESG Performance and Supply-Chain Total-Factor Productivity. Sustainability, 16(20), 9016. [CrossRef]
- Yıldırım, M. (2023). Cluster Analysis on Supply Chain Management-Related Indicators. İnsan ve Toplum Bilimleri Araştırmaları Dergisi, 12(5), 2499-2520. [CrossRef]
- Yu, K., Wu, Q., Chen, X., Wang, W., & Mardani, A. (2024). An integrated MCDM framework for evaluating the environmental, social, and governance (ESG) sustainable business performance. Annals of Operations Research, 342(1), 987-1018. [CrossRef]
- Zeng, H., Li, R. Y. M., & Zeng, L. (2022). Evaluating green supply chain performance based on ESG and financial indicators. Frontiers in Environmental Science, 10, 982828. [CrossRef]
- Zhang, M. , Yang, W., Zhao, Z., Pratap, S., Wu, W., & Huang, G. Q. (2023). Is digital twin a better solution to improve ESG evaluation for vaccine logistics supply chain: An evolutionary game analysis. Operations Management Research, 16(4), 1791-1813. [CrossRef]
- Zhang, Y. , Li, Y., & Che, J. (2024). Optimal weight random forest ensemble with Fuzzy C-means cluster-based subsampling for carbon price forecasting. Journal of Intelligent & Fuzzy Systems, 46(1), 991-1003. [CrossRef]
- Zhao, L. , Yu, Q., Li, M., Wang, Y., Li, G., Sun, S.,... & Liu, Y. (2022). A review of the innovative application of phase change materials to cold-chain logistics for agricultural product storage. Journal of Molecular Liquids, 365, 120088. [CrossRef]
- Zheng, D., & Wang, T. (2025). Supply chain resilience, logistics efficiency, and enterprise competitiveness. Finance Research Letters, 79, 107335.
- Zhu, C. , & Liu, Z. (2024, April). Semi-supervised clustering of PM2. 5 pollution. In International Conference on Computer Application and Information Security (ICCAIS 2023) (Vol. 13090, pp. 427-432). SPIE.
Figure 1.
Random Forest Analysis of Environmental Drivers of Logistics Performance.
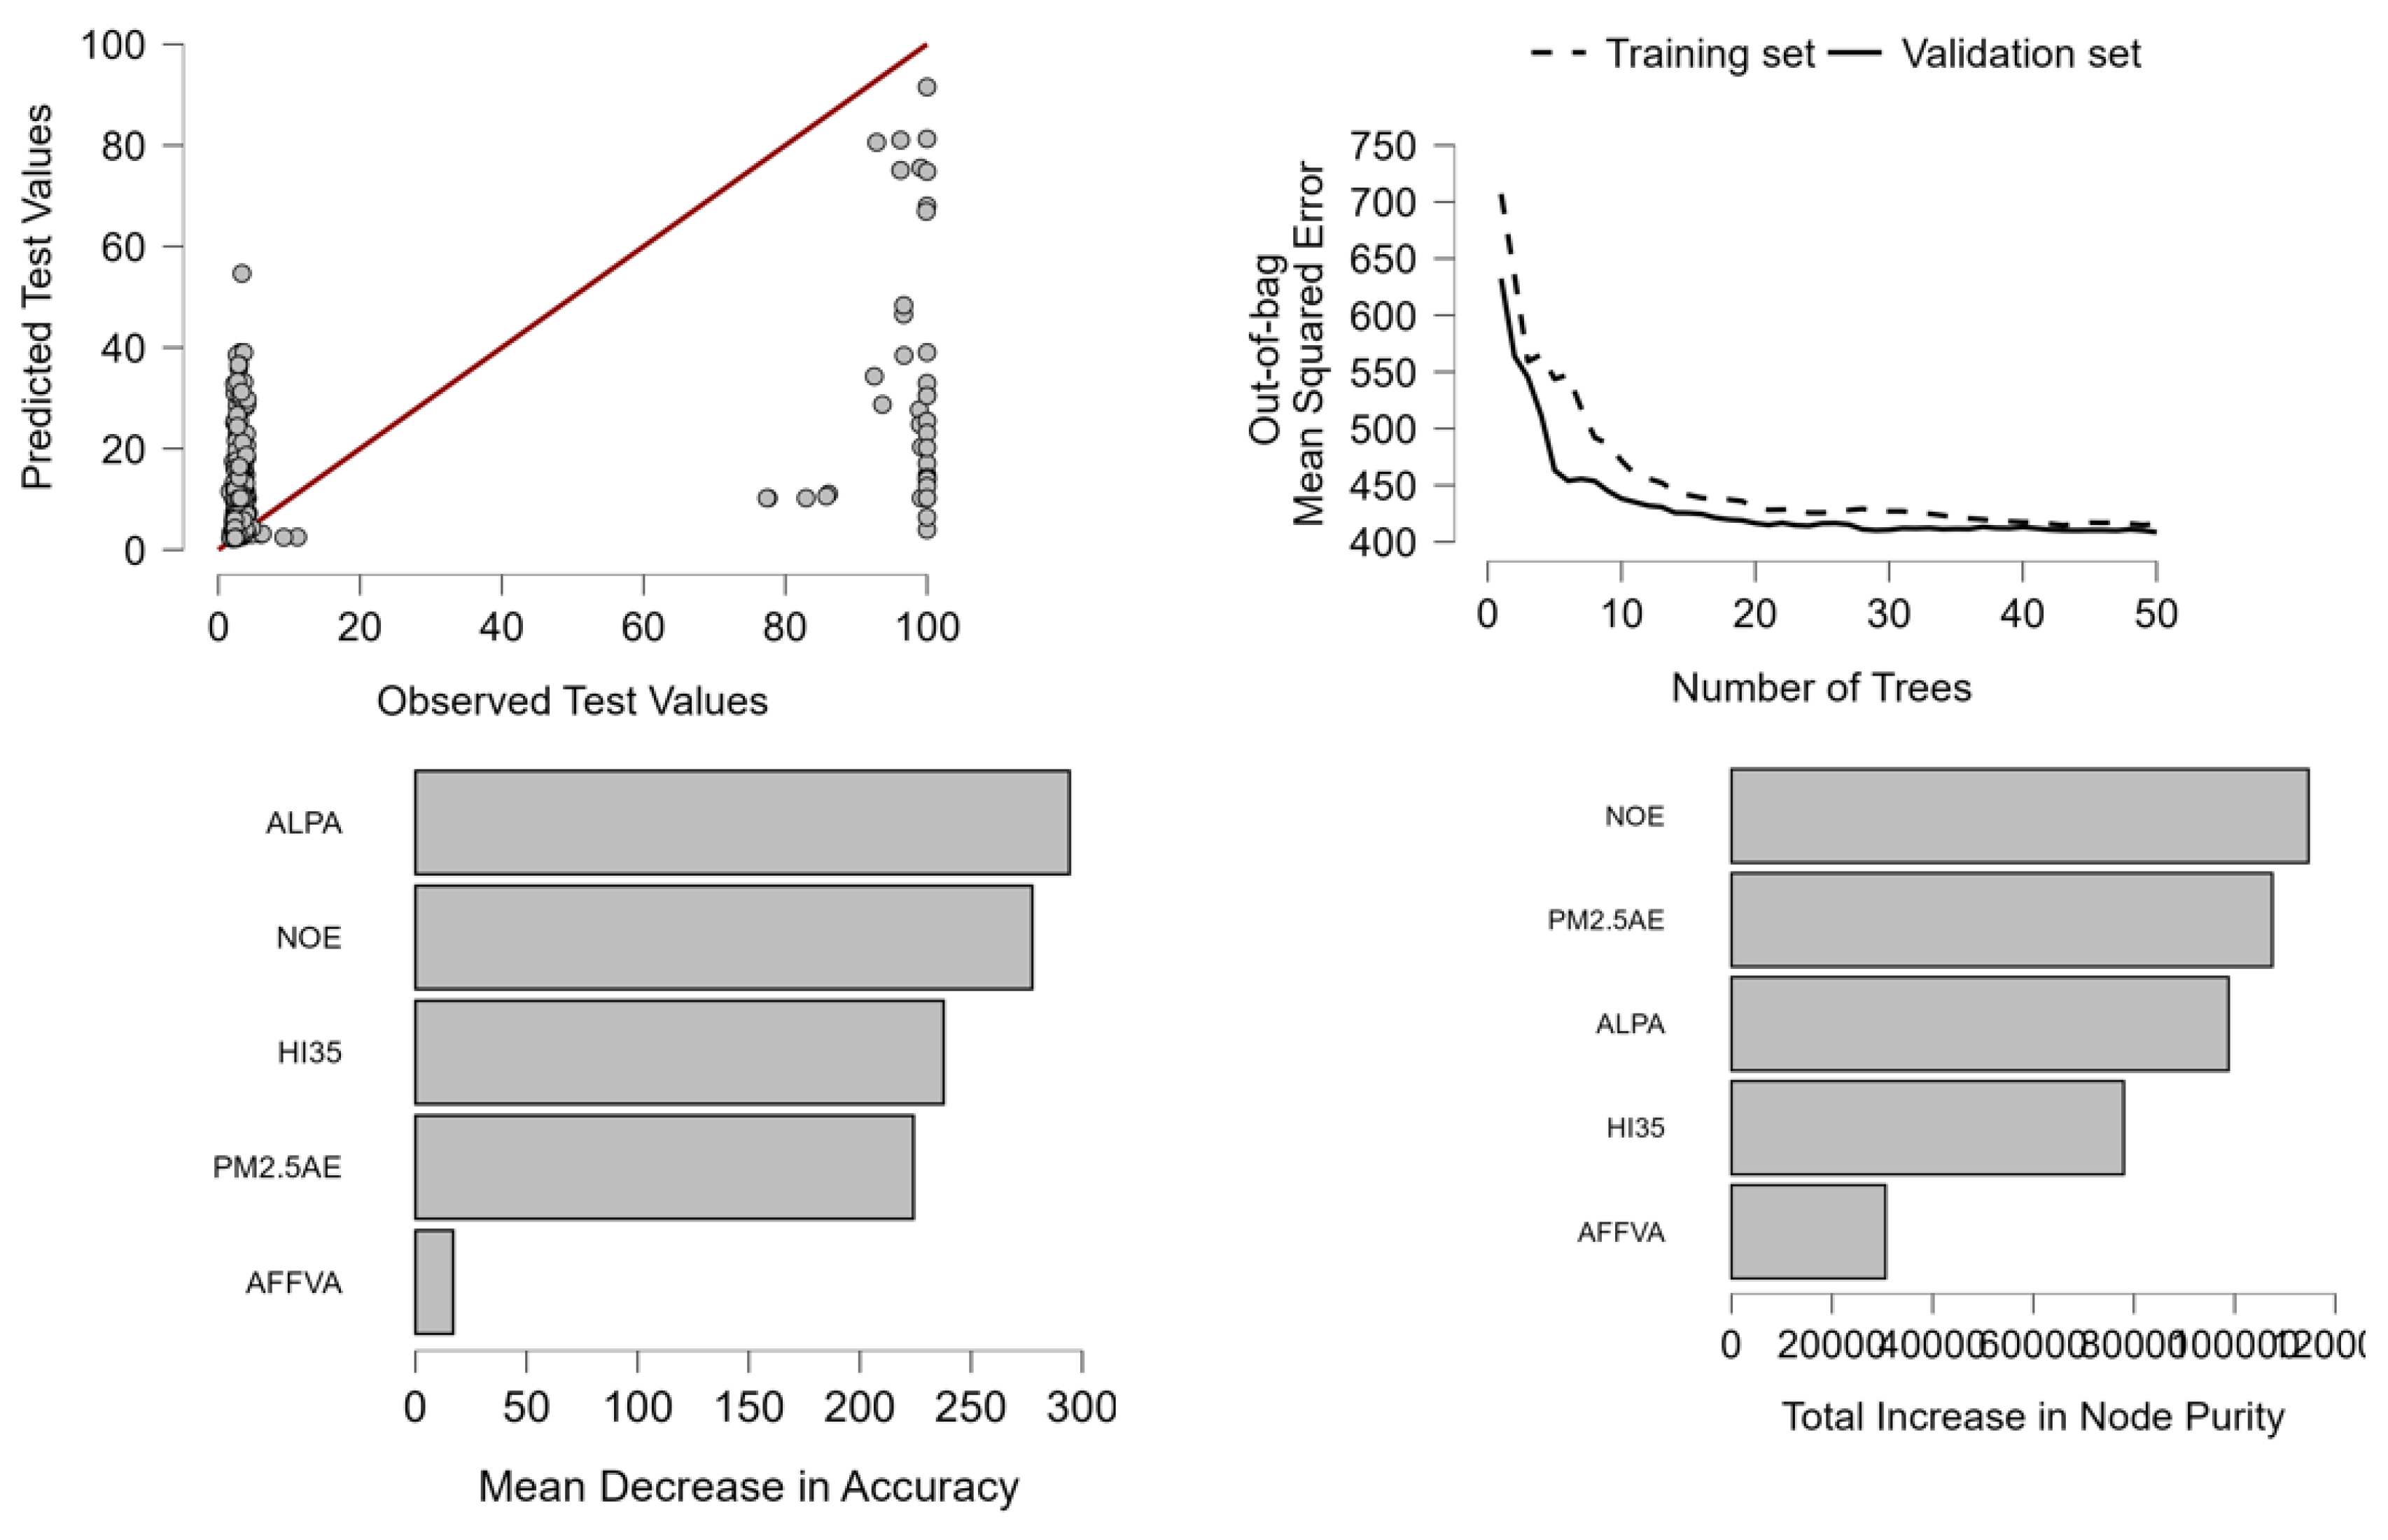
Figure 2.
Environmental Clustering of Countries Based on LPI Determinants: Cluster Profiles and Variable Deviations.
Figure 2.
Environmental Clustering of Countries Based on LPI Determinants: Cluster Profiles and Variable Deviations.
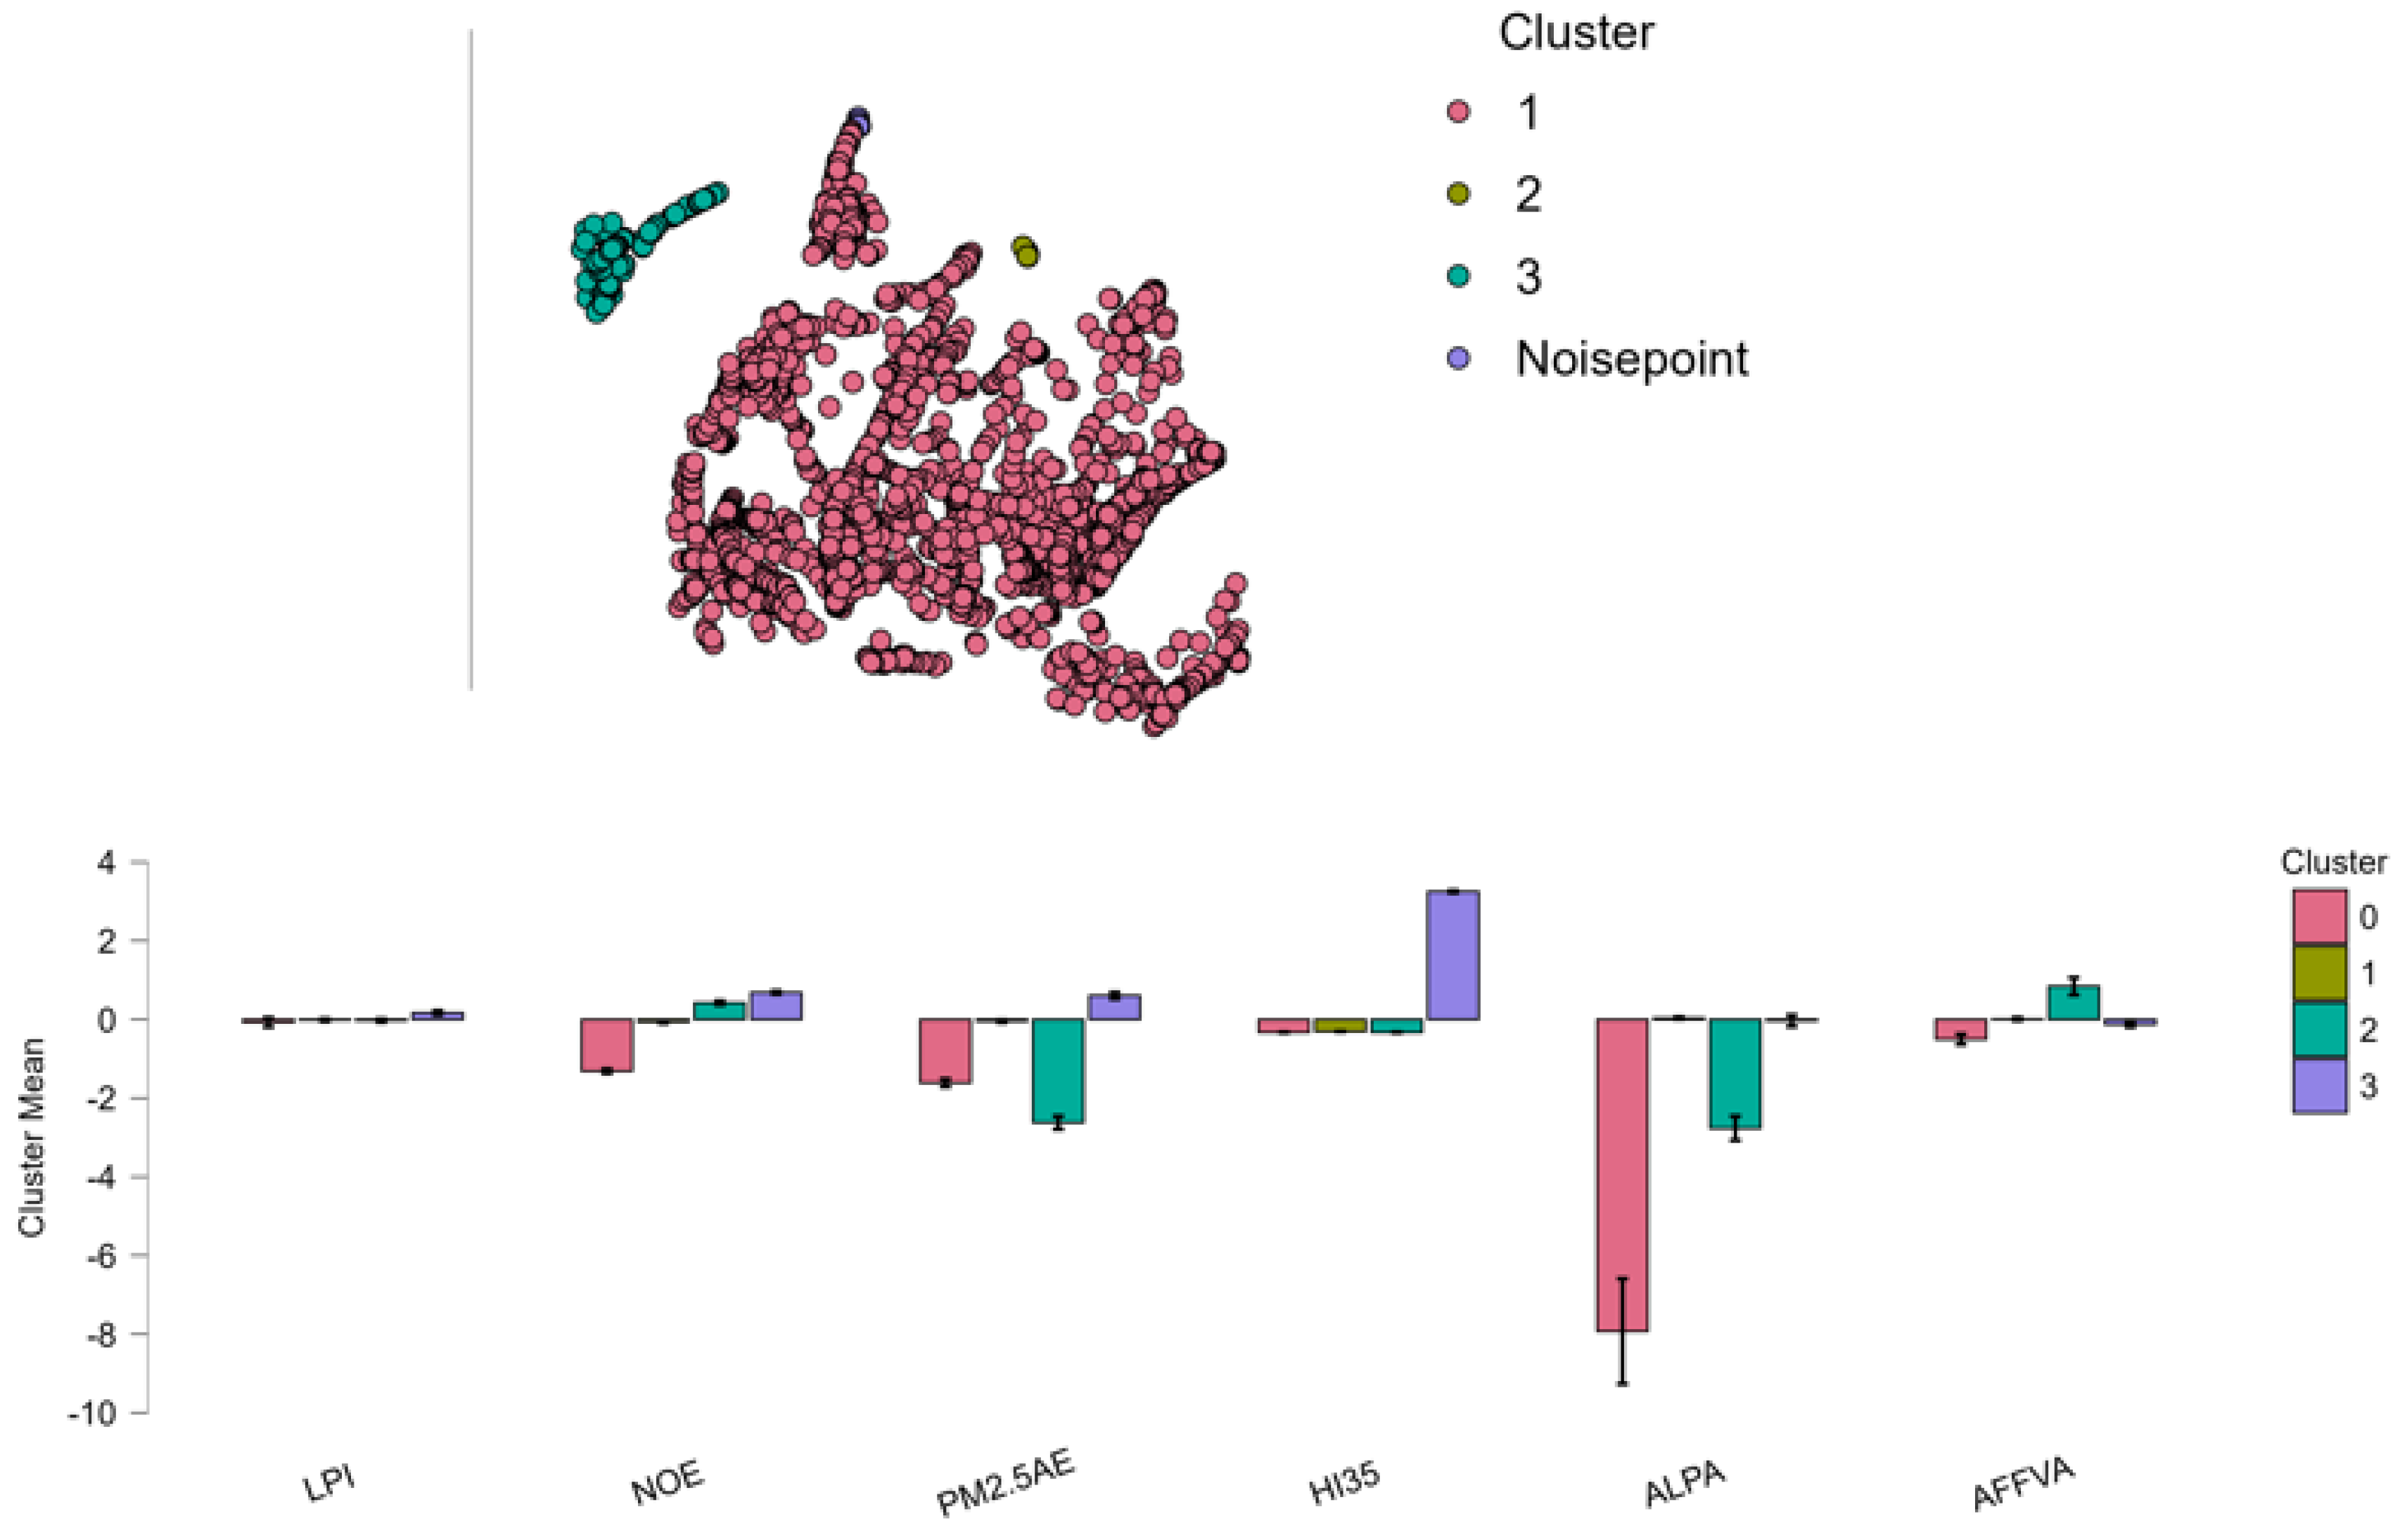
Figure 3.
KNN Feature Importance Analysis for Socio-Economic Predictors of Logistics Performance.
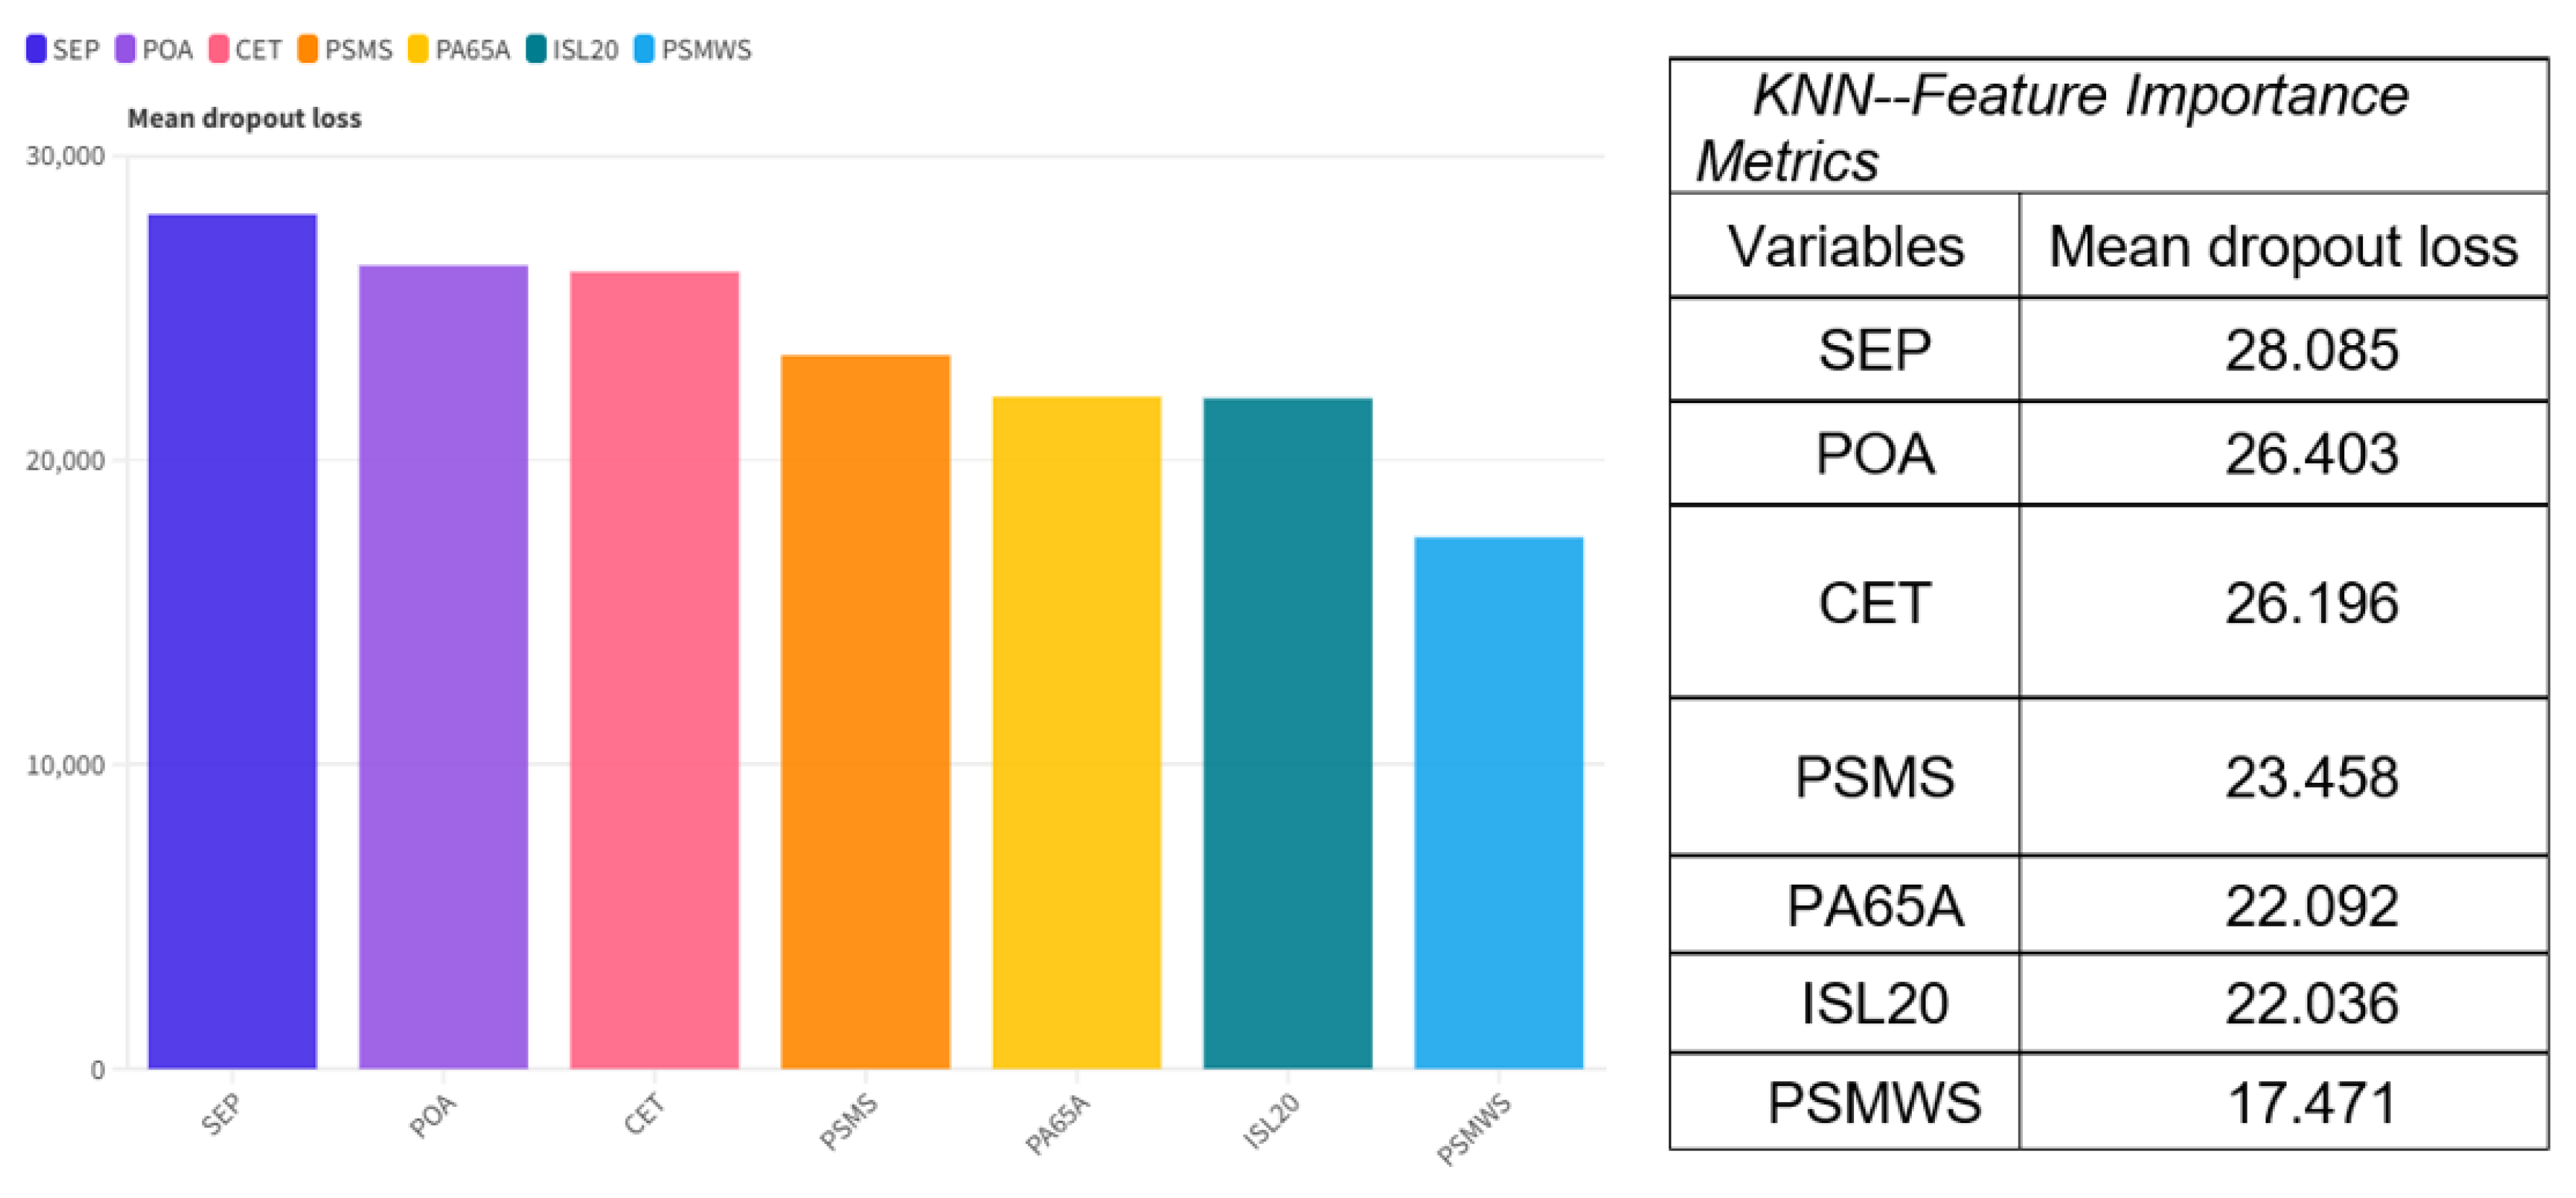
Figure 4.
Additive Feature Contributions to LPI Predictions Using K-Nearest Neighbors (KNN).
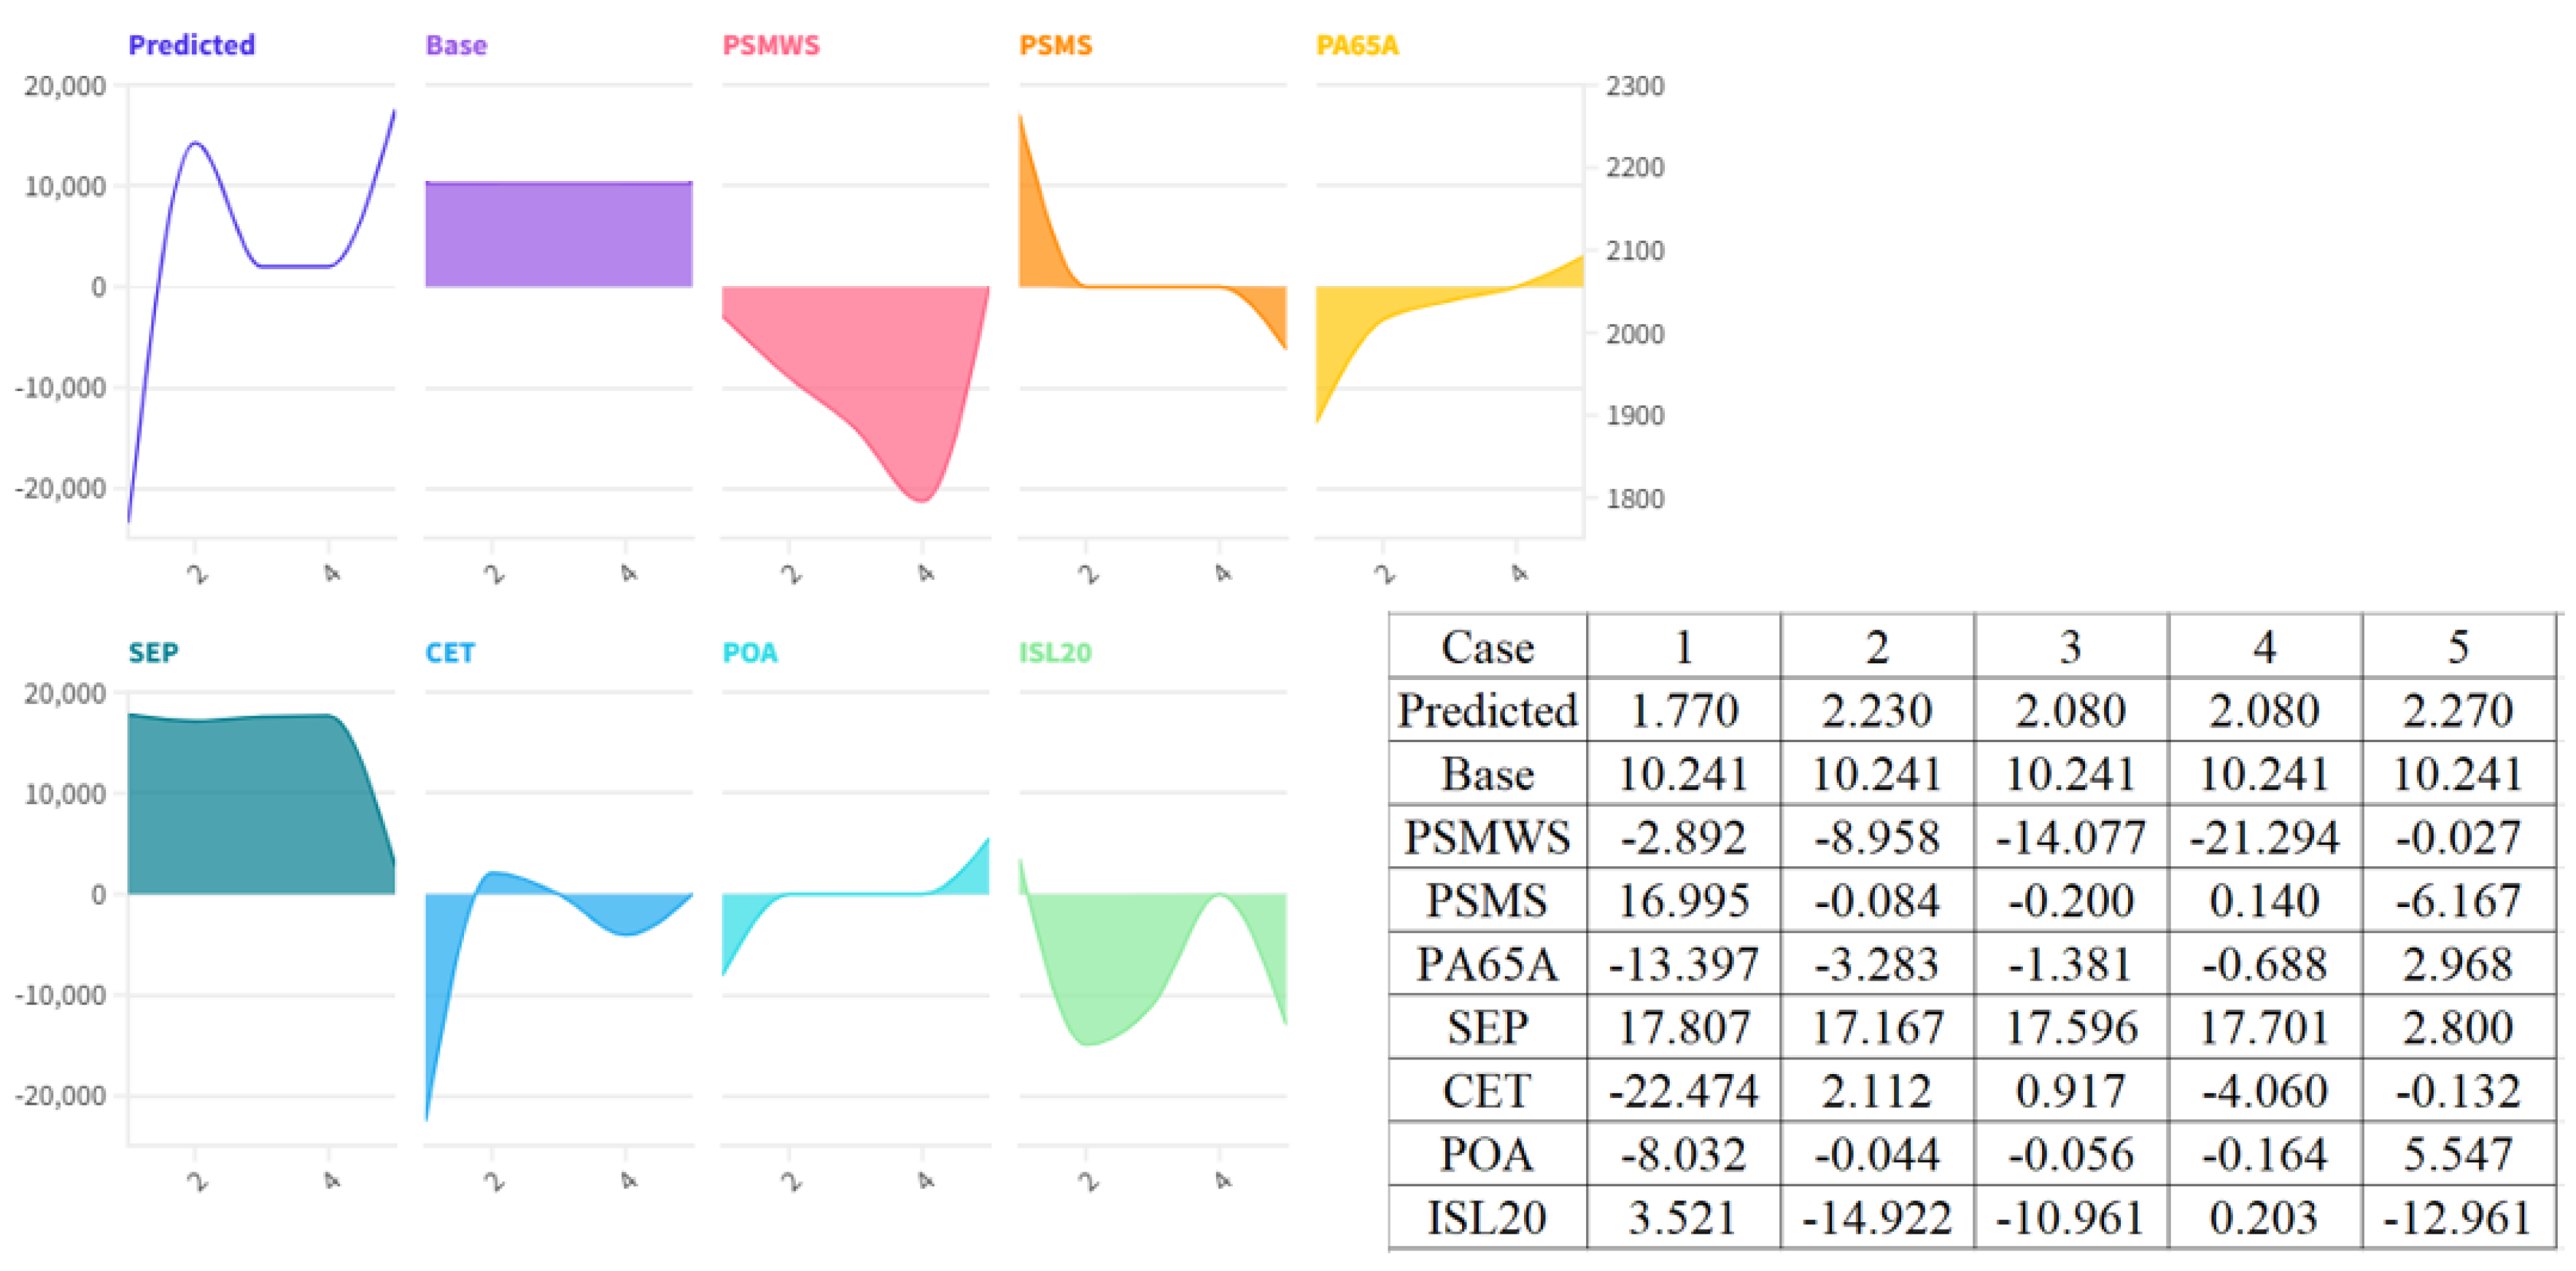
Figure 5.
Distribution and Cluster-Wise Means of Governance and Logistics Performance Indicators (LPI) Across Ten Groups.
Figure 5.
Distribution and Cluster-Wise Means of Governance and Logistics Performance Indicators (LPI) Across Ten Groups.
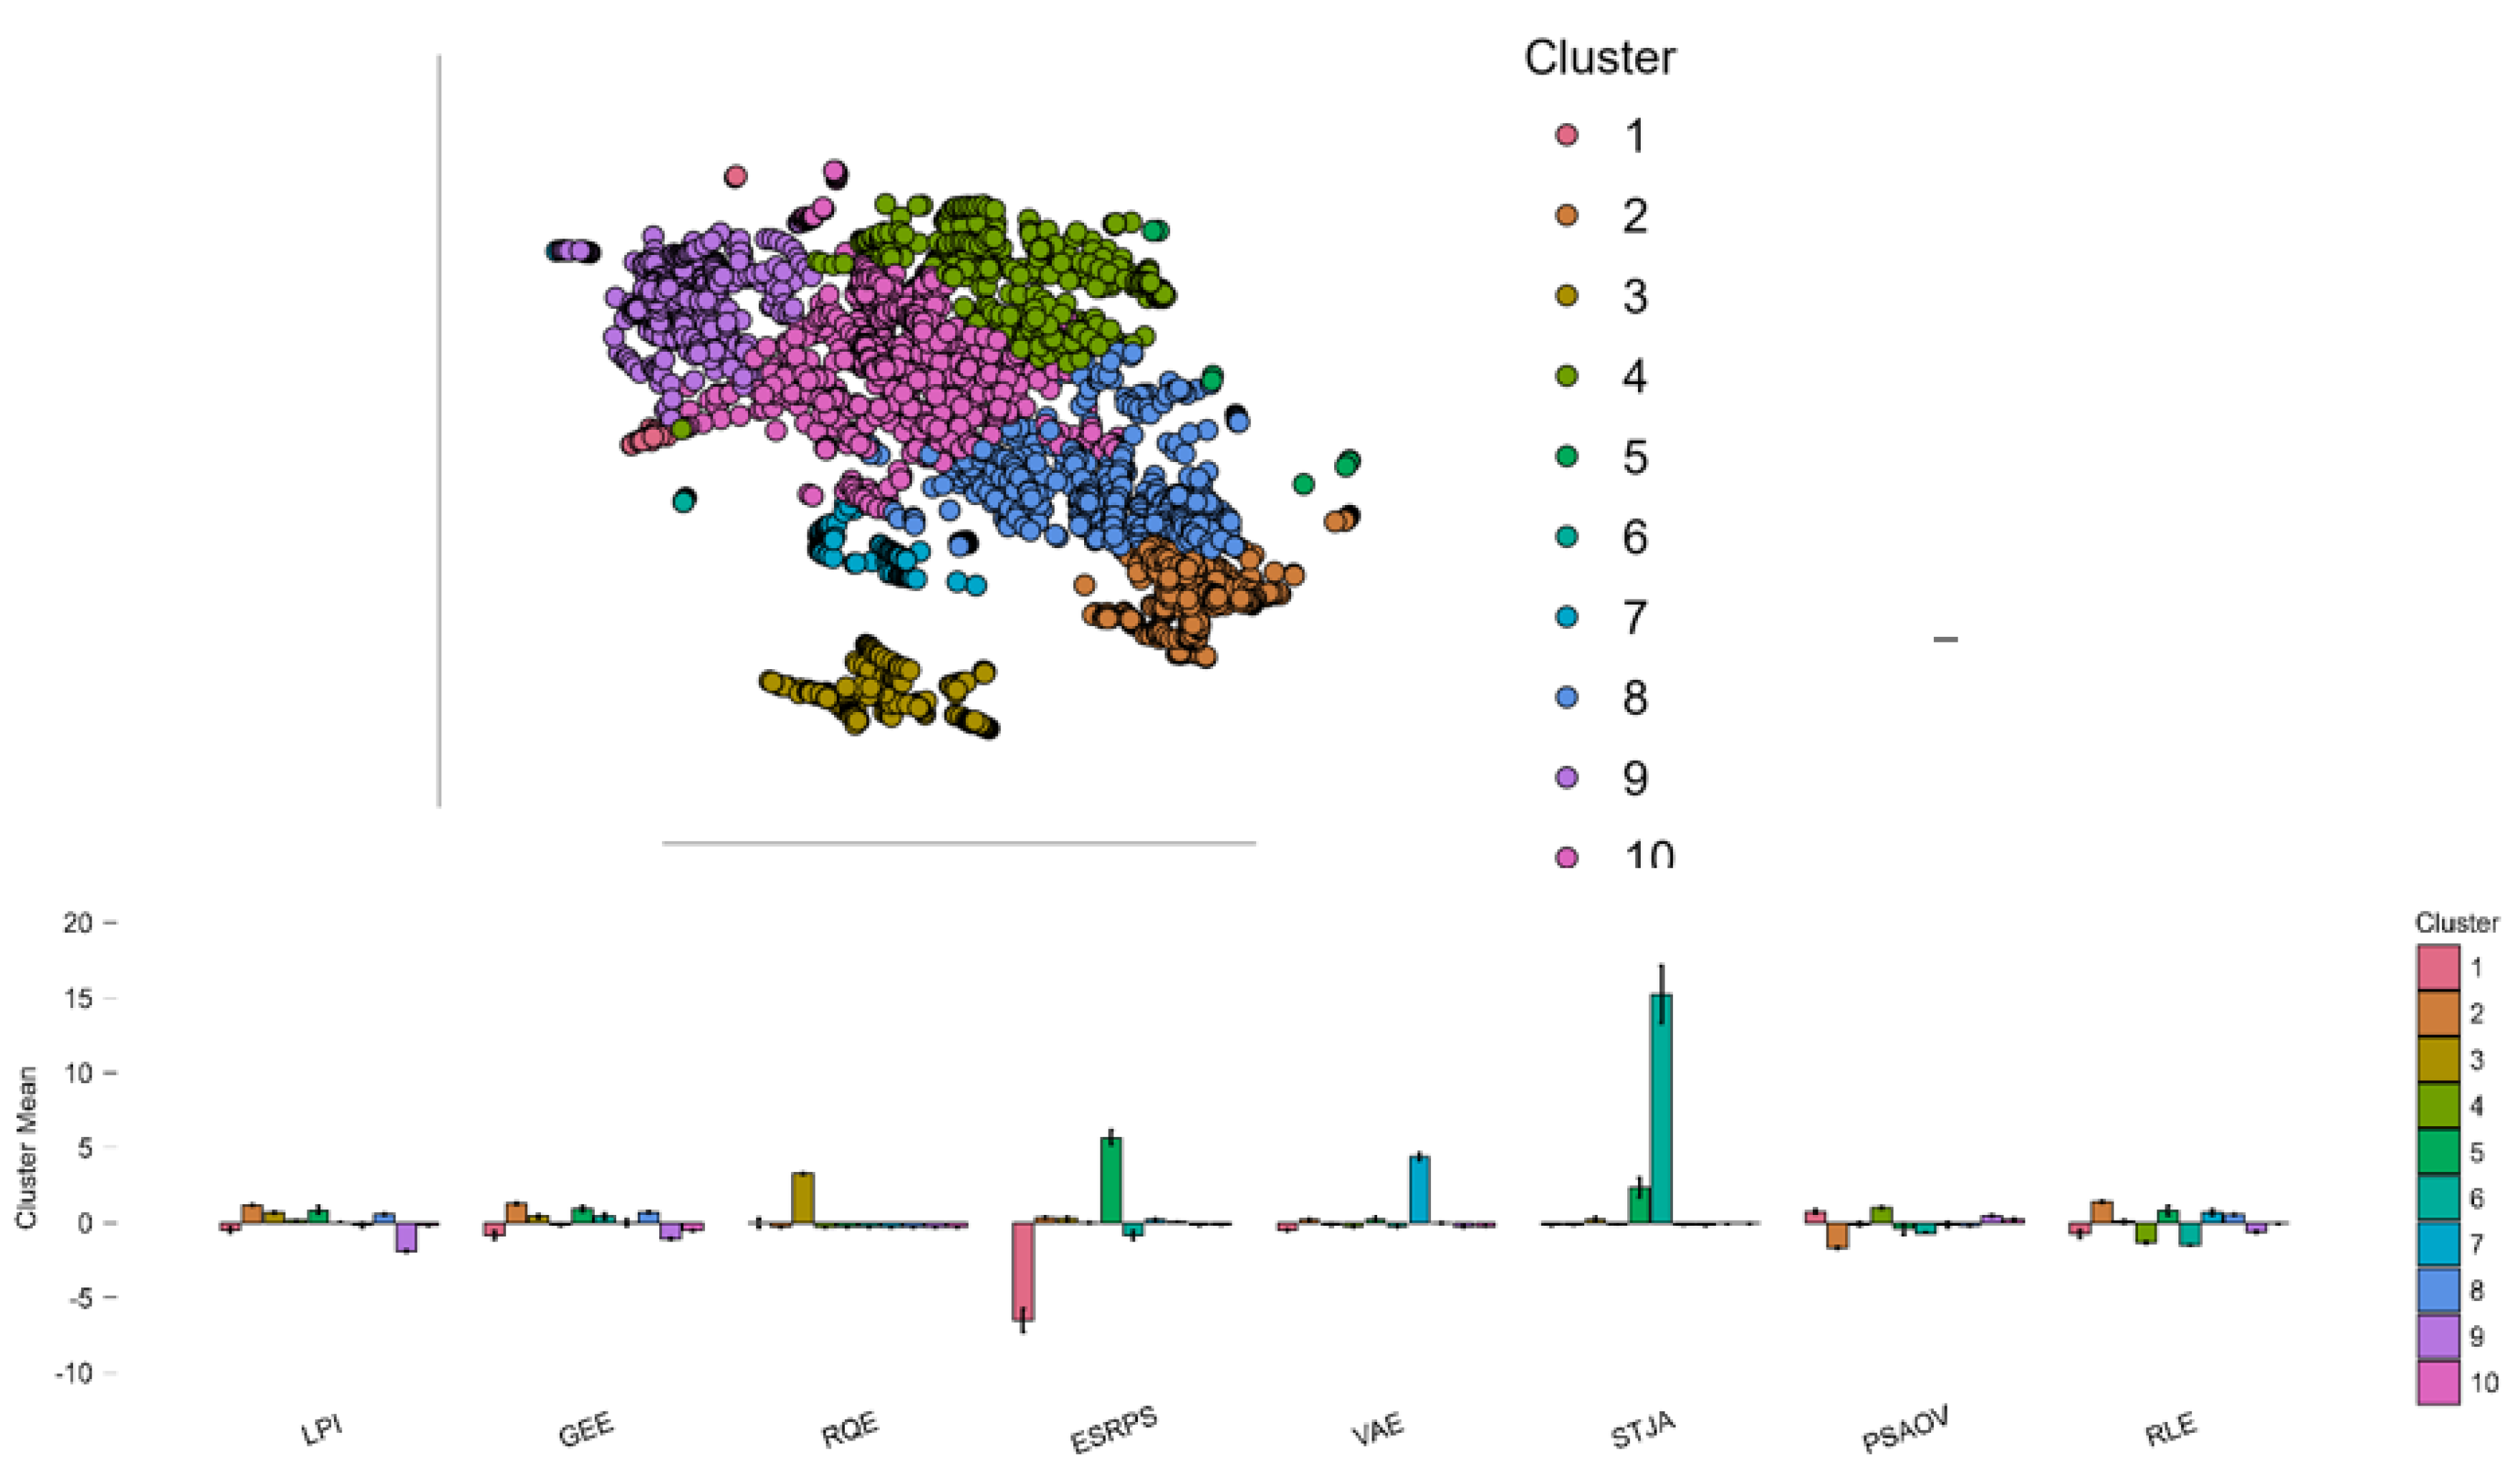
Figure 6.
Pairwise Relationships Among Governance and Logistics Indicators by Cluster.
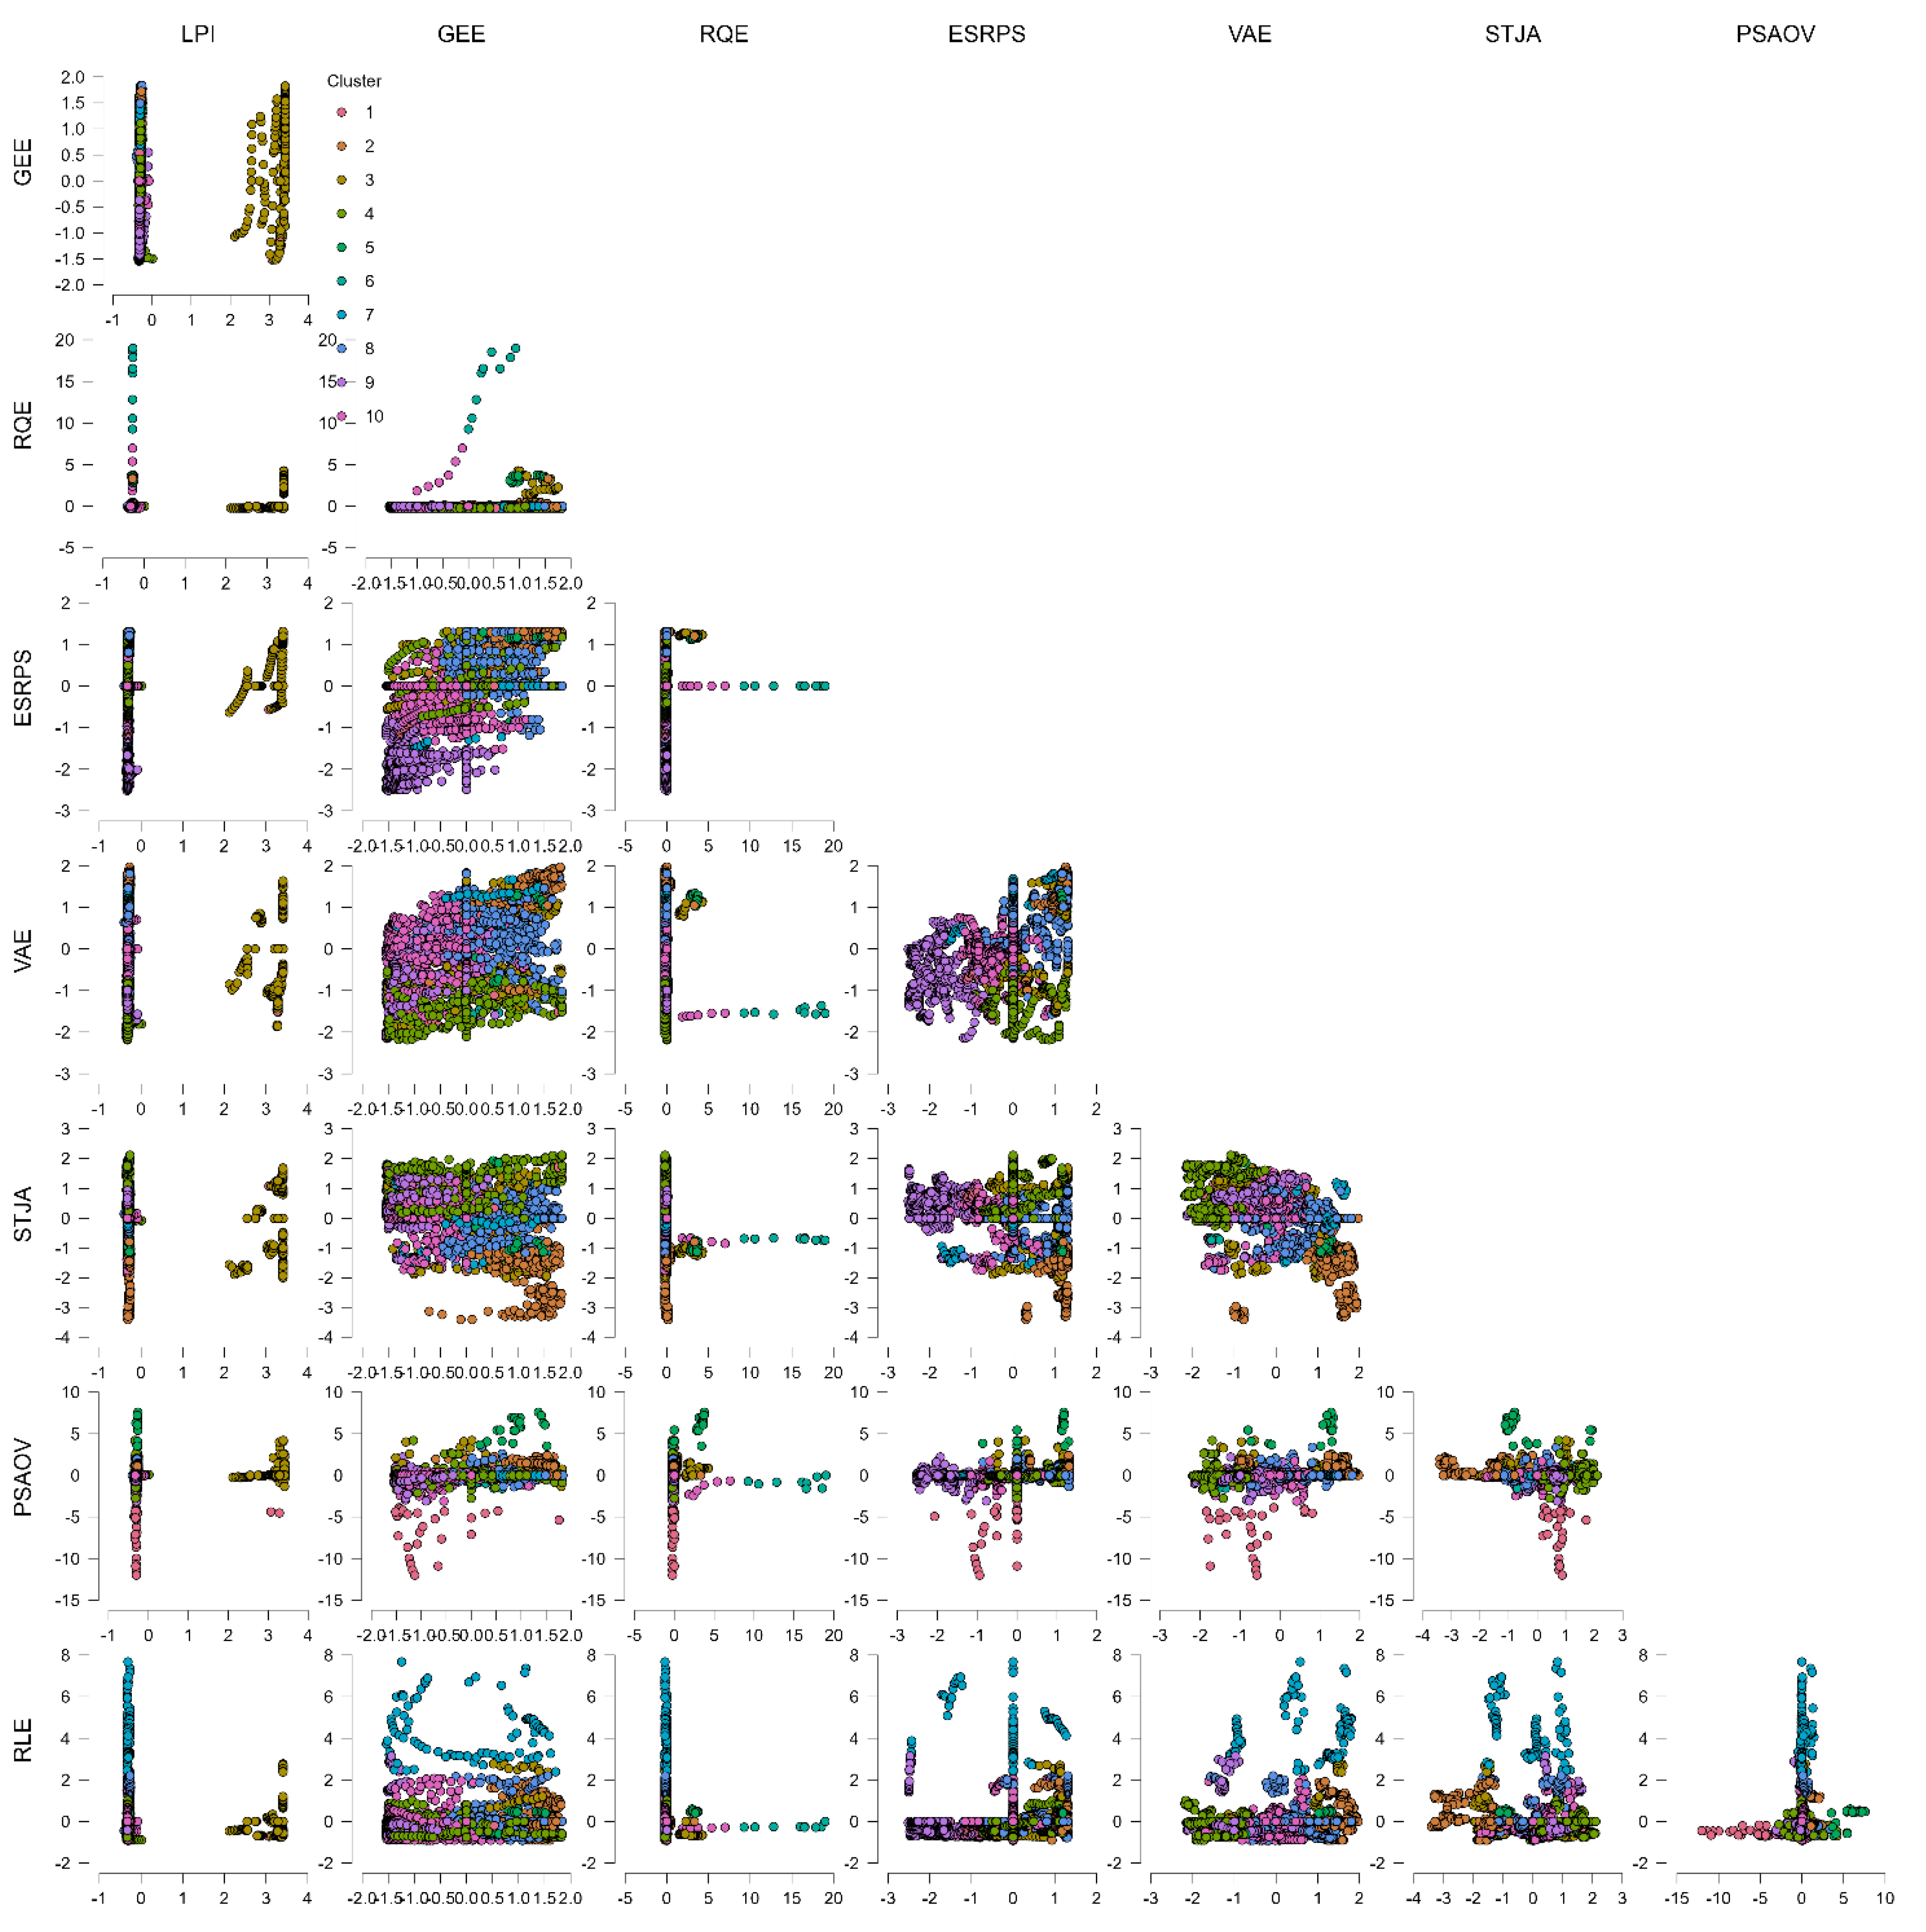

Table 1.
Environmental Stressors and Logistics Performance: An IV Panel Data Analysis.
| Dependent variable | LPI | |||||
| Endogenous | NOE PM25AE HI35 ALPA AFFVA | |||||
| Instruments | ACFTC PSMWS PSMS LEBT FRT PA65A LRAT SEP GEET CET LFPRT CODCDMPN MRU5 HB POA ISL20 GI PHRNPL AAGRPCI IUI GDPG PSHWNP RFMLFPR SLRI STJA RLE NM | |||||
| Observation | using 2771 observations | |||||
| Times | 17 | |||||
| Countries | 163 | |||||
| Fixed-effects TSLS | G2SLS random effects | |||||
| Variable | Coefficient | Std. Error | z-Statistic | Coefficient | Std. Error | z-Statistic |
| const | 4.36011** | 1.80629 | 2.414 | 4.30356** | 1.81460 | 2.372 |
| NOE | 0.00380304*** | 0.00124891 | 3.045 | 0.00382670*** | 0.00125502 | 3.049 |
| PM25AE | -0.109926** | 0.0434881 | -2.528 | -0.109655** | 0.0436855 | -2.510 |
| HI35 | 0.00822227*** | 0.00270937 | 3.035 | 0.00822599*** | 0.00272194 | 3.022 |
| ALPA | -0.00580407** | 0.00242142 | -2.397 | -0.00570789** | 0.00243231 | -2.347 |
| AFFVA | 0.0830939*** | 0.0217233 | 3.825 | 0.0836790*** | 0.0218238 | 3.834 |
| Statistics | SSR = 1880.24 | SSR = 2790.55 | ||||
| sigma-hat = 0.849903 (df = 2603) | sigma-hat = 1.00461 (df = 2765) | |||||
| R-squared = corr(y, yhat)^2 = 0.000173 | R-squared = corr(y, yhat)^2 = 0.000175 | |||||
| Included units = 163 | Included units = 163 | |||||
| Time-series length: min = 17, max = 17 | Time-series length: min = 17, max = 17 | |||||
| Wald chi-square(5) = 33.8617 [0.0000] | Wald chi-square(5) = 34.0125 [0.0000] | |||||
| Null hypothesis: The groups have a common intercept | sigma-hat(within) = 0.84990329 | |||||
| Test statistic: F(162, 2603) = 14978.8 [0.0000] | sigma-hat(between) = 25.712297 | |||||
Table 2.
Comparative Performance of Machine Learning Models in Predicting Logistics Performance.
| Statistics | Boosting Regression | Decision Tree Regression | k-Nearest Neighbours Regression | Linear Regression | Random Forest Regression | Lasso | Support Vector Machine |
| MSE | 668.052 | 435.315 | 596.462 | 603.118 | 464.679 | 606.449 | 842.876 |
| MSE(scaled) | 1.333 | 1.03 | 0.955 | 1.472 | 0.922 | 1.452 | 1.556 |
| RMSE | 25.847 | 20.864 | 24.423 | 24.558 | 21.556 | 24.626 | 29.032 |
| MAE / MAD | 13.713 | 8.824 | 8.57 | 14.267 | 10.264 | 14.032 | 9.458 |
| MAPE | 229.26% | 182.74% | 150.97% | 284.71% | 181.05% | 287.14% | 24.52% |
| R² | 0.111 | 0.234 | 0.272 | 0.069 | 0.29 | 0.074 | 0.049 |
Table 3.
Variable Importance Metrics for Predicting Logistics Performance.
| Variables | Mean decrease in accuracy | Total increase in node purity | Mean dropout loss |
| NOE | 277.497 | 114.677.766 | 23.130 |
| PM2.5AE | 224.074 | 107.476.889 | 21.434 |
| ALPA | 294.265 | 98.796.892 | 23.223 |
| HI35 | 237.642 | 77.966.120 | 21.182 |
| AFFVA | 16.990 | 30.634.277 | 17.586 |
Table 4.
Comparative Evaluation of Clustering Algorithms for Environmental Impacts on Logistics Performance.
Table 4.
Comparative Evaluation of Clustering Algorithms for Environmental Impacts on Logistics Performance.
| Metric | Density Based | Fuzzy C-Means | Hierarchical | Model Based | Neighborhood | Random Forest |
| Maximum diameter | 0.508 | 0.778 | 0.000 | 0.763 | 0.243 | 0.763 |
| Minimum separation | 1.000 | 0.008 | 0.184 | 0.000 | 0.026 | 3.16×10⁻⁵ |
| Pearson’s γ | 0.482 | 0.261 | 1.000 | 0.000 | 0.682 | 0.029 |
| Dunn index | 1.000 | 0.009 | 0.247 | 0.001 | 0.035 | 0.000 |
| Entropy | 0.000 | 0.709 | 0.266 | 0.940 | 0.941 | 0.695 |
| Calinski-Harabasz index | 0.099 | 0.060 | 0.161 | 0.000 | 1.000 | 0.000 |
| R² | 0.000 | 0.280 | 0.547 | 0.241 | 1.000 | 0.207 |
| AIC | 1.000 | 0.615 | 0.000 | 0.455 | 0.000 | 0.509 |
| BIC | 1.000 | 0.594 | 0.000 | 0.432 | 0.000 | 0.493 |
| Silhouette | 0.476 | 0.128 | 0.537 | 0.063 | 0.414 | 0.000 |
Table 5.
Cluster Composition and Variability Metrics Using Density-Based Clustering on Environmental Determinants of LPI.
Table 5.
Cluster Composition and Variability Metrics Using Density-Based Clustering on Environmental Determinants of LPI.
| Cluster | Noisepoints | 1 | 2 | 3 |
| Size | 8 | 2517 | 8 | 238 |
| Explained proportion within-cluster heterogeneity | 0.000 | 0.940 | 2.795×10⁻⁴ | 0.060 |
| Within sum of squares | 0.000 | 12160.403 | 3.617 | 776.706 |
| Silhouette score | 0.000 | 0.382 | 0.791 | 0.523 |
| Note. The Between Sum of Squares of the 3 cluster model is 3099.35 | ||||
| Note. The Total Sum of Squares of the 3 cluster model is 16040.08 | ||||
Table 6.
Cluster Mean Values for Environmental and Logistic Indicators.
| LPI | NOE | PM2.5AE | HI35 | ALPA | AFFVA | |
| Cluster 0 | -0.073 | -1.314 | -1.612 | -0.328 | -7.928 | -0.504 |
| Cluster 1 | -0.016 | -0.062 | -0.044 | -0.305 | 0.037 | 0.011 |
| Cluster 2 | -0.027 | 0.423 | -2.623 | -0.329 | -2.766 | 0.843 |
| Cluster 3 | 0.169 | 0.684 | 0.606 | 3.250 | -0.033 | -0.125 |
Table 7.
Impact of Social Factors on Logistics Performance: Fixed-Effects TSLS and G2SLS Estimates.
| Y | LPI | |||||
| Endogenous | PSMWS PSMS PA65A SEP CET POA ISL20 | |||||
| Instruments | IUI GDPG PSHWNP RFMLFPR SLRI STJA RLE NM CO2E NOE PM25AE GHGLUCF EILPE REC FFEC EU CDD HDD HI35 SPEI LST PD LWS ALPA FPI AFFVA MST AFWT TMPA ASFD ASNRD | |||||
| T | 17 | |||||
| N | 163 | |||||
| Observations | 2771 | |||||
| Fixed-effects TSLS | G2SLS random effects | |||||
| coefficient | std. error | z | coefficient | std. error | z | |
| Constant | 14.2037*** | 0.931617 | 15.25 | 14.2130*** | 0.929932 | 15.28 |
| PSMWS | -0.0127591* | 0.00696445 | -1.832 | -0.0129694* | 0.00695574 | -1.865 |
| PSMS | -0.0485794*** | 0.0138711 | -3.502 | -0.0486587*** | 0.0138471 | -3.514 |
| PA65A | -0.0468931** | 0.0223795 | -2.095 | -0.0468441** | 0.0223481 | -2.096 |
| SEP | -0.364282** | 0.181080 | -2.012 | -0.363990** | 0.180837 | -2.013 |
| CET | 1.69526*** | 0.400538 | 4.232 | 1.69409*** | 0.399966 | 4.236 |
| POA | 0.0293510*** | 0.00888111 | 3.305 | 0.0292621*** | 0.00887040 | 3.299 |
| ISL20 | -1.59629*** | 0.370631 | -4.307 | -1.59533*** | 0.370088 | -4.311 |
| Statistics and Tests | SSR = 1043.01 | SSR = 2755.43 | ||||
| sigma-hat = 0.633248 (df = 2601) | sigma-hat = 0.998629 (df = 2763) | |||||
| R-squared = corr(y, yhat)^2 = 0.002318 | R-squared = corr(y, yhat)^2 = 0.002340 | |||||
| Included units = 163 | Included units = 163 | |||||
| Time-series length: min = 17, max = 17 | Time-series length: min = 17, max = 17 | |||||
| Wald chi-square(7) = 71.9868 [0.0000] | Wald chi-square(7) = 72.3664 [0.0000] | |||||
| Null hypothesis: The groups have a common intercept | sigma-hat(within) = 0.63324843 | |||||
| Test statistic: F(162, 2601) = 27100.4 [0.0000] | sigma-hat(between) = 26.654767 | |||||
Table 8.
Comparison of Machine Learning Algorithms for Predicting Logistics Performance Based on Socio-Economic Factors.
Table 8.
Comparison of Machine Learning Algorithms for Predicting Logistics Performance Based on Socio-Economic Factors.
| Metric | Boosting | Decision Tree | K-Nearest Neighbors | Linear | Random Forest | Regularized Linear | SVM |
| MSE | 0.617 | 0.110 | 0.000 | 0.451 | 0.007 | 0.642 | 0.708 |
| MSE(scaled) | 0.568 | 0.091 | 0.000 | 0.822 | 0.056 | 0.777 | 1.000 |
| RMSE | 0.643 | 0.099 | 0.000 | 0.470 | 0.005 | 0.664 | 0.724 |
| MAE / MAD | 0.776 | 0.140 | 0.000 | 0.727 | 0.277 | 0.857 | 0.316 |
| MAPE | 0.763 | 0.172 | 0.000 | 1.000 | 0.290 | 0.955 | 0.000 |
| R² | 0.211 | 0.793 | 1.000 | 0.092 | 0.950 | 0.103 | 0.000 |
Table 9.
Normalized Performance Metrics for Clustering Algorithms: Predicting LPI with Socio-Economic Variables.
Table 9.
Normalized Performance Metrics for Clustering Algorithms: Predicting LPI with Socio-Economic Variables.
| Metric | Density Based | Fuzzy C-Means | Hierarchical | Model Based | Neighborhood-Based | Random Forest |
|---|---|---|---|---|---|---|
| Maximum diameter | 1.000 | 0.072 | 0.063 | 0.967 | 0.061 | 0.081 |
| Minimum separation | 1.000 | 0.029 | 0.216 | 0.000 | 0.056 | 0.033 |
| Pearson’s γ | 0.527 | 0.000 | 0.870 | 0.179 | 0.538 | 0.056 |
| Dunn index | 1.000 | 0.043 | 0.314 | 0.000 | 0.081 | 0.043 |
| Entropy | 0.000 | 0.752 | 0.340 | 1.000 | 0.899 | 0.693 |
| Calinski-Harabasz index | 1.000 | 0.001 | 0.002 | 0.002 | 0.004 | 0.001 |
| R² | 0.000 | 0.351 | 0.642 | 0.627 | 1.000 | 0.494 |
| AIC | 1.000 | 0.593 | 0.000 | 0.008 | 0.000 | 0.569 |
| BIC | 1.000 | 0.593 | 0.000 | 0.008 | 0.000 | 0.569 |
| Silhouette | 1.000 | 0.115 | 0.926 | 0.370 | 0.963 | 0.000 |
Table 10.
Socio-Economic Characterization of Clusters Affecting Logistic Performance.
| Cluster | 1 | 2 | 3 | 4 | 5 | 6 | 7 | 8 | 9 | 10 |
| Size | 564 | 244 | 218 | 434 | 68 | 409 | 76 | 352 | 237 | 169 |
| Explained proportion within-cluster heterogeneity | 0.168 | 0.105 | 0.108 | 0.153 | 0.041 | 0.108 | 0.064 | 0.063 | 0.117 | 0.072 |
| Within sum of squares | 1.153 | 718.762 | 745.245 | 1.053 | 284.004 | 744.270 | 442.164 | 433.747 | 801.223 | 493.387 |
| Silhouette score | 0.227 | 0.161 | 0.219 | 0.194 | 0.378 | 0.239 | 0.235 | 0.450 | 0.204 | 0.430 |
| Center LPI | -0.302 | -0.315 | -0.324 | -0.312 | 3.309 | -0.299 | -0.327 | -0.277 | -0.311 | 3.233 |
| Center PSMWS | -0.077 | 0.164 | 2.259 | -0.088 | -0.042 | -0.515 | 1.799 | -0.673 | -0.127 | -0.632 |
| Center PSMS | 0.668 | 0.183 | 0.741 | -1.210 | -2.134 | -0.063 | -2.193 | 0.633 | 0.090 | 0.207 |
| Center PA65A | -0.624 | -0.466 | -0.165 | -0.078 | 1.284 | -0.121 | 1.423 | -0.220 | 2.149 | -0.252 |
| Center SEP | -0.253 | -0.209 | -0.691 | -0.662 | -1.185 | 0.883 | -2.489 | 1.200 | 0.242 | 0.358 |
| Center CET | -0.495 | -0.520 | -1.018 | -0.478 | -0.783 | 0.723 | -1.620 | 1.748 | 0.028 | 0.556 |
| Center POA | -0.360 | 1.542 | -0.600 | -0.400 | -0.580 | -0.505 | -0.423 | 1.168 | 0.147 | -0.217 |
| Center ISL20 | -0.545 | -0.474 | -1.035 | -0.416 | -0.978 | 0.751 | -1.560 | 1.603 | 0.114 | 0.685 |
Table 11.
Cluster means.
| Cluster Means | ||||||||
| LPI | PSMWS | PSMS | PA65A | SEP | CET | POA | ISL20 | |
| Cluster 1 | -0.495 | -0.545 | -0.302 | -0.624 | -0.360 | 0.668 | -0.077 | -0.253 |
| Cluster 2 | -0.520 | -0.474 | -0.315 | -0.466 | 1.542 | 0.183 | 0.164 | -0.209 |
| Cluster 3 | -1.018 | -1.035 | -0.324 | -0.165 | -0.600 | 0.741 | 2.259 | -0.691 |
| Cluster 4 | -0.478 | -0.416 | -0.312 | -0.078 | -0.400 | -1.210 | -0.088 | -0.662 |
| Cluster 5 | -0.783 | -0.978 | 3.309 | 1.284 | -0.580 | -2.134 | -0.042 | -1.185 |
| Cluster 6 | 0.723 | 0.751 | -0.299 | -0.121 | -0.505 | -0.063 | -0.515 | 0.883 |
| Cluster 7 | -1.620 | -1.560 | -0.327 | 1.423 | -0.423 | -2.193 | 1.799 | -2.489 |
| Cluster 8 | 1.748 | 1.603 | -0.277 | -0.220 | 1.168 | 0.633 | -0.673 | 1.200 |
| Cluster 9 | 0.028 | 0.114 | -0.311 | 2.149 | 0.147 | 0.090 | -0.127 | 0.242 |
| Cluster 10 | 0.556 | 0.685 | 3.233 | -0.252 | -0.217 | 0.207 | -0.632 | 0.358 |
Table 12.
Causal Effects of Institutional Governance on the Logistics Performance Index (LPI).
| y | LPI | |||||
| Endogenous | GEE RQE ESRPS VAE STJA PSAOV RLE | |||||
| Instruments | IUI CO2E NOE PM25AE GHGLUCF EILPE REC FFEC EU CDD HDD HI35 SPEI LSTPD LWS ALPA FPI AFFVA MST AFWT TMPA ASFD ASNRD | |||||
| T | 17 | |||||
| N | 163 | |||||
| Observations | 2771 | |||||
| G2SLS random effects | Fixed-effects TSLS | |||||
| coefficient | std. error | z | coefficient | std. error | z | |
| const | 11.9114*** | 0.588432 | 20.24 | 11.9297*** | 0.593942 | 20.09 |
| GEE | 0.0151558*** | 0.00230164 | 6.585 | 0.0152008*** | 0.00232277 | 6.544 |
| RQE | -5.51554e-06** | 2.38212e-06 | -2.315 | -5.52359e-06** | 2.40369e-06 | -2.298 |
| ESRPS | -0.0354579*** | 0.00975704 | -3.634 | -0.0357672 *** | 0.00984858 | -3.632 |
| VAE | 0.543244*** | 0.137306 | 3.956 | 0.546940 *** | 0.138589 | 3.946 |
| STJA | 0.0259654*** | 0.00625200 | 4.153 | 0.0259979*** | 0.00630913 | 4.121 |
| PSAOV | 9.78199e-07** | 4.06429e-07 | 2.407 | 9.77849e-07** | 4.10115e-07 | 2.384 |
| RLE | 0.282701** | 0.110445 | 2.560 | 0.283452** | 0.111451 | 2.543 |
| Statistics And Tests | SSR = 2713.7 | SSR = 1072.64 | ||||
| sigma-hat = 0.991039 (df = 2763) | sigma-hat = 0.64218 (df = 2601) | |||||
| R-squared = corr(y, yhat)^2 = 0.009367 | R-squared = corr(y, yhat)^2 = 0.009321 | |||||
| Included units = 163 | Included units = 163 | |||||
| Time-series length: min = 17, max = 17 | Time-series length: min = 17, max = 17 | |||||
| Wald chi-square(7) = 72.3551 [0.0000] | Wald chi-square(7) = 71.0526 [0.0000] | |||||
| sigma-hat(within) = 0.64218019 | Null hypothesis: The groups have a common intercept | |||||
| sigma-hat(between) = 30.771231 | Test statistic: F(162, 2601) = 26449.2 [0.0000] | |||||
Table 13.
Comparative Performance of Regression Algorithms for Predicting Logistics Performance.
| Boosting Regression | Decision Tree Regression | k-Nearest Neighbors | Linear Regressions | Random Forest Regression | Support Vector Machine | |
| MSE | 710.124 | 395.86 | 215.583 | 646.107 | 327.09 | 681.308 |
| MSE (scaled) | 1.198 | 0.759 | 0.425 | 1.488 | 0.415 | 1.689 |
| RMSE | 26.648 | 19.896 | 14.683 | 25.419 | 18.086 | 26.102 |
| MAE / MAD | 13.847 | 6.537 | 5.779 | 14.92 | 8.665 | 7.702 |
| MAPE | 212.44% | 128.57% | 133.26% | 294.11% | 145.91% | 18.16% |
| R² | 0.16 | 0.384 | 0.619 | 0.065 | 0.628 | 0.024 |
Table 14.
Governance Predictors and Their Influence on LPI: Mean Dropout Loss Analysis.
| Mean dropout loss | |
| STJA | 29.515 |
| VAE | 28.538 |
| ESRPS | 23.916 |
| RLE | 20.574 |
| GEE | 20.056 |
| RQE | 17.422 |
| PSAOV | 16.924 |
| Note. Mean dropout loss (defined as root mean squared error (RMSE)) is based on 50 permutations. | |
Table 15.
Additive Feature Contributions to LPI Predictions Using k-NN Model (Governance Dimension).
Table 15.
Additive Feature Contributions to LPI Predictions Using k-NN Model (Governance Dimension).
| Additive Explanations for Predictions of Test Set Cases | |||||||||
| Case | Predicted | Base | GEE | RQE | ESRPS | VAE | STJA | PSAOV | RLE |
| 1 | 2.180 | 10.678 | -0.686 | -0.046 | -16.907 | 9.827 | -0.116 | -0.529 | -0.042 |
| 2 | 2.370 | 10.678 | 0.019 | -0.002 | -16.008 | 9.862 | -1.659 | -0.550 | 0.029 |
| 3 | 6.203 | 10.678 | 0.493 | -0.006 | -14.116 | 7.964 | 0.773 | 0.172 | 0.245 |
| 4 | 2.370 | 10.678 | -0.387 | -0.015 | -16.067 | 9.473 | -0.832 | -0.417 | -0.062 |
| 5 | 2.503 | 10.678 | 2.120 | -1.209 | -0.858 | -1.044 | -5.932 | -0.239 | -1.014 |
| Note. Displayed values represent feature contributions to the predicted value without features (column ‘Base’) for the test set. | |||||||||
Table 16.
Comparative Evaluation of Clustering Algorithms for Governance and Logistics Performance Analysis.
Table 16.
Comparative Evaluation of Clustering Algorithms for Governance and Logistics Performance Analysis.
| Metric | Density Based | Fuzzy c-Means | Hierarchical | Model Based | Neighborhood | Random Forest |
| Maximum diameter | 0.447 | 0.740 | 0.000 | 0.791 | 0.057 | 1.000 |
| Minimum separation | 0.997 | 0.126 | 0.981 | 0.061 | 0.149 | 0.000 |
| Pearson’s γ | 0.805 | 0.368 | 1.000 | 0.283 | 0.588 | 0.000 |
| Dunn index | 0.492 | 0.046 | 1.000 | 0.000 | 0.110 | 0.001 |
| Entropy | 0.000 | 0.674 | 0.095 | 0.764 | 0.668 | 0.490 |
| Calinski-Harabasz index | 0.179 | 0.248 | 0.221 | 0.159 | 1.000 | 0.000 |
| R² | 0.130 | 0.425 | 0.392 | 0.297 | 1.000 | 0.000 |
| AIC | 0.699 | 0.273 | 0.327 | 0.578 | 0.000 | 1.000 |
| BIC | 0.672 | 0.258 | 0.333 | 0.578 | 0.000 | 1.000 |
| Silhouette | 0.787 | 0.328 | 0.704 | 0.463 | 0.598 | 0.000 |
Table 17.
Governance and Logistics Performance: Cluster Characterization via Neighborhood Clustering.
Table 17.
Governance and Logistics Performance: Cluster Characterization via Neighborhood Clustering.
| Cluster | 1 | 2 | 3 | 4 | 5 | 6 | 7 | 8 | 9 | 10 |
| Size | 27 | 347 | 236 | 375 | 20 | 9 | 85 | 491 | 385 | 796 |
| Explained proportion within-cluster heterogeneity | 0.036 | 0.096 | 0.202 | 0.128 | 0.019 | 0.016 | 0.074 | 0.140 | 0.102 | 0.189 |
| Within sum of squares | 235.437 | 631.869 | 1.332.939 | 848.618 | 128.765 | 102.540 | 488.693 | 922.706 | 675.294 | 1.247.106 |
| Silhouette score | 0.391 | 0.342 | 0.263 | 0.149 | 0.458 | 0.684 | 0.315 | 0.155 | 0.317 | 0.243 |
| Center LPI | -0.052 | -0.282 | 3.251 | -0.311 | -0.276 | -0.277 | -0.307 | -0.302 | -0.314 | -0.312 |
| Center GEE | -0.851 | 1.256 | 0.415 | -0.128 | 0.923 | 0.398 | 0.011 | 0.711 | -1.064 | -0.534 |
| Center RQE | -0.144 | -0.127 | 0.237 | -0.107 | 2.339 | 15.237 | -0.125 | -0.164 | -0.051 | -0.051 |
| Center ESRPS | -0.480 | 1.169 | 0.657 | 0.159 | 0.830 | -0.000 | -0.178 | 0.543 | -1.892 | -0.185 |
| Center VAE | -0.744 | 1.378 | 0.075 | -1.335 | 0.794 | -1.503 | 0.705 | 0.520 | -0.639 | -0.059 |
| Center STJA | 0.732 | -1.684 | -0.117 | 0.986 | -0.415 | -0.697 | -0.154 | -0.205 | 0.482 | 0.207 |
| Center PSAOV | -6.510 | 0.371 | 0.273 | 0.012 | 5.663 | -0.853 | 0.190 | 0.045 | -0.170 | -0.126 |
| Center RLE | -0.512 | 0.190 | -0.117 | -0.271 | 0.198 | -0.236 | 4.396 | -0.044 | -0.246 | -0.229 |
| Note. The Between Sum of Squares of the 10 cluster model is 15546.03 | ||||||||||
| Note. The Total Sum of Squares of the 10 cluster model is 22160 | ||||||||||
Table 18.
Governance Profiles and Their Logistic Outcomes: Cluster Mean Comparisons.
| Cluster Means | ||||||||
| LPI | GEE | RQE | ESRPS | VAE | STJA | PSAOV | RLE | |
| Cluster 1 | -0.480 | -0.851 | -0.052 | -6.510 | -0.512 | -0.144 | 0.732 | -0.744 |
| Cluster 2 | 1.169 | 1.256 | -0.282 | 0.371 | 0.190 | -0.127 | -1.684 | 1.378 |
| Cluster 3 | 0.657 | 0.415 | 3.251 | 0.273 | -0.117 | 0.237 | -0.117 | 0.075 |
| Cluster 4 | 0.159 | -0.128 | -0.311 | 0.012 | -0.271 | -0.107 | 0.986 | -1.335 |
| Cluster 5 | 0.830 | 0.923 | -0.276 | 5.663 | 0.198 | 2.339 | -0.415 | 0.794 |
| Cluster 6 | -1.098×10⁻⁷ | 0.398 | -0.277 | -0.853 | -0.236 | 15.237 | -0.697 | -1.503 |
| Cluster 7 | -0.178 | 0.011 | -0.307 | 0.190 | 4.396 | -0.125 | -0.154 | 0.705 |
| Cluster 8 | 0.543 | 0.711 | -0.302 | 0.045 | -0.044 | -0.164 | -0.205 | 0.520 |
| Cluster 9 | -1.892 | -1.064 | -0.314 | -0.170 | -0.246 | -0.051 | 0.482 | -0.639 |
| Cluster 10 | -0.185 | -0.534 | -0.312 | -0.126 | -0.229 | -0.051 | 0.207 | -0.059 |
Disclaimer/Publisher’s Note: The statements, opinions and data contained in all publications are solely those of the individual author(s) and contributor(s) and not of MDPI and/or the editor(s). MDPI and/or the editor(s) disclaim responsibility for any injury to people or property resulting from any ideas, methods, instructions or products referred to in the content. |
© 2025 by the authors. Licensee MDPI, Basel, Switzerland. This article is an open access article distributed under the terms and conditions of the Creative Commons Attribution (CC BY) license (http://creativecommons.org/licenses/by/4.0/).
Copyright: This open access article is published under a Creative Commons CC BY 4.0 license, which permit the free download, distribution, and reuse, provided that the author and preprint are cited in any reuse.


