
Submitted:
10 May 2025
Posted:
12 May 2025
You are already at the latest version
Abstract
Since the hydrogen production process is not yet fully efficient, this paper proposes a poly-generation system which is driven by a geothermal energy source and utilizes a combined Kalina/Organic Rankine cycle coupled with an electrolyzer unit to produce simultaneously power and green hydrogen in an efficient way. A comprehensive ther-modynamic analysis and an exergetic evaluation are carried out to assess the effect of system key parameters (geothermal temperature, high pressure, ammonia-water concen-tration ratio, and terminal thermal difference) on the performance of concurrent produc-tion of power and green hydrogen. Thereby, two configurations are investigated with/without separation of turbines. The optimal ammonia mass fraction of basic solution in KC is identified that leads to an overall optimal system performance in terms of ex-ergetic efficiency and green hydrogen production rate. In both configurations, the optimal evaluation is made possible by conducting a genetic algorithm optimization. The simula-tion results without/with separation of turbines demonstrate the potential of the suggested cycle combination and emphasize its effectiveness and efficiency. Exemplary, for the case without separation of turbines, it turns out that the combination of ammonia-water and MD2M provides the best performance with net power of 1470 kW, energy efficiency of 0.1181, exergy efficiency of 0.1258 while producing a significant green hydrogen amount of 3194.208 Kg/day.
Keywords:
green hydrogen production
; poly-generation system
; geothermal energy source
; operating conditions
; ammonia-water ratio
; combined Kalina-ORC cycle
; electrolyzer
; thermodynamic analysis
; exergetic evaluation
; optimization
1. Introduction
As cleaner alternatives to traditional fossil fuels are highly demanded, hydrogen is emerging as one of the most important energy solutions for the 21st century, capable of meeting future energy needs, with the potential to meet 18% of global energy needs by 2050 [1,2]. When produced from renewable energy sources, hydrogen is a zero-emission fuel [3], and then a promising zero-emission fuel candidate in decarbonizing economy along with key sectors such as transportation, energy generation and manufacturing [1,2,3,4]. Considering that the combustion properties of hydrogen are extremely different from those of fossil fuels in terms of flammability limits, the flame propagating speed, ignition delay, etc., various studies investigating combustion of hydrogen or of fossil fuel with H2 additions are being now extensively carried out to earlier elucidate capabilities and challenges in engineering applications [5,6,7]. Next, it should be mentioned that hydrogen presents potential for distributed heating, energy storage and e-fuels generation [1,2,3,4,5,6,7,8,9,10]. However, the hydrogen production process is not yet fully efficient as it is apparent in Table 1. Such an inefficiency impacts the overall sustainability and cost-effectiveness of hydrogen as an energy source.
In fact, a wide range of resources is available for hydrogen production, mainly fossil-based and renewable energy sources [2,3,4,5,6,7,8]. For various manufacturing processes, hydrogen color coding is conventionally used to link it to the energy source utilized for its production [5], see in Table 1. Focusing on green hydrogen, besides well-known classical production methods and their challenges [3,4,5], various poly-generation systems have been proposed in the literature as shown in Table 1. Recent technological advances have made it possible to improve their efficiency, reduce their costs and increase their scalability. Today, the cost of green hydrogen has dropped significantly, making it competitive with blue hydrogen [5]. Nevertheless, it is still urgent to further enhance the efficiency of such systems for sustainable environmental protection and to simultaneously reduce consumption.
Taking advantage of the generation of electricity, the Kalina cycle has proved its worth, especially used with ammonia-water mixture as working fluid for its variable-temperature phase change which offers a better temperature match in heat exchangers than pure working fluids. In this respect, Aravindan and Praveen Kumar [6] have investigated the integration of an autonomous cycle using municipal solid waste and solar thermal energy to power a solid oxide electrolyzer for hydrogen production. This system uses solar energy and is based on the utilization of an organic Rankine cycle (ORC) and a Kalina cycle. Comparative analysis showed that the ORC outperformed the Kalina cycle by 16% in thermal efficiency. Multi-objective optimization showed that the ORC achieved thermal efficiency of 15.5%, an exergy efficiency of 12.9%, and a total investment cost of $130,833, compared to 6.23%, 7.37%, and $135,235, respectively, for the Kalina cycle. Baral and Šebo [7] validated the analysis of a hybrid system combining solar photovoltaic (PV) energy with storage and wind turbines in a promising approach. The study highlighted the possibility of integrating solar thermal energy with an Organic Rankine Cycle (ORC) to recover waste heat for hydrogen production. Hassan et al. [8] have proposed a precise methodology for comparing wind and solar solutions for the large-scale production of green hydrogen. Their study took into account the impact of zero carbon emissions due to the integration of renewable energy-based processes. The results show that the optimal electrolyser capacity can be combined with a 1.5 MW wind power plant and a 2.0 MW solar photovoltaic plant. The cost of producing green hydrogen on a large-scale range from $6.33/kg to $8.87/kg, depending on whether wind or solar power is used.
While many studies contrast the Kalina cycle with the Organic Rankine Cycle (ORC), other explore cascade systems combining these two cycles. Several research activities are underway to optimize the production of electricity and green hydrogen based on cogeneration or poly-generation systems combining these cycles. Karthikeyan and Kumar [9] proposed a system for the simultaneous production of refrigeration, electricity and green hydrogen. This study, carried out in a city located in a cold region, showed high production rates: 220 kW for electricity and 1.9 kg/h for hydrogen. However, the energy efficiency was relatively low at only 13.6%. Elrhoul et al., [10] simulated and compared the performance of conventional and dual-pressure organic Rankine cycles separately coupled to solid oxide electrolysis. The results show that the dual-pressure cycle produces 14.79% more energy than the conventional ORC, improving the energy input to the solid oxide electrolyzer. Hydrogen production reaches 34.47 kg/h, compared with 31.14 kg/h for conventional ORC. What's more, integrating the dual-pressure cycle into a hydrogen production plant has reduced costs and improved system efficiency by making full use of available waste heat. See also [32,33,34]
The Kalina cycle has been also used to produce green energy from renewable sources based on geothermal energy. Alirahmi et al. [11] developed a multi-generation system integrating an organic Rankine cycle, a polymer electrolyte membrane electrolyzer, and a lithium/bromide absorption refrigeration cycle. After multi-objective simulation and optimization using the NSGA-II algorithm, the results showed an optimal exergy efficiency of 37.85% and a production cost of 15.09 USD/h. Hai et al. [12] investigated the efficient use of waste heat from a double flash expansion geothermal cycle in a system combining a Kalina cycle and a thermoelectric generator. Waste heat from the Kalina cycle is recovered by a LiCl-H₂O absorption chiller. Hydrogen is produced using the electricity generated by the Kalina cycle and the power output of the high-pressure turbine of the double flash expansion cycle, which feeds an electrolysis unit. The study reports an exergy efficiency of 35.58%, a unit product cost of $9.512/GJ, and a payback time of 0.418 years.
Madhesh et al. [13] have designed a cascade system using a hybrid solar-biogas heat source. The system integrates power generation via a Kalina cycle and an organic Rankine cycle, a dual evaporator vapor compression cooling system, and a solid oxide electrolyzer. Results show that this system achieves an energy utilization rate of 0.76, an exergy efficiency of 21.56%, and a total cost of $58,677. Further studies have been conducted along these lines. Abdelmajid Saoud et al.,[14] optimized a system integrating an organic Rankine cycle and a single-effect double-lift absorption cycle, with the addition of a solar power plant. The final result from this analysis showed an improvement of the heat recovery potential by 22.22%. See also [24,25]
In the recent literature, three main classes of coupling have been especially suggested up to now (see in Table 1). These may be referred to as single mode (SiM) (i.e., a Kalina cycle is coupled to a PEM and then compared to Organic Rankine cycle coupled to a PEM), the cascade coupling/mode (CaM) (i.e., the Kalina cycle and Organic Rankine cycle are cascaded to a PEM), and the combined coupling/mode (CoM) (i.e., the Kalina cycle and Organic Rankine cycle are combined and then coupled to a PEM). In all these studies, only [15] included KC and ORC coupled to PEME, RT and PTC to generate electricity and hydrogen by using solar energy source. It enables to produce a net power of 1957 kW and a hydrogen production of 1 Kg/h. What about the KC and ORC coupling while using a geothermal source?
Furthermore, it appears in this case that (1) the effect of operating conditions have been nowhere comprehensively investigated. (2) How an optimal ammonia mass fraction of the basic solution leads to an overall optimal system performance in terms of exergetic efficiency and in regard of green hydrogen production rate is still open. (3) The impact of the working fluid on the production of both electricity and green hydrogen is not yet fully clarified in this context in order to optimize the system. (4) For a cogeneration strategy, the influence of the separation of turbines on the performance of the combined KC/ORC coupling/ mode has not yet been properly quantified with respect to the production rate of green hydrogen.
In this respect, the present work uses data from the geothermal resources across the Democratic Republic of Congo to drive a zero-emission poly-generation energy system for a simultaneous power and green hydrogen production. The suggested system integrates a combined ORC-KC mode (CoM) coupled to a Proton exchange membrane (PEM) electrolyzer. Thereby, various operating conditions of the system are considered. They include geothermal temperature and high pressure as well as the terminal temperature difference and different concentration ratios of the working ammonia-water mixture. On this basis, a comprehensive thermodynamic analysis and an exergetic evaluation will be carried out to assess the effect of system key parameters on the performance of concurrent production of power and green hydrogen. One of the final objectives is to identify the optimal ammonia mass fraction of the basic solution that leads to an overall optimal system performance not only in terms of exergetic efficiency but also in regard to green hydrogen production rate. Such an optimization task will be performed by means of a genetic algorithm optimization. Furthermore, the reference temperature will be finally adjusted to the optimal temperature obtained to demonstrate how this will lead to an increase in energy efficiency and hydrogen production and a decrease in the total exergy destruction rate in both operating configurations, with/without separation of turbines.
Subsequent to this introduction, the Democratic Republic of Congo (DRC) geothermal potential is shortly outlined in Section 2. In Section 3, the system under study is described, and modeled in Section 4. The optimization algorithm is detailed in Section 5. All the results obtained are presented and discussed in Section 6. The essential findings are summarized in Section 7.

Table 1.
Brief literature review on hydrogen production from various energy sources. A color coding is usually used to categorize hydrogen with respect to the energy source used for its production [5]. Green hydrogen is produced using renewable energy sources such as solar, wind or geothermal energy. Grey and brown/black hydrogen when it is produced by methane steam reforming and gasification, respectively, and once combined with carbon capture and storage, blue hydrogen is produced. Pink hydrogen is generated through electrolysis powered by nuclear energy. Turquoise hydrogen is produced through the pyrolysis of methane, with solid carbon as a by-product. Yellow hydrogen is newly used for hydrogen made through electrolysis using solar power, while white hydrogen is a naturally occurring, geological hydrogen found in underground deposits and created through fracking.
| Authors/year | Cogeneration | Energy sources | Working fluids | Net power and Hydrogen production |
|---|---|---|---|---|
| Yilmaz et al.[16] (2024) | Geothermal cycle + ORC + PEME+ OD (SiM) (Green hydrogen, freshwater and heat) |
Geothermal | Organic fluid +water | 2046 kW; 0.002367 kg/s |
| Sabbaghi and Sefid [17] (2024) | ORC+PEME (SiM) (Electricity and green hydrogen) |
Geothermal | Carbon dioxide | 3.99 lit/s |
| Hajabdollahi et al. [18] (2023) | Reverse osmosis desalination +ORC+PEME (SiM) (Electricity, heating, hydrogen and freshwater) |
Geothermal | Organic fluid | 1556.2 kW; 0.42 m3/day |
| Wenqiang Li et al. [19] (2024) | Double-flash cycle+ PEME+PTC (SiM) (Electricity and hydrogen) |
Geothermal | Water | 25.48 kg/h |
| Arslan et al.[20] (2024) | Geothermal Power Plant (AFJES) +PEME (SiM) (Electricity and hydrogen) |
Geothermal | Water | 4132 kW; 150 kg/s |
| Kun Li et al.[21] (2022) | Flash-binary geothermal cycle +ERC+ (KC+ERC) +PEME (SiM) (Electricity, hydrogen, cooling and freshwater) |
Geothermal | Water + Ammonia-water | 782 kW; 0.181 kg/h |
| Almutairi et al. [22] (2021) | Flash-binary geothermal cycle +ORC+PEME (SiM) (Electricity and hydrogen) |
Geothermal | Organic fluid+ Water | 128.16 kW; 0.39626 kg/h |
| Gao et al. [23] (2024) | Steam-methanol reforming +KC + Flash-binary geothermal cycle (SiM) (Electricity, hydrogen and freshwater) |
Geothermal -Solar | Ammonia-water | 215.9 kW; 0.0224 kg/s |
| Shubo Zhang et al. [24] (2023) | Parabolic trough solar collectors (PTSC)+KC+PEME+ARC (SiM) (Electricity, hydrogen and hot water) |
Geothermal, biomass, Solar | Ammonia-water | 3.71 MW; 11.42 kg/h |
| Laleh et al.[25] (2023) | Brayton cycle +ORC+RC (CoM) (Electricity and hydrogen) |
Biomass | LNG, Organic fluid, Water | 10 MW; 0.66 kg/s |
| Wang et al.[26] (2022) | RC+PEME+ Solid oxide electrolyzer (SOE) + Multi-effect desalination (MED) (SiM) (Electricity, hydrogen and freshwater) |
Biomass | Water | 1735 kW; 9880 kg/h |
| Karthikeyan et al. [27] (2024) | Heat pump+ ORC+PEME (SiM) (Electricity, hydrogen and heat) |
Biomass-Solar | Organic fluid | 815 kW; 3 kg/h |
| Sharifishourabi et al. [28] (2025) | KC + Alkaline electrolyzer + Refrigeration cycle (SiM) (Electricity, hydrogen, cooling and heat) |
Biomass-Wind | Ammonia-water | 5.38 kg/h |
| Forootan et al. [29] (2024) | ORC+PEME+ Brayton cycle+ Multi-effect distillation (SiM) (Electricity, oxygen, hydrogen, hot water and freshwater) |
Solar | Organic fluid | 133 MW; 201.6 kg/h |
| Bamisile et al.[30] (2020) | 2 RC+PEME + SE-ARC+ DE-ARC+ PTC (SiM) (Electricity, hydrogen, hot water and freshwater) |
Solar | Water | 1027 kW; 0.9785 kg/h |
| Lykas et al. [31] (2023) | ORC+PEME (SiM) (Electricity and hydrogen) |
Solar | Organic fluid | 24 kW; 0.205 kg/h |
| Mansir [32] (2024) | Brayton cycle+ PVT+ KC+PEME (SiM) (Electricity and hydrogen) |
Solar | Carbon dioxide +NH3H2O | 33585 kW; 16.90 kg/day |
| Colakoglu and Durmayaz [33] (2022) | Solar-tower+ Brayton cycle +RC+KC (SiM) (Electricity and hydrogen) |
Solar | Organic fluid +NH3H2O | 1478 kW; 22.48 kg/h |
| Sharifishourabi et al. [15] (2024) | RC+PEME +ORC+ PTC+KC (CoM) (Electricity and hydrogen) |
Solar | Organic fluid +NH3H2O | 1957 kW; 1 kg/h |
| Effatpanah et al. [34] (2023) | advanced alkaline electrolyzer (AAE) system +ORC+ARC+CPV/T system (SiM) (Electricity, hydrogen and cooling) |
Solar-Wind | LiBr-H2O and organic fluid | 315 kW; 1.012 kg/s |
| Gargari et al. [35] (2018) | Gas Turbine-Modular Helium Reactor (GT-MHR) and a biogas steam reforming (BSR) (SiM) (Electricity and hydrogen) |
Biogas | methane and carbon dioxide | 260.13 MW; 0.217 kg/s |
2. Geothermal Potential in the DRC
The Democratic Republic of Congo, located in Central Africa, has considerable geothermal potential, but it is largely unknown and not yet evaluated. As part of the East African Rift region, characterized by recent deformation and volcanic activity, the DRC's geological and tectonic history has been marked by various events that have fostered the development of a fracture system conducive to the circulation of hydrothermal fluids. This system has led to the emergence of geothermal springs in most of the country's interior provinces, such as North Kivu, South Kivu and Maniema, as well as in the south, formerly Katanga [36].
Given that the exploitation of these sources could catalyze the DRC's economic development through geothermal projects, various studies are being carried out to explore the possibilities of using these geothermal resources to generate electricity [25]. For the first time, a geothermal power plant was erected in the former Katanga province, at the Kiabukwa site, in 1953, capable of generating 0.2 MW at a temperature of 91°C [36,37]. Figure 1 shows several identified geothermal sites, some have not yet been studied at depth. Mulenda Adelin et al.,[38] presented a perspective on a site at Kankule, located between the Bidagarha and Lwiro rivers, which flow from the Kahuzi forest, and situated in the Kahuzi Biega national park in South Kivu province. This site could produce up to 13 MW, including 2.1 MW in gross electrical output, with a maximum temperature of 203°C. Table 2 provides a brief overview of potential geothermal sites by well temperature and depth.
In [38] some temperatures at the Kankule site as a function of depth are reported, all fed by the same source rock:
- 90°C corresponds to 1019.21 m.
- 100°C corresponds to 1231.54 m
- 195°C corresponds to 3333.66 m.
For the present analysis in this paper, geothermal energy data from the Kankule site in the DRC are selected for use.
3. System Description
3.1. Configurations Under Study
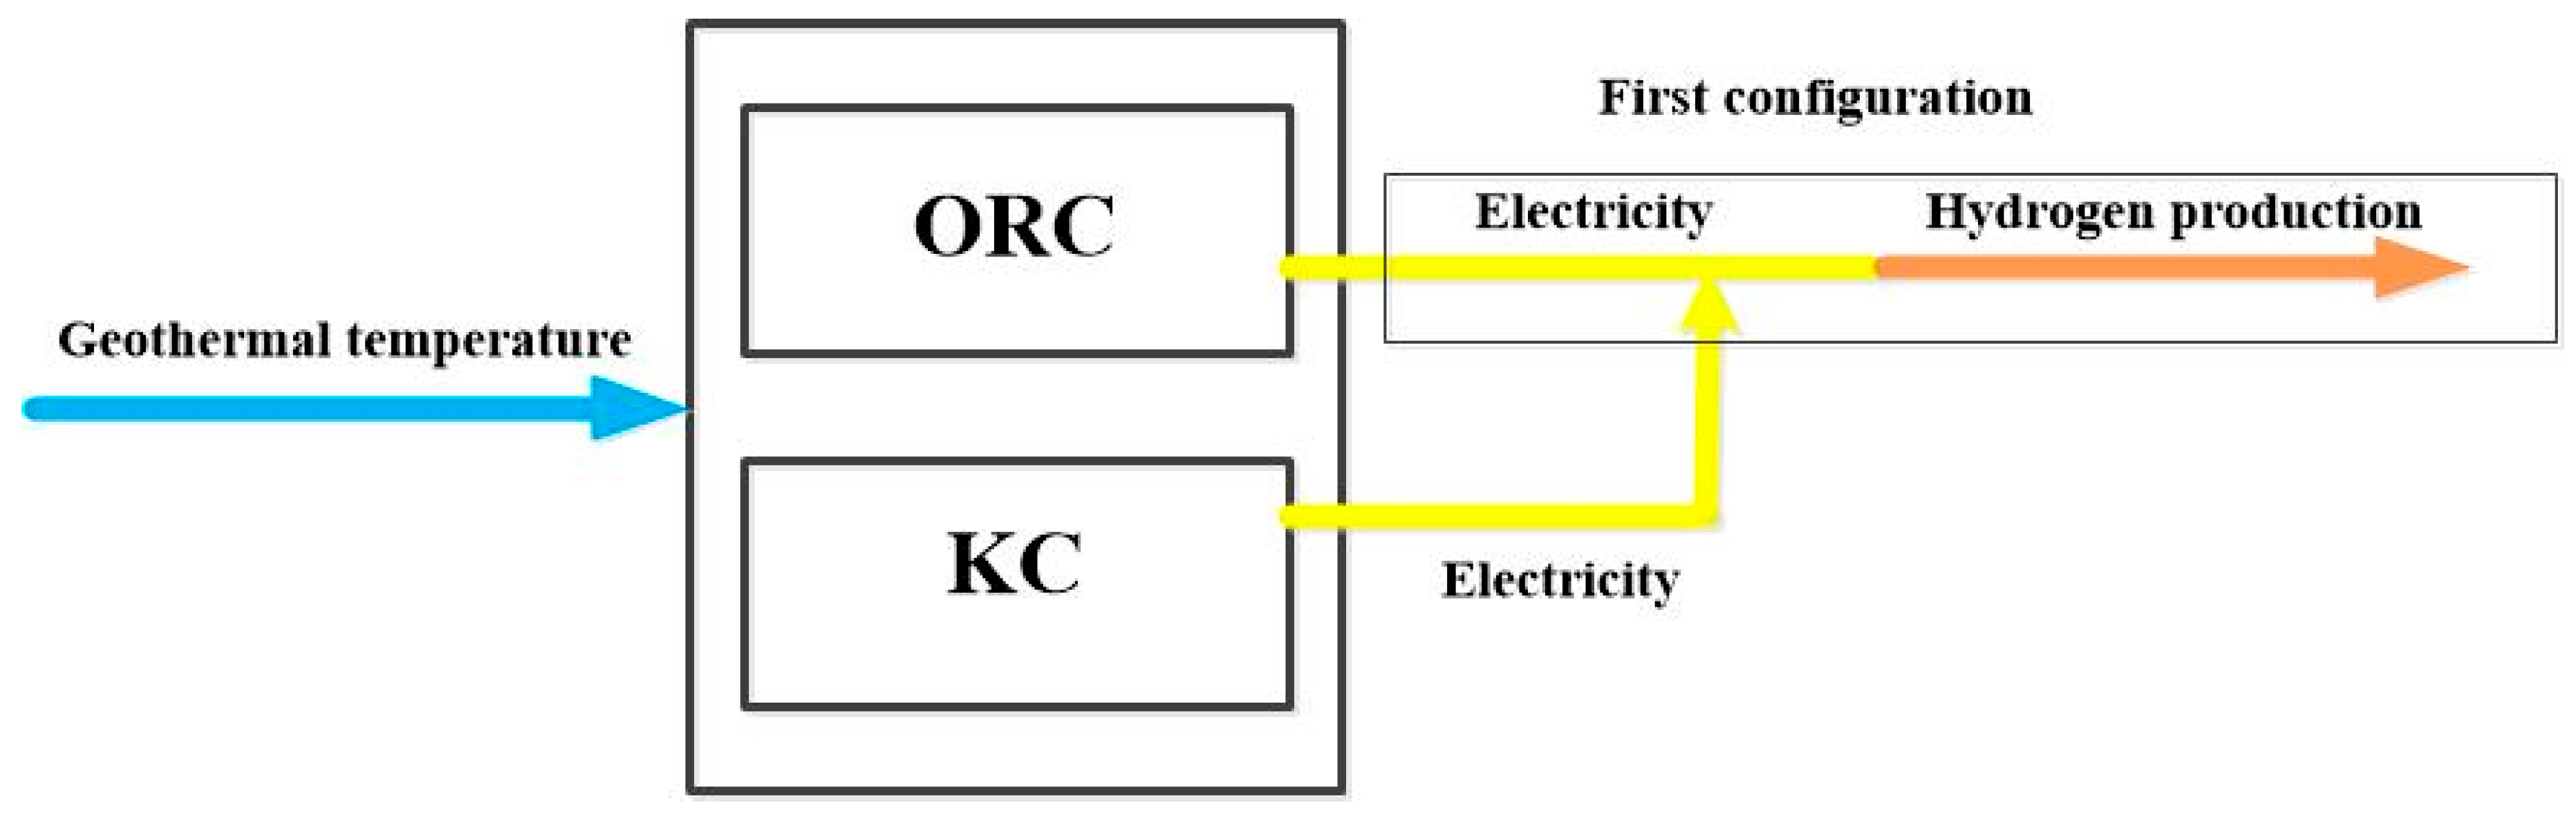
To produce both power and green hydrogen in an efficient way, the suggested system is composed by a combined ORC-KC mode coupled to a Proton exchange membrane (PEM) electrolyzer, as displayed in Figure 2. In the ORC cycle, the organic fluid is pumped at point (4) to the vapor generator (VG,ORC) where it is vaporized before entering the ORC turbine at point (1) for expansion. On leaving the turbine (point 2), it transfers part of its thermal energy to the ammonia-water mixture in regenerator 2, thus improving the fluid temperature between points (14) and (15). After passing through the regenerator, the organic fluid is condensed in condenser 1 (point 3) before the cycle is repeated. In the Kalina cycle, the ammonia-water mixture is pumped from point (13) to point (14), heated in regenerator 2 and then further heated in regenerator 1 before being partially evaporated in the vapor generator (VG,KC). At the outlet of this generator (point 6), the mixture is sent to a separator where it is divided into two streams: the vapor phase rich in ammonia expands in the KC turbine to produce energy before returning to the mixer, while the liquid phase gives off heat in regenerator 1 before being expanded by a valve. The two streams are then recombined in the mixer before being condensed in condenser 2, continuing the cycle. The geothermal water, after passing through the VG,KC (point 19), is sent to a heat exchanger where it transfers its heat to the incoming water at point (25). This preheated water is then sent to the electrolyzer at point (26). In this first configuration (Figure 2), the electricity produced by the combined cycle also powers the electrolyzer, which produces green hydrogen and oxygen at its output.
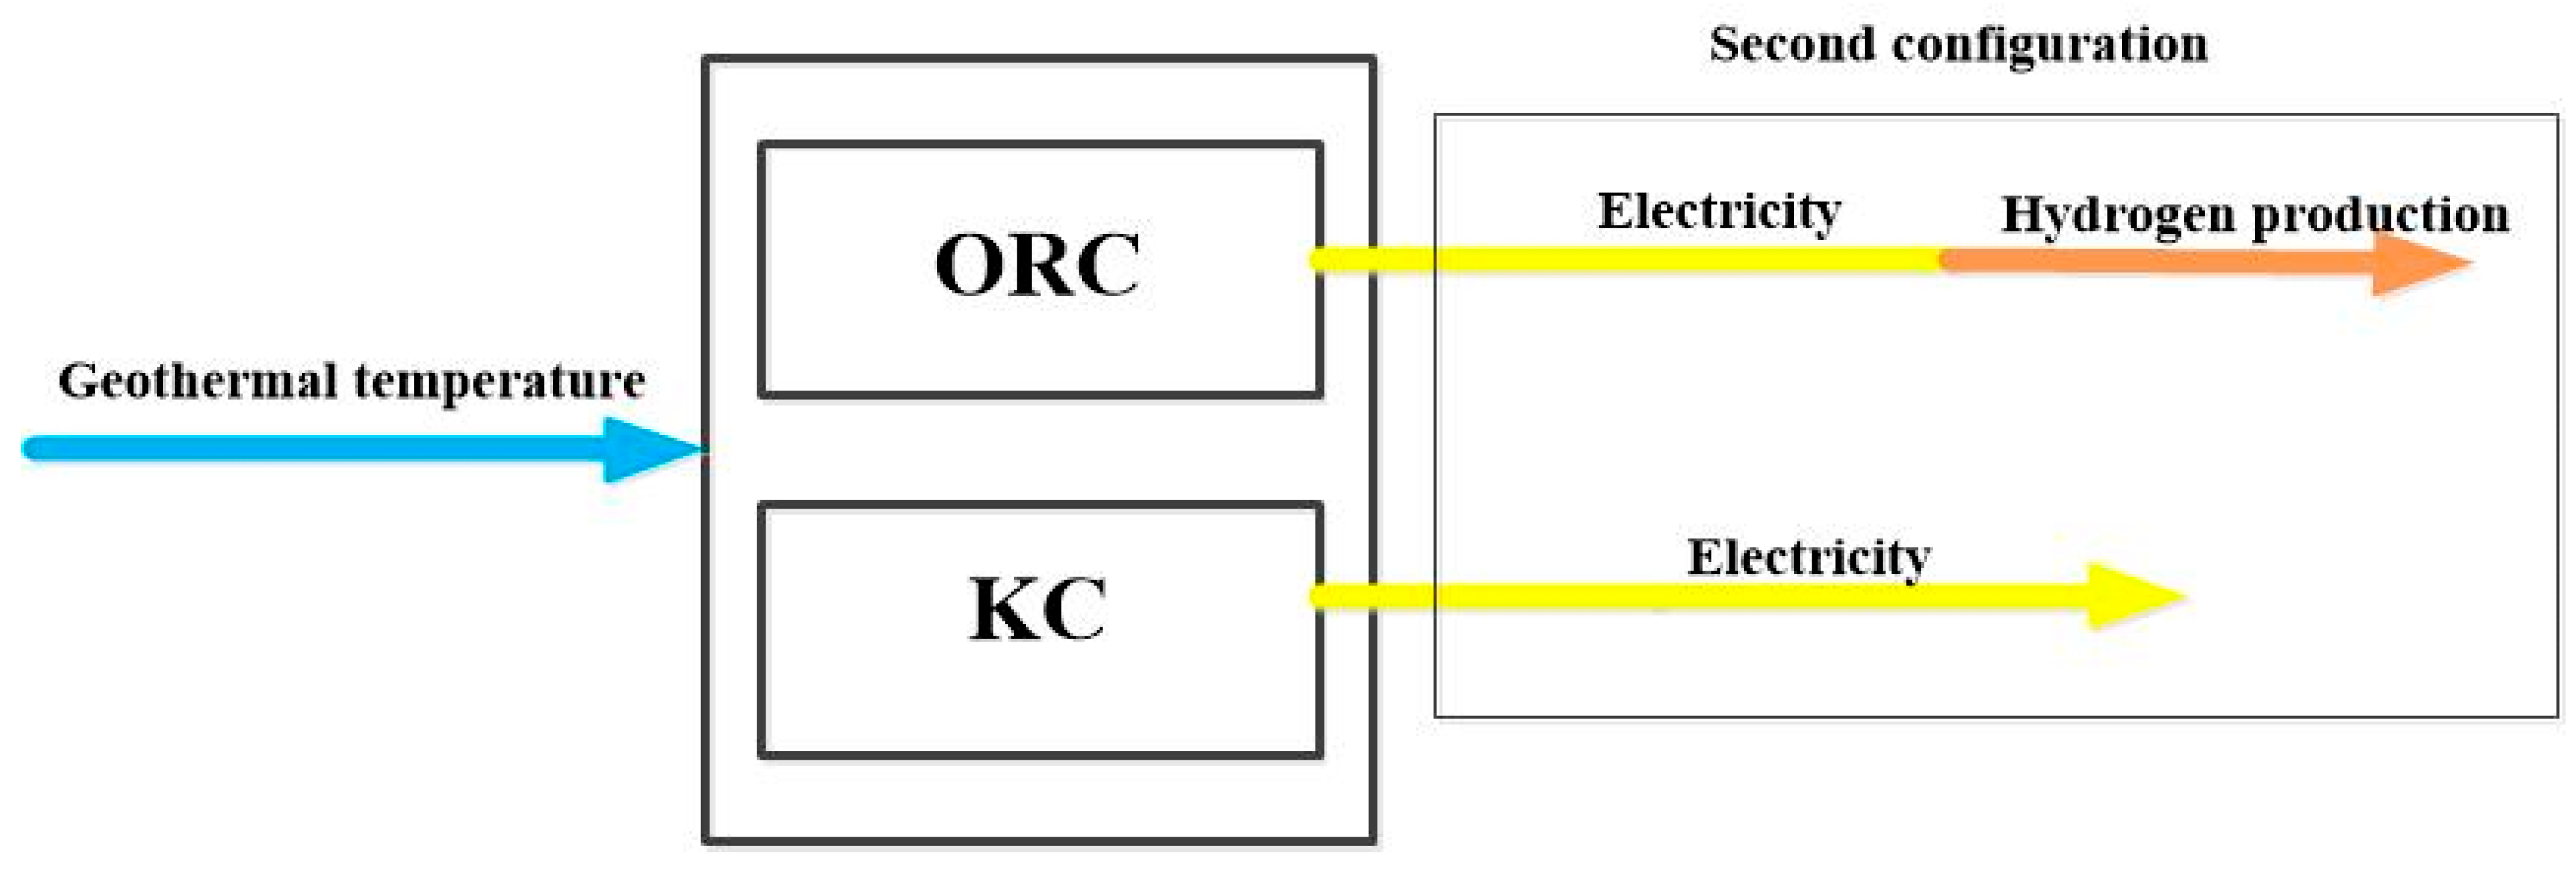
In the second configuration in which the turbines are separated, Figure 3 represents the case in which the OR and Kalina cycles are used in a way that the power generated by the KC turbine is used for electricity production (KC-GEN), while the power generated by the ORC cycle is used for hydrogen production.
3.2. Working Fluid Selection
In both configurations, the choice of working fluid is an essential element in the analysis of a thermodynamic system, since the chosen fluid must have specific thermo-physical properties essential to improve the system performance. The principle of the Kalina cycle is based on the use of mixture that provides a progressive evaporation temperature and improve system performance. In this study, the working fluid selected for the Kalina cycle is the ammonia-water mixture, an azeotropic fluid. This mixture is particularly suitable for single-phase heat sources such as geothermal heat, biomass heat and industrial waste heat [39].
For the Organic Rankine Cycle, the selection of working fluids is based on two main environmental criteria: ozone depletion potential (ODP) and global warming potential (GWP)[40]. These criteria are supplemented by safety considerations, including non-flammability and chemical stability. Five working fluids were selected for this study: R152a, R236fa, MD2M, isobutane, and isobutene. Table 3 summarizes some of their properties.
4. Modeling system
4.1. Assumptions
The analysis of these configurations is carried out using appropriate codes developed within the EES software based on following assumptions:
- The model operates under steady-state conditions;
- Pressure drops in all components are neglected;
- The vapor at the turbine inlet is considered to be in a state of dry saturation;
- It is assumed that the fluid leaving the condensers is saturated;
- Flow through throttle valves is isenthalpic
In addition to the stated assumptions, Table 4 lists other thermodynamic input parameters that must be identified to evaluate the performance of this model.
4.2. Proton Exchange Membrane Electrolyzer (PEME)
The energy produced by the combined ORC-KC system is applied to the PEM electrolyser to produce green hydrogen. In a water electrolyzer, hydrogen is produced by a chemical reaction as shown in equation (1). This reaction takes place at the anode and cathode of the PEM. Equations (2) and (3) represent these reactions. Equation (4) determines the energy required for these reactions.
Where represents Gibb’s free energy.
The following equation can be used to determine the molar flow rate of hydrogen production[42]:
where J and F are the faraday constant and the current density respectively.
4.3. Organic Rankine Cycle (ORC) and Kalina Cycle (KC) Modeling
4.3.1. Energy Modeling
The energy analysis of the system can be expressed in the general form of steady-state mass and energy equations [47]:
where is mass flow rate, ammonia mass fraction, heat rate, work, and enthalpy.
4.3.2. Exergy Modeling
Based on the second low of thermodynamic, the concept of exergy refers to the potential or availability of energy to perform work. In simple terms, it is the maximum useful work that can be extracted from a system relative to a defined reference state [48]. This shows that exergy is a more refined interpretation of energy. Exergy consists of four elements: chemical, kinetic, physical and potential. Under the assumptions of this study, the effects of chemical, kinetic and potential exergy are considered negligible.
According to this equation (12), the exergy rate is obtained by multiplying the mass flow by the exergy value [47]:
The exergy balance equation of a system can be formulated as follows [47]:
where , are the work, exergy destruction, rate of heat transfer respectively. Other expressions used in the above equation can defined as follows [49]:
where , are the reference temperature and entropy generation respectively.
The remaining thermodynamic modeling equations are summarized in Table 5.
5. Optimization
In the analysis of thermal systems, the aim of optimization is generally to maximize both thermal and exergy efficiency, in accordance with the laws of thermodynamics. This optimization can be carried out using a variety of methods, depending on the precise objectives to be achieved. In this study, the genetic algorithm (GA) was selected for its relevance. This approach is based on heuristic numerical search methods that reproduce the principles of naturel selection in biological evolution [52].
Various steps are implemented to optimize this operation: initialization, ability assignment, crossover and mutation. The whole process is aimed at optimizing (i.e. maximizing) particular objectives as a function of selected design variables [53]. Thermal efficiency or exergy efficiency are the objective function in this study. GA optimization parameters and decision variables are presented in Table 6 and Table 7 respectively. The single-objective optimization model for thermodynamic performance can be described as:
6. Results and discussion
6.1. Validation Model
In order to confirm the accuracy of the results obtained from the thermodynamic simulation of the system under study (Figure 2), an appropriate code has been created using the Engineering Equation Solver (EES) software for comparison with results obtained from the literature. Three cases were selected from the literature and each case is simulated under the same operating conditions. The thermodynamic simulation results are presented and compared in Table 8, Table 9 and Table 10 between the current work and references [55], [56] and [45] for the ORC system, the KC system, and the PEME system, respectively.
6.2. Thermodynamic Results
The simulation of the proposed system was performed using EES software according to the input parameters presented in Table 3. As part of this simulation, the impact of critical operating conditions (such as high pressure, geothermal source temperature, ammonia basic concentration, and terminal temperature difference) on the thermodynamic performance of the system was evaluated in this section. This includes elements such as net power, hydrogen production, and energy and exergy efficiency. In this study, the oxygen production rate is not taken into account, following the approach of Lykas et al [31]. In some studies, a separator is integrated at the oxygen outlet to separate the pure oxygen from water. The latter is then reinjected into the PEME water supply circuit as described by Ghaebi et al.[57] and Akrami et al[58].
6.2.1. Overall Thermodynamic Evaluation Results
Table 11 presents the results obtained after simulating the different working fluid combinations (ammonia-water +organic fluid). It shows that the ammonia-water+MD2M combination gives the best performance compared to the other combinations. On this basis, all the remaining results are presented only for the ammonia-water+MD2M combination. Table 12 summarizes the results obtained after simulation for this combination. The simulation results are close to those reported in the literature, in particular by Soleymani et al.[59] who obtained a hydrogen production of 0.07454 kg/s (6440.256 kg/day) for a net power of 2726 kW.
This section may be divided by subheadings. It should provide a concise and precise description of the experimental results, their interpretation, as well as the experimental conclusions that can be drawn.
6.2.2. Effect of Operating Conditions on Thermodynamic Quantities and Exergetic Analysis
This section analyzes the impact of the proposed system's key operating conditions (high pressure, geothermal temperature, ammonia concentration, and terminal temperature difference) on the system performance (net power, hydrogen production, thermal efficiency, and exergy efficiency) and explains the physical mechanisms underlying the results.
Increasing the geothermal temperature improves the net power, hydrogen production, energy efficiency and exergy efficiency. This is due to an increase in the mass flow rate of the rich solution in the separator and in the VG, KC and an increase in the enthalpy drop in the turbines as the source temperature increases. At low inlet temperatures, the rate of increase in heat absorbed by the system is less than the rate of increase in net power. At high inlet temperatures, however, this trend is reversed, resulting in an increase in thermal and exergy efficiency up to a threshold temperature.
An increase in ammonia concentration (X_basic) leads to an increase in the power extracted by the turbine, resulting in an increase in the net power of the system. This improvement is mainly due to the increase in mass flow through the separator, which promotes increased ammonia vapor production. This increase in mass flow also contributes to improved hydrogen production. However, the results show that the rate of increase in net power is higher than the rate of increase in heat absorbed by the system. As a result, thermal and exergy efficiency reach a maximum for an optimal value of X_basic and then decreases. It should be noted that the variation of the ammonia concentration does not directly affect the turbine of the ORC cycle. Since the total power of the system is equal to the sum of the power of the two turbines, an increase in the power produced by the KC turbine leads to an improvement in the net power and an increase in hydrogen production.
As the high-pressure increases the mass flow of the working fluids decreases. At the same time, the enthalpy in the turbines decreases. The combined effect of these two effects is that net power increases and then decreases. Since hydrogen production is related to net power, it also increases. Energy and exergy efficiencies continue to increase until a certain pressure is reached. An increase in the TTD decreases the temperature of the vapor generator, thus reducing the input enthalpy and mass flow into the turbine, which leads to a reduction in the power produced by the turbine, which in turn reduces the net power, hydrogen production, and thermal and exergy efficiencies of the system.
6.2.3. Effect of Geothermal Temperature on the System Performance
Figure 4 illustrate the effect of geothermal source temperature (Tsource) on system performance for a terminal temperature difference (TTD) maintained at 10°C. Figure 4a,b show the evolution of net power (Wnet) and hydrogen production (ṁ_H₂) as a function of T_source, respectively, for different values of high pressure. It is clear that increasing the geothermal temperature leads to a simultaneous improvement in net power and hydrogen production. The maximum power is obtained at a pressure of 1500 kPa, with a net power of 1895 kW and a hydrogen production of 0.0475 kg/s (4,104 kg/day). Figure 4c,d show the energy and exergy efficiencies as a function of Tsource for different ammonia concentrations of the NH₃-H₂O mixture in the coupled ammonia-water/organic fluid combination. These efficiencies also increase with temperature. A mass concentration of 0.50 gives the best results in terms of efficiency.
6.2.3. Effect of High Pressure on System Performance
Figure 5 examine the effect of high pressure (P_high) on the system performance, again with TTD fixed at 10°C. Figure 5a–c illustrate the variations in net power and hydrogen production rate as a function of high pressure for different geothermal temperatures and base mixture concentrations. There is an initial increase in these values up to an optimum pressure threshold, beyond which performance decreases. The best performance is obtained at a geothermal temperature of 180°C (Figure 5a,b). Figure 5c shows that the maximum net power is obtained at a base concentration of 0.80. This figure also shows that the energy efficiency follows a similar trend: it increases with pressure to a maximum and then decreases. Optimum energy efficiency is achieved at a concentration of 0.65.
6.2.4. Effect of Basic Concentration on the System Performance
Figure 6 analyze the effect of basic concentration (X_basic) on system performance at a constant TTD of 10°C. Figure 6a–c show that increasing the base concentration leads to an increase in net power and hydrogen production, especially for a geothermal temperature of 180°C and a base concentration of 0.8. In this case, the maximum power reaches 1921 kW and 0.04812 kg/s (4,157 kg/day), respectively. Figure 6c also shows that for pressures above 2000 kPa, hydrogen production continues to increase with basic concentration. However, below this threshold it reaches a maximum before decreasing. Figure 6d,e show a decrease in energy and exergy efficiencies with increasing base concentration for all pressures tested. The best efficiencies are obtained at a high pressure of 3000 kPa.
6.2.5. Effect of Terminal Temperature Difference (TTD) on the System Performance
Figure 7 examine the effect of varying TTD on system performance. Figure 7a–c show that increasing TTD causes a decrease in net power, hydrogen production, and energy and exergy efficiencies. The best performance is observed at a pressure of 2500 kPa (Figure 7a,b). Figure 7c shows that hydrogen production remains optimal for a base concentration of 0.8, while Figure 7d,e indicate that 3000 kPa is the most favorable pressure in terms of efficiency.
6.3. Optimization Results
Optimization results were obtained using the genetic algorithm parameters detailed in Table 6 and the decision variables defined in Table 7. These results indicate an optimal range of decision variables for the combination of the ammonia-water mixture with the five organic fluids. The optimization shows that the optimal source temperature is between 177.3 and 180°C, while the optimal pressure is between 2968 and 2994 kPa. The terminal temperature difference (TTD) is between 8 and 9°C, and the optimal ammonia concentration is between 0.50 and 0.51. Among the different combinations analyzed, the ammonia-water + R152a mix offers the best performance with a net power of 2,106 kW and a hydrogen production of 0,05049 kg/s (4,362.336), outperforming the other combinations. It is closely followed by ammonia-water + MD2M. The results obtained after the optimization are summarized in Table 13a.
Table 13b compares the results of the proposed system before and after optimization using the ammonia-water +R152a combination at a geothermal temperature of 180°C. The results of optimizing this combination showed a significant improvement in system performance of 7.922% for net power, 7.8% for hydrogen production, 21.1% for energy efficiency, 25% for exergy efficiency and 5.67% for overall system efficiency.
6.4. Effect of the Separation of Turbines on the System Performance
In line with the data in Table 4 and Figure 3, this section presents the simulation results for the ORC (Organic Rankine Cycle) and KC (Kalina Cycle) cycles separately. The power generated by the KC turbine is used for electricity production, while the power generated by the ORC cycle is used for hydrogen production in PEME, see Figure 12. Figure 8, Figure 9 and Figure 10 below focus especially on the effects of three key parameters (geothermal temperature, high pressure, and TTD) on the net power, hydrogen production, and the overall system efficiency.
6.4.1. Effect of Geothermal Temperature on the System Performance
Figure 8 show the effect of geothermal temperature on net power, hydrogen production and overall system efficiency for a TTD set at 10°C. Net power (Wnet,ORC and Wnet,KC), hydrogen production, and overall system efficiency increase with increasing temperature. A pressure of 3,000 kPa leads to the best ORC cycle performance (Figure 8a,b), while a pressure of 1,500 kPa optimizes the KC net power (Figure 8c).
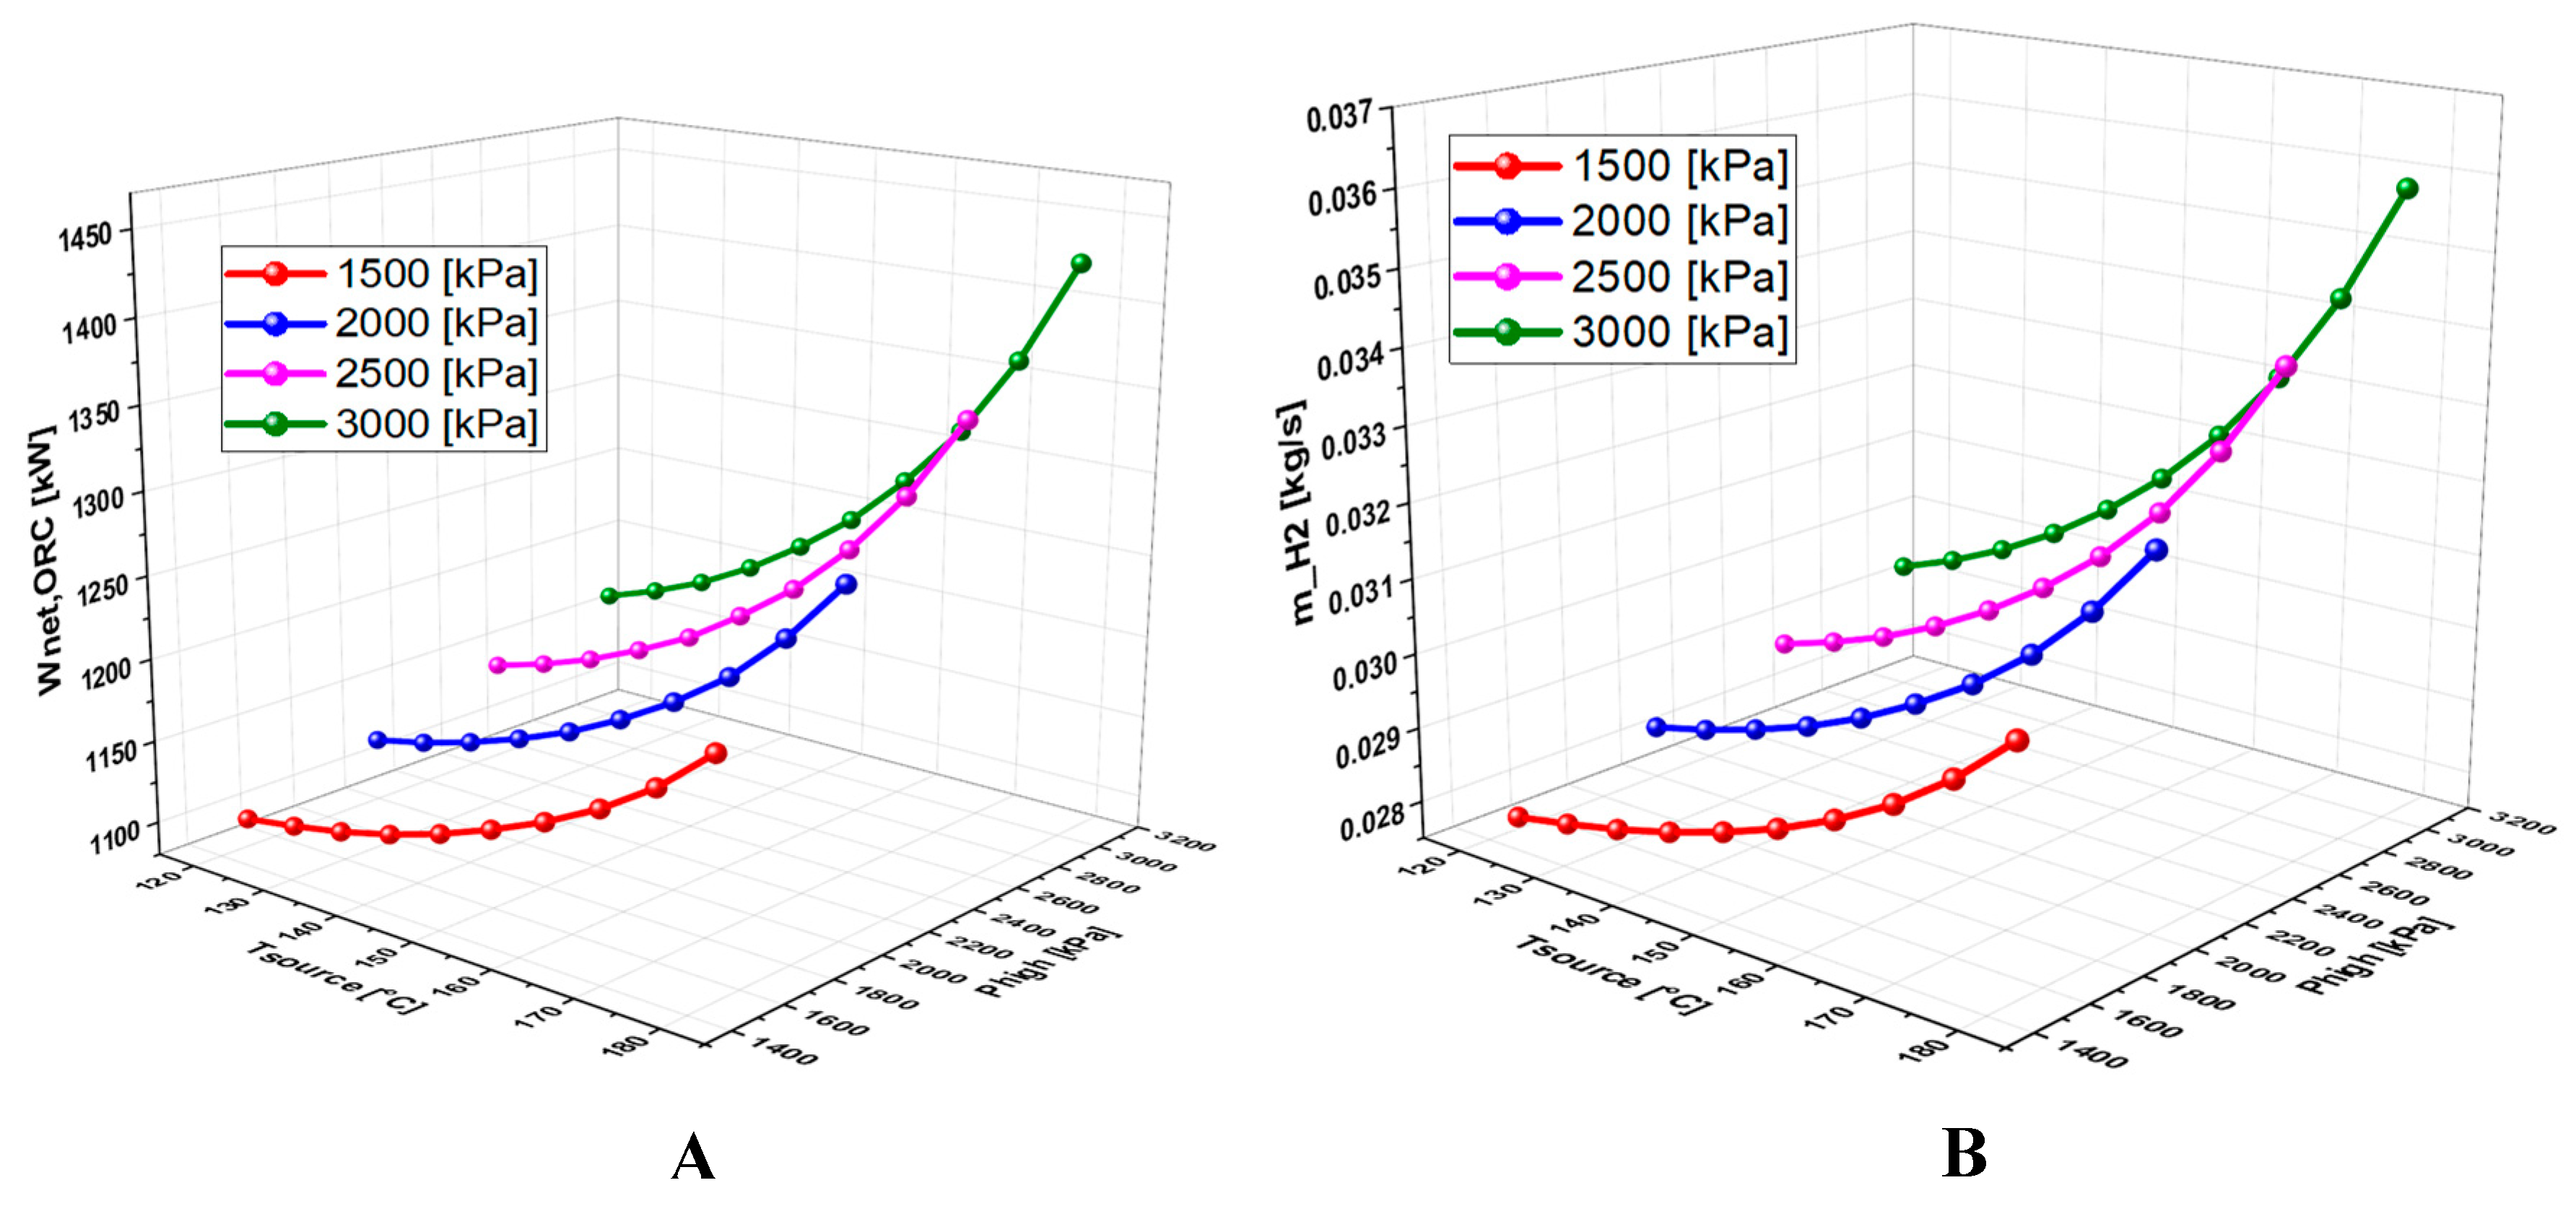
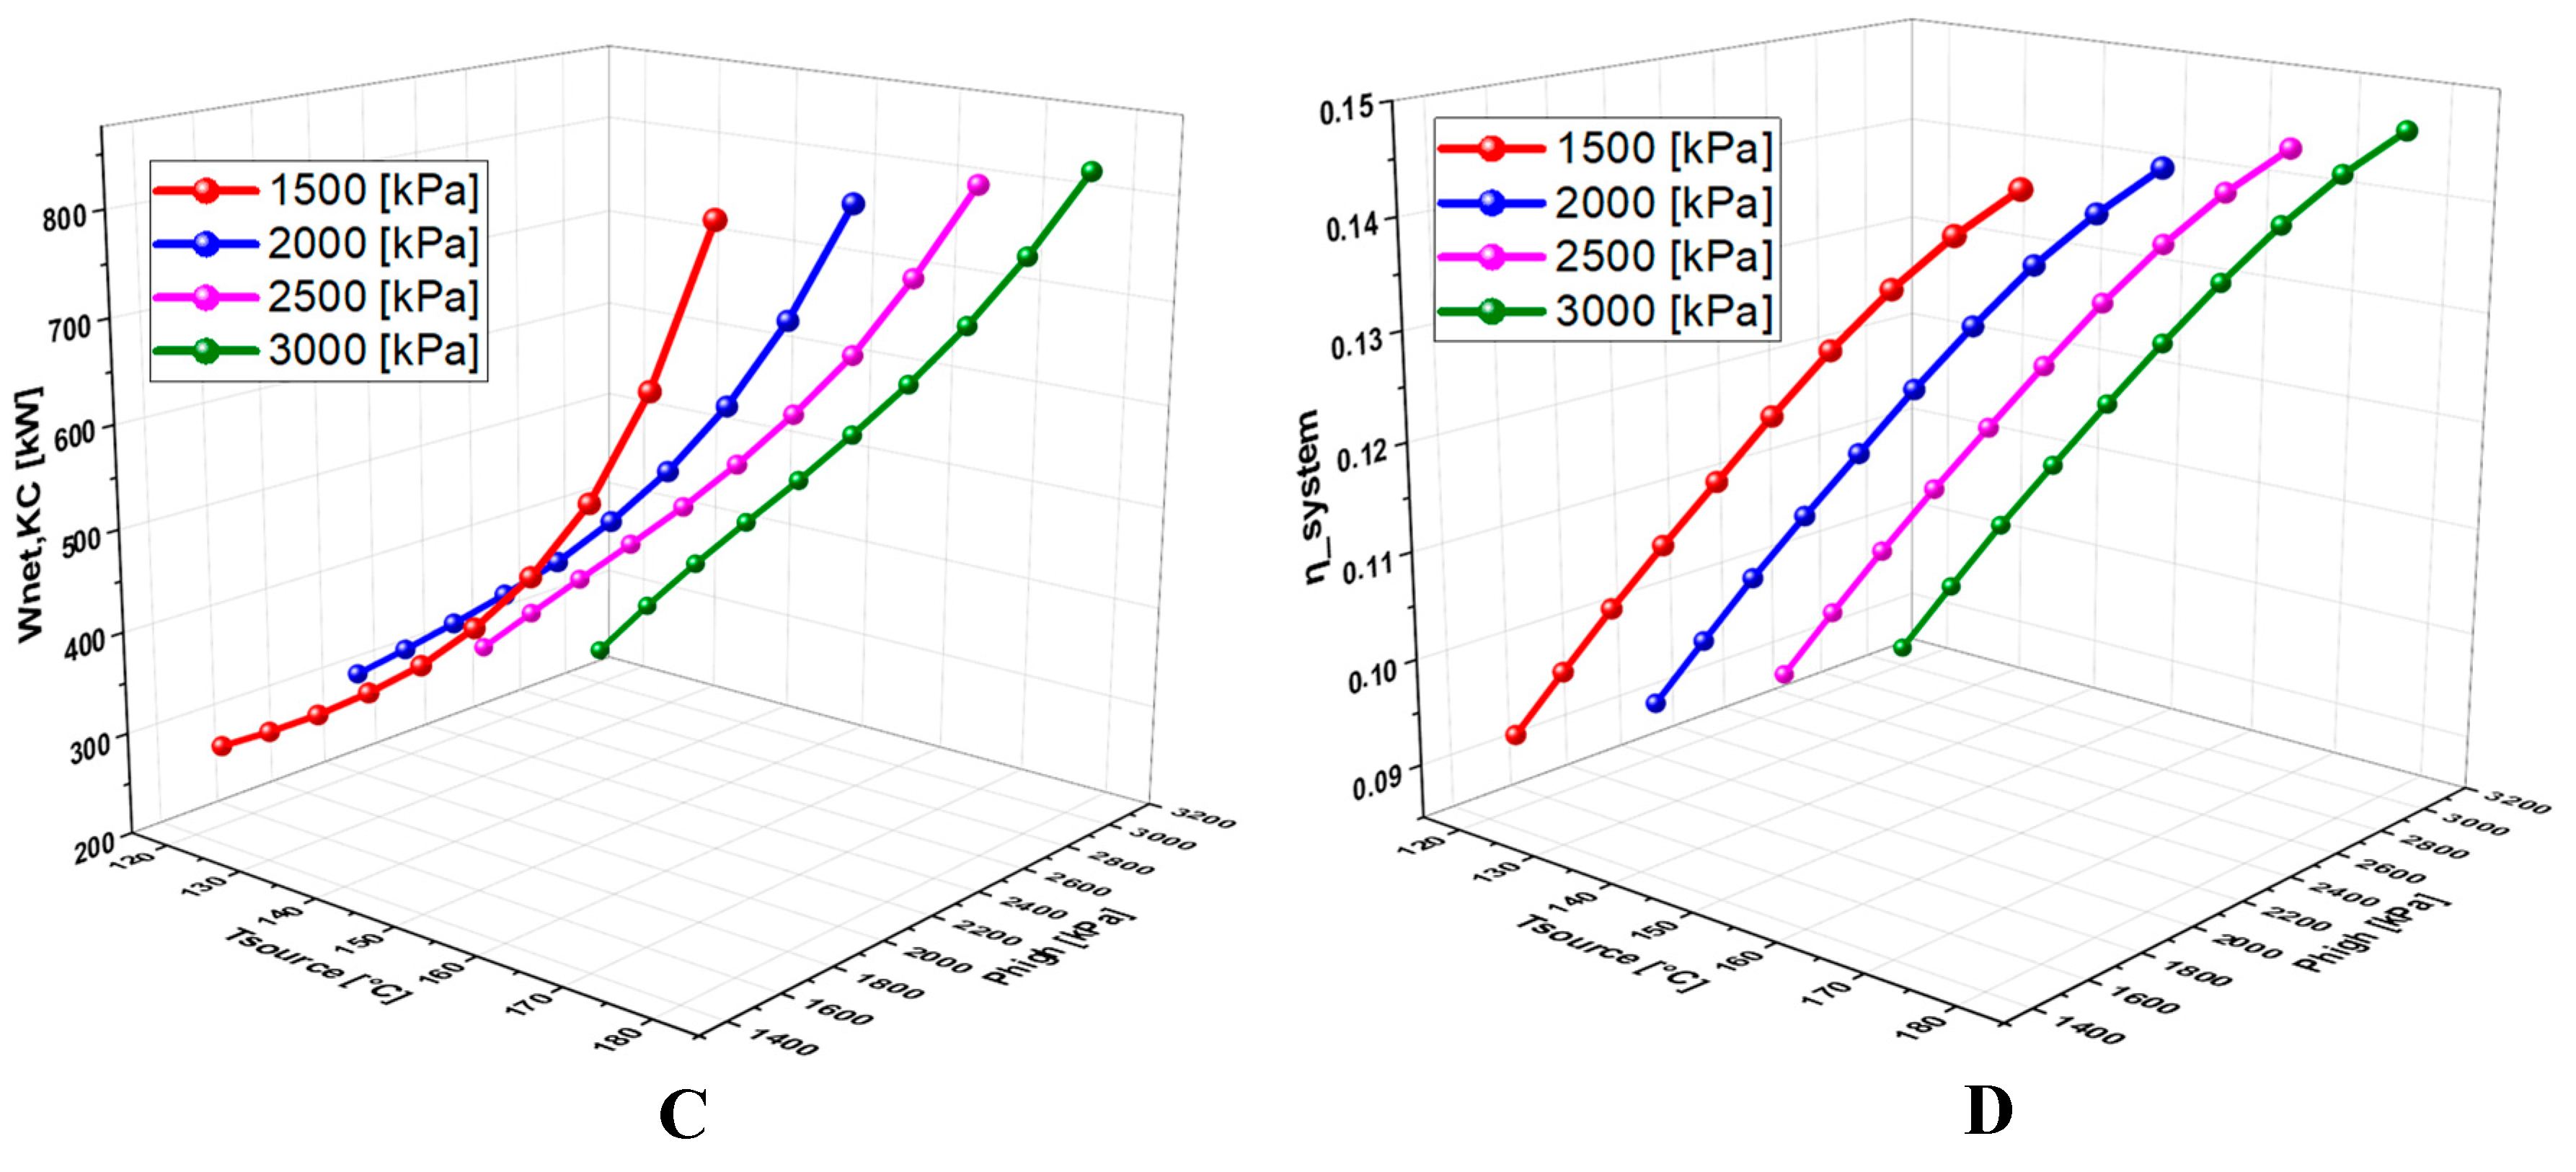
Figure 8.
Effect of geothermal temperature on: A. Net power, ORC, B. Hydrogen production, C. Net power, KC, D. Overall system efficiency.
Figure 8.
Effect of geothermal temperature on: A. Net power, ORC, B. Hydrogen production, C. Net power, KC, D. Overall system efficiency.
6.4.2. Effect of High Pressure on the System Performance
Figure 9 analyze the effect of P_high on the previously mentioned quantities. Figure 9a,b show that increasing P_high improves the performance of the ORC cycle, especially at a geothermal temperature of 120°C. Figure 9c shows that the net power of the KC reaches a maximum before decreasing, which has a negative impact on the overall system efficiency (Figure 9d).
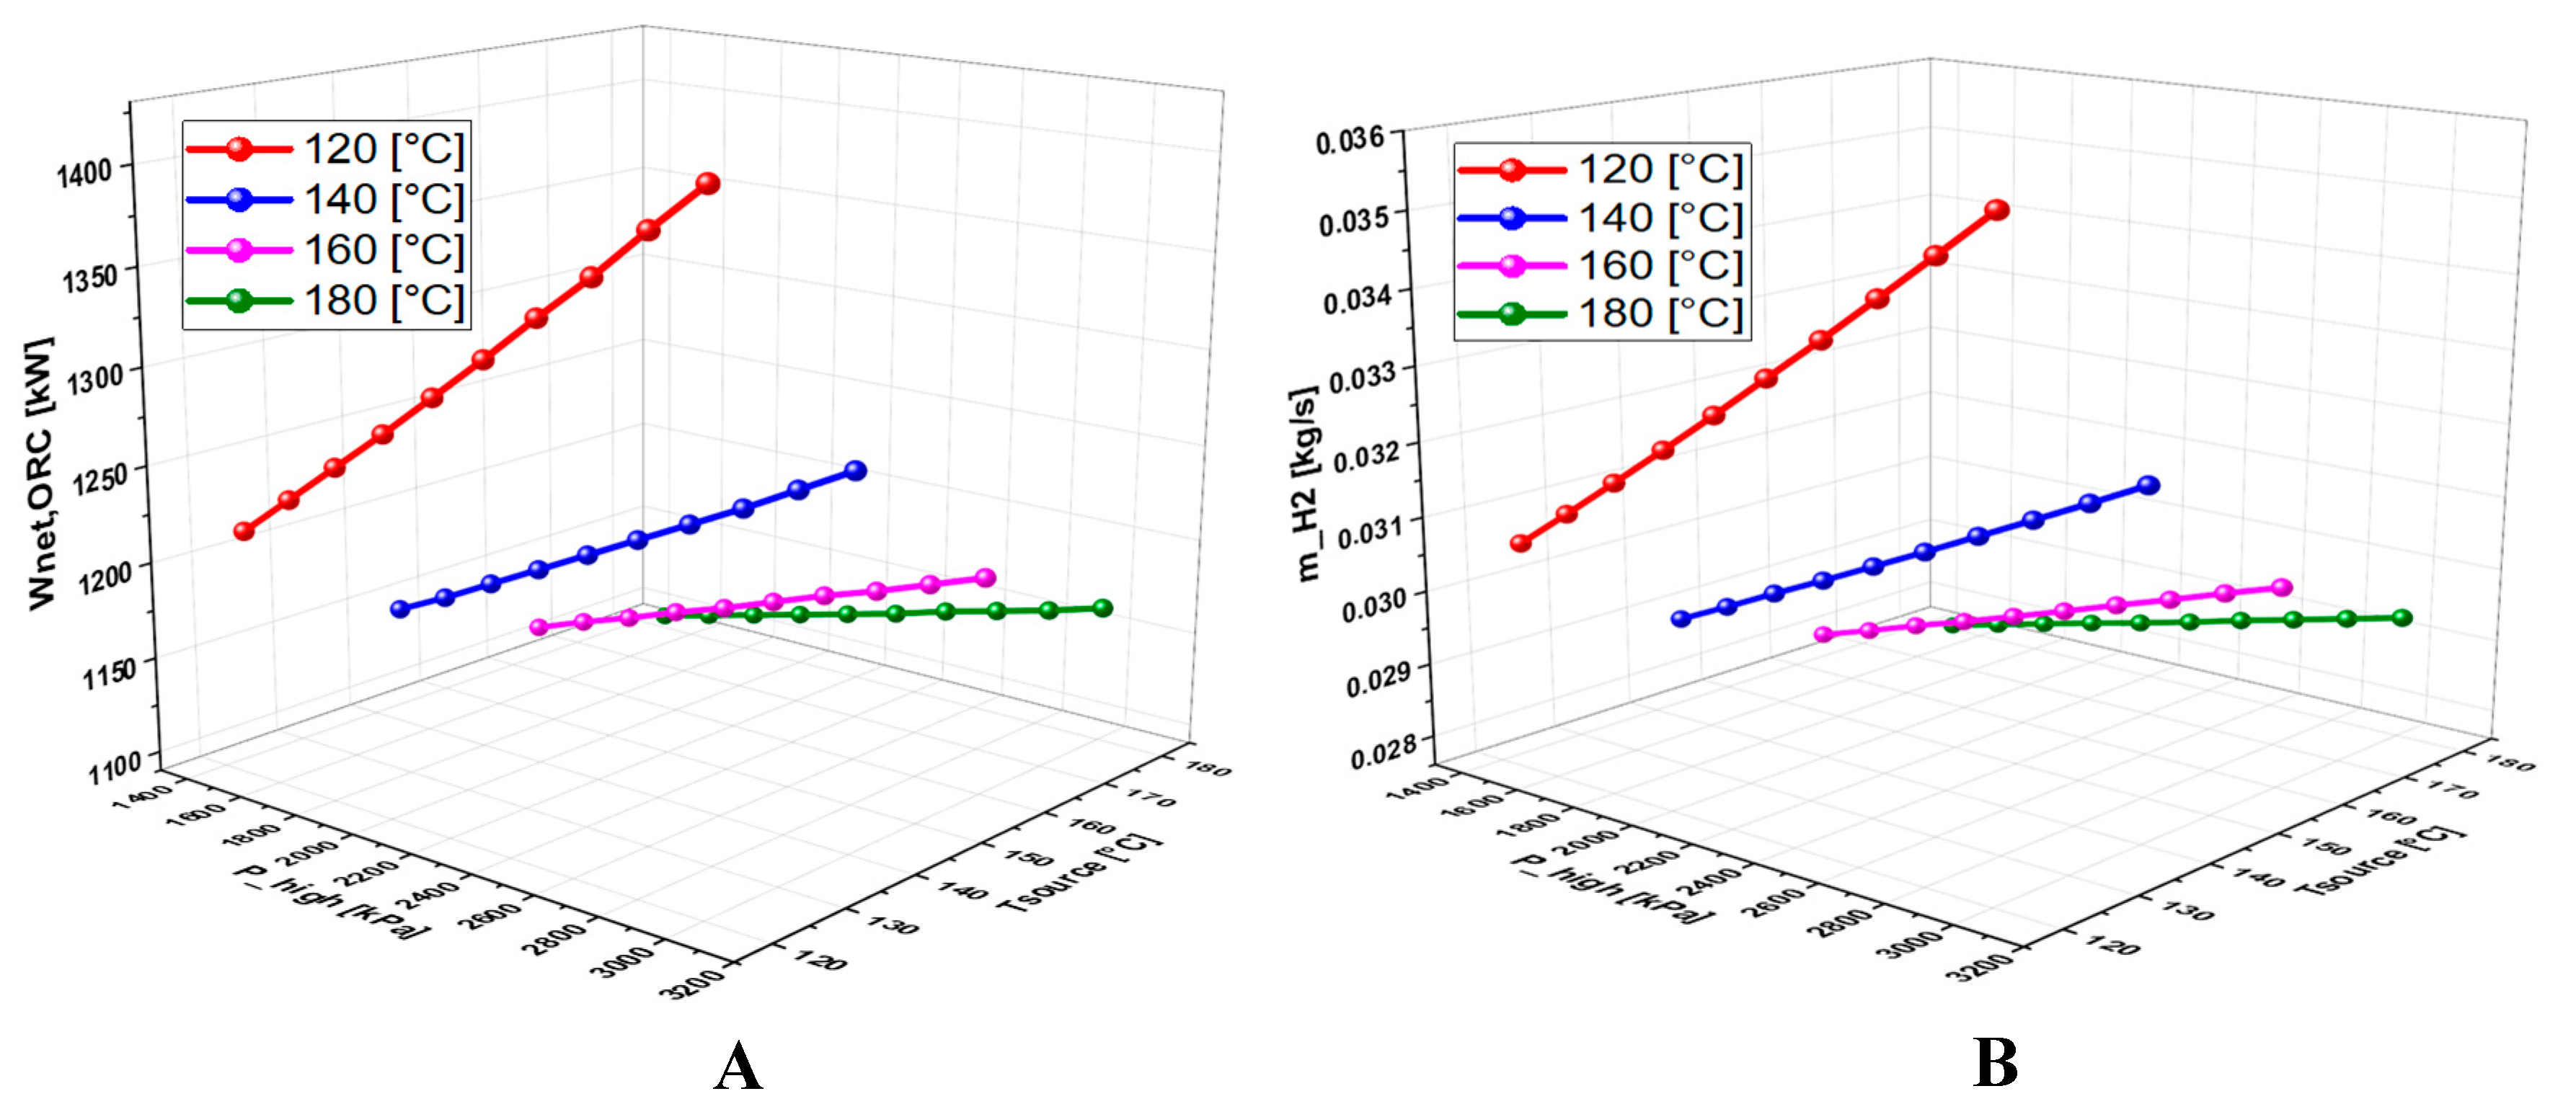
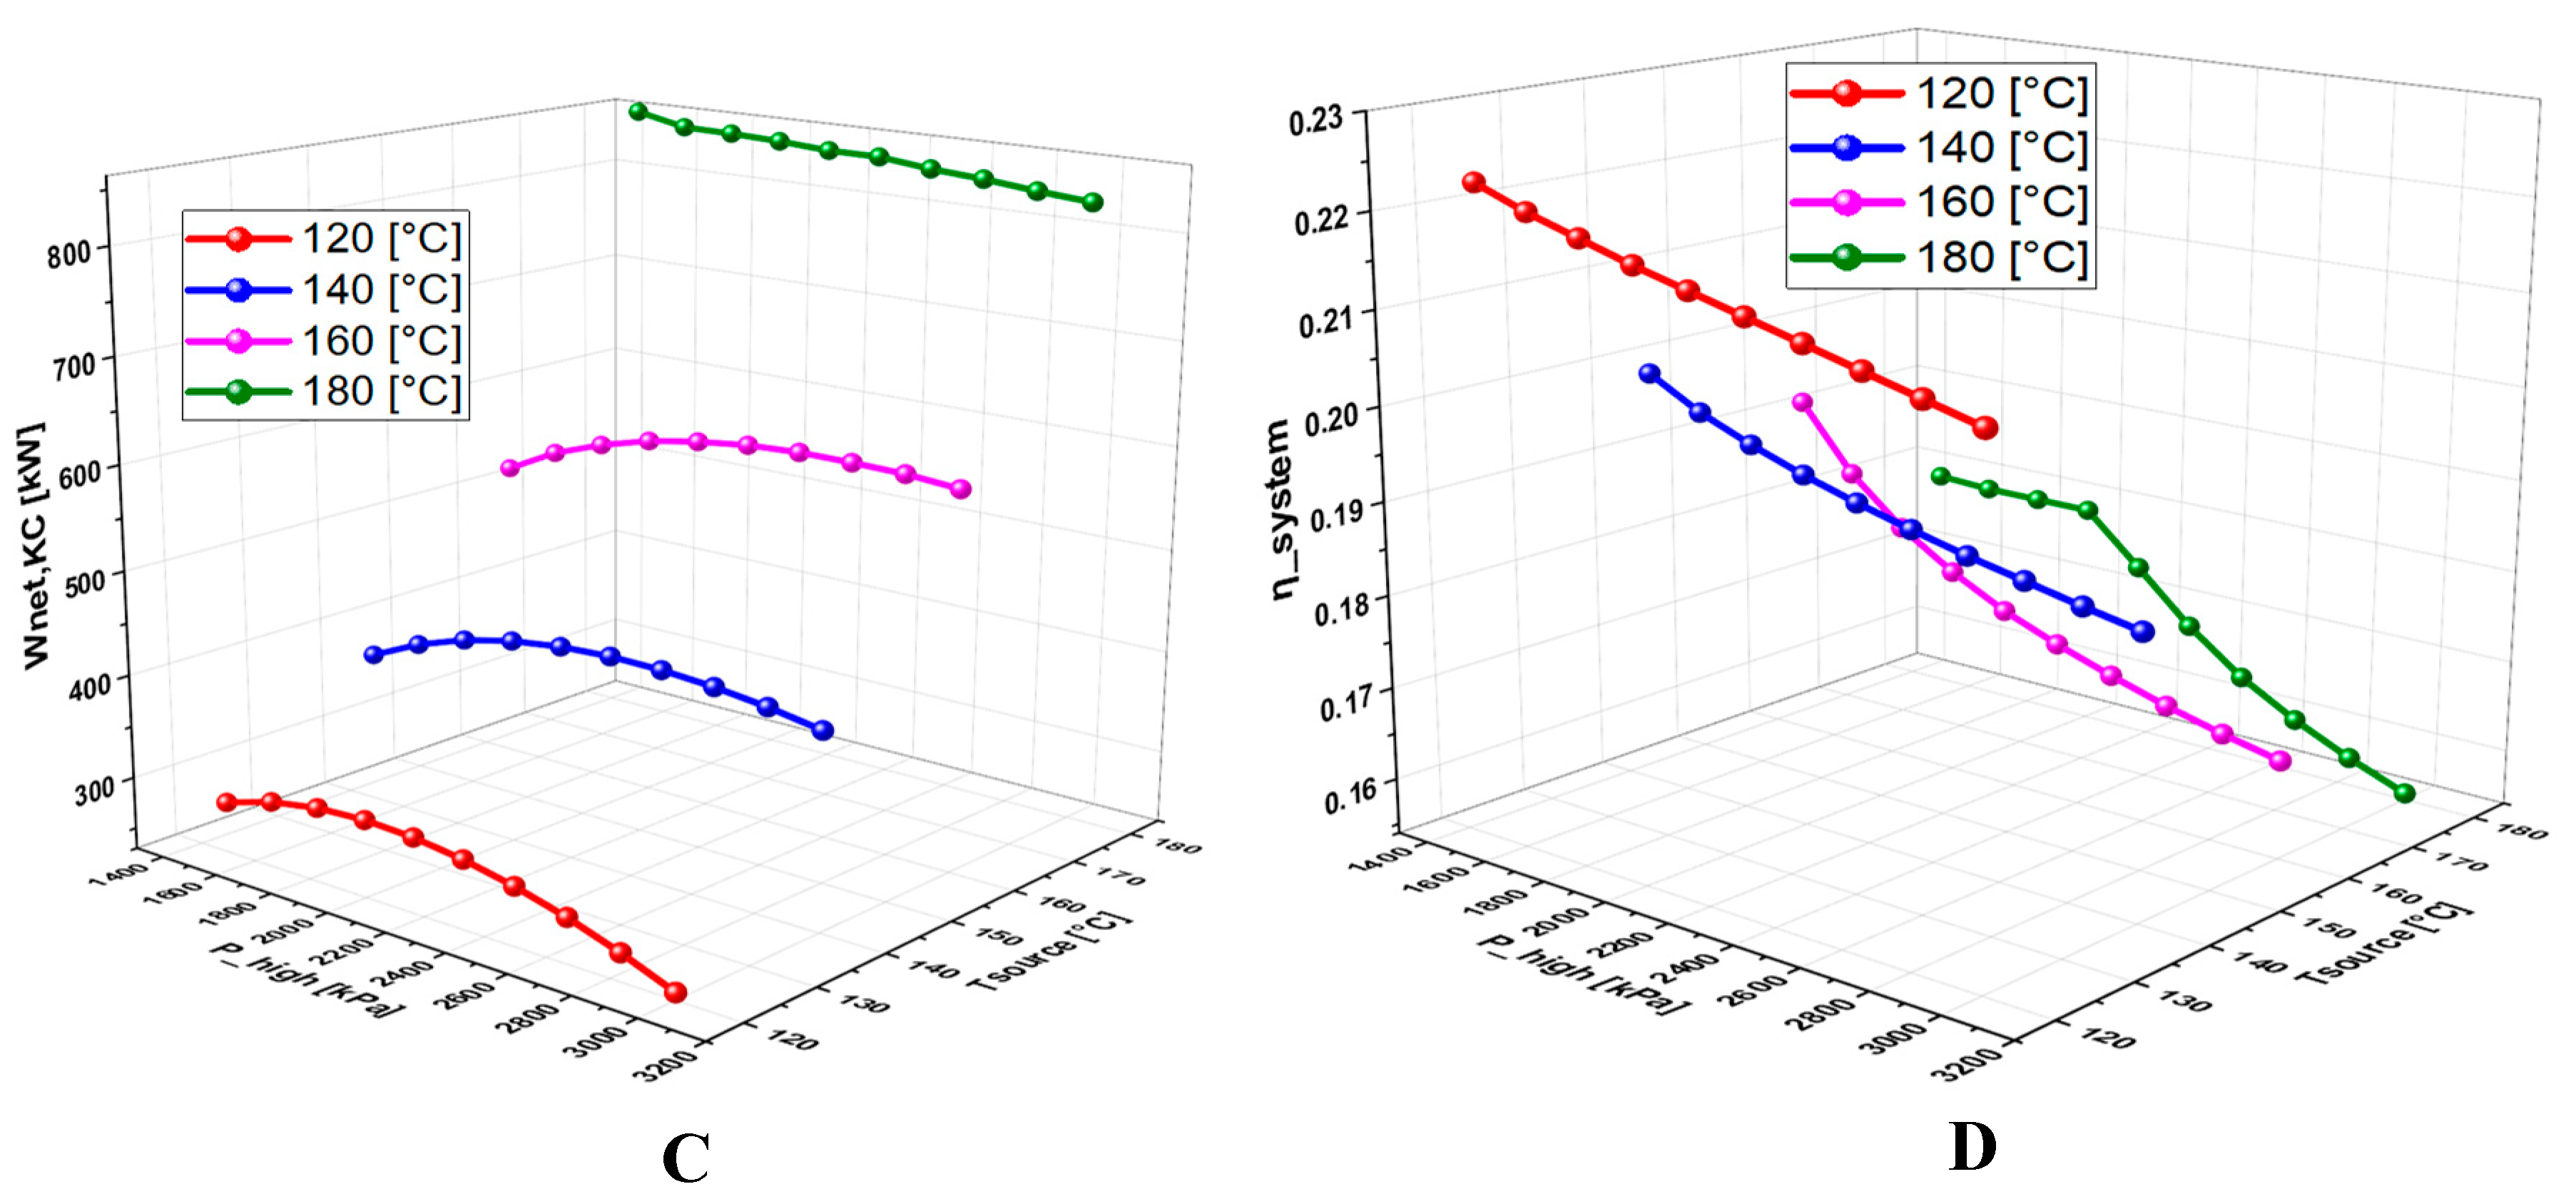
Figure 9.
Effect of high pressure on: A. Net power, ORC, B. Hydrogen production, C. Net power, KC, D. Overall system efficiency.
Figure 9.
Effect of high pressure on: A. Net power, ORC, B. Hydrogen production, C. Net power, KC, D. Overall system efficiency.
6.4.3. Effect of TTD on the System Performance
Figure 10 shows the effect of TTD on the net power, hydrogen production and overall efficiency. Increasing TTD causes a decrease in all of these quantities. Figure 10a,b show that a pressure of 3000 kPa maximizes the performance of the ORC cycle, while Figure 10c shows that the KC net power is optimal at 2500 kPa.
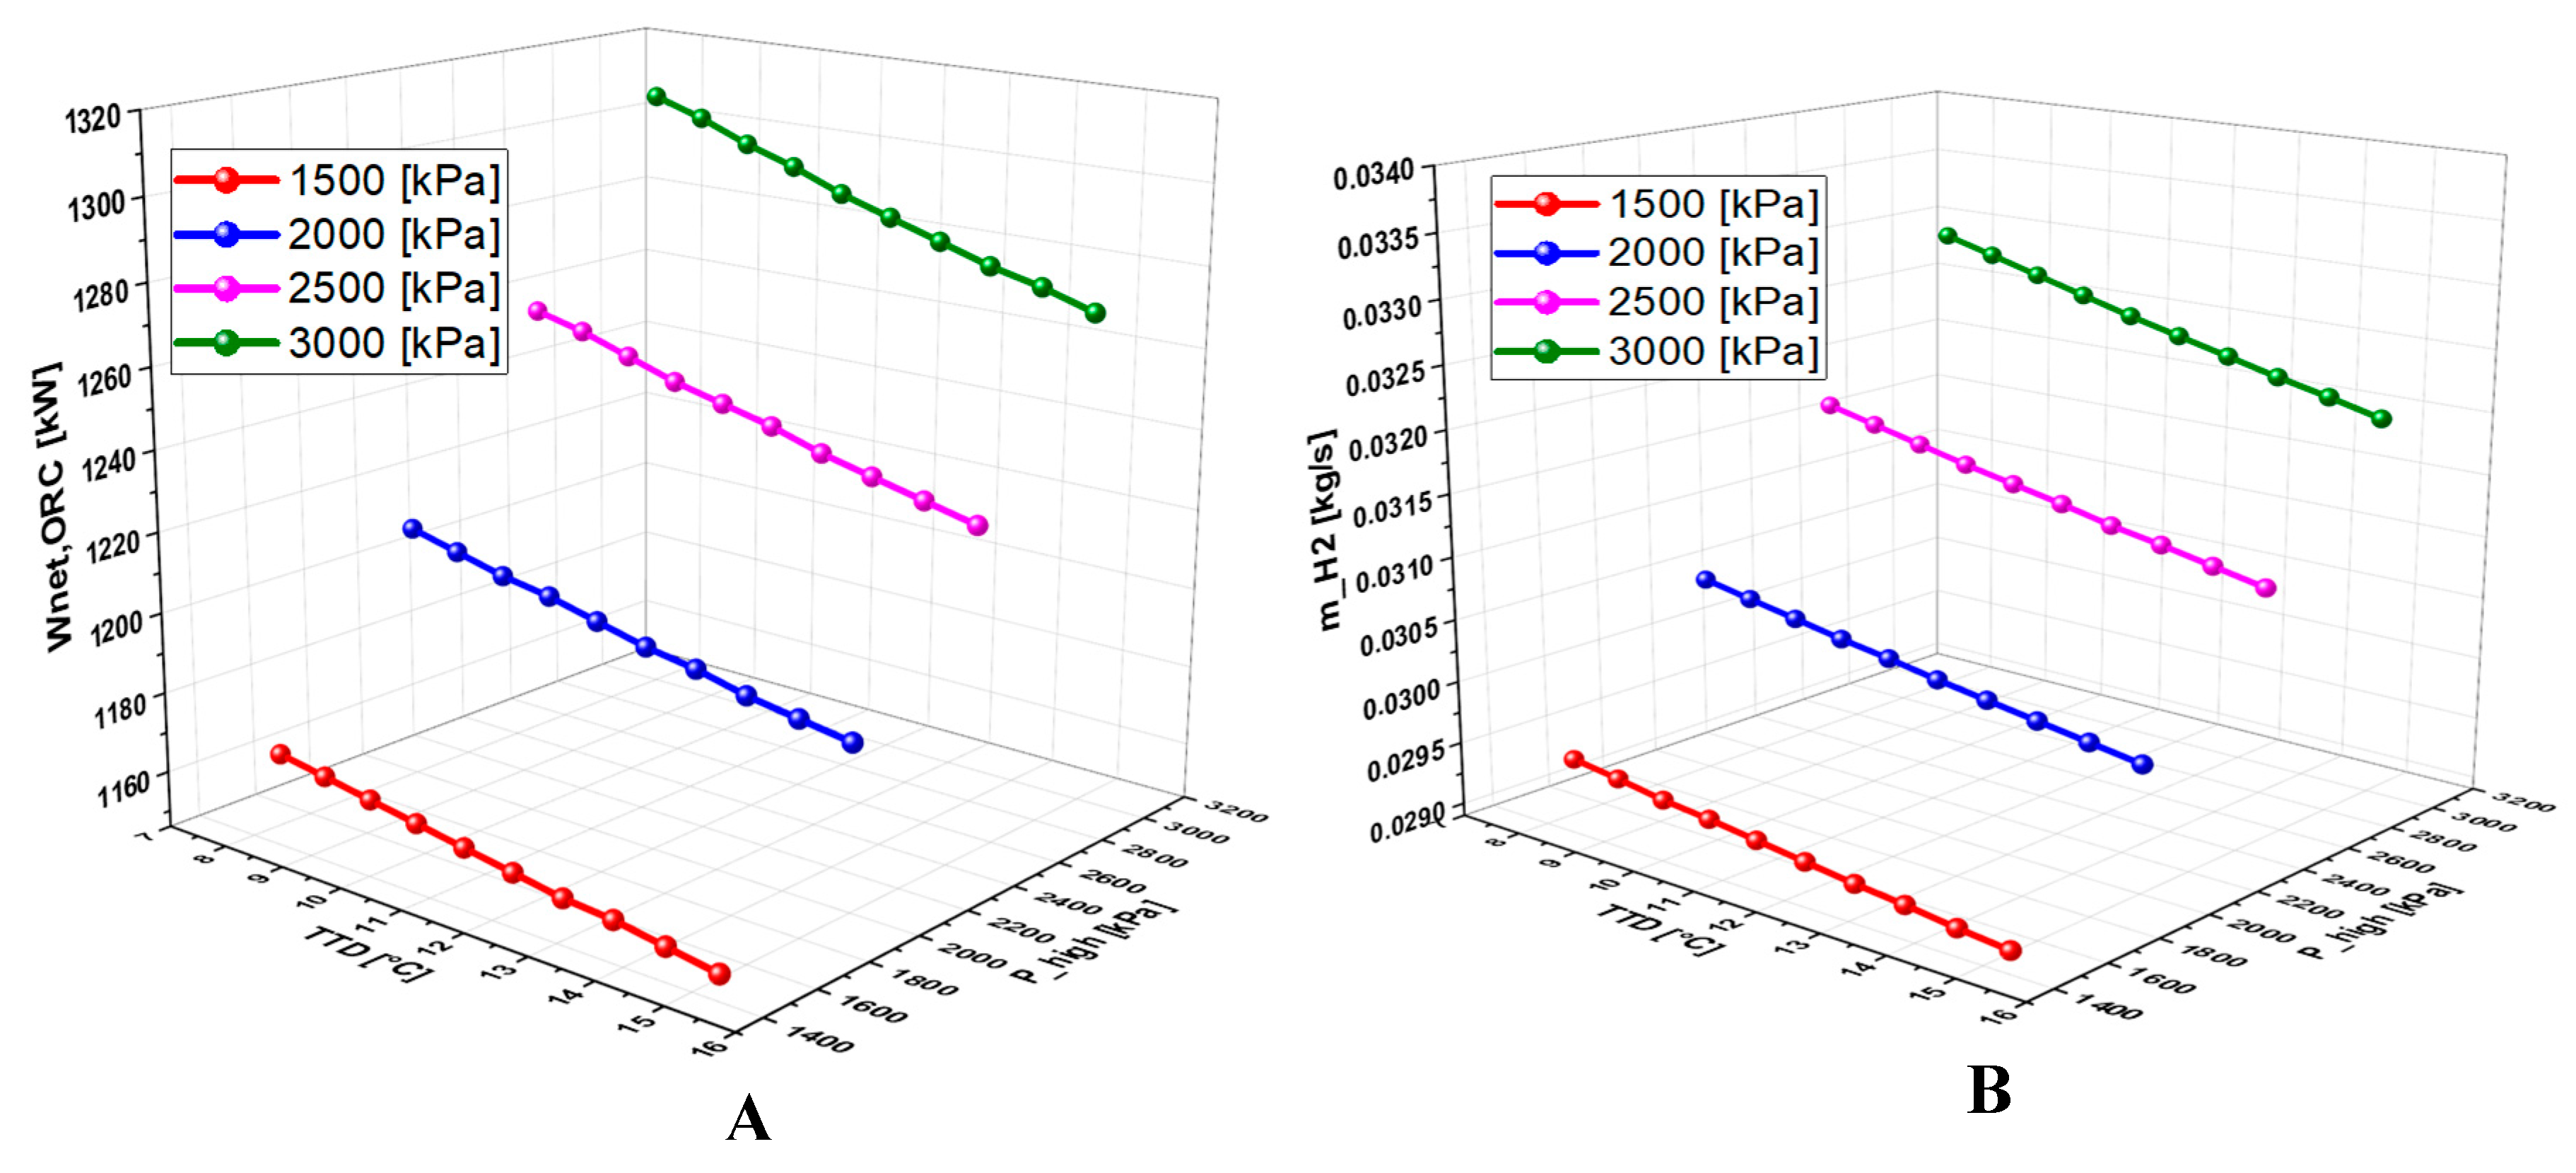
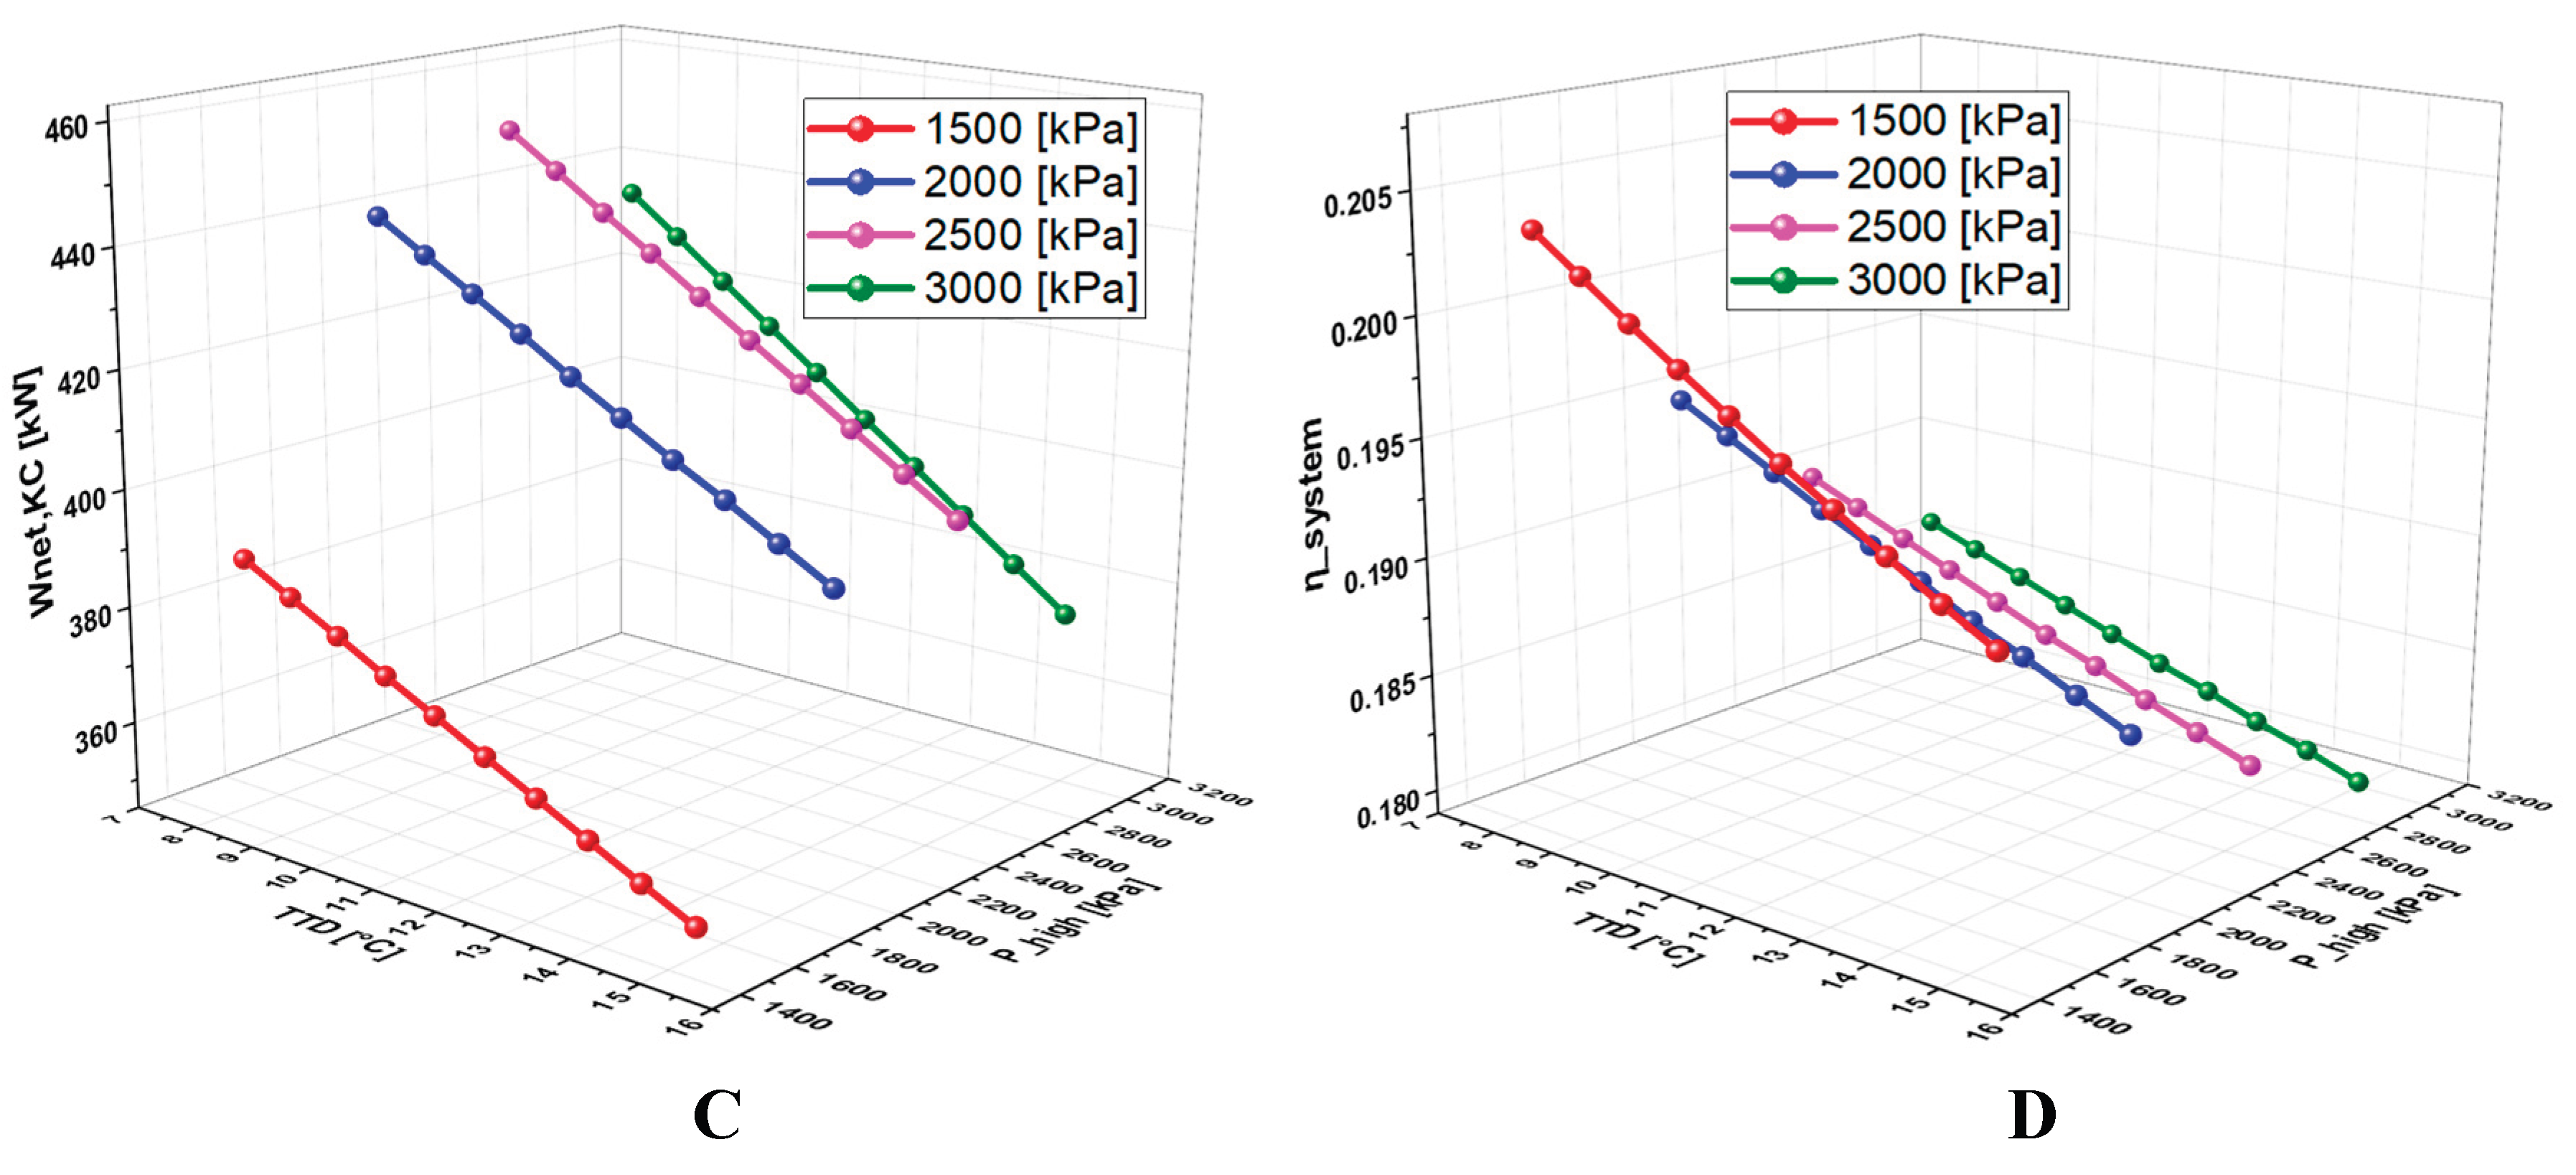
Figure 10.
Effect of TTD on: A. Net power, ORC, B. Hydrogen production, C. Net power, KC, D. Overall system efficiency.
Figure 10.
Effect of TTD on: A. Net power, ORC, B. Hydrogen production, C. Net power, KC, D. Overall system efficiency.
7. Conclusions
A poly-generation system has been proposed in which a combined Kalina/Organic Rankine cycle is coupled with an electrolyzer unit to produce both power and green hydrogen in an efficient way. The system is driven by a geothermal energy source. In particular, a comprehensive thermodynamic analysis and an exergetic evaluation were carried out to assess the effect of key parameters (geothermal temperature, high pressure, ammonia-water concentration ratio, and terminal temperature difference) on the performance of concurrent production of power and green hydrogen. Two configurations schematically displayed in Figure 11 and Figure 12 have been considered. After simulation and optimization using the genetic algorithm method, following conclusions can be drawn:
- Under the same operating conditions, the combination of ammonia-water mixture and MD2M allowed to achieve the best performance after simulation compared to the other combinations, with a net power of 1470 kW and a hydrogen production of 0.03697 kg/s (3194.208 kg/day).
- Optimization results show that among the different combinations analyzed, the combination of ammonia-water + R152a offers the best performance, with a net power of 2016 kW and a hydrogen production of 0.05049 kg/s (4362.336 kg/day). It is followed by the ammonia-water + MD2M combination.
- The combination ammonia-water + R152a further provides a significant improvement in the system performance, with a 7.922% increase in net power and a 7.8% improvement in hydrogen combination.
- Furthermore, adjusting the reference temperature to a maximum of 179.9°C leads to an increase in energy efficiency from 12 % to 15 % and a decrease in the total exergy destruction rate to 14574 kW from 14828 Kw.
- Optimization results also indicate that the optimum ammonia concentration for the proposed system is between 0.50 and 0.51 for different combinations.
- A detailed study of the evolution of the system performance as a function of the main parameters investigated over various ranges of variation revealed that the geothermal temperature is the parameter with the most significant impact on the overall operation of the system.
- In case of turbine separation, the production of hydrogen reaches 0.03112 kg/s (2687 kg/day), which is significantly lower than the production obtained with the combined turbines, i.e. a reduction of 15%. The electricity needed from the ORC amounts 1235 kW, and the power generated from the KC is about 435.5 kW say 35.26 %. It is worthy noting that in case of coupled turbines, the amount of electricity is of 1470 kW.
- Comparing the performance of the proposed cycle combinations with the existing one without accounting for the economic part, it turns out this cycle performs better and is simply flexible as the amount of electricity to be allocated for the hydrogen production can vary between 1235 and 1470 kW.
Author Contributions
Conceptualization, Guy Trudon Muya; methodology, Sadiki Amsini; software, Guy Trudon Muya ,Yasmina Boukhchana; validation, Guy Trudon Muya; formal analysis, Sun Yaquan, Samuel Molima; investigation, Ali Fellah; resources and DRC geothermal data, Matthieu Kanyama, Samuel Molima; writing—original draft preparation, Guy Trudon Muya, Sadiki Amsini; writing—review and editing, Guy Trudon Muya; visualization, Guy Trudon Muya , Yasmina Boukhchana; supervision, Ali Fellah, Sadiki Amsini ; project administration, Sadiki Amsini.All authors have read and agreed to the published version of the manuscript.
Funding
This research received no external funding
Acknowledgments
The authors gratefully acknowledge the support by the Technische Universität Darmstadt (Institutes RSM and EKT) and the DFG (German Research Council) through the project SA 8367/15-1 as well as the ENIG/ISTA-Kinshasa Cooperation. The third author acknowledges especially the financial support by the China Scholar Council, China (CSC, n° 202009650009
Conflicts of Interest
The authors declare no conflicts of interest.
Abbreviations
The following abbreviations are used in this manuscript:
| Nomenclature | |
| EES | Engineering Equation Solver |
| F | faraday constant |
| GA | Genetic algorithm |
| GEN | Generator |
| h | enthalpy (kJ/kg) |
| HEX | exchanger |
| J | current density |
| KC | Kalina cycle |
| LHV | Lower heating value |
| mass flow rate (kg/s) | |
| Hydrogen production rate (kg/s), (kg/day) | |
| ORC | Organic Rankine cycle |
| P | Pressure (kPa) |
| PEM | Proton exchange membrane |
| PEME | Proton exchange membrane electrolyzer |
| heat flow (kW) | |
| reg | regenerator |
| s | entropy (kJ/kg K) |
| T0 | ambient temperature (◦C) |
| T | temperature (◦C) |
| TTD | terminal temperature difference (°C) |
| VG | vapor generator |
| VG | overpotential (V) |
| V_O | reversible potential (V) |
| V_act,a | cathode overpotential (V) |
| V_act,c | anode overpotential (V) |
| V_ohm | ohmic overpotential (V) |
| W | Power (KW) |
| Wnet | power net (KW) |
| Greek letters | |
| η | efficiency (%) |
| ε | effectiveness |
| Subscripts | |
| cond | condenser |
| ex | exergy |
| gen | generator |
| in | inlet |
| out | outlet |
| th | thermal |
References
- M. K. Singla, P. Nijhawan, and A. S. Oberoi, “Hydrogen fuel and fuel cell technology for cleaner future: a review,” Environ Sci Pollut Res, vol. 28, no. 13, pp. 15607–15626, Apr. 2021. [CrossRef]
- R. Yukesh Kannah et al., “Techno-economic assessment of various hydrogen production methods – A review,” Bioresource Technology, vol. 319, p. 124175, Jan. 2021. [CrossRef]
- S. K. Dash, S. Chakraborty, and D. Elangovan, “A Brief Review of Hydrogen Production Methods and Their Challenges,” Energies, vol. 16, no. 3, p. 1141, Jan. 2023. [CrossRef]
- Xu Wen, Louis Dressler, Andreas Dreizler, Amsini Sadiki, Johannes Janicka, Christian Hasse: Flamelet LES of turbulent premixed/stratified flames with H2 addition, Combustion and Flame, Volume 230, August 2021, 111428.
- B. S. Zainal et al., “Recent advancement and assessment of green hydrogen production technologies,” Renewable and Sustainable Energy Reviews, vol. 189, p. 113941, Jan. 2024. [CrossRef]
- M. Aravindan and G. Praveen Kumar, “Optimizing novel green hydrogen production from solar and municipal solid waste: A thermo-economic investigation with environmental comparison between integrated low temperature power cycles,” Process Safety and Environmental Protection, vol. 186, pp. 421–447, Jun. 2024. [CrossRef]
- S. Baral and J. Šebo, “Techno-economic assessment of green hydrogen production integrated with hybrid and organic Rankine cycle (ORC) systems,” Heliyon, vol. 10, no. 4, p. e25742, Feb. 2024. [CrossRef]
- Q. Hassan, A. Z. Sameen, H. M. Salman, and M. Jaszczur, “Large-scale green hydrogen production via alkaline water electrolysis using solar and wind energy,” International Journal of Hydrogen Energy, vol. 48, no. 88, pp. 34299–34315, Oct. 2023. [CrossRef]
- B. Karthikeyan and G. Praveen Kumar, “Thermoeconomic and optimization approaches for integrating cooling, power, and green hydrogen production in dairy plants with a novel solar-biomass cascade ORC system,” Energy Conversion and Management, vol. 295, p. 117645, Nov. 2023. [CrossRef]
- D. Elrhoul, M. Naveiro, M. R. Gómez, and T. A. Adams, “Thermo-economic analysis of green hydrogen production onboard LNG carriers through solid oxide electrolysis powered by organic Rankine cycles,” Applied Energy, vol. 380, p. 124996, Feb. 2025. [CrossRef]
- S. M. Alirahmi, E. Assareh, N. N. Pourghassab, M. Delpisheh, L. Barelli, and A. Baldinelli, “Green hydrogen & electricity production via geothermal-driven multi-generation system: Thermodynamic modeling and optimization,” Fuel, vol. 308, p. 122049, Jan. 2022. [CrossRef]
- T. Hai et al., “Combination of a geothermal-driven double-flash cycle and a Kalina cycle to devise a polygeneration system: Environmental assessment and optimization,” Applied Thermal Engineering, vol. 228, p. 120437, Jun. 2023. [CrossRef]
- K. Madhesh et al., “Analysis and multi-objective evolutionary optimization of Solar-Biogas hybrid system operated cascade Kalina organic Rankine cycle for sustainable cooling and green hydrogen production,” Energy Conversion and Management, vol. 301, p. 117999, Feb. 2024. [CrossRef]
- Saoud, Y. Boukhchana, J. C. Bruno, and A. Fellah, “Thermodynamic investigation of an innovative solar-driven trigeneration plant based on an integrated ORC-single effect-double lift absorption chiller,” Thermal Science and Engineering Progress, vol. 50, p. 102596, May 2024. [CrossRef]
- M. Sharifishourabi, I. Dincer, and A. Mohany, “A novel trigeneration energy system with two modes of operation for thermal energy storage and hydrogen production,” Energy, vol. 304, p. 132121, Sep. 2024. [CrossRef]
- F. Yilmaz, M. Ozturk, and R. Selbas, “A parametric examination of the energetic, exergetic, and environmental performances of the geothermal energy-based multigeneration plant for sustainable products,” International Journal of Hydrogen Energy, p. S0360319924054430, Dec. 2024. [CrossRef]
- M. A. Sabbaghi and M. Sefid, “Thermo-economic analysis of a combined flash-binary geothermal cycle with a transcritical CO2 cycle to produce green hydrogen,” IJEX, vol. 43, no. 2, pp. 110–122, 2024. [CrossRef]
- H. Hajabdollahi, A. Saleh, and M. Shafiey Dehaj, “A multi-generation system based on geothermal driven: energy, exergy, economic and exergoenvironmental (4E) analysis for combined power, freshwater, hydrogen, oxygen, and heating production,” Environ Dev Sustain, vol. 26, no. 10, pp. 26415–26447, Aug. 2023. [CrossRef]
- W. Li et al., “Enhancing green hydrogen production via improvement of an integrated double flash geothermal cycle; Multi-criteria optimization and exergo-environmental evaluation,” Case Studies in Thermal Engineering, vol. 59, p. 104538, Jul. 2024. [CrossRef]
- M. Arslan and C. Yilmaz, “Development of models for green hydrogen production of Turkey geothermal Resources: A case study demonstration of thermodynamics and thermoeconomics analyses,” Fuel, vol. 359, p. 130430, Mar. 2024. [CrossRef]
- K. Li, Y.-Z. Ding, C. Ai, H. Sun, Y.-P. Xu, and N. Nedaei, “Multi-objective optimization and multi-aspect analysis of an innovative geothermal-based multi-generation energy system for power, cooling, hydrogen, and freshwater production,” Energy, vol. 245, p. 123198, Apr. 2022. [CrossRef]
- K. Almutairi, S. S. Hosseini Dehshiri, A. Mostafaeipour, A. Issakhov, K. Techato, and J. Arockia Dhanraj, “Performance optimization of a new flash-binary geothermal cycle for power/hydrogen production with zeotropic fluid,” J Therm Anal Calorim, vol. 145, no. 3, pp. 1633–1650, Aug. 2021. [CrossRef]
- J. Gao, Y. Zhang, X. Li, X. Zhou, and Z. J. Kilburn, “Thermodynamic and thermoeconomic analysis and optimization of a renewable-based hybrid system for power, hydrogen, and freshwater production,” Energy, vol. 295, p. 131002, May 2024. [CrossRef]
- S. Zhang, W. Jian, J. Zhou, J. Li, and G. Yan, “A new solar, natural gas, and biomass-driven polygeneration cycle to produce electrical power and hydrogen fuel; thermoeconomic and prediction approaches,” Fuel, vol. 334, p. 126825, Feb. 2023. [CrossRef]
- S. Sharafi Laleh, F. P. Gharamaleki, S. F. Alavi, S. Soltani, S. M. S. Mahmoudi, and M. A. Rosen, “A novel sustainable biomass-fueled cogeneration cycle integrated with carbon dioxide capture utilizing LNG regasification and green hydrogen production via PEM electrolysis: Thermodynamic assessment,” Journal of Cleaner Production, vol. 421, p. 138529, Oct. 2023. [CrossRef]
- S. Wang, H. Lin, A. M. Abed, A. Sharma, and H. Fooladi, “Exergoeconomic assessment of a biomass-based hydrogen, electricity and freshwater production cycle combined with an electrolyzer, steam turbine and a thermal desalination process,” International Journal of Hydrogen Energy, vol. 47, no. 79, pp. 33699–33718, Sep. 2022. [CrossRef]
- B. Karthikeyan, G. Praveen Kumar, R. Narayanan, S. R, and A. Coronas, “Thermo-economic optimization of hybrid solar-biomass driven organic rankine cycle integrated heat pump and PEM electrolyser for combined power, heating, and green hydrogen applications,” Energy, vol. 299, p. 131436, Jul. 2024. [CrossRef]
- M. Sharifishourabi, I. Dincer, and A. Mohany, “Development of a novel biomass-wind energy system for clean hydrogen production along with other useful products for a residential community,” Energy and Built Environment, p. S2666123325000091, Jan. 2025. [CrossRef]
- . M. Forootan and A. Ahmadi, “Machine learning-based optimization and 4E analysis of renewable-based polygeneration system by integration of GT-SRC-ORC-SOFC-PEME-MED-RO using multi-objective grey wolf optimization algorithm and neural networks,” Renewable and Sustainable Energy Reviews, vol. 200, p. 114616, Aug. 2024. [CrossRef]
- Bamisile, Q. Huang, W. Hu, M. Dagbasi, and A. D. Kemena, “Performance analysis of a novel solar PTC integrated system for multi-generation with hydrogen production,” International Journal of Hydrogen Energy, vol. 45, no. 1, pp. 190–206, Jan. 2020. [CrossRef]
- P. Lykas, N. Georgousis, A. Kitsopoulou, D. N. Korres, E. Bellos, and C. Tzivanidis, “A Detailed Parametric Analysis of a Solar-Powered Cogeneration System for Electricity and Hydrogen Production,” Applied Sciences, vol. 13, no. 1, p. 433, Dec. 2022. [CrossRef]
- B. Mansir, “Thermodynamic investigation of novel hybrid plant with hydrogen as a green energy carrier,” International Journal of Hydrogen Energy, vol. 51, pp. 1171–1180, Jan. 2024. [CrossRef]
- M. Colakoglu and A. Durmayaz, “Energy, exergy and economic analyses and multiobjective optimization of a novel solar multi-generation system for production of green hydrogen and other utilities,” International Journal of Hydrogen Energy, vol. 47, no. 45, pp. 19446–19462, May 2022. [CrossRef]
- S. Khojaste Effatpanah, H. R. Rahbari, M. H. Ahmadi, and A. Farzaneh, “Green hydrogen production and utilization in a novel SOFC/GT-based zero-carbon cogeneration system: A thermodynamic evaluation,” Renewable Energy, vol. 219, p. 119493, Dec. 2023. [CrossRef]
- S. G. Gargari, M. Rahimi, and H. Ghaebi, “Thermodynamic analysis of a novel power-hydrogen cogeneration system,” Energy Conversion and Management, vol. 171, pp. 1093–1105, Sep. 2018. [CrossRef]
- L. Makuku, “Inventory of geothermal sources in the DRC and their development plan for the electrification of locals areas. Case of the eastern part of the DRC,” IOP Conf. Ser.: Earth Environ. Sci., vol. 249, p. 012016, Apr. 2019. [CrossRef]
- Pacifique S Mukandala and C. K. Mahinda, “Geothermal Development in the Democratic Republic of the Congo-a Country Update,” 2020. [CrossRef]
- M. Mbuto, Y.-Y. Albert, and K. Albert, “Etude Differentielle Des Sites Geothermiques De Kankule A Katana Au Sud-Kivu I. Revue De La Litterature,” pp. 2278–4861, Jun. 2020. [CrossRef]
- H. Mergner and T. Weimer, “Performance of ammonia–water based cycles for power generation from low enthalpy heat sources,” Energy, vol. 88, pp. 93–100, Aug. 2015. [CrossRef]
- Y. A. Chaboki, A. Khoshgard, G. Salehi, and F. Fazelpour, “Thermoeconomic analysis of a new waste heat recovery system for large marine diesel engine and comparison with two other configurations,” Energy Sources, Part A: Recovery, Utilization, and Environmental Effects, vol. 46, no. 1, pp. 10159–10184, Dec. 2024. [CrossRef]
- H. Rostamzadeh, H. Ghaebi, S. Vosoughi, and J. Jannatkhah, “Thermodynamic and thermoeconomic analysis and optimization of a novel dual-loop power/refrigeration cycle,” Applied Thermal Engineering, vol. 138, pp. 1–17, Jun. 2018. [CrossRef]
- Bamisile et al., “Thermo-environ study of a concentrated photovoltaic thermal system integrated with Kalina cycle for multigeneration and hydrogen production,” International Journal of Hydrogen Energy, vol. 45, no. 51, pp. 26716–26732, Oct. 2020. [CrossRef]
- H.-R. Bahrami and M. A. Rosen, “Exergoeconomic evaluation and multi-objective optimization of a novel geothermal-driven zero-emission system for cooling, electricity, and hydrogen production: capable of working with low-temperature resources,” Geotherm Energy, vol. 12, no. 1, p. 12, May 2024. [CrossRef]
- M. Ni, M. K. H. Leung, and D. Y. C. Leung, “Energy and exergy analysis of hydrogen production by a proton exchange membrane (PEM) electrolyzer plant,” Energy Conversion and Management, vol. 49, no. 10, pp. 2748–2756, Oct. 2008. [CrossRef]
- M. Taheripour, M. Kahani, and M. H. Ahmadi, “A hybrid poly-generation system for power and hydrogen production by thermal recovery from waste streams in a steel plant: Techno-economic analysis,” Energy Reports, vol. 11, pp. 2921–2934, Jun. 2024. [CrossRef]
- H. Nami, E. Akrami, and F. Ranjbar, “Hydrogen production using the waste heat of Benchmark pressurized Molten carbonate fuel cell system via combination of organic Rankine cycle and proton exchange membrane (PEM) electrolysis,” Applied Thermal Engineering, vol. 114, pp. 631–638, Mar. 2017. [CrossRef]
- Bejan, G. Tsatsaronis, and M. J. Moran, Thermal design and optimization. in A Wiley-Interscience publication. New York: Wiley, 1996.
- M. Javad Dehghani, “Enhancing energo-exergo-economic performance of Kalina cycle for low- to high-grade waste heat recovery: Design and optimization through deep learning methods,” Applied Thermal Engineering, vol. 195, p. 117221, Aug. 2021. [CrossRef]
- Sadiki and F. Ries, “Entropy Generation Analysis in Turbulent Reacting Flows and Near Wall: A Review,” Entropy, vol. 24, no. 8, p. 1099, Aug. 2022. [CrossRef]
- R. Shankar and W. Rivera, “Investigation of new cooling cogeneration cycle using NH3H2O mixture,” International Journal of Refrigeration, vol. 114, pp. 88–97, Jun. 2020. [CrossRef]
- T. Srinivas, N. Shankar Ganesh, and R. Shankar, Flexible Kalina Cycle Systems, 0 ed. Apple Academic Press, 2019. [CrossRef]
- Shirazi, R. A. Taylor, G. L. Morrison, and S. D. White, “A comprehensive, multi-objective optimization of solar-powered absorption chiller systems for air-conditioning applications,” Energy Conversion and Management, vol. 132, pp. 281–306, Jan. 2017. [CrossRef]
- S. Sharifi, F. Nozad Heravi, R. Shirmohammadi, R. Ghasempour, F. Petrakopoulou, and L. M. Romeo, “Comprehensive thermodynamic and operational optimization of a solar-assisted LiBr/water absorption refrigeration system,” Energy Reports, vol. 6, pp. 2309–2323, Nov. 2020. [CrossRef]
- H. Ghaebi, T. Parikhani, H. Rostamzadeh, and B. Farhang, “Proposal and assessment of a novel geothermal combined cooling and power cycle based on Kalina and ejector refrigeration cycles,” Applied Thermal Engineering, vol. 130, pp. 767–781, Feb. 2018. [CrossRef]
- T. K. Gogoi and P. Hazarika, “Comparative assessment of four novel solar based triple effect absorption refrigeration systems integrated with organic Rankine and Kalina cycles,” Energy Conversion and Management, vol. 226, p. 113561, Dec. 2020. [CrossRef]
- H. Ghaebi, A. S. Namin, and H. Rostamzadeh, “Exergoeconomic optimization of a novel cascade Kalina/Kalina cycle using geothermal heat source and LNG cold energy recovery,” Journal of Cleaner Production, vol. 189, pp. 279–296, Jul. 2018. [CrossRef]
- H. Ghaebi, B. Farhang, T. Parikhani, and H. Rostamzadeh, “Energy, exergy and exergoeconomic analysis of a cogeneration system for power and hydrogen production purpose based on TRR method and using low grade geothermal source,” Geothermics, vol. 71, pp. 132–145, Jan. 2018. [CrossRef]
- E. Akrami, A. Chitsaz, P. Ghamari, and S. M. S. Mahmoudi, “Energy and exergy evaluation of a tri-generation system driven by the geothermal energy,” J Mech Sci Technol, vol. 31, no. 1, pp. 401–408, Jan. 2017. [CrossRef]
- E. Soleymani, S. Ghavami Gargari, and H. Ghaebi, “Thermodynamic and thermoeconomic analysis of a novel power and hydrogen cogeneration cycle based on solid SOFC,” Renewable Energy, vol. 177, pp. 495–518, Nov. 2021. [CrossRef]
Figure 1.
Geolocation of the site of the geothermal water of Kankule in Katana, South Kivu, DRC ( modified from [38]).
Figure 1.
Geolocation of the site of the geothermal water of Kankule in Katana, South Kivu, DRC ( modified from [38]).
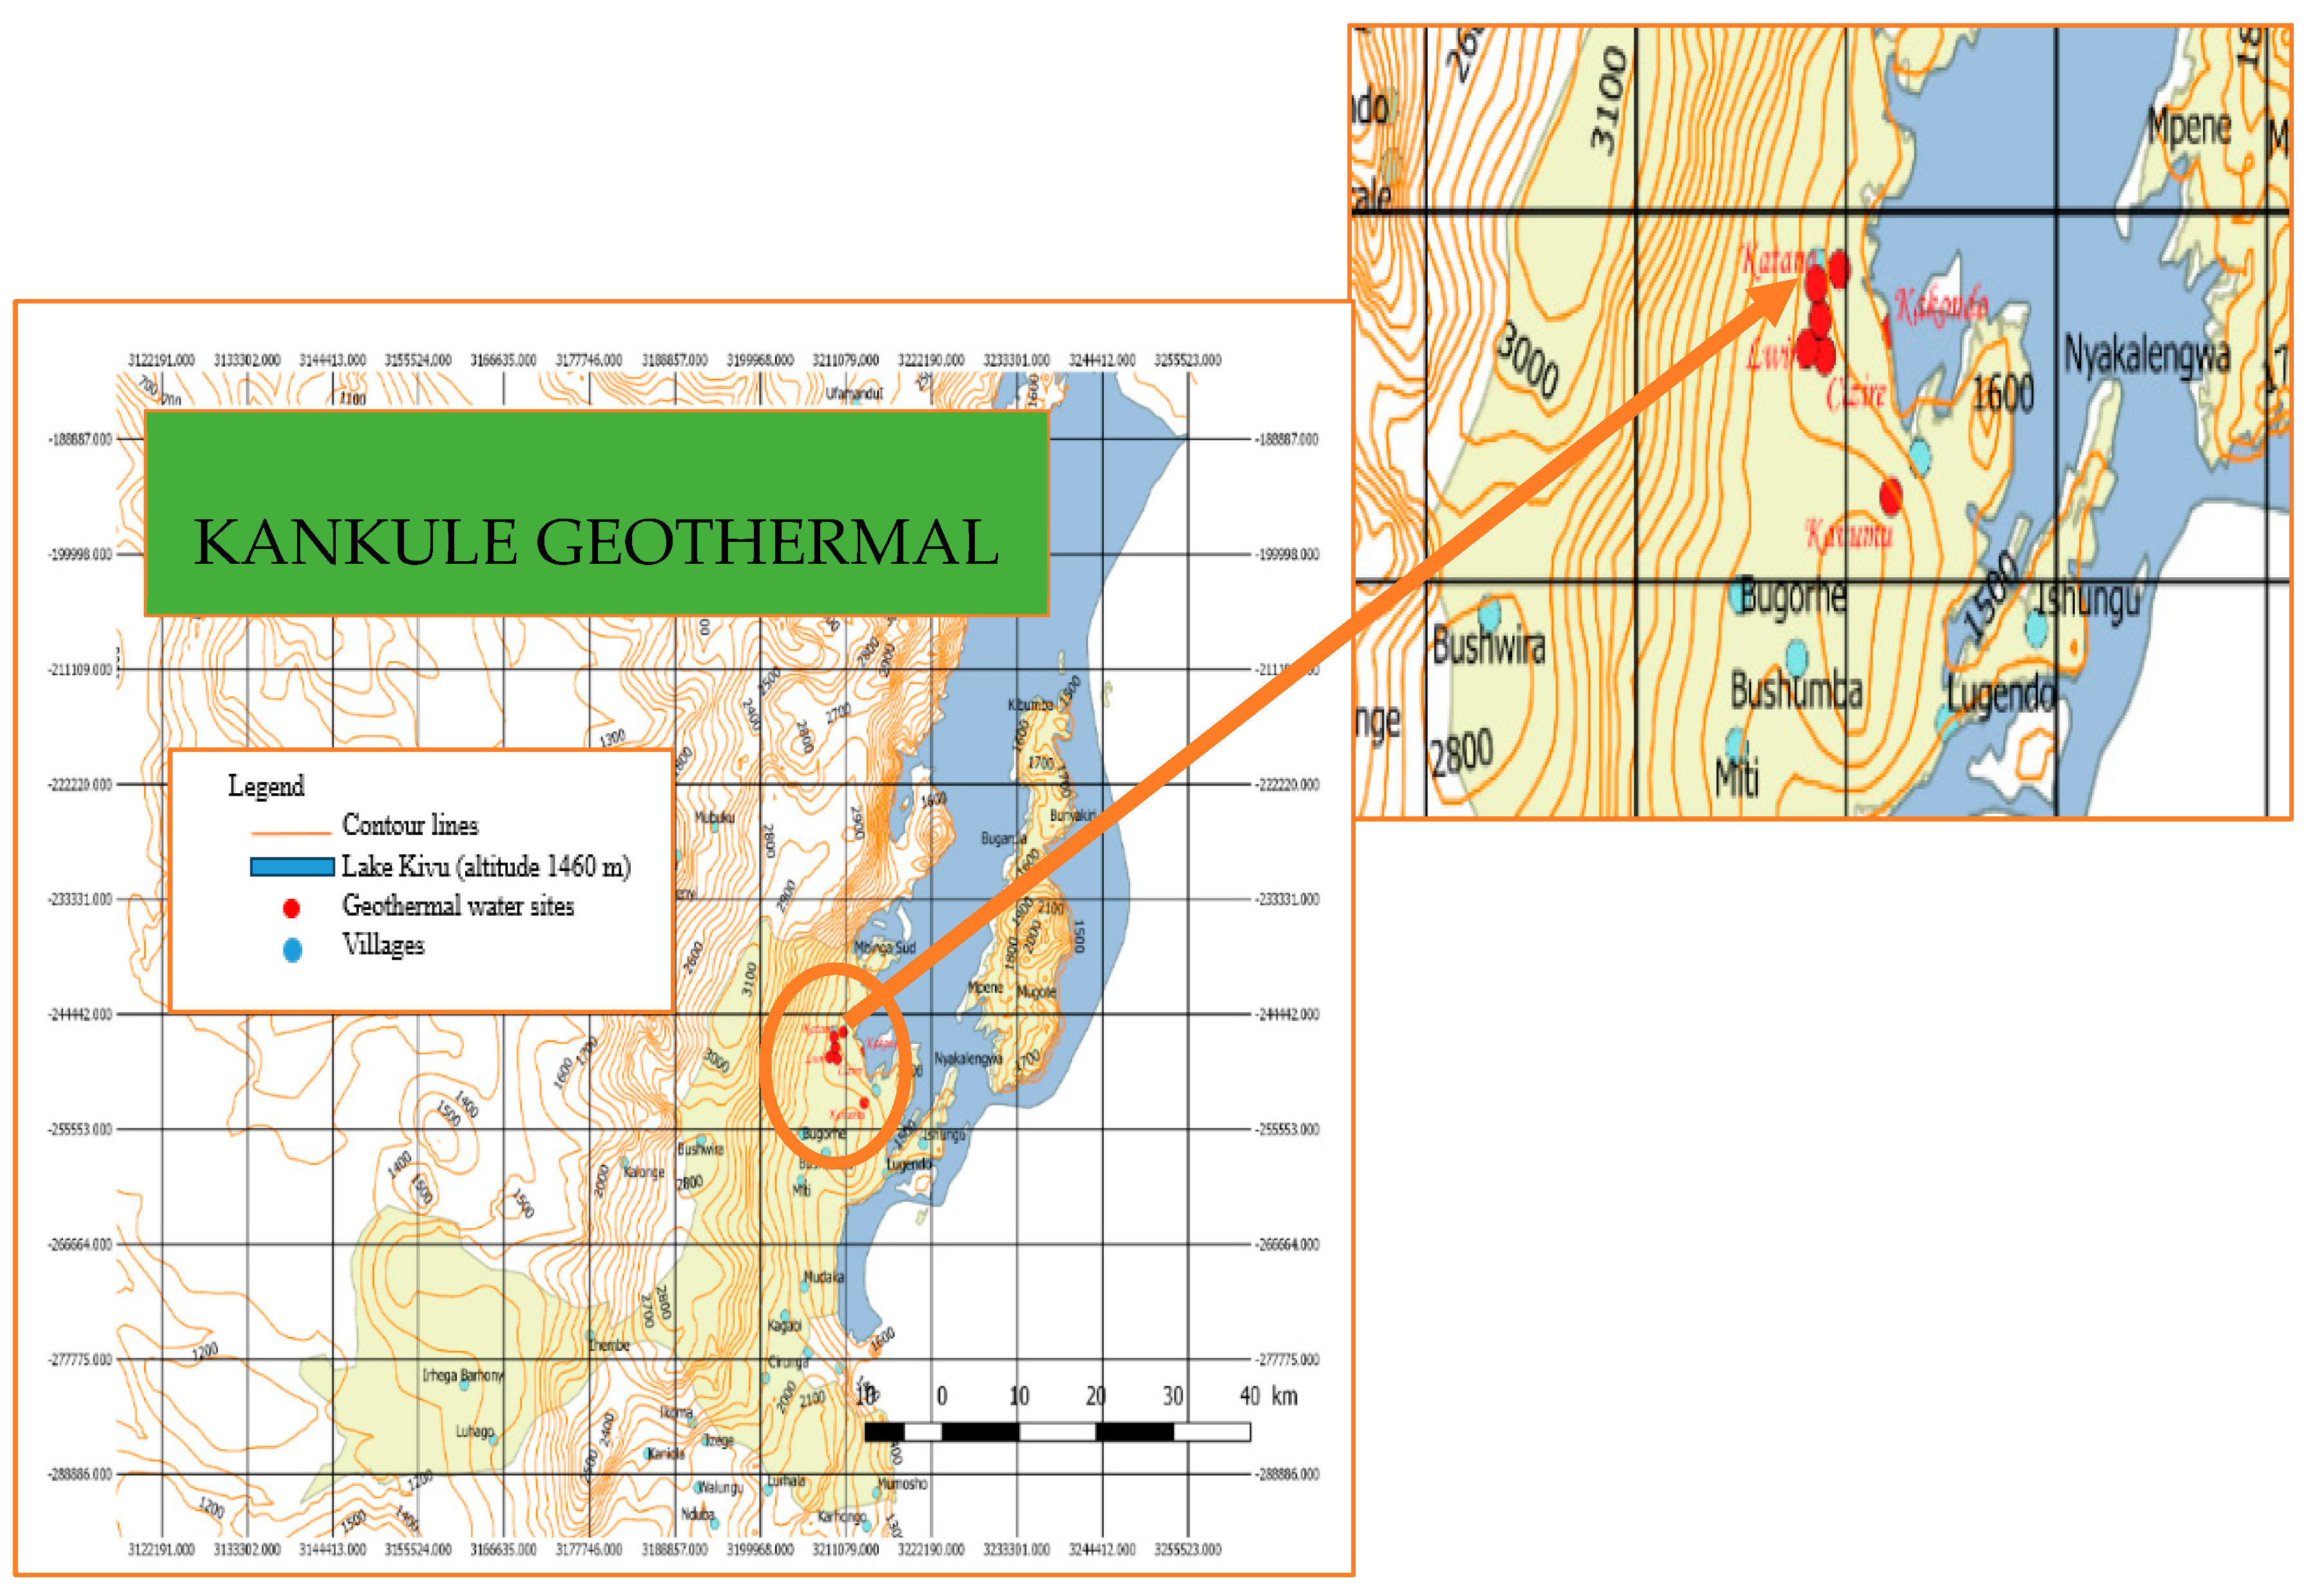
Figure 2.
A poly-generation system consisting of a Kalina and an Organic Rankine combined cycles and driven by a geothermal energy source from the DRC.
Figure 2.
A poly-generation system consisting of a Kalina and an Organic Rankine combined cycles and driven by a geothermal energy source from the DRC.
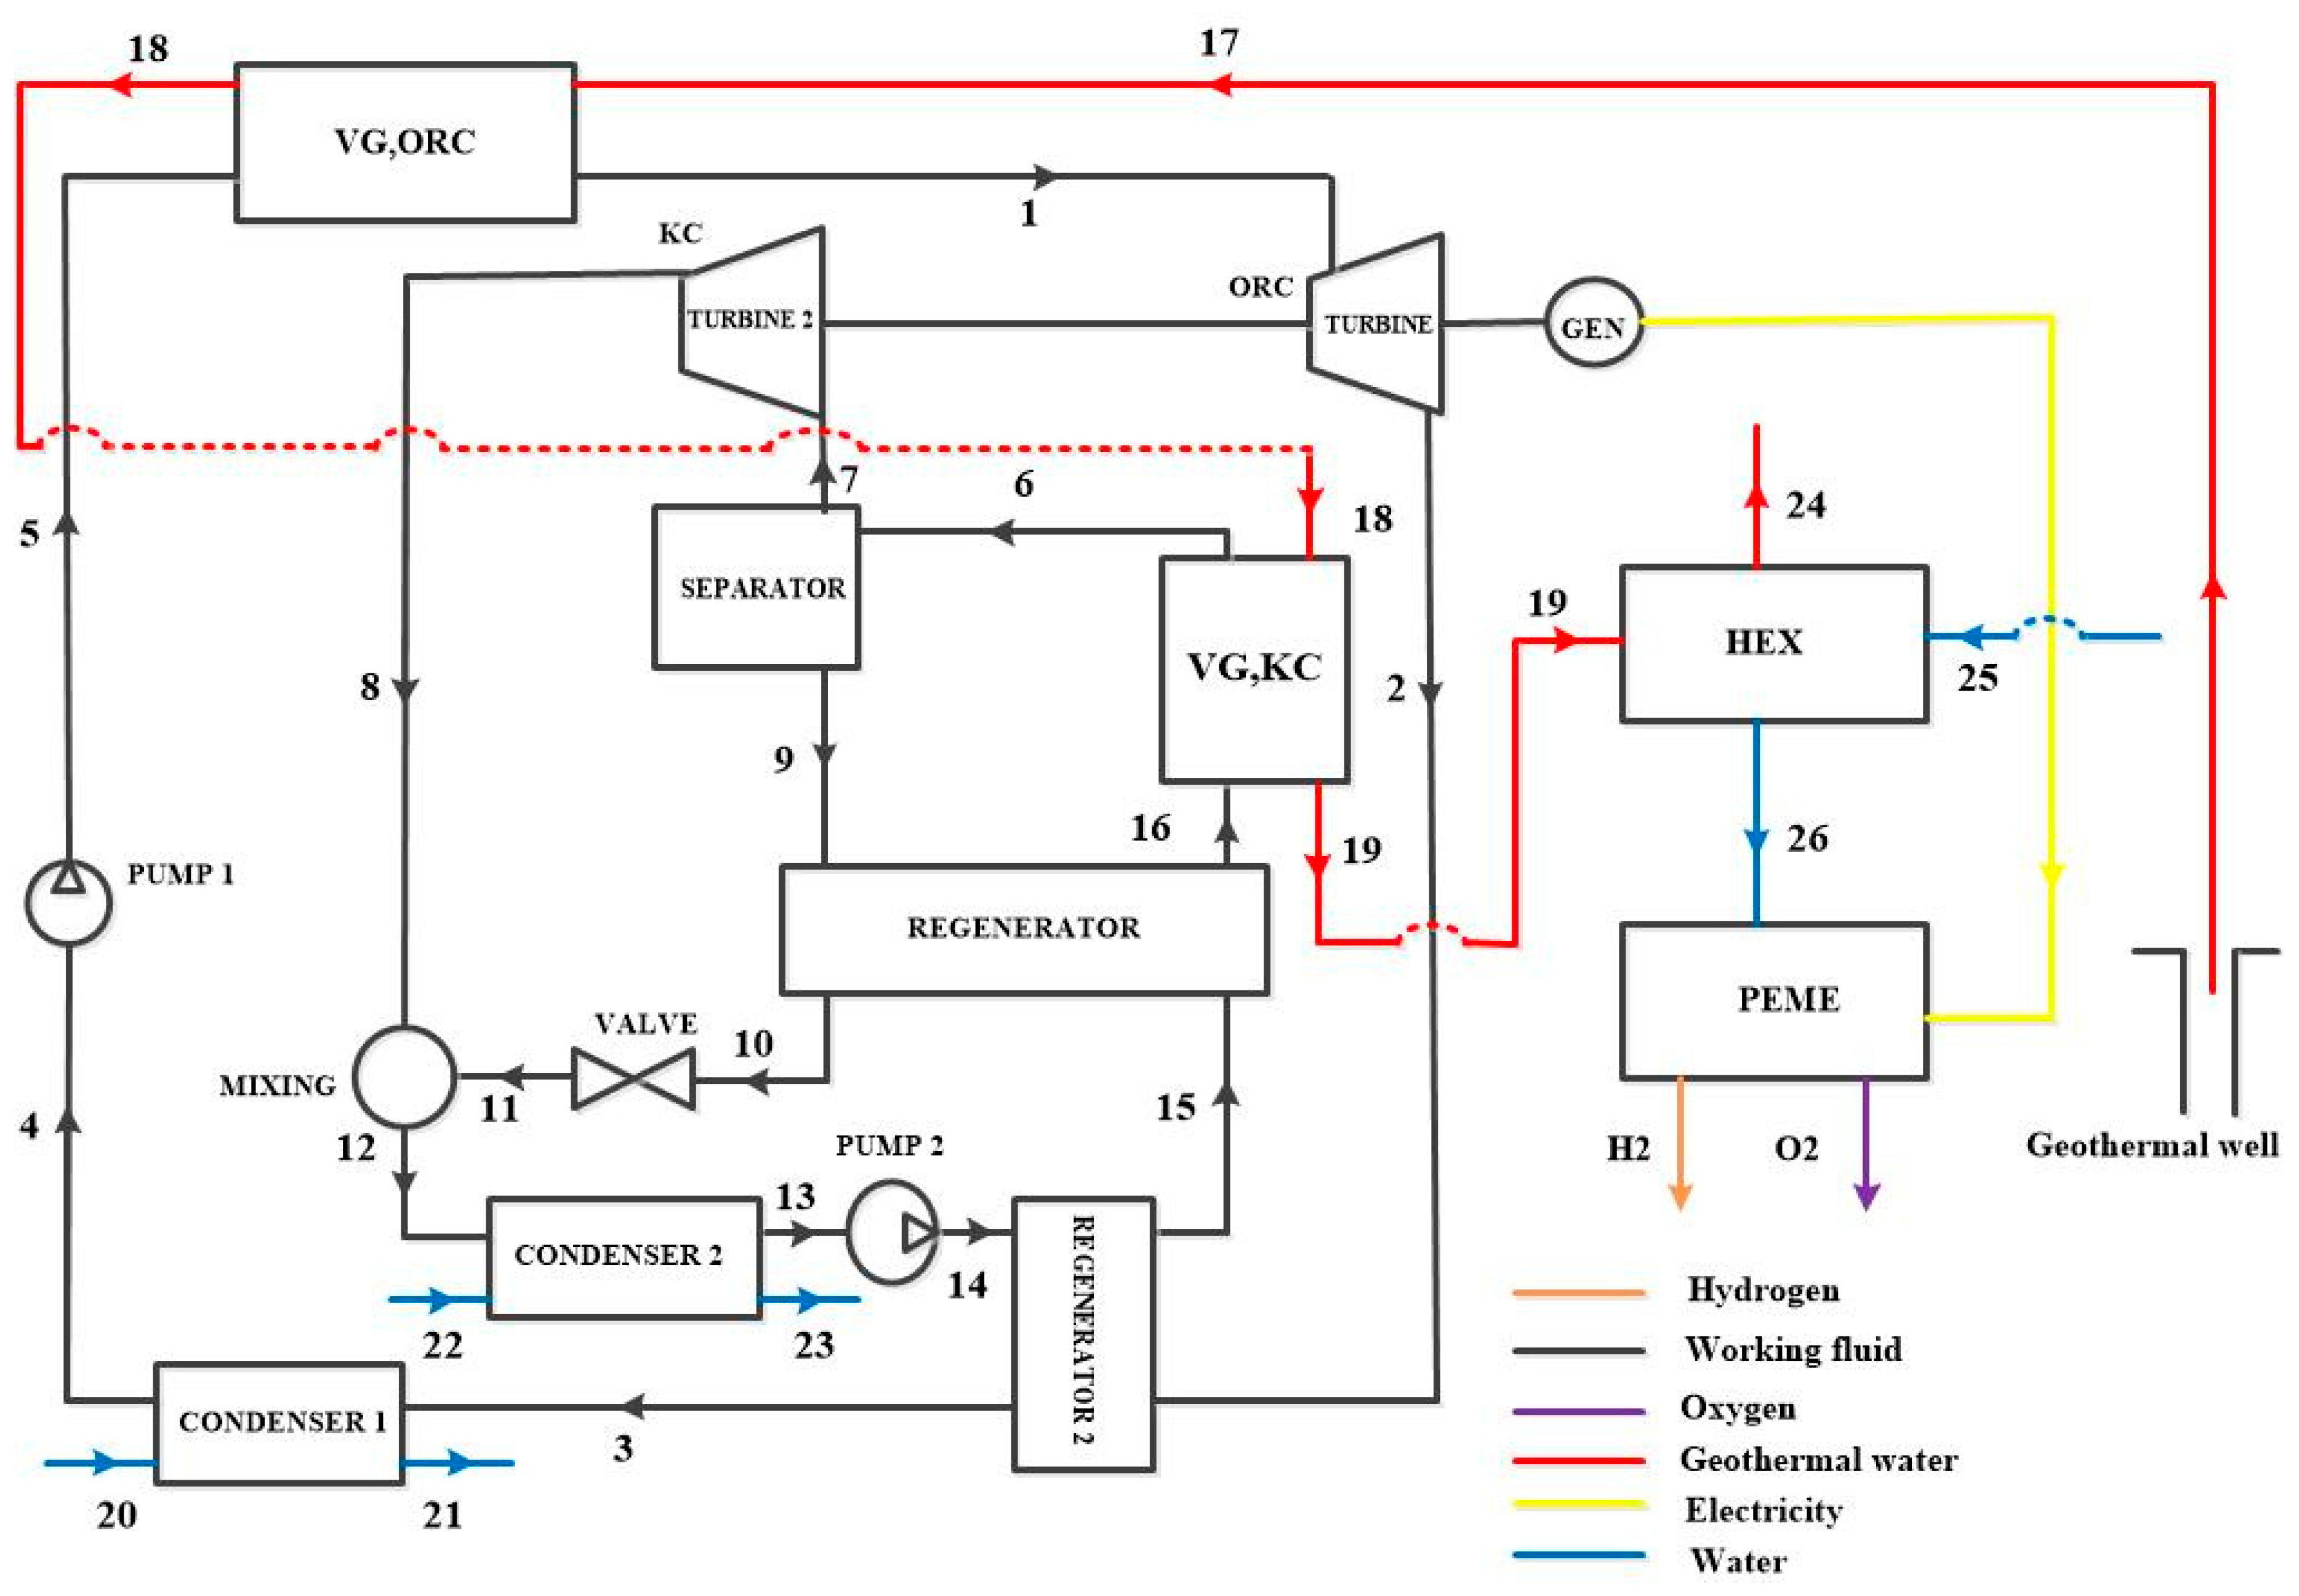
Figure 3.
A poly-generation system with separate turbines (turbine ORC for hydrogen production and turbine KC for electricity production).
Figure 3.
A poly-generation system with separate turbines (turbine ORC for hydrogen production and turbine KC for electricity production).
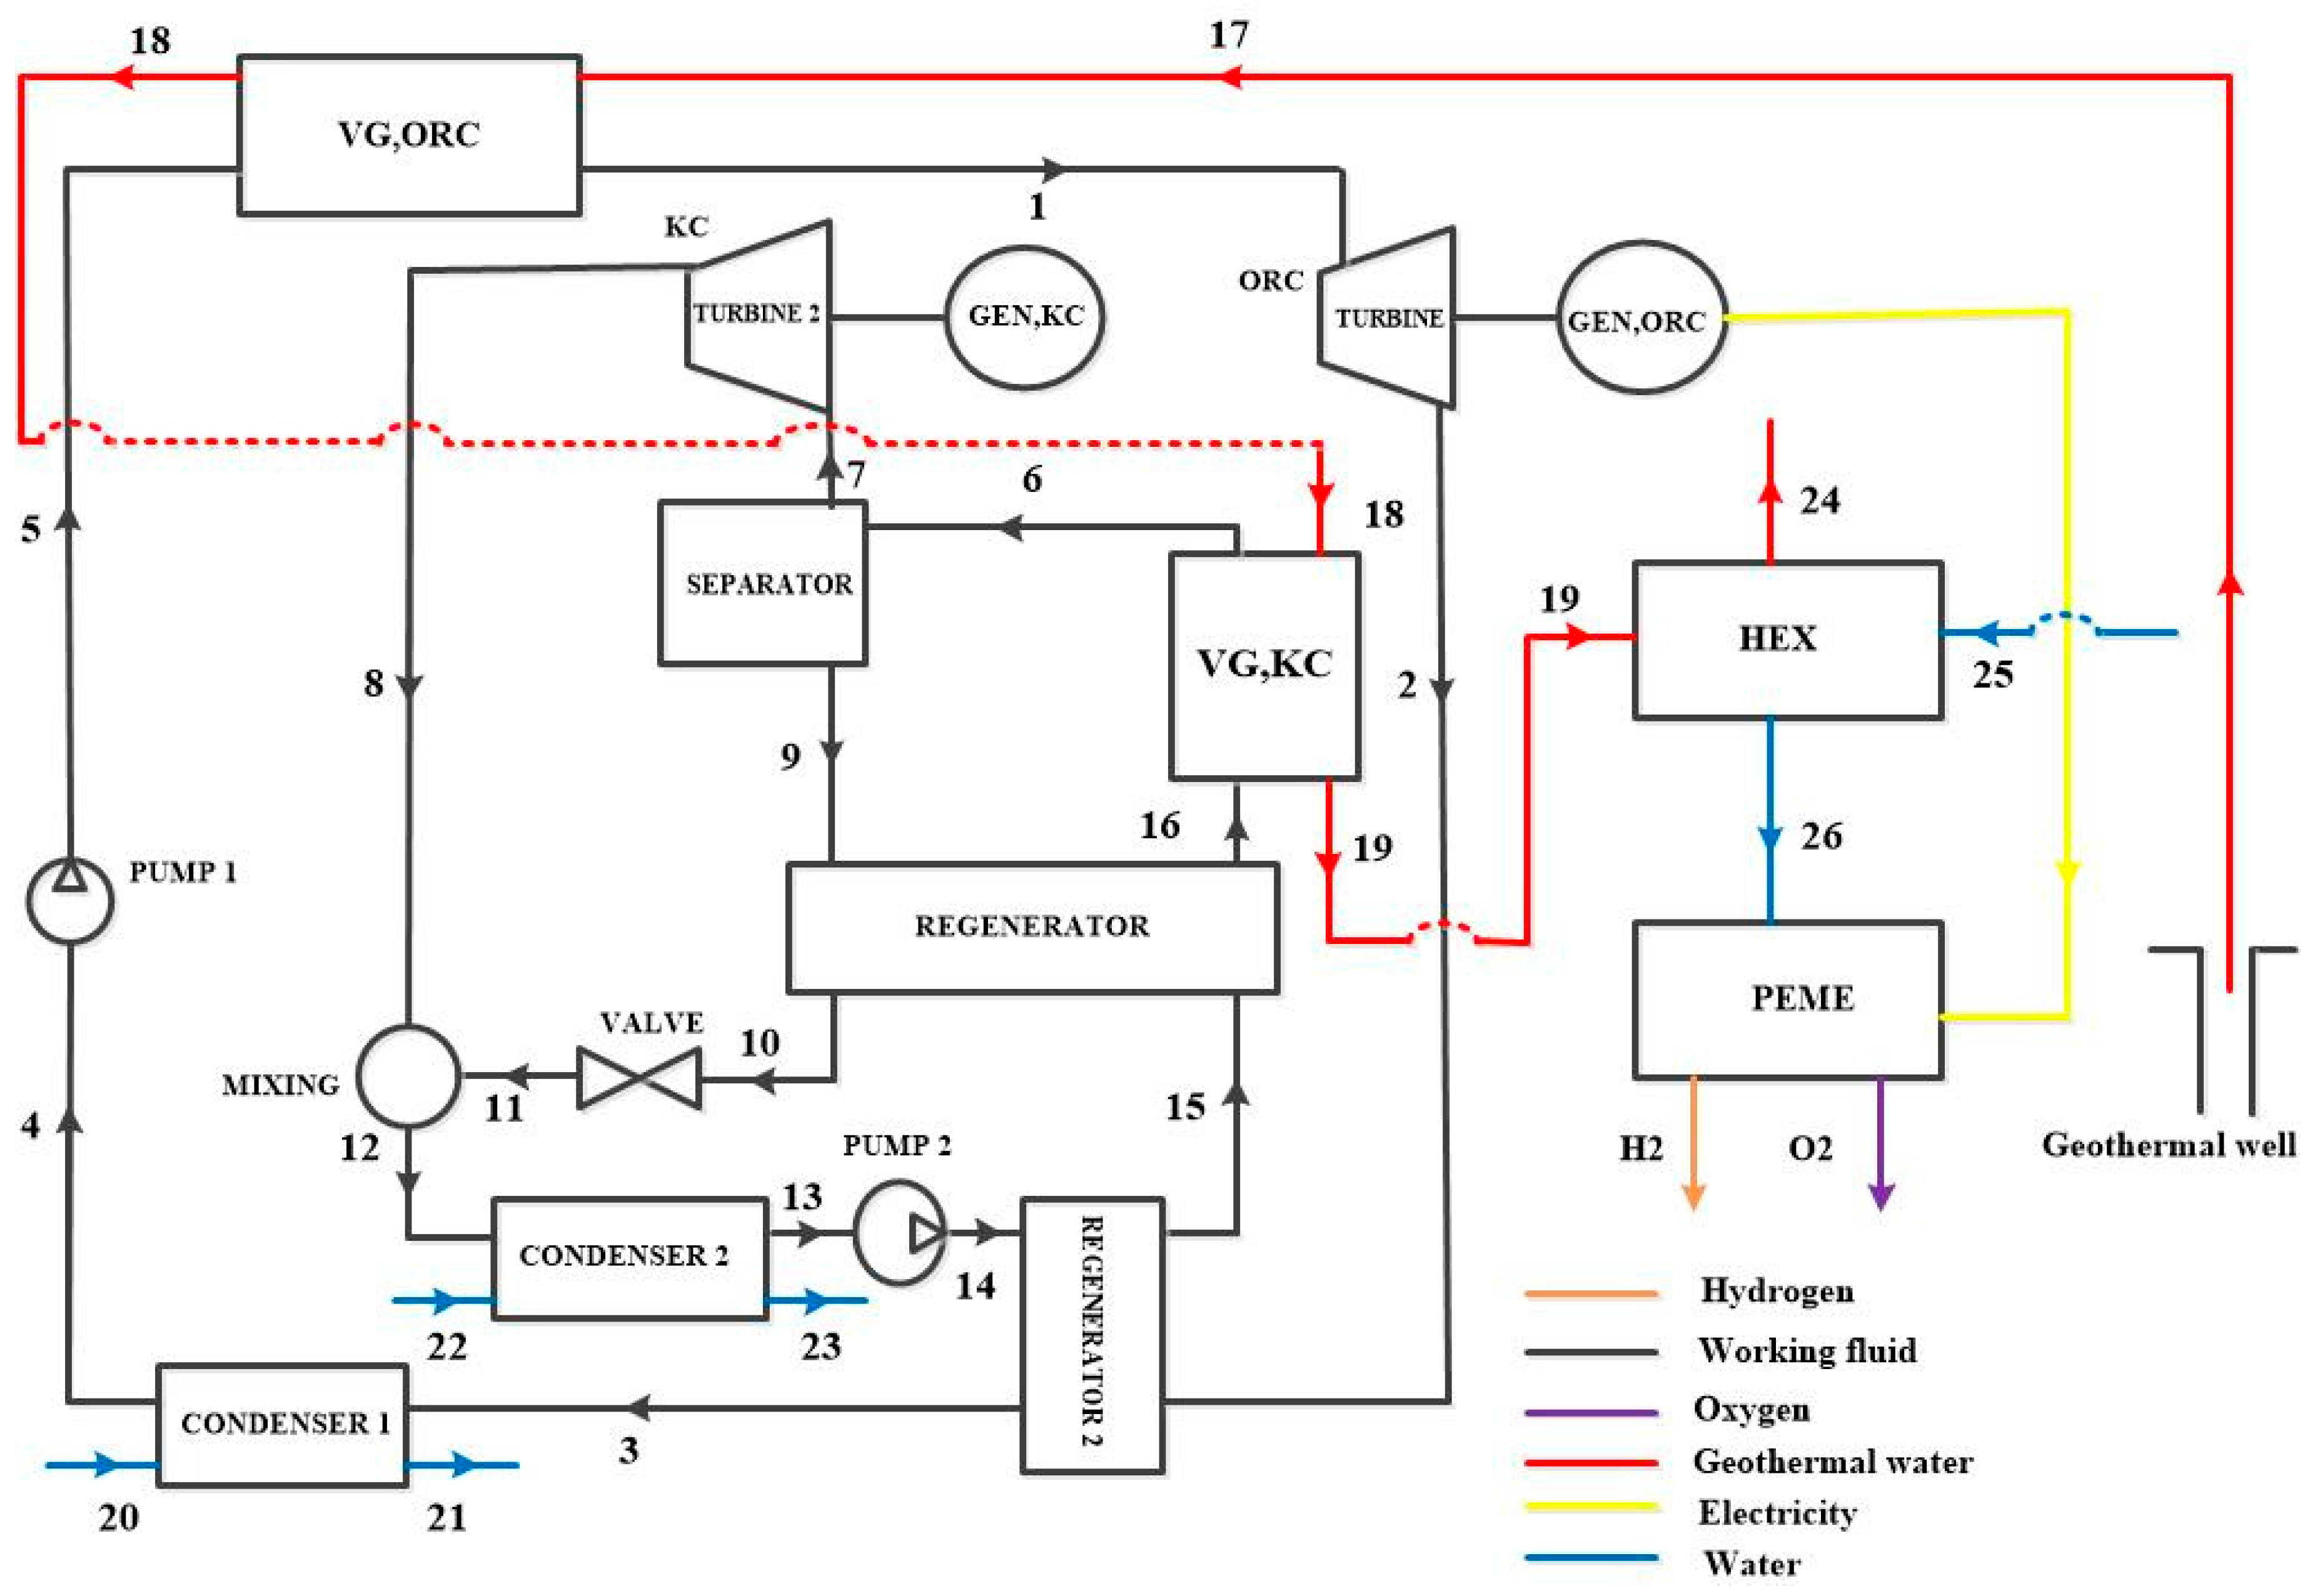
Figure 4.
Effect of geothermal temperature on: A. Net power, B. Hydrogen production, C. Thermal efficiency, C. Exergy efficiency.
Figure 4.
Effect of geothermal temperature on: A. Net power, B. Hydrogen production, C. Thermal efficiency, C. Exergy efficiency.
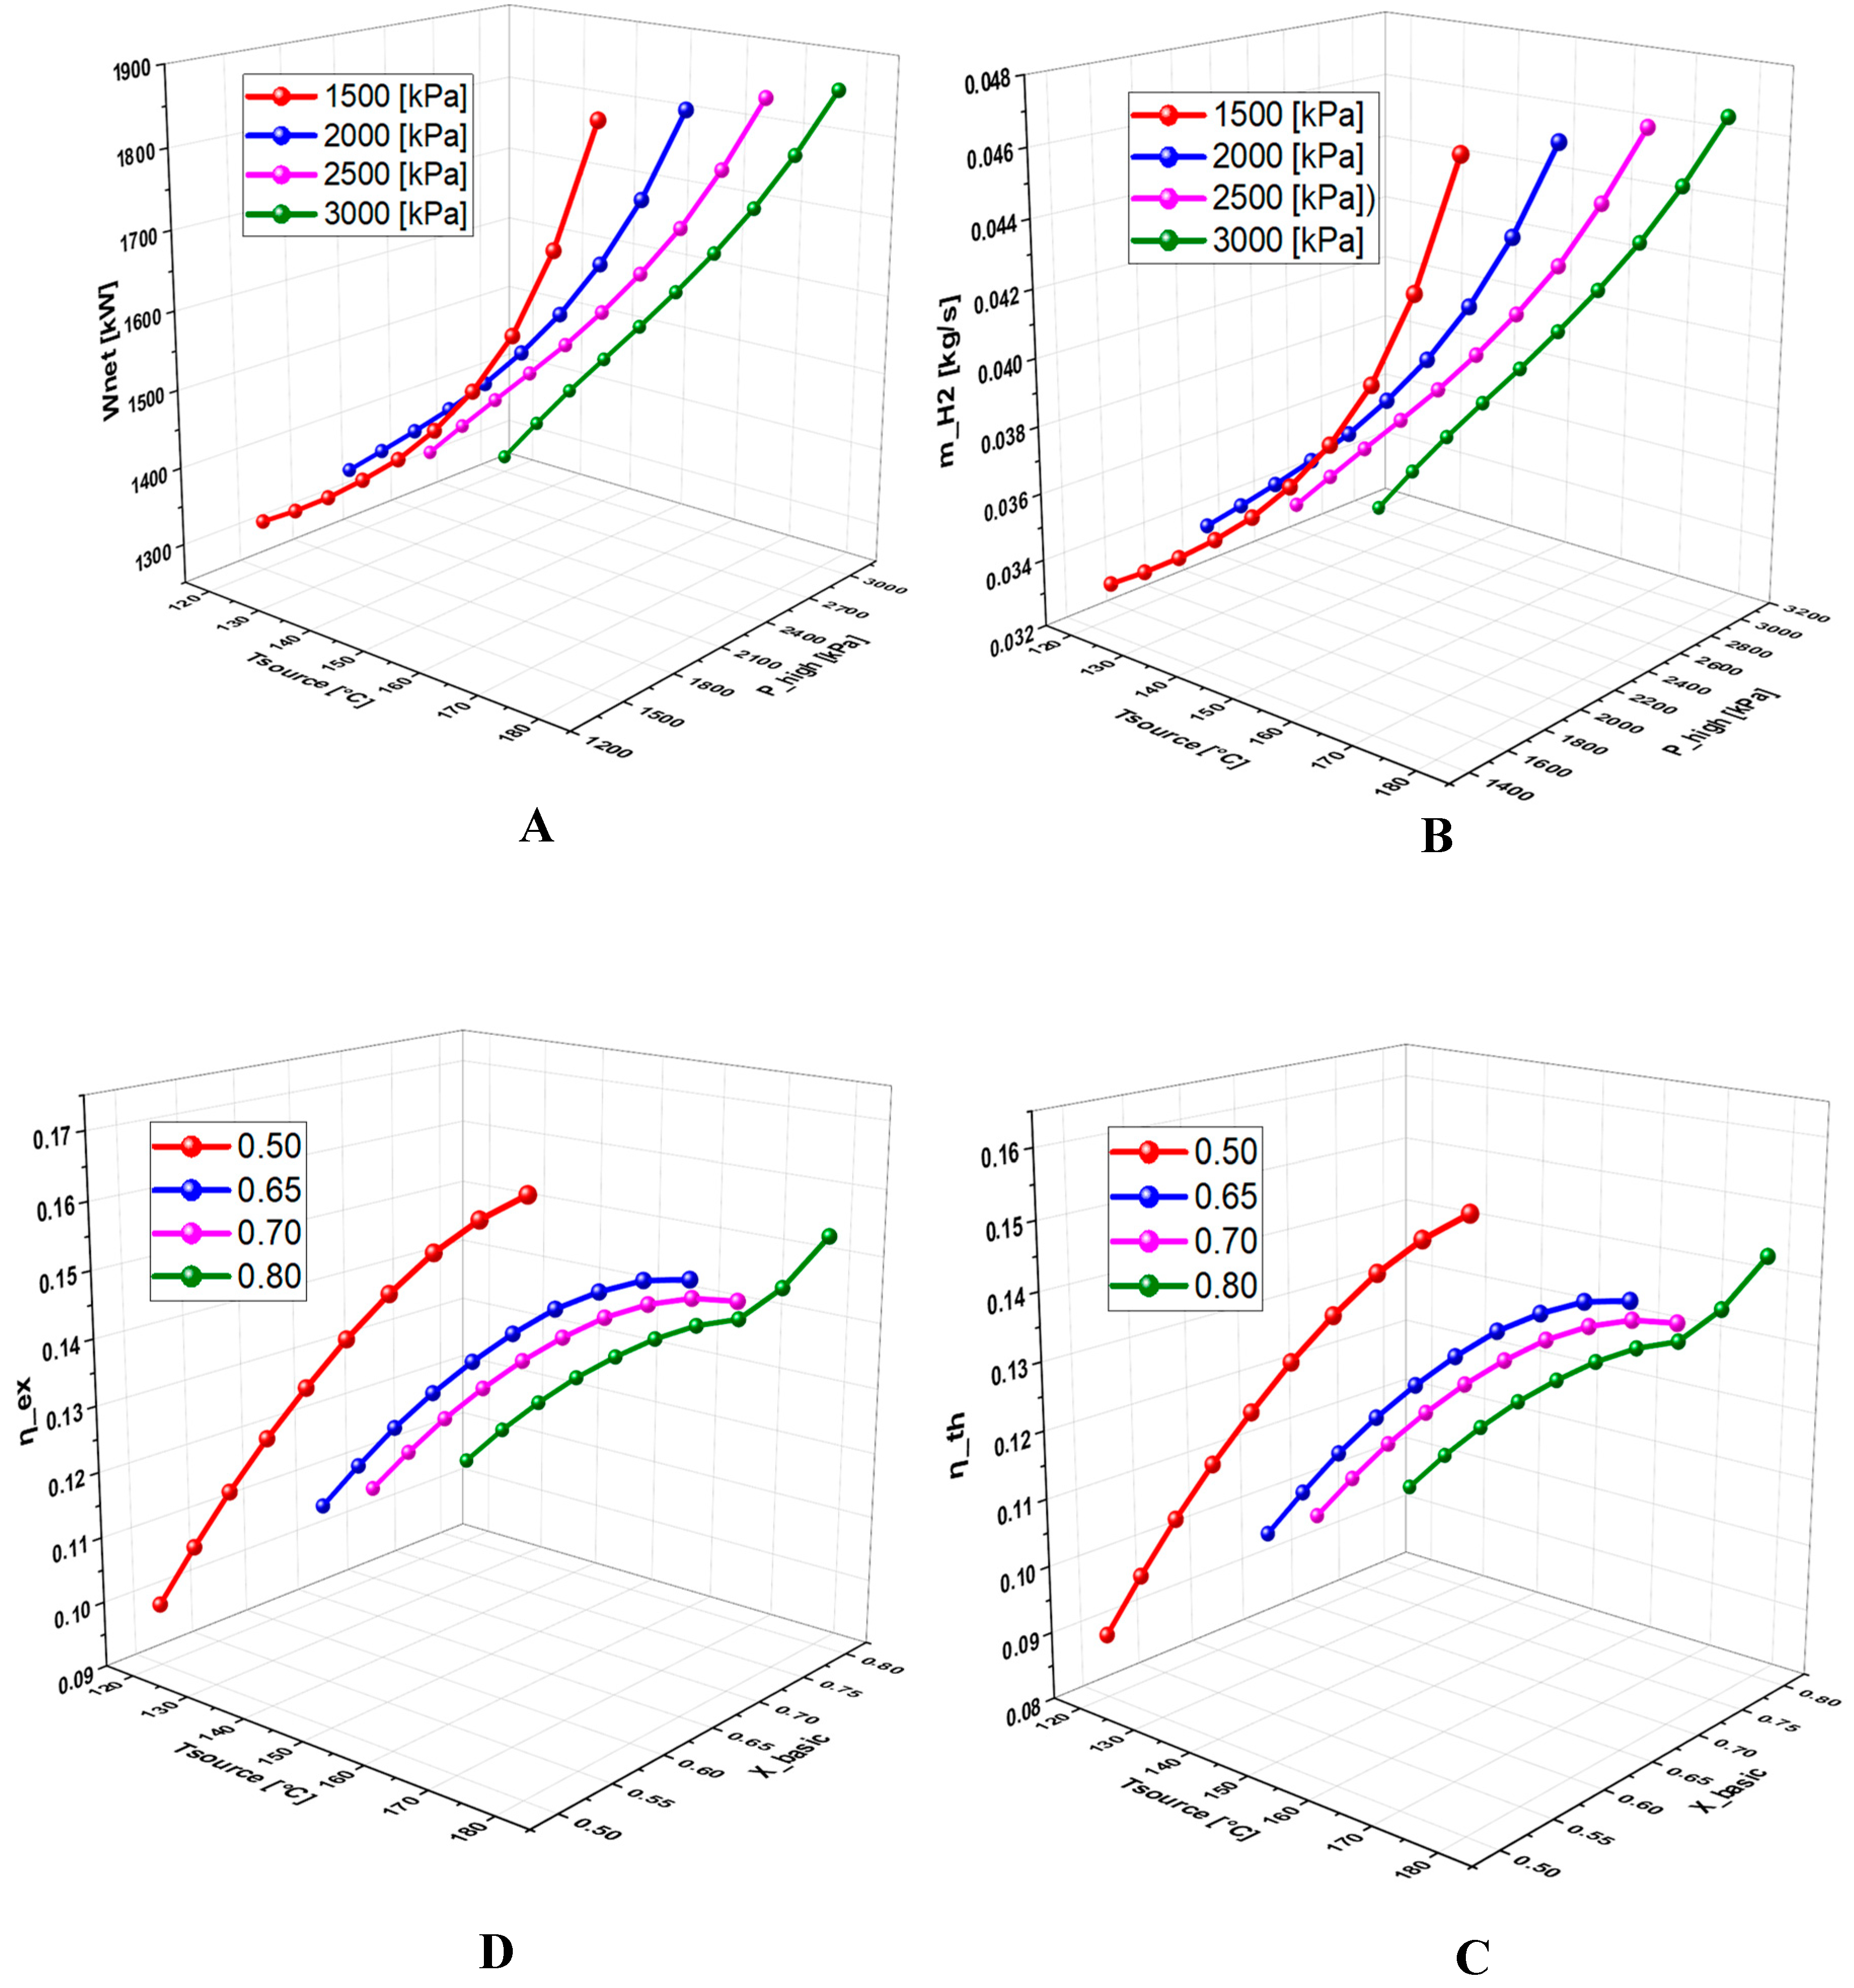
Figure 5.
Effect of high pressure on: A. Net power, B. Hydrogen production, C. Net power D. Thermal efficiency.
Figure 5.
Effect of high pressure on: A. Net power, B. Hydrogen production, C. Net power D. Thermal efficiency.
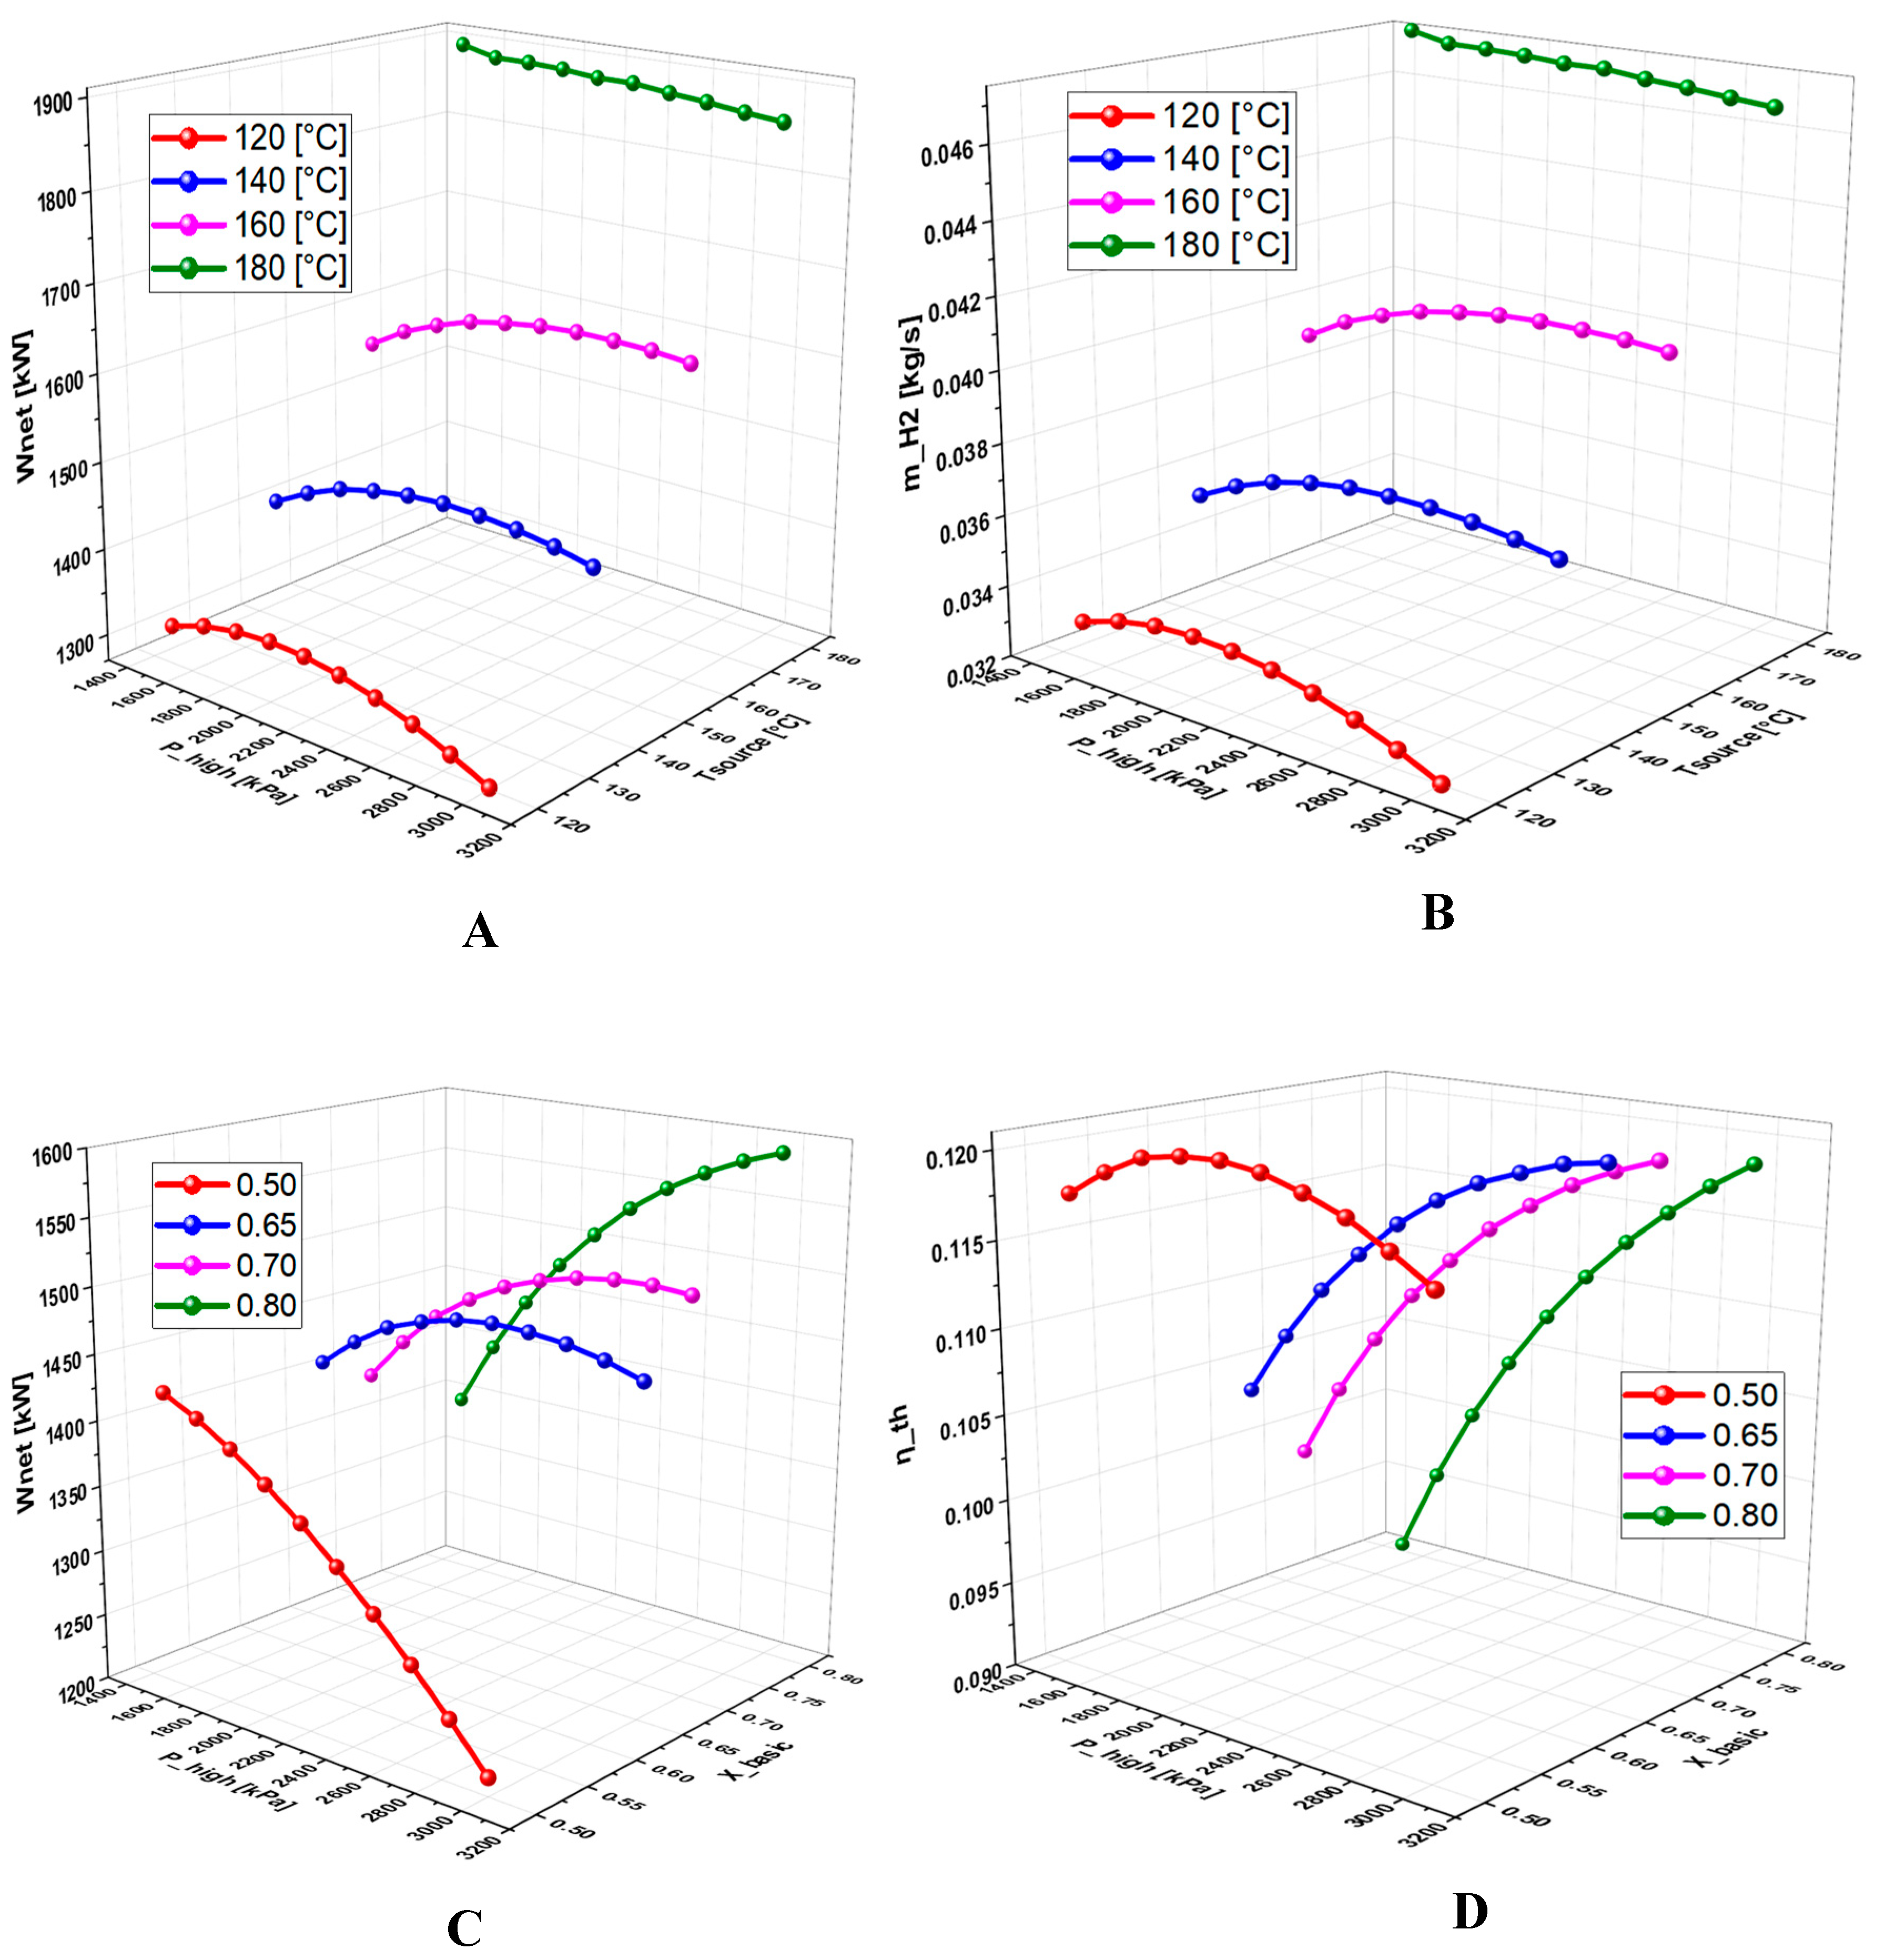
Figure 6.
Effect of basic concentration on: A. Net power, B. Hydrogen production, C. Hydrogen production, D. Thermal efficiency, E. Exergy efficiency.
Figure 6.
Effect of basic concentration on: A. Net power, B. Hydrogen production, C. Hydrogen production, D. Thermal efficiency, E. Exergy efficiency.
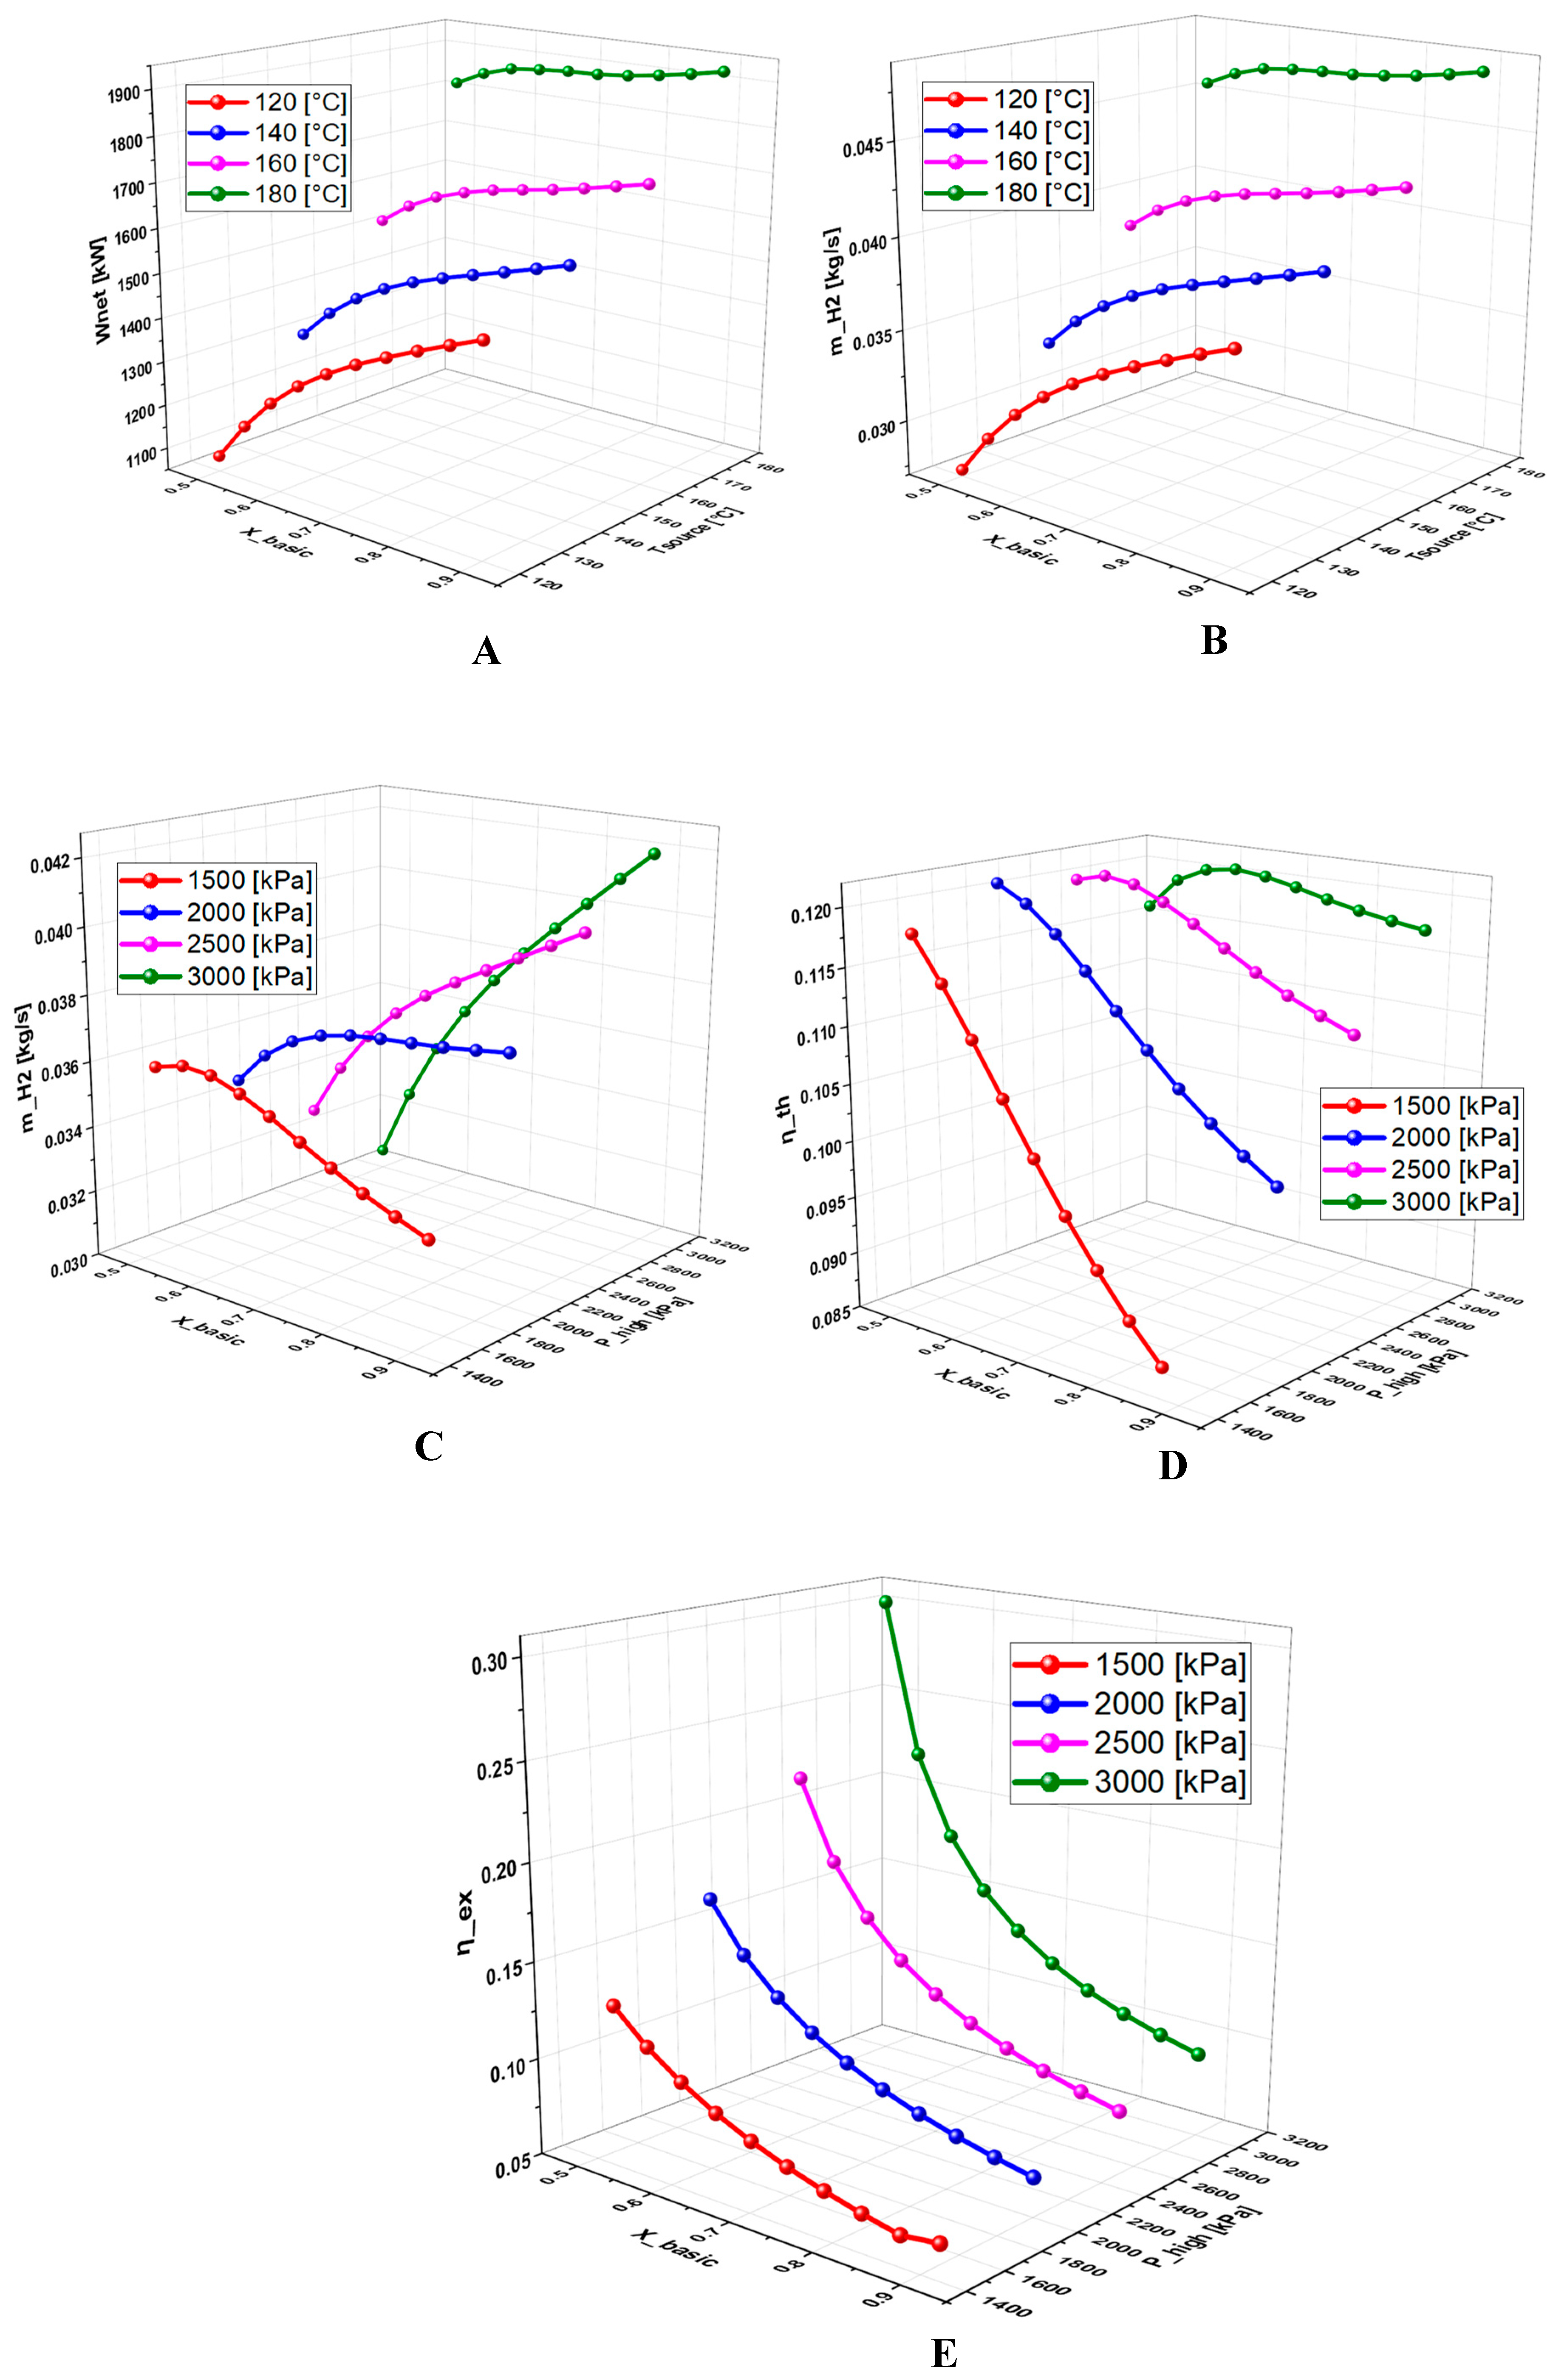
Figure 7.
Effect of terminal temperature difference on: A. Net power, B. Hydrogen production, C. Hydrogen production, D. Thermal efficiency, E. Exergy efficiency.
Figure 7.
Effect of terminal temperature difference on: A. Net power, B. Hydrogen production, C. Hydrogen production, D. Thermal efficiency, E. Exergy efficiency.
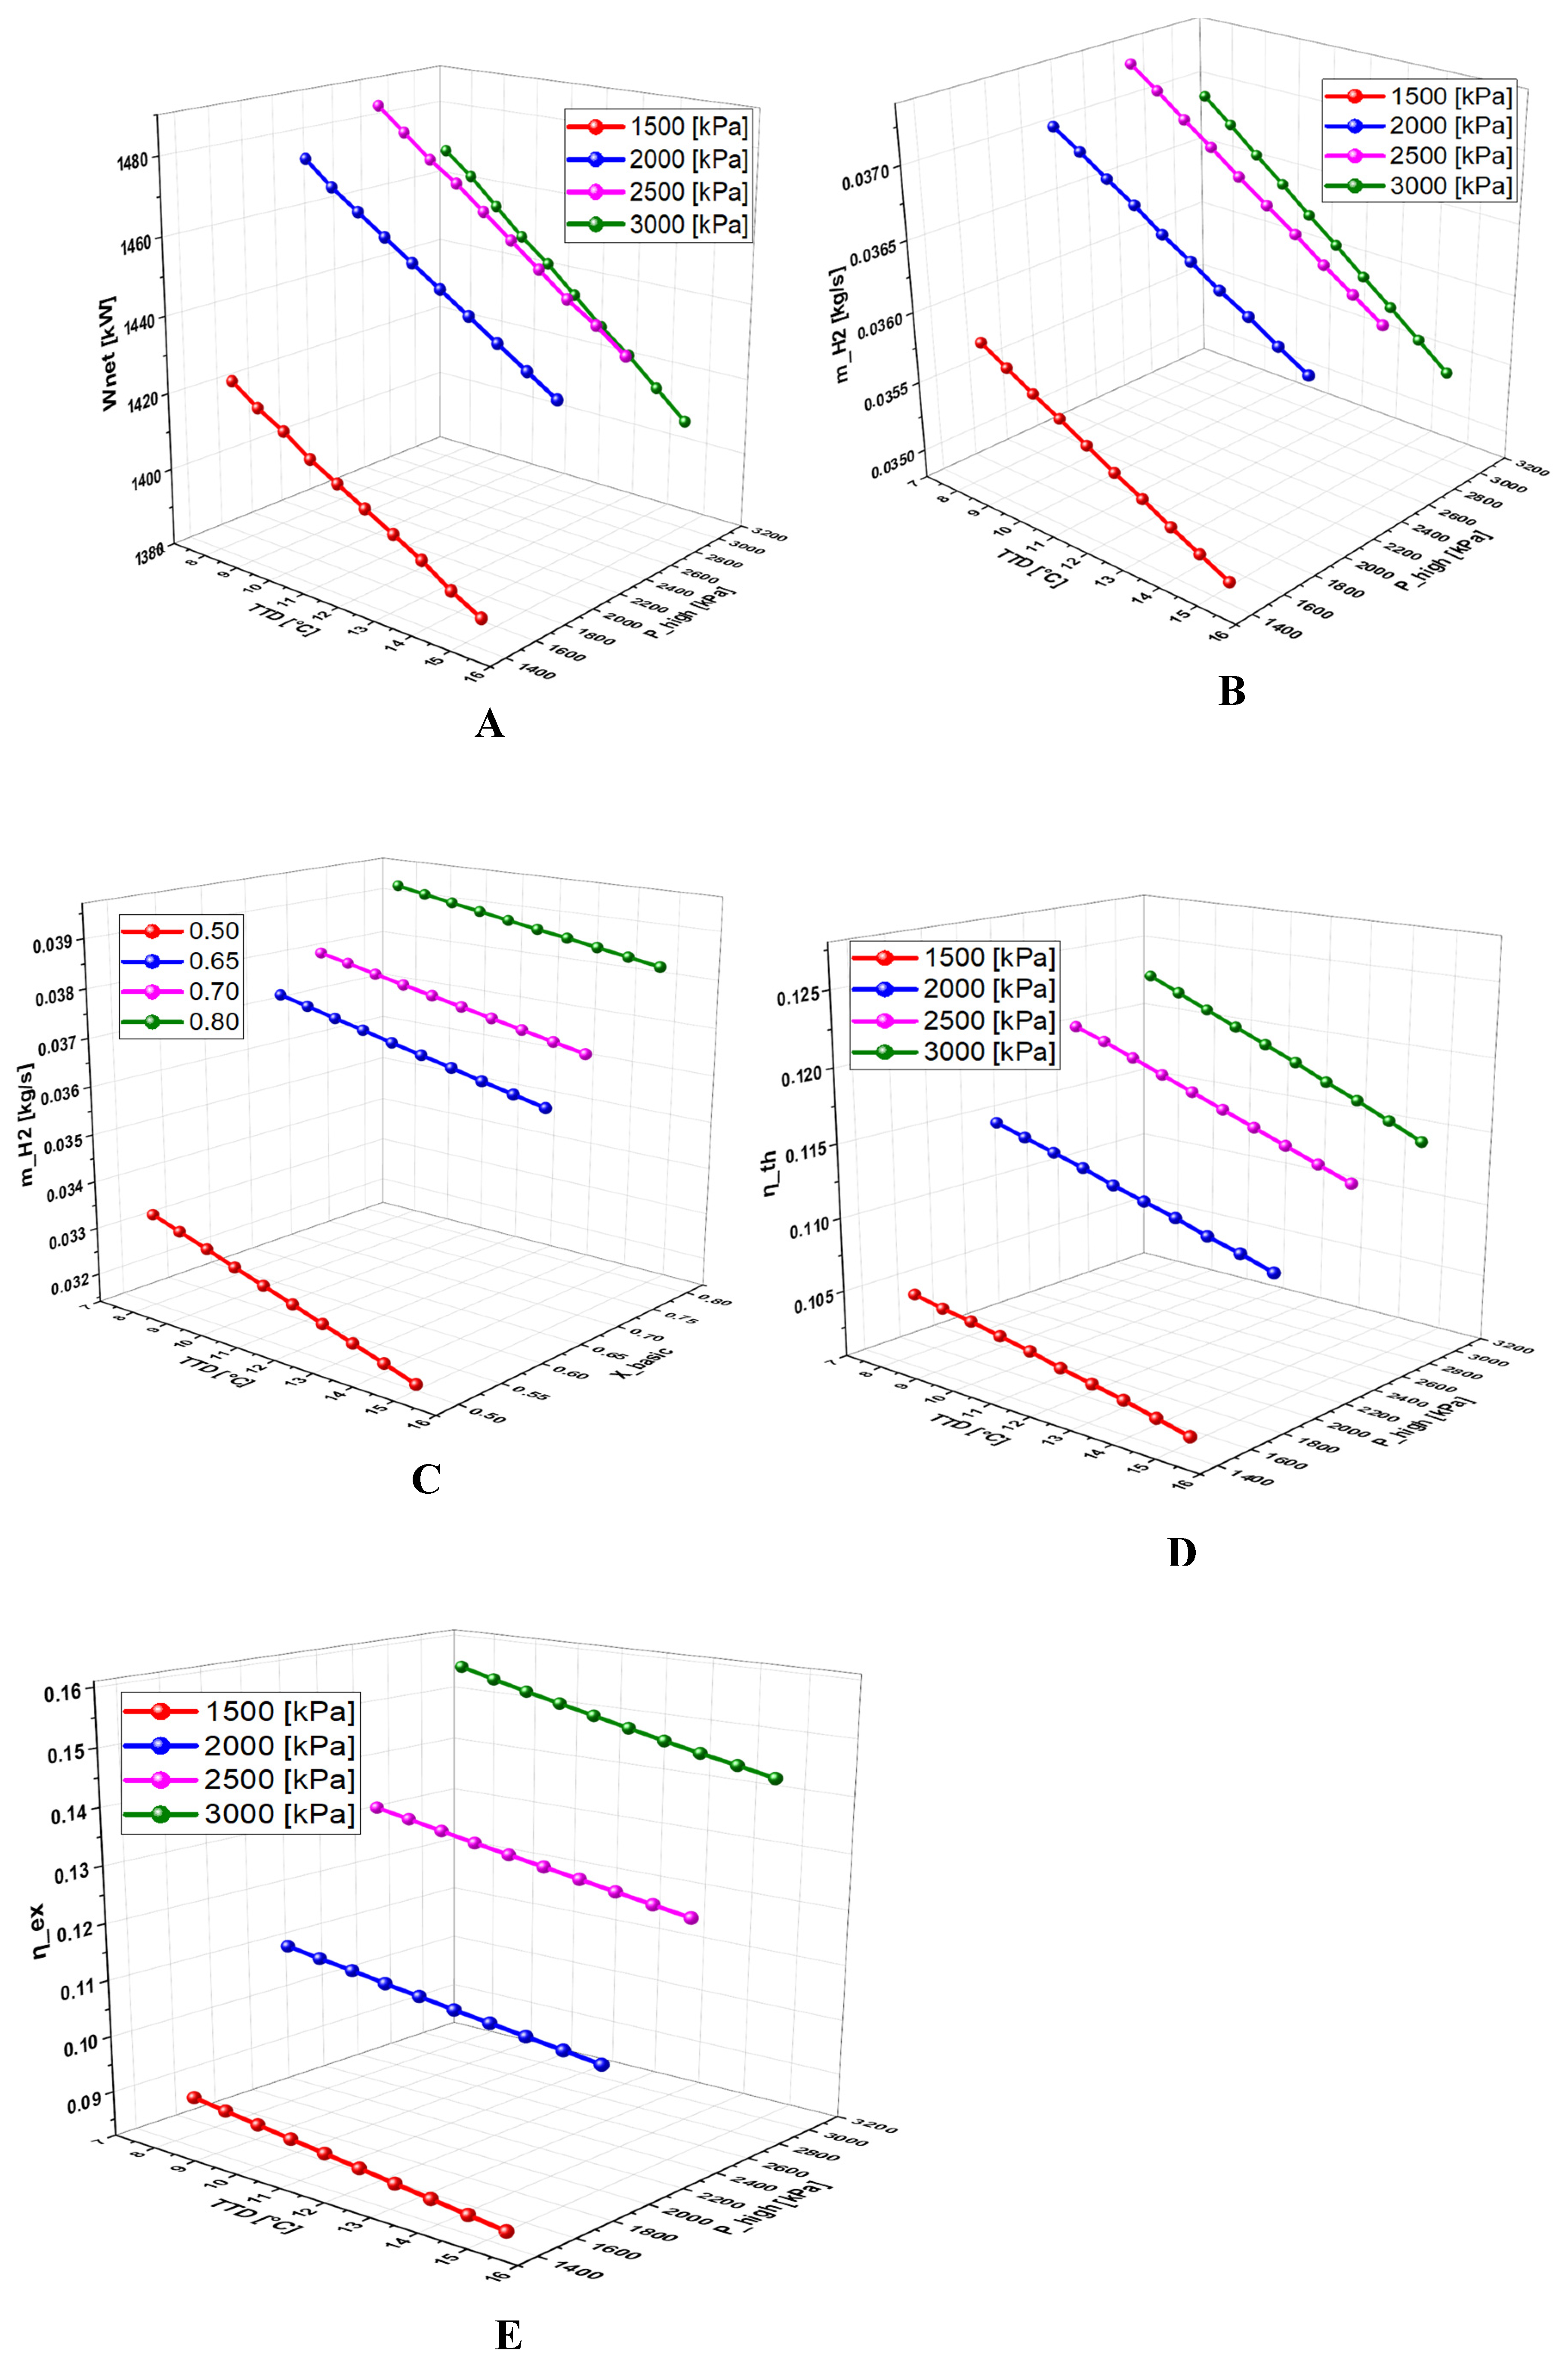
Table 2.
Some DRC potential geothermal sites by well temperature and depth.
| Reference | Sites | Temperatures [°C] | Depth [m] |
|---|---|---|---|
| Kankule [38] | Kankule 1 | 90-203 | 1019,21-3514,15 |
| Upemba-Moero-Tanganyika [37] | Tanganyika | 40-50 | |
| Upemba | 70-100 | ||
| Kivu-Edouard [37] | Kivu-Edouard | 20-100 | |
| Rwenzori [37] | Soixante sites | 20-100 | |
| Virunga [37] | Mayi-ya- Moto | 96 | |
| Kahuzi Biega Ruzizi [37] | Nyangezi | 40 | |
| Uvira | 44 |
| Working fluids | Molar mass [kg/kmol] |
[°C] |
[Bar] |
ODP | GWP [100/yr] |
ASHRAE |
| R236fa | 152.04 | 124.85 | 32 | 0 | 6300 | - |
| MD2M | 310.7 | 326.3 | 11.44 | 0 | 1 | A1 |
| ISOBUTANE | 58.13 | 134.66 | 36.29 | 0 | 20 | A3 |
| R152a | 66.05 | 113..30 | 45.2 | 0 | 12.4 | A2 |
| ISOBUTENE | 56.13 | 144.7 | 40 | - | 3 | - |
Table 4.
Other thermodynamic input parameters.
| Parameters | Value | Unit |
| Reference temperature, T0 | 25 | °C |
| Reference pressure, P0 | 101.3 | kPa |
| Geothermal inlet temperature, T_source | 140 | °C |
| Geothermal water mass flow rate, m_geo | 100 | kg/s |
| Terminal temperature difference, TTD | 10 | °C |
| Basic ammonia mass fraction, Xbasic | 65 | % |
| Regenerators effectiveness 1 and 2, εReg | 95 | % |
| High pressure, P_high | 2500 | kPa |
| Turbines isentropic efficiency, ηTur | 87 | % |
| Pumps isentropic efficiency, ηPump | 75 | % |
| Temperature of condenser 1 | 30 | °C |
| Exchanger, Hex | 80 | % |
| Basic mixture mass flow rate, m_basic | 5 | kg/s |
| Anode activation energy, Eacta | 76 | (kJ/kg) |
| Cathode activation energy, Eactc | 18 | (kJ/kg) |
| Anode pre-exponential factor, Jre,a | 1.7×10⁵ | (A/m2) |
| Cathode pre-exponential factor, Jref,c | 4.6×10³ | (A/m2) |
| Faraday constant, F | 96,486 | (C/mol) |
Table 5.
Thermodynamic balance (energy and exergy) equations for poly-generation system.
| Components | First Low Equations | Second Low Equations |
| Vapor generator, KC | ||
| Vapor generator, ORC | ||
|
Separator |
|
|
|
Turbine, ORC |
|
|
| Turbine, KC | ||
|
Pump 1 |
|
|
| Pump 2 | ||
|
Regenerator |
|
|
|
Regenerator 2 |
||
| Valve 1 | ||
|
Mixer 1 |
|
|
|
Condenser 1 |
||
|
Condenser 2 |
||
|
HEX |
Table 6.
Genetic algorithm responsible parameters[54].
Table 6.
Genetic algorithm responsible parameters[54].
| Parameters | Values |
| Individuals number in the population | 32 |
| Number of generations | 64 |
| Maximum mutation rate | 0.25 |
| Minimum mutation rate | 0.0005 |
| Initial mutation rate | 0.25 |
| Crossover probability | 0.85 |
Table 7.
The ranges of decision variables.
| Decision variable | Range |
| TTD (°C) | 8-15 |
| 0.50-0.90 | |
| (kPa) | 1500-3000 |
| (°C) | 120-180 |
Table 8.
ORC validation [55].
Table 8.
ORC validation [55].
| state | Temperature [°C] | Pressure [kPa] | Enthalpy [kJ/kg] | Entropy[kJ/kgK] | ||||
| Reference | Study | Reference | Study | Reference | Study | Reference | Study | |
| 1 | 145 | 145 | 1129.81 | 1130 | 531.84 | 531.8 | 1.943 | 1.943 |
| 2 | 98.9 | 98.71 | 177.79 | 177.2 | 494.03 | 494 | 1.954 | 1.954 |
| 3 | 47.50 | 47.48 | 177.79 | 177.3 | 443.38 | 443.4 | 1.808 | 1.808 |
| 4 | 30 | 30 | 177.79 | 177.4 | 239.10 | 239.1 | 1.135 | 1.135 |
| 5 | 30.40 | 30.4 | 1129.81 | 1130 | 239.90 | 239.9 | 1.136 | 1.136 |
| 6 | 69.54 | 67.13 | 1129.81 | 1130 | 290.94 | 290.5 | 1.303 | 1.293 |
| Wnet [kW] | 3810 | 3947 | ||||||
| Thermal efficiency | 0.1508 | 0.1536 | ||||||
Table 9.
Validation of KCS[56].
Table 9.
Validation of KCS[56].
| PRESSURE [kPa] | TEMPERATURE [K] | AMMONIA CONCENTRATION | |||||||
| N° | Present work | Reference | Relative error [%] | Present work | Reference | Relative error [%] | Present work | Reference | Relative error [%] |
| 1 | 4919 | 4919 | 0 | 433.2 | 433.15 | 0.012 | 0.6299 | 0.6299 | 0 |
| 2 | 4919 | 4919 | 0 | 433.2 | 433.15 | 0.012 | 0.9094 | 0.9094 | 0 |
| 3 | 4919 | 4919 | 0 | 433.2 | 433.15 | 0.012 | 0.4269 | 0.4269 | 0 |
| 4 | 4919 | 4919 | 0 | 319 | 319.07 | -0.002 | 0.4269 | 0.4269 | 0 |
| 5 | 823.2 | 823 | 0.024 | 319.8 | 319.81 | -0.003 | 0.4269 | 0.4269 | 0 |
| 6 | 823.2 | 823 | 0.024 | 352.3 | 356.54 | -1.189 | 0.9094 | 0.9094 | 0 |
| 7 | 823.2 | 823 | 0.024 | 342.2 | 342.16 | 0.012 | 0.6299 | 0.6299 | 0 |
| 8 | 823.2 | 823 | 0.024 | 312.1 | 312.1 | 0 | 0.6299 | 0.6299 | 0 |
| 9 | 4919 | 4919 | 0 | 313 | 313.06 | -0.019 | 0.6299 | 0.6299 | 0 |
| 10 | 4919 | 4919 | 0 | 378.7 | 378.69 | 0.003 | 0.6299 | 0.6299 | 0 |
| Present work | Reference | Relative error [%] | |||||||
| Thermal efficiency | 0.1353 | 0.1352 | 0.07396 | ||||||
Table 10.
Validation of PEME [45].
Table 10.
Validation of PEME [45].
| Parameters | Present work | Reference |
| Current density [A/m2] | 5000 | 5000 |
| Water primary temperature [°C] | 25 | 25 |
| Electrolyzer temperature [°C] | 80 | 80 |
| Net power [kW] | 29421 | 29421 |
| Hydrogen production [kg/s] | 0.0940 | 0.0940 |
Table 11.
Thermodynamic evaluation results obtained from the simulation.
| Working fluids | Wnet [kW] | [kg/s] | ||
|---|---|---|---|---|
| NH3H2O - MD2M | 1470 | 0.03697 | 0.1184 | 0.1258 |
| NH3H2O - R236fa | 1469 | 0.03696 | 0.1332 | 0.1269 |
| NH3H2O - R152a | 1467 | 0.03689 | 0.1186 | 0.1261 |
| NH3H2O - ISOBUTANE | 1465 | 0.03685 | 0.1371 | 0.1258 |
| NH3H2O - ISOBUTENE | 1465 | 0.03684 | 0.1434 | 0.1253 |
Table 12.
Thermodynamic evaluation results obtained after simulation.
| Outputs | Values |
|---|---|
| Net power, Wnet | 1470 [kW] |
| Hydrogen production, | 0.03697 [kg/s] |
| Energy efficiency, | 0.11184 |
| Exergy efficiency, | 0.1258 |
| PEME efficiency, | 0.2643 |
| System efficiency, | 0.213 |
Table 13a.
Optimization results of different combinations.
| Working fluids | Wnet [kW] | [kg/s] | ||
| NH3H2O - MD2M | 1760 | 0.04415 | 0.1658 | 0.2477 |
| NH3H2O - R236fa | 1738 | 0.04361 | 0.1575 | 0.2558 |
| NH3H2O - R152a | 2016 | 0.05049 | 0.1502 | 0.252 |
| NH3H2O - ISOBUTANE | 1744 | 0.04377 | 0.1626 | 0.2583 |
| NH3H2O - ISOBUTENE | 1734 | 0.04353 | 0.1713 | 0.2522 |
Table 13b.
Optimization results of different combinations.
| Terms | Base | Optimum |
| Temperature source [°C] | 180 | 180 |
| Terminal temperature difference [°C] | 10 | 8.039 |
| High pression [kPa] | 2500 | 2981 |
| Ammonia concentration (X_basic) | 0.65 | 0.8997 |
| Net power, Wnet [kW] | 1868 | 2016 |
| Hydrogen production, [kg/s] | 0.04683 | 0.05049 |
| Energy efficiency, | 0.1234 | 0.1502 |
| Exergy efficiency, | 0.2007 | 0.250 |
| System efficiency, | 0.215 | 0.2272 |
Disclaimer/Publisher’s Note: The statements, opinions and data contained in all publications are solely those of the individual author(s) and contributor(s) and not of MDPI and/or the editor(s). MDPI and/or the editor(s) disclaim responsibility for any injury to people or property resulting from any ideas, methods, instructions or products referred to in the content. |
© 2025 by the authors. Licensee MDPI, Basel, Switzerland. This article is an open access article distributed under the terms and conditions of the Creative Commons Attribution (CC BY) license (http://creativecommons.org/licenses/by/4.0/).
Copyright: This open access article is published under a Creative Commons CC BY 4.0 license, which permit the free download, distribution, and reuse, provided that the author and preprint are cited in any reuse.


