
Submitted:
09 May 2025
Posted:
12 May 2025
You are already at the latest version
Abstract
This study aims to develop a forecasting model for the evolution of entrepreneurship in the transport sector within European mountainous regions, by employing time series data and advanced statistical models. The forecasting analysis is based on an extensive set of 28 indicators (I1–I28), extracted from the Eurostat database, which reflect the dynamics of business births and deaths, survival rates, employment structure, and the pace of business growth. The research focuses on 15 European countries with relevant mountain areas, applying ARIMA-type models to assess the predictive capacity of the selected indicators.The findings highlight increased volatility in entrepreneurial activity, influenced by factors such as limited infrastructure, economic seasonality, and geographic isolation. Although the accuracy of the models varies, they allow for the identification of relevant trends and significant regional disparities. The study emphasizes that newly established enterprises, although small in size, play a key role in employment dynamics, while regions with more developed infrastructure tend to display better entrepreneurial performance. Therefore, the article provides a valuable empirical foundation for shaping public policy in European mountain regions.
Keywords:
European transport
; Mountain entrepreneurship
; Mountain forecasting
1. Introduction and Literature Review
Transportation represents a crucial factor underpinning the development of mountain areas (Price et al., 2004), as it facilitates interconnection with nearby downstream regions where the population is predominantly concentrated. The specific geomorphological characteristics of mountain areas—such as high altitudes, steep slopes, unstable terrain, and harsh climate—impose significant technical and economic constraints on the planning, construction, and maintenance of transport infrastructure. Consequently, specialized engineering solutions are required, including the construction of viaducts, tunnels, retaining walls, and protective systems against natural hazards (e.g., landslides, avalanches, rockfalls), alongside the imperative to preserve fragile ecosystems (Banister, 2008).
Transport modes adapted to mountainous regions—such as cable cars, suspension bridges, and aerial transport—can provide access where roads and railways are impractical (Giuliani & Scudellari, 2017). Since ancient times, transit routes have existed across mountains, often relying on traditional forms of mobility such as pack animals, which remain effective in challenging terrain. Today, modern access is often achieved using all-terrain vehicles (ATVs) in hard-to-reach locations. However, this practice raises concerns regarding air and noise pollution (Martín-Cejas, 2015). In contrast, animal-powered transport offers a renewable energy source; draught animals are integrated into local production systems—they reproduce naturally, feed on local resources and produce organic fertilizer vital for sustaining alpine flora (Starkey, 2001).
The advent of industrialization created the need to transport large quantities of goods and adopt modern means of transportation, which also improved access to education and healthcare (Seimon, 2001; UNWTO, 2020). In the current context of sustainable development and growing interest in ecological tourism, it is imperative to implement innovative and sustainable mobility solutions that meet transport demands without compromising the integrity of natural ecosystems (Macário, 2014).
Future strategies should aim to expand environmentally friendly transport networks—so-called “green networks”—particularly given the disproportionately negative environmental impact of private road transport (Wang, 2019; Martín-Cejas, 2015; Miller, 2008). Coordinating mobility with local activity needs through the deployment of smaller hybrid or electric buses (equipped to accommodate persons with disabilities) would benefit both tourists and residents. These services should operate frequently along key routes throughout the day, ensuring that both local and tourist activities are supported with the same level of flexibility currently offered by private vehicles (Scuttari et al., 2013).
Cable transport systems, such as gondolas and funiculars, provide an efficient mobility solution in remote mountainous areas, exerting minimal pressure on soil and vegetation. Widely adopted in European alpine regions, they contribute to decongesting road traffic and preserving the natural landscape (Teshome et al., 2024). Another viable solution lies in implementing smart mobility systems, integrating digital applications for route planning, optimizing public transportation, and promoting shared mobility. Through the use of artificial intelligence and sensor networks, authorities can efficiently manage traffic flows and respond in real time to weather conditions or emergencies.
Additionally, the development of interconnected pedestrian trails and electric bicycle paths serves as an important complementary measure, supporting active tourism and reducing reliance on conventional vehicles (McRae et al., 2019; Teshome et al., 2024). In mountain rescue operations, especially in rugged terrain, the use of drones has proven invaluable for conducting search missions and delivering emergency supplies (McRae et al., 2019; Tilburg, 2017).
In conclusion, the future of mountain transport must be rooted in clean technologies, geographically adapted infrastructure and public policies oriented toward sustainability (Munteanu & Vlăsceanu, 2016). Integrated approaches that combine technological innovation with environmental stewardship form the basis for effective and responsible mobility in mountainous regions.
2. Methodology
The semnification for the indicators in the article can be found in Eurostat or at the link [https://doi.org/10.5281/zenodo.14713867]. The inspected countries are Portugal, Austria, Slovenia, Romania, Spain, Bulgaria, Poland, France, Sweden, Germany, Slovakia, Greece, Croatia, Italy, Czech Republic. Data were gathered from Eurostat and handled by the authors in SPSS and Excel.
The primary objective of this research is to forecast the evolution of entrepreneurship in the transport sector within European mountainous regions, using a comprehensive set of statistical indicators that reflect the dynamics of businesses and labor force participation. The study specifically aims to analyze the historical behavior of these indicators, as well as assess their capacity to contribute to modeling future development scenarios.
The data encompasses a wide range of relevant indicators for entrepreneurial activity in the transport sector. The data was processed using SPSS and Microsoft Excel applications, undergoing a rigorous cleaning, validation, and structuring process to prepare it for use in forecasting statistical models.
The dataset includes 28 indicators (I1–I28), of which the first 17 (I1–I17) address fundamental aspects of entrepreneurial activity, such as the total number of businesses (I1), the number of newly established businesses (I2), their size (I3), survival rates (I7–I9), as well as the dynamics of employment in newly established or closed businesses (I4, I5, I16, I17). Indicators I18–I28 extend the analysis to include the share of employment in new or closed businesses, growth in employment within businesses aged three years, and other indicators derived from workforce structure.
The processing was performed on two main sets of indicators, corresponding to groups I1–I17 and I18–I28. Each group was analyzed separately, focusing on the consistency of the models and the accuracy of the predictions.
The forecasts were made using ARIMA (Autoregressive Integrated Moving Average) models, adapted for each individual indicator. These models are suitable for time series analysis, enabling the capture of trends and seasonality from historical data.
The performance of each model was evaluated using the following adjustment indicators: R-squared, Stationary R-squared, RMSE, MAPE, MaxAPE, MAE, and Normalized BIC (as seen in Table 1 and Figure 1).
- Models for indicators I1–I17
The average values of the performance indicators for this group show significant variability in the quality of the fit, as follows:
- Stationary R-squared has an average value of 0.026, with a minimum of -3.775, signaling insignificant instability in some models.
- R-squared is even negative (-0.003), suggesting that, in some cases, the ARIMA model failed to explain data variation better than a constant line.
- RMSE and MAE have high average values (12,298.29 and 8,300.88, respectively), confirming the dispersion of values around the prediction.
- MAPE records an extremely high average value (609.59), indicating low accuracy in relative error expression, especially for indicators with low values.
- Normalized BIC has an average value of 10.08, which may indicate a reasonable trade-off between complexity and accuracy for some models.
- Models for indicators I18–I28
This second set of models seems to provide more stable results, as follows:
- Stationary R-squared increases slightly to 0.035, while R-squared becomes neutral (0.000), which, although not signaling exceptional performance, indicates a more balanced fit.
- The average RMSE remains similar (12,078.64), but the dispersion (SE = 36,324.13) is comparable to the first set.
- MAPE drops to 981.91, but it remains noticeably high, indicating the model’s difficulty in managing proportional errors for certain indicators.
- The average Normalized BIC is 10.27, very close to the value for the first group, signaling methodological consistency between the two sets.
3. Results
The analysis of the data concerning mountain entrepreneurship in the European transport sector has highlighted a series of significant trends, as presented in Table 1, Figure 1, and Figure 2. These results provide a comprehensive view of the dynamics of businesses, employment evolution, and the factors influencing the sustainability of businesses in this sector.
3.1. Evaluation of forecasting model quality
The analysis of the ARIMA models applied to the indicators I1–I28 revealed significant variations in the quality of the fits, reflecting the complexity and specificity of entrepreneurship in the transport sector within the European mountain regions. The dynamics in these areas are often influenced by seasonal factors, economic instability, difficult accessibility, and the lack of competitive transport infrastructure.
3.1.1. Results for the I1–I17 indicator set
This group includes fundamental indicators concerning business activity and associated labor force:
- Stationary R-squared, with an average of 0.026, indicates an incomplete capacity of the models to capture stationary trends in the data. However, in isolated cases, such as for I7 or I16, the higher positive values suggest some predictability regarding employment stability and business survival.
- A negative R-squared (average of -0.003) highlights the difficulty of reliably estimating the evolution of certain indicators in mountain areas, where economic activity is more fragmented and dependent on seasonality (e.g., winter tourism, seasonal freight transport).
- RMSE and MAE are high (averaging over 12,000 and 8,000, respectively), reflecting an unstable entrepreneurial environment where the opening and closing of businesses occur frequently depending on local contexts (e.g., road conditions, snowfall, regional infrastructure projects).
- MAPE over 600% confirms that the models become ineffective in accurately forecasting percentage indicators, such as I12 or I13, especially in regions with low activity, where small variations lead to large percentage effects.
- Normalized BIC (average of 10.08) suggests high model complexity for some indicators, yet with an acceptable penalty for overfitting.
3.1.2. Results for the I18–I28 indicator set
This group includes derived indicators, mainly focused on employment structure:
- A slight improvement in Stationary R-squared (average of 0.035) suggests that the models fit better for indicators describing the share of the workforce in new or surviving businesses. Thus, I18 or I23 offer a clearer representation of the direct contribution of new businesses to regional employment.
- MAPE remains high (981%), but is lower than in the first group, indicating somewhat higher predictability for structural indicators than for volume-based ones.
- MaxAE up to 292,010 shows that some models were profoundly affected by extreme values— a phenomenon frequently encountered in mountain regions where a single infrastructure project can create or eliminate hundreds of jobs.
3.2. Analysis of mountain entrepreneurship in the transport sector
The European mountain region has a unique entrepreneurial profile, marked by pronounced seasonality, challenging geography, and a high dependency on existing infrastructure. The transport sector is vital in this region, essential for both population mobility and serving economic activities (e.g., agritourism, forestry, local production).
3.2.1. Business birth and survival
The birth rate of businesses (I2) has shown a consistent increase in recent years, reflecting a favorable economic environment and business opportunities in the mountain sector. However, the growth rate varies significantly between regions, with alpine areas exhibiting the highest values, while other mountain regions lag behind.
Indicators I2 and I7 demonstrate that despite challenges, there is a constant flow of entrepreneurial initiatives. Nevertheless, the 3-year survival rate (I9) varies significantly, highlighting the vulnerability of new businesses to external shocks (e.g., weather conditions, lack of seasonal demand, limited access to markets).
The 3-year survival rate (I9) is approximately 60%, suggesting that the majority of newly established businesses manage to overcome the critical period. However, this figure decreases in areas with limited access to transport infrastructure, emphasizing the importance of connectivity for the sustainability of mountain businesses.
The business turnover rate (I12) stands at 10%, reflecting a healthy market dynamic, with new businesses replacing those exiting the market. However, this value is lower in isolated areas, where barriers to entry and exit are higher.
Indicators I13 and I14 indicate a high level of market volatility, with a tendency towards structural instability: many small businesses emerge but disappear just as quickly.
The mortality rate (I14) has remained relatively stable, indicating intense competition and potential difficulties in adapting to market changes. Mortality is more pronounced among small businesses, highlighting their vulnerability to economic fluctuations.
The net growth of the business population (I15) is positive (2% annually), but varies by region. Areas with well-developed transport infrastructure show higher growth, underscoring the need for investments in accessibility.
3.2.2. Employment and business size
Indicators I16 and I17 reveal a real contribution of entrepreneurship to employment, even though it is often of a small scale. The average size of newly established businesses (I3) is small, reflecting a micro-entrepreneurship model specific to mountain areas.
The number of people employed in newly established businesses (I17) increased by 12% over the last 5 years, reflecting a significant contribution of mountain entrepreneurship to job creation. However, the average size of newly established businesses (I3) remains small (fewer than 5 employees), which may limit the long-term economic impact.
The employment rate in newly established businesses (I18) is 5% of the total employees in the sector, while the share of employment in businesses that close (I22) is 3%. This shows a relatively balanced relationship between the creation and loss of jobs, but with a slight advantage for new businesses.
Indicators I18–I24 show that although new businesses contribute moderately to employment, they play an important role in ensuring the continuity of activities in isolated communities.
The share of employment in surviving businesses (I23) is 25%, indicating a solid contribution of these businesses to workforce participation. Moreover, businesses that survive for 3 years experience an average increase in employment of 15% (I24), suggesting gradual expansion after stabilizing.
3.2.3. Dynamics of high-growth firms
I10 and I11 highlight a paradoxical aspect: although few, high-growth firms exist and have potential. They most likely emerge in correlation with local development projects, European funds, or initiatives in mountain tourism and specialized transport (e.g., cable cars, freight transport for alpine shelters).
High-growth businesses (I10–I11) are observed in about 8% of active businesses, especially in regions with developed mountain tourism. This indicates an opportunity for supportive policies that stimulate innovation and the expansion of high-potential businesses.
ARIMA models provide limited utility in forecasting point values but can be effectively used to identify general trends and plan public policy scenarios in mountain regions.
The dynamics of mountain entrepreneurship are deeply dependent on local conditions, transport infrastructure, and support policies for SMEs. Econometric models must be supplemented with qualitative information (e.g., interviews, local surveys) for a complete understanding.
Targeted support for increasing the survival capacity of new businesses and reducing barriers to transport and market access could significantly contribute to stabilizing and developing the mountain entrepreneurial sector.
Forecast analysis results confirm the following:
- Supporting small businesses through funding and mentoring programs to reduce the mortality rate;
- Improving connectivity in isolated mountain areas to stimulate business birth rates and increase employment;
- Promoting innovation in the mountain transport sector to increase the number of high-growth businesses.
Mountain entrepreneurship in European transport is in a phase of moderate growth, with significant opportunities for improvement through policies tailored to regional needs. The results indicate that investments in infrastructure and business support can have a major long-term impact.
4. Conclusion
The results of the research confirm the existence of significant entrepreneurial potential in the transport sector within European mountain regions, but also highlight a series of systemic challenges that affect the performance and sustainability of businesses. The forecasting models used (ARIMA) showed limited capacity in accurately predicting point developments, but proved useful in shaping general trends and regional development scenarios.
In the context of the research, the following conclusions are emphasized:
(1) Birth and survival indicators (I2 and I7–I9): these suggest an active entrepreneurial environment, but one that is marked by fragility. The 60% three-year survival rate is a positive signal, though it is unevenly distributed across regions. This highlights the need for more targeted interventions to support businesses in areas where survival rates are lower.
(2) Small business size and employment fluctuations (I3, I16–I17): the small size of new businesses (I3) and the large volume of employment fluctuations (I16–I17) reflect a micro-entrepreneurship model heavily dependent on local context and seasonality. This indicates that many businesses are operating on a small scale and may struggle to create long-term, stable employment.
(3) Performance indicators (RMSE, MAPE): these models indicated a high degree of dispersion and sensitivity to external shocks, which are characteristic of the mountainous environment. This suggests that the forecasting models may not always be reliable in terms of precise outcomes, especially in regions with high volatility and external dependencies (e.g., weather, seasonal demand).
(4) Better-developed transport infrastructure (I15): regions with better-developed transport infrastructure exhibit a higher net growth in the business population (I15) and a greater contribution to employment. This further supports the argument that connectivity plays a crucial role in fostering entrepreneurial activity and economic growth in mountain areas.
Public policy recommendations:
(1) Support for small and new businesses: small and new businesses should be supported through dedicated funding schemes, mentoring programs, and business incubators tailored to the specifics of mountain regions. This will help overcome the challenges posed by small business size and high volatility.
(2) Transport infrastructure development: enhancing transport infrastructure in isolated regions should be a priority, as it is a prerequisite for increasing business births and improving economic connectivity. This will also help reduce the geographical disparities that currently exist between regions.
(3) Encouraging innovation and digitization: fostering innovation and digitalization in the mountain transport sector is essential to support the emergence of high-growth enterprises and improve competitiveness. These efforts should focus on creating a favorable environment for technological advancements and new business models in transport.
(4) Continuous monitoring and qualitative research: ongoing monitoring of entrepreneurial dynamics, complemented by qualitative research (e.g., interviews, local surveys), is crucial for adapting to evolving challenges and opportunities. Quantitative analyses alone may not capture the full picture, especially in areas with unique local conditions.
(5) Development of a regional network for best practices: establishing a regional network for sharing best practices will facilitate knowledge transfer and foster cross-border cooperation among mountain regions. This could lead to synergies that amplify the impact of public policies and business initiatives.
By correlating statistical forecasts with strategic interventions in infrastructure, entrepreneurial education, and institutional support, European mountain regions can become sustainable hubs for economic development and innovation in the transport sector.
During the preparation of this manuscript, the authors utilized artificial intelligence tools for assistance in statistical analysis and data interpretation. Following this, the authors rigorously reviewed, validated, and refined all results, ensuring accuracy and coherence. The final content reflects the authors’ independent analysis, critical revisions, and scholarly judgment. The authors assume full responsibility for the integrity and originality of the published work.
References
- Banister, D. (2008). The sustainable mobility paradigm. Transport Policy, 15(2), 73–80. [CrossRef]
- Eurostat (2025). Business demography and high growth enterprises by NACE Rev. 2 activity and other typologies [urt_bd_hgn__custom_15325082].
- Giuliani, F., & Scudellari, J. (2017). Cable transport systems as a sustainable mobility option in urban and mountain areas. Procedia Engineering, 198, 66–77.
- . [CrossRef]
- Macário, R. (2014). Sustainable mobility in mountain regions: Transport policies and practices. Journal of Transport Geography, 34, 1–9. [CrossRef]
- Martín-Cejas, R. R. (2015). The environmental impact caused by road access to Timanfaya Natural Park on Lanzarote Island. [Journal name missing].
- McRae, J. N., Gay, C. J., Nielsen, B. M., & Hunt, A. P. (2019). Using an unmanned aircraft system (drone) to conduct a complex high-altitude search and rescue operation: A case study. Wilderness & Environmental Medicine, 30(3), 287–290.
- . [CrossRef]
- Miller, N. P. (2008). US national parks and management of park soundscapes: A review. Applied Acoustics, 69, 77–92. [CrossRef]
- Munteanu, C., & Vlăsceanu, G. (2016). Sustainable transport in the Romanian mountain areas – challenges and perspectives. Romanian Review of Political Geography, 18(1), 21–29. http://rrgp.uoradea.ro.
- Price, M. F., Jansky, L. F., & Iatsenia, A. A. (2004). Key issues for mountain areas. United Nations University Press.
- Scuttari, A., Della Lucia, M., & Martini, U. (2013). Integrated planning for sustainable tourism and mobility. Tourism Geographies, 15(4), 542–560.
- . [CrossRef]
- Seimon, A. (2001). Mountains and transport. In Mountain Agenda, Mountains of the World: Mountains, Energy, and Transport (pp. xx–xx). Berne: Centre for Development and Environment.
- Starkey, P. (2001). Animal power: Appropriate transport in mountain areas. In Mountain Agenda, Mountains of the World: Mountains, Energy, and Transport (pp. xx–xx). Berne: Centre for Development and Environment.
- Teshome, M. B., Rasool, F., & Orzes, G. (2024). Mountain logistics: A systematic literature review and future research directions. Logistics, 8(4), 115.
- . [CrossRef]
- Tilburg, C. (2017). First report of using portable unmanned aircraft systems (drones) for search and rescue. Wilderness & Environmental Medicine, 28(2), 116–118.
- . [CrossRef]
- Wang, M., Lin, X., & Yu, L. (2019). Comprehensive evaluation of green transportation in Chongqing’s main urban area based on sustainable development theory. Systems Science & Control Engineering, 7(1), 369–378. [CrossRef]
- World Tourism Organization (UNWTO). (2020). Sustainable tourism and transport in mountain destinations. https://www.unwto.org.
Figure 1.
Conditions for the forecasting model of mountain transport entrepreneruship.
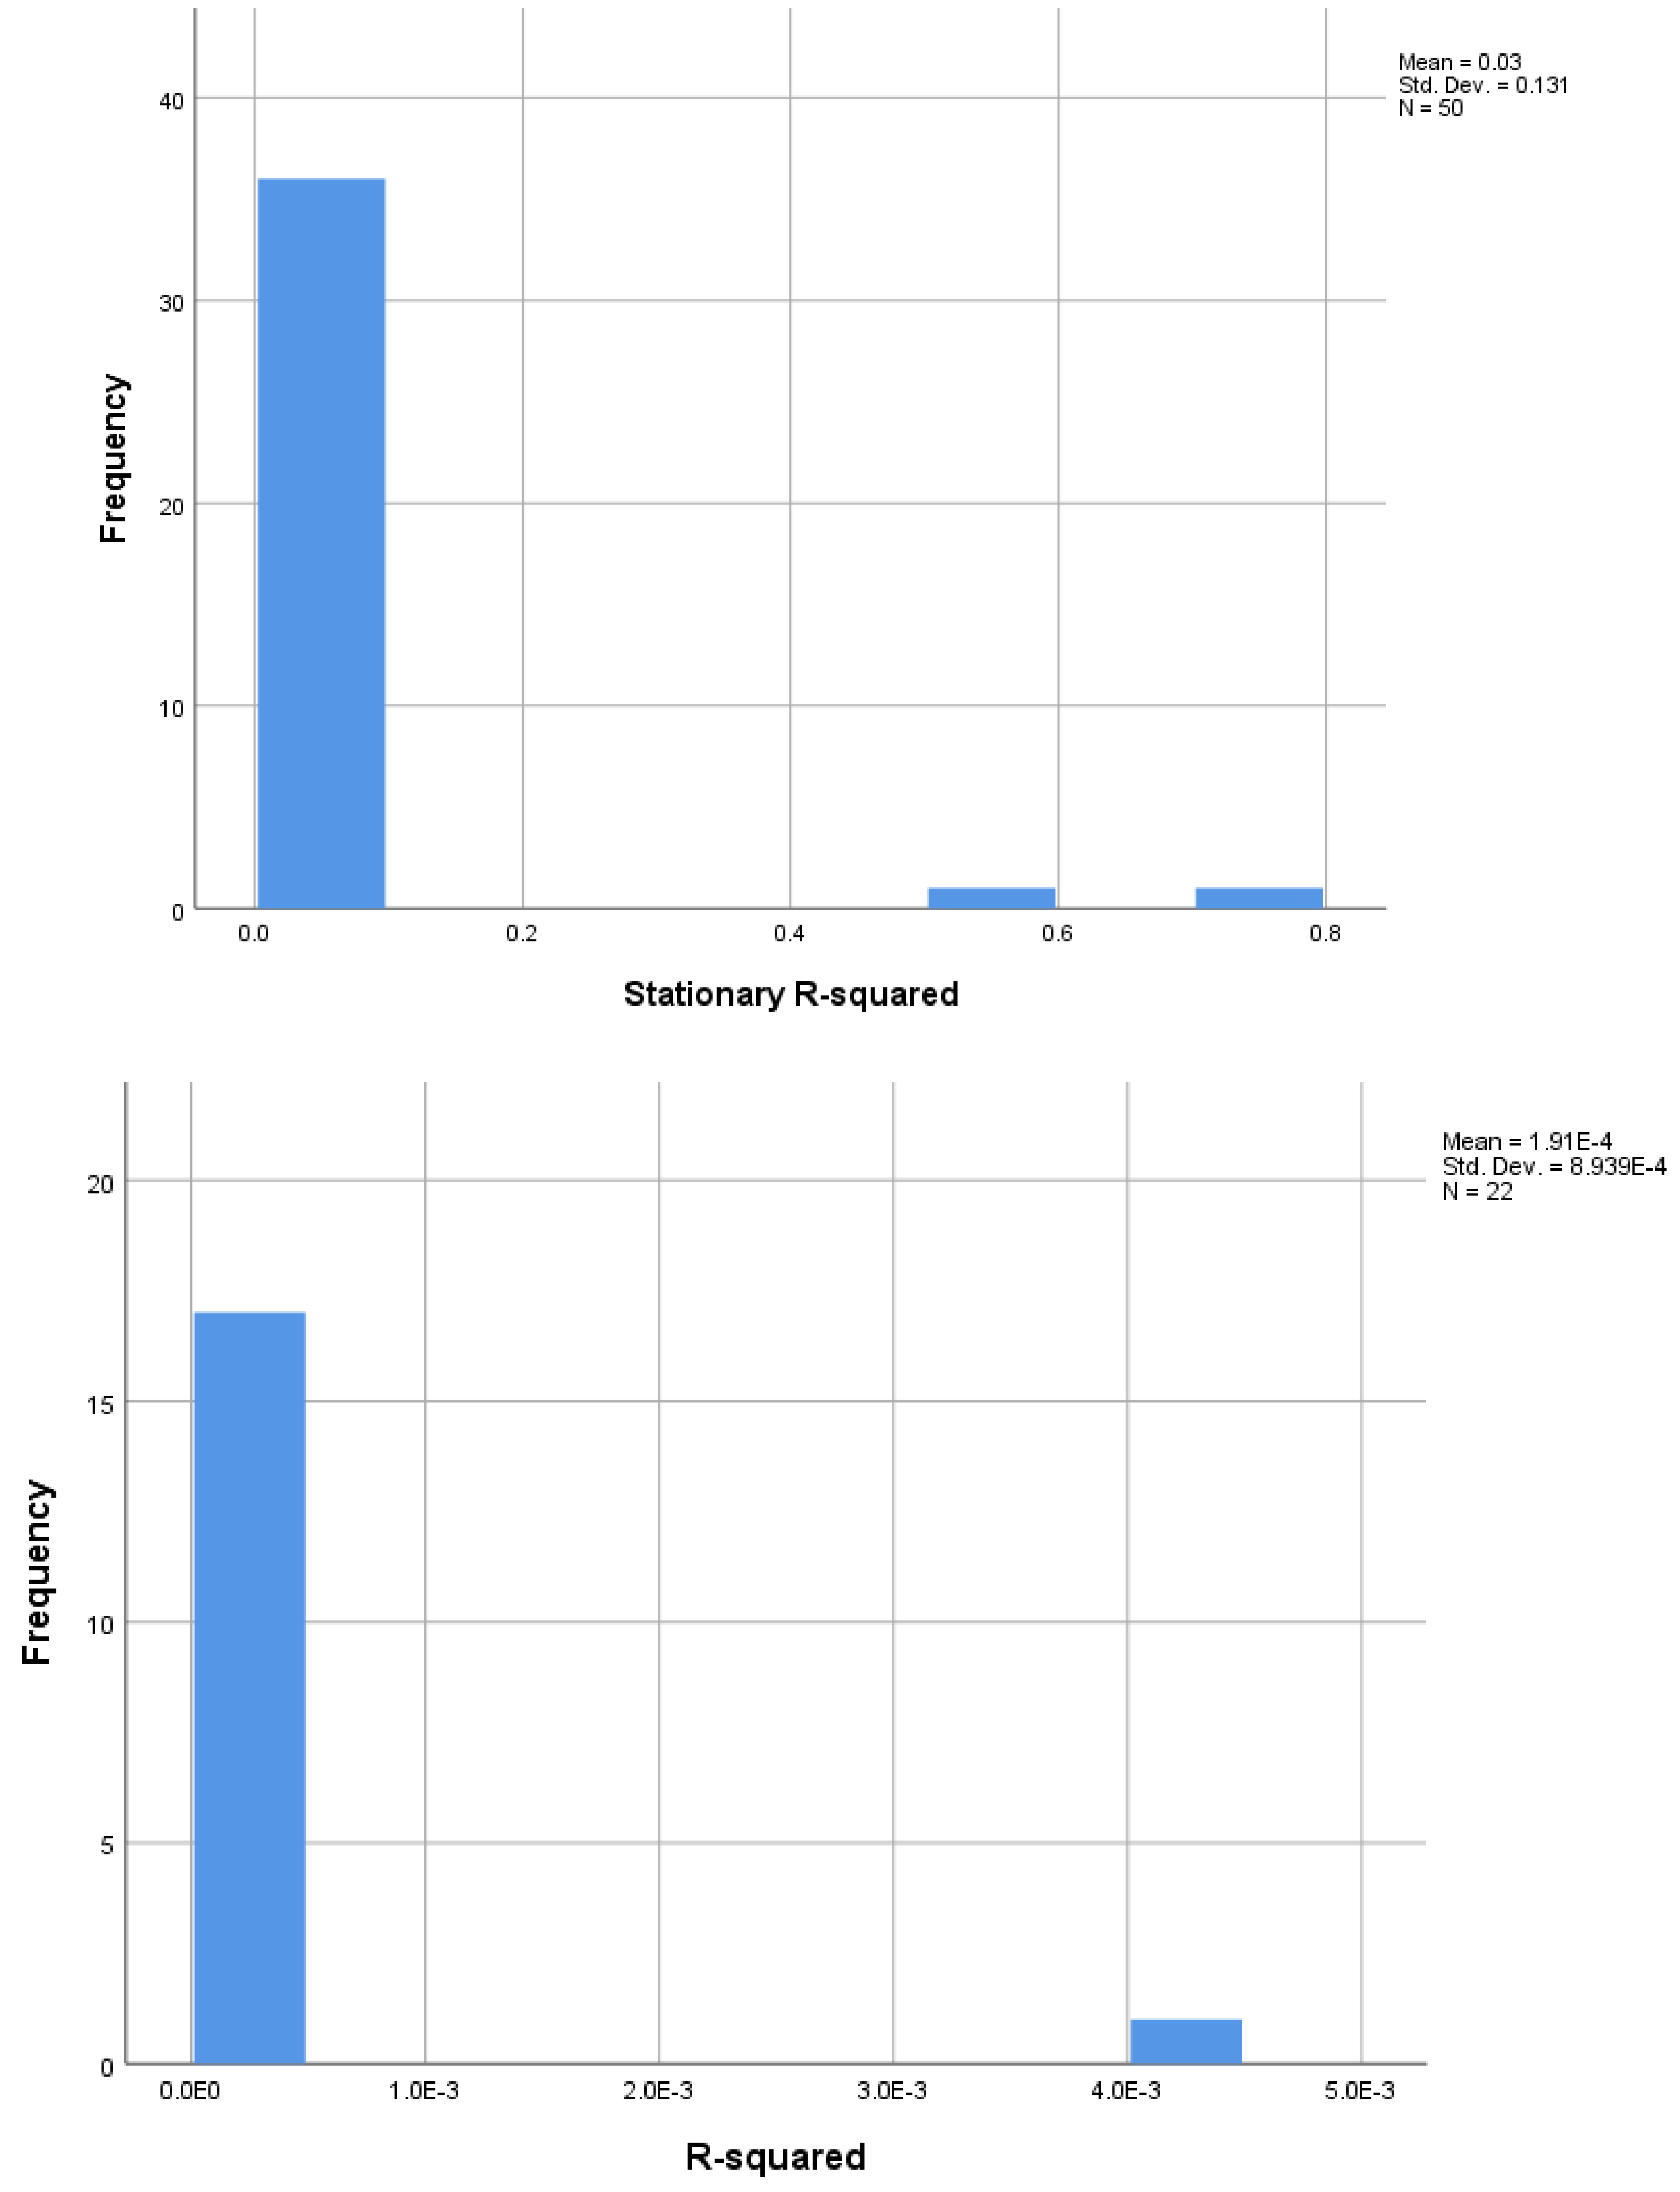
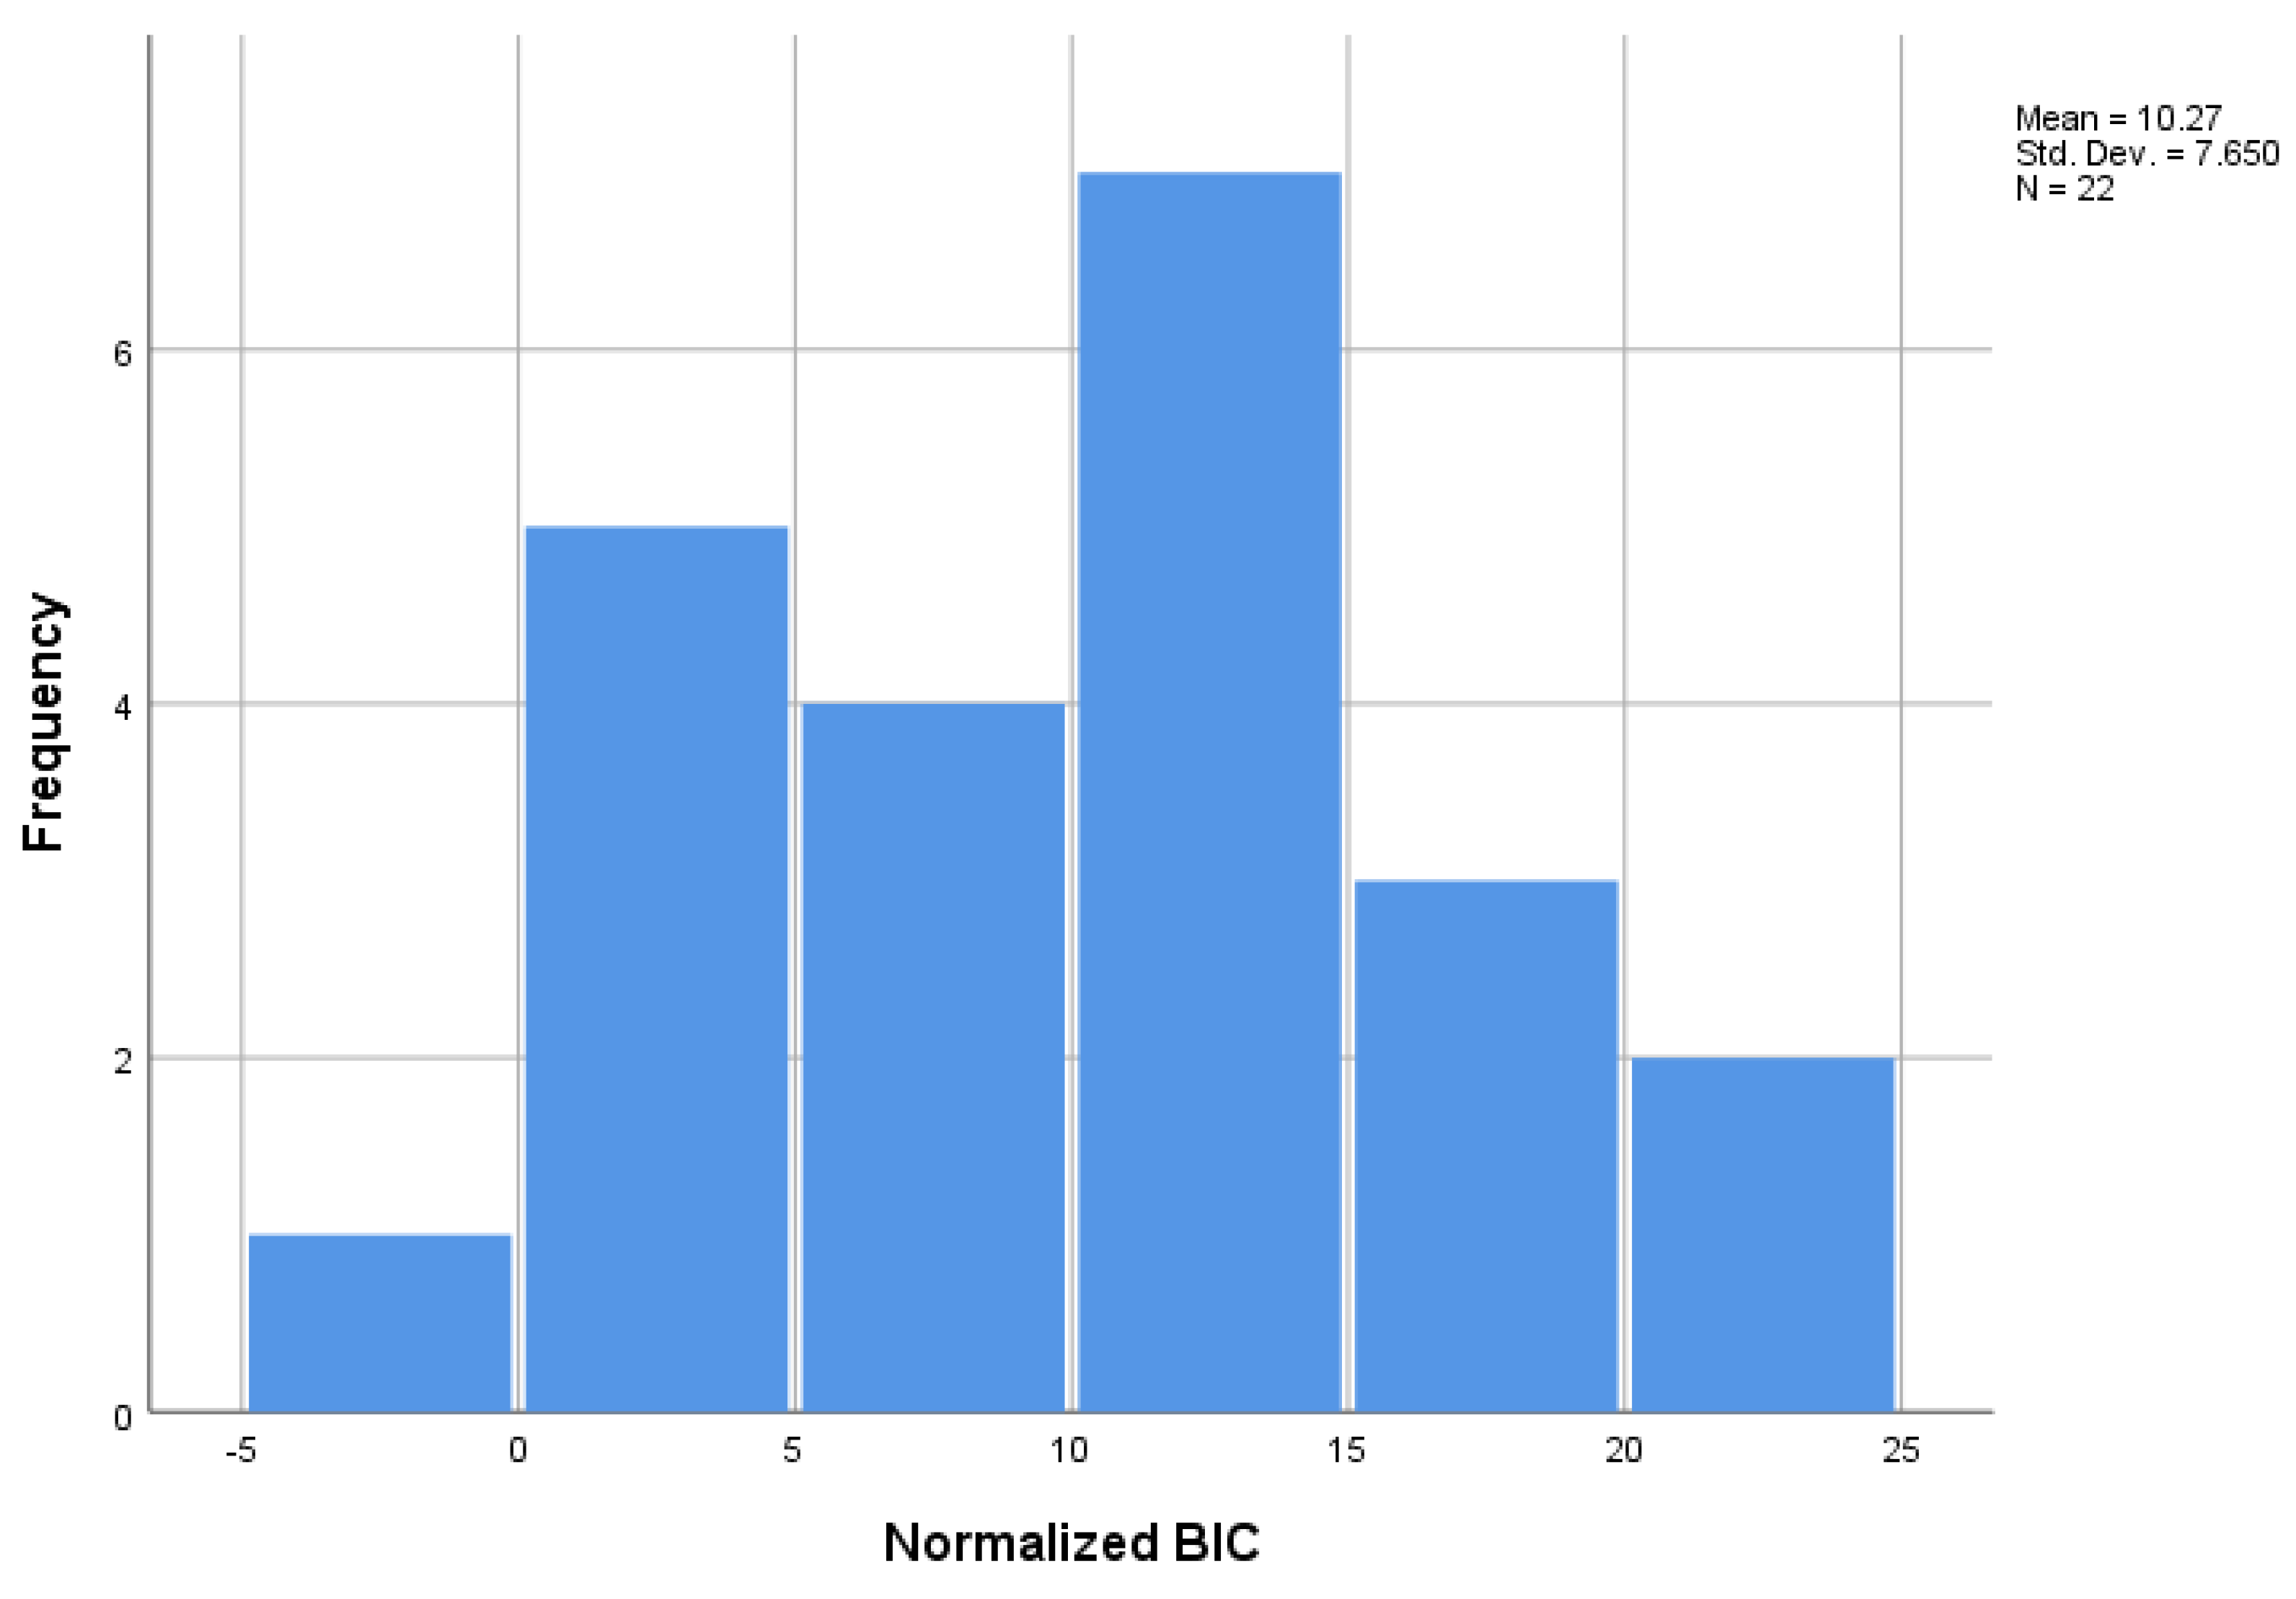
Figure 2.
The dynamics of mountain entrepreneurship in european transport: a forecasting analysis of structural and performance indicators.
Figure 2.
The dynamics of mountain entrepreneurship in european transport: a forecasting analysis of structural and performance indicators.
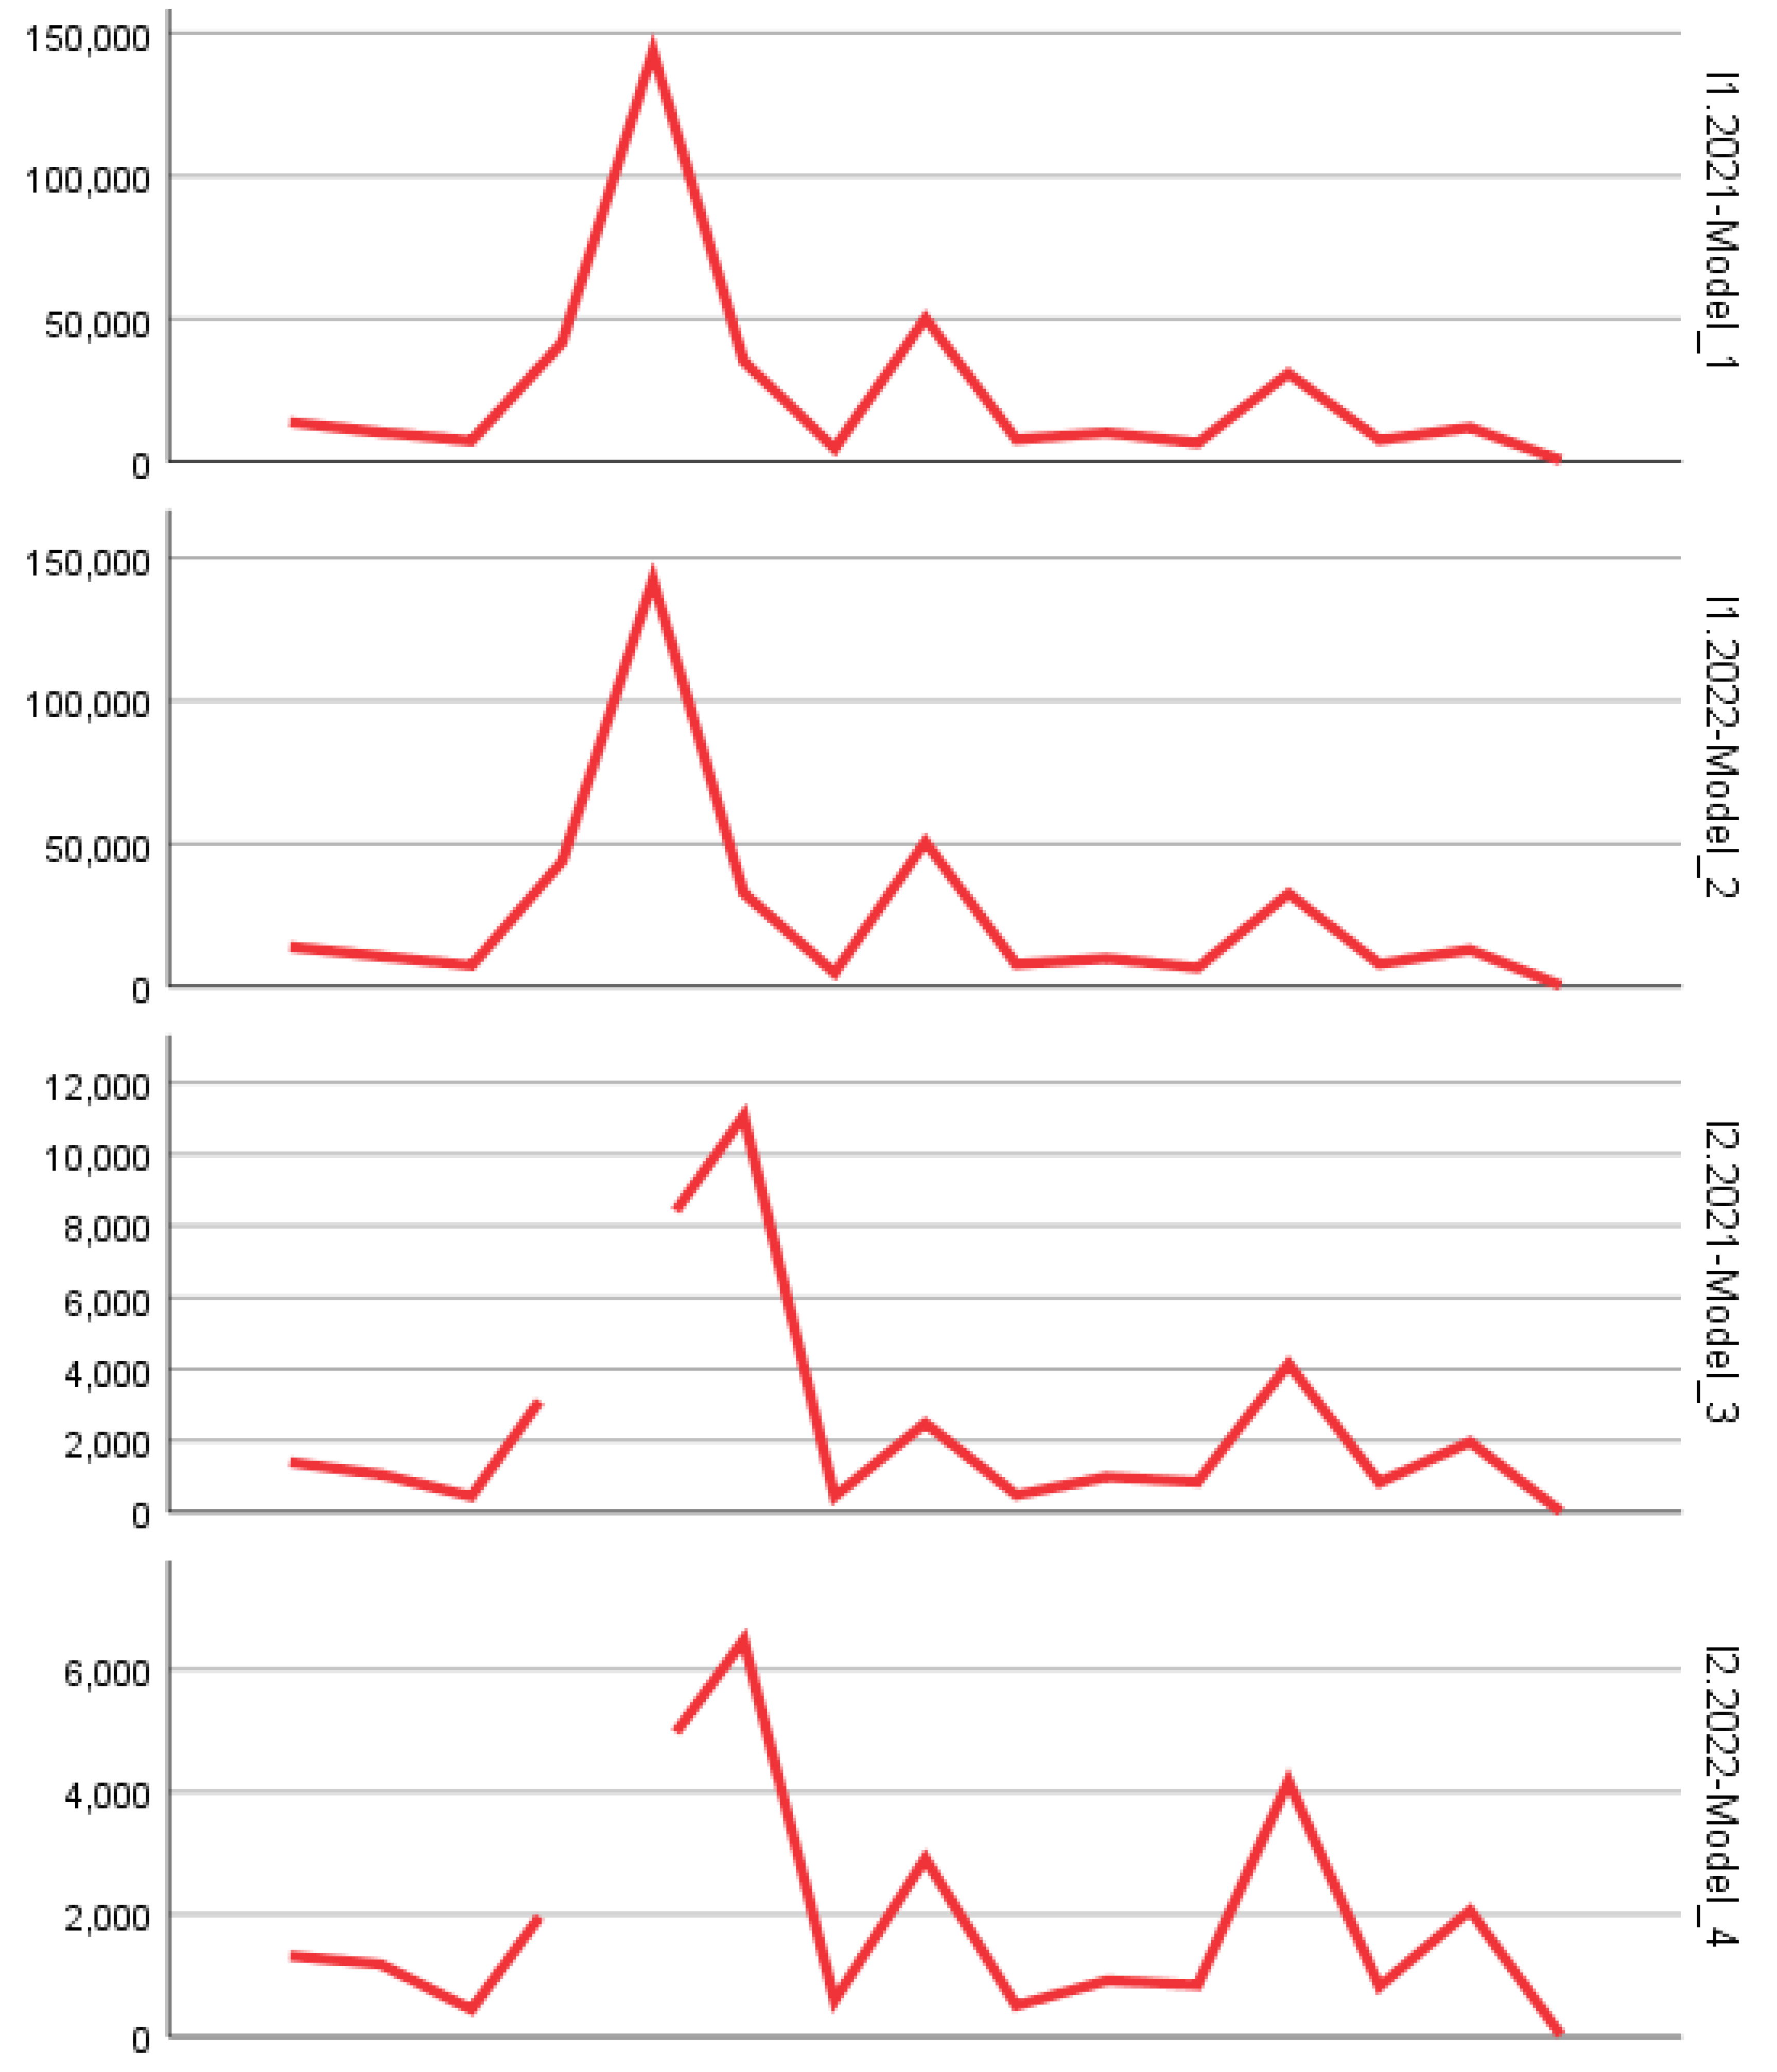
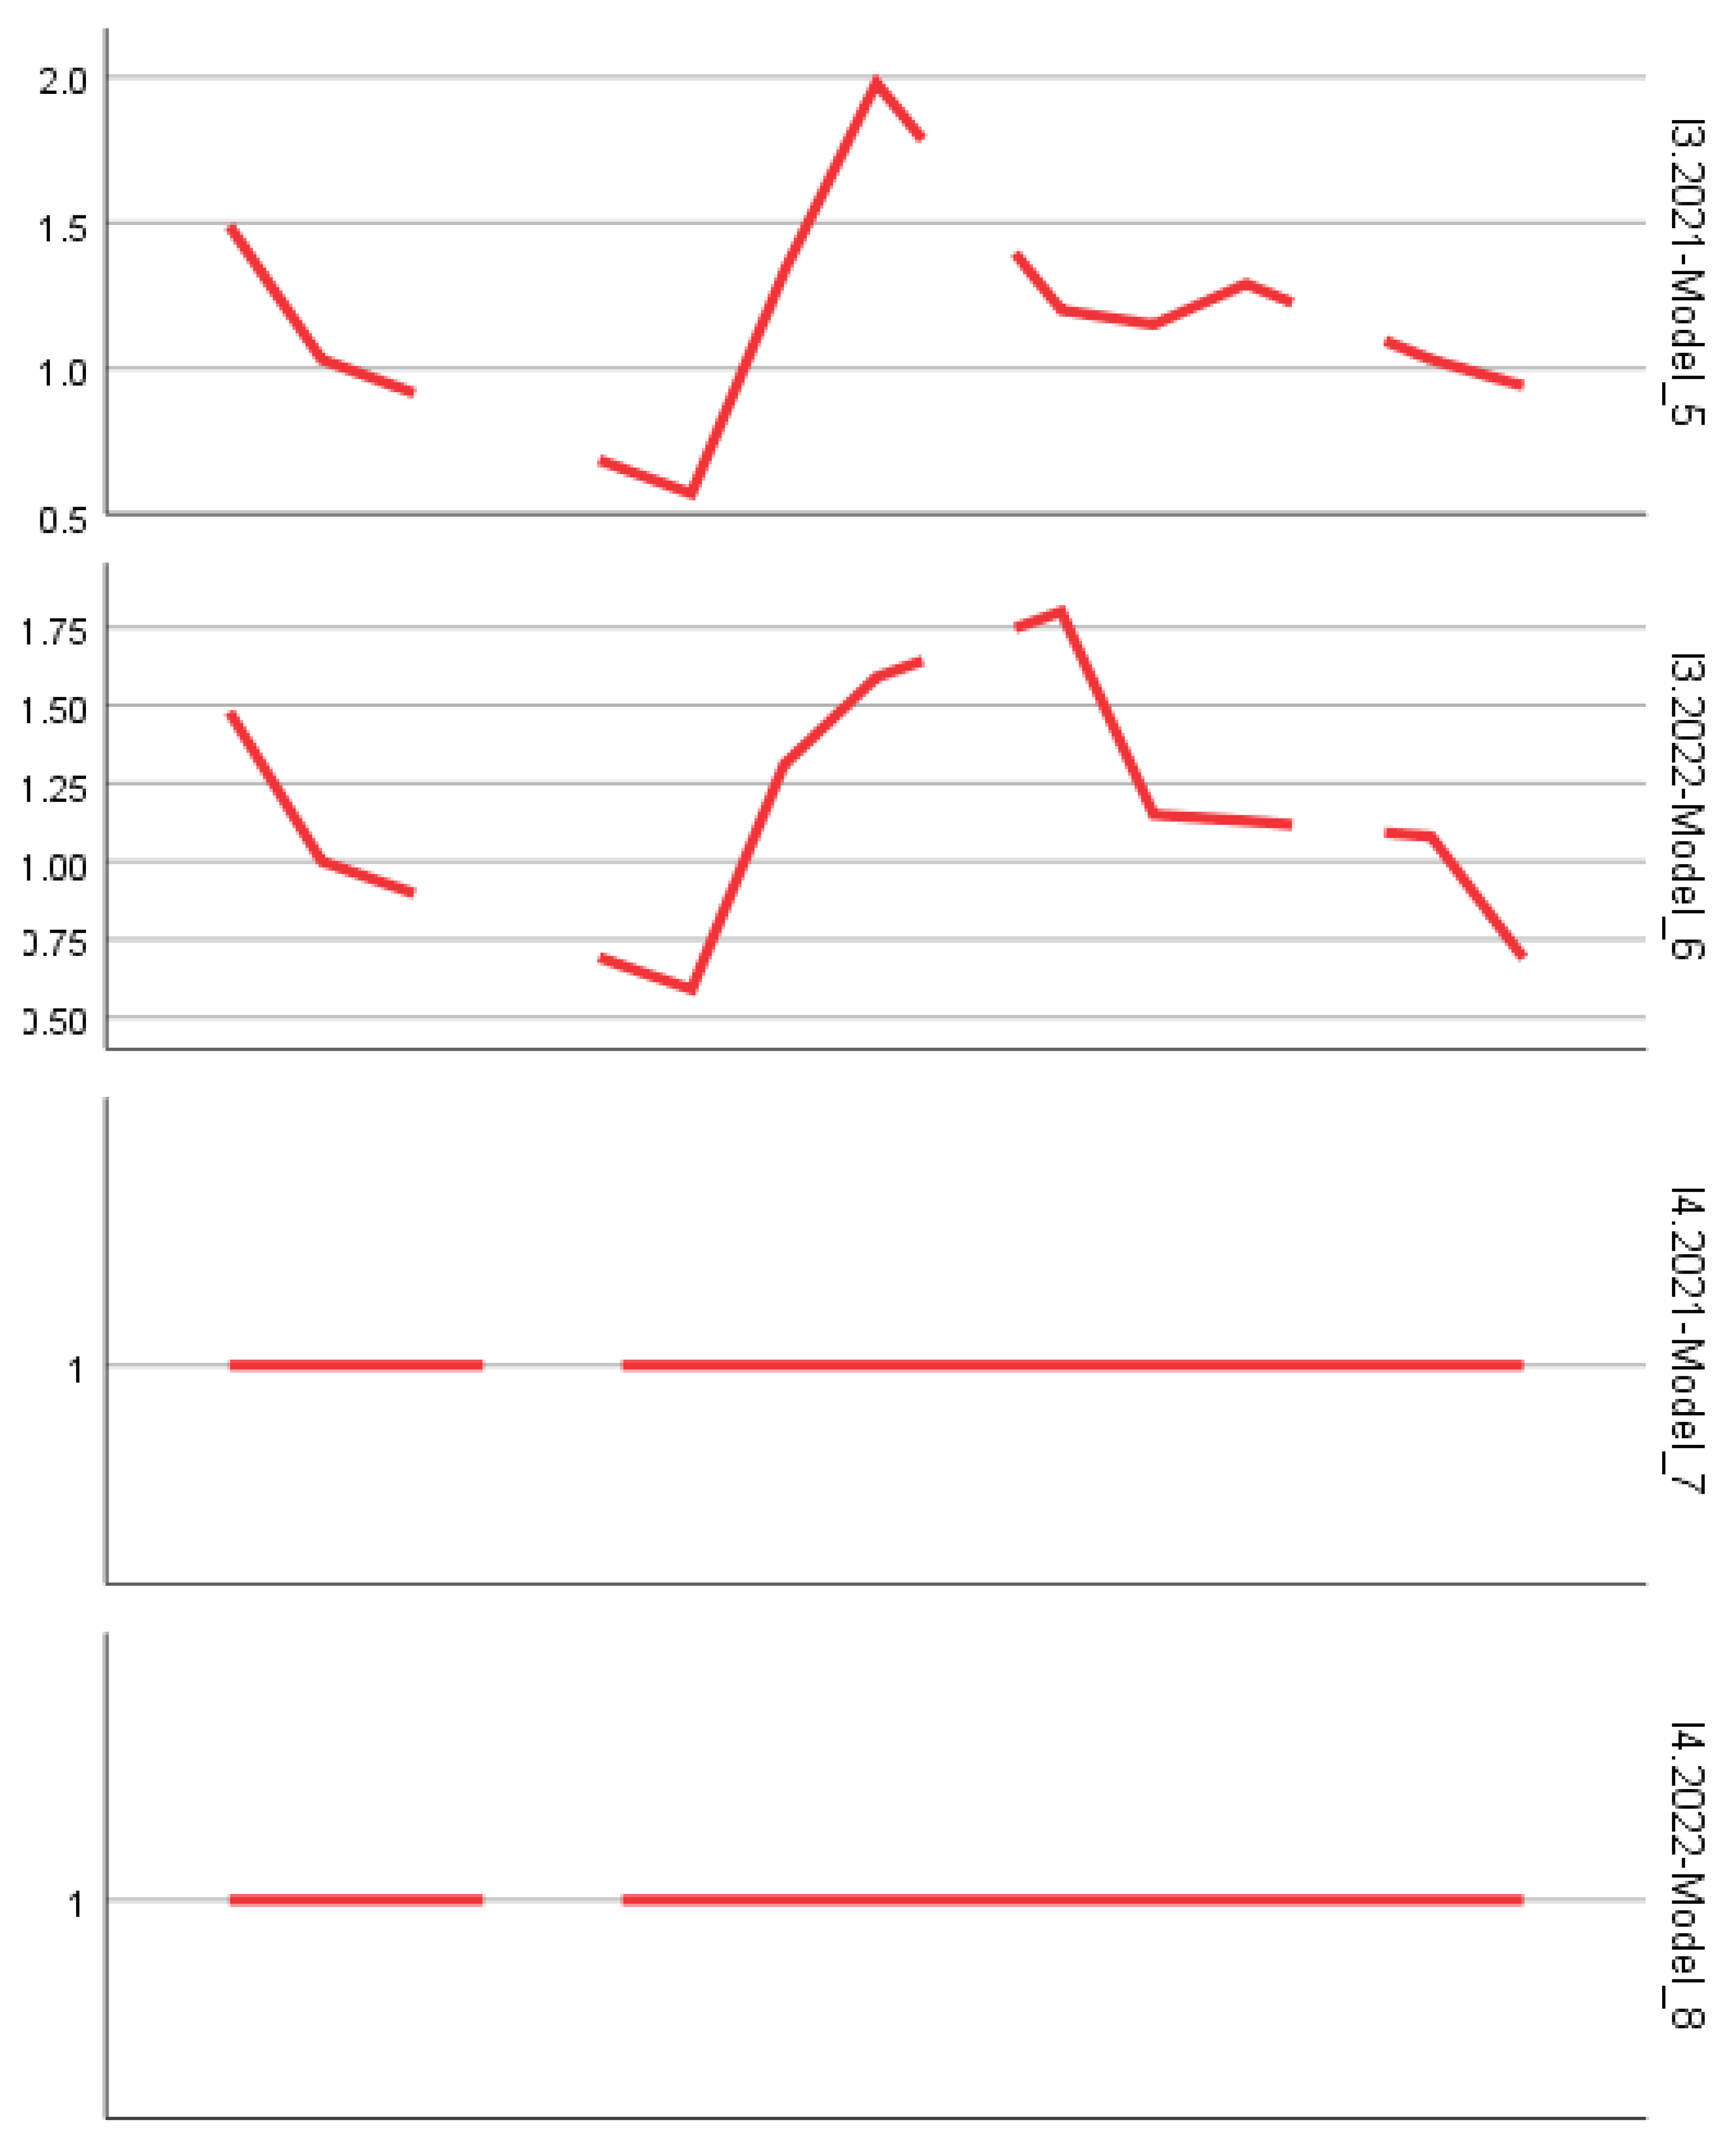
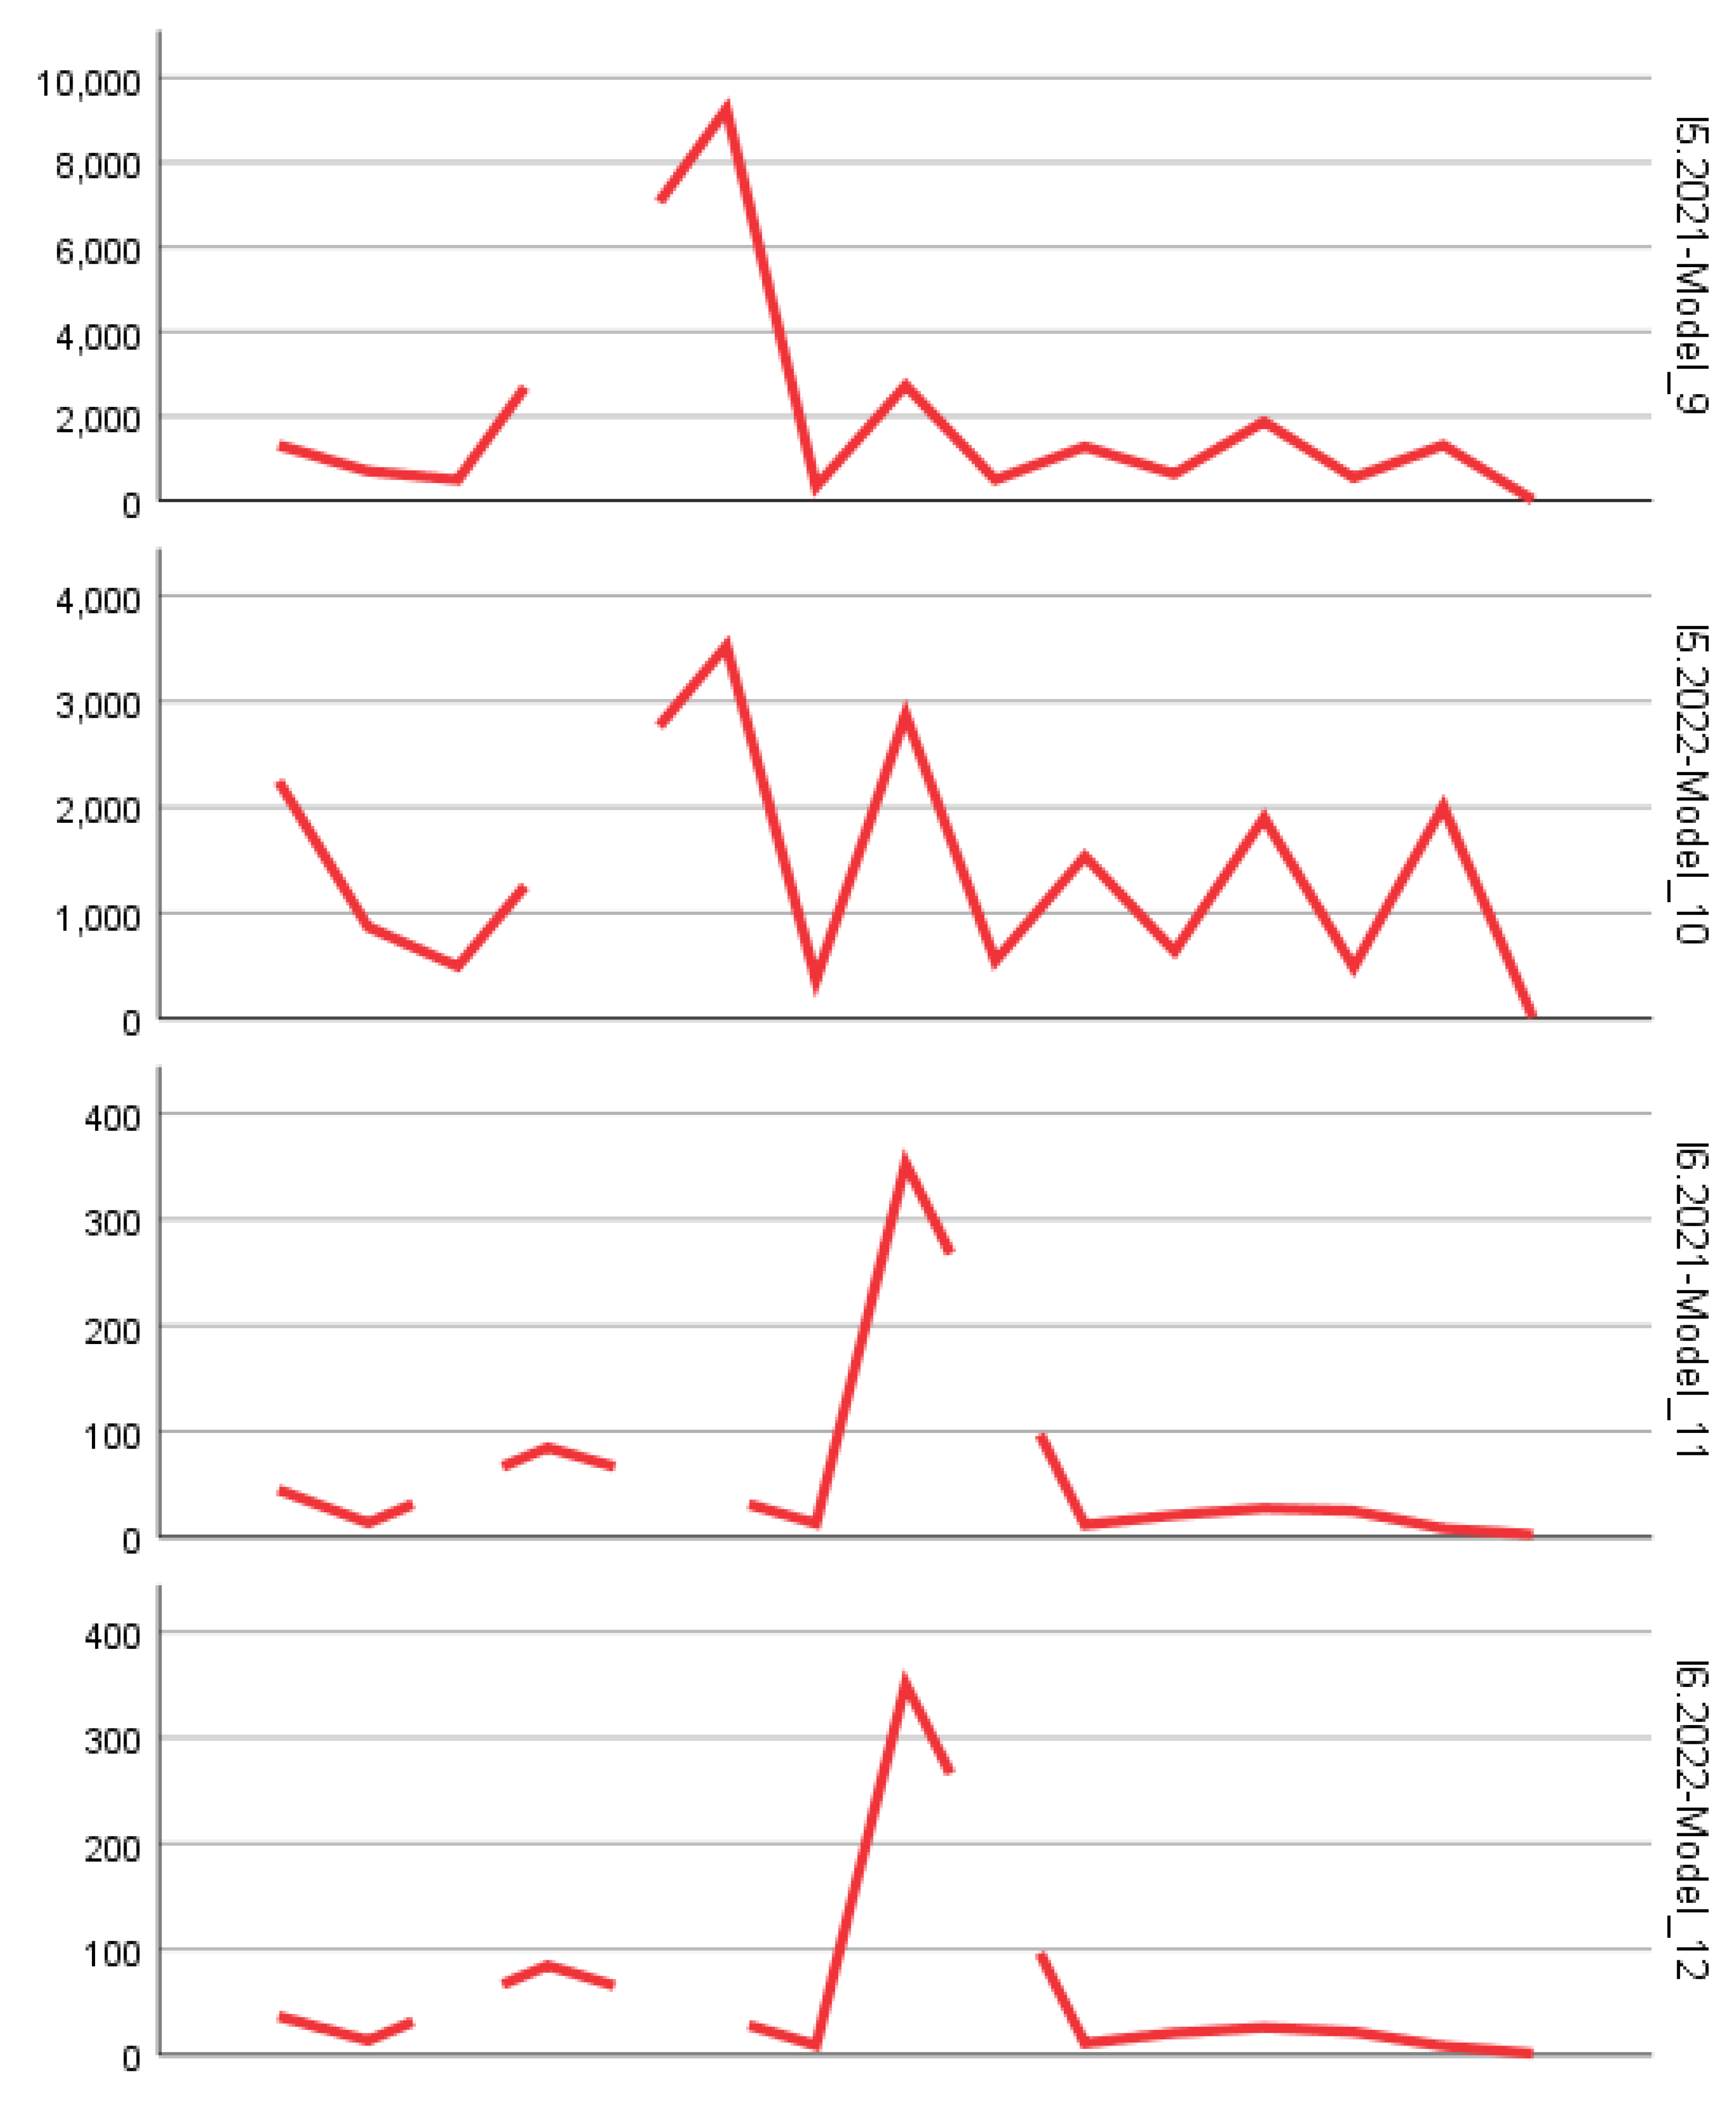
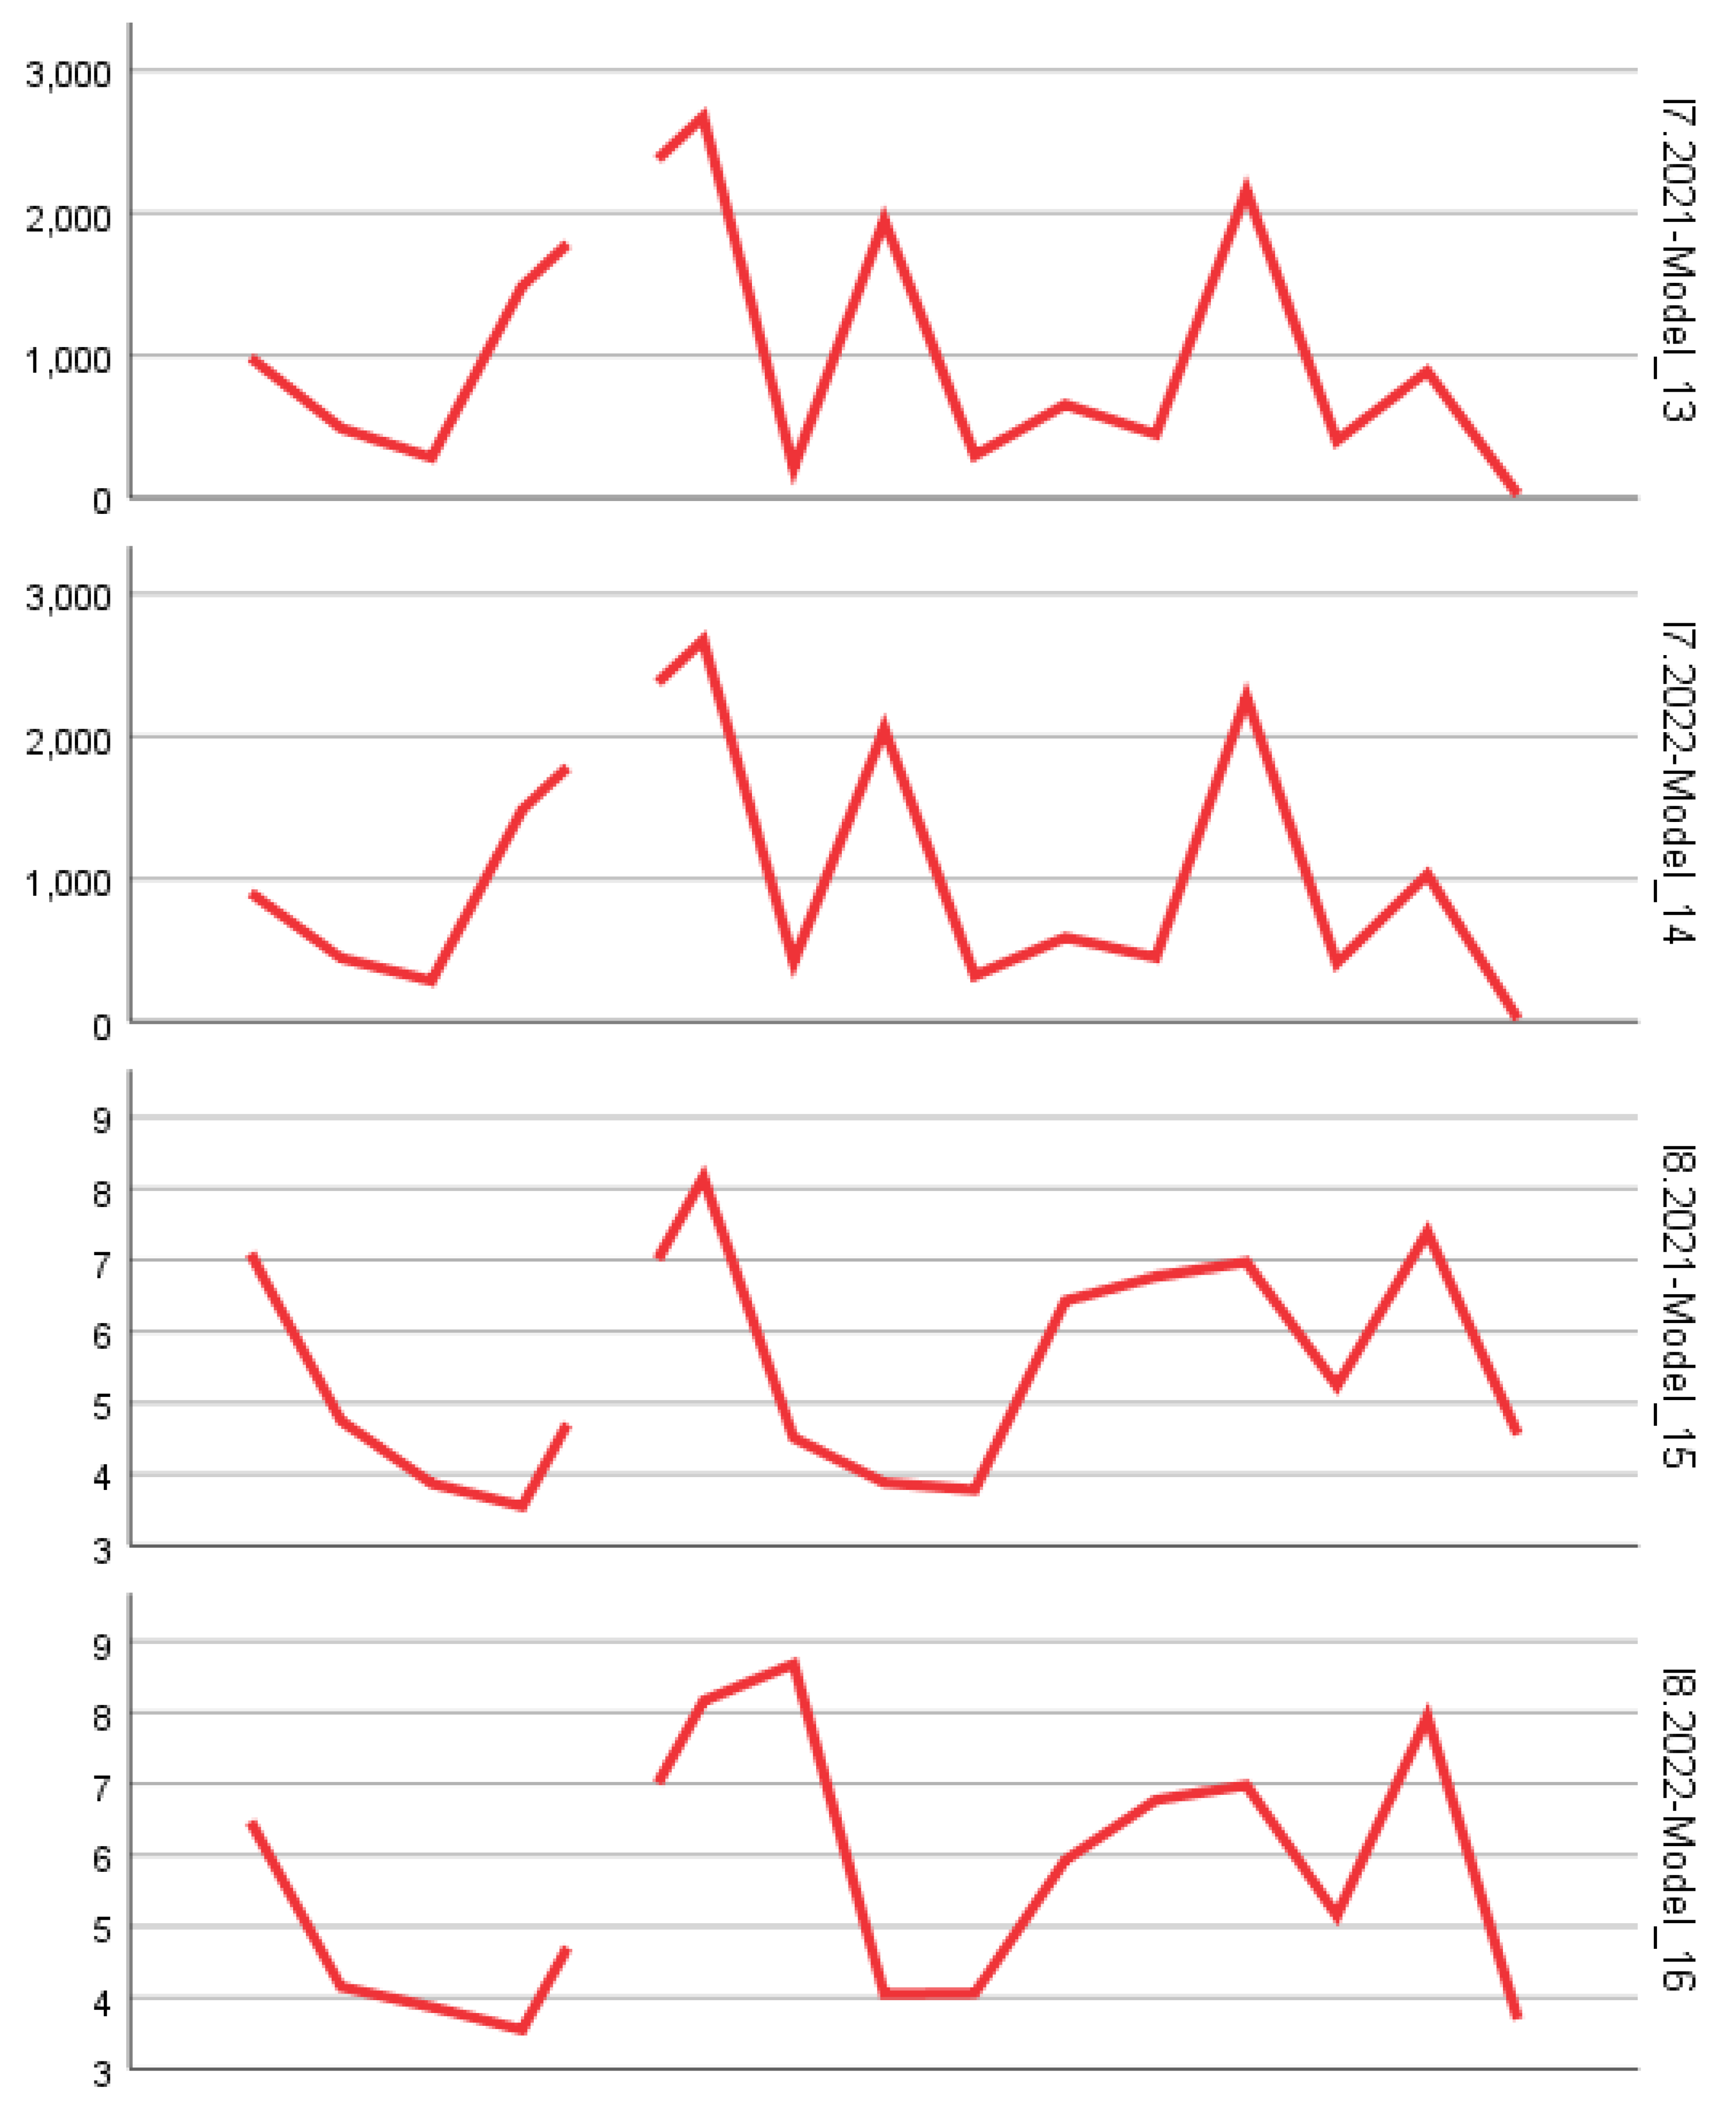

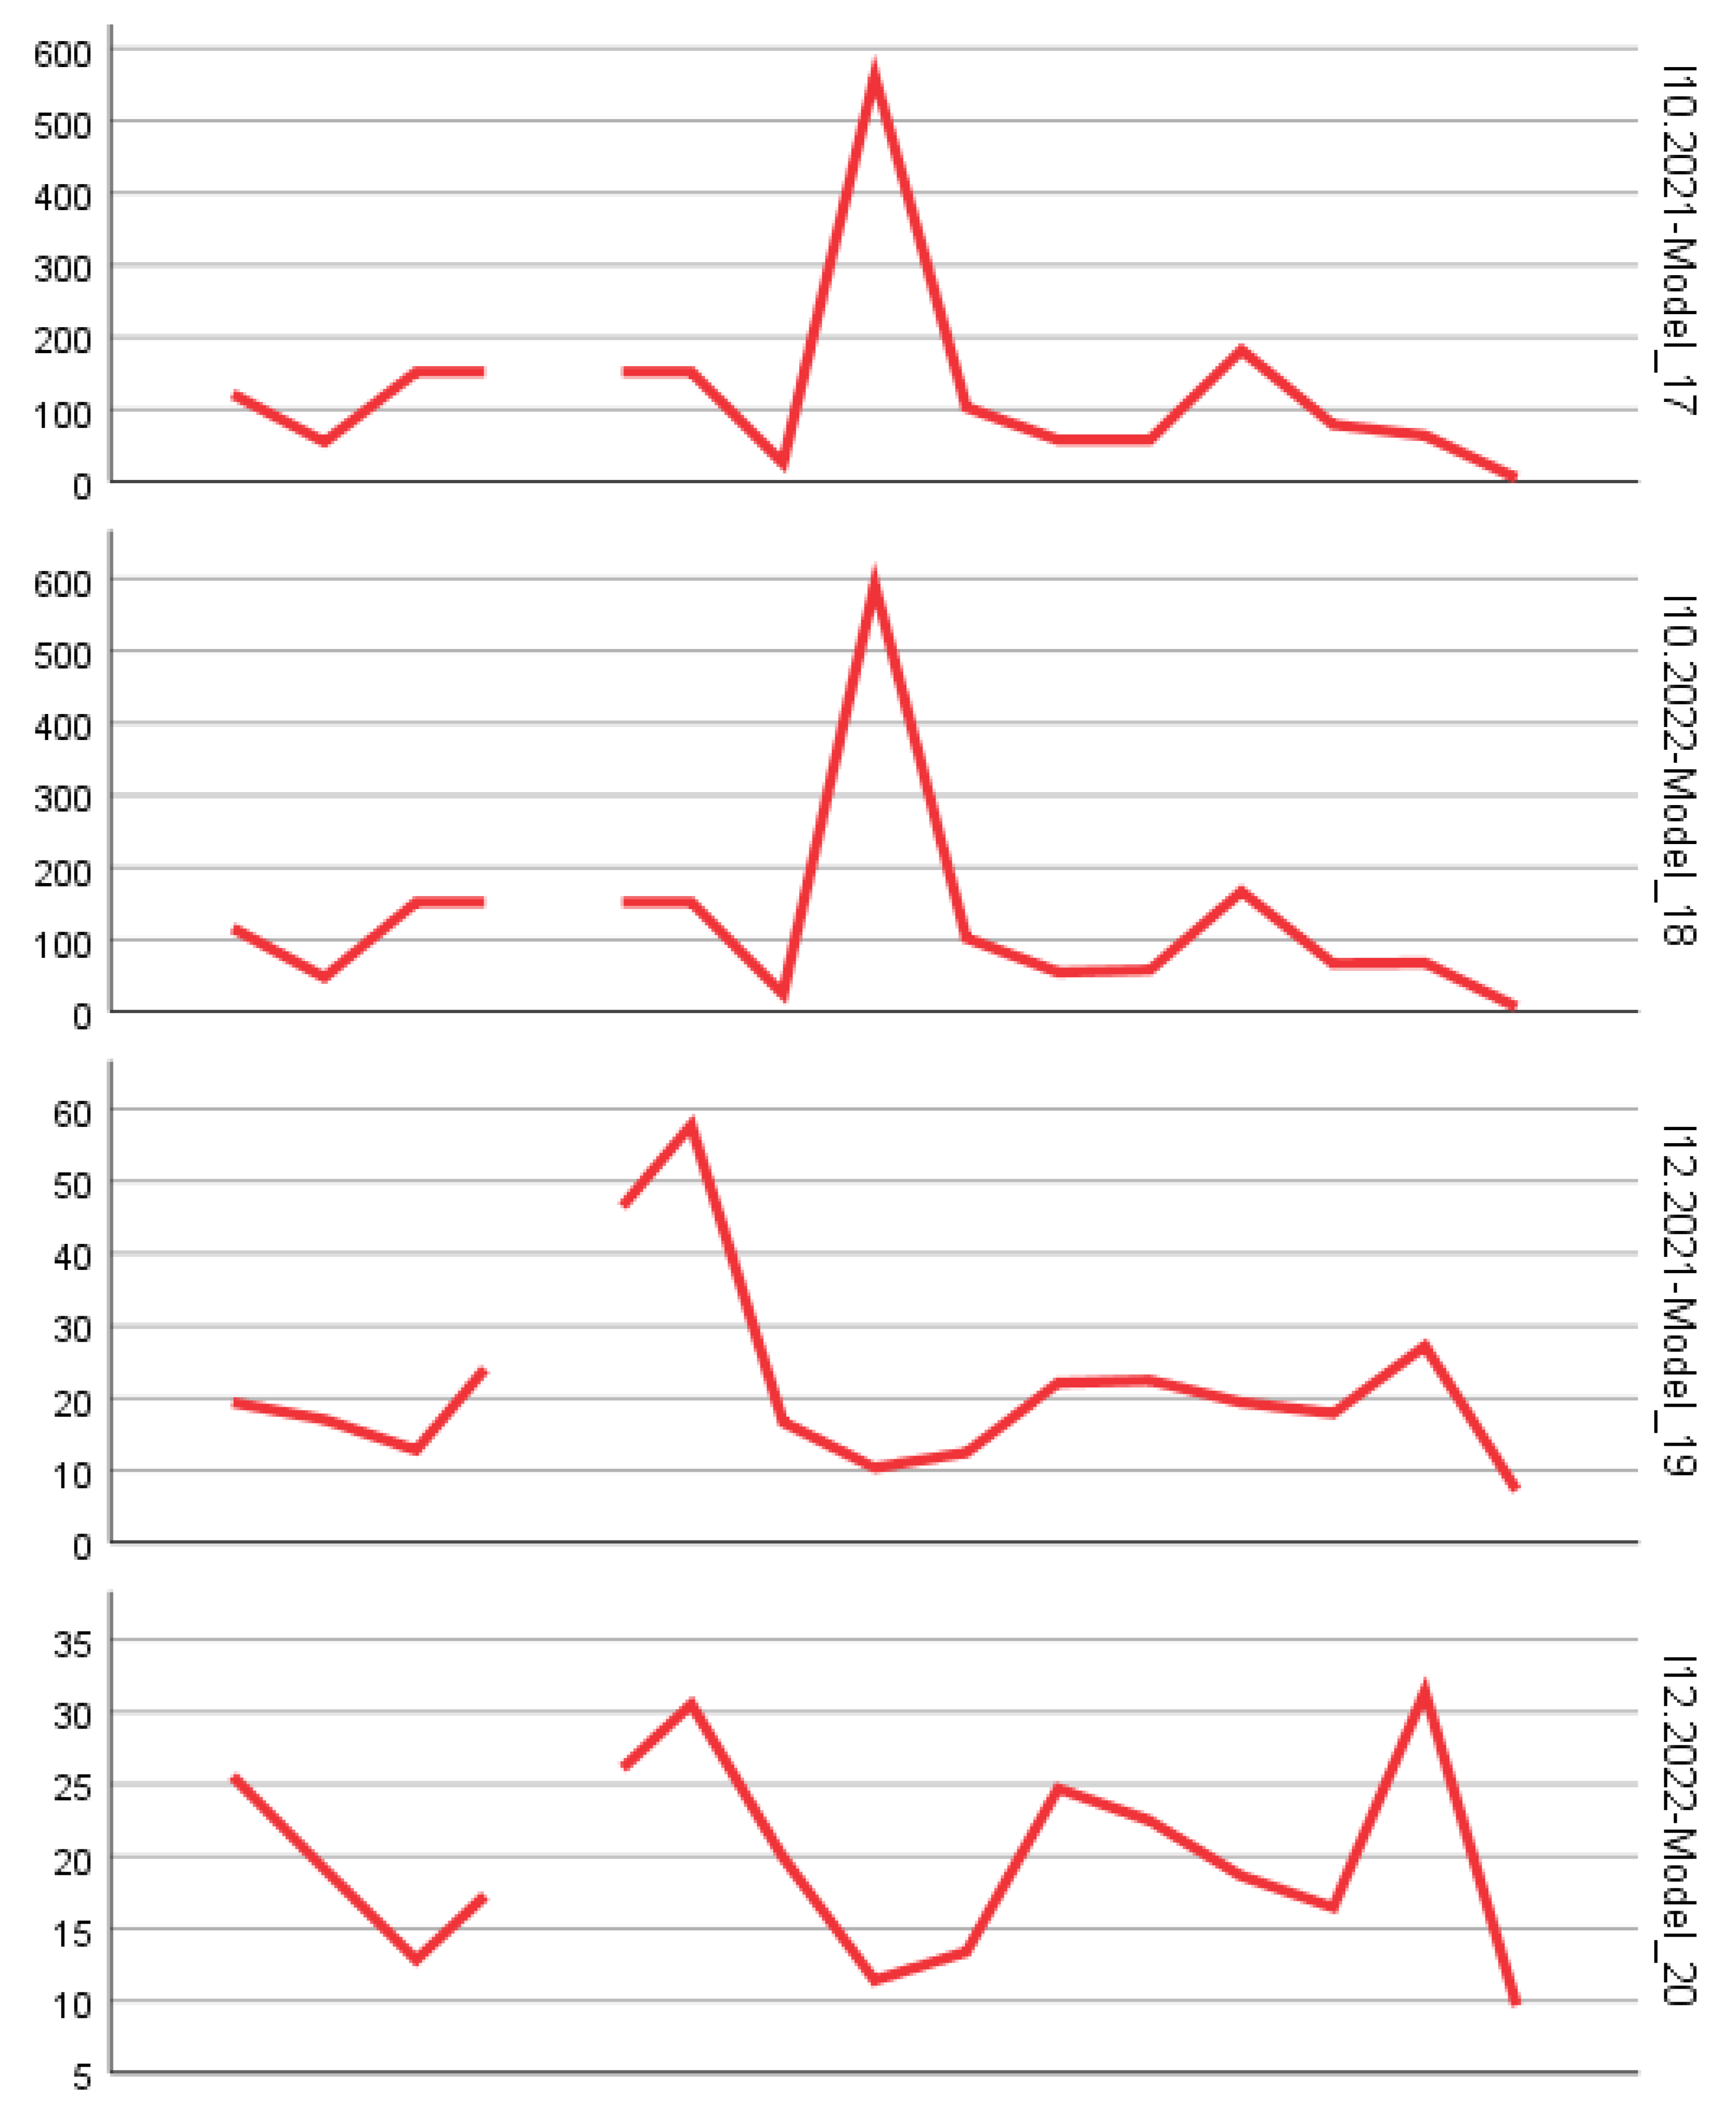
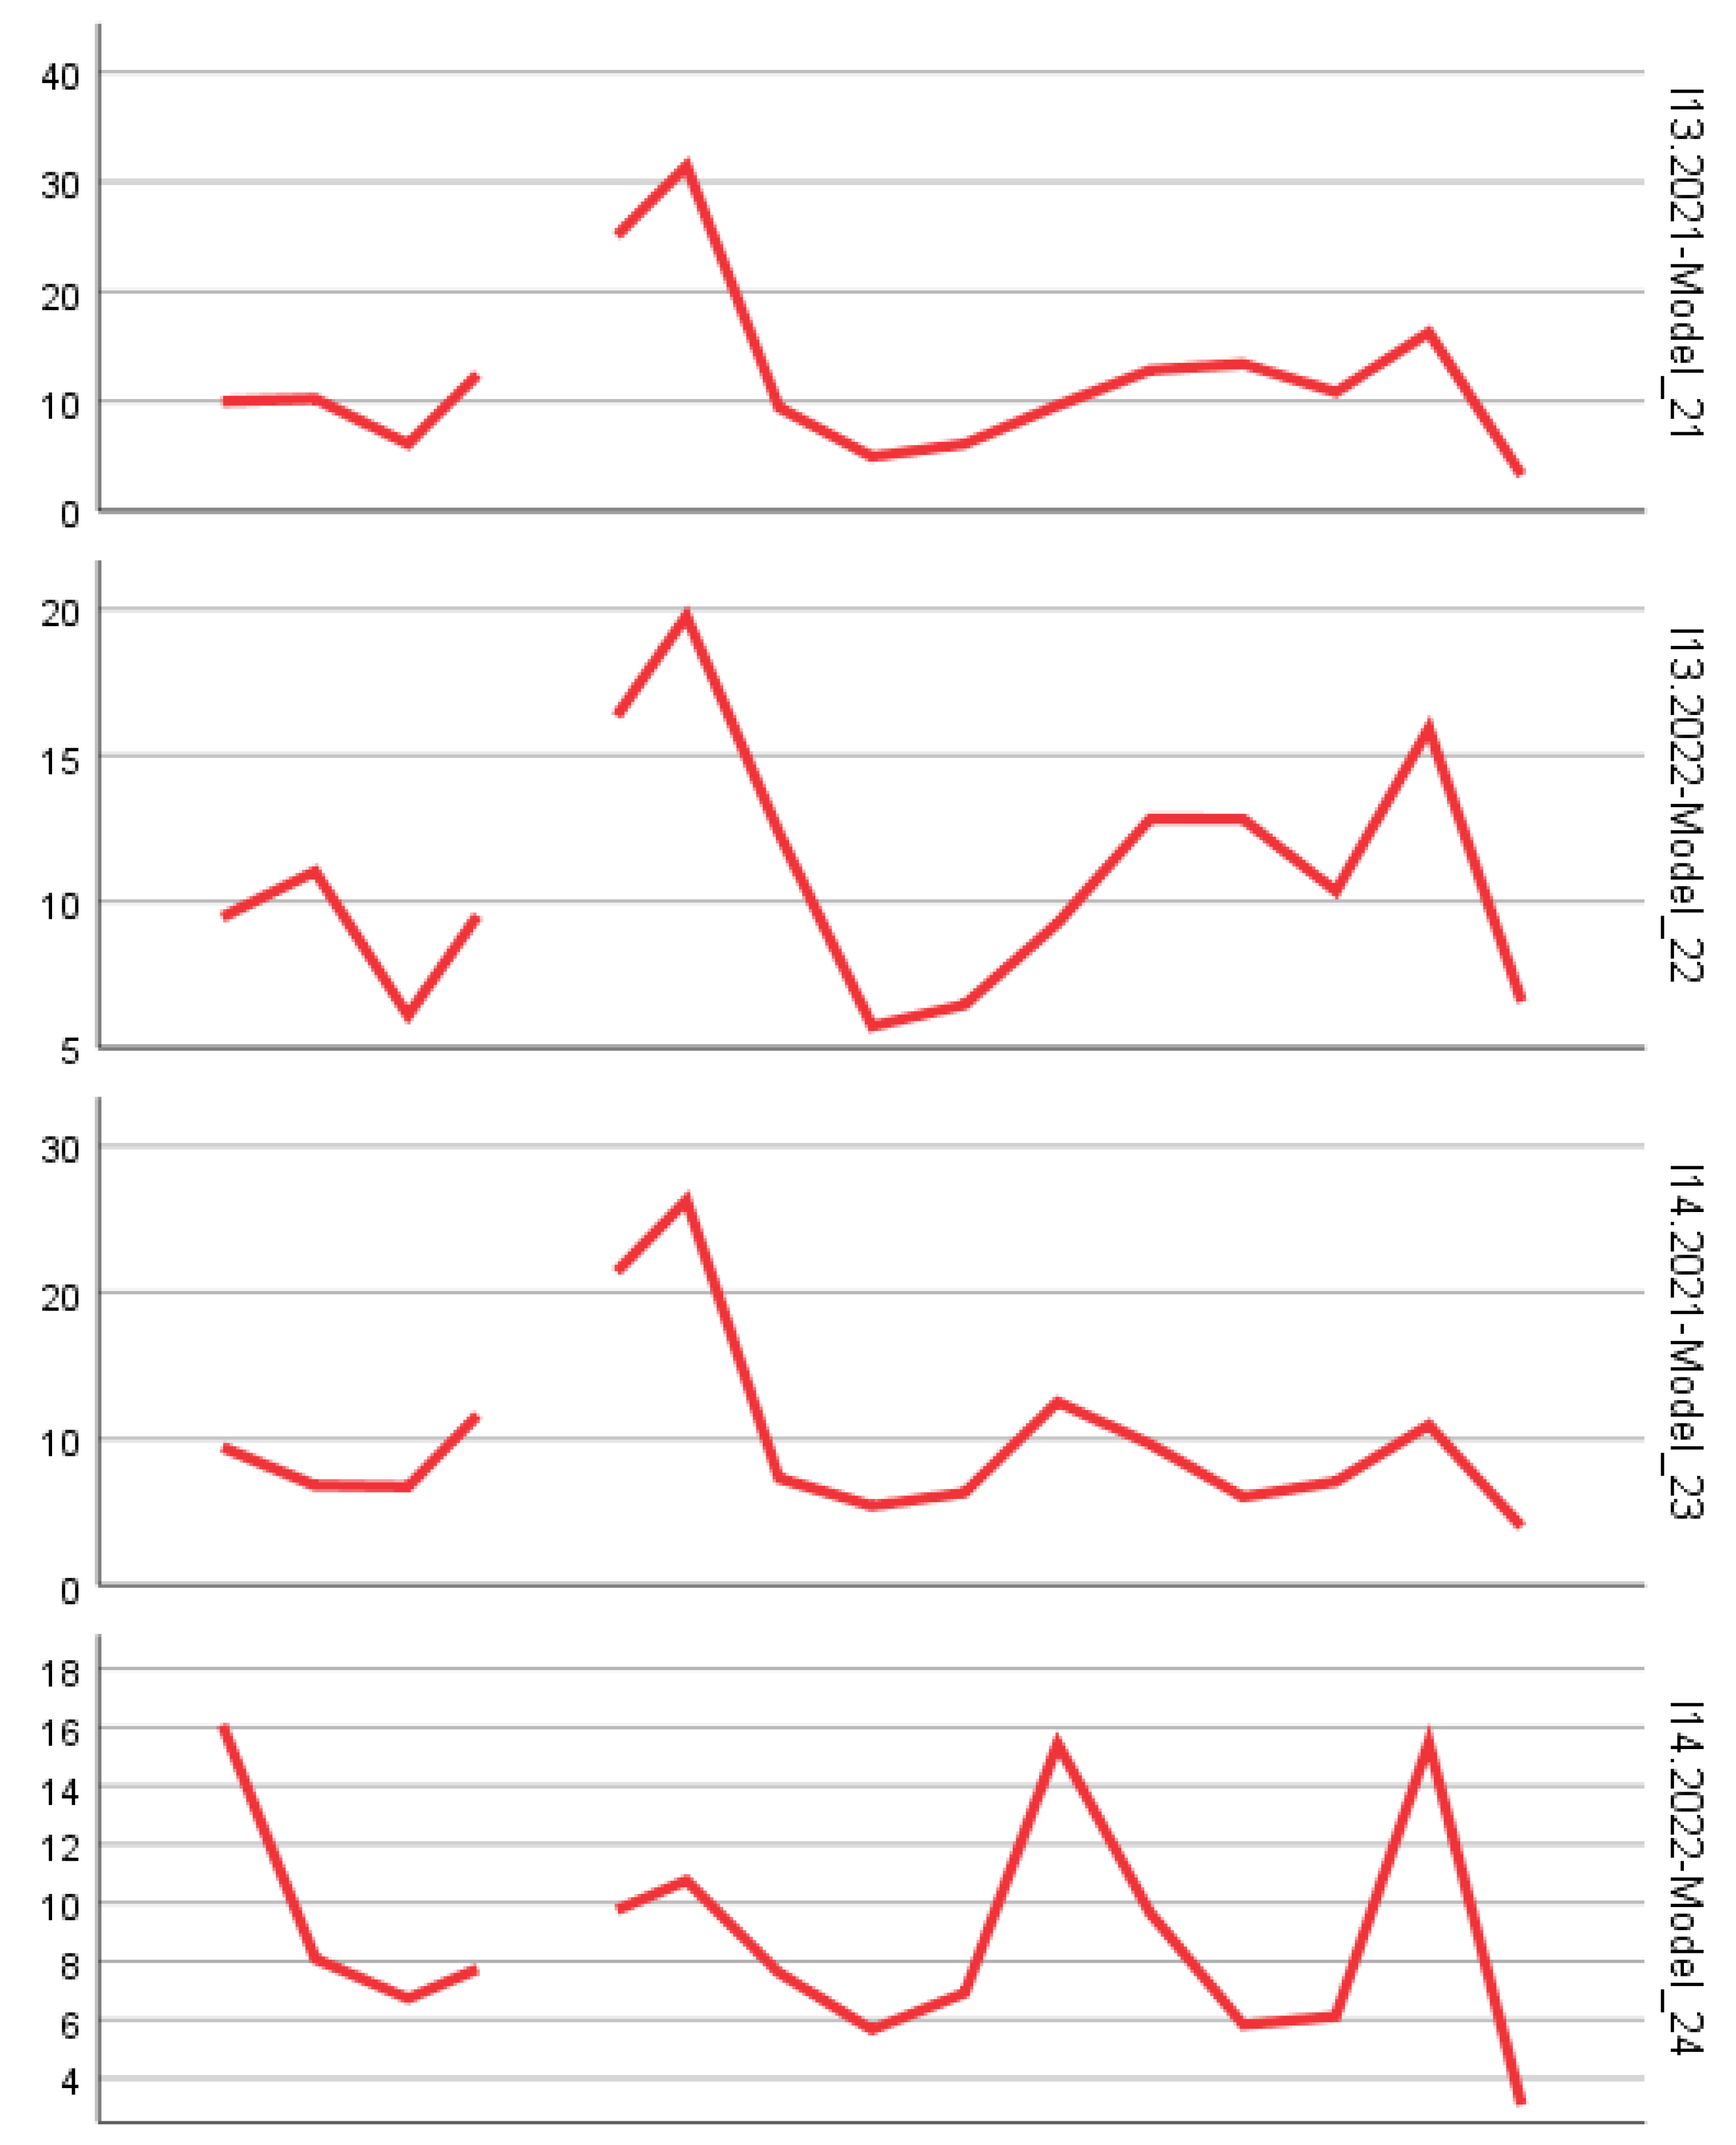
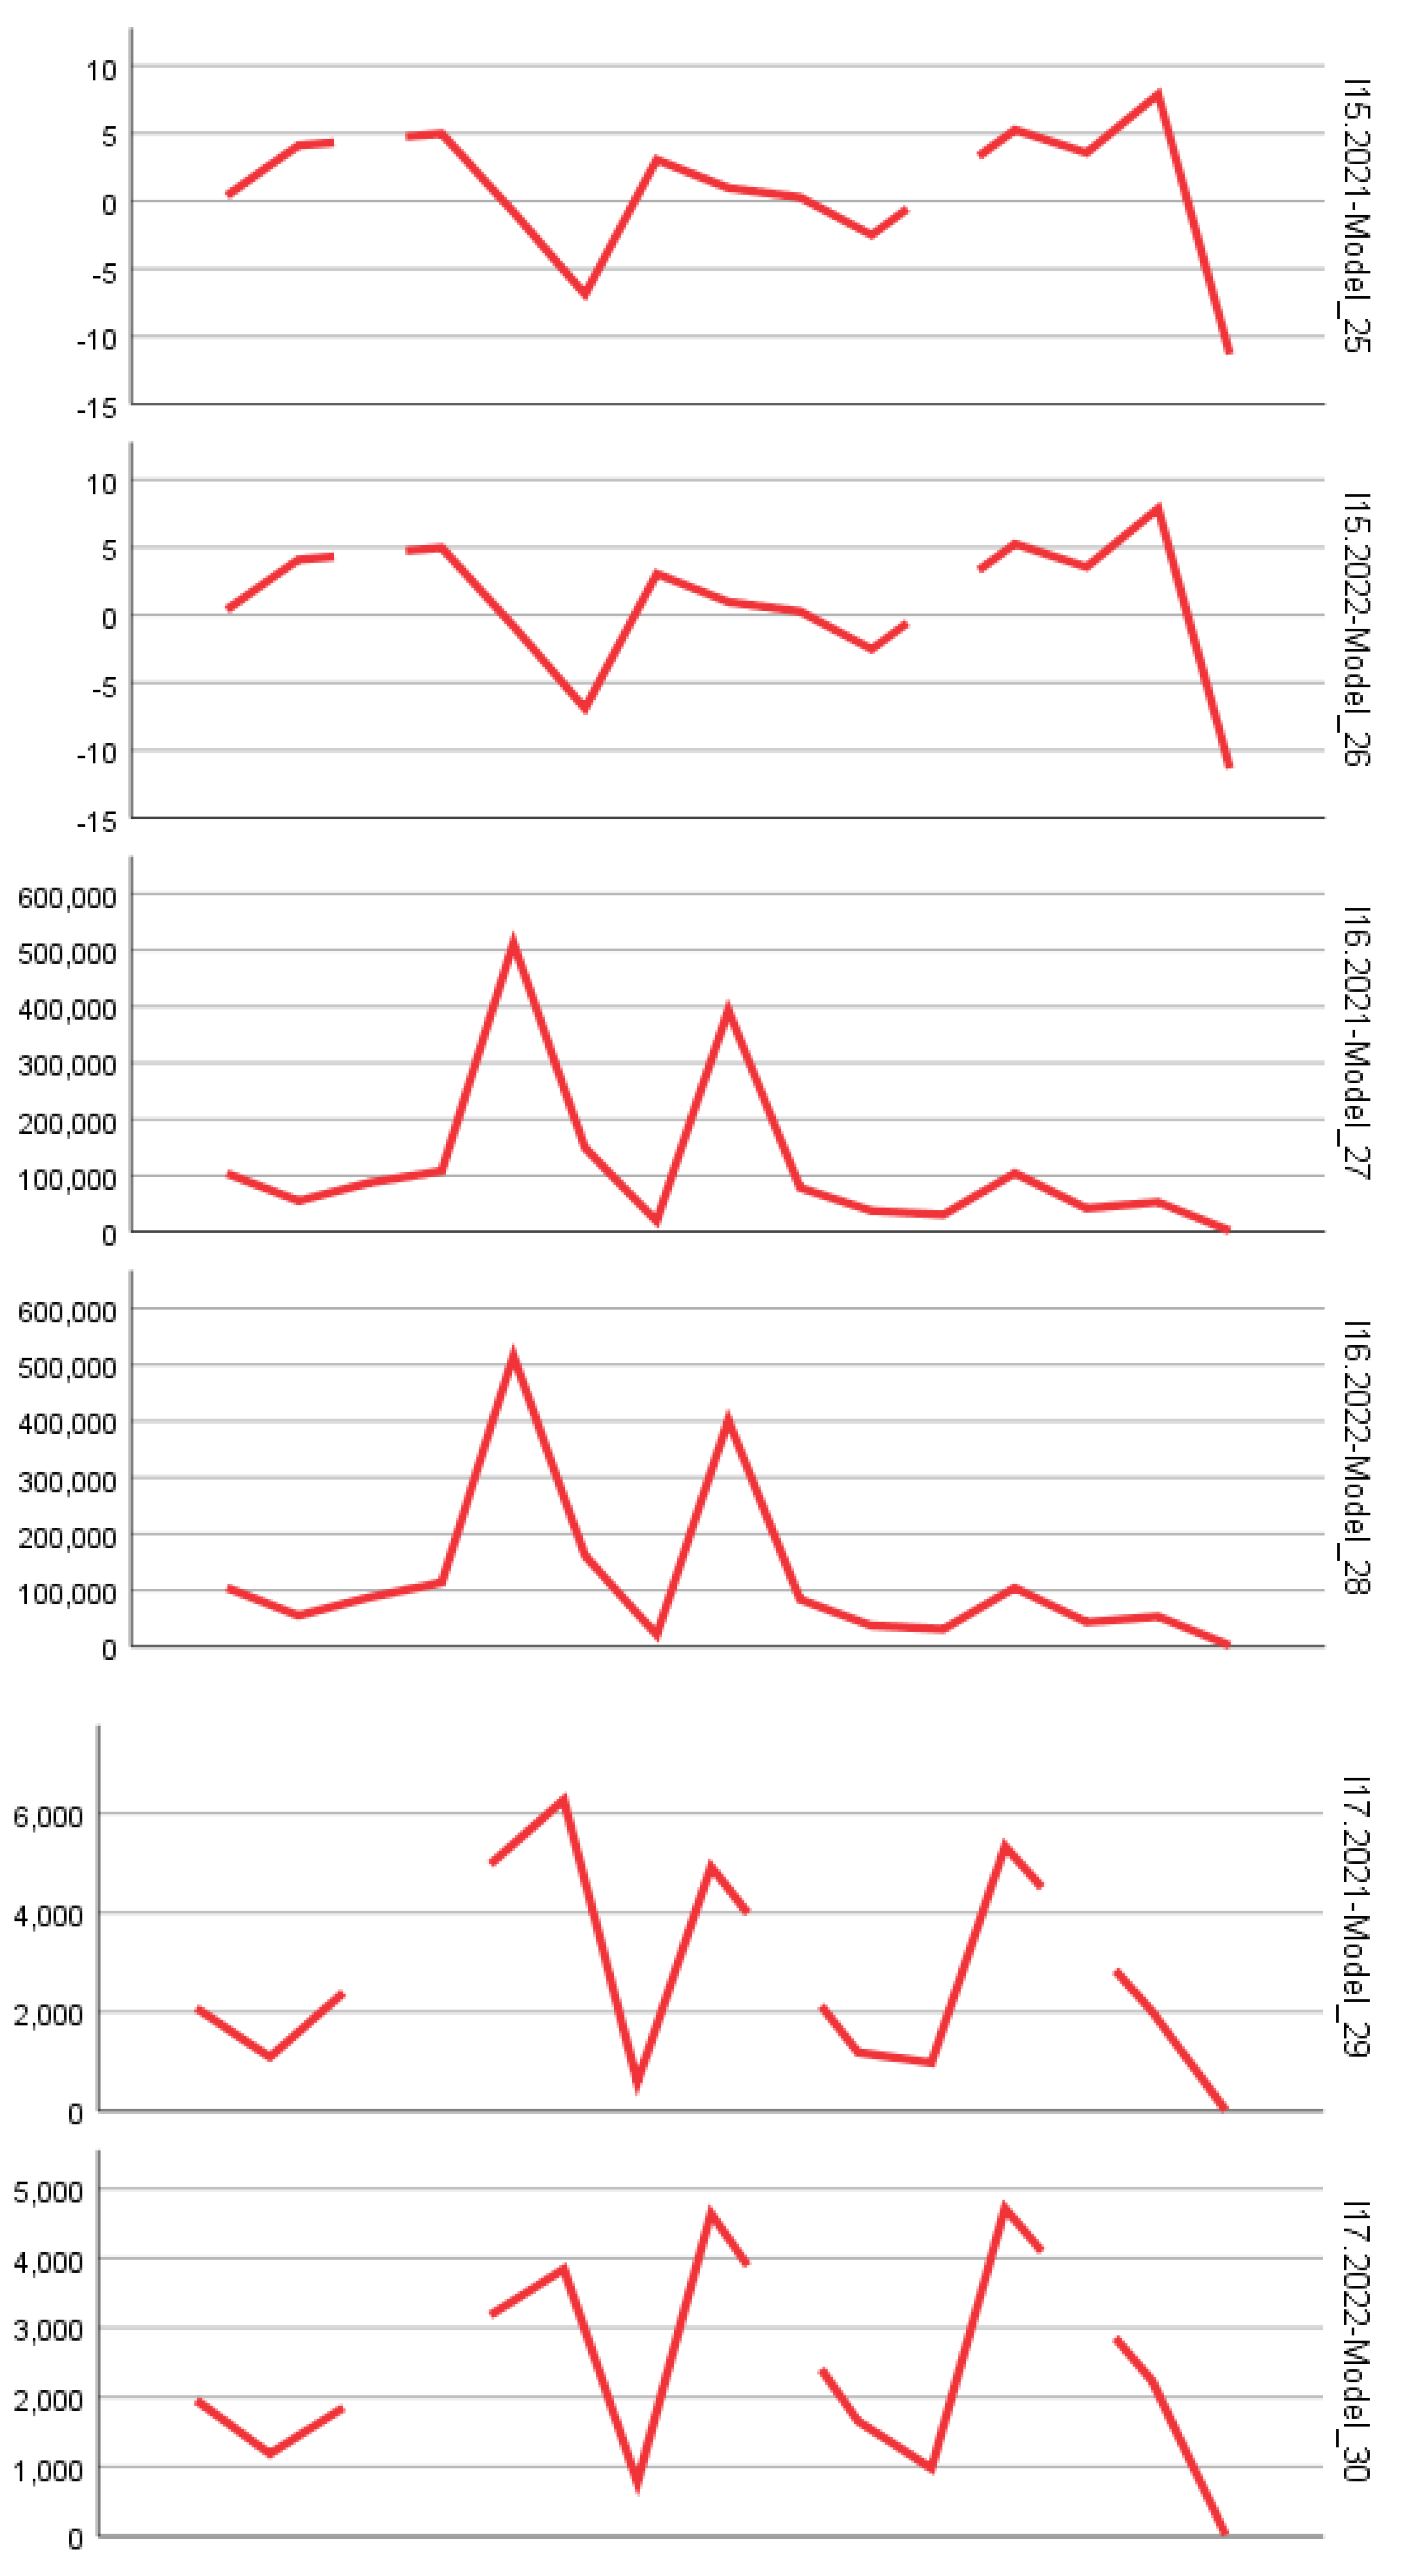
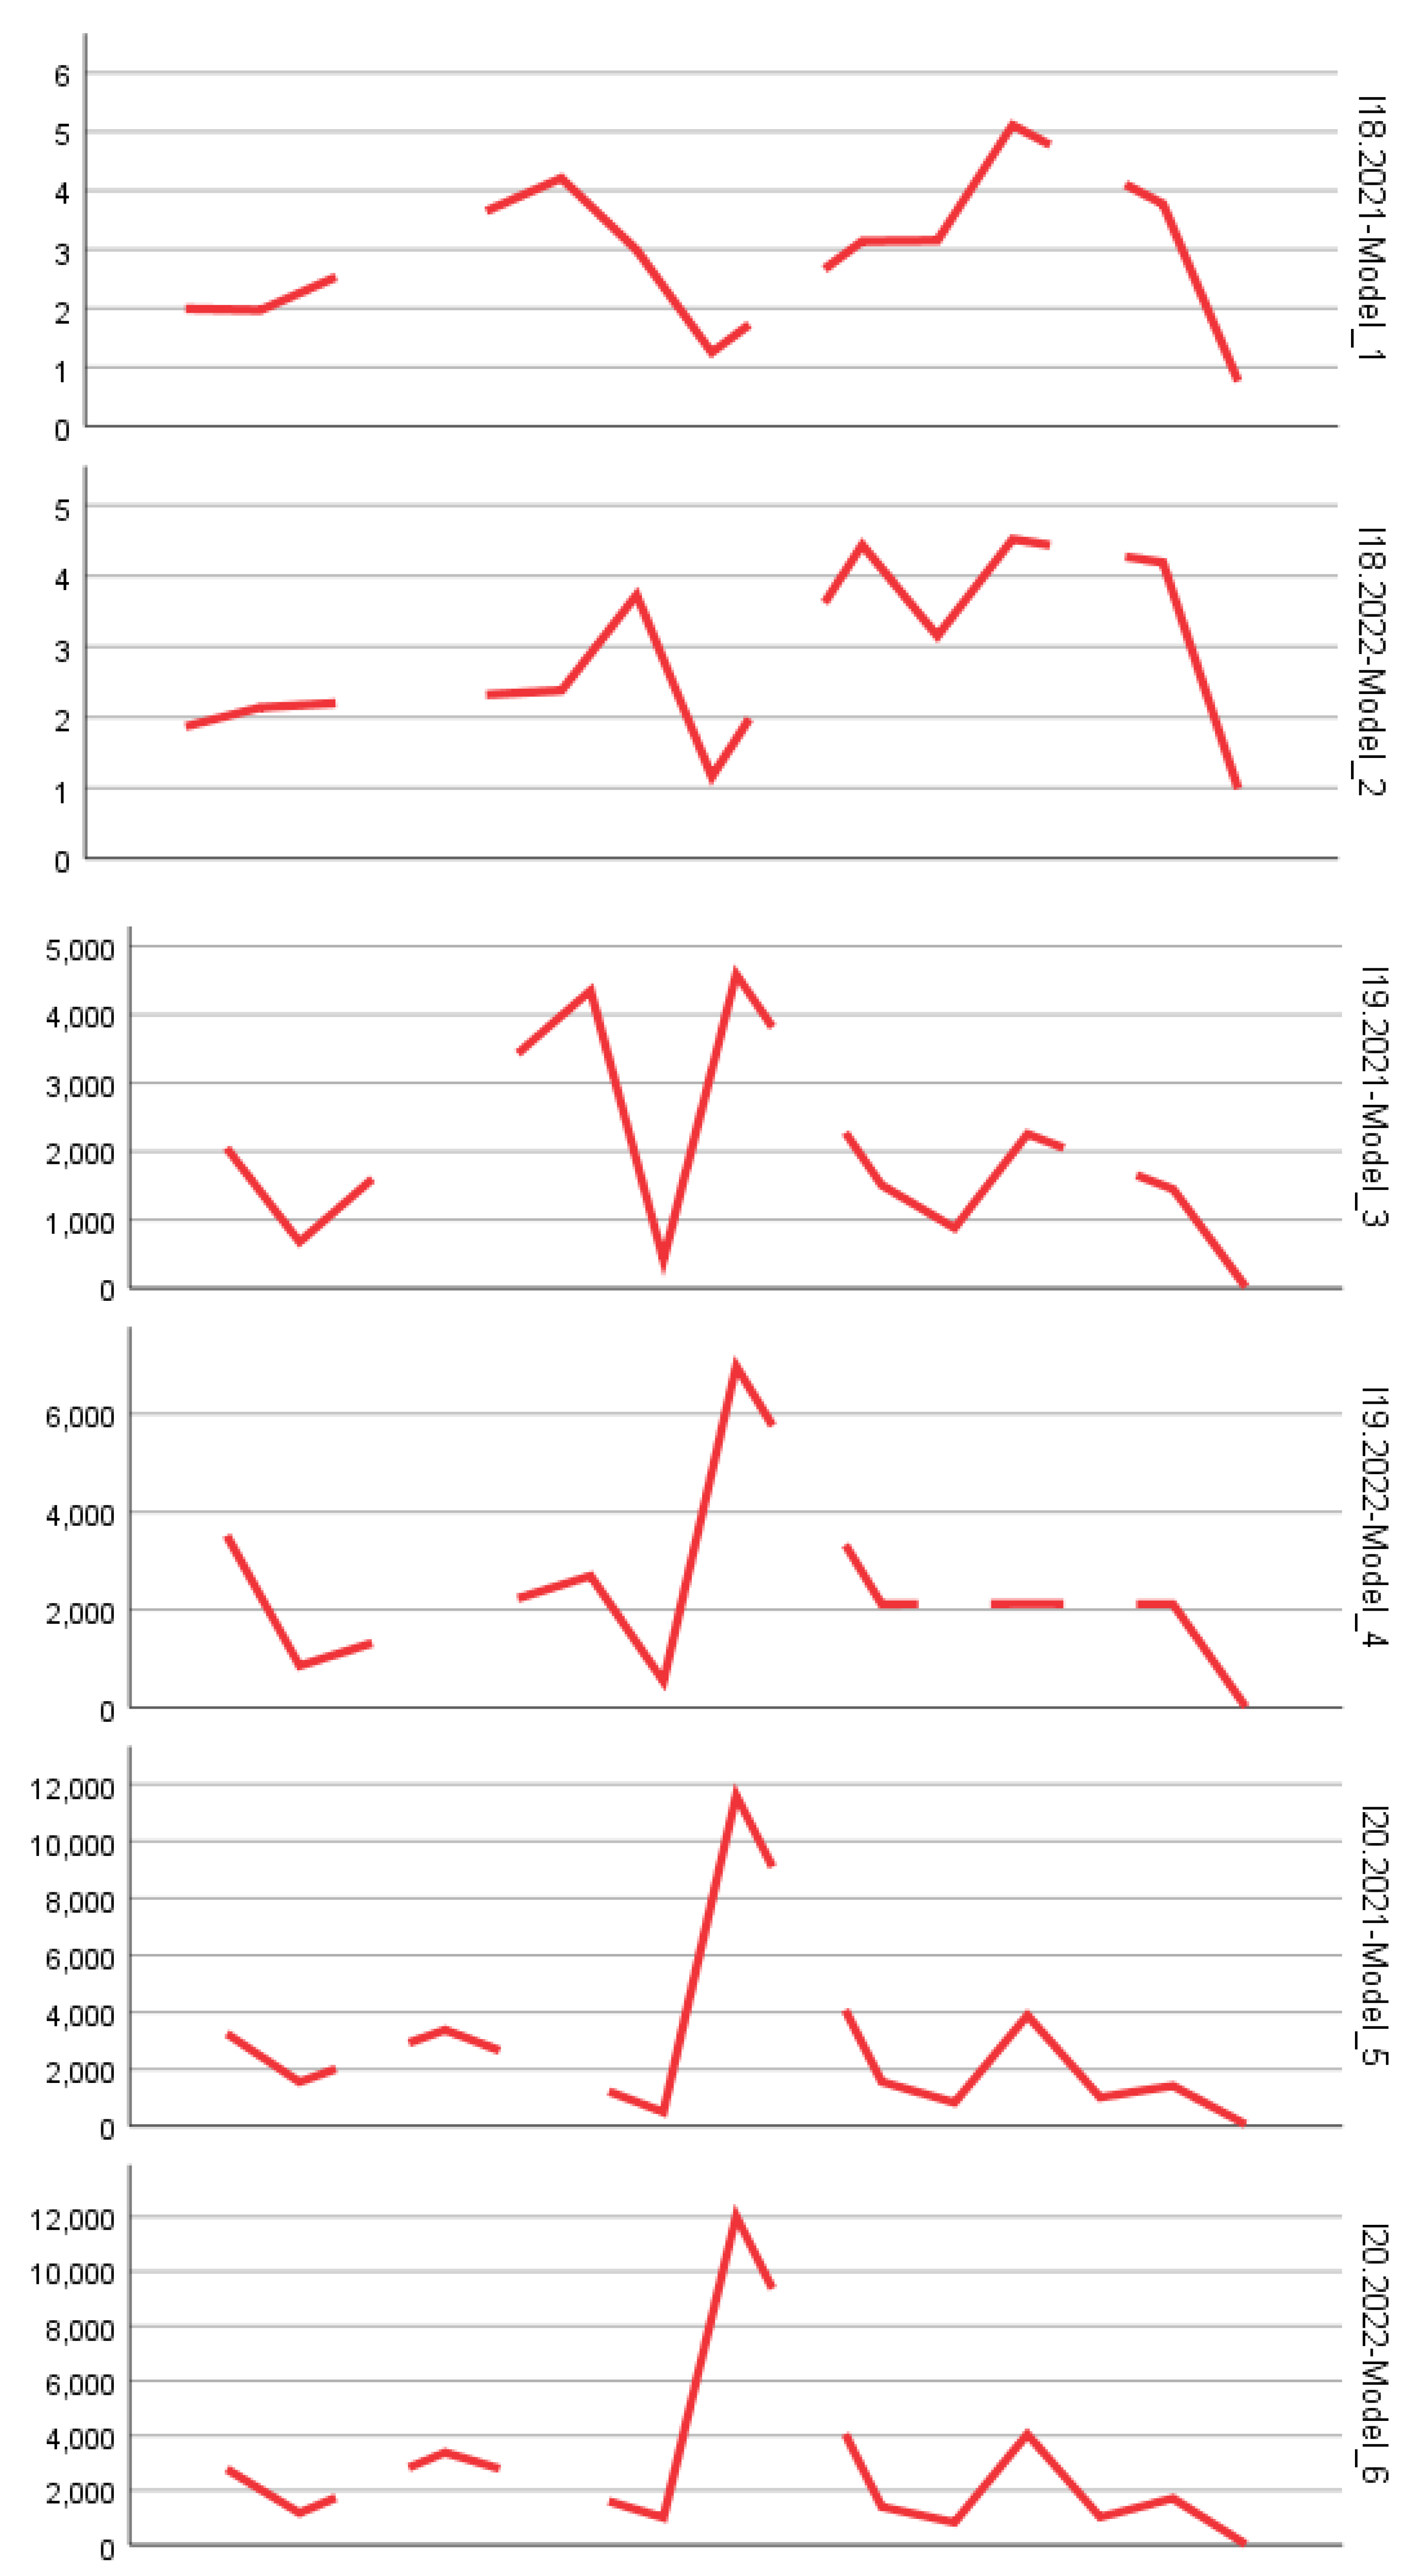
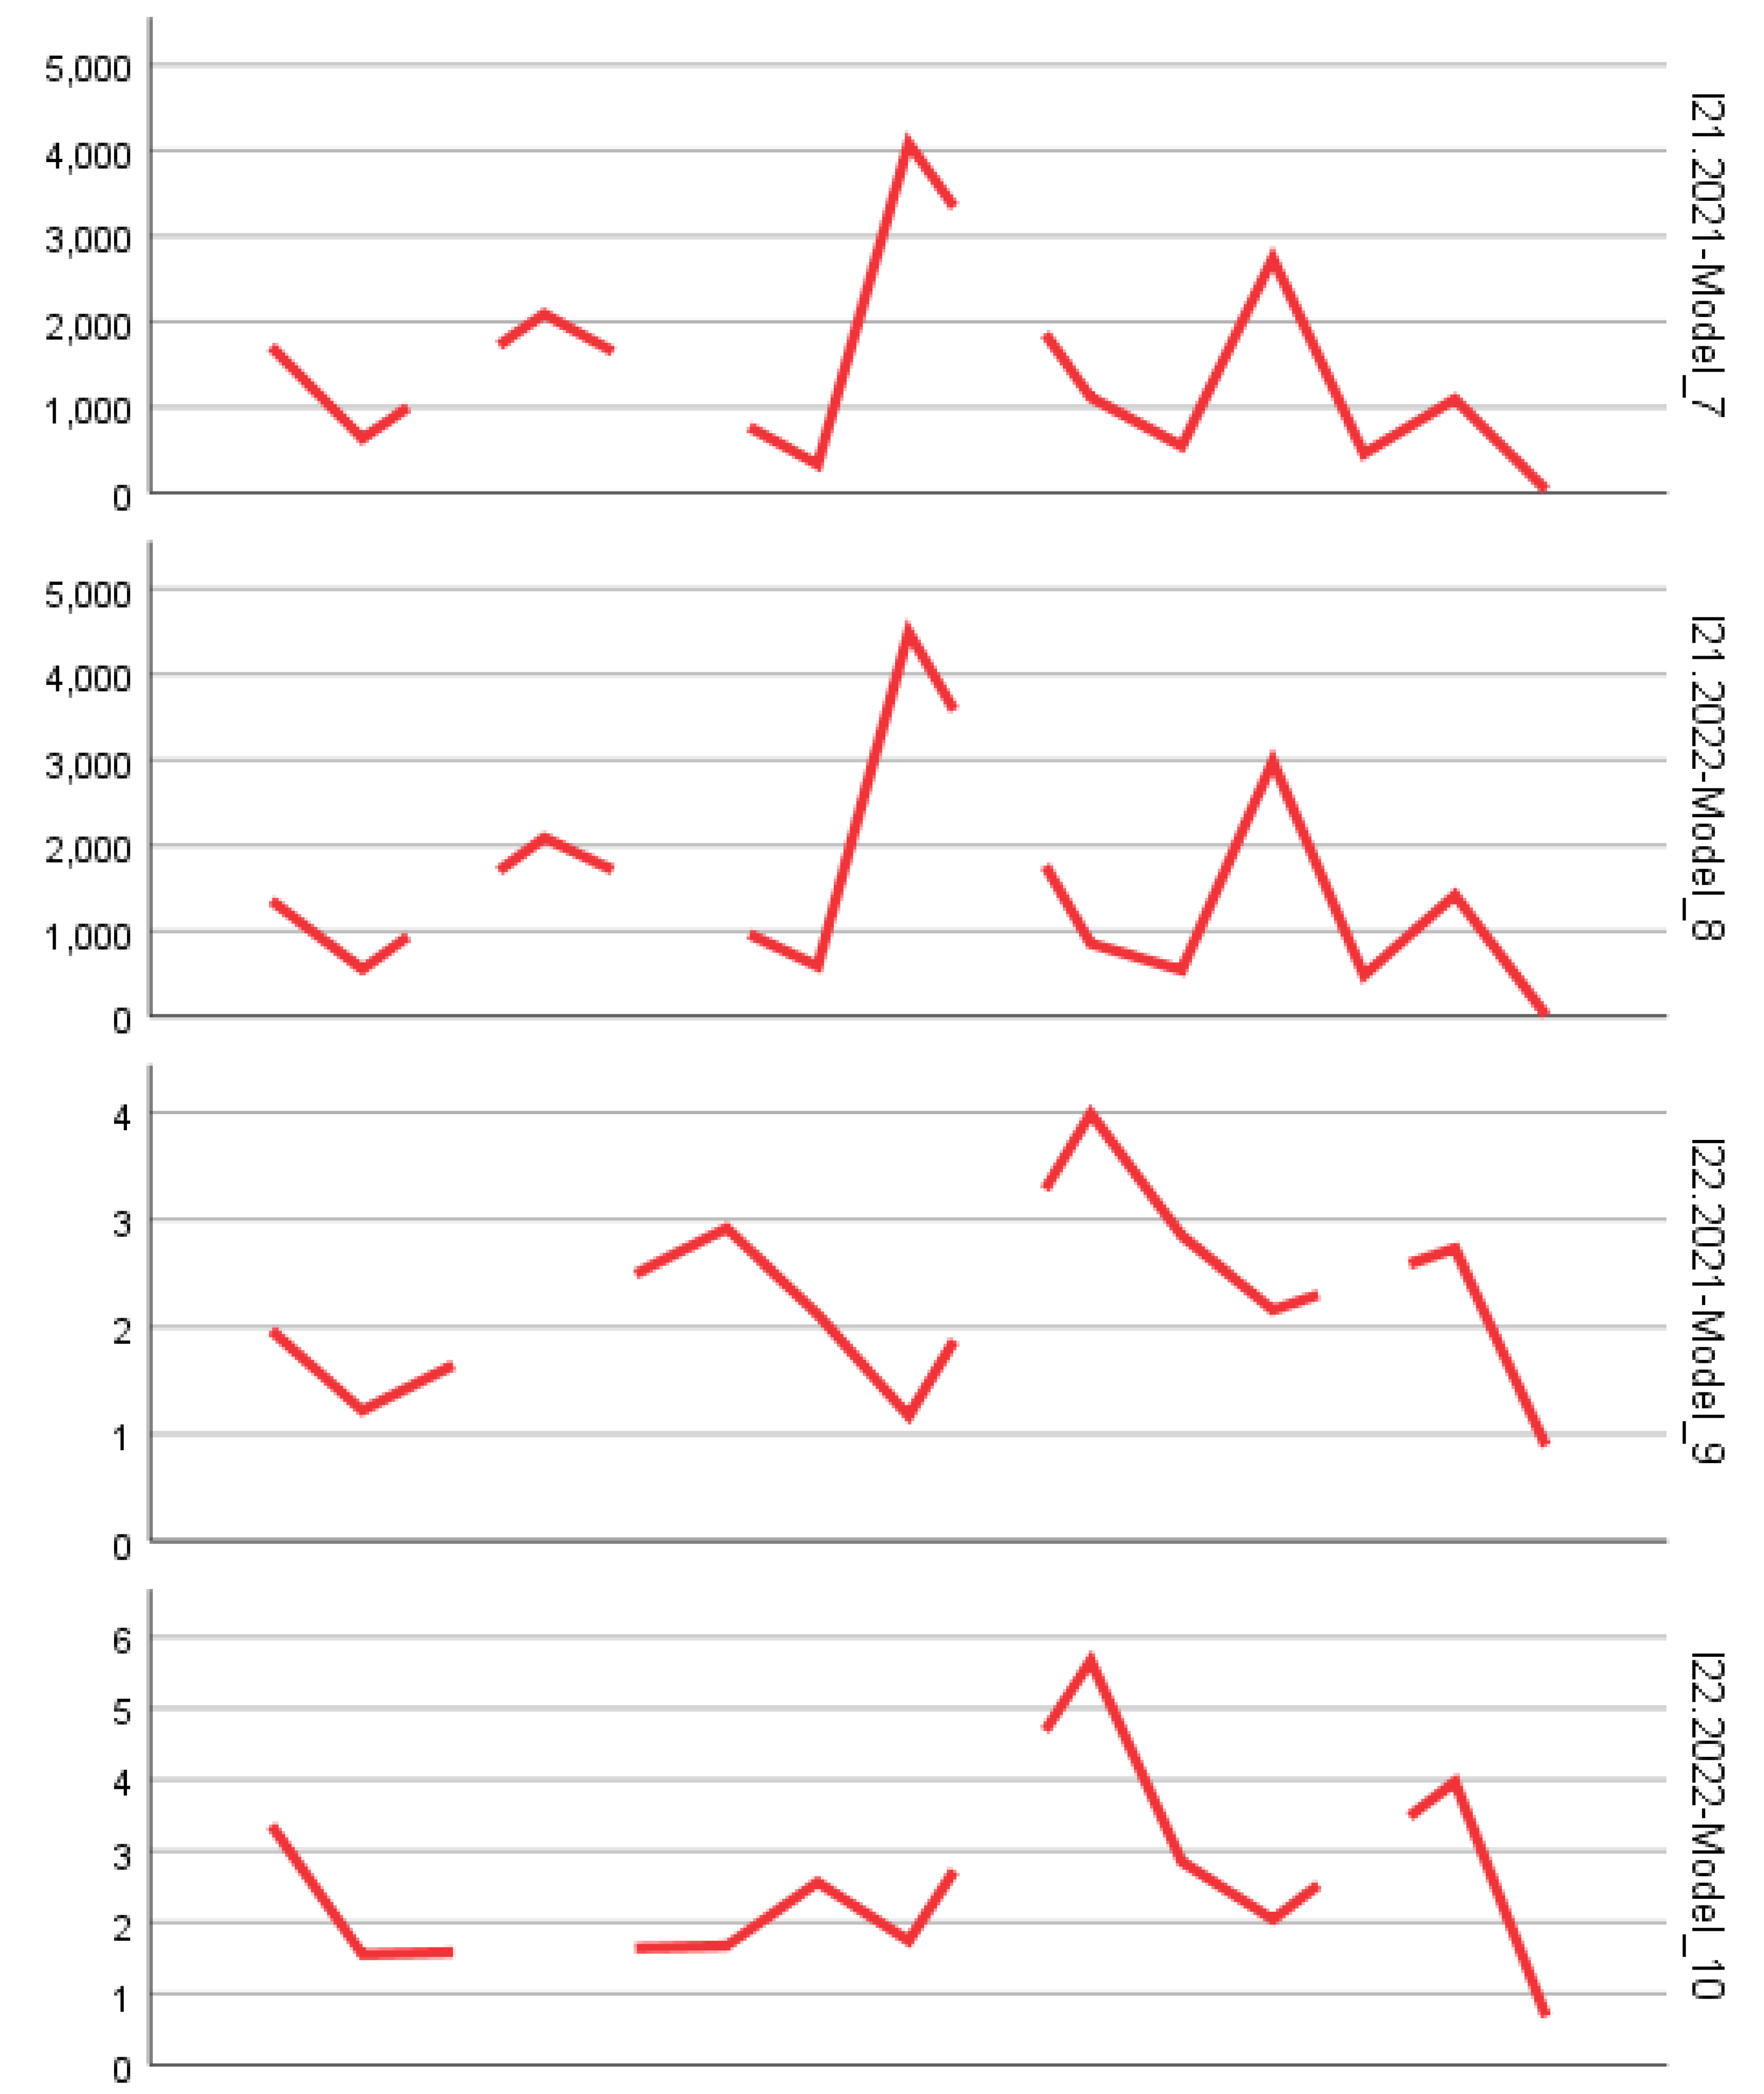
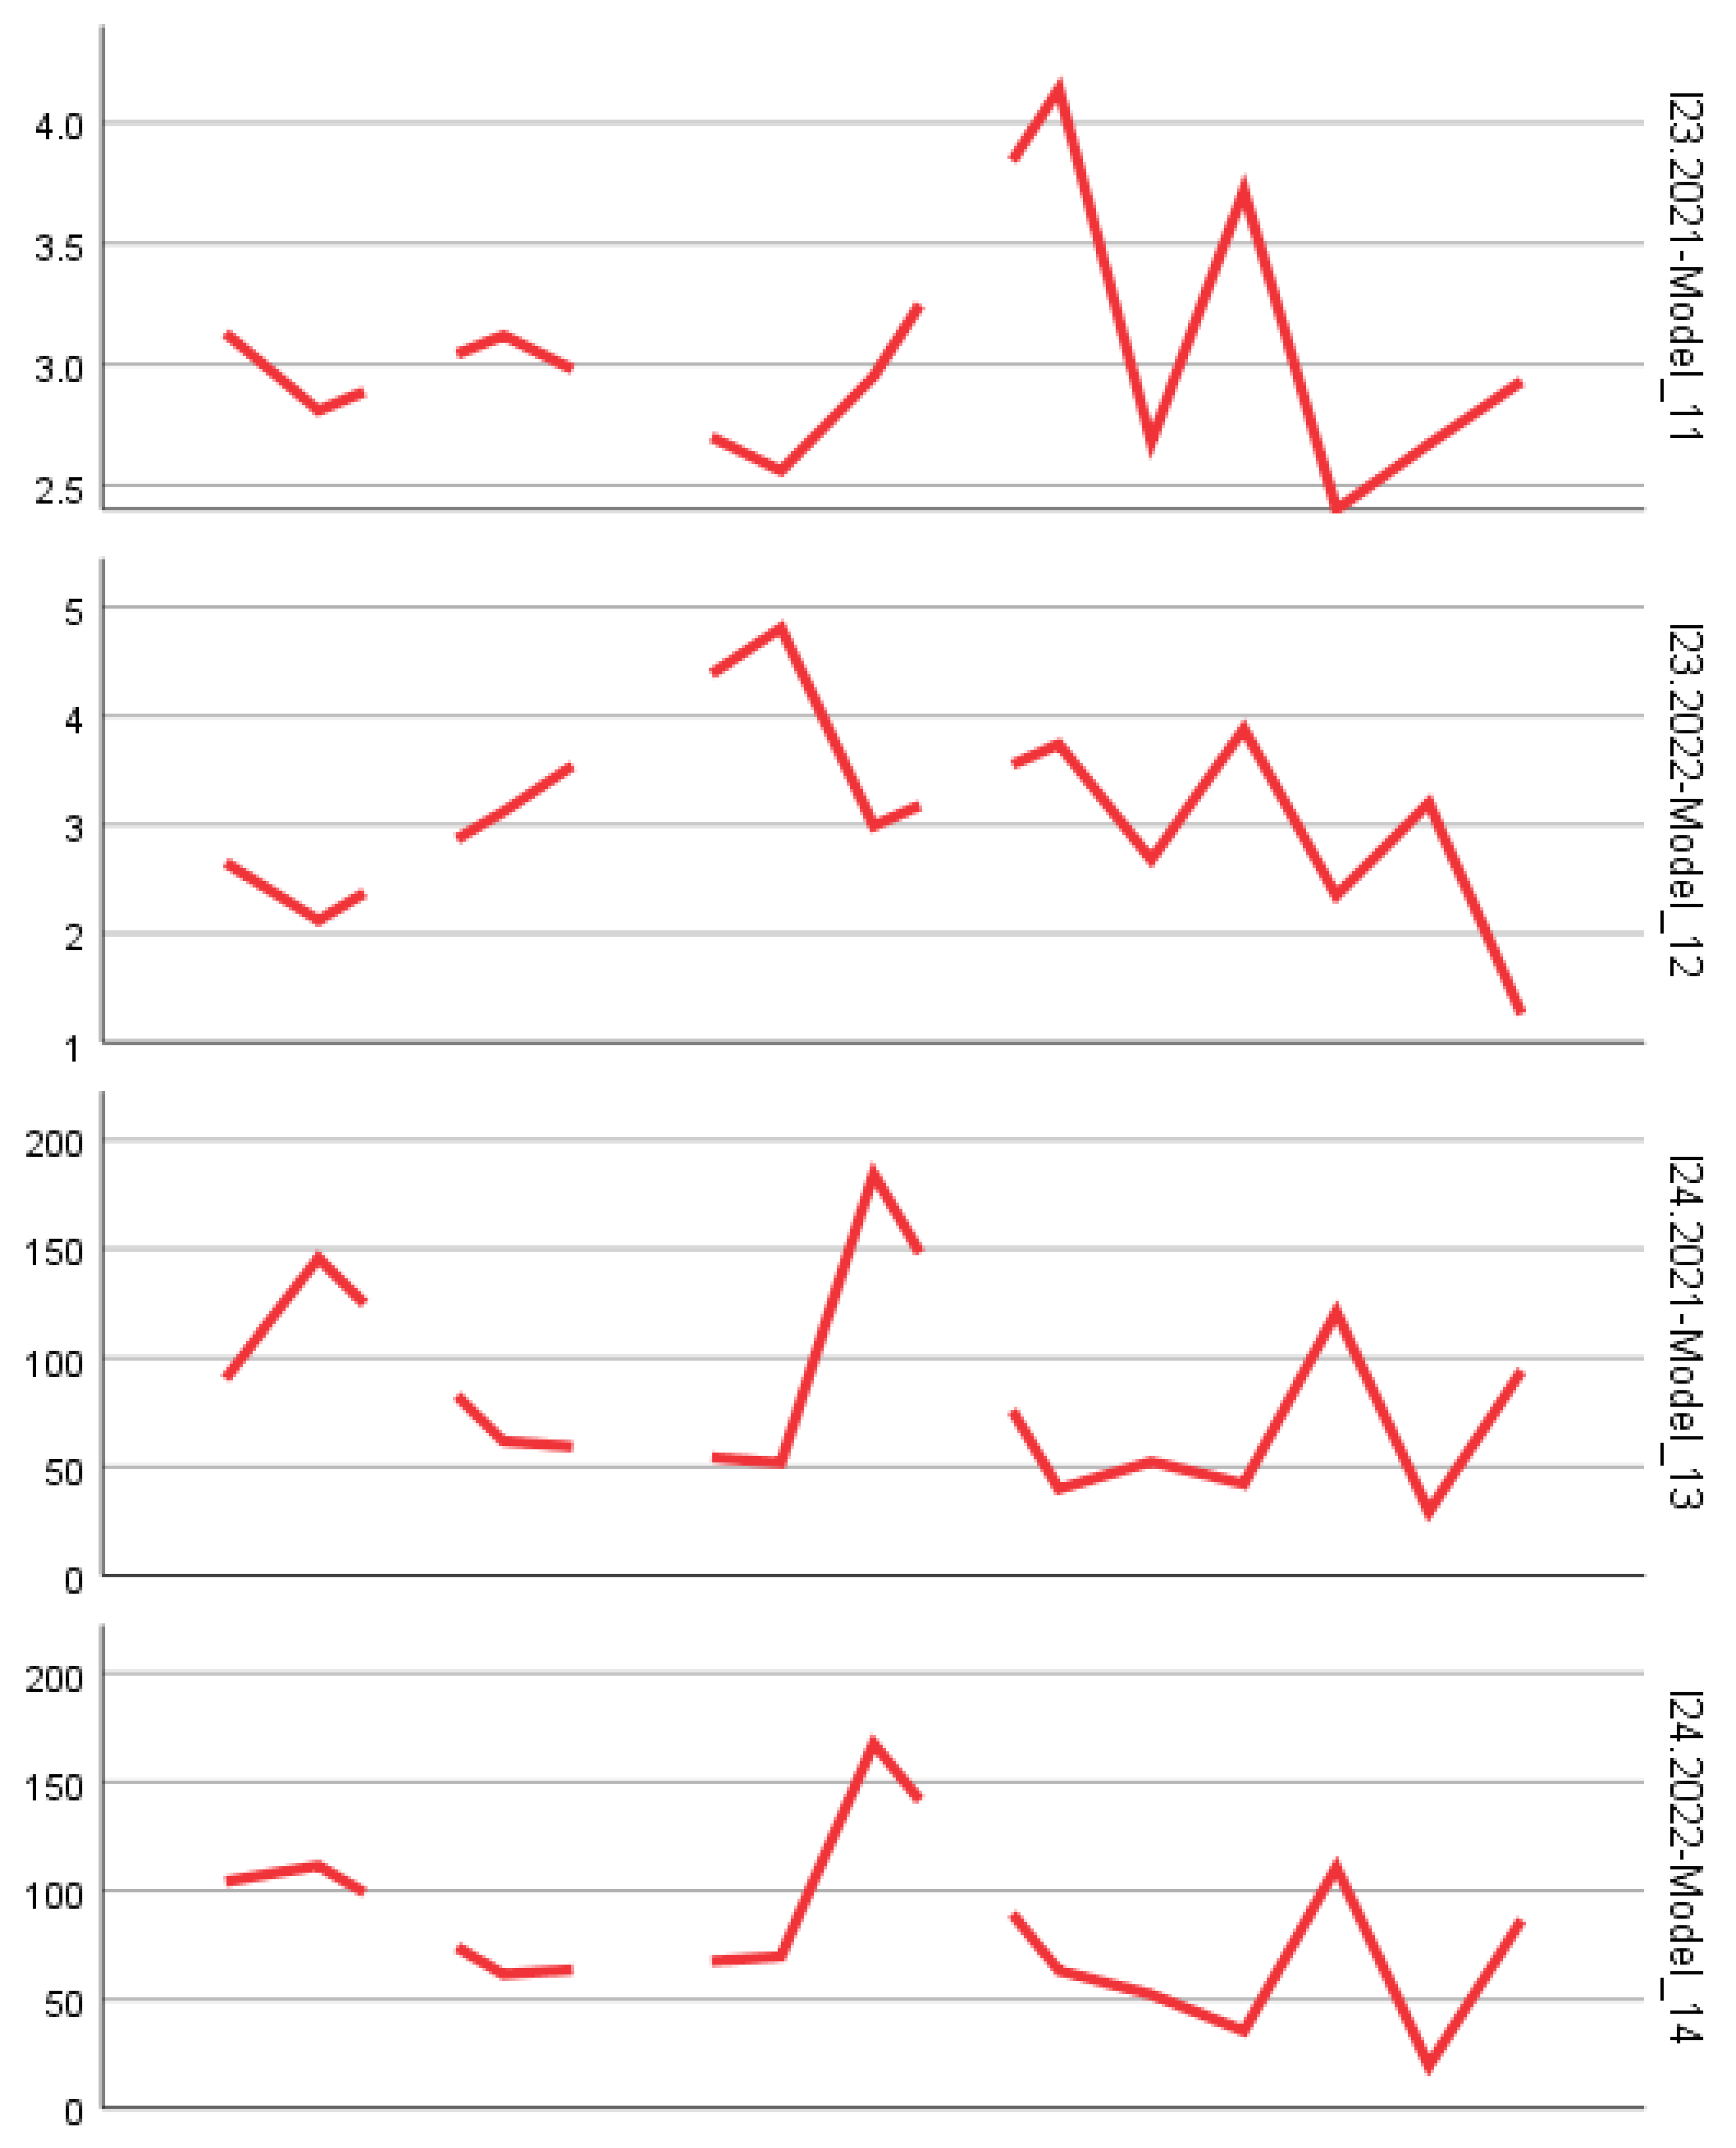
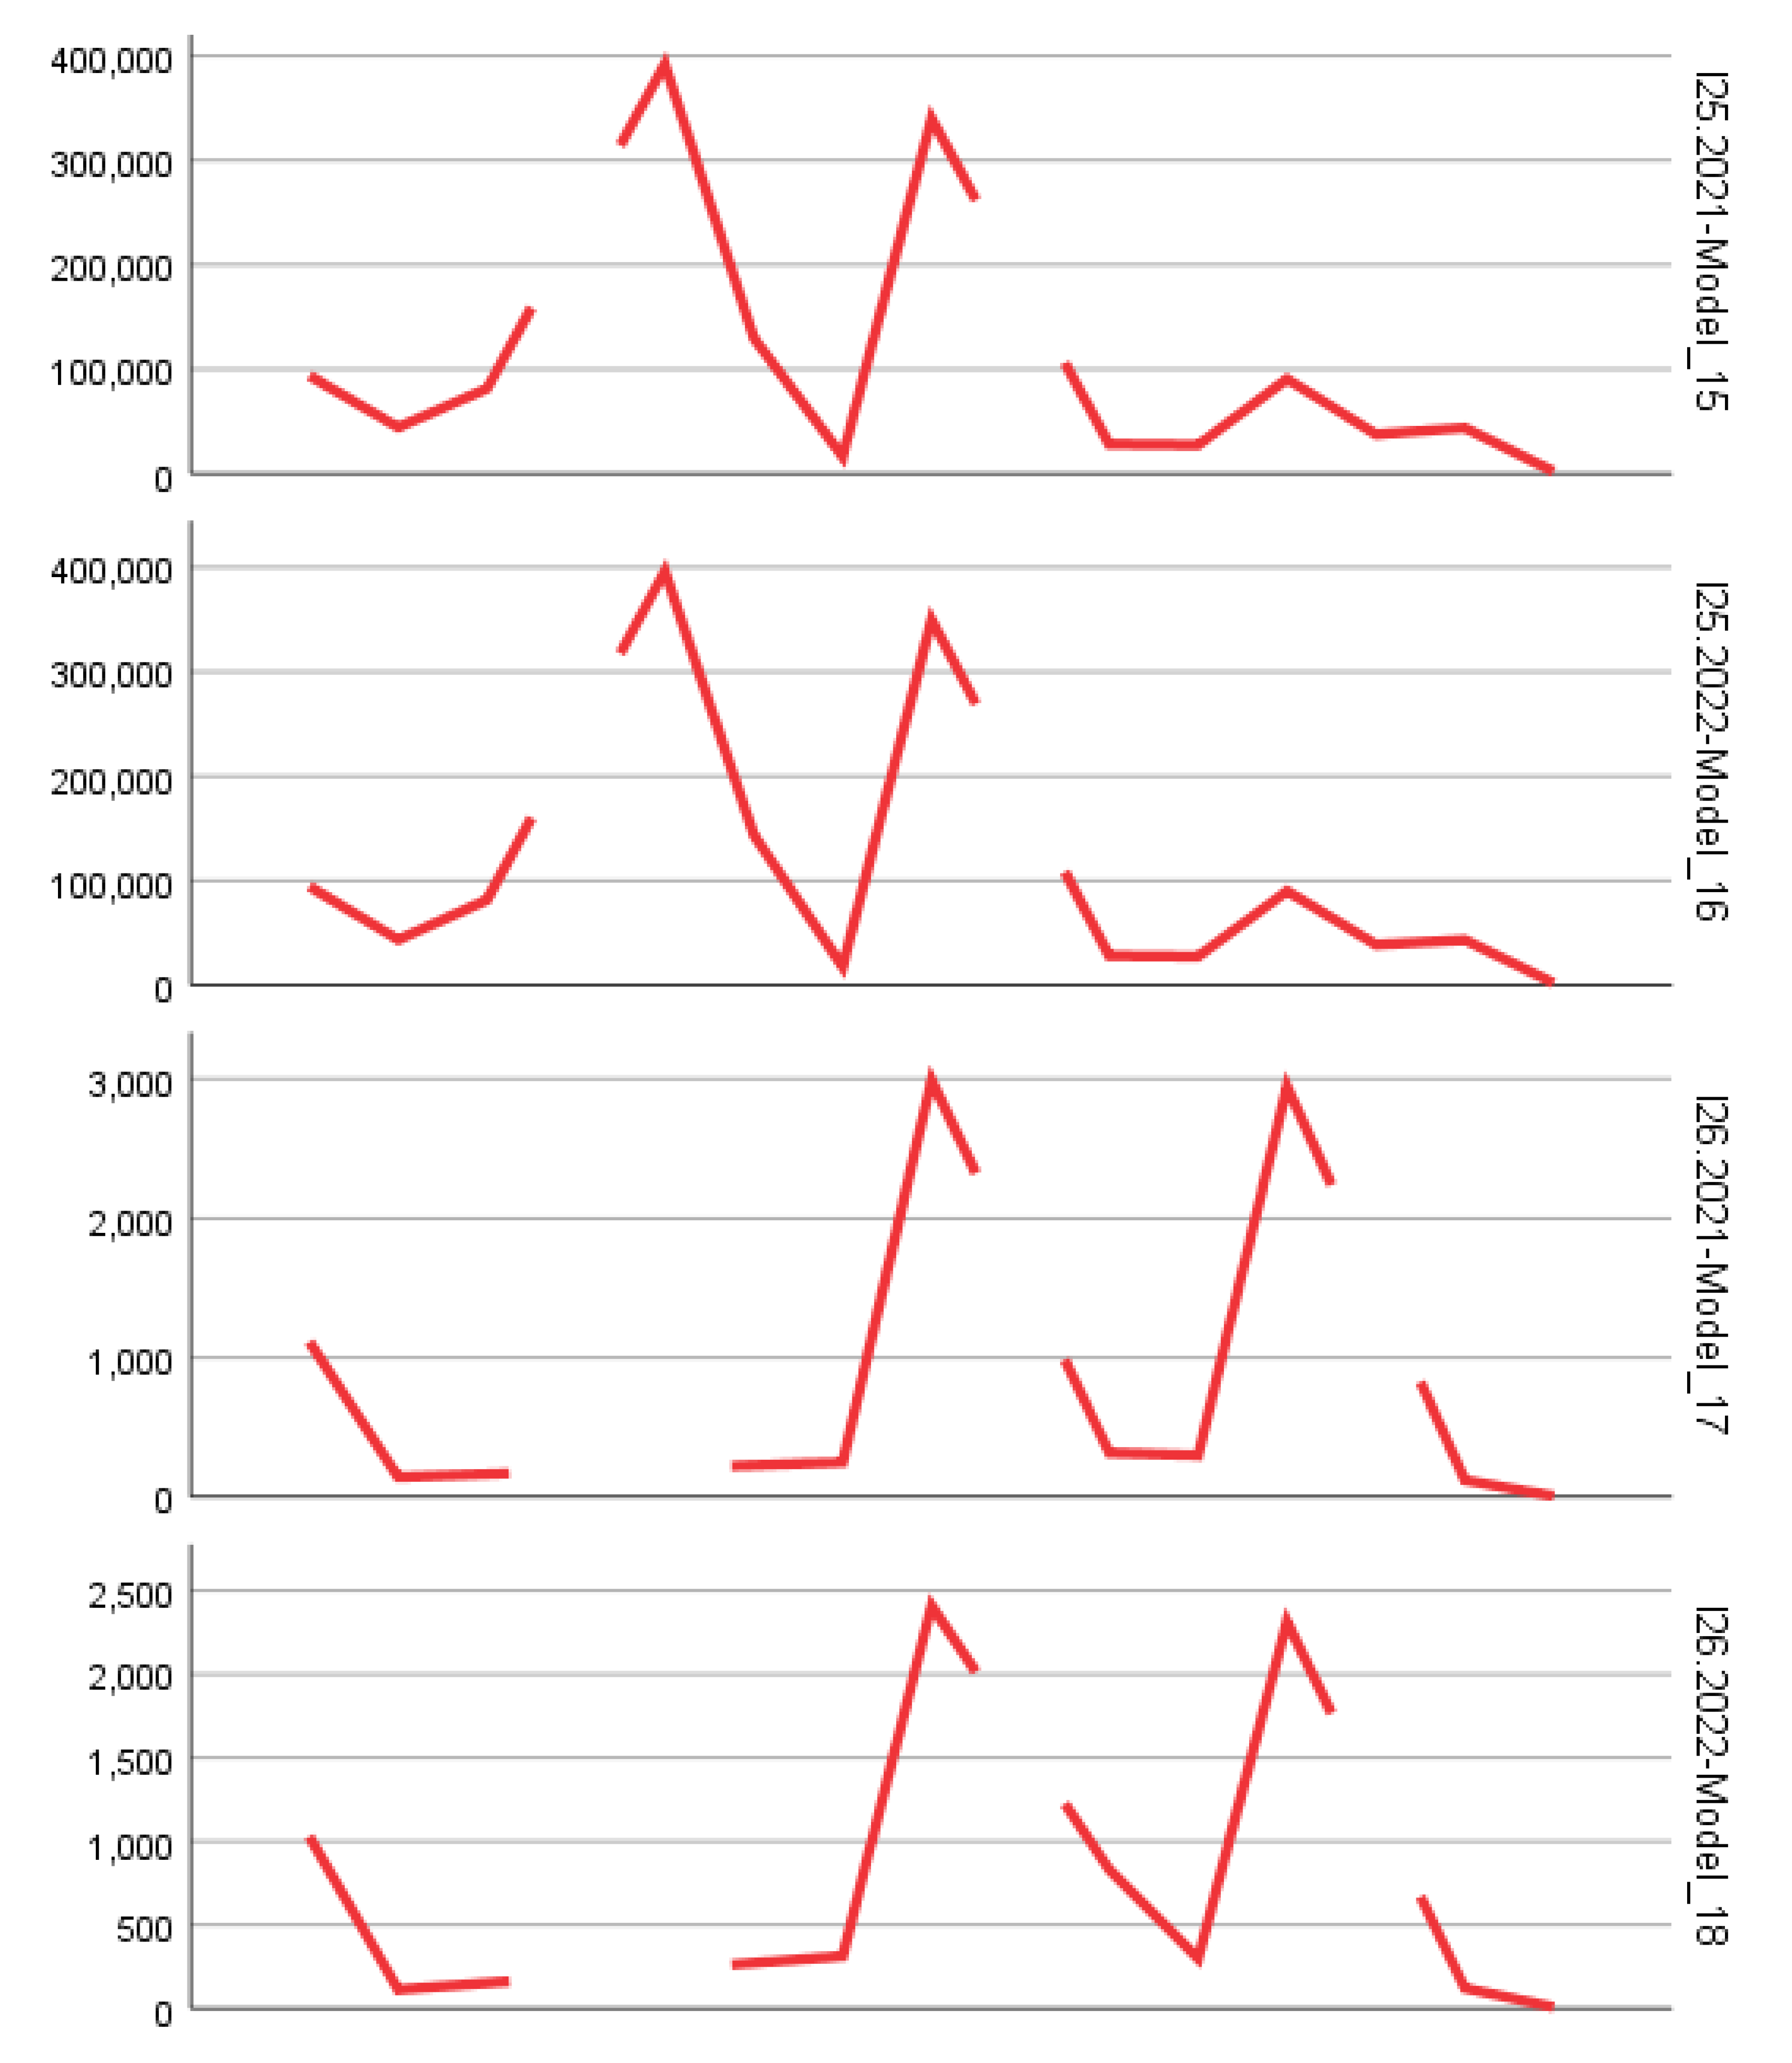
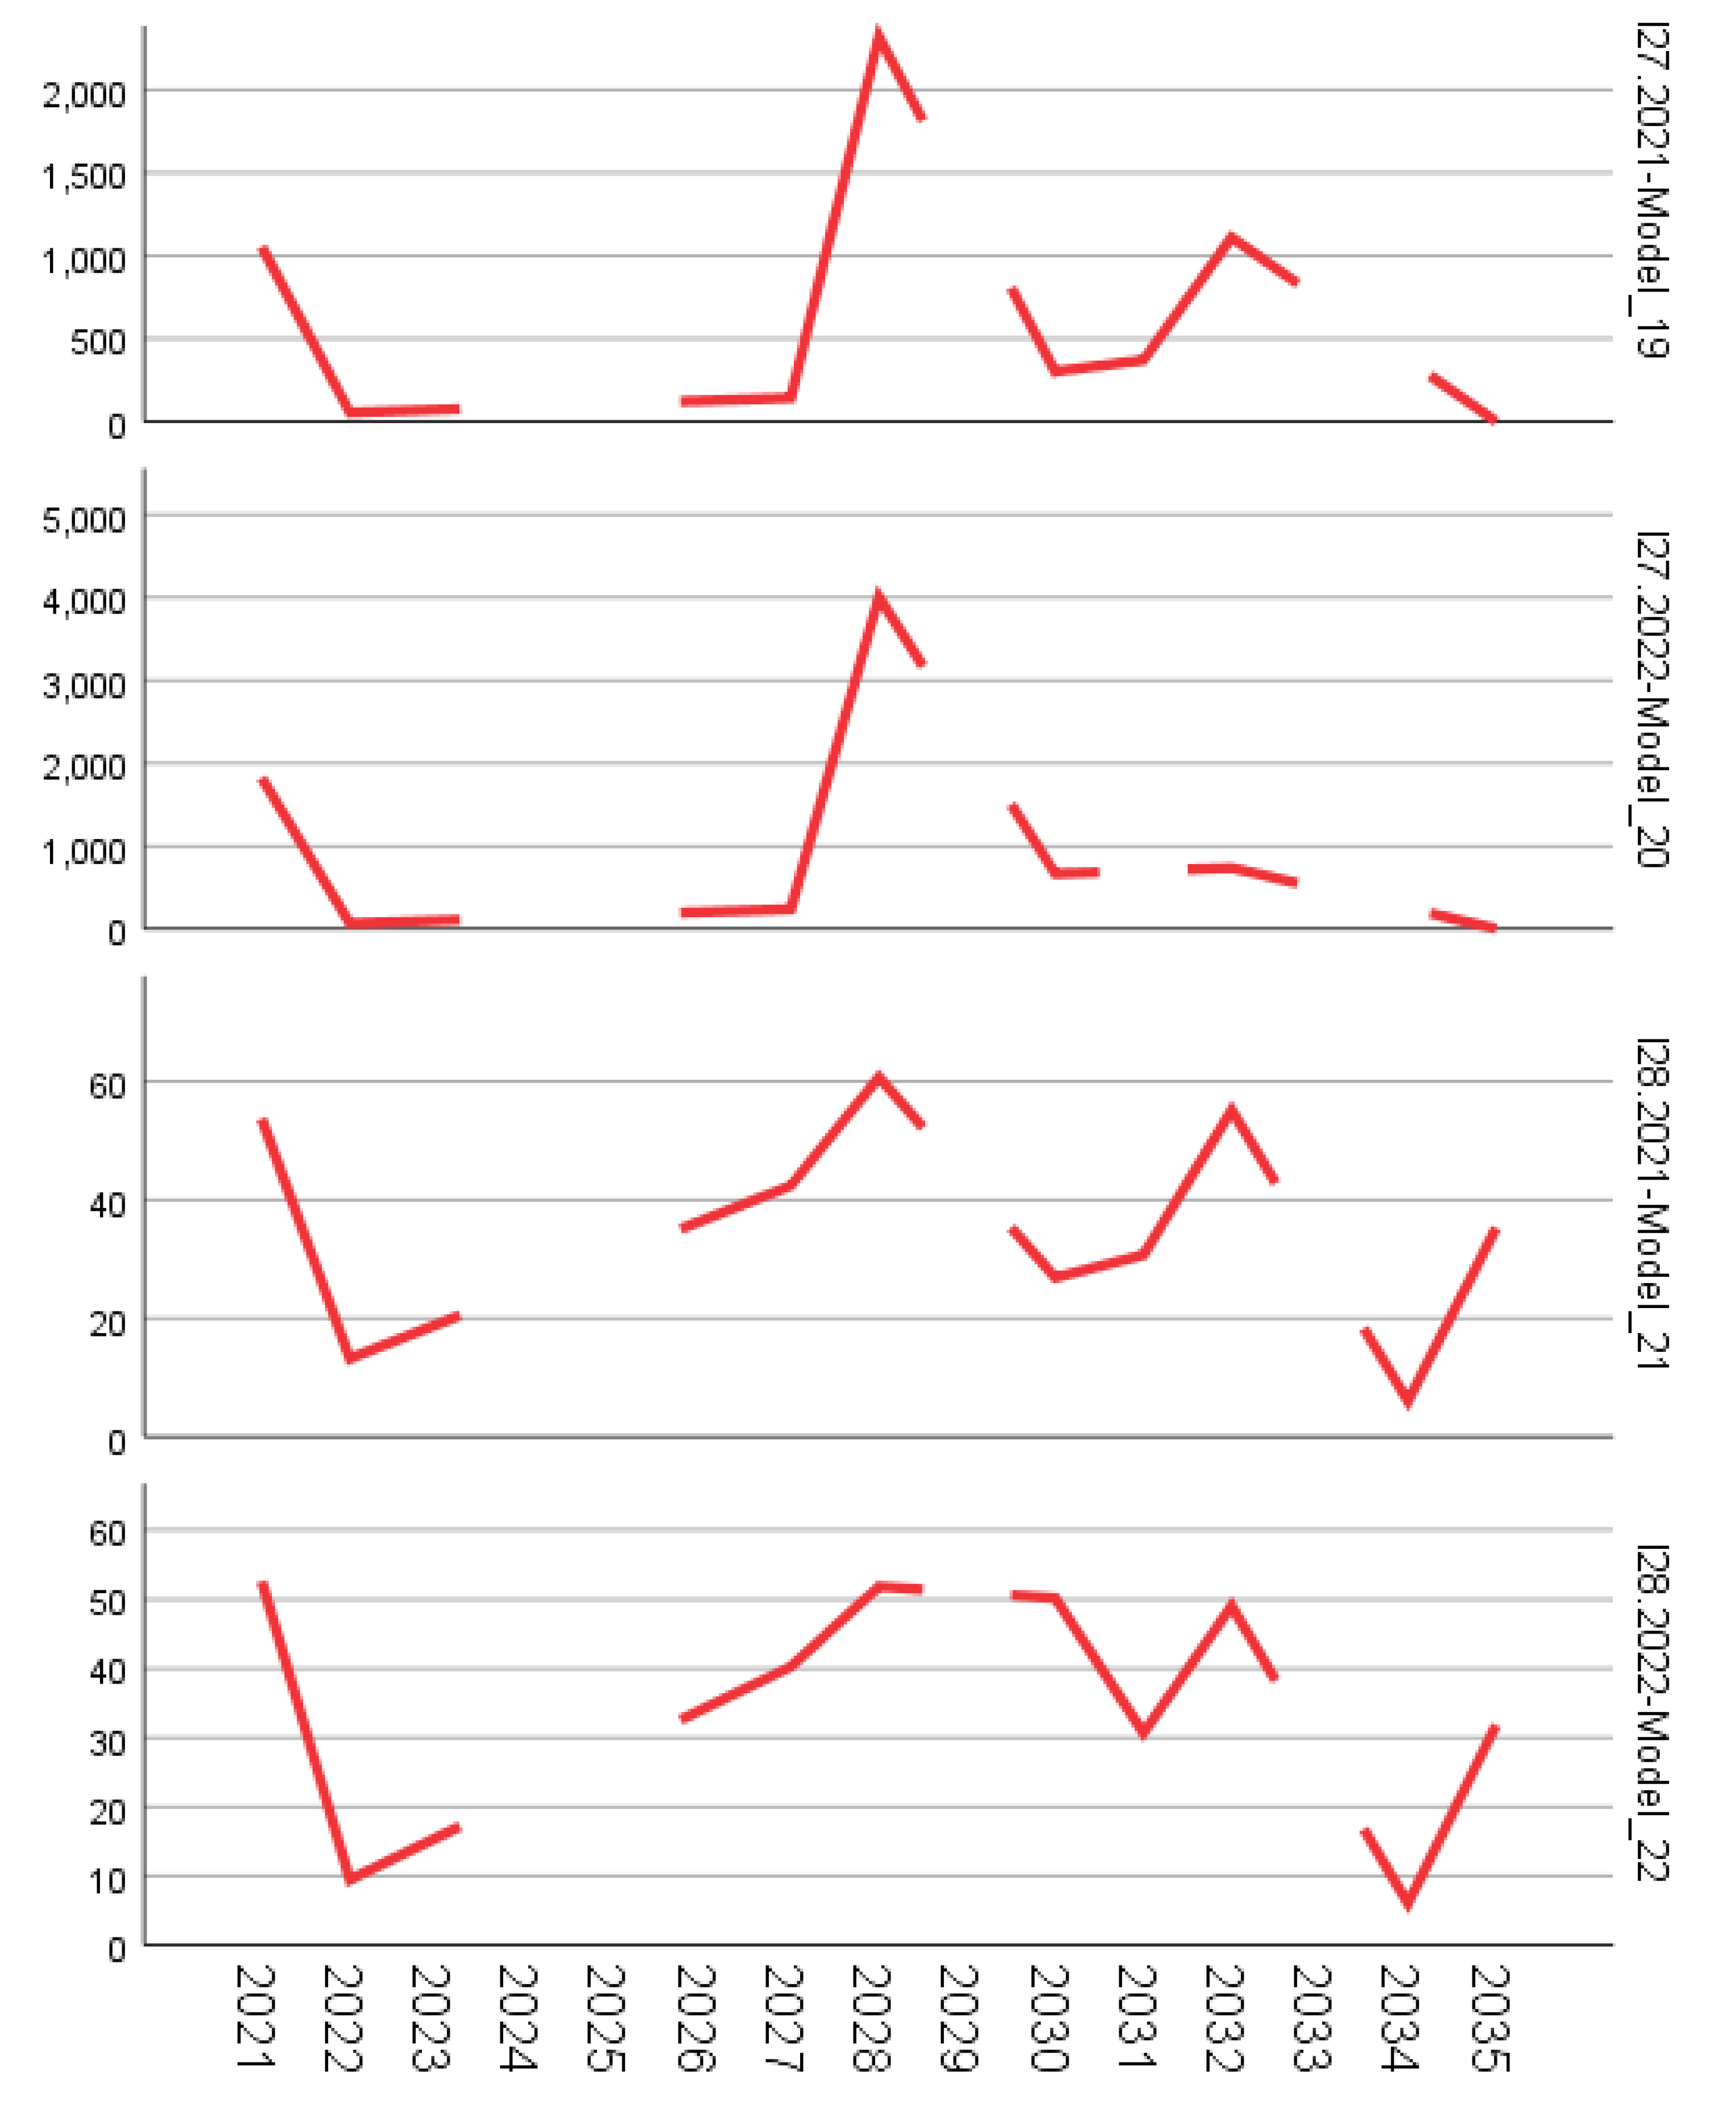

Table 1.
Forecasting Models Fit for I1-I28.
| Model Fit I1-I17 | |||||||||||
| Fit Statistic | Mean | SE | Minimum | Maximum | Percentile | ||||||
| 5 | 10 | 25 | 50 | 75 | 90 | 95 | |||||
| Stationary R-squared | 0.026 | 0.131 | -3.775 | 0.766 | -2.198 | -1.088 | -5.551 | 1.110 | 2.220 | 1.776 | 0.242 |
| R-squared | -0.003 | 0.022 | -0.155 | 0.004 | -3.042 | -1.510 | -2.220 | 5.551 | 2.220 | 1.710 | 5.695 |
| RMSE | 12298.287 | 36261.398 | 0.000 | 144790.424 | 0.241 | 0.647 | 4.157 | 121.446 | 1784.093 | 35873.067 | 131691.376 |
| MAPE | 609.598 | 1257.285 | 0.000 | 8585.307 | 7.898 | 27.860 | 44.908 | 309.755 | 635.806 | 1511.009 | 2098.128 |
| MaxAPE | 5174.804 | 9898.228 | 0.000 | 66825.000 | 17.742 | 67.666 | 178.499 | 2184.652 | 6777.806 | 13515.188 | 15355.067 |
| MAE | 8300.878 | 24448.986 | 0.000 | 95392.160 | 0.167 | 0.473 | 3.242 | 72.258 | 1343.216 | 23210.893 | 90298.925 |
| MaxAE | 32309.672 | 94324.131 | 0.000 | 394633.733 | 0.415 | 1.327 | 7.558 | 367.830 | 3643.664 | 117626.800 | 327628.033 |
| Normalized BIC | 10.083 | 7.567 | -1.750 | 23.947 | -1.314 | 0.206 | 3.404 | 10.156 | 15.290 | 21.159 | 23.788 |
| Model Fit I18-I28 | |||||||||||
| Fit Statistic | Mean | SE | Minimum | Maximum | Percentile | ||||||
| 5 | 10 | 25 | 50 | 75 | 90 | 95 | |||||
| Stationary R-squared | 0.035 | 0.163 | -1.998 | 0.766 | -1.832 | -7.550 | 0.000 | 1.110 | 9.992 | 7.683 | 0.651 |
| R-squared | 0.000 | 0.001 | -1.998 | 0.004 | -1.832 | -7.550 | 0.000 | 1.110 | 9.992 | 7.683 | 0.004 |
| RMSE | 12078.644 | 36324.139 | 0.515 | 125605.530 | 0.581 | 0.954 | 1.417 | 863.179 | 1686.456 | 87028.717 | 125199.944 |
| MAPE | 981.914 | 1842.691 | 12.151 | 8585.307 | 14.705 | 33.778 | 61.146 | 451.557 | 1107.963 | 2301.785 | 7668.963 |
| MaxAPE | 7834.999 | 14288.727 | 27.295 | 66825.000 | 43.698 | 139.881 | 263.674 | 3885.100 | 10002.579 | 15385.643 | 59113.028 |
| MAE | 8470.922 | 25462.731 | 0.376 | 88744.130 | 0.425 | 0.711 | 1.081 | 673.877 | 1239.634 | 60444.861 | 88249.865 |
| MaxAE | 28267.425 | 85053.244 | 1.130 | 292010.615 | 1.229 | 1.800 | 2.880 | 1616.764 | 3480.146 | 205675.162 | 291681.008 |
| Normalized BIC | 10.272 | 7.650 | -1.108 | 23.679 | -0.923 | 0.128 | 0.927 | 13.767 | 15.079 | 21.476 | 23.673 |
Disclaimer/Publisher’s Note: The statements, opinions and data contained in all publications are solely those of the individual author(s) and contributor(s) and not of MDPI and/or the editor(s). MDPI and/or the editor(s) disclaim responsibility for any injury to people or property resulting from any ideas, methods, instructions or products referred to in the content. |
© 2025 by the authors. Licensee MDPI, Basel, Switzerland. This article is an open access article distributed under the terms and conditions of the Creative Commons Attribution (CC BY) license (http://creativecommons.org/licenses/by/4.0/).
Copyright: This open access article is published under a Creative Commons CC BY 4.0 license, which permit the free download, distribution, and reuse, provided that the author and preprint are cited in any reuse.


