Submitted:
12 May 2025
Posted:
12 May 2025
You are already at the latest version
Abstract
Autism Spectrum Disorder (ASD) is a clinically heterogeneous neurodevelopmental condition increasingly linked to systemic metabolic dysfunction. In this study, we applied a transcriptomics-based systems framework—Personalized Metabolic Margin Mapping (PM³) - to analyze prefrontal cortex samples from 12 individuals with ASD and 12 neurotypical controls. Differential expression of 158 curated metabolic genes was assessed across pathways related to energy metabolism, redox regulation, one-carbon cycling, and detoxification. Unsupervised machine learning (Isolation Forest and K-means clustering), combined with Euclidean and percentage distance metrics, revealed consistent downregulation of mitochondrial enzymes and transporters - most notably the multivitamin symporters SLC5A6 and SLC19A2, which mediate the uptake of biotin, pantothenic acid, thiamine, and lipoic acid. These alterations were accompanied by upregulation of redox and sulfur-handling genes, indicating compensatory adaptation to metabolic stress. We propose a unifying hypothesis in which chronic microbial lipopolysaccharide (LPS) exposure suppresses vitamin transport, triggering a cascade of mitochondrial dysfunction and metabolic reprogramming in the ASD brain. This transcriptomic signature supports the concept of a “metabolic autism spectrum” and highlights nutrient transport bottlenecks as modifiable targets for precision therapies. The PM³ model offers a mechanistically grounded platform for stratifying ASD by metabolic subtype and guiding future intervention studies. We invite prospective validation of this model using integrated transcriptomic–metabolomic approaches in LPS-exposed systems.

Keywords:
autism spectrum disorder (ASD)
; systems biology
; mitochondrial dysfunction
; SLC5A6
; SLC19A2
; biotin
; thiamine
; pantothenic acid
; transcriptomics
; lipopolysaccharide (LPS)
; metabolic reprogramming
; redox adaptation
; precision medicine
; multivitamin transporters
; neurodevelopment
1. Introduction
Autism spectrum disorder (ASD) is a complex neurodevelopmental condition characterized by persistent deficits in social communication and interaction, accompanied by restricted interests and repetitive behaviors. Despite decades of research and the identification of hundreds of associated genetic variants, the biological mechanisms linking genotype to phenotype remain incompletely understood [1,2]. Emerging evidence suggests that ASD is not limited to neural circuit dysfunction, but also involves systemic metabolic abnormalities, including mitochondrial dysfunction, oxidative stress, altered amino acid metabolism, and impaired detoxification [3,4].
Transcriptomic and metabolomic studies of ASD brain tissue have consistently shown reduced oxidative phosphorylation, glutathione depletion, and repression of mitochondrial gene expression [4,5,6]. Together, these findings suggest a broader pattern of bioenergetic collapse and redox imbalance. Notably, such metabolic alterations may arise not only from genetic predisposition, but also from environmental factors-particularly microbial metabolites and immune activation-that interact with host metabolism during critical periods of brain development [7,8,9].
Among these factors, lipopolysaccharide (LPS)—an endotoxin derived from gram-negative gut bacteria—has emerged as a potent trigger of systemic inflammation and neuroimmune stress. LPS levels are often elevated in individuals with gut dysbiosis and increased intestinal permeability, both of which have been frequently reported in ASD [10]. LPS exposure is known to suppress nutrient transporters, impair mitochondrial enzymes, and compromise blood–brain barrier integrity, potentially reducing cerebral access to essential cofactors such as biotin, pantothenic acid, thiamine, and lipoic acid [11,12,13].
To investigate the metabolic underpinnings of ASD, we developed a curated gene framework—Personalized Metabolic Margin Mapping (PM³)—focused on transcriptional shifts in energy metabolism, redox cycling, amino acid pathways, methylation, and detoxification. Using RNA-seq data from postmortem prefrontal cortex samples of ASD individuals and matched controls, we analyzed 158 cofactor-dependent genes. Transcriptomic anomalies were identified using unsupervised machine learning, including Extended Isolation Forest, K-means clustering, and Euclidean distance analysis.
This systems-level approach aims to identify a convergent signature of metabolic instability in the ASD cortex and test the hypothesis that microbial metabolites—particularly LPS—impair cofactor transport and mitochondrial function. In doing so, we propose a mechanistic model of ASD involving functional nutrient deficiency, mitochondrial stress, and redox-adaptive transcriptional reprogramming.
2. Methods
2.1. Transcriptomic Dataset Acquisition
We utilized publicly available, normalized RNA-seq expression data from the study by Parikshak et al. (GSE64018), consisting of postmortem cortical tissue from individuals diagnosed with autism spectrum disorder (ASD, n = 12) and neurotypical controls (n = 12) [14]. Samples were obtained from the superior temporal gyrus (Brodmann areas 41/42/22), with grey matter retained across all cortical layers. RNA extraction, rRNA depletion, and size selection were performed as described in the original study, ensuring high-integrity mRNA for transcriptomic analysis.
2.2. PM³ Gene Model Construction
We developed a curated metabolic gene model, termed Personalized Metabolic Margin Mapping (PM³), encompassing over 150 genes selected for their involvement in key biochemical pathways, including energy production, redox regulation, amino acid metabolism, methylation, and detoxification. Each gene was annotated with its associated enzyme, metabolic domain, cofactor dependency (e.g., biotin, thiamine pyrophosphate [TPP], lipoic acid, CoA/pantothenic acid, vitamin B12), and subcellular localization (cytoplasmic or mitochondrial). This model was designed to enable systems-level evaluation of transcriptional vulnerability in ASD cortex.
2.3. Differential Expression and Divergence Metrics
To evaluate gene-specific expression changes between ASD and control groups, we computed the following: 1. Percent Expression Difference (%Δ): Calculated from group means to indicate directional upregulation or downregulation. 2. Mean Euclidean Distance (ED): Computed across all samples per gene to quantify variability and divergence between ASD and control expression distributions. 3. Area Under the ROC Curve (AUC): Derived from unsupervised Isolation Forest models to quantify each gene’s ability to distinguish ASD from control states, serving as a transcriptomic anomaly score.
No threshold was applied for log2 fold change, as our focus was to capture subtle but coordinated metabolic shifts rather than statistically maximal differentials. Formal statistical tests were not applied due to limited sample size and the unsupervised nature of the analysis.
2.4. Machine Learning and Gene-Level Anomaly Detection
An unsupervised Isolation Forest algorithm was implemented using the H2O.ai machine learning platform (v3.42.0.2) to compute anomaly scores for each gene across all samples. These scores captured nonlinear expression deviations and potential transcriptional outliers contributing to metabolic instability. Additionally, K-means clustering was applied to the anomaly score matrix to identify distinct gene clusters reflecting metabolic expression patterns. AUC values were then calculated to assess the discriminatory strength of each gene in separating ASD from control states.
2.5. Software and Visualization Tools
3. Results
3.1. Divergence of Metabolic Gene Expression in ASD Cortex
We applied the PM³ model to assess differential expression of 158 curated metabolic genes in postmortem prefrontal cortex samples from individuals with autism spectrum disorder (ASD) and matched neurotypical controls. A subset of these genes exhibited substantial transcriptional divergence, as identified by unsupervised anomaly detection using Isolation Forest (IF). Notably, 20 genes demonstrated AUC scores above 0.70, indicating moderate to strong discriminatory power for ASD-related transcriptomic shifts (Table 1). Full gene-level annotations, including %Δ, AUC, metabolic domain, and cofactor dependency, are provided in Supplementary Data Table S1.
Among the highest-ranking genes were key components of mitochondrial redox regulation and TCA cycle flux, including SUCLA2 (AUC = 0.88), GOT1 (0.86), SLC25A11 (0.85), and CKMT1A (0.84). These genes reflect core disruptions in glutamate metabolism, mitochondrial transport, and energy buffering. Additional relevant transcripts - GOT2, GLS, IDH3A, and MDH2 - further implicate breakdowns in mitochondrial redox coupling and NAD⁺-dependent energy transfer.
While most of these high-ranking genes were transcriptionally suppressed in ASD, a subset of genes—including GPT2, SHMT1, and SUCLG2 - were upregulated, potentially indicating compensatory metabolic activation. These genes span diverse cofactor dependencies, including thiamine (B1), NAD⁺, PLP (B6), Coenzyme A, and lipoic acid, reinforcing our model that environmental factors (e.g., lipopolysaccharide) may suppress cofactor transporters and drive differential vulnerability across enzyme systems.
This table summarizes the top-ranked metabolic genes identified by the PM³ (Personalized Metabolic Margin Mapping) model as differentially expressed in post-mortem brain cortex of individuals with autism spectrum disorder (ASD) relative to neurotypical controls. Genes are ranked by their anomaly scores (AUC) derived from unsupervised isolation forest analysis, which reflect expression divergence between groups. Expression changes are presented as percent difference (%Δ), with positive values indicating upregulation and negative values indicating downregulation in ASD samples.
This alluvial diagram maps transcriptional dysregulation across metabolic domains in ASD. Each stream connects four layers: (1) Metabolic Domain, (2) Pathway, (3) Direction of Change (Up or Down in ASD vs CTL), (4) Gene and Enzyme Name. Stream colors reflect domain-specific groupings for visualization clarity. The left side illustrates core systems affected—including energy metabolism, methylation, redox balance, transsulfuration, and amino acid metabolism—while the right side shows specific enzymes with significantly altered expression. Upregulated and downregulated flows are split at the center, illustrating a global metabolic shift in autism characterized by downregulation of key mitochondrial pathways (e.g., TCA cycle, PDH complex) and partial upregulation of compensatory systems (e.g., glycolysis, GSH biosynthesis, GABA shunt). This systems map reveals how dysregulated expression is not isolated but emerges from coordinated failure across interconnected metabolic axes.
3.2. Systems-Level Visualization of Metabolic Dysregulation in ASD
To visualize the distribution of metabolic gene expression changes in ASD, we generated an alluvial diagram representing the flow of 158 curated genes across functional domains, pathways, direction of regulation, and gene identity (Figure 1). Of these, 89 genes were downregulated, and 69 genes were upregulated in ASD cortex compared to controls.
Downregulated genes were predominantly associated with mitochondrial energy production, the TCA cycle, transamination, and cofactor-dependent enzymatic steps, including those requiring thiamine (B1), lipoic acid, Biotin, and CoA. This pattern reflects a widespread suppression of oxidative metabolism and mitochondrial function. In contrast, upregulated genes were enriched in amino acid metabolism, serine–glycine–folate cycling, and methylation-related pathways. This systems-level overview highlights a coordinated reorganization of metabolic priorities in the ASD brain, characterized by energy pathway suppression and selective upregulation of alternative routes tied to neurodevelopmental and redox processes.
4. Discussion
Autism spectrum disorder (ASD) is a prevalent neurodevelopmental condition characterized by social communication deficits and restricted, repetitive behaviors. While its behavioral phenotype is well established, the underlying molecular mechanisms remain only partially elucidated. To gain systems-level insight into the metabolic architecture of ASD, we conducted a transcriptomic analysis of postmortem prefrontal cortex tissue, applying the PM³ (Personalized Metabolic Margin Mapping) model to identify gene-level anomalies in mitochondrial function, redox balance, and detoxification pathways.
From our panel of 158 curated metabolic genes, several transcripts emerged as markedly dysregulated. Among the most upregulated were:
- NQO1 (+49.7%), encoding a flavoprotein quinone reductase involved in antioxidant defense;
- PMM2 (+30.3%), critical for glycosylation and ER stress adaptation;
- SORD (+24.5%), reflecting altered polyol pathway flux.
Conversely, key downregulated genes included:
- NOS2 (−18.3%), a nitric oxide synthase central to redox and inflammatory signaling;
- CKMT1A (−16.8%), a mitochondrial creatine kinase vital for ATP buffering;
- SLC25A32 (−14.4%), a folate transporter essential for mitochondrial one-carbon metabolism.
Together, these shifts suggest a systems-wide reorganization of cortical metabolism in ASD, wherein impaired mitochondrial throughput, altered redox homeostasis, and disrupted cofactor transport converge to reshape energy production, detoxification, and neuroimmune signaling (Figure 2).
Transcriptomic studies in ASD have consistently reported downregulation of electron transport chain components, reinforcing our observation of mitochondrial failure in oxidative phosphorylation [6].
In parallel, recent work by He et al. (2025) identified a subset of ASD cases with upregulated LPS-associated genes (e.g., MAPK8, TNFSF12), suggesting microbial-derived endotoxin exposure as a key driver of immune and metabolic reprogramming [10].
This integrative metabolic map illustrates core biochemical pathways affected in autism spectrum disorder (ASD), including mitochondrial energy production, amino acid catabolism, redox cycling, one-carbon methylation, and transsulfuration. Gene expression changes derived from ASD postmortem cortex samples are overlaid: Red boxes indicate increased mRNA transcription, Blue boxes indicate decreased transcription, and Green boxes represent minimal change (< 1%). Transporters (e.g., SLC family) and cofactor-dependent enzymes (e.g., biotin [B7], thiamine [B1], lipoic acid [LA]) are localized to their respective subcellular compartments. Enzymes without transcriptional labeling indicate unavailable normalized TPM (nTPM) values in the reference dataset. Visual elements adapted from Servier Medical Art (https://smart.servier.com), licensed under CC BY 4.0.
4.1. Suppression of Cofactor Transporters in ASD Cortex
Our data, as illustrated in Figure 3, highlight the coordinated downregulation of cytoplasmic cofactor transporters—including SLC5A6 (-4.5%), the sodium-dependent multivitamin transporter (SMVT) responsible for the uptake of biotin, pantothenic acid, and lipoic acid. This transporter is known to be suppressed by LPS in colonic epithelial cells via casein kinase 2 (CK2)-dependent signaling[11]. We propose that a similar mechanism operates in the brain, contributing to local cofactor deficiencies despite adequate systemic levels.
Reduced expression of SLC19A2 (-3.5%), the TPP transporter, supports this hypothesis and aligns with evidence that LPS inhibits thiamine uptake via at least two complementary mechanisms: first, through TLR4- and NF-κB–mediated downregulation of thiamine transporters [12]; and second, it directly interferes with LPS by involving a protein kinase A (PKA) signaling pathway, which mediates the inhibition of thiamin uptake through decreased expression of its transporters at the cell membrane[13]. This dual mode of suppression may compound intracellular TPP deficiency, especially in tissues with high oxidative demand. A slight upregulation of SLC19A3 (+3.9%) may reflect compensatory stress responses[19].
Moreover, opposing transcriptional changes in PANK1 (-11.8%) and PANK2 (+1.7%) suggest a compartment-specific adaptation to preserve mitochondrial CoA biosynthesis in the face of cytoplasmic pantothenate shortage.
These findings support a mechanistic model in which LPS-mediated transporter repression leads to a functionally acquired cofactor deficiency, impairing the activity of mitochondrial enzymes such as PDH, OGDH, and BCKDH, and ultimately disrupting redox and energy homeostasis.
Figure 4.
Domain-Specific Gene Expression Patterns.
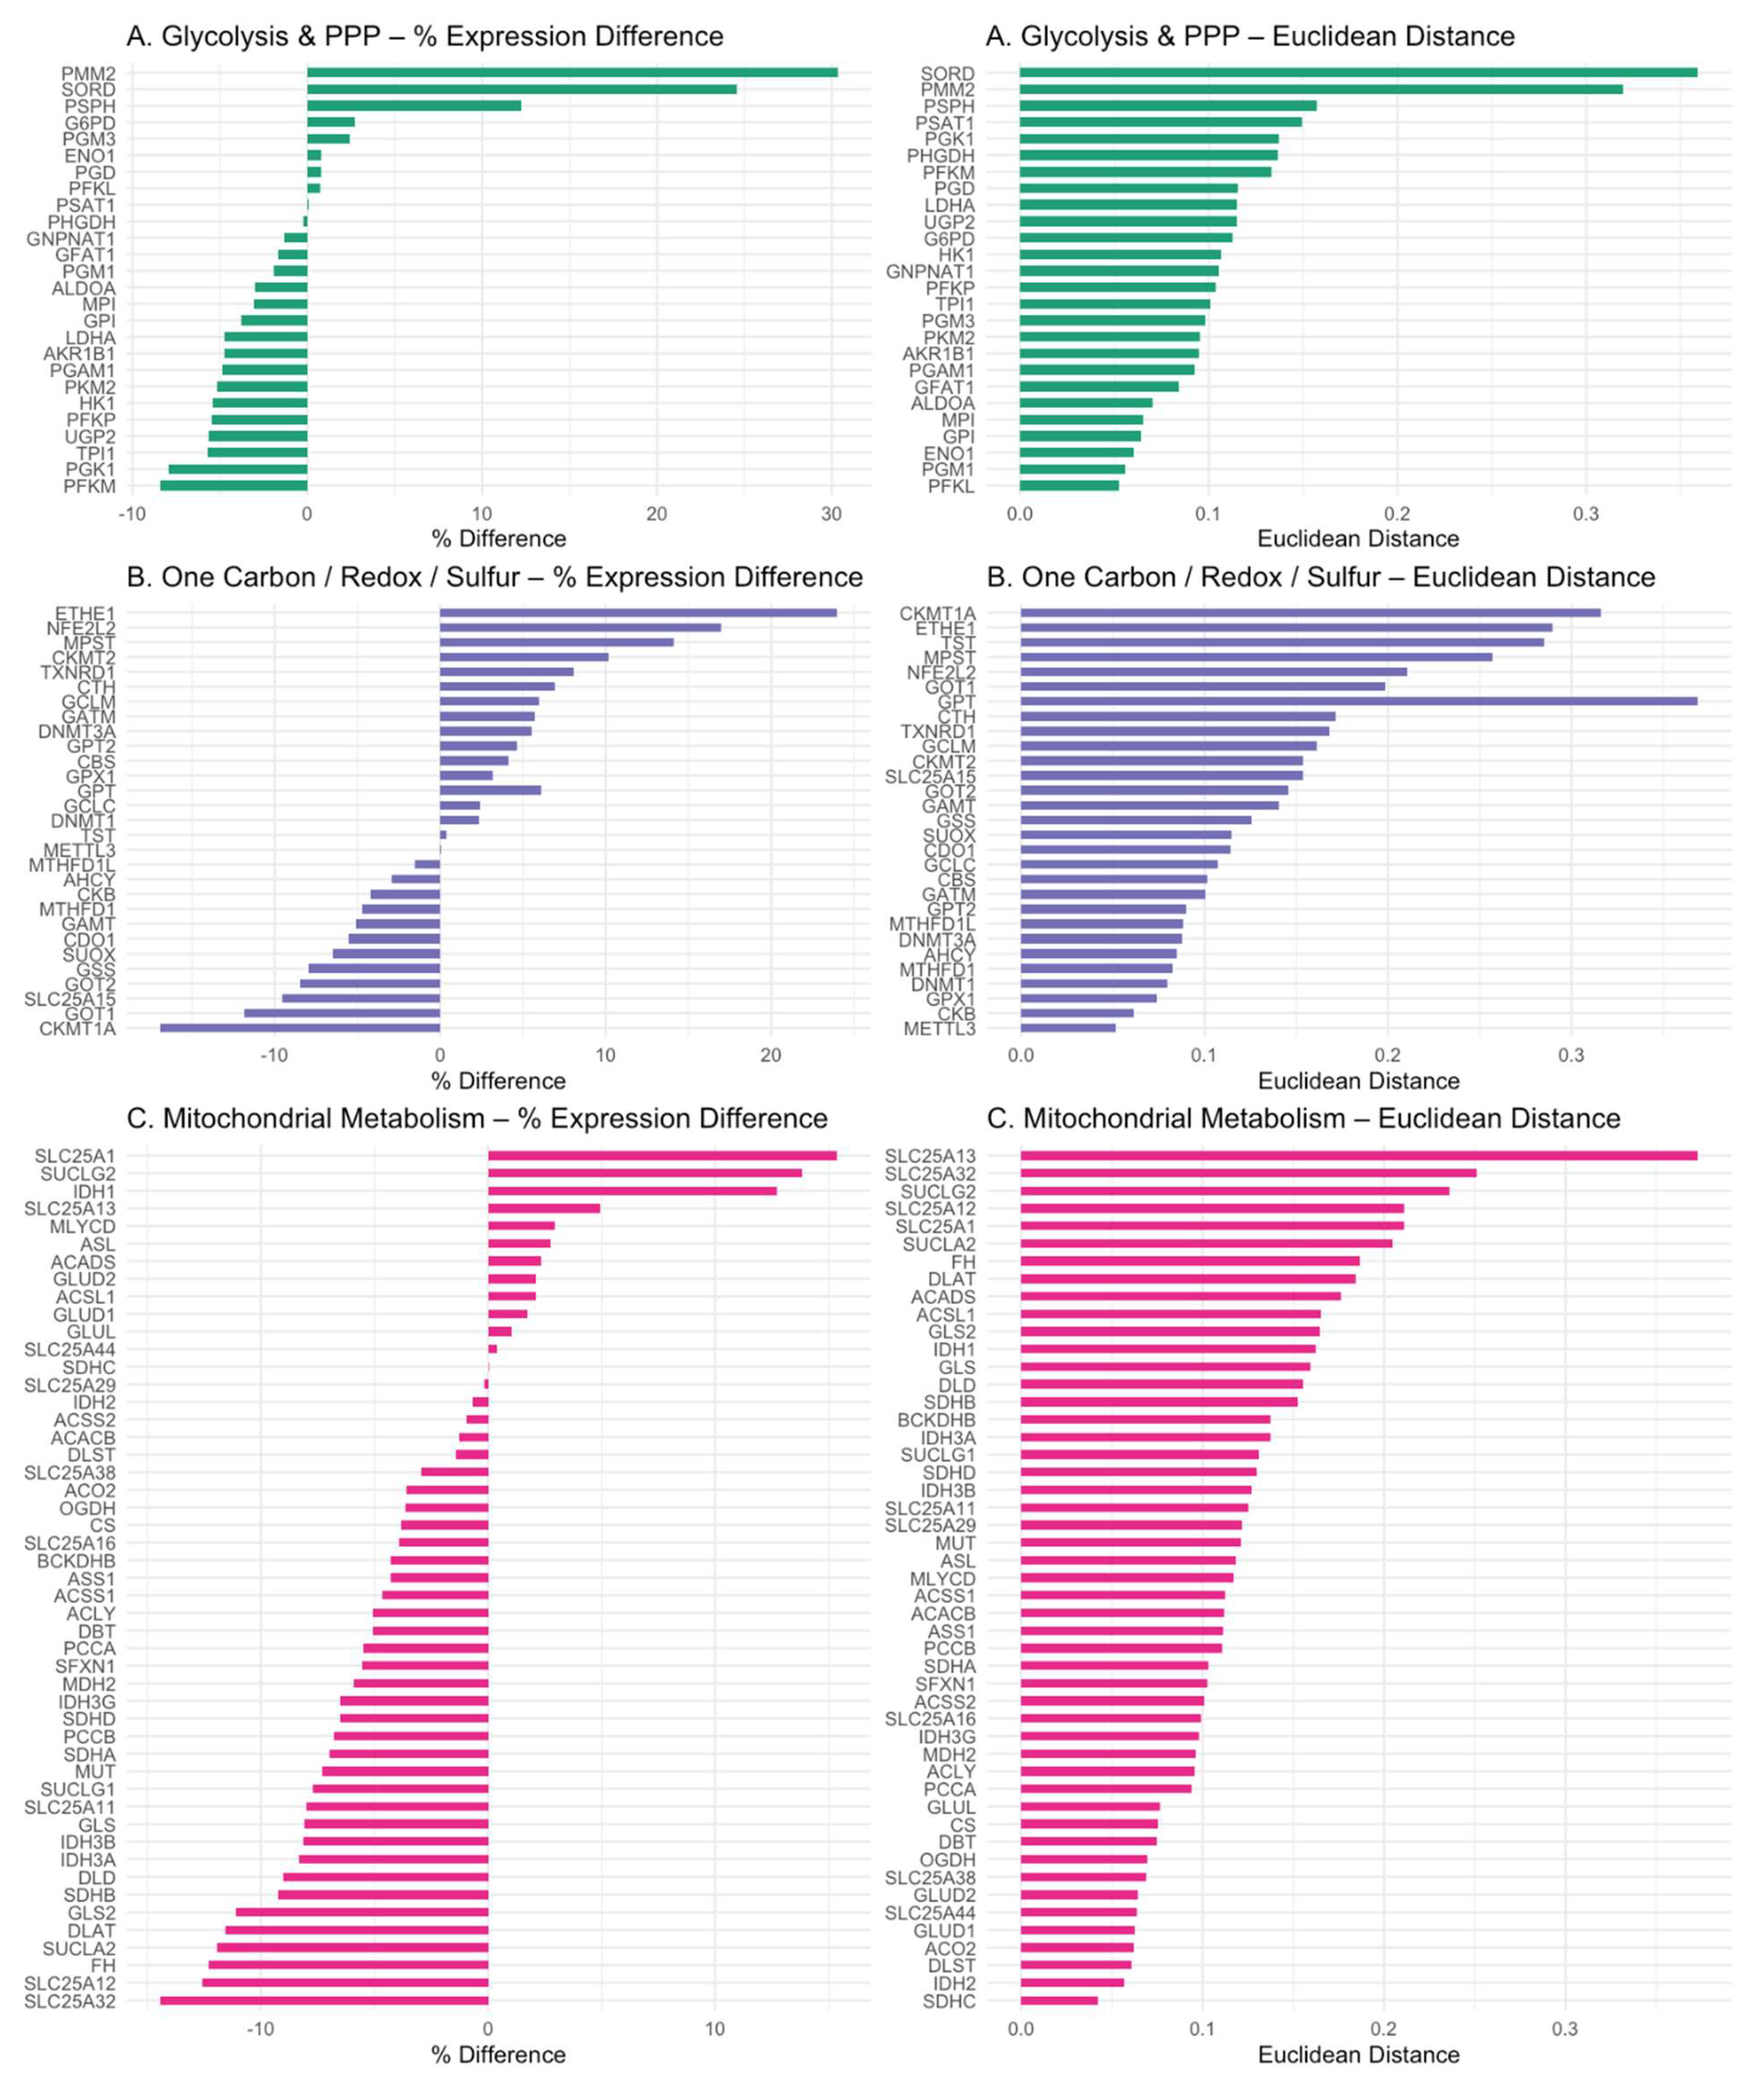
PM³ genes were grouped into three domains: (A) glycolysis and pentose phosphate pathway (PPP), (B) one-carbon/redox/sulfur metabolism, and (C) mitochondrial metabolism. Percent expression differences (left) and mean Euclidean distances (right) are shown for each gene. Color coding reflects domain identity. This visualization reveals selective transcriptional shifts and variability across functional pathways in ASD cortex. Figure panels generated in R using ggplot2 and patchwork packages.
4.2. Glycolytic Downregulation and Citrate–Pyruvate Feedback
Unexpectedly, glycolytic flux appeared suppressed in the ASD cortex, with reduced expression of PFKP (-5.4%) and PKM2 (-5.1%). These effects may be driven by elevated intracellular pyruvate and citrate levels, which are known to allosterically inhibit PFK and PKM2. Cytosolic citrate accumulation—potentially exacerbated by SLC25A1 upregulation (+15%) and downregulation of ACLY (-5%) and ACACB (-2%)—may impose a glycolytic brake. Concurrently, upregulation of GPT2 (+4.6%) and GLUD1/2 (+2%) suggests a compensatory transamination pathway (ALT–GLUD loop) for managing pyruvate overflow, functioning as a pre-Warburg buffer. This metabolic rerouting enables the cell to recycle glutamate and α-ketoglutarate while minimizing lactate production—a mechanism previously characterized in cancer metabolism [20].
4.3. Mitochondrial Bottlenecks in the TCA Cycle
Key enzymes of the TCA cycle were transcriptionally suppressed in ASD cortex, including the pyruvate dehydrogenase complex (PDHA1, DLAT, DLD), isocitrate dehydrogenases (IDH3A, IDH3B, IDH2), and the α-ketoglutarate dehydrogenase complex (OGDH, DLST, DLD). Average downregulation was ~5.6% for PDH, ~8.2% for IDHs, and ~6.3% for OGDH. These consistent reductions reflect a coherent energetic downshift that constrains mitochondrial throughput and redox cycling.
These molecular signatures are consistent with biochemical evidence of suppressed mitochondrial respiration in ASD brains [21,22,23]. Collectively, these observations reinforce the hypothesis of a bioenergetic bottleneck driven by both cofactor deficiency and transcriptional inhibition of mitochondrial enzyme complexes.
4.4. Propionic Acid as a Mitochondrial Toxin
We observed reduced transcription of biotin- and B12-dependent enzymes involved in PPA detoxification—PCCA (−5.5%), PCCB (−6.8%), and MUT (−7.9%). These findings suggest impaired clearance of propionyl-CoA, exacerbating mitochondrial stress. This bottleneck likely reflects both cofactor insufficiency and retrograde transcriptional repression due to reduced substrate flux—a hallmark of metabolic adaptation under load.
4.5. Upregulation of Sulfur Metabolism Pathways in ASD
Sulfation and glucuronidation are critical phase II detoxification pathways that become increasingly taxed under gut dysbiosis and xenobiotic overload—common features in ASD[26,27]. Downregulation of glycolysis may impair glucuronidation capacity by limiting the synthesis of UDP-glucuronic acid. This is supported by the observed 5.6% decrease in UGP2 expression, an enzyme essential for producing UDP-glucose, the direct precursor of UDP-glucuronic acid.
In addition, gut dysbiosis in ASD often leads to the overgrowth of β-glucuronidase-producing bacteria, which cleave glucuronide conjugates and promote toxin reabsorption [28]. In this context, the detoxification burden shifts to sulfation, which depends on intracellular sulfate and the ATP-dependent synthesis of PAPS (3′-phosphoadenosine-5′-phosphosulfate)[28].
We observed upregulation of ETHE1 (+23%) and TST (+0.4%), enzymes involved in H₂S detoxification[29]. Consistently, elevated urinary sulfur metabolites have also been reported in individuals with ASD[30].
In contrast, the downregulation of SUOX (−6.6%), a molybdenum-dependent enzyme responsible for oxidizing sulfite to sulfate, may represent a critical bottleneck in sulfite clearance[31]. Impaired SUOX activity is known to promote sulfite accumulation and exacerbate oxidative stress—mechanisms that disrupt brain mitochondrial energy homeostasis[32].
Altogether, these pathways illustrate a complex interplay between microbial metabolism, sulfur detoxification, and host metabolic adaptation in ASD.
4.6. One-Carbon Metabolism Disruption in ASD
The brain relies heavily on de novo serine biosynthesis to support neurotransmission, myelination, and one-carbon metabolism. PHGDH, the rate-limiting enzyme in this pathway, is highly expressed in astrocytes and initiates the conversion of 3-phosphoglycerate to 3-phosphohydroxypyruvate [33,34].
In the ASD cortex, we observed upregulation of SHMT1 (+7%), SHMT2 (+12%), and PSPH (+12%), enzymes involved in one-carbon transfer and the terminal step of serine biosynthesis. In contrast, PHGDH expression was slightly decreased (−0.2%). This downregulation may reflect a reduction in glycolytic flux (~10%), limiting the availability of 3-phosphoglycerate—the glycolytic intermediate required to initiate serine synthesis. Such substrate limitation suggests a cortex-specific dependence on glycolytic input to sustain one-carbon flux and methylation capacity.
Transcriptomic compensation through glycine degradation was evident, with upregulation of GLDC (+14.7%) and GCSH (+7.5%), while AMT was slightly reduced (−5%). This shift may reflect an alternative route to maintain folate-mediated one-carbon units under serine-limited conditions.
Together, these findings suggest a methylation bottleneck in ASD, not due to primary defects in one-carbon enzymes, but arising secondarily from upstream glycolytic suppression and mitochondrial stress. This serine–glycine imbalance may impair epigenetic programming and contribute to neurodevelopmental dysregulation in autism.
4.7. Therapeutic Implications
If validated, this model highlights SLC5A6 and SLC19A2 as potential targets for restoring cofactor delivery in ASD. While specific interventions remain to be determined, this framework opens new possibilities for translational research—ranging from nutrient-based strategies to microbiome-directed approaches. The identification of vitamin transporter suppression as a convergent mechanism invites further exploration by both academic and industry partners to develop targeted solutions for metabolic restoration in ASD.
4.8. Study Limitations and Future Directions
This study is based on retrospective transcriptomic data, and a direct correlation between plasma lipopolysaccharide (LPS) levels and tissue-specific expression of SLC5A6, SLC19A2, or other PM³ model genes could not be established. In particular, brain and peripheral tissues may respond differently to microbial signals, and such spatial heterogeneity cannot be resolved through bulk RNA-seq alone. Moreover, cofactor levels (e.g., biotin, pantothenic acid, thiamine) and post-transcriptional regulation were not evaluated, potentially underestimating functional deficits. These limitations highlight the need for prospective studies incorporating multi-omics profiling, LPS challenge models, and metabolite quantification across relevant tissues to validate and extend the metabolic cascade proposed here.
5. Conclusion
This study presents a systems-level view of metabolic dysfunction in ASD, proposing that microbial lipopolysaccharide (LPS) inhibits key cofactor transporters (SLC5A6, SLC19A2), leading to downstream suppression of glycolysis, mitochondrial function, and one-carbon metabolism. We show that this inhibition contributes to reduced glucuronidation and serine synthesis, shifting detoxification toward energy-intensive sulfation and mitochondrial sulfur pathways. These adaptations reveal a coordinated metabolic response with implications for neurodevelopment and epigenetic dysregulation. These findings warrant clinical investigation of nutrient transport and mitochondrial function in biomarker-stratified ASD subtypes.
Abbreviations for Figure 2 and Figure 4 (Metabolic and Transcriptomic Visualization)
Abbreviations Used in Figure: 2 and 4: 3-MCC – 3-Methylcrotonyl-CoA carboxylase,
3-MST – 3-Mercaptopyruvate sulfurtransferase, 3-PS – Phosphoserine aminotransferase, 4′-Phosphopantetheine – Active form of pantothenic acid (B5), 5-MTHF – 5-Methyltetrahydrofolate, 10-CHO-THF – 10-Formyltetrahydrofolate, 5,10-MTHF – 5,10-Methylenetetrahydrofolate, ACC – Acetyl-CoA carboxylase, ACS – Acyl-CoA synthetase,
ACADS – Short-chain acyl-CoA dehydrogenase, AHCY – Adenosylhomocysteinase, ALT – Alanine aminotransferase, ASL – Argininosuccinate lyase, AST / AAT – Aspartate aminotransferase, ASS – Argininosuccinate synthase, BCAT – Branched-chain amino acid aminotransferase, BCKDH – Branched-chain α-keto acid dehydrogenase, BHMT – Betaine-homocysteine methyltransferase, BH2 / BH4 – Dihydrobiopterin / Tetrahydrobiopterin, CBS – Cystathionine beta-synthase, CH2-THF – 5,10-Methylenetetrahydrofolate, CK – Creatine kinase
CP – Carbamoyl phosphate, CPT I / II – Carnitine palmitoyltransferase I / II, CSAD – Cysteine sulfinic acid decarboxylase, CDO – Cysteine dioxygenase, DMG – Dimethylglycine, dUMP – Deoxyuridine monophosphate, dTMP – Deoxythymidine monophosphate, FAS – Fatty acid synthase, FMO1 – Flavin-containing monooxygenase 1, GABA – Gamma-aminobutyric acid
GAD – Glutamate decarboxylase, GART / ATIC – Purine biosynthesis enzymes, GCL – Glutamate-cysteine ligase, GS – Glutathione synthetase, GLS – Glutaminase, GCS – Glycine cleavage system, G6P – Glucose-6-phosphate, G3P – Glyceraldehyde-3-phosphate, GTP – Guanosine triphosphate, HK – Hexokinase, IDH – Isocitrate dehydrogenase, KGDHC – α-Ketoglutarate dehydrogenase complex, LCFA / MCFA / SCFA – Long-/Medium-/Short-chain fatty acids, MAT – Methionine adenosyltransferase, MDH – Malate dehydrogenase
MCM – Methylmalonyl-CoA mutase, MTR / MTRR – Methionine synthase / Methionine synthase reductase, MTHFD – Methylenetetrahydrofolate dehydrogenase, MT – Methyltransferase, NOS – Nitric oxide synthase, OTC – Ornithine transcarbamylase, PDC – Pyruvate dehydrogenase complex, PC – Pyruvate carboxylase, PCC – Propionyl-CoA carboxylase, PFK-1 – Phosphofructokinase-1, PGK – Phosphoglycerate kinase
PGM – Phosphoglycerate mutase, PHGDH – Phosphoglycerate dehydrogenase
PSAT – Phosphoserine aminotransferase, PSPH – Phosphoserine phosphatase
PEP – Phosphoenolpyruvate, SQR – Sulfide:quinone oxidoreductase, SAM / SAH – S-Adenosylmethionine / S-Adenosylhomocysteine, SCFA-CoA / MCFA-CoA / LCFA-CoA – Short-/Medium-/Long-chain fatty acyl-CoA, SHMT – Serine hydroxymethyltransferase
SCS – Succinyl-CoA synthetase, SCH – Succinate-CoA hydrolase, THF – Tetrahydrofolate, TPH2 – Tryptophan hydroxylase, TCA – Tricarboxylic acid cycle, TDH – Threonine dehydrogenase, TYMS – Thymidylate synthase
Acknowledgments
Some visual elements in Figure 2 and the Graphical Abstract were adapted from Servier Medical Art (https://smart.servier.com), provided under a Creative Commons Attribution 4.0 International License.
References
- C. Lord, M. Elsabbagh, G. Baird, og J. Veenstra-Vanderweele, „Autism spectrum disorder“, Lancet, b. 392, tbl. 10146, bls. 508–520, ágú. 2018. [CrossRef]
- G. Ramaswami og D. H. Geschwind, „Genetics of autism spectrum disorder“, í Handbook of Clinical Neurology, b. 147, 2018, bls. 321–329.
- R. E. Frye, N. Rincon, P. J. McCarty, D. Brister, A. C. Scheck, og D. A. Rossignol, „Biomarkers of mitochondrial dysfunction in autism spectrum disorder: A systematic review and meta-analysis“, Neurobiol. Dis., b. 197, bls. 106520, 2024. [CrossRef]
- R. E. Frye o.fl., „Redox metabolism abnormalities in autistic children associated with mitochondrial disease“, Transl. Psychiatry, b. 3, 2013. [CrossRef]
- F. Gu, V. Chauhan, og A. Chauhan, „Glutathione redox imbalance in brain disorders“, Current Opinion in Clinical Nutrition and Metabolic Care, b. 18, tbl. 1. 2015. [CrossRef]
- A. Anitha o.fl., „Downregulation of the expression of mitochondrial electron transport complex genes in autism brains“, Brain Pathol., b. 23, tbl. 3, 2013. [CrossRef]
- D. McDonald, M. Hornig, C. Lozupone, J. Debelius, J. A. Gilbert, og R. Knight, „Towards large-cohort comparative studies to define the factors influencing the gut microbial community structure of ASD patients“, Microb. Ecol. Heal. Dis., b. 26, tbl. 0, 2015. [CrossRef]
- E. Y. Hsiao o.fl., „Microbiota modulate behavioral and physiological abnormalities associated with neurodevelopmental disorders“, Cell, b. 155, tbl. 7, 2013.
- R. K. Naviaux, „Perspective: Cell danger response Biology—The new science that connects environmental health with mitochondria and the rising tide of chronic illness“, Mitochondrion, b. 51. 2020. [CrossRef]
- B. C. 1 2 Yuanxia He # 1 2, Yun He # 2, „He Y, He Y, Cheng B. Identification of Bacterial Lipopolysaccharide-Associated Genes and Molecular Subtypes in Autism Spectrum Disorder. Pharmgenomics Pers Med. 2025 Jan 17;18:1-18. doi: 10.2147/PGPM.S494126. PMID: 39850061; PMCID: PMC11750731.“, Pharmgenomics. Pers. Med., b. Pharmacoge, tbl. Volume 18, 2025.
- R. Lakhan og H. M. Said, „Lipopolysaccharide inhibits colonic biotin uptake via interference with membrane expression of its transporter: A role for a casein kinase 2-mediated pathway“, Am. J. Physiol. - Cell Physiol., b. 312, tbl. 4, 2017. [CrossRef]
- S. Anthonymuthu, S. Sabui, K. Lee, A. Sheikh, J. M. Fleckenstein, og H. M. Said, „Bacterial lipopolysaccharide inhibits colonic carrier-mediated uptake of thiamin pyrophosphate: roles for TLR4 receptor and NF-B/P38/JNK signaling pathway“, Am. J. Physiol. - Cell Physiol., b. 325, tbl. 3, 2023. [CrossRef]
- H. M. Selvaraj, A., Sabui, S., Manzon, K. I., Sheikh, A., Fleckenstein, J. M., & Said, „Bacterial lipopolysaccharide inhibits free thiamin uptake along the intestinal tract via interference with membrane expression of thiamin transporters 1 and 2“, Am. J. Physiol. Physiol., b. 327(5), tbl. C1163-C1177., 2024. [CrossRef]
- M. Irimia o.fl., „A highly conserved program of neuronal microexons is misregulated in autistic brains“, Cell, b. 159, tbl. 7, 2014. [CrossRef]
- S. Lee, S. Sriutaisuk, og H. Kim, „Using the Tidyverse Package in R for Simulation Studies in SEM“, Struct. Equ. Model., b. 27, tbl. 3, 2020. [CrossRef]
- H. Wickham, W. Chang, og M. H. Wickham, „Package `ggplot2’“, Creat. Elegant Data Vis. Using Gramm. ofGraphics. Version, b. 2, tbl. 1, 2016.
- Z. Gu, „Complex heatmap visualization“, iMeta, b. 1, tbl. 3, 2022. [CrossRef]
- E. LeDell o.fl., „Package ‘h2o’“, April, 2020. .
- A. Schänzer o.fl., „Stress-induced upregulation of SLC19A3 is impaired in biotin-thiamine- responsive basal ganglia disease“, Brain Pathol., b. 24, tbl. 3, 2014. [CrossRef]
- S. J. Parker o.fl., „Selective alanine transporter utilization creates a targetable metabolic niche in pancreatic cancer“, Cancer Discov., b. 10, tbl. 7, 2020. [CrossRef]
- D. A. Rossignol og R. E. Frye, „Mitochondrial dysfunction in autism spectrum disorders: a systematic review and meta-analysis“, Mol. Psychiatry, b. 17, tbl. 3, bls. 290–314, 2012.
- C. Giulivi o.fl., „Mitochondrial Dysfunction in Autism“, JAMA, b. 304, tbl. 21, bls. 2389–2396, des. 2010.
- R. K. Naviaux, „Metabolic features of the cell danger response“, Mitochondrion, b. 16, 2014. [CrossRef]
- D. F. MacFabe, „Short-chain fatty acid fermentation products of the gut microbiome: implications in autism spectrum disorders“, Microb. Ecol. Heal. Dis., b. 23, tbl. 0, 2012. [CrossRef]
- R. E. Frye o.fl., „Modulation of mitochondrial function by the microbiome metabolite propionic acid in autism and control cell lines“, Transl. Psychiatry, b. 6, tbl. 10, 2016.
- S. H. Murch, T. T. MacDonald, J. A. Walker-Smith, P. Lionetti, M. Levin, og N. J. Klein, „Disruption of sulphated glycosaminoglycans in intestinal inflammation“, Lancet, b. 341, tbl. 8847, 1993. [CrossRef]
- R. E. Kane, A. P. Li, og D. R. Kaminski, „Sulfation and glucuronidation of acetaminophen by human hepatocytes cultured on matrigel and type 1 collagen reproduces conjugation in vivo“, Drug Metab. Dispos., b. 23, tbl. 3, 1995.
- Y. Sun, L. C. Harps, M. Bureik, og M. K. Parr, „Human Sulfotransferase Assays With PAPS Production in situ“, Front. Mol. Biosci., b. 9, 2022. [CrossRef]
- V. Tiranti o.fl., „Loss of ETHE1, a mitochondrial dioxygenase, causes fatal sulfide toxicity in ethylmalonic encephalopathy“, Nat. Med., b. 15, tbl. 2, 2009. [CrossRef]
- R. H. Waring og L. V. Klovrza, „Sulphur metabolism in autism“, Journal of Nutritional and Environmental Medicine, b. 10, tbl. 1. 2000. [CrossRef]
- R. M. Garrett, J. L. Johnson, T. N. Graf, A. Feigenbaum, og K. V. Rajagopalan, „Human sulfite oxidase R160Q: Identification of the mutation in a sulfite oxidase-deficient patient and expression and characterization of the mutant enzyme“, Proc. Natl. Acad. Sci. U. S. A., b. 95, tbl. 11, 1998. [CrossRef]
- M. Grings o.fl., „Sulfite disrupts brain mitochondrial energy homeostasis and induces mitochondrial permeability transition pore opening via thiol group modification“, Biochim. Biophys. Acta - Mol. Basis Dis., b. 1842, tbl. 9, 2014. [CrossRef]
- T. J. De Koning, K. Snell, M. Duran, R. Berger, B. T. Poll-The, og R. Surtees, „L-serine in disease and development“, Biochemical Journal, b. 371, tbl. 3. 2003. [CrossRef]
- J. H. Yang o.fl., „Brain-specific Phgdh deletion reveals a pivotal role for l-serine biosynthesis in controlling the level of D-serine, an N-methyl-D-aspartate receptor co-agonist, in adult brain“, J. Biol. Chem., b. 285, tbl. 53, 2010. [CrossRef]
- G. Kikuchi, Y. Motokawa, T. Yoshida, og K. Hiraga, „Glycine cleavage system: Reaction mechanism, physiological significance, and hyperglycinemia“, Proceedings of the Japan Academy Series B: Physical and Biological Sciences, b. 84, tbl. 7. 2008.
- L. R. Schaevitz og J. E. Berger-Sweeney, „Gene-environment interactions and epigenetic pathways in autism: the importance of one-carbon metabolism.“, ILAR journal / National Research Council, Institute of Laboratory Animal Resources, b. 53, tbl. 3–4. 2012.
- S. P. Paşca o.fl., „One carbon metabolism disturbances and the C677T MTHFR gene polymorphism in children with autism spectrum disorders“, J. Cell. Mol. Med., b. 13, tbl. 10, 2009.
Figure 1.
Systems-Level Mapping of Metabolic Gene Dysregulation in Autism.
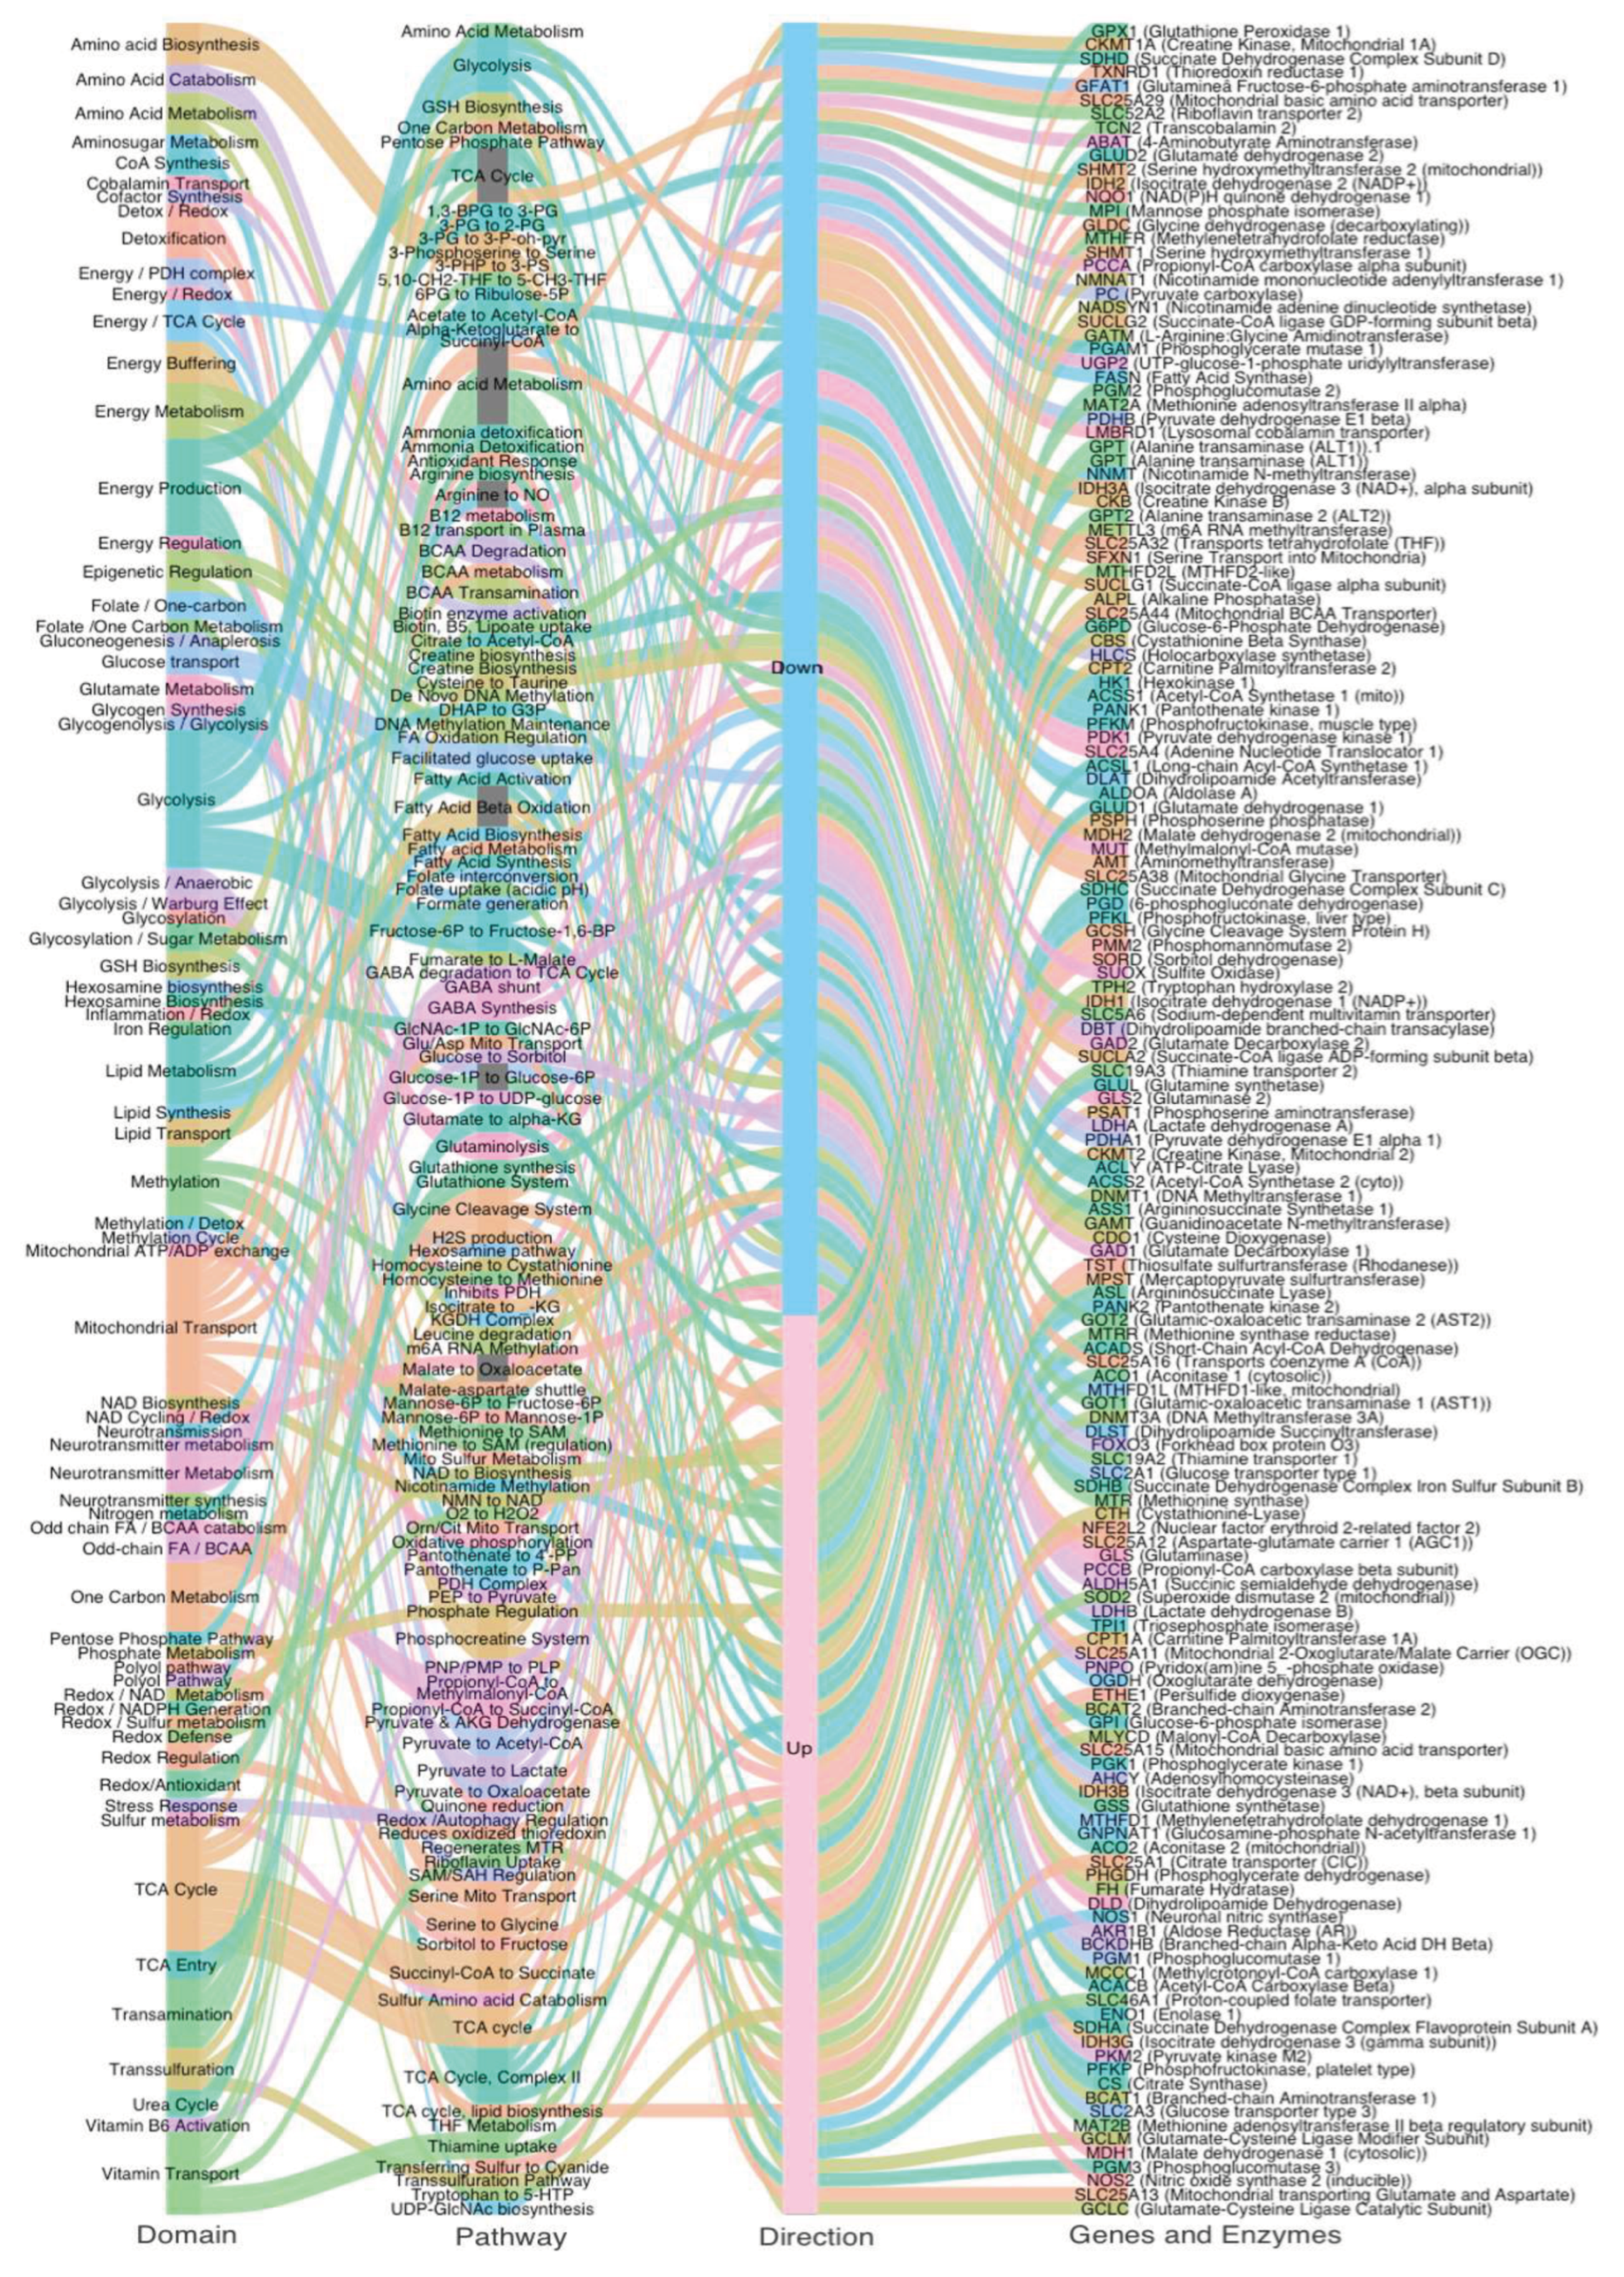
Figure 2.
Systems Model of Metabolic Dysfunction in Autism.
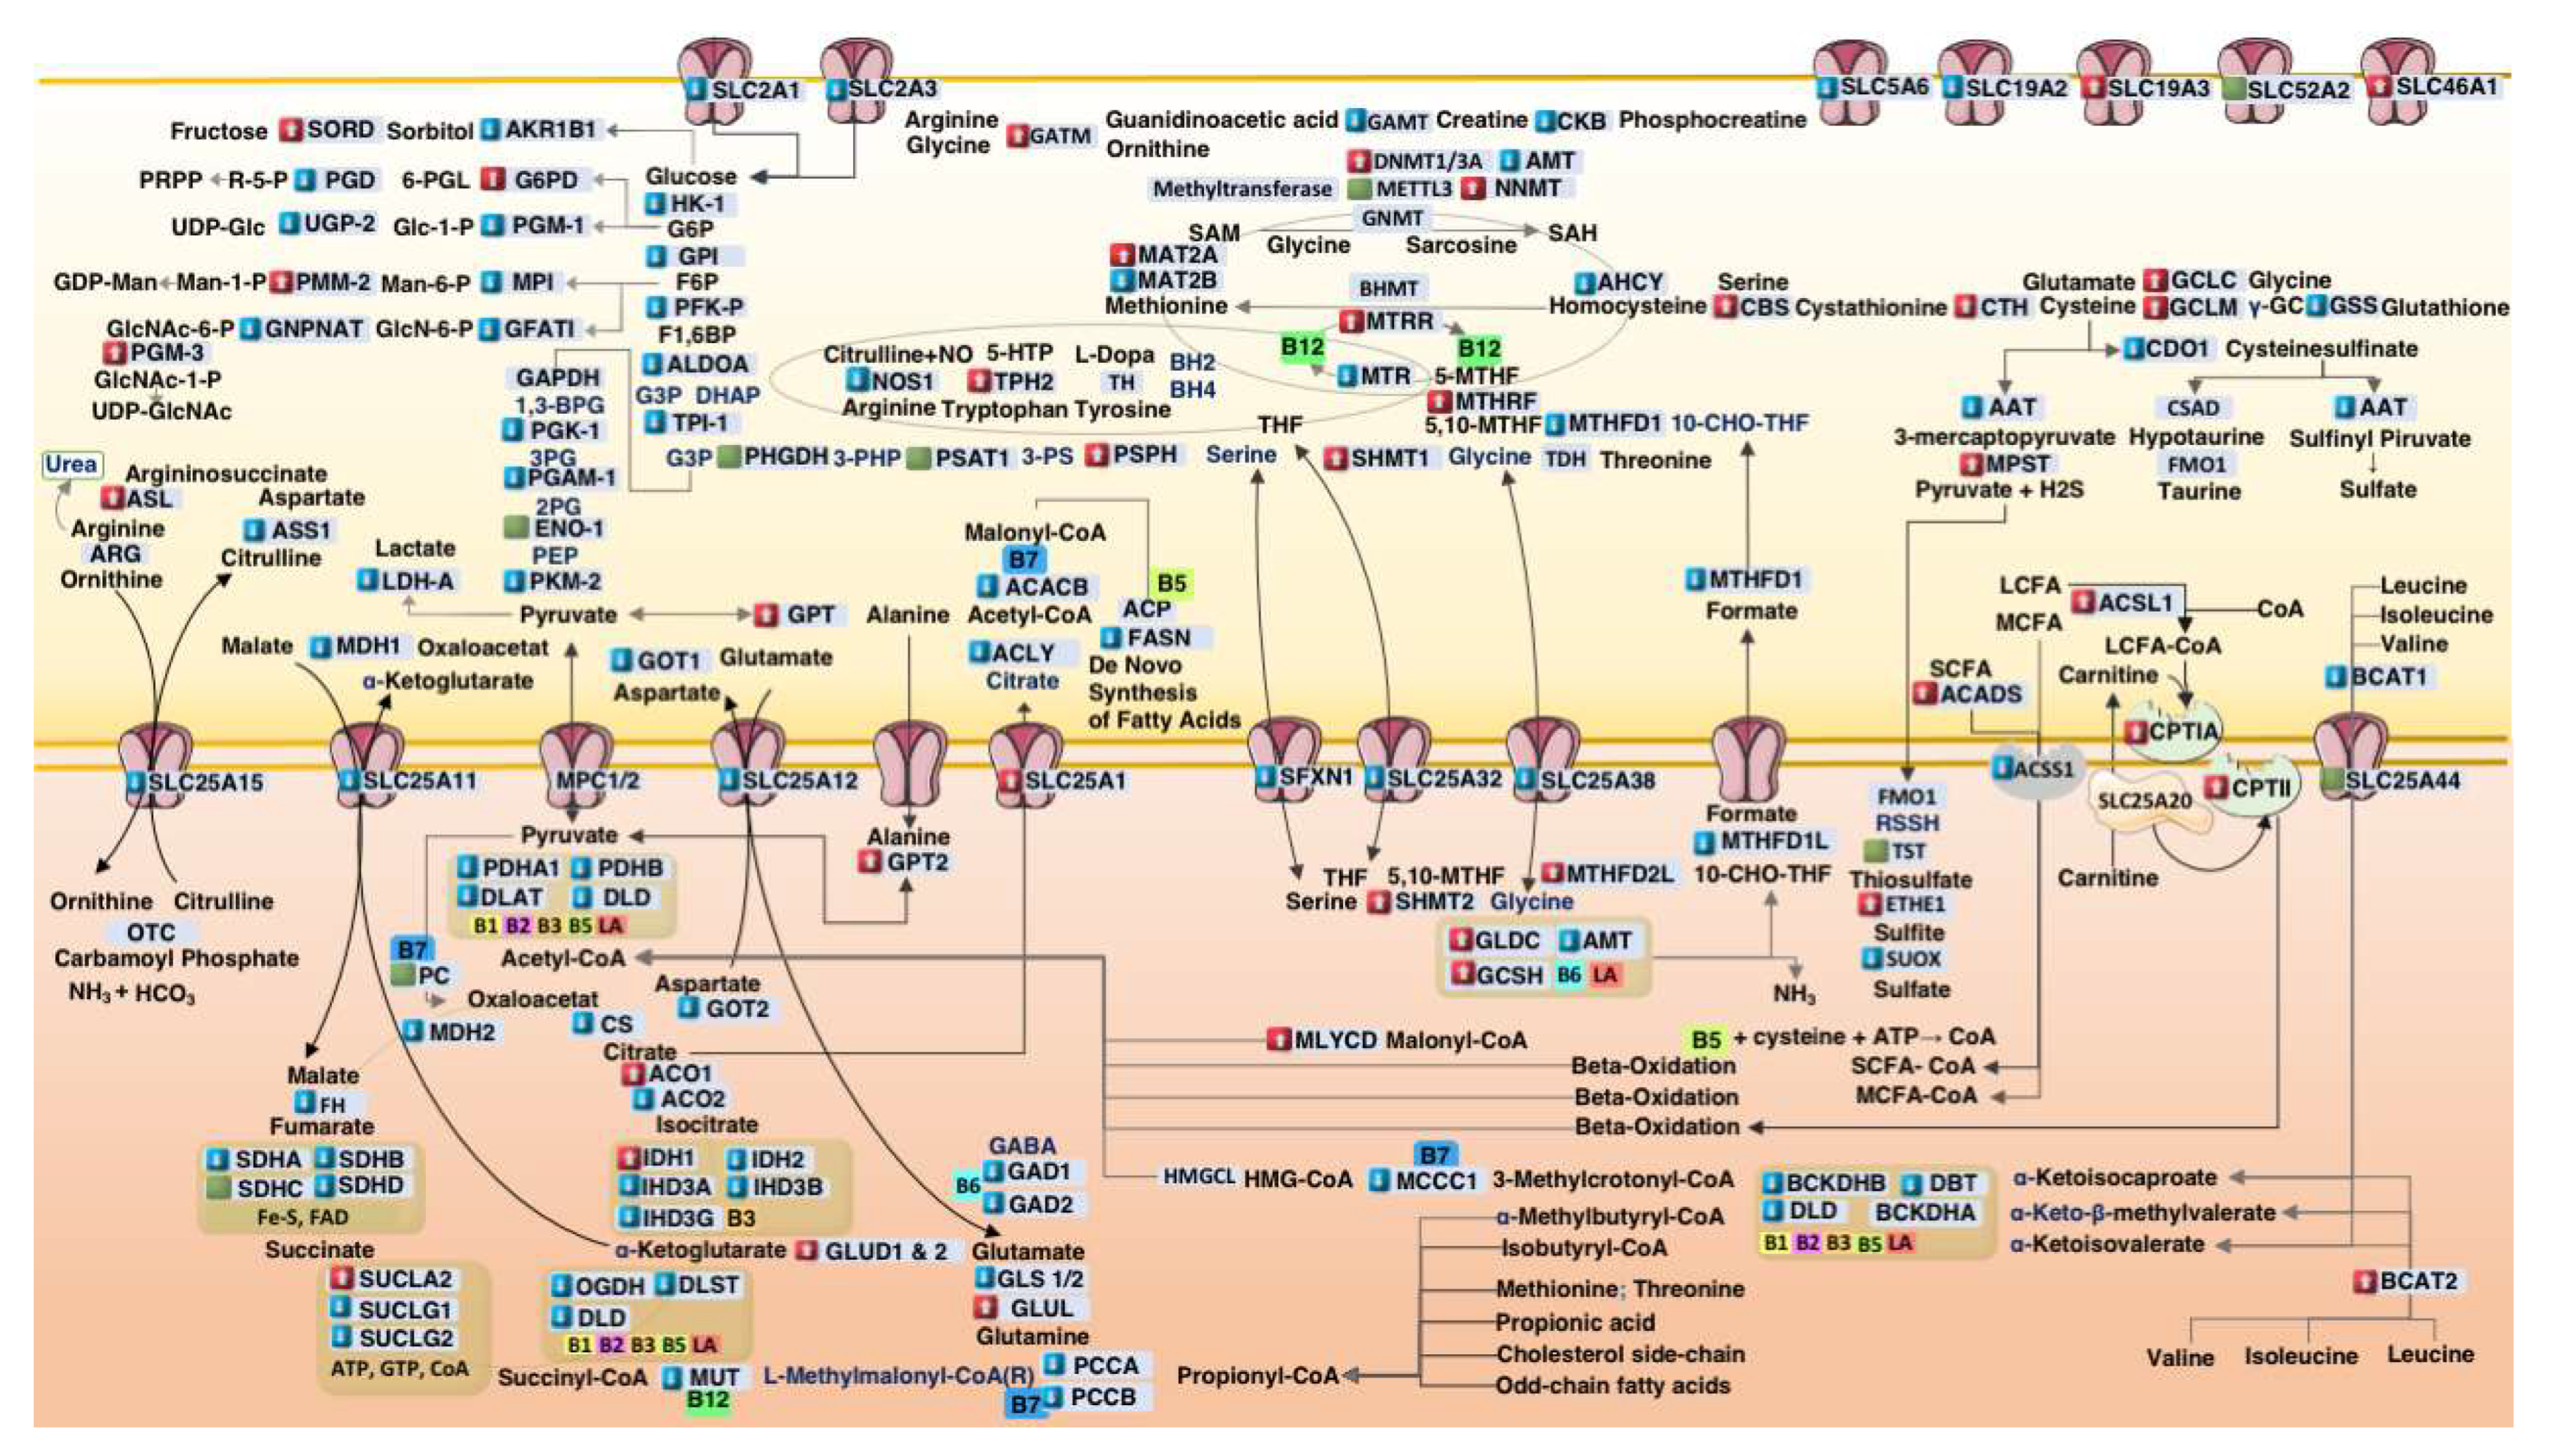
Figure 3.
Cofactor-Dependent Transcriptomic Vulnerability in Autism. This figure highlights genes dependent on core mitochondrial and cytosolic cofactors: Biotin, Thiamine Pyrophosphate (TPP), Lipoic Acid, Pantothenic Acid/CoA, and ATP. Top panels show the % expression difference (ASD vs. control), and bottom panels display the mean Euclidean distance from controls, reflecting multigene dispersion. Genes are stratified by compartment (cytoplasmic vs. mitochondrial) and color-coded by cofactor dependency.
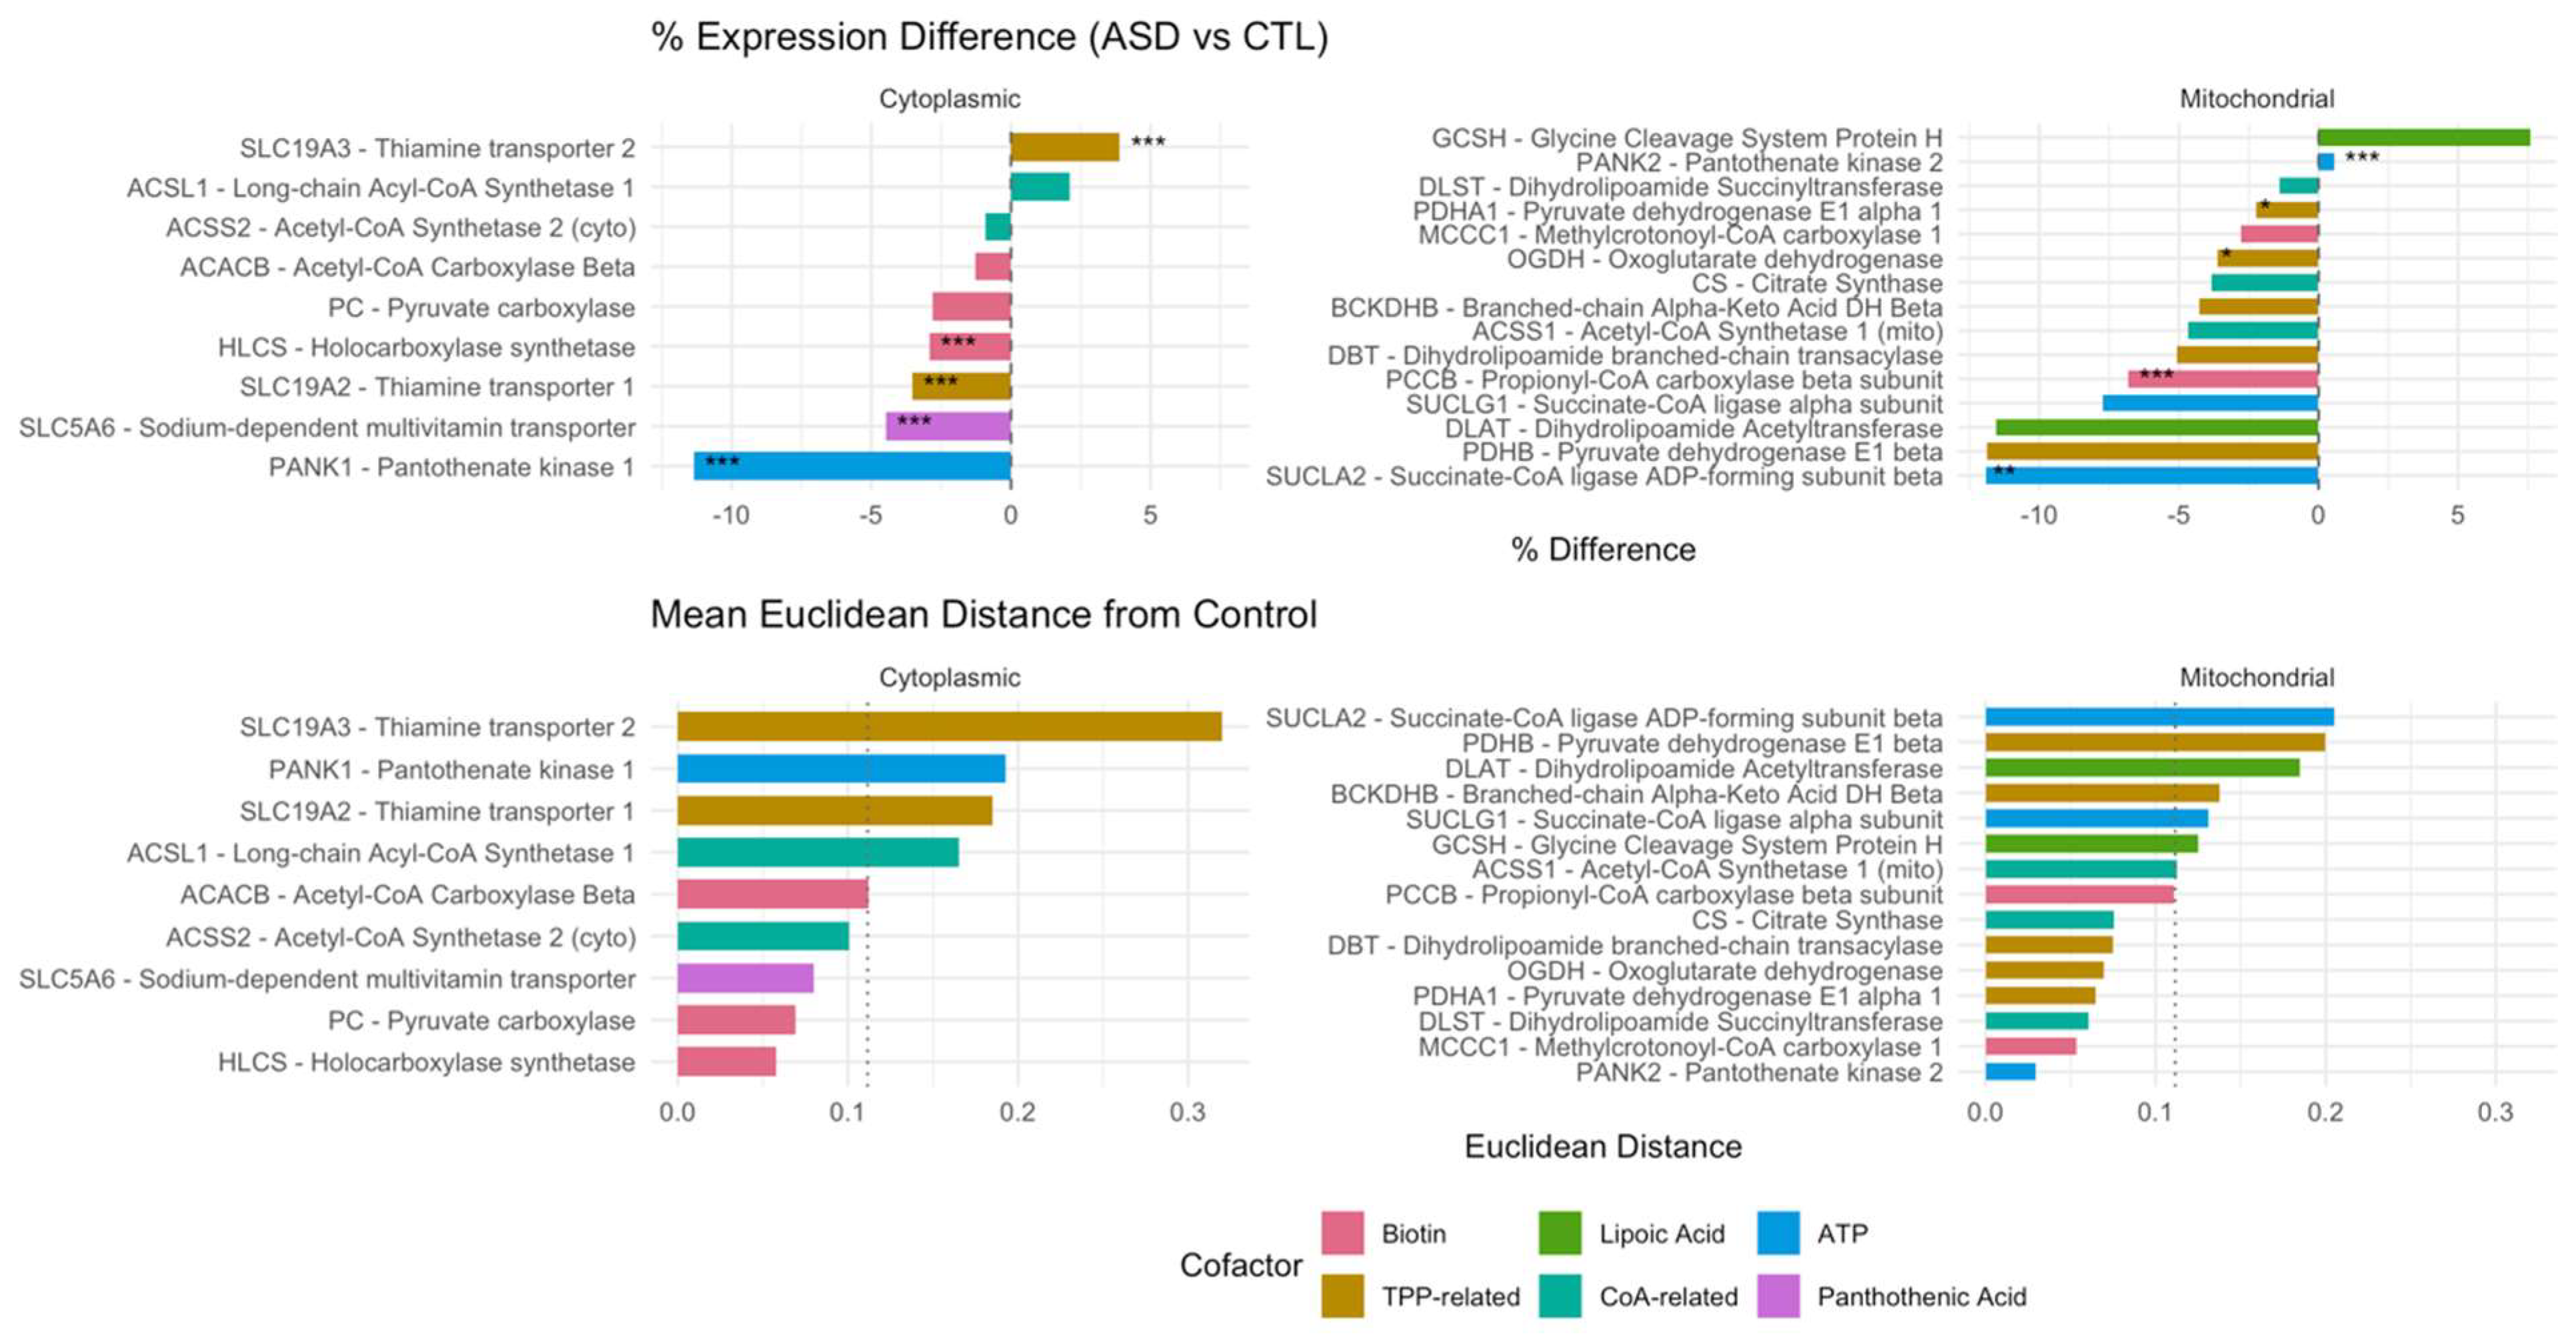

Table 1.
Differentially Expressed Metabolic Genes in ASD Cortex Identified by the PM³ Model.
| Gene Symbol |
Gene Name |
%Δ Expression |
AUC |
Cofactor(s) |
Pathway |
Functional Role |
|---|---|---|---|---|---|---|
| SUCLA2 | Succinate-CoA ligase (ADP-forming β) | -11.93 | 0.88 | ADP, CoA | TCA Cycle | Succinyl-CoA to Succinate |
| GOT1 | Aspartate transaminase 1 (AST1) | -11.82 | 0.86 | PLP (Vitamin B6) | Transamination | Glutamate/oxaloacetate shuttle |
| SLC25A11 | 2-Oxoglutarate/Malate Carrier (OGC) | -7.99 | 0.85 | Mitochondrial Transport | Malate shuttle (Mito) | |
| CKMT1A | Mitochondrial creatine kinase 1A | -16.9 | 0.84 | Mg2+, ATP | Energy Buffering | Phosphocreatine shuttle |
| GPT2 | Alanine transaminase 2 (ALT2) | 4.64 | 0.83 | PLP (Vitamin B6) | Transamination | Alanine ↔ Pyruvate |
| GOT2 | Aspartate transaminase 2 (AST2) | -8.48 | 0.80 | PLP (Vitamin B6) | Transamination | Mitochondrial transamination |
| GLS | Glutaminase | -8.08 | 0.79 | Glutamine | Glutamate Metabolism | Glutamine to Glutamate |
| IDH3A | Isocitrate dehydrogenase 3α(NAD⁺-linked) | -8.33 | 0.79 | NAD+ | TCA Cycle | Isocitrate to α-Ketoglutarate |
| MDH2 | Malate dehydrogenase 2 (mitochondrial) | -5.93 | 0.78 | NAD+ | TCA Cycle | Malate to Oxaloacetate (mito) |
| IDH3B | Isocitrate dehydrogenase3β (NAD⁺-linked) | -8.13 | 0.78 | NAD+ | TCA Cycle | Isocitrate to α-Ketoglutarate |
| SHMT1 | Serine hydroxymethyltransferase 1 | 7.55 | 0.77 | PLP (Vitamin B6) | One Carbon Metabolism | Serine to Glycine |
| MDH1 | Malate dehydrogenase 1 (cytosolic) | -11.78 | 0.74 | NAD+ | NAD Cycling / Redox | Malate to Oxaloacetate |
| OGDH | Oxoglutarate dehydrogenase | -3.63 | 0.73 | B1, NAD+, CoA, lipoate | Energy / TCA Cycle | α-Ketoglutarate to Succinyl-CoA |
| PDHA1 | Pyruvate dehydrogenase E1 α subunit | -2.25 | 0.73 | B1, NAD+, CoA, lipoate | Energy / PDH complex | Pyruvate to Acetyl-CoA |
| MAT2B | Methionine adenosyltransferase II β | -11.9 | 0.72 | Methylation | Methionine to SAM (regulation) | |
| SFXN1 | Serine Transport into Mitochondria | -5.51 | 0.71 | Mitochondrial Transport | Mitochondrial Serine Transport | |
| MTHFD1 | Methylene-THF dehydrogenase 1 | -4.73 | 0.71 | NADH+ | Folate/One-Carbon Metabolism | Folate interconversion |
| DLD | Dihydrolipoamide Dehydrogenase | -9.0 | 0.71 | FAD, NAD | Energy / Redox | E3 subunit of PDH/OGDH complexes |
| SUOX | Sulfite Oxidase | -6.6 | 0.70 | Molybdenum, Cytochrome b5, and Heme | Sulfur metabolism | Sulfite oxidation |
| TST | Thiosulfate sulfurtransferase (Rhodanese) | 0.36 | 0.70 | Detoxification | Thiosulfate sulfurtransferase (Detoxification) | |
| SUCLG2 | Succinate-CoA ligase (GDP-forming β) | 13.83 | 0.69 | GDP, CoA | TCA Cycle | Succinyl-CoA to Succinate |
Disclaimer/Publisher’s Note: The statements, opinions and data contained in all publications are solely those of the individual author(s) and contributor(s) and not of MDPI and/or the editor(s). MDPI and/or the editor(s) disclaim responsibility for any injury to people or property resulting from any ideas, methods, instructions or products referred to in the content. |
© 2025 by the authors. Licensee MDPI, Basel, Switzerland. This article is an open access article distributed under the terms and conditions of the Creative Commons Attribution (CC BY) license (http://creativecommons.org/licenses/by/4.0/).
Copyright: This open access article is published under a Creative Commons CC BY 4.0 license, which permit the free download, distribution, and reuse, provided that the author and preprint are cited in any reuse.


