
Submitted:
02 May 2025
Posted:
06 May 2025
You are already at the latest version
Abstract
Assessment of sustainability at the macro level is carried out for 12 leading OECD economies plus China and Brazil over a period of 1960-2015 in a comparative dynamic fashion under varying policy priorities: economic, social, environmental and equal importance. Overall, Sweden, Switzerland and Norway are found to be outperforming most other countries based on the basket of 16 different sustainability indicators consistently over time. While there are underlying causes of such performance expressed in policies of innovation, decarbonisation, social cohesion addressing economic, environmental and social dimensions, there are some soft factors traditionally lying outside economic or policy domains. Such factors represent the power of institutions, the level of psychological wellbeing as well as societal values, which tend to be statistically different in Sweden, Switzerland and Norway as opposed to other countries in the sample. The reasons for the changes in sustainability performance among countries under different policy priorities are discussed at length with special attention paid to economically-, environmentally- and socially-weighted sustainability index of progress.
Keywords:
sustainability
; macroeconomics
; progress
; indicators
; assessment
; sustainability performance index
1. Introduction
While the global economy moved beyond six of the nine planetary boundaries (Richardson et al, 2023), it is now becoming abundantly clear that sustainability must be the top priority at the national and international level. Going beyond GDP is becoming a buzzword in high OECD political circles (Stiglitz, 2018), a long time since Herman Daly (Daly, 1991; Daly et al, 1994; Daly, 2000), Robert Ayres (Ayres, 1998, Ayres, 2009, Ayres, 2014) introduced and Victor (2008) and Jackson (2009) developed further the idea that economic growth should not be the ultimate goal of societal development. Major international institutions like OECD, UN and EU have been running Measuring Progress programmes (OECD, 2011) and examine alternatives to GDP (UNEP, 2023). This paper will address a range of research questions of particular interest to us: how could sustainability be assessed using multiple indicators; what are implications of the assessment of sustainability changes over time; what is the role of policy priorities, how can dynamic performances of countries be compared over time, what are the reasons, including policies, institutional and societal factors that could explain the relative strong performance among top performers and weak performance among countries that are lagging behind? The rest of the paper is structured as follows: Section 2 presents the literature review; Section 3 outlines the methodology of the analysis, Section 4 presents the results, Section 5 discusses underlying institutional and societal factors explaining the performance, Section 6 concludes.
2. Literature Review
Accurately assessing an economy’s performance is as difficult for researchers as it is relevant for policy makers. Efforts to measure economic performance, historically often summarized as Gross Domestic Product (GDP), today strive to include more aspects of current wellbeing and sustainability. Wellbeing often includes indicators of education, health, or distribution, while sustainability is assessed along economic, social, and environmental dimensions (Annex 1). Motivated by recent financial and environmental crises, measuring progress “beyond GDP” has become part of the academic and policy mainstream, exemplified by flagship sustainable development reports published by the OECD, EU, and UN (United Nations (UN), 2014; OECD, 2017; Stiglitz, Fitoussi and Durand, 2018; Sachs et al., 2022) Signalling the topic’s relevance, these reports build on a literature that has tried to define, accurately measure, and compare economic performance and sustainability since the 1970s. To provide an overview, we have grouped contributions by method type, as can be seen in Table 1 below. Many of the earlier studies in the field are closely tied to national accounting. They start with a standard economic measure, such as GDP or GNP and adjust by including or excluding certain measures. Moving beyond monetary indicators, the second cluster of studies aggregates a broad spectrum of indicators into a composite index, providing a single compact measure of complex processes. Footprints also provide an aggregated number but are focused on environmental aspects. Where composite indices provide an abstracted, single-number result, footprints aggregate into result expressed in a concrete common unit such as hectares or GHG emissions. Lastly, non-integrated baskets use broad indicator sets without aggregating them. Across, but also within method types, approaches vary in the degree to which they cover social, economic, and environmental sustainability, whether they convincingly address weighting issues, how easily they are comparable across time and space and how useful they are for policy purposes. Most studies allow for compensation between indicators, thus capturing weak sustainability (Dietz and Neumayer, 2007), while only a few fulfil strong sustainability criteria. Each method type can be interpreted as an attempt to mitigate shortcomings of another. Studies based on national accounting have a strong theoretical foundation, but their need for monetary indicators means that only aspects can be included where reliable valuation methods exist. Composite indices are not limited in terms of indicators, but weighting of different indicators can seem arbitrary. Footprints provide an easily understandable measure, but this measure might be harder to disaggregate and use for policy purposes. Non-integrated baskets avoid arbitrary weighting but forfeit easy overall comparability across space and time. As will be laid out in the following section, no study has achieved easy cross-country comparison over a longer time horizon while addressing weighting issues, including all three main dimensions of sustainability, and providing a useful foundation for policy purposes.
As mentioned, early contributions are closely linked to national accounting methods. Nordhaus and Tobin (1972) adjust GNP by reclassifying some of the expenditures that are usually counted as final (Nordhaus and Tobin, 1972). The resulting measure of economic welfare (MEW) can then be compared the amount of consumption that would be possible while ensuring that welfare does not decrease for future generations. Focusing on natural capital stocks, Hartwick (1990) adjusts net national product by including changes in natural capital stocks and suggests that any surplus should be reinvested into produced capital to compensate for depletion of natural capital stocks (Hartwick, 1990). With their weak sustainability approach the MEW and Hartwick provide the groundwork for two of the most prominent examples of multidimensional sustainability assessments. The first, either known as Genuine Savings (GS) or Adjusted Net Savings (ANS), was first explored by Pearce and Atkinson and elaborated on by Hamilton, among others (Pearce and Atkinson, 1993; Hamilton, 2000). At its core, GS or ANS deducts depreciation of man-made and natural capital from gross savings. In Hamilton (2000), GS means traditional net savings plus education expenditures minus energy, mineral, net forest depletion and carbon dioxide damage. For 1997, the results suggest that extractive economies are less sustainable, while high consumption in middle- and high-income countries is unproblematic. The second major approach based on national accounting is the Index of Sustainable Economic Welfare (ISEW) (Daly, 1994, p. 199) or Genuine Progress Indicator (GPI) (Cobb, Odman and Wackernagel, 1999). Like GDP, ISEW starts with personal consumption but then adjusts for distribution, as well as deducting and adding a range of measures, including more environmental indicators than GS/ANS. The main takeaway of the GPI/ISEW - generally called “threshold hypothesis” (Lawn and Clarke, 2010) - suggests that GDP only contributes to welfare up to a threshold, after which the GPI starts diverging from GDP growth. Approaches based on national accounting remain relevant. Lawn and Clarke (2010) apply the GPI to seven Asian-Pacific countries. GS has been calculated for a wide range of countries and time horizons (Lindmark, Nguyen Thu and Stage, 2018; McGrath, Hynes and McHale, 2019) and has been proposed by OECD reports as one of the most useful indicators of economic sustainability (Stiglitz, Sen and Fitoussi, 2009). Arrow et al. develop their own measure (Arrow et al., 2012) with results close to Cobb et al. (1999). National accounting itself has seen important developments towards more accurate monetary and physical measurements, as can be seen in the emergence of the System of Environmental Ecological Accounting as an international statistical standard (United Nations (UN), 2014). Relying on monetary indicators clearly has advantages. Approaches based on national accounting are easily understandable because of their proximity to standard measures, and they can be compared across time and space. Using economic theory as an entry point can improve accessibility but can lead to reliance on strong assumptions (Dietz and Neumayer, 2006). And despite statistical improvements, reliable valuation methods are limited, and criticisms connected to the incommensurability of values apply (Shmelev and Rodríguez-Labajos, 2009).
Composite indices address these concerns by including non-monetary indicators, often resulting in diverse and large indicator sets, that are then aggregated into a single number. Many composite indices exist, some specialised on one or two sustainability dimensions, some on all. Indices focused on environmental sustainability include the WWF Living Planet Index (Loh et al., 1998), Environmental Vulnerability Index (South Pacific Applied Geoscience Commission (SOPAC), 2005), the Environmental Sustainability Index (Esty, Granoff and Ruth, 2002) and the Environmental Performance Index (Wolf et al., 2022), the latter two both published by the Universities of Yale and Columbia. Osberg and Sharpe focus on economic sustainability (Osberg and Sharpe, 2002), while the rest of the composite indices in Table 1 try to capture economic, social, and environmental sustainability. Others have added institutional sustainability as a fourth dimension (Mirshojaeian Hosseini and Kaneko, 2011). Selection of indicators usually comes down to policy priorities and data availability. Extensive indicator baskets can limit the available time horizon, or general comparability across time and space. The latter can also be affected by changes in methodology, as is the case for the ESI and HDI (United Nations Development Programme (UNDP), 2022). Some indices were not published for more than a few years (Prescott-Allen, 2001; South Pacific Applied Geoscience Commission (SOPAC), 2005). Inclusion of different units of measurement means that decisions must be made when aggregating. Most studies employ equal weights, acknowledging that finding an expert consensus is likely impossible (Sachs et al., 2022, p. 61). The EPI employs varying weights based on policy-objectives (Wolf et al., 2022) changing from edition to edition, limiting cross-temporal comparisons. Whether average or varying weights are chosen, some arbitrariness remains. Only Osberg and Sharpe (2002) address this issue by applying equal and alternative weights, illustrating varying priorities. Because of the weighting issues, as well as the complex indicator sets, the composite indices can seem quite abstract.
Footprints can be easier to grasp. Like approaches based on national accounting, footprints present their result in one concrete common unit, be it hectares, GHG emissions or emitted light energy. Its most elaborate example is the Ecological Footprint (EF), at its core representing water and land use associated with consumption and waste absorption, boiled down into a single number. EF’s can be calculated on any scale, for example nationally and globally (Wackernagel et al., 1997). By comparing the global EF with earth’s carrying capacity, the EF becomes an indicator of global overconsumption. Even though the EF’s message is easily understood, its calculations are still quite complicated, and can suffer from lacking data in certain countries and high correlation with CO2 emissions (Giljum et al, 2007). These issues are the reason why some have proposed the Carbon Footprint (Hertwich and Peters, 2009) as a more practical indicator to assess overconsumption (Stiglitz, Sen and Fitoussi, 2009). Instead of land and water use, the CF represents GHG emissions associated with consumption categories. A third example comes from Sutton, who puts emitted light energy in relation to the country’s value of ecosystem services, thus comparing a proxy for consumption to a proxy for biocapacity (Sutton, 2003). Sutton also shows that his index is closely correlated with the EF, but not with the ESI, highlighting that sustainability measures can be contradictory and might measure entirely different aspects. Footprints give an easy indication of overconsumption. While they might be easier to understand than composite indices, they could be less useful for policy purposes. In the case of the EF and the CF, they can show which sectors are especially intensive in land use or GHG emissions, but they cannot be disaggregated into the complex processes that they try to capture as easily as most composite indices.
Non-integrated baskets are a direct answer to the weighting issues inherent to composite indices, while maintaining the possibility to include a wide variety of indicators. One contemporary example is the assessment based on SDGs (European Commission (EC). Statistical Office of the European Union., 2022). With 101 indicators and without the practical overview provided by a composite index, such an assessment can seem overwhelming, which is why others have argued for non-aggregation with a compact indicator set (Stiglitz, Sen and Fitoussi, 2009; OECD, 2017). Stiglitz et al. (2009) argue for a separation of the assessment of current well-being and sustainability, and of economic and environmental sustainability. They see aggregated measures such as GS or EF as possible parts of a “dashboard”, but not as an overall assessment of sustainability. By only looking at indicators for one dimension of sustainability, weighting becomes less of an issue. Whoever is reading the presented data can do so according to their policy priorities. Cognizant of these priorities Mascarenhas et al. select their basket according to questionnaires with stakeholders (Mascarenhas et al., 2010). Compared to composite indices, non-aggregation makes strong sustainability criteria possible (Mori et al., 2015). If there is a critical stock of natural capital, then the indicator basket can simply be interpreted accordingly, without a composite index muddying the waters. By avoiding some of the issues of composite indices, non-integrated baskets sacrifice immediate readability and overall comparability across space and time. The non-integrated baskets listed in Table 1 do not cover a very long time horizon.
Trade-offs always exist when choosing a method to assess current wellbeing, sustainability, or both. Approaches based on national accounting allow for a strong foundation in economic theory and easier comparisons but are problematic because the valuation of the environment can be hard or impossible. A larger basket means more nuance, but less comparability across time and space and weighting issues if aggregated. A more focused approach can mean decreased usefulness for policy purposes and exclusion of at least one of the three dimensions of sustainability. Different methods address problems of other methods but are connected to new shortcomings. Some have combined existing indices to get a more complete picture (Li et al., 2022). In our own work, we have addressed weighting issues by employing Multicriteria Decision Aid (MCDA) with varying weights to allow for analysis from different policy standpoints (Shmelev and Rodríguez-Labajos, 2009; Shmelev, 2017). Overall, no approach has maintained coverage of all three major dimensions of sustainability, broad cross-temporal and cross-country comparison, while sufficiently addressing weighting issues. Osberg and Sharpe (2002) analyse alternative priorities, but their approach is limited to economic sustainability. GS/ANS approaches can cover a long time horizon and have no issues with arbitrary weighting, but their reliance on monetary indicators limits their coverage of environmental sustainability and their models rely on strong theoretical assumptions (Dietz and Neumayer, 2006) Any measure using a large indicator basket sacrifices some comparability across time and space, either because indicators are not available, or statistical capabilities vary between countries or across time, making comparison difficult. The index proposed in this paper uses a set of indicators that is compact enough to enable broad cross-country and cross-temporal comparison and varied enough to capture all three dimensions of sustainability. To circumvent weighting issues, data for different policy alternatives is presented. The result can be easily disaggregated into its components, providing a useful basis for policy analysis.
3. Methodology
Our methodology of multidimensional assessment of sustainability (Figure 1) rests on previous work applying multicriteria decision aid for dynamic sustainability assessment: (Shmelev, S.E. and Rodríguez-Labajos, B., 2009), Shmelev (2011), Shmelev (2017). The largest element of novelty in the present research is simultaneous assessment of several countries based on multiple sustainability indicators covering an extended period of 1960-2015. The assessment is forming part of the UNIVERSE modelling complex, where each of the indicators for each country constitutes a separate dynamic econometric model similar to the research performed in Shmelev and Speck (2018).
The selection of 14 countries in our sample: USA, China, Japan, Brazil, Sweden, Switzerland, Norway, Turkey, Canada, Austria, France, Germany, Denmark and the Netherlands is far from being random, reflecting a strategic choice that captures a representative share of global economic activity, sustainability policies, and environmental impact. Focusing on economic dimensions, the sample accounts for over 62% of global GDP (2023) with major economies such as USA (26%), China (16.9%), Japan (4.2%), Germany (4%) and France (2.9%) leading the global economy. The mix of advanced economies represented by the OECD countries and emerging economies (China, Brazil, Turkey) ensures a balanced comparison of sustainability progress across different developmental stages. Including smaller by high-performing economies like Switzerland, Sweden and Norway provides insight into innovative sustainability policies. Examining environmental dimensions, USA and China alone account for over 45% of global CO2 emissions, making them critical for understanding sustainability trends (Shmelev, Brook, 2021). Japan, Germany, Canada and France are among the largest industrialised economies with major environmental impacts. Sweden, Norway, and Switzerland are recognized for their leadership in environmental sustainability and renewable energy (Shmelev, Speck, 2018). Brazil is essential as a leader in biodiversity and renewable hydropower but also a key player in deforestation and land use change. From the policy diversity and institutional models perspective, the countries selected represent a variety of economic and governance models: Nordic countries of Sweden, Norway, Denmark are strong welfare states with leading sustainability policies; Anglo-Saxon model liberal economies of USA, Canada apply market-driven sustainability approaches; Continental Europe countries of France, Germany, Netherlands, Austria and Switzerland use mixed economic models with high environmental standards; Emerging economies of China, Brazil and Turkey exhibit rapid growth and contrasting sustainability challenges. The study includes countries from North America, Europe, East Asia and South America covering a wide geographic and climatic diversity; the mix of high-income, middle-income and rapidly developing nations allows meaningful cross-country comparisons. The selection of countries was driven by data availability, as constructing a consistent dataset of nine key sustainability indicators from 1960 to the present was not feasible for many nations, including Mexico, most of Africa, and Indonesia, making our final choice both necessary and analytically robust.
Assessment of sustainability is, essentially, a multidimensional assessment problem, bringing together economic, social and environmental aspects of the development process. This is why multicriteria decision aid tools, MCDA, (Roy, 1996) are best suited to assess performance. In this study, we adopt an elegant MCDA methodology of linear aggregation with weights with one peculiarity. We change weights expressing varying policy priorities for environmental, social or economic dimensions similar to how it has been done for cities in Shmelev (2019), Shmelev and Shmeleva (2018, 2019, 2023, 2025).
Selection of indicators in our research has been dictated by years of experience and the desire to cover as long a time period as possible (1960-2015) at the same time covering all sustainability dimensions in equal measure. The final set of indicators includes (Figure 1): GDP per capita at purchasing power parity, Inflation rate and Debt-to-GDP ratio representing the economic dimensions, life expectancy, unemployment rate and the share of top 1% income representing the social dimension, and, finally, CO2 emissions, share of renewable energy and % of agricultural land representing environmental dimension. We kept the balance between the dimensions clear by using three indicators in each since the composition of the basket of indicators is a political choice that will influence the result and we wanted all the dimensions to be represented in equal measure. All data has been normalised and expressed as numbers projected onto the [0:1] interval with larger values representing the better values of the indicator taking into account the preference to maximize or minimise this indicator. Normalisation has been carried out across the whole set of values of each indicator across the whole set of countries with the worst value being projected to 0 and the best onto 1 on the [0:1] scale. The varying policy priorities were expressed through changing weights with a weight of 0.5 given to the priority dimension and 0.25 to each of the remaining dimensions and individual weights of indicators obtained by dividing the dimension weight by 3 (the number of indicators in each dimension).
Using such global normalisation we were able to compare performance of several countries on the same scale under economic, environmental, social priorities and equal weights scenarios. Most of the data came from the World Bank. There are multiple methodological issues related to the quality of environmental and social data at the macro level that should be mentioned here. We would have loved to be able to use consistent data for Gini index of income inequality for all countries for the period 1960-2015, however this was not possible to obtain at the time of publication. Equally, we would have loved to use long time series data on biodiversity, e.g. bird index data, however such data was not available for the whole period under consideration so we had to resort to a proxy of % of agricultural land. When this indicator increases, we assume that the % of forest and the biodiversity present there declines. At the same time, we would have loved to use a consistent dataset on recycling rates for 1960-2015 for all countries, however this was not available either. Of the whole plethora of sustainability indicators recommended by SDG methodology, there are still persistent gaps that limit the evidence-based comprehensive analysis of policies on long time horizons similar to the one adopted in this paper. One exception is the study by Shmelev & Speck (2018) which uses a comparable dataset starting in 1960 and applying an econometric model to study the real-life impacts of carbon and other environmental taxes on CO2 emissions in Sweden.
4. Analysis
The results of our analysis can be seen in the four graphs below, displaying developments across our sustainability basket, aggregated into a composite index. Each graph covers the indices of 14 countries from 1960 until 2015, with varying weights for the different dimensions of sustainability. Figure 2 shows results for equal weights, while Figure 3, Figure 4 and Figure 5 each prioritise one dimension over the others, as we have laid out above. In the following section, we will analyse the stories that these graphs tell about sustainability across economic, social, and environmental dimensions, and across time. For brevity’s sake, we will focus on seven countries, enough to offer some interesting takeaways and demonstrate the strengths of our dashboard.
With equal weights, three clear top performers are identifiable: Switzerland, Norway, and Sweden. Two countries come close, with Japan performing well early on, and dropping off afterwards, and Canada, characterized by a stable, and recently improving curve. These two are joined by Austria and Turkey as countries whose integrated performance stays above 0.55, with both showing an overall improvement. Countries whose integrated performance drops below 0.55 in some phases are Brazil, Denmark, Germany, Netherlands, France, China, and the USA. Developments in these countries are varied. Germany, the Netherlands, and France start out from a similarly low level but achieve steady and significant improvement with time. Improvement in the US exists, but is smaller, while China, Brazil, and Denmark experience especially high variance.
Observing these overall trends, some interesting questions emerge. What is driving the positive developments among the top performers? Why are the curves of France, Germany, and the Netherlands so similar, while developments in Denmark have been more up and down? What explains China’s rise and fall? What went wrong in Japan, and in Brazil of the 80s and 90s? Looking at the results with varying weights in Figure 3, Figure 4 and Figure 5 provides hints at some answers. Brazil’s up and down is most pronounced with economic prioritization, suggesting that the main drivers of overall performance in this time come from this dimension. Figure 3, Figure 4 and Figure 5 produce more questions, for example why the US performs so badly under environmental prioritization. To clear things up, we will take a closer look at seven individual countries.
4.1. USA
The evenly weighted index for the US has improved slowly but steadily, with signs of stagnation in recent years. This overall trend can be seen under economic (Figure 3) and social prioritization (Figure 5), with the former showing a relatively larger improvement, although at a lower level. With environmental priorities, the overall development is still slightly positive (especially in recent years), but the improvement has been less steady, and is a negative outlier in international comparison.
For economic indicators, positive trends for GDP and negative trends for debt roughly cancel each other out, while inflation has seen some up and down, but has been stable on average. Both debt and inflation have increased as a result of the financial crisis, and explain some of the stagnation of overall and economic performance since 2008. The overall stability of economic indicators hints at the high priority that political decision makers in the US place on the mitigation of economic crises. The smaller improvement under social prioritization is accounted for by a relatively high level across social indicators in the beginning and recent negative trends in top 1 % income share, which mirrors widely discussed increases in inequality (Piketty and Saez, 2014) Unemployment has been up and down, in line with economic crises.
It is clear that sustainability indicators are shaped by crises. Following a recession in the 60s, carbon emission reductions were not a high priority. Then and now, CO2 emissions per capita remained nearly double that of the OECD average (World Bank, no date), driving the negative performance trend (Figure 3). Growing environmental awareness in the late 60s and early 70s produced some environmental improvements, but momentum was lost again by the early 80s (Kraft, 2000; Rome, 2003). Since the 2000s however, more significant improvement can be seen in a slow decrease of per capita CO2 emissions and an increasing share of renewables, suggesting that policy priorities can shift not just as a result of economic, but also because of environmental crisis. Symptoms of the growing political will to address environmental problems can be seen recently in the Obama and current Biden administration, but progress was neither easy, because of opposition from the Republican party, nor linear, as the Trump administration rolled back policies and withdrew from the Paris Climate Agreement (Cha, Farrell and Stevis, 2022) Beyond changing administrations, a contributor to a temporary decrease in environmental performance after 2008 could also be changing public attitudes amidst increasing unemployment, which has been shown to be closely correlated with shifting priorities away from environmental goals (Kenny, 2019).
4.2. Brazil
Overall, Brazil’s performance has slightly declined, with a drastic up and down in the 1990s, that is especially pronounced under economic prioritization. Under environmental priorities, performance starts on a higher level, but decreases by the largest margin, while with increased weights for the social indicators, the graph is more stable, and even increases slightly.
As the severity of the up and down under economic prioritization (Figure 2) suggests, its main drivers are debt and inflation. Debt was high as a result of the 1970s oil crisis, contributing to rising inflation. Additionally, it has been shown that Latin American countries such as Brazil that re-democratised after 1980 tended to pursue populist policies that further increased inflation, eventually leading to a hyperinflation in the early 1990s (Samuels, 2003; Bittencourt, 2012). The economic turmoil was eventually addressed by the “Plano Real”, which introduced a new currency, increased government revenue, and re-established some of the national government’s control over the fiscal policies of the federal states, which had contributed to the rise of inflation (Samuels, 2003). Although new problems have emerged, the “Plano Real” is one of the main reasons why sustainability performance in Figure 2 has been improving since the early 2000s.
The relatively strong performance under environmental prioritization (Figure 4), as well as the relatively large decrease, is driven by Brazil’s share of renewables and CO2 emissions. Motivated by supply shortages from non-renewables such as the oil crises, Brazil’s energy mix has been clean in international comparison, with large hydropower and sugarcane energy capabilities (de Freitas and Kaneko, 2011), hovering around 50% renewable energy consumption out of total consumption, as opposed to below 15% for OECD members (World Bank, no date). Even though CO2 emissions have grown, and are the main factor explaining the performance decrease under environmental prioritization, Brazil’s per capita carbon emissions are still much lower than the OECD average and in 2015 were nearly five metric tons below China (World Bank, no date). Emission changes in Brazil also differ from China’s and the world average in that they have been closely linked to changes in the energy mix and carbon intensity, rather than energy intensity (de Freitas and Kaneko, 2011)
Lastly, the relative overall stability and slight improvement under social prioritization (Figure 5) since the mid-2000s relative to the developments under environmental priorities can be explained by small to moderate improvements across the social indicators. Life expectancy has steadily increased due to growth and a range of social reforms, that have reduced poverty and improved inequalities in regards to access to education and healthcare (Freeman et al., 2020). Despite these improvements, income inequality is still high in international comparison, and the top 1 % income share was rising until 2008 and has decreased only slightly since (Alvaredo et al., 2018). On a positive note, due to the successful economic recovery from the turmoil of the 1990s along with increased formalization (Menezes-Filho and Scorzafave, 2009), Brazil managed to break an upwards trend in unemployment that had been going on until the late 1990s, decreasing the total unemployment rate from 11.13% in 1999 to 6.76% in 2014 (World Bank, no date).
4.3. Japan
Japan is the country with the largest overall decrease in the sustainability index, which plateaued between the middle of the 1970s and 1990s. Under economic prioritization (Figure 2), this decline is steeper after 1995, and under environmental priorities, since 1975 (Figure 4). With increased weights for social indicators, the decrease is much smaller than for the other prioritizations (Figure 5).
Japan’s overall sustainability decline is driven both by economic and environmental indicators. While economic conditions were somewhat stable until the early 1970s, growth-driven CO2 emissions were increasing rapidly in this timeframe (Broadbent, 1999, p. 12), explaining the steeper curve before 1975 in Figure 3. While emissions still rose overall until the 2000s, a governmental crackdown on polluting companies in 1973 managed to stabilize emission growth (Broadbent, 1999, p. 127). With CO2 emissions stabilizing the main drivers of the performance decline after 1995 are stagnating growth and increasing government debt. After decades of steady growth brought on by export driven development (Zang and Baimbridge, 2012), growth has slowed down since 1995, and government debt has increased in an effort to mitigate the negative effects potential stagnation. Explanations for this stagnation range from slowing of productivity growth (Tyers, 2012; Akram, 2019), declining exports (Akram, 2019), China’s expansion (Tyers, 2012) to a currency appreciation against the US-Dollar (McKinnon and Ohno, 2001). Especially Japanese manufacturing struggled to stay competitive in light of the growth of other Asian economies (Akram, 2019). Traditional tools to reinvigorate the economy have been ineffective in the context of very low inflation or deflation, which has led to arguments for the existence of a Japanese liquidity trap (Krugman, Dominquez and Rogoff, 1998).
In contrast to the relatively large performance decline from an economic and environmental viewpoint, the trend under social prioritization has been less steep. While unemployment has recently increased to over 5 % due to the economic slowdown discussed above, Japan’s economy is equal in comparison to the US and the European average (Alvaredo et al., 2018), with the top 1% income share remaining under 10 % due to the basis of large capital incomes being removed during World War 2 and occupational reforms, as well as progressive taxation, and collective bargaining later on (Moriguchi and Saez, 2008). As for most other developed countries, life expectancy has steadily increased, explaining the relative stability of the graph in Figure 5.
4.5. Sweden
Sweden, along with Norway and Switzerland is one of the top performers, starting out at a high level and after a slow start in the 1960s, achieving a steady improvements until today, except for a stretch in the early 1990s. Performance remains at an especially high level under social prioritization (Figure 5), while the other two see larger improvements, although at a slightly lower level.
Sweden’s slow start can be explained by comparatively slow growth and rising CO2 emissions. Emerging environmental consciousness and the oil price shocks eventually led to institutional change in the form of the Environmental Agency in 1967 and the Environmental Protection Act in 1969. In Western European comparison, the rise of environmental concerns into the public eye happened early in Sweden (Heidenblad, 2018). With more funds for environmental protection, significant emission reductions and an increased share of renewables were achieved, which along with faster growth accounts for the improved overall performance. Declining CO2 emissions have remained as one of the drivers of progress (Figure 3), driven by a mix of technological improvements in hydro and nuclear power, carbon taxation, and especially energy taxes on coal and gas (Shmelev and Speck, 2018).
The temporary performance decline in the 1990s is due to economic crisis in the early 1990s, produced by the financial deregulation of the 1980s (Englund, 2015) and triggered by a rapid drop in real estate prices (Edvinsson, Eriksson and Ingman, 2021) produced a decrease in GDP, rising inflation and high unemployment (Kiander and Vartia, 2011). The recovery was kickstarted when the krona changed to a floating exchange rate, leading to a sharp depreciation and subsequent export-driven growth (Jonung and Hagberg, 2005; Jonung, 2009). This paved the way for further improvements across our sustainability criteria, brought on by strong growth, low inflation and decreasing CO2 emissions, the latter promoted by an economy in which the main employing sectors are also insignificant contributors to economy-wide CO2 emissions (Shmelev and Brook, 2021).
With the resolution of the crisis, that has generally been deemed to be an example of good crisis management (Jonung, 2009), unemployment returned to a low level, which together with low inequality contributes to Sweden being one of the top performers overall, and especially strong under social prioritization. The reasons for the strong social performance of Sweden specifically and Scandinavian countries generally, have been linked to the existence of a pragmatic, consensus-based social democratic “Nordic model”, which has managed to use the growth of its economy as a facilitator of a comparatively equal society with strong unions, small wage differentials, and effective cooperation between major societal actors (Alestalo, Hort and Kuhnle, 2009; Brandal, Bratberg and Thorsen, 2013, p. 12).
4.6. China
China, despite impressive economic growth, is one of the countries that have experienced a classic case of a turning point (Shmelev, 2017). Unlike Japan however, conditions have been improving before 1985, and, unfortunately, the massive economic growth after economic reforms has not brought with it the overall sustainability improvements yet (Figure 2, Figure 3, Figure 4 and Figure 5), which we still might see as time goes by. Across prioritizations, significant differences can be observed: both the economic and social prioritization show a decline after 1985, at a much lower level for the former than the latter. From an environmental viewpoint, conditions peaked mid 1980s.
The positive picture pre-1985 is characterised by low inflation, which returned to these levels after a large spike as a result of the “Great Leap Forward” (Naughton, 1989), relatively low CO2 emissions due to a largely non-industrial economy, growing life expectancy and low inequality (Riskin, 2014). Economic reform in 1978, which brought partial liberalization, while preserving strong state capabilities unlocked rapid GDP growth in the following decades (Khan, 2007). Many authors have discussed other drivers behind these developments, ranging from physical and human capital accumulation (Chow, 1993; Wang and Yao, 2003), growing productivity (Borensztein and Ostry, 1996; Wang and Yao, 2003)and institutional change (Qian, 2002). Others have argued that the extent of Chinese growth might have been overstated due to under-reported inflation (Young, 2003). Positive developments of GDP were accompanied by a mixed picture for our other sustainability indicators. Brought on by the new-found economic autonomy and large government expenditures, inflation saw upwards spikes at the end of the 80s into the mid-90s, and stabilized afterwards. Debt has been increasing gradually, explaining the overall decrease in performance under economic prioritization (need to see data to make sure that this is true). Increasing unemployment until 2006 because of job losses in state-owned enterprises as well as a relaxation of the hukou system, which had kept rural workers out of urban employment (Feng, Hu and Moffitt, 2015), accounts for a part of a similar decrease under social prioritization. Additionally, the top 1 % share of income has been steadily increasing because of unequal access to education, urbanization and a growing skill premium (Jain-Chandra et al., 2018).
In contrast, under environmental prioritization developments have been mixed, and complicated by the fact that China’s most sustainable sectors provide relatively little employment in comparison to countries such as Sweden, Germany and the US (Shmelev and Brook, 2021) and China has yet to phase out coal to fully decarbonise. Still, renewable energy capacities have rapidly increased, indicating a significant shift in government priorities (Yuan and Zuo, 2011). While energy efficiency and consumption patterns became more sustainable, CO2 emissions have steadily grown, and slowed down only recently, reflecting further political commitments, but also a slight slowdown in growth (Zheng et al., 2019).
4.6. Germany
Along with the neighbouring Netherlands and France, Germany’s performance has steadily improved, although at a relatively low level. This steady increase can be seen both with economic and environmental prioritization, while developments under social priorities have been slightly more unsteady. After an initial decline in performance until 1985, and excluding a temporary decrease in 1995, a strong upwards trend has meant that performance with social priorities is now the strongest out of the three sustainability dimensions.
Most indicators in our basket have improved, either steadily, or with some up and down. The latter applies to GDP, which has grown in three major surges, with stagnation or an up and down at the end of each. The early 80s saw an economic downturn due to the 1979 oil shock (Hellwig et al., 1987), in the early to mid 90s reunification brought on the so called consolidation crisis (Heilemann, 2019)and the recession was worsened by the burst of the “dotcom”-bubble (Räth, 2009). The negative effects of the financial crisis in 2008 were large, but recovery was swift, because of a resilient labour market and flexibility of fiscal policies (Blömer et al., 2015). While debt has increased, developments for CO2 emissions and the share of renewables have been positive, driven by decreasing energy intensity (Duan et al., 2022)and a gradual move away from coal (Renn and Marshall, 2016), although per capita emissions remain high.
4.7. Denmark
In contrast to its German and Swedish neighbours, Denmark’s performance has fluctuated significantly. A large decline from 1960 to 1985 was followed by improvement until 1995, then a rapid drop to an all-time performance low and finally relative stability. As a result of this up and down, Denmark’s integrated basket of indicators has slightly declined. While the fluctuations are less extreme under economic and environmental prioritization, social indicators seem to be the drivers behind the ups and downs.
Denmark’s economic indicators look similar to both Germany’s and Sweden’s, with clear growth overall, and downturns in the early 80s, late 90s and after 2008. Inflation was high in the 70s because of large fiscal expenditures to maintain employment during and after the oil crisis, but was reigned in by a conservative government that introduced a fixed exchange rate in the 1980s, which has been identified as one of the reasons for the remarkably low inflation ever since (Møller Christensen and Topp, 1997). In North and Central European comparison, Denmark’s debt has remained relatively low, again initiated by the conservative political swing in the early 80s (Møller Christensen and Topp, 1997; Steigum, 2010). Thus, low inflation and debt account for most of Denmark’s good economic performance in comparison to Germany.
Under environmental prioritization (Figure 5), Denmark also outperforms Germany, except for a temporary decrease in the late 1990s. With steady improvements for agricultural land and share of renewables, CO2 emissions are the main drivers behind fluctuations. Emissions were up and down until 1990 and increased to a peak until the end of the decade, explaining the overall decline of Denmark’s curve until the late 1990s. Motivated by the oil crisis in the 1970s, political will to achieve energy self-sufficiency, especially through renewable energy existed much earlier (Sovacool, 2013), but only a fundamental restructuring of the heating system and energy sector brought on long term emission reductions (Jensen, 2017). Despite improvements, it should be noted that research has shown that modelling Denmark’s emission while including GHG’s connected to traded goods might reduce the significance of improvements (Lenzen, Pade and Munksgaard, 2004)
Denmark’s overall decline under social prioritization is driven by increasing income inequality, while changes in unemployment account for the comparatively large fluctuations. With a Palma ratio of below 1, Denmark’s income distributed quite equally in international comparison (Bjørsted et al., 2021, p. 31). At the same time, the top 1% income share has been increasing (Caspersen, 2023). While some growth oriented policies may have exacerbated the developments, rising inequality is likely tied to global trends, that have seen a growing gap between wages for lower skill and higher skill work as well as increasing capital incomes (Michelson, 2016). In addition to economic stagnation, and a spike in CO2 emissions, the steep downwards trend at the end of the 1990s is connected to peaking unemployment around that time. The same goes for the following recovery, where a mix of new labour market policies, training programs, more effective trade unions and increased participation of women combined with an economic upswing to produce an “employment miracle” (Madsen, 1999). The shape of Denmark’s graph in Figure 4 then develops in line with a spike in unemployment due to the 2008 financial crisis and the subsequent recovery.
5. Discussion
The comparative assessment of per capita sustainability performance across major economies highlights significant disparities, particularly in environmental priorities. The United States, Germany, and the Netherlands underperform compared to Norway, Switzerland, and Sweden, whose superior outcomes are rooted in structural economic factors, energy policies, and institutional characteristics.
The United States exhibits weak environmental performance due to its heavy reliance on fossil fuels, which results in per capita CO2 emissions of 16.41 tonnes per year—substantially higher than Switzerland’s 4.35, Sweden’s 4.48, and Norway’s 7.52. This stark contrast reflects the limited penetration of renewable energy in the U.S., which stands at only 12.95%, significantly trailing Sweden’s 48.54%, Norway’s 57%, and Switzerland’s 64%. Additionally, the U.S. faces structural inefficiencies in urban planning, transportation reliance on private vehicles, and an inconsistent environmental policy framework prone to political reversals. The Scandinavian countries, in contrast, have long-established environmental policies, including carbon taxes and investments in hydroelectric and nuclear energy.
President Donald Trump has initiated the process for the United States to withdraw from the Paris Agreement once again. On January 20, 2025, he signed an executive order titled "Putting America First In International Environmental Agreements," directing the immediate withdrawal from the Paris Agreement and other related international climate commitments. This marks the second time the U.S. has exited the Paris Agreement under Trump's leadership; the first withdrawal occurred during his initial term. The executive order also mandates the termination of all U.S. financial commitments under the United Nations Framework Convention on Climate Change, including the International Climate Finance Plan. This action has raised concerns among environmental organizations and international leaders, particularly those from nations vulnerable to climate change impacts
France, in contrast to Germany and the Netherlands, has a significant nuclear energy share, which contributes to its relatively lower per capita CO2 emissions of 4.59 tonnes—comparable to Sweden and Switzerland. However, its reliance on nuclear power has not translated into a higher share of renewables, which remains at 13%. Germany, with a renewable share of only 14% and per capita CO2 emissions of 9.10 tonnes, continues to rely on fossil fuels, particularly coal, which has hindered its sustainability performance. The Netherlands, with an emissions rate of 8.88 tonnes per capita and similarly low renewable adoption, follows a comparable trajectory.
In economic terms, GDP per capita figures further differentiate these countries. Switzerland ($86,605), Norway ($97,019), and Sweden ($60,020) lead significantly over Germany ($47,959), France ($43,011), and the Netherlands ($52,830). The U.S., at $55,064, also lags behind the sustainability leaders. The higher economic output of Switzerland, Norway, and Sweden supports their ability to invest in sustainable infrastructure, research, and social welfare systems. Inflation also plays a role; while low in absolute terms, Switzerland (-0.01%) and Sweden (-0.18%) have outperformed Germany (0.907%) and France (0.508%). Norway, at 2.04%, remains stable. These variations indicate economic stability and controlled monetary policies that support sustainability-oriented investments.
Income distribution provides additional insights into the structural inequality present in these nations. The U.S. stands out with a top 1% income share of 20.20%, higher than Sweden (8.73%) and Switzerland (11.3%), but lower than Norway (32.2%), France (32.43%), and Germany (38.26%). The high values in France and Germany indicate greater income inequality, which can weaken social sustainability by concentrating wealth among the elite, reducing social mobility, and limiting broader economic participation. In contrast, Scandinavian economies with lower inequality have robust social security systems and progressive taxation, ensuring more inclusive economic development.
Unemployment figures further delineate these economies. Switzerland (3.04%) and Norway (3%) maintain low unemployment, followed by Germany (4.98%) and Sweden (7.5%), while France lags with a significantly high unemployment rate of 10.29%. Sustainable economic models prioritize job security and social protections, explaining why Scandinavian economies outperform their European counterparts in holistic sustainability measures.
Agricultural land usage, serving as a proxy for biodiversity preservation, also reflects sustainability performance. Switzerland (38.53%), Norway (3%), and Sweden (7.45%) retain large areas of natural wilderness, while France (52.54%), Germany (47.94%), and the Netherlands (54.59%) have converted more land for agriculture. The U.S. also exhibits high agricultural land use at 44.59%, which, while lower than Germany and France, still suggests a significant transformation of natural landscapes.
Debt-to-GDP ratios also distinguish sustainable economic policies. Switzerland (30.62%), Norway (28.7%), and Sweden (44.78%) manage debt effectively, allowing greater fiscal flexibility to invest in sustainability initiatives. France (94.90%) and Germany (75.70%) operate under higher debt burdens, restricting public spending on long-term environmental and social programs. The U.S. fares even worse, with a debt-to-GDP ratio of 104.61%, constraining its ability to finance sustainability transitions effectively.
Life expectancy data further supports the correlation between economic stability, social investment, and sustainability performance. Switzerland (83.19 years), Sweden (82.25 years), and Norway (82.1 years) lead in longevity, while Germany (81.09), France (82.71), and the Netherlands (81.70) follow closely. The U.S. significantly underperforms at 78.84 years, reflecting disparities in healthcare, social policies, and economic inequality.
6. Conclusions
This comprehensive analysis reveals that Norway, Switzerland, and Sweden’s superior sustainability performance is driven by high renewable energy shares, low CO2 emissions, robust economic stability, lower income inequality, and strong environmental governance. In contrast, Germany, France, and the Netherlands underperform due to their dependence on fossil fuels, lower GDP per capita, higher income inequality, and structural economic constraints. The U.S. remains an outlier with excessive carbon emissions, income inequality, and weak environmental policies.
Appendix A
| Auth Method | Method Type | Method Name | Indicators | available time horizon | lusionConcs |
| Nordhaus & Tobin (1972) | NA | Measure of economic welfare (MEW) | 10 | 1929-1965 | This study lays the groundwork for national accounting approaches, adjusting GNP by deducting expenditures that do not increase welfare. It then contrasts the calculated Measure of economic welfare (MEW) with an MEW that would hold welfare constant over time. Decreases in natural capital are discussed but excluded from calculations. The authors argue for introducing incentives to preserve resources to counter problems that arise when the price mechanism does not properly value wealth depletion. |
| Hartwick (1990) | NA | true NNP | 5 | n.a. | This is one of the foundational contributions for weak sustainability measures. It adjusts net national product by deducting used up natural capital stocks to arrive at a "true NNP" measure. It is based on "Hartwick's Rule", prescribing reinvestment of gains from declining stocks of exhaustible resources into produced capital to achieve sustainability. |
| Pearce & Atkinson (1993) | NA | Genuine Savings | 4 | 1765-today | This initial exploration of the GS/ANS approach proposes a weak sustainability indicator, based on comparing savings with depreciation of capital stocks. An economy is sustainable if it saves more than it depletes its stocks of produced and natural capital. It presents results for 18 countries. |
| Daly (1994) | NA | Index of Sustainable Economic Well-being | 21 | 1950-1990 | The ISEW divides personal consumption by income distribution and then deducts or adds a range of measures. It includes a wider range of environmental indicators than previous indices. Results are presented for the US from 1950-1990. The ISEW is shown to have grown much slower than GNP. Unsustainable consumption patterns are identified as the main reason for the ISEWs divergence from GNP growth. |
| Wackernagel et al. (1997) | F | Ecological Footprint | 10 | 1961-2018 | The Ecological Footprint assesses how much land and water area is used for a country's consumption and connected waste absorption. A sustainable country stays within its biophysical boundaries. Results are presented for 52 nations, showing that humanity is exceeding earth's biophysical capacity by one third. |
| Loh et al. (1998) | CI | WWF Living Planet Index | 3 | 1970-today | The Living Planet Index is an attempt at assessing the state of forest, freshwater and marine ecosystems. It offers country-data for each, as well as an integrated index. All overall indices are shown to have declined significantly. The report offers a separate measure for global consumption pressure. |
| Cobb et al. (1999) | NA | Genuine Progress Indicator | 18 | 1950-today | The GPI and ISEW are usually treated as synonymous. This 1999 contribution presents the US GPI, with personal consumption adjusted for income distribution and addition and subtraction of different measures, from 1950-1999. It includes measures for economic, social, and environmental sustainability, all denoted in dollars. The report shows that the GPI has started diverging downwards from GDP around 1970, lending support to the "threshold hypothesis", according to which GDP growth only contributes to welfare up to a turning point. |
| Hamilton (2000) | NA | Genuine Savings | 7 | 1765-today | This report presents Genuine Savings (GS), adjusting traditional net savings by subtracting net depletion in natural resource value and value of pollution and adding investments in education. Results are presented for all countries and across regions in 1997. Only the Middle East and North Africa are shown as slightly unsustainable. Middle- and high-income countries, especially in South Asia and the Pacific have the highest GS, while a negative correlation is shown between resource dependency of countries and their GS. |
| Prescott-Allen (2001) | CI | Wellbeing Index / Barometer of Sustainability | > 60 | 1998 | This book proposes a Wellbeing Index (WI), based on two top-level indices: the Human Wellbeing Index (HWI) and the Ecosystem Wellbeing Index (EWI). Instead of monetary of physical valuation, performance scores are compared to performance standards and aggregated into indices. Sustainability is defined as a WI of 81. Results are presented for 180 countries. No country in the report is categorized as sustainable: The overall "best" countries score high on HWI but relatively low on EWI. For most countries, HWI is higher than EWI. |
| Esty et al. (2002) | CI | Environmental Sustainability Index | 68 | 2000-2005 | The ESI is aggregated from five core components: environmental systems, reducing stresses, reducing human vulnerability, social and institutional capacity, and global stewardship. 20 sub-indices, based on 68 indicators are averaged and compared internationally. Results are presented for 241 countries. Most high performers are high-income countries. Per capita income is shown to be positively correlated with the ESI, but countries with low income and high ESI exist. |
| Osberg and Sharpe (2002) | CI | Index of Economic Well-Being | 15 | 1971-1999 | This study proposes an index assessing economic sustainability. Some indicators also touch on social aspects, e.g., Gini coefficient and risk of unemployment. 15 indicators build four top-level indices that are integrated into an overall index. The Index is shown to have increased less than GDP per capita in a sample of six OECD countries. |
| Sutton (2003) | F | Night Light Energy ESI | 2 | n.a. | This study calculates a sustainability index based on Nighttime Satellite Imagery. It uses light energy emitted as a proxy for environmental impact and relates it to value of ecosystem services. Madagascar, Mongolia, and several island nations are most sustainable. Correlation with the EF, but not with the ESI is pointed out. |
| SOPAC (2003) | CI | Environmental Vulnerability Index | 50 | 1973-2005 | The EVI assesses environmental vulnerability of individual countries. Indicators are scaled according to thresholds, rating each on a 1-7 scale of environmental vulnerability. Sub-indices are provided for 5 policy-relevant areas, namely climate change, exposure to natural disasters, biodiversity, desertification, water, agriculture/fisheries, and human health aspects. |
| Stiglitz, Sen and Fitoussi (2009) | NIB | not named | 28 | n.a. | This report proposes a separate assessment of current well-being and sustainability. To assess economic sustainability, it advocates for a monetary approach close to ANS, adjusted by depletion indicators, where reliable valuation methods exist. Separately, environmental sustainability should be assessed with the help of physical indicators, such as the Carbon Footprint. |
| Hertwich & Peters (2009) | F | Carbon Footprint | 1 | 1970-today | This study offers one of the first cross-country comparisons of the Carbon Footprint, assessing the amount of GHG emissions associated with consumption of goods and services. It allows for comparisons across space and across sectors. The authors do not claim to have offered an overall assessment of sustainability. |
| Shmelev & Rodríguez-Labajos (2009) | MCDA | NAIADE | 3 (16) | 1960-2003 | This study offers a dynamic alternative to composite measurement indices. Criteria are selected according to policy agendas and theoretical considerations. Short-, medium-, and long-term analyses are carried out for the case of Austria, along weak and strong sustainability criteria. Indicators are not integrated into a composite index, but years are ranked according to their overall performance relative to other years. |
| Lawn & Clarke (2010) | NA | GPI | 18 | 1967-2006 | This paper recalculates and applies the GPI for seven Asian-Pacific countries. It provides support for the threshold hypothesis, but argues that development late-comers, the point where GPI diverges from GDP is earlier. |
| Mascarenhas et al. (2010) | NIB | Algarve regional SDI | 20 | n.a. | This study proposes a dashboard for regional sustainability assessment in the Algarve, Portugal. It addresses weighting issues of other indices by selecting indicators based on questionnaires with local stakeholders. |
| Mirshojaeian Hosseini & Kaneko (2011) | CI | not named | 29 | 2000-2007 | This study measures and ranks sustainability for 133 countries. Using Principal Components Analysis, indicators are grouped into 4 pillars: institutional, economic, social, and environmental. Both for individual countries and regions, trends of overall sustainability and for each pillar are presented, showing similar behaviour for the first three, and diverging trends for environmental sustainability. |
| Arrow et al. (2010) | NA | not named | 21 | 1995-2000 | This study measures sustainability in 5 countries by assessing changes in comprehensive wealth, meaning an economic valuation of natural, human, reproducible, and as an extension health capital, while deducting capital gains on oil and carbon damages. If comprehensive wealth grows, a country's development is deemed sustainable, as is the case for US, China, India, and Brazil. For all these countries, net depletion of natural capital is overcompensated by gains in human or reproducible capital. |
| UN (2014) | NA | SEEA | n.a. | n.a. | In this document, the UN introduces a statistical standard for environmental accounting. The accounts include environmental flows, environmental assets stocks and economic activity. Some aggregate measures are included, such as depletion-adjusted net saving, or depletion-adjusted net domestic product. |
| Mori et al. (2015) | NIB | City Sustainability Index | 12 | 2015 | This study proposes a sustainability assessment of cities, able to measure both economic, social, and environmental sustainability and leakage effects to other cities. It uses constraint indicators, for which a city must be above a certain threshold, and maximization indicators, that are either positive or negative contributors. To maintain strong sustainability criteria, it does not aggregate. The index is applied to 12 megacities. |
| Shmelev (2017) | F | APIS | 3 | 1995-2011 | This chapter assesses the sustainability performance of 7 countries. By testing varying weights, it allows for assessment from the viewpoint of different policy priorities, focused on the economy, environment, or the social dimension. Developments in Germany, France and the UK are shown to be positive regardless of priorities, while trends in China, Russia, Brazil, and the US are less clear. |
| OECD (2017) | NIB | How's Life indicator set | 32 | 2005-2017 | This indicator set assesses current well-being and sustainability separately. For current well-being, countries are scored on each measure. The sustainability assessment focuses on changes in natural, human, economic and social capital stocks. No integrated index is produced, but trends in each stock are compared internationally. |
| Stiglitz, Fitoussi and Durand (2018) | NIB | How's Life indicator set | 32 | n.a. | This report advocates for a dashboard based on OECD (2017), and advocates broadly for a further-reaching approach to measure current and future wellbeing beyond GDP. Acknowledging the SDGs as an attempt at such an approach, it argues for a need for prioritization. It advocates for better measures for sustainability, including all three dimensions - social, economic, environmental. |
| UNDP (2022) | CI | HDI | 4 | 1990-2022 | The HDI offers an integrated index of human development. It is not explicitly a sustainability index, but it can be adjusted to include planetary pressures or poverty. These adjusted HDIs then show whether a country's performance improves or worsens with the inclusion of additional dimensions. Adjustments for planetary pressures include CO2 emissions and material footprint. It has been published since 1975, but due to changes in methodology, only data since 1990 is comparable. |
| Wolf et al. (2022) | CI | EPI | 40 | 2002-today | The EPI offers a large dashboard, integrated into a single index assessing environmental sustainability. Most high performers are high-income countries. Weights are chosen according to policy objectives |
| Li et al. (2022) | NA/F | ES and GEE | 21 | 2000-2018 | This study assesses economic sustainability through the GPI's share of GDP and ecological efficiency through GPI's share of the Environmental Footprint. Its study area is the Yangtze River Delta in China. It shows positive trends for ecological efficiency, and a negative trend for economic sustainability. |
| EC (2022) | NIB | EU SDG indicator set | 101 | 2017-2022 | This report uses 17 SDGs comprised of 101 indicators to assess sustainable development in the EU. EU-wide trends are shown for each SDG. Performance criteria are not integrated into a composite index, but interlinkages between SDGs are discussed. For each SDG, a policy context is provided, showing what is already being done towards achieving the goal. |
| Sachs et al. (2022) | CI | SDG Index | 120 | 2010-today | The report assesses progress across the 17 SDGs which are equally weighted and aggregated into a composite index. High-income countries, especially in Scandinavia are high performers, while low-income countries tend to score lower. The report shows trends and challenges for each SDG and associated indicators in each country. |
Abbreviations: NA = based on national accounting; CI = composite index; F = footprint; NIB = non-integrated basket; n.a. = not applicable.
References
- Akram, T. The Japanese Economy: Stagnation, Recovery, and Challenges. J. Econ. Issues 2019, 53, 403–410. [Google Scholar] [CrossRef]
- Alestalo, M., Hort, S.E. and Kuhnle, S. (2009) ‘The Nordic model: Conditions, origins, outcomes, lessons’. Available online: https://edoc.vifapol.de/opus/volltexte/2013/4255/pdf/41.pdf (accessed on 19 October 2023).
- Alvaredo, F.; et al. (2018) World Inequality Report 2018. Harvard University Press.
- Arrow, K.J.; et al. (2012) ‘Sustainability and the measurement of wealth’, Environment and Development Economics, 17(3), pp. 317–353. [CrossRef]
- Atalay, S.; Solmazer, G. The Relationship Between Cultural Value Orientations and the Changes in Mobility During the Covid-19 Pandemic: A National-Level Analysis. Front. Psychol. 2021, 12, 578190. [Google Scholar] [CrossRef]
- Axsen, J.; Kurani, K.S. Developing sustainability-oriented values: Insights from households in a trial of plug-in hybrid electric vehicles. Glob. Environ. Chang. 2013, 23, 70–80. [Google Scholar] [CrossRef]
- Ayres, R. U. (1998). Turning point: An end to the growth paradigm. St. Martin’s.
- Ayres, R. U. (2014). The bubble economy: Is sustainable growth possible? The MIT Press.
- Ayres, R. U. , & Warr, B. (2009). The economic growth engine: How energy and work drive material prosperity. E. Elgar.
- Bittencourt, M. Democracy, populism and hyperinflation: some evidence from Latin America. Econ. Gov. 2012, 13, 311–332. [Google Scholar] [CrossRef]
- Bjørsted, E.; et al. (2021) Fra kriseår til velfærdssamfund - et portræt af lønmodtagernes vilkår gennem 85 år. AE – Arbejderbevægelsens Erhvervsråd. Available online: https://www.ae.dk/files/media/document/ae_jubil%C3%A6um_web_med%20fotos%20uden%20ophavsret.pdf (accessed on 22 October 2023).
- Blömer, M.J.; Dolls, M.; Fuest, C.; Löffler, M.; Peichl, A. German Public Finances through the Financial Crisis. Fisc. Stud. 2015, 36, 453–474. [Google Scholar] [CrossRef]
- Borensztein, E. and Ostry, J. (1996) ‘Accounting for China’s Growth Performance’, American Economic Review, 86(2), pp. 224–28.
- Brandal, N., Bratberg, Ø. and Thorsen, D.E. (2013) ‘Introduction’, in N. Brandal, Ø. Bratberg, and D.E. Thorsen (eds) The Nordic Model of Social Democracy. London: Palgrave Macmillan UK, pp. 1–15. [CrossRef]
- Broadbent, J. (1999) Environmental Politics in Japan: Networks of Power and Protest. Cambridge University Press.
- Caspersen, S. (2023) Den gyldne procent af danskerne sidder på mere end ni procent af de samlede indkomster for første gang i årtier. Economic Council of the Labour Movement. Available online: https://www.ae.dk/node/3280/pdf-export (accessed on 6 September 2023).
- Cha, J.M.; Farrell, C.; Stevis, D. Climate and Environmental Justice Policies in the First Year of the Biden Administration. Publius 2022, 52, 408–427. [Google Scholar] [CrossRef]
- Chow, G.C. Capital Formation and Economic Growth in China. Q. J. Econ. 1993, 108, 809–842. [Google Scholar] [CrossRef]
- Cobb, C., Odman, G.S.G. and Wackernagel, M. (1999) ‘Why bigger isn’t better: The Genuine Progress Indicator: 1999 Update’.
- Daly, H. E. (1991). Steady-state economics (2nd ed., with new essays). Island Press.
- Daly, H. E. (2000). Beyond growth: The economics of sustainable development (Nachdr.). Beacon Press.
- Daly, H. E., Cobb, J. B., & Cobb, C. W. (1994). For the common good: Redirecting the economy toward community, the environment, and a sustainable future (2nd ed., updated and expanded). Beacon Press.
- Dietz, S. and Neumayer, E. (2006) ‘A Critical Appraisal of Genuine Savings as an Indicator of Sustainability’, in Lawn, P., Sustainable Development Indicators in Ecological Economics. Edward Elgar Publishing, p. 3641. Available online. [CrossRef]
- Dietz, S.; Neumayer, E. Weak and strong sustainability in the SEEA: Concepts and measurement. Ecol. Econ. 2007, 61, 617–626. [Google Scholar] [CrossRef]
- Duan, C.; Zhu, W.; Wang, S.; Chen, B. Drivers of global carbon emissions 1990–2014. J. Clean. Prod. 2022, 371. [Google Scholar] [CrossRef]
- Edvinsson, R.; Eriksson, K.; Ingman, G. A real estate price index for Stockholm, Sweden 1818–2018: putting the last decades housing price boom in a historical perspective. Scand. Econ. Hist. Rev. 2021, 69, 83–101. [Google Scholar] [CrossRef]
- Englund, P.; (2015) ‘The Swedish 1990s banking crisis A revisit in the light of recent experience’. Sveriges Riksbank. Available online: https://ypfs.som.yale.edu/node/16953 (accessed on 19 October 2023).
- Esty, D.C., Granoff, I.M.E. and Ruth, B. (2002) 2002 Environmental Sustainability Index. Yale Center for Environmental Law and Policy (YCELP).
- European Commission (EC). Statistical Office of the European Union. (2022) Sustainable development in the European Union: overview of progress towards the SDGs in an EU context : 2022 edition. LU: Publications Office. Available online: https://data.europa.eu/doi/10.2785/76551 (accessed on 20 February 2023).
- Feng, S., Hu, Y. and Moffitt, R. (2015) Long Run Trends in Unemployment and Labor Force Participation in China. w21460. Cambridge, MA: National Bureau of Economic Research, p. w21460. Available online. [CrossRef]
- Freeman, T.; Gesesew, H.A.; Bambra, C.; Giugliani, E.R.J.; Popay, J.; Sanders, D.; Macinko, J.; Musolino, C.; Baum, F. Why do some countries do better or worse in life expectancy relative to income? An analysis of Brazil, Ethiopia, and the United States of America. Int. J. Equity Heal. 2020, 19, 1–19. [Google Scholar] [CrossRef] [PubMed]
- de Freitas, L.C.; Kaneko, S. Decomposition of CO 2 emissions change from energy consumption in Brazil: Challenges and policy implications. Energy Policy 2011, 39, 1495–1504. [Google Scholar] [CrossRef]
- Giljum, S., Hammer, M., Stocker, A., Lackner, M., Best, A. Blobel, D., Ingwersen, W., Naumann S., Neubauer, A. Simmons, C., Lewis, K., Shmelev, S. (2007), Scientific assessment and evaluation of the indicator “Ecological Footprint”, Dessau-Roßlau, Germany: German Federal Environment Agency.
- Hamilton, K. (2000) Genuine Saving as a Sustainability Indicator. Washington, DC: World Bank. Available at: https://doi.org/10/1570695/genuine-saving-sustainability-indicator.
- Hartwick, J.M. Natural resources, national accounting and economic depreciation. J. Public Econ. 1990, 43, 291–304. [Google Scholar] [CrossRef]
- Heidenblad, D.L. Mapping a New History of the Ecological Turn: The Circulation of Environmental Knowledge in Sweden 1967. Environ. Hist. 2018, 24, 265–284. [Google Scholar] [CrossRef]
- Heilemann, U. Rezessionen in der Bundesrepublik Deutschland von 1966 bis 2013. Wirtschaftsdienst 2019, 99, 546–552. [Google Scholar] [CrossRef]
- Hellwig, M.; Neumann, M.J.M.; Vaubel, R.; Miller, M. Economic Policy in Germany: Was There a Turnaround? Econ. Policy 1987, 2, 103. [Google Scholar] [CrossRef]
- Hertwich, E.G.; Peters, G.P. Carbon Footprint of Nations: A Global, Trade-Linked Analysis. Environ. Sci. Technol. 2009, 43, 6414–6420. [Google Scholar] [CrossRef]
- Jackson, T. Prosperity without Growth: Economics for a Finite Planet; Earthscan: London, UK, 2009. [Google Scholar]
- Jain-Chandra, S.; Khor, N.; Mano, R.; Schauer, J.; Wingender, P.; Zhuang, J. Inequality in China – Trends, Drivers and Policy Remedies. IMF Work. Pap. 2018, 18. [Google Scholar] [CrossRef]
- Jensen, P.K., Jens Stissing (2017) ‘Struggles in Denmark’s transition towards a low carbon future: Shifts in the energy technology assemblage’, in Handbook of Transitions to Energy and Climate Security. Routledge.
- Jonung, L. (2009) ‘The Swedish model for resolving the banking crisis of 1991-93. Seven reasons why it was successful’, Directorate General Economic and Monetary Affairs, European Commission, European Economy - Economic Papers [Preprint].
- Jonung, L. and Hagberg, T. (2005) How Costly was the Crisis of the 1990s? A Comparative Analysis of the deepest Crises in Finland and Sweden over the last 130 Years. European Commission (European Economy - Economic papers).
- Kenny, J. Economic conditions and support for the prioritisation of environmental protection during the Great Recession. Environ. Politi- 2019, 29, 937–958. [Google Scholar] [CrossRef]
- Khan, M.H. (2007) ‘Governance, Economic Growth and Development since the 1960s’.
- Kiander, J.; Vartia, P. Lessons from the crisis in Finland and Sweden in the 1990s. Empirica 2011, 38, 53–69. [Google Scholar] [CrossRef]
- Kraft, M.E. (2000) ‘U.S. Environmental Policy and Politics: From the 1960s to the 1990s’.
- Krugman, P.R.; Dominquez, K.M.; Rogoff, K. It's Baaack: Japan's Slump and the Return of the Liquidity Trap. Brookings Pap. Econ. Act. 1998, 1998, 137. [Google Scholar] [CrossRef]
- Kutzschbach, J.; Tanikulova, P.; Lueg, R. The Role of Top Managers in Implementing Corporate Sustainability—A Systematic Literature Review on Small and Medium-Sized Enterprises. Adm. Sci. 2021, 11, 44. [Google Scholar] [CrossRef]
- Lawn, P.; Clarke, M. The end of economic growth? A contracting threshold hypothesis. Ecol. Econ. 2010, 69, 2213–2223. [Google Scholar] [CrossRef]
- Lenzen, M.; Pade, L.-L.; Munksgaard, J. CO2Multipliers in Multi-region Input-Output Models. Econ. Syst. Res. 2004, 16, 391–412. [Google Scholar] [CrossRef]
- Li, Y.; Qiao, J.; Xie, L.; Huang, L.; Su, Y.; Zhou, M.; Wang, K.; Zhang, J.; He, S.; Huang, L. Assessing economic sustainability and ecological efficiency with genuine progress indicator: a case study of the Yangtze River Delta from 2000 to 2018. Environ. Sci. Pollut. Res. 2022, 29, 46751–46766. [Google Scholar] [CrossRef] [PubMed]
- Lindmark, M.; Thu, H.N.; Stage, J. Weak support for weak sustainability: Genuine savings and long-term wellbeing in Sweden, 1850–2000. Ecol. Econ. 2018, 145, 339–345. [Google Scholar] [CrossRef]
- Loh, J.; et al. (1998) Living Planet Report 1998. WWF International, New Economics Foundation, World Conservation Monitoring Centre. Available online: https://wwfint.awsassets.panda.org/downloads/livingplanetreport98.pdf (accessed on 8 February 2023).
- LoMonaco-Benzing, R.; Ha-Brookshire, J. Sustainability as Social Contract: Textile and Apparel Professionals’ Value Conflicts within the Corporate Moral Responsibility Spectrum. Sustainability 2016, 8, 1278. [Google Scholar] [CrossRef]
- Madsen, P.K. (1999) Denmark: Flexibility, security and labour market success. International Labour Organisation.
- Mascarenhas, A.; Coelho, P.; Subtil, E.; Ramos, T.B. The role of common local indicators in regional sustainability assessment. Ecol. Indic. 2010, 10, 646–656. [Google Scholar] [CrossRef]
- McGrath, L.; Hynes, S.; McHale, J. Augmenting the World Bank's estimates: Ireland's genuine savings through boom and bust. Ecol. Econ. 2019, 165. [Google Scholar] [CrossRef]
- McKinnon, R.; Ohno, K. The Foreign Exchange Origins of Japan's Economic Slump and Low Interest Liquidity Trap. World Econ. 2001, 24, 279–315. [Google Scholar] [CrossRef]
- Menezes-Filho, N. and Scorzafave, L. (2009) ‘Employment and Inequality of Outcomes in Brazil’.
- Michelson, S. (2016) ‘Inequality in Denmark through the Looking Glass’.
- Hosseini, H.M.; Kaneko, S. Dynamic sustainability assessment of countries at the macro level: A principal component analysis. Ecol. Indic. 2011, 11, 811–823. [Google Scholar] [CrossRef]
- Møller Christensen, A. and Topp, J. (1997) ‘MONETARY POLICY IN THE NORDIC COUNTRIES: EXPERIENCES SINCE 1992’, in. (BIS Policy Papers No. 2). Available online: https://www.bis.org/publ/plcy02.pdf#page=6 (accessed on 12 July 2023).
- Mori, K.; Fujii, T.; Yamashita, T.; Mimura, Y.; Uchiyama, Y.; Hayashi, K. Visualization of a City Sustainability Index (CSI): Towards Transdisciplinary Approaches Involving Multiple Stakeholders. Sustainability 2015, 7, 12402–12424. [Google Scholar] [CrossRef]
- Moriguchi, C.; Saez, E. The Evolution of Income Concentration in Japan, 1886–2005: Evidence from Income Tax Statistics. Rev. Econ. Stat. 2008, 90, 713–734. [Google Scholar] [CrossRef]
- Naughton, B. (1989) ‘Inflation and Economic Reform in China’, Current History, 88(539), pp. 269–291.
- Nordhaus, W. and Tobin, J. (1972) Is Growth Obsolete? NBER Chapters. National Bureau of Economic Research, Inc, pp. 1–80. Available online: https://econpapers.repec.org/bookchap/nbrnberch/7620.htm (accessed on 8 February 2023).
- OECD (2017) How’s Life? 2017: Measuring Well-being. Paris: Organisation for Economic Co-operation and Development. Available online: https://www.oecd-ilibrary.org/economics/how-s-life-2017_how_life-2017-en (accessed on 8 February 2023).
- OECD. (2011). How’s Life?: Measuring Well-being. OECD. [CrossRef]
- Osberg, L.; Sharpe, A. An Index of Economic Well–Being for Selected OECD Countries. Rev. Income Wealth 2002, 48, 291–316. [Google Scholar] [CrossRef]
- Pearce, D.W.; Atkinson, G.D. Capital theory and the measurement of sustainable development: an indicator of “weak” sustainability. Ecol. Econ. 1993, 8, 103–108. [Google Scholar] [CrossRef]
- Piketty, T.; Saez, E. Inequality in the long run. Science 2014, 344, 838–843. [Google Scholar] [CrossRef]
- Prescott-Allen, R. (2001) The wellbeing of nations : a country-by-country index of quality of life and the environment. Available online: https://portals.iucn.org/library/node/7942 (accessed on 8 February 2023).
- Qian, Y. (2002) ‘How Reform Worked in China’. Rochester, NY. Available online. [CrossRef]
- Räth, N. (2009) ‘Rezessionen in historischer Betrachtung’, Wirtschaft und Statistik, (3), p. 203.
- Renaud, B. (1997) ‘The 1985 to 1994 Global Real Estate Cycle: An Overview’, Journal of Real Estate Literature, 5(1), pp. 13–44.
- Renn, O. and Marshall, J.P. (2016) ‘Coal, nuclear and renewable energy policies in Germany: From the 1950s to the “Energiewende”’, Energy Policy, 99(C), pp. 224–232.
- Rickaby, M.A.; Glass, J.; Fernie, S. Conceptualizing the Relationship between Personal Values and Sustainability—A TMO Case Study. Adm. Sci. 2020, 10, 15. [Google Scholar] [CrossRef]
- Riskin, C. (2014) ‘Inequality and the reform era in China’, in S. Fan et al. (eds) The Oxford Companion to the Economics of China. Oxford University Press, p. 0. Available online. [CrossRef]
- Rome, A. "Give Earth a Chance": The Environmental Movement and the Sixties. J. Am. Hist. 2003, 90, 525–554. [Google Scholar] [CrossRef]
- Roy, B. Multicriteria Methodology for Decision Aiding; Springer: New York, NY, USA, 1996. [Google Scholar]
- Sachs, J.D.; Kroll, C.; Lafortune, G.; Fuller, G.; Woelm, F. Sustainable Development Report 2022. 1st edn. Cambridge University Press; 2022. [CrossRef]
- Samuels, D. Fiscal Straitjacket: The Politics of Macroeconomic Reform in Brazil, 1995–2002. J. Lat. Am. Stud. 2003, 35, 545–569. [Google Scholar] [CrossRef]
- Sarid, A.; Goldman, D. A Value-Based Framework Connecting Environmental Citizenship and Change Agents for Sustainability—Implications for Education for Environmental Citizenship. Sustainability 2021, 13, 4338. [Google Scholar] [CrossRef]
- Shmelev, S. (2017) ‘Multidimensional Assessment of Sustainability: Harmony vs. the Turning Point’, in S. Shmelev (ed.) Green Economy Reader: Lectures in Ecological Economics and Sustainability. Cham: Springer International Publishing (Studies in Ecological Economics), pp. 67–98. Available online. [CrossRef]
- Shmelev, S.; Brook, H.R. Macro Sustainability across Countries: Key Sector Environmentally Extended Input-Output Analysis. Sustainability 2021, 13, 11657. [Google Scholar] [CrossRef]
- Shmelev, S. (Ed.). (2019). Sustainable cities reimagined: Multidimensional assessment and smart solutions (First Edition). Routledge, Taylor & Francis Group.
- Shmelev, S.E.; Shmeleva, I.A. Global urban sustainability assessment: A multidimensional approach. Sustain. Dev. 2018, 26, 904–920. [Google Scholar] [CrossRef]
- Shmelev, S.E.; Shmeleva, I.A. Multidimensional sustainability benchmarking for smart megacities. Cities 2019, 92, 134–163. [Google Scholar] [CrossRef]
- Shmelev, S.E.; Lefievre, N.; Saadi, N.; Shmeleva, I.A. Interdisciplinary Linkages among Sustainability Dimensions in the Context of European Cities and Regions Research. Sustainability 2023, 15, 14738. [Google Scholar] [CrossRef]
- Shmelev, S.E.; Shmeleva, I.A. Smart and sustainable benchmarking of cities and regions in Europe: The application of multicriteria assessment. Cities 2025, 156. [Google Scholar] [CrossRef]
- Shmelev, S.E.; Rodríguez-Labajos, B. Dynamic multidimensional assessment of sustainability at the macro level: The case of Austria. Ecol. Econ. 2009, 68, 2560–2573. [Google Scholar] [CrossRef]
- Shmelev, S.E.; Speck, S.U. Green fiscal reform in Sweden: Econometric assessment of the carbon and energy taxation scheme. Renew. Sustain. Energy Rev. 2018, 90, 969–981. [Google Scholar] [CrossRef]
- South Pacific Applied Geoscience Commission (SOPAC) (2005) Building resilience in SIDS : the environmental vulnerability index. SOPAC. Available online: https://library.sprep.org/content/building-resilience-sids-environmental-vulnerability-index (accessed on 8 February 2023).
- Sovacool, B.K. Energy policymaking in Denmark: Implications for global energy security and sustainability. Energy Policy 2013, 61, 829–839. [Google Scholar] [CrossRef]
- Steigum, E. (2010) ‘The Norwegian Banking Crisis in the 1990s: Effects and Lessons’.
- Stiglitz, J., Sen, A. and Fitoussi, J. (2009) ‘Report of the Commission on the Measurement of Economic Performance and Social Progress (CMEPSP)’.
- Stiglitz, J.E., Fitoussi, J.-P. and Durand, M. (2018) Beyond GDP: Measuring What Counts for Economic and Social Performance. Paris: Organisation for Economic Co-operation and Development. Available online: https://www.oecd-ilibrary.org/economics/beyond-gdp_9789264307292-en (accessed on 8 February 2023).
- Sutton, P.C. An Empirical Environmental Sustainability Index Derived Solely from Nighttime Satellite Imagery and Ecosystem Service Valuation. Popul. Environ. 2003, 24, 293–311. [Google Scholar] [CrossRef]
- Thøgersen, J.; Ölander, F. Spillover of environment-friendly consumer behaviour. J. Environ. Psychol. 2003, 23, 225–236. [Google Scholar] [CrossRef]
- Tyers, R. Japanese Economic Stagnation: Causes and Global Implications*. Econ. Rec. 2012, 88, 517–536. [Google Scholar] [CrossRef]
- UNDP (2022) Human Development Report 2021-22, Human Development Reports. United Nations. Available online: https://hdr.undp.org/content/human-development-report-2021-22 (accessed on 8 February 2023).
- United Nations (UN) (ed.) (2014) System of environmental-economic accounting 2012: central framework. New York, NY: United Nations.
- UNEP. (2023). Inclusive Wealth Report 2023: Measuring Sustainability and Equity. United Nations Environment Programme. [CrossRef]
- Victor, P. A. (2008). Managing without growth: Slower by design, not disaster. Edward Elgar.
- Wackernagel, M. et al. (1997) ‘Ecological footprints of nations. How much nature do they use? How much nature do they have?’. Available online: https://www.semanticscholar.org/paper/Ecological-footprints-of-nations.-How-much-nature-Wackernagel-Onisto/dcd01a578651825184bc5072f7f50afeae645635 (accessed on 8 February 2023).
- Wang, Y.; Yao, Y. Sources of China's economic growth 1952–1999: incorporating human capital accumulation. China Econ. Rev. 2003, 14, 32–52. [Google Scholar] [CrossRef]
- Winterstein, J.; Zhu, B.; Habisch, A. How personal and social-focused values shape the purchase intention for organic food: Cross-country comparison between Thailand and Germany. J. Clean. Prod. 2023, 434, 140313. [Google Scholar] [CrossRef]
- New Haven Wolf, M.J. et al. (2022) 2022 Environmental Performance Index. New Haven, CT: Yale Center for Environmental Law and Policy (YCELP). Available online: https://epi.yale.edu/downloads/epi2022report06062022.pdf (accessed on 8 February 2023).
- World Bank. World Development Indicators | DataBank. Available online: https://databank.worldbank.org/source/world-development-indicators (accessed on 12 October 2023).
- Young, A. Gold into Base Metals: Productivity Growth in the People’s Republic of China during the Reform Period. J. Politi- Econ. 2003, 111, 1220–1261. [Google Scholar] [CrossRef]
- Yuan, X.; Zuo, J. Transition to low carbon energy policies in China—from the Five-Year Plan perspective. Energy Policy 2011, 39, 3855–3859. [Google Scholar] [CrossRef]
- Zang, W.; Baimbridge, M. Exports, imports and economic growth in South Korea and Japan: a tale of two economies. Appl. Econ. 2011, 44, 361–372. [Google Scholar] [CrossRef]
- Zheng, J.; Mi, Z.; Coffman, D.; Shan, Y.; Guan, D.; Wang, S. The Slowdown in China’s Carbon Emissions Growth in the New Phase of Economic Development. One Earth 2019, 1, 240–253. [Google Scholar] [CrossRef]
Figure 1.
Sustainability Assessment Methodology.
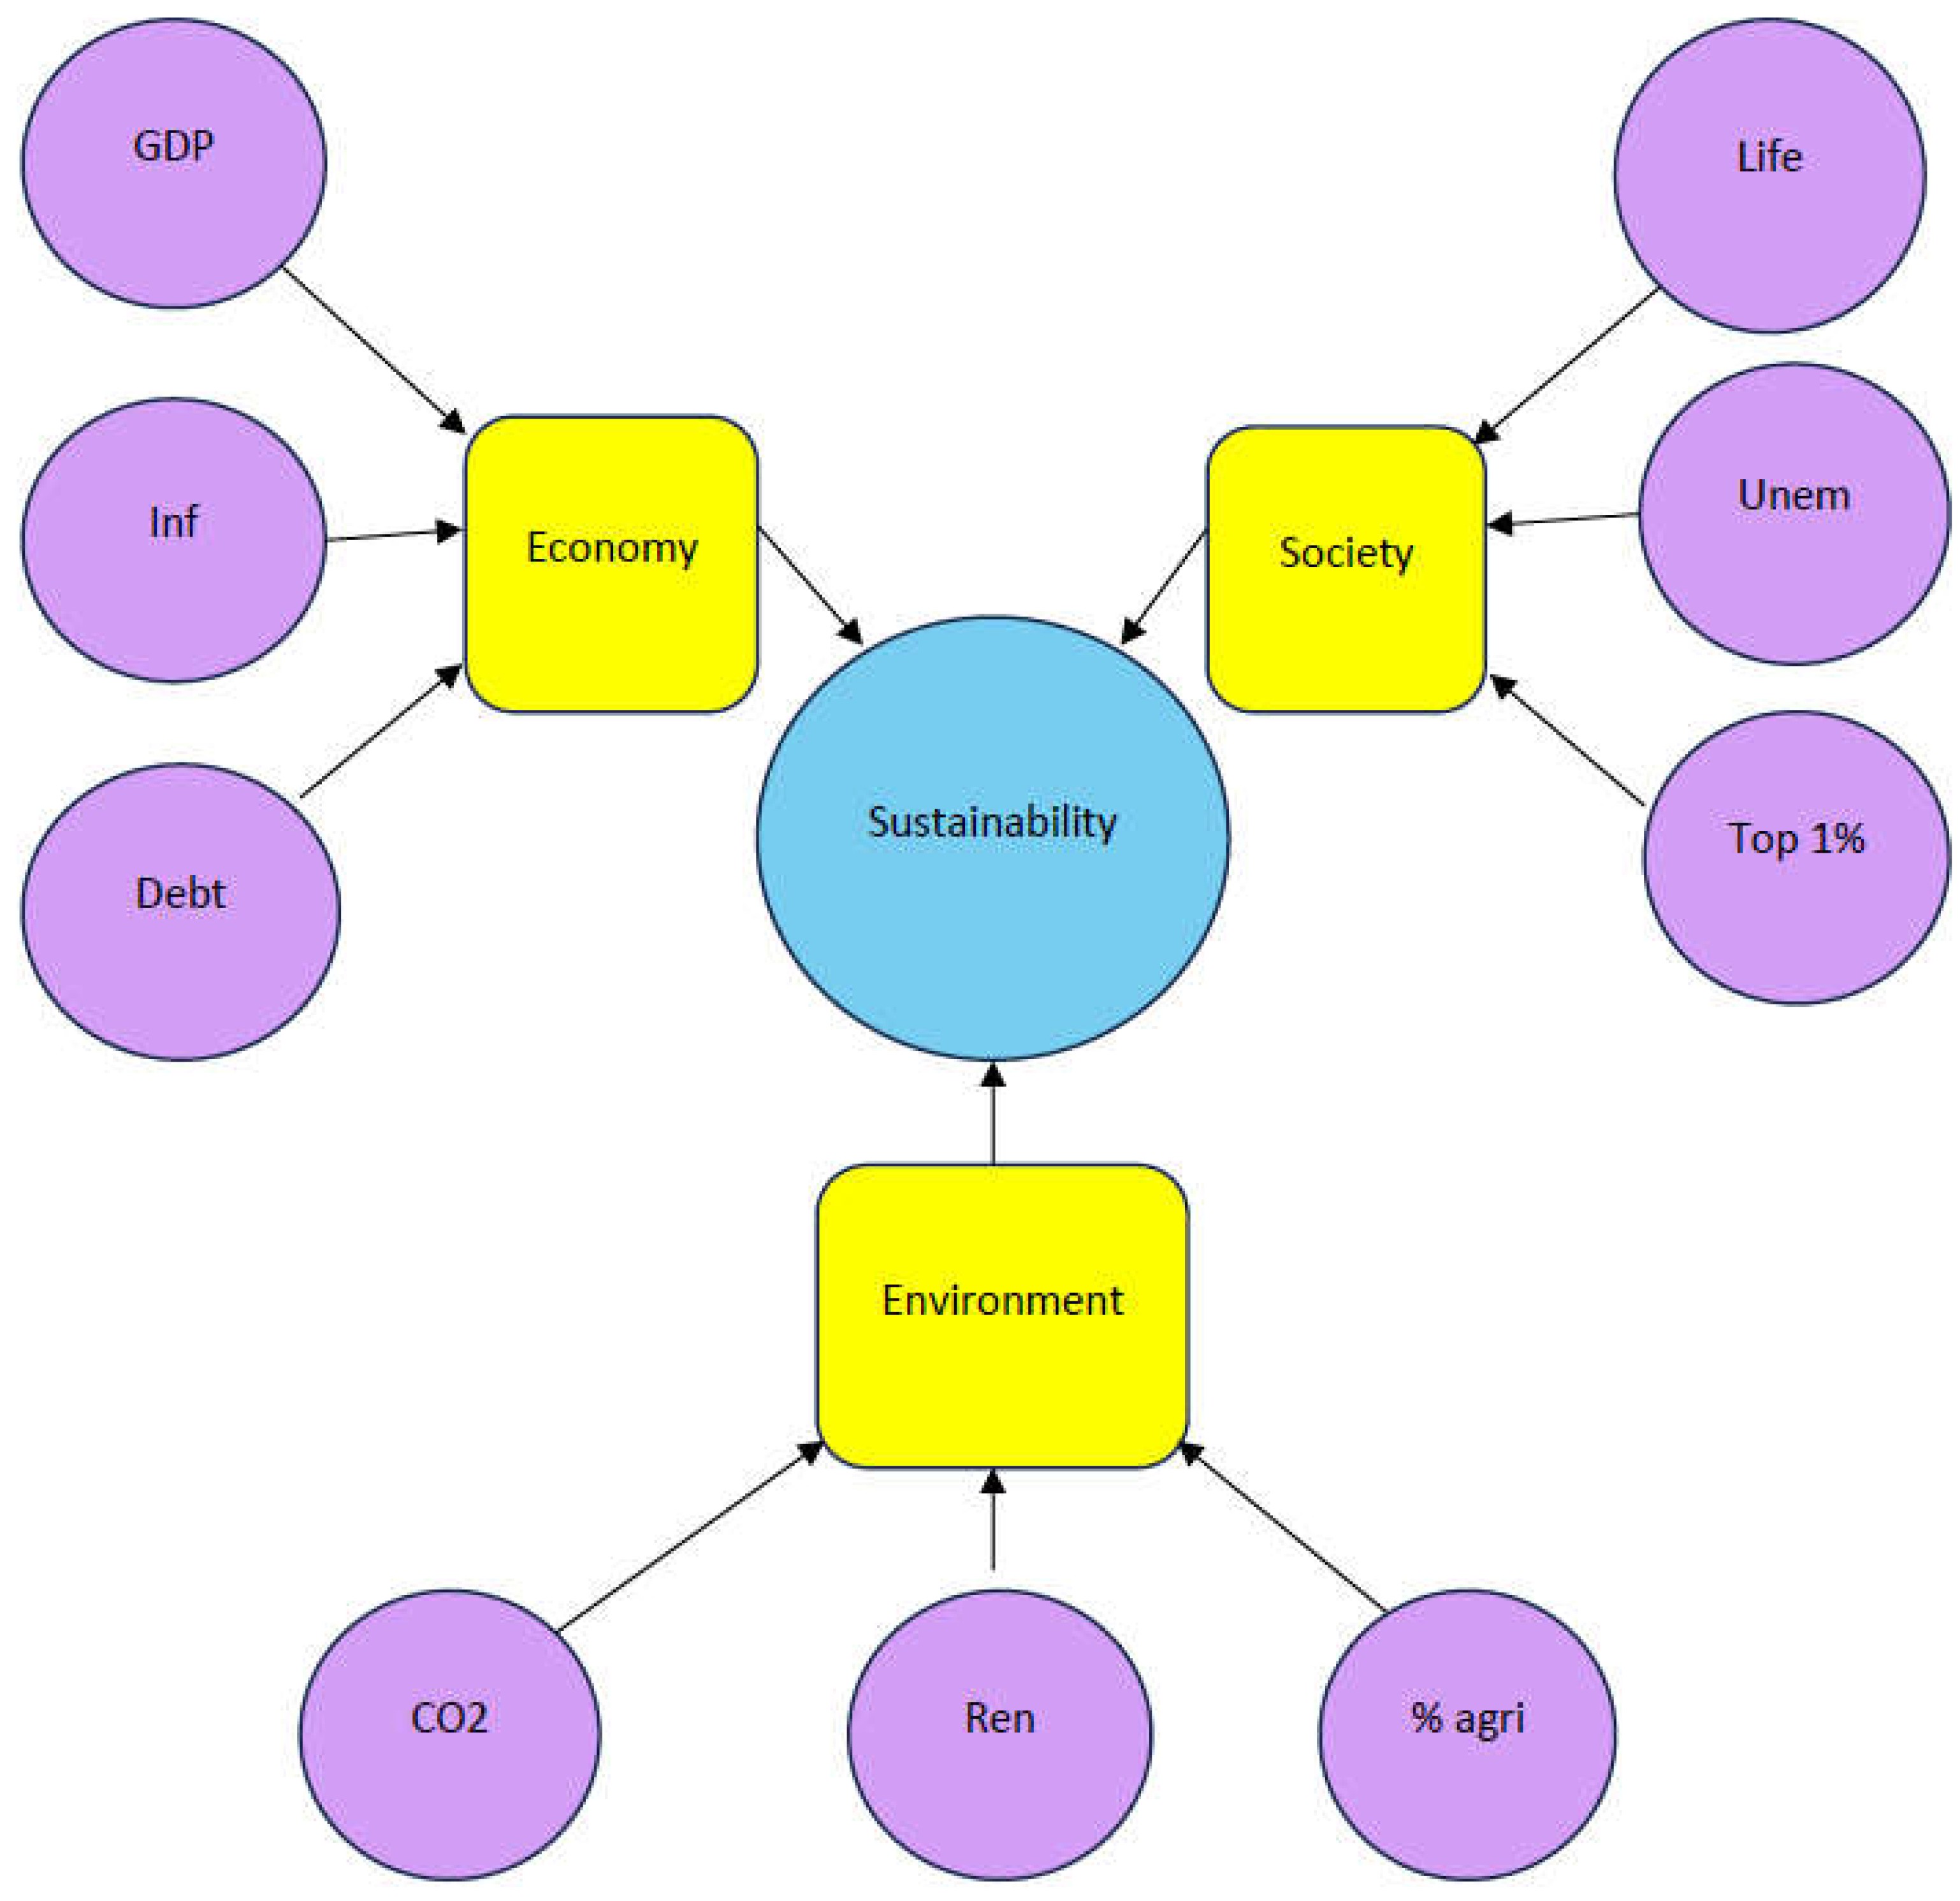
Figure 2.
Integrated Sustainability Performance Index: Equal weights. Source: authors’ calculations.
Figure 2.
Integrated Sustainability Performance Index: Equal weights. Source: authors’ calculations.
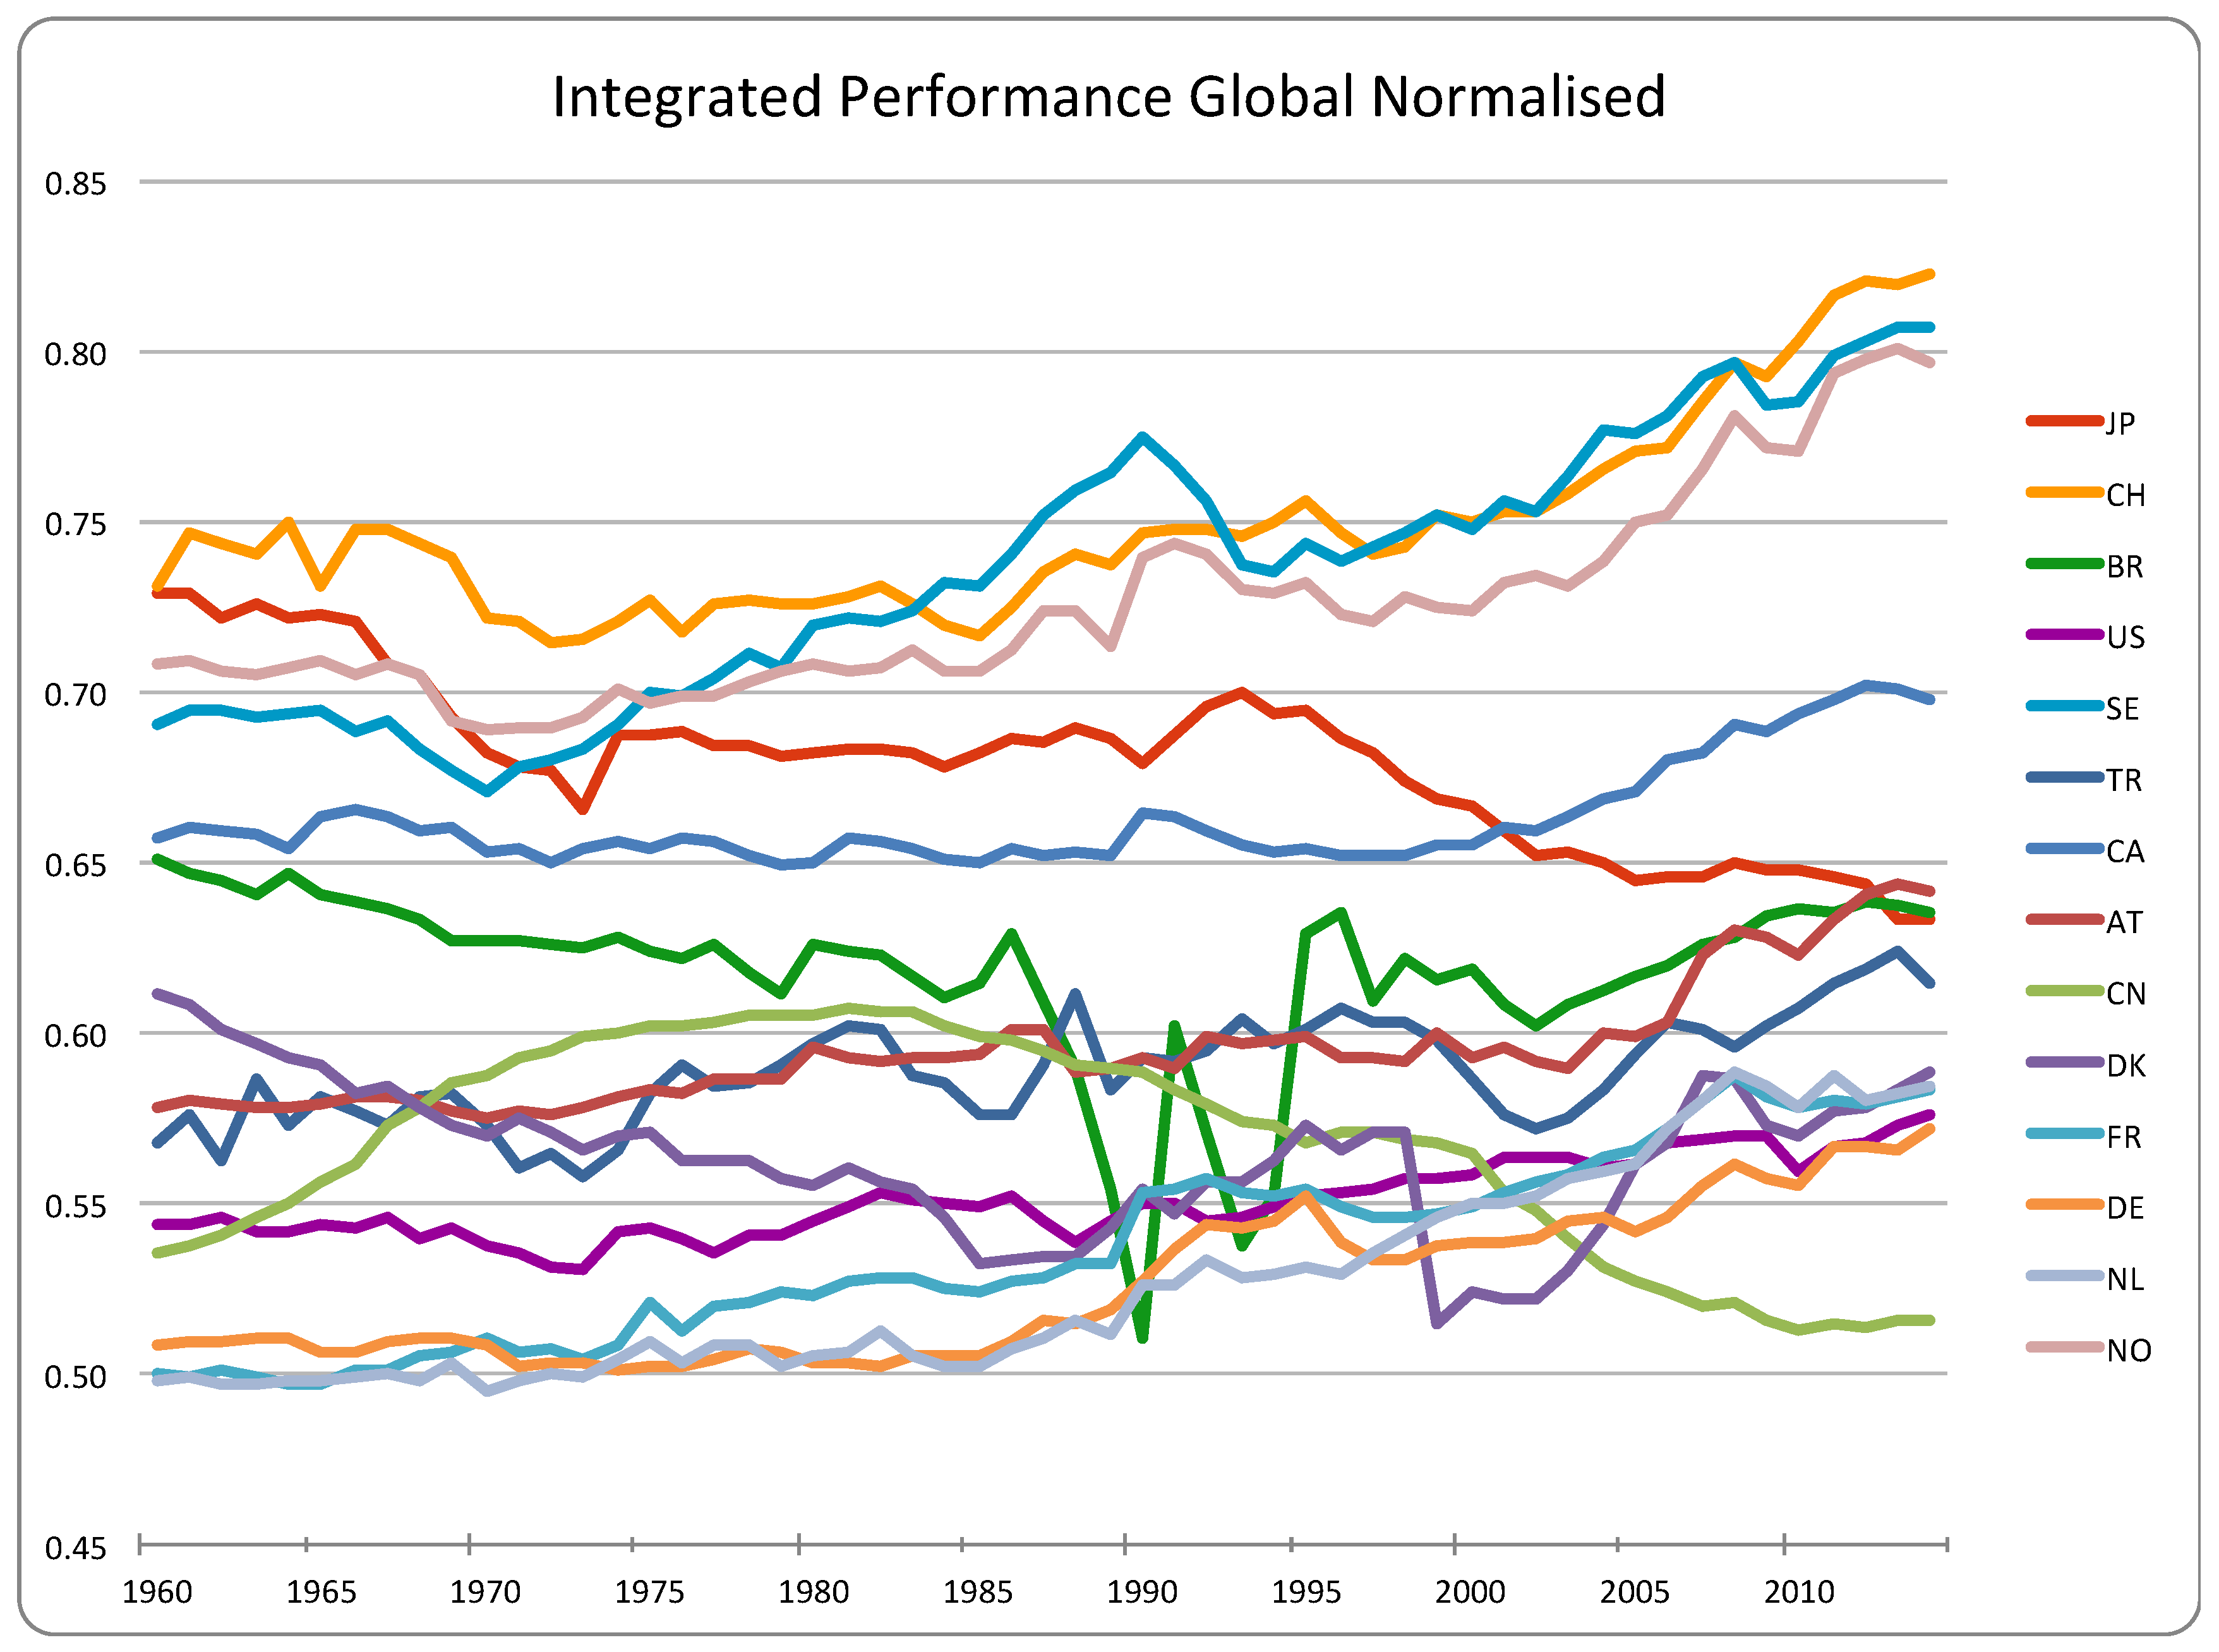
Figure 3.
Integrated Sustainability Performance Index: Economic Priorities. Source: authors’ calculations.
Figure 3.
Integrated Sustainability Performance Index: Economic Priorities. Source: authors’ calculations.
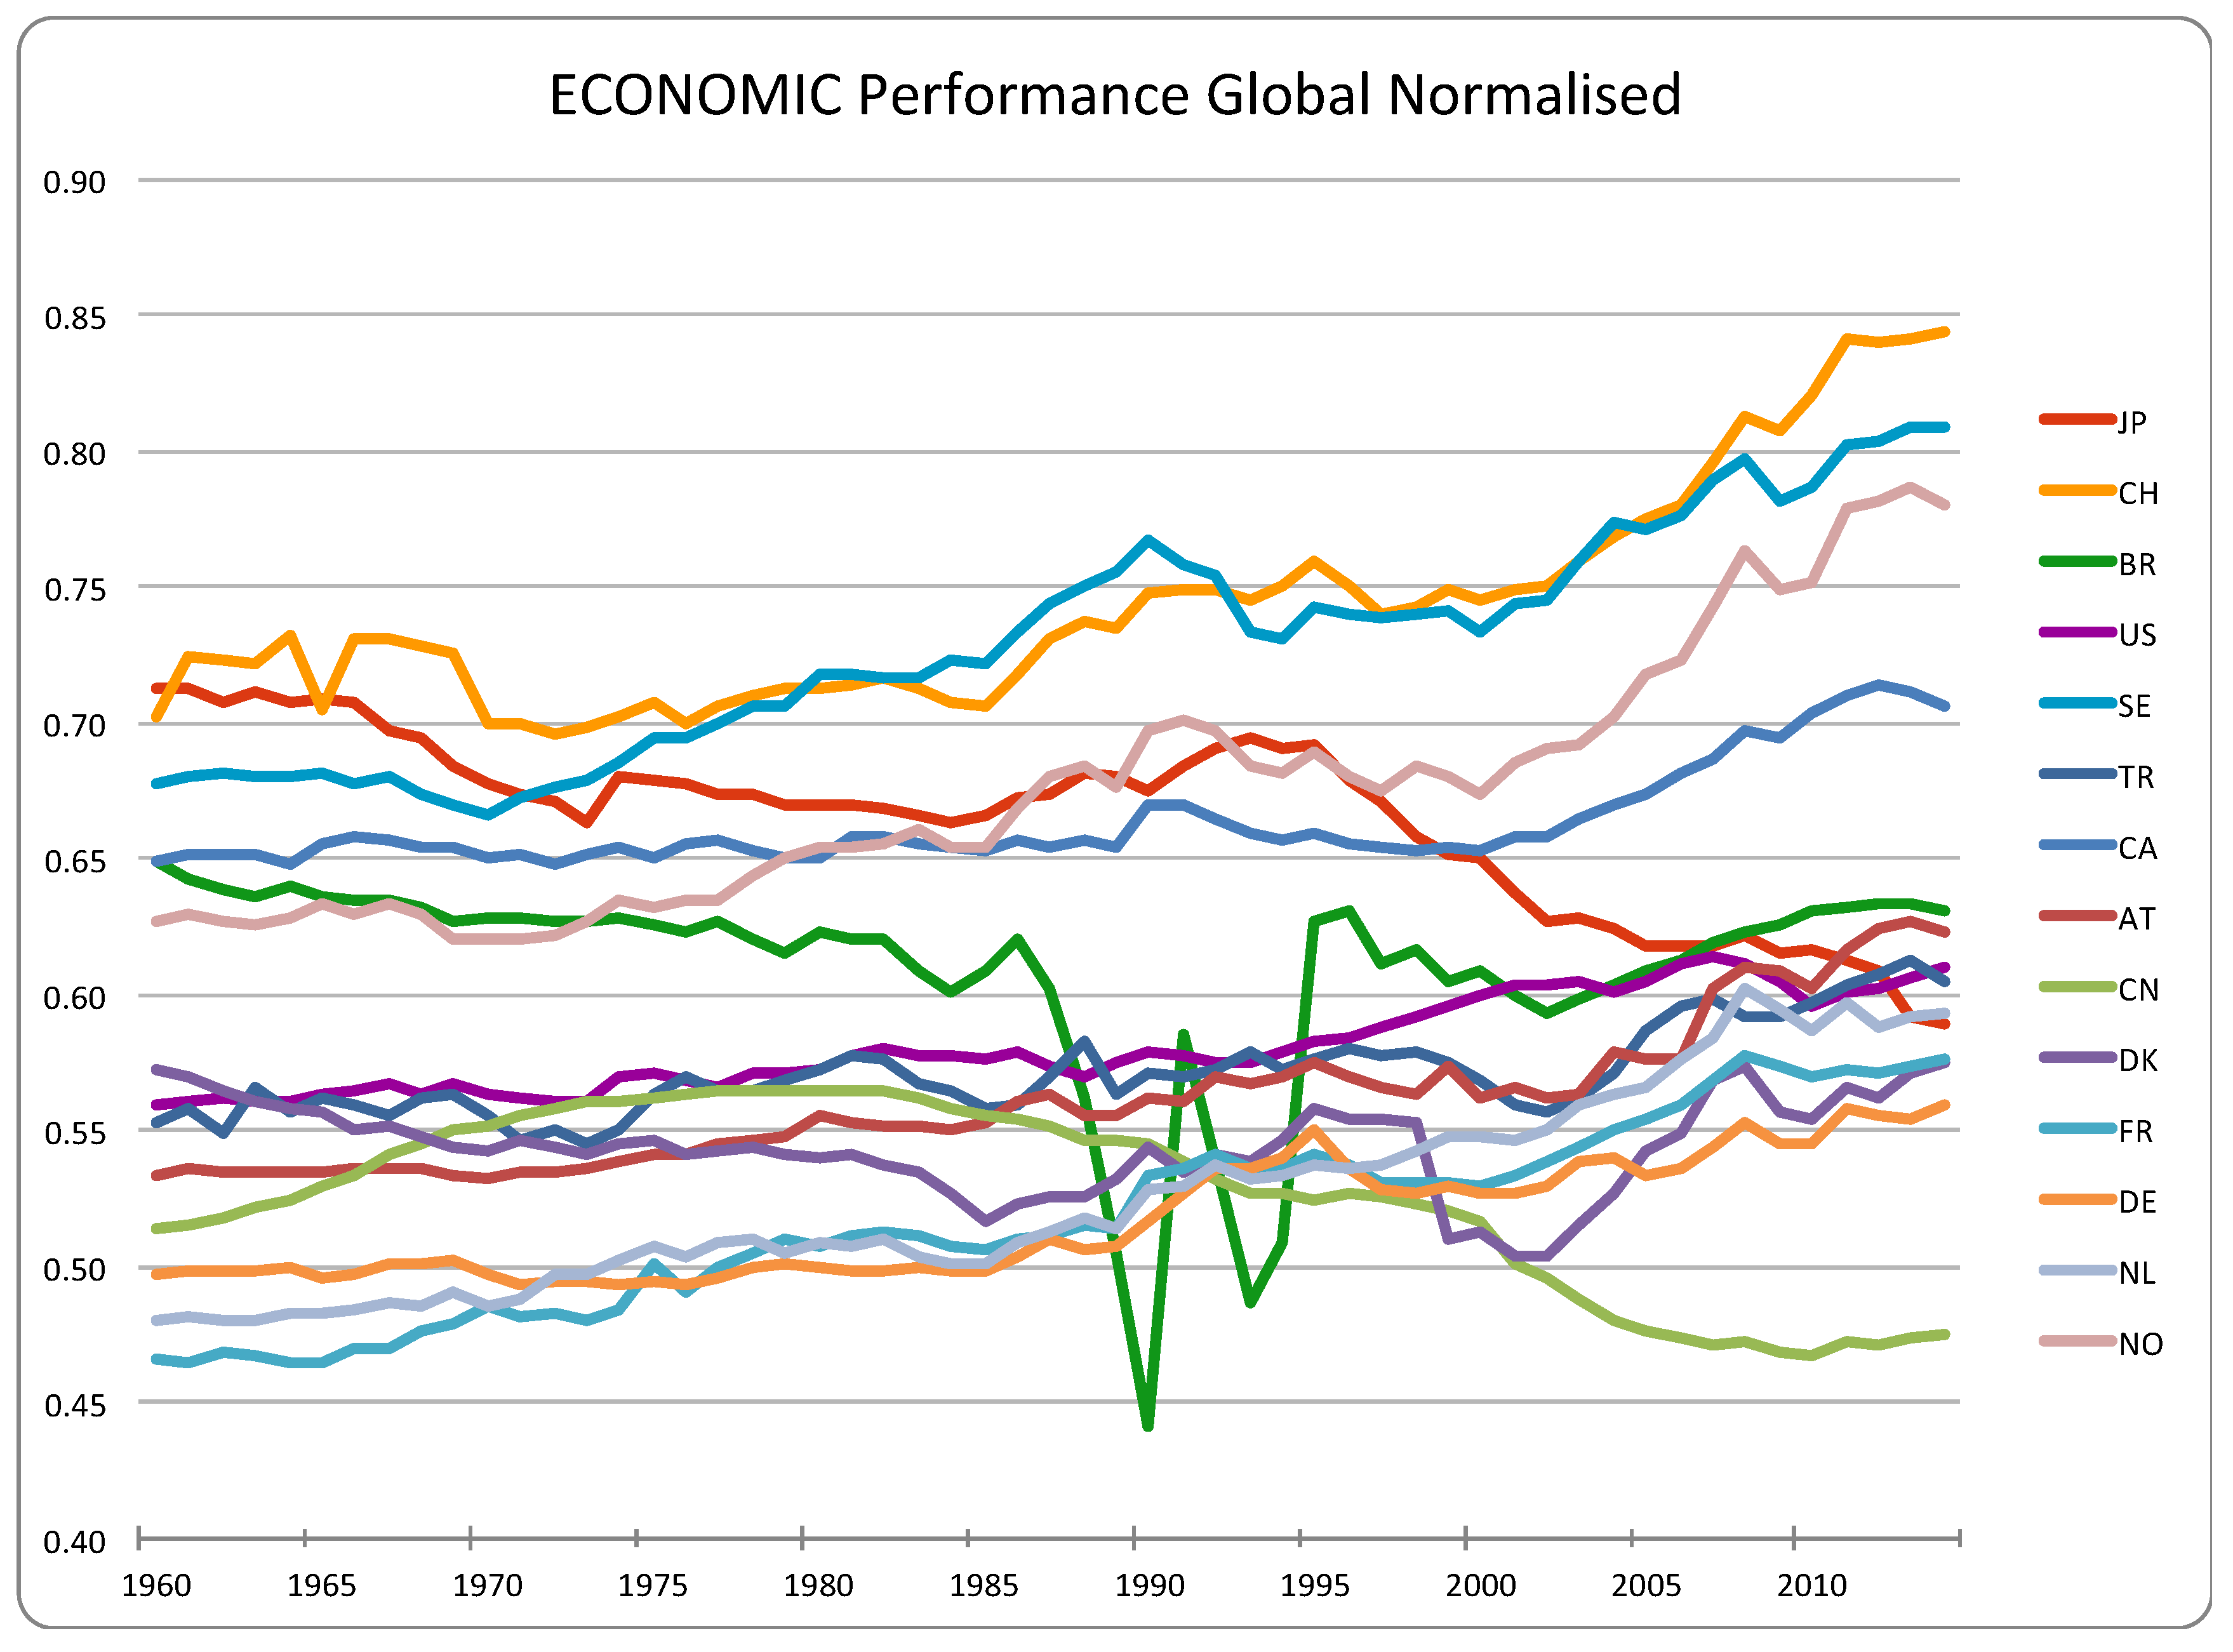
Figure 4.
Integrated Sustainability Performance Index: Environmental Priorities. Source: authors’ calculations.
Figure 4.
Integrated Sustainability Performance Index: Environmental Priorities. Source: authors’ calculations.
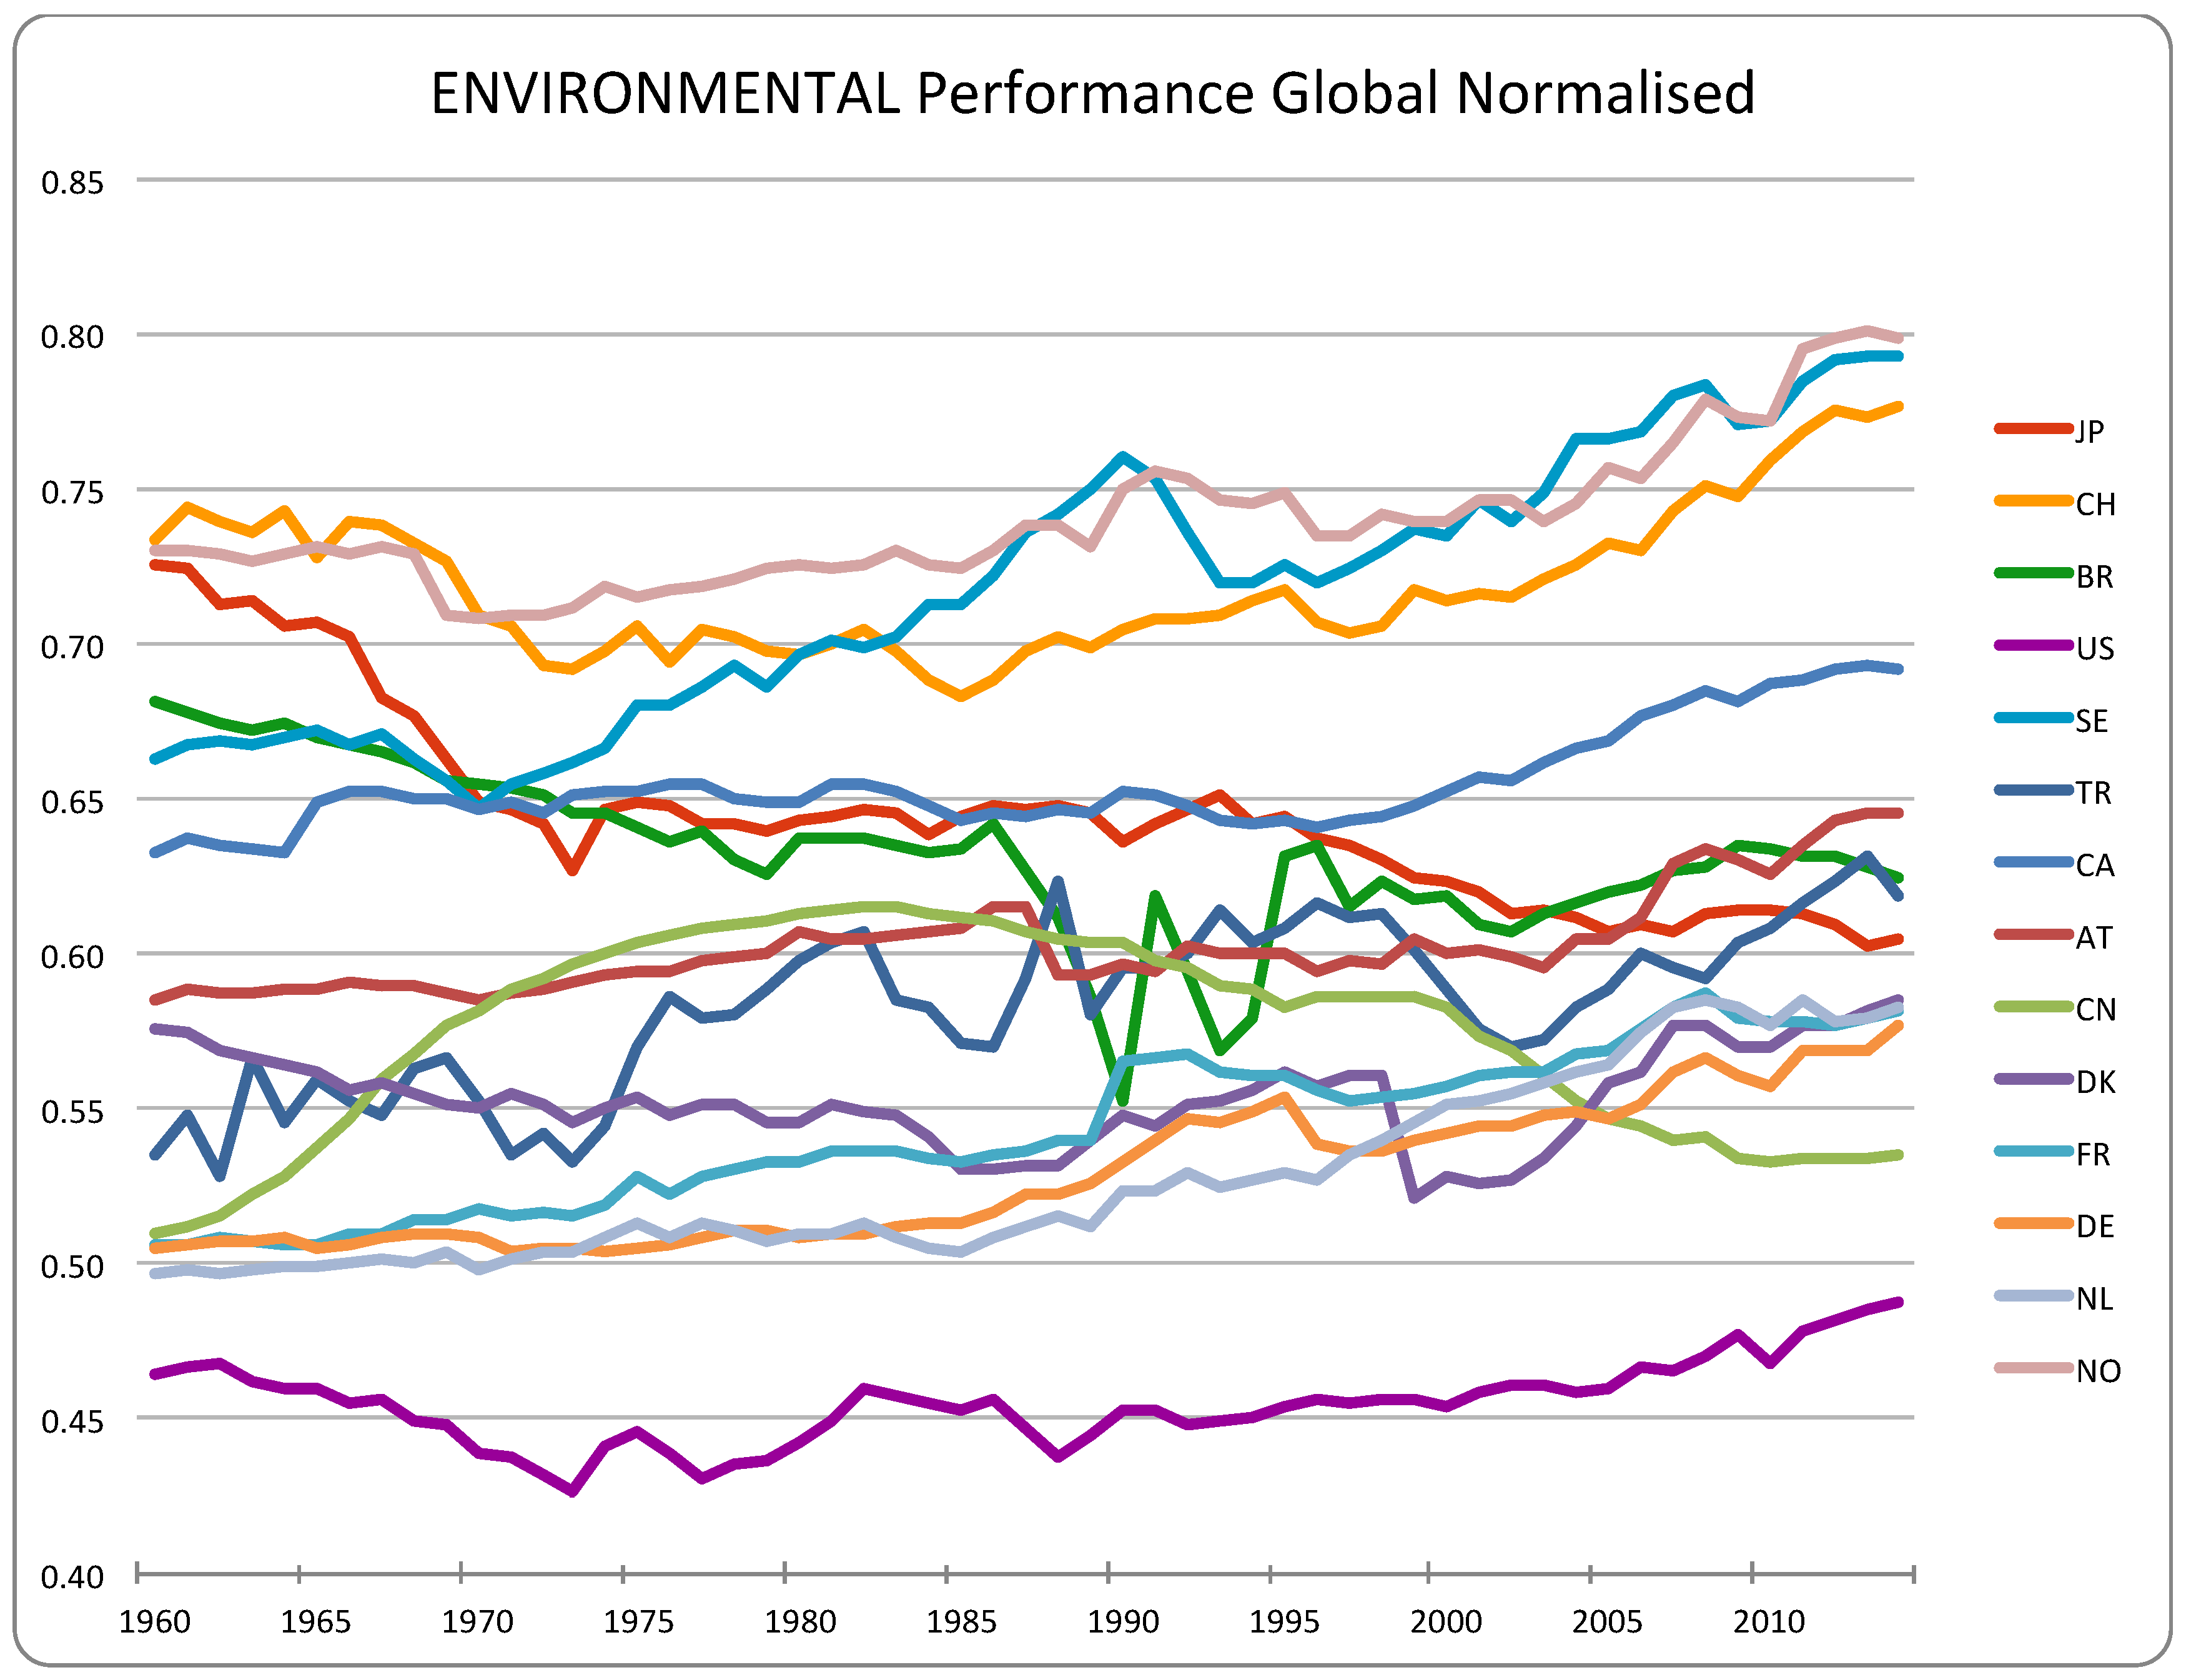
Figure 5.
Integrated Sustainability Performance Index: Social Priority. Source: authors’ calculations.
Figure 5.
Integrated Sustainability Performance Index: Social Priority. Source: authors’ calculations.
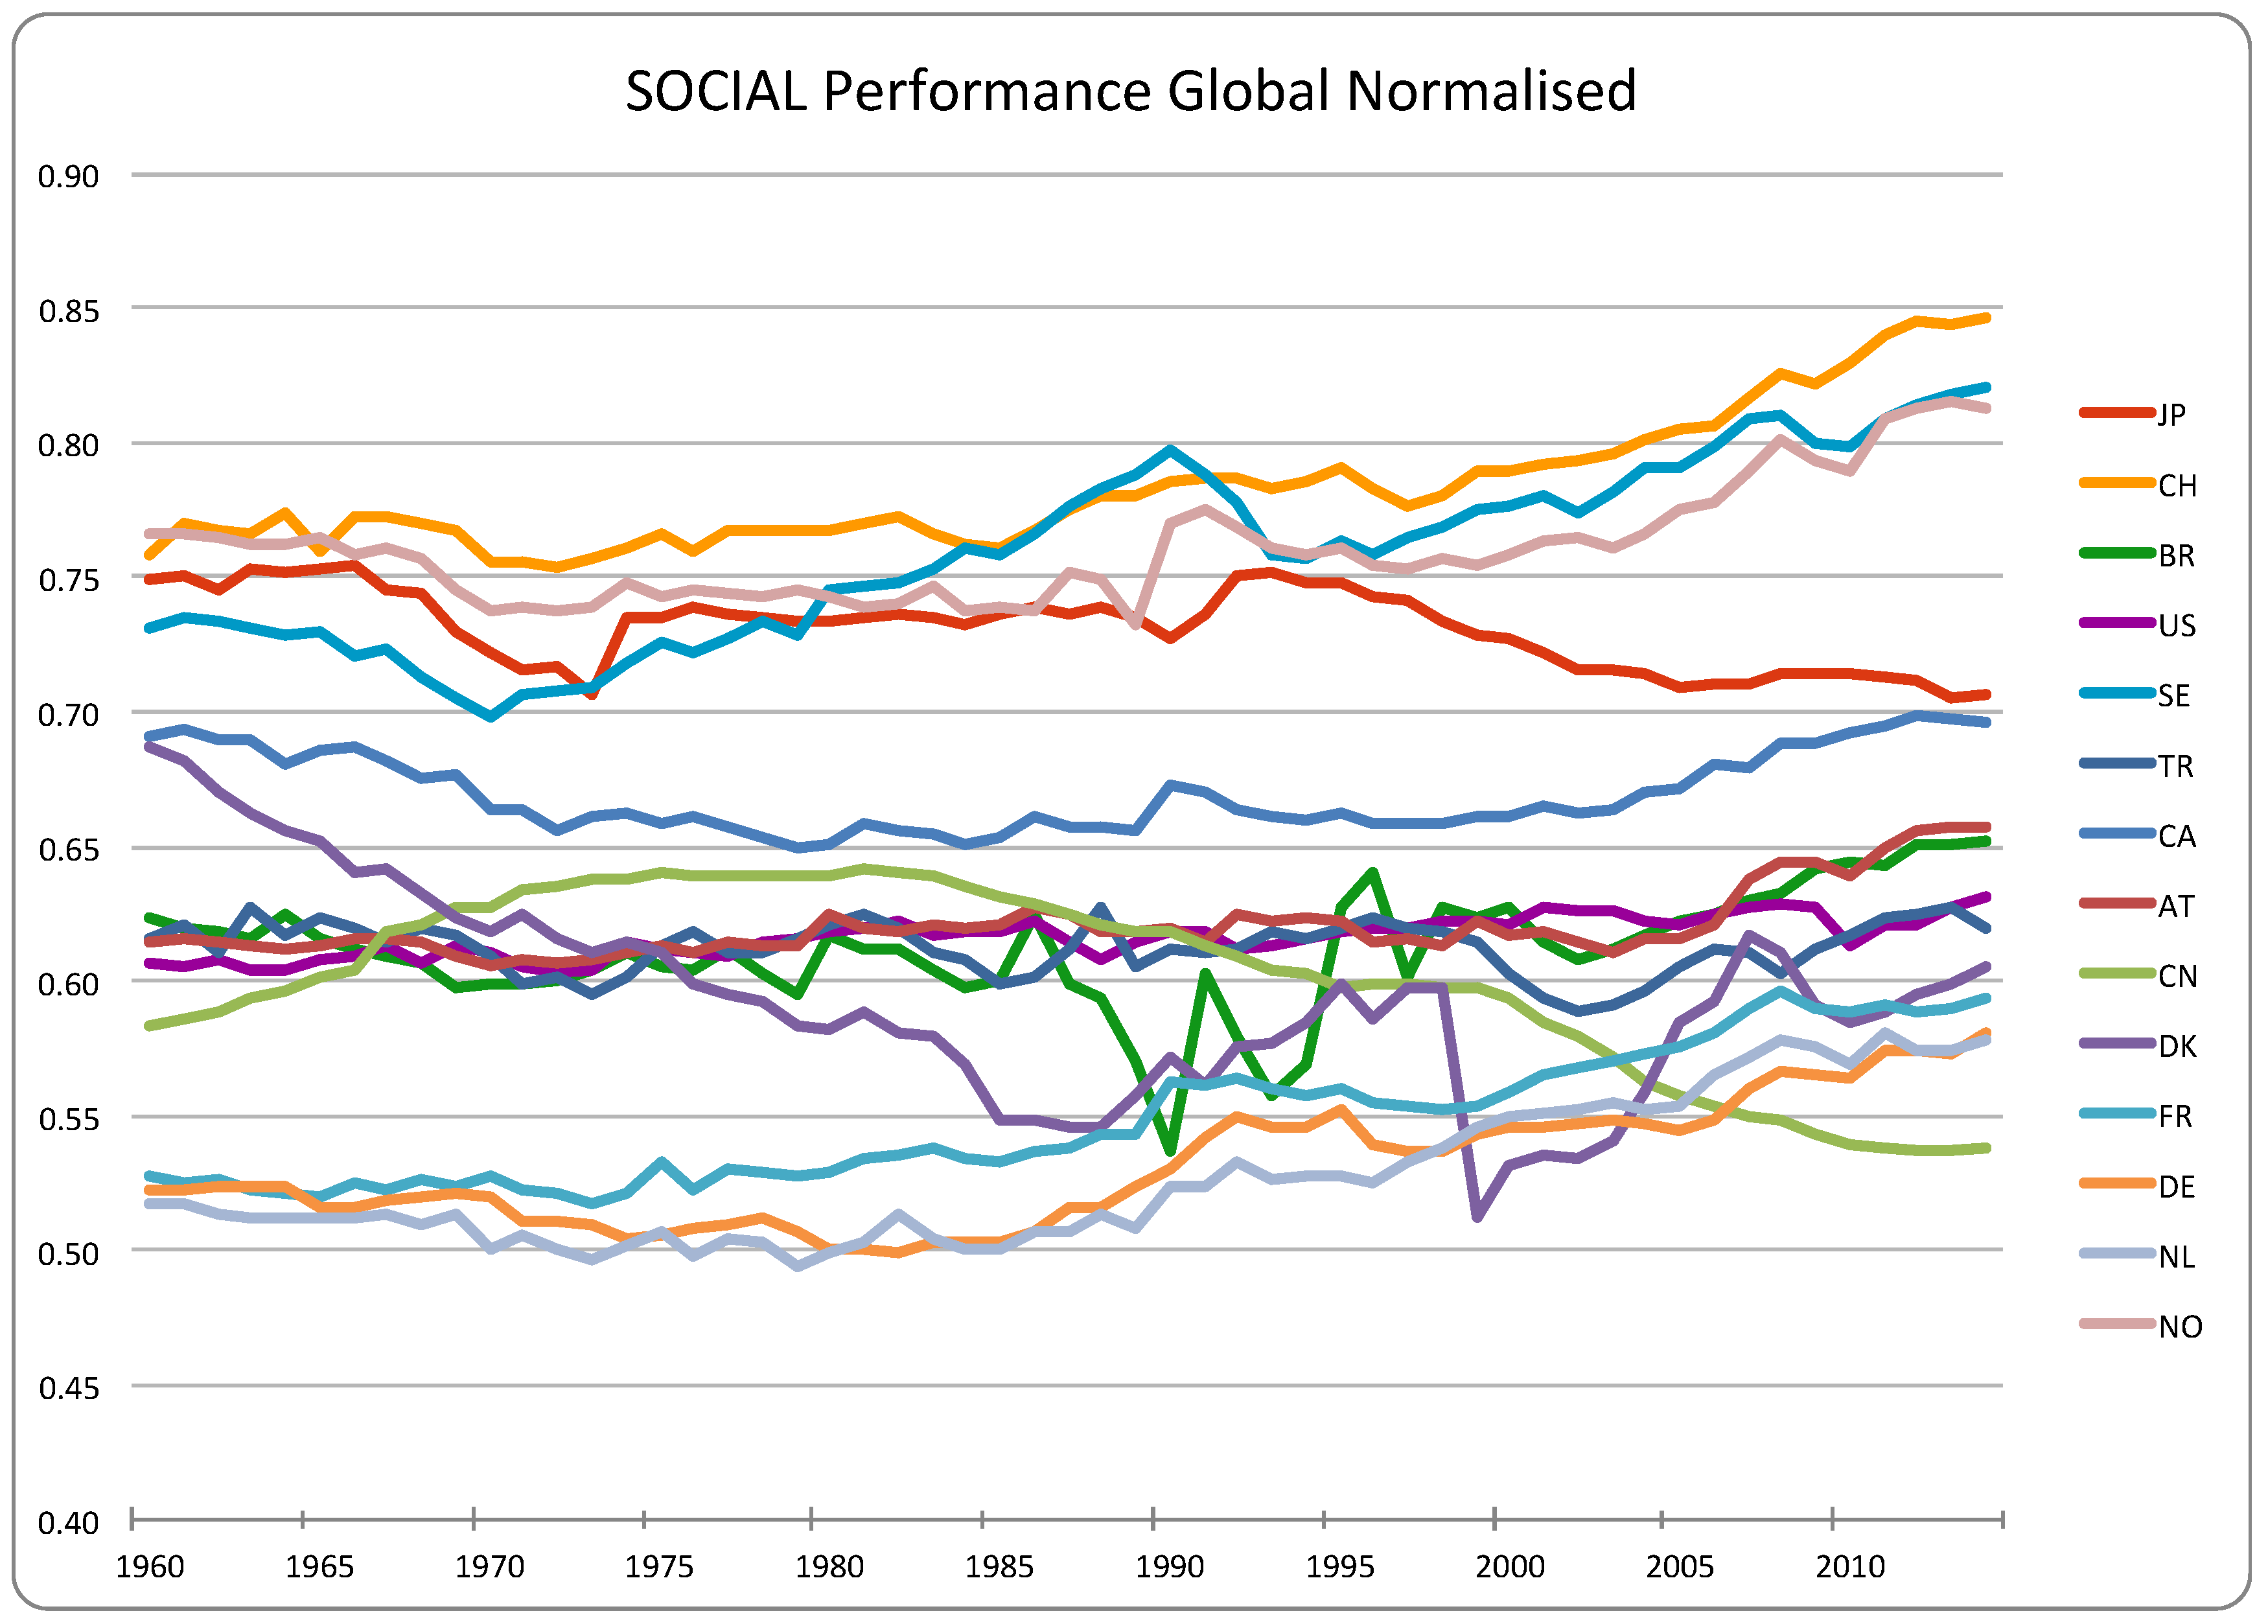
Disclaimer/Publisher’s Note: The statements, opinions and data contained in all publications are solely those of the individual author(s) and contributor(s) and not of MDPI and/or the editor(s). MDPI and/or the editor(s) disclaim responsibility for any injury to people or property resulting from any ideas, methods, instructions or products referred to in the content. |
© 2025 by the authors. Licensee MDPI, Basel, Switzerland. This article is an open access article distributed under the terms and conditions of the Creative Commons Attribution (CC BY) license (http://creativecommons.org/licenses/by/4.0/).
Copyright: This open access article is published under a Creative Commons CC BY 4.0 license, which permit the free download, distribution, and reuse, provided that the author and preprint are cited in any reuse.


