
Submitted:
18 April 2025
Posted:
18 April 2025
You are already at the latest version
Abstract
The paper describes the application of four different Nuclear Magnetic Resonance (NMR) experiments on the same olive oil sample to extract, in our best extent, the oil chemical composition reasonably featured by the specific genotype (cultivar) and de-tailed environmental conditions (terroir). The acquisition of three different 1H-NMR experiments was set to extract the combined information about a) main components, b) less represented components, and c) very tiny represented but key-ruling secoridoid species, respectively. To enclose the main chemical information within a unique da-taset, a single 1H NMR spectrum was reconstructed by customized crops from the three mentioned experiments (RICC-NMR). The robust setup of four experiments, namely I) standard 1H{13C}, II) multiple pre-saturated 1H{13C}; III) 1H selective excita-tion at 9.25 ppm, and IV) 13C{1H} acquisition, allowed to process the 1H-RICC-NMR and the 13C-NMR profiles so that any sample chemometrics was chemo-metrically characterized with an enhanced precision over several key minor species important for the remarkable analytical conclusions. In this paper, some specific EVOOs from Sicily and Sardinia are compared and discussed.
Keywords:
NMR analysis
; RICC-NMR
; extra-virgin-olive-oil
; Olea europaea
; 1H{13C}-NMR
; metabolic profile
; PLS-DA
1. Introduction
Extra virgin olive oil (EVOO) is the non-polar fraction obtained by milling the drupes of Olea europaea. Its widespread consumption worldwide is chiefly due to the optimal balance among saturated (SFA), monounsaturated (MUFA), and polyunsaturated (PUFA) fatty acids [1]. While the high MUFA content significantly contributes to the health benefits of EVOO compared to other vegetable oils, its bioactivity is also influenced by a variety of minor compounds involved in key physiological pathways. These include aliphatic and triterpene alcohols, hydrocarbons, volatile compounds, squalene (SQ), sterols, phenols, and other bioactive molecules [2,3].
Among these minor components, lipophilic phenols have gained significant attention due to their protective role against oxidative stress, demonstrated in both in vitro and in vivo studies [3,4,5,6]. Additionally, these phenolic compounds contribute to the self-stabilization of EVOO, enhancing its shelf life, and are also responsible for key organoleptic properties, particularly bitterness and aroma, despite their relatively low concentrations [7,8].
The characterization of EVOO relies on a range of analytical techniques, mainly employing separation methods coupled with highly sensitive detectors. Some of these methods are recognized as official protocols by the European Commission [9]. Gas chromatography with flame ionization detection (GC-FID) is the standard approach for quantifying fatty acids as glyceryl esters and other compounds [10,11]. High-performance liquid chromatography (HPLC), frequently coupled with diode-array detection (DAD), is employed for the determination of specific triacylglycerols (triglycerides) [12] and alternatively for the quantification of phenolic compounds after extraction with acetonitrile [13]. Due to the complex nature of EVOO composition, several targeted analytical approaches have been developed to identify and quantify specific compounds [14].
Over the last decades, nuclear magnetic resonance (NMR) spectroscopy has gained prominence as a holistic approach [15]. The NMR power comes from a pure quantitative response and direct sampling (without chemical treatments), which minimizes experimental errors and limits the potential use of standards [16]. The most stated limitation of this technique is sensitivity, linked to the relative concentration of chemicals with respect to the most represented species within the sample [17,18]. This is named “the dynamic range limit”, and specific targeted experiments can overcome this challenge through the attenuation or exclusion of the “giant” signals coming from the most represented compounds. In this study, we present an original experimental protocol to specifically tackle the mentioned dynamic range challenge, pushing further the limits of the EVOOs NMR analysis of minor components. The results are used to generate a rationale able to interpret the differences between Sicilian and Sardinian olive oil samples, paving the way for other possible studies that embrace a wider plethora of samples.
2. Materials and Methods
2.1. Samples
As a case study to evaluate the application of our original procedure, described in Section 2.3 and Section 2.4, we chose to compare two groups of extra virgin olive oils (EVOOs) from Sardinia and Sicily, for which the literature provides genetic evidence indicating a certain degree of genetic correspondence [19]. The thirty-seven chosen EVOO samples were selected from Sicilian (eighteen samples of Nocellara cultivar) and Sardinian (nineteen samples of Bosana cultivar) crops to provide a rationale explaining the Olea Europaea terroir condition. Specific goods were given by local producers in dark, sealed bottles after the 2023-2024 campaign. Samples were kept sealed in dark and dry cupboards until January 2025 and then picked up for analysis. Measurements were run in triplicate. After dilution in CDCl3, sample solutions were analysed or kept in the -44°C freezer. According to the NMR profile, the frozen solution remains stable for 20 days.
2.2. Chemicals
High-purity deuterated chloroform (CDCl3), tetramethyl silane (TMS), n-hexane, cyclohexane, methanol, and all the chemicals at reagent grade were obtained from Sigma-Aldrich (Milan, Italy).
2.3. NMR Sample Preparation
Sample preparation is based on a specific strategy developed to seek the best compromise to obtain an acceptable field homogeneity for any sample, good sensitivity extended to the less represented components and 13C signals, and a good separation between key signals of the 13C- NMR experiments (namely the 10-C of oleic and linoleic fragments) [20, 21]. Final samples are prepared by diluting original EVOO samples with CDCl3, keeping the relative weight ratio to 13.5:86.5; for quick and cost-effective preparation, this corresponds to adding 500 μL of deuterated chloroform to 128 μL of EVOO at 298K inside a 5-mm test tube for NMR analysis.
We remark again that other NMR strategies use more solvents and higher dilutions to achieve resolution; however, they lack specific sensitivity and insight into some of the mentioned degradable phenolic species [1]. In this context, the increased sensitivity plays a crucial role in the detection of sterol species.
2.4. NMR Experimental Protocol
For any sample, four basic experiments were recorded:
- Experiment I: a standard 1H spectrum endowed with 13C decoupling sequence during the acquisition, made by 16 scans and a suitable cycling delay for quantitative analysis.
- Experiment II: is the same experiment I, with a multiple pre-saturated wave able to attenuate the main signals (NOESYGPPS). This experiment is run for 32 scans, and a suitable cycling delay for quantitative analysis.
- Experiment III: 1H- DPFGSE (selected double-pulsed field gradient spin echo) spectrum [21] is with 40 scans for the detection and quantification of aldehydic-phenolic species.
- Experiment IV: full-time 1H decoupled 13C spectrum with 128 scans with a suitable recycling delay for quantitative evaluations (more than 18 sec per cycle) [20].
This experimental protocol results from our personal optimization, aimed at achieving the best performance within a reasonable overall experimental time. Our four experiments’ setup lasted around 8 min, 8 min, 8 min, and 40 min, respectively; therefore, by including the preparation procedure, the total experimental analysis for every sample was 90 min in the worst-case scenario.
2.5. NMR Acquisition and Processing
Samples in the 5 mm NMR tubes were analysed by a 600-MHz Bruker (Bruker Biospin Italy – Milan) spectrometer equipped with a BBI probe with gradients at the constant temperature of 298 K. After the automatic tuning and gradient shimming, the line shape of the CHCl3 residual signal was checked by shimming until line shape was lower than 1.0 Hz. NMR spectra were run at 600.13 and 150.73 MHz, respectively. The hard pulse for the maximum sensitivity (90° pulse) was calibrated throughout the samples and always within 8.2 ± 0.1 μs at -11.3 dB. The 1D, 1H{13C}. Selective, multi-suppression (NOESYGPPS), and 13C{1H} experiments were conducted as previously described [22]. The 1H spectra (I, II, III and IV) were acquired with the same spectral width (12ppm), acquisition time (AQ = 2,2 sec), and delay (15 sec).
Experiments I, II, III were run with a spectral width of 12 ppm, number of scans (64), 2 s of acquisition time, and 15 s of recycle delay to keep quantitative methods regardless the different protonic relaxation times (maximum value of T1 = 2.5, which is less than 5 times the total recycling time), resulting in a total acquisition time of 18 min.
By following our previous studies, we set up experiment III (1H- DPFGSE pulse sequence) [23]. The shaped pulse between 8 and 10 ppm was an optimized BURP (Band-Selective, Uniform Response, Pure-Phase) [24] with a duration of 7 ms. After 8 to 16 scans, the spectrum displayed signals in the region of interest (barely foreseen through experiments I, and II) with a better signal-to-noise ratio provided that a slight line-broadening function (0.3 Hz) was applied for the Fourier-transform procedure.
For experiment II (NOESYGPPS), 1H NMR pulse sequence was employed. Consistent with a previous study, an amplitude- and phase-modulated shaped pulse was applied during the relaxation delay (RD), comprising 29 highly selective frequency bands, each with a bandwidth of 5 Hz. This enabled highly selective suppression of dominant lipid signals while preserving the remainder of the spectrum undistorted within ±0.1 ppm of each suppressed signal.
For the same reason, experiments IV (13C{1H}) were first acquired with the 13C 90° hard pulse (15 ± 0.3 us at -20.2 dB, 112 W), 128 scans, 2 s of acquisition time, and 20 s for the time delay. Afterward, these experiments were compared to some others with lower recycling time and smaller tilting angles with the purpose of optimizing the experimental time, keeping the quantitative ratio of 13C signals. The final optimized conditions were: 128 scans, 90° pulse, and 20 seconds of total recycling delay for a total of 48 minutes of experimental time.
Calibration of experiments I, II, and III were basically performed on the methyl group of the β-sitosterol signal to (δH = 0.738 ppm previously set with respect to the TMS δH=0.0± 0.005 ppm). Similarly, for 13C calibration (experiment IV), the glycerol CH signal (>CH-OH; δ13C= 78.9340 ppm previously set for the TMS δc=0.0± 0.005 ppm). This provides a TMS free frequency calibration of oil samples, getting rid of many experimental issues.
2.6. NMR Processing Strategies and Quantification
Chemometrics is the comprehensive study of chemical data from samples, aiming to interpret variations and differences across various categories by utilizing specialized mathematical and statistical tools. Although it could be done by acquiring all spectral information (through bins), we believe that the choice of a specific target enables a simpler discussion of target effects, free from artifacts. Our idea to collect different 1H experiments (I, II, and III) aims to achieve suitable precision in peak integration in a completely different dynamic range, reflecting a wide relative concentration of the EVOO components. To handle a limited dataset, we had the idea to rebuild just one 1H NMR profile cropped out from the three experiments, whose retained regions keep the optimized sensitivity of that specific experiment. The original Restored Intensities by Crops of Customized NMR experiments (RICC-NMR) saves, in just one spectral trace (Figure 1), the best sensitivity for main components (taken from experiment I), less represented components (sourced from experiment II, which is also the quantitative reference for the other insets), and minor phenolic fraction in the 8.5-10 ppm range.
The integration of 102 regions of RICC-NMR profile and 98 regions from the 13C-NMR enabled the optimized quantification of 19 chemical compounds which were used to assess the quality of the oils and rationalize the statistical trends. Data processing was carried out by collecting spectra using MestreNova (version 12 -Mestrelab Research SL Santiago de Compostela, Spain), followed by the generation of data point matrices, which were subsequently processed within MATLAB (Matlab R2024a software package - The Mathworks, Cambridge). Matlab allows multiple treatments of decoded spectra, which were calibrated, baseline corrected, composited into the RICC-NMR traces, aligned using the icoshift routine [25], and finally integrated (see Supplementary Material for the line codes). Integrals were then merged through the MARA-NMR optimization procedure [26], resulting in the quantification of 19 significant components. The precision of this quantification was assessed through measurements performed in triplicate across three separate days, yielding nine values for each variable. MARA-NMR is based on the least-squares regression applied to the global data; therefore, low quadratic deviation values were considered as a guarantee of self-consistent outcomes.
2.7. Traditional Analytical Essays
To assess the quality and commercial classification of each EVOO, several parameters outlined by European regulation [9] were evaluated. These are identified through chemical analyses such as free fatty acidity (FFA), peroxide value (PV), and specific spectrophotometric indices.
The FFA is a parameter that depends on the quality of the raw material; it is a marker of the product’s freshness and reflects the health conditions of the raw material, providing essential information about the quality of the milled olives. The results were expressed as a percentage of oleic acid.
The PV value (max 20 meq O2/kg) is a marker of oil freshness and indicates the degree of primary oxidation, which is indicative of its quality.
The spectrophotometric indices (precisely, maximum values for K232, K270, and ΔK) provide information on the oxidative state of the product and, therefore, its degree of aging.
2.8. Statistical analysis
Statistical analyses were performed using the SIMCA-P software package version 14.1 (Umetrics AB, Umea, Sweden), and data were scaled using the univariate procedure. Principal Component Analysis (PCA) data analysis was performed for exploratory purposes and outlier detection, while Projection to Latent Structures (PLS)-based methods were employed for discriminant analysis and data set comparison. We used an orthogonal extension of PLS-DA [27], where the first latent variable only accounted for variations in correlated data. PLS-DA models were evaluated using the goodness-of-fit parameter (R2Y) and the predictive ability parameter (Q2Y). First, 37 independent samples were chosen to perform a multivariate statistical analysis without any defined classification. Due to the relatively limited available samples, we preferred to use the nineteen variables output by NMR quantification to avoid overfitting, collinearity, and challenging recovery of the chemical rationale. The results were analysed, and their robustness was verified using the methods proposed by Erikson [28]: a permutation test was performed by randomly changing the class assignment of 3 samples for time.
3. Results
3.1. Data processing and treatment
Processing of the mentioned NMR data resulted in the quantification of 19 components, which are listed in Table 1.
3.2. Statistical Analysis of the Metabolic Profile
Statistical graphs are reported in Figure 2. For the statistical analysis, we have used 37 observables and 19 variables. The PCA of Figure 2a shows a promising clustering of samples according to specific variables (loadings not shown), revealing a fair distribution that may be linked to several factors (i.e., temperature, altitude, solar exposition, and/or pedologic). The Cumulative Sum of Squares R2 (0.554) and the fraction of the total variation of X Q2 (0.139) indicate an insufficient fit, which may depend on the low number of samples. The PCA shows clustering into two groups, SIC (blue) and SAR (red) (Figure 2a).
The Partial Least Squares Discriminant Analysis (PLS-DA) model (R² = 0.889; Q² = 0.789) demonstrated a robust and reliable separation between SIC and SAR sample groups (Figure 2b). The model’s robustness was evaluated through both leave-one-out cross-validation and random permutation testing,
In PLS-DA, permutation testing assesses the statistical significance of the model by randomly shuffling class labels and determining whether the model’s performance metrics remain robust, thus mitigating the risk of overfitting. It displays the correlation coefficient between the original y-variable and the permuted y-variable on the x-axis versus the cumulative R2 and Q2 on the Y-axis and draws the regression line. The intercept is a measure of the overfit. A 300-fold permutation test was conducted, resulting in regression lines with R² and Q² intercepts of 0.247 and −0.305, respectively, supporting the model’s validity. These results confirm that the PLS-DA model is both statistically robust and suitable for extension to larger or future datasets.
We also used an orthogonal extension of PLS-DA [27], in which the first latent variable accounted only for correlated data variations, filtering out the variation not directly related to the discriminant response (Figure 2b). A complete separation of the two classes was obtained.
From Figure 2b, we can identify the most important variables and their roles in the PLS-DA model. These are PHGR, VSTR2, O2, VSTR, ELNL, Ln, MUF9, HTY-EDA. Results are consistent with those obtained by Piravi-Vanak [29], which demonstrated that the fatty acid and sterols composition of EVOO is strongly influenced by the variety, ripening process, and geographical origin, particularly latitude and climatic conditions [30].
In Figure 2c, the Variable Importance in Projection (VIP) score is shown as a weighted sum of the squared PLS weights (w*), considering the amount of Y-variance explained by each component in each dimension. Usually, VIP larger than 1 are the most relevant for explaining Y.
4. Discussion
The quantification of minor components is the most effective approach for understanding the mechanisms of differentiation driven by genotypic and/or pedoclimatic conditions [31]. Most published papers adopt the continuous bucketing approach (e.g., 0.04 ppm), subsequently attempting to identify a component responsible for the specific discrimination (a fully untargeted analysis). Nevertheless, this approach is affected by dataset uncertainties related to data non-collinearity across different buckets. The use of different spectra enabled the extraction of targeted extensive information on minor components through definite integrals, which were typically obscured by more intense signals within standard NMR experiments. Our multi-experimental approach takes advantage of the best features evidenced by the different techniques; for instance, the multi-suppression of main signals and simultaneous 13C decoupling cleans several regions where tiny but crucial signals are fairly displayed.
Such selected datasets enabled a more confident application of statistical analyses, providing immediate insights into the influence of climatic conditions.
For this reason, we have chosen two cultivars belonging to the same Phoenician botanical family [19] but grown on two big islands in the centre of the Mediterranean Sea.
Through this vision, the composition of polyphenols and sterols directly accounts for the response of olive trees to climatic conditions. Specifically, during the 2023–2024 season, despite higher temperatures in northern Sardinia compared to the average of previous years [32], the comparison with climatic conditions in Sicily clearly demonstrates that in Sardinia, lower temperatures and higher humidity lead to a higher production of some polyphenols (Oleuropein and Ligstroside aglycone) and sterols.
OPLS-DA identified main differentiators based on geographical region; vegetal sterols and ligustroside aglycone characterize the Sardinian oils, whereas Sicilian samples are correlated positively with Oleate esters and Linoleate esters. These main discriminant components confirm the previously observed climatic distinction already evidenced in earlier studies [20, 30].
As reported by Lukic et al. [33], the influence of agronomic, varietal, and pedoclimatic variables is complex, affecting the composition of fatty acids, sterols, and other minor components. In this paper, we highlight the dominant influence of climatic conditions on the composition of polyphenols and sterols in EVOOs. Specifically, higher temperatures are associated with an increase in the production of both free and glycerol-bound fatty acids, while the composition of sterols and polyphenols is negatively affected. This effect can be interpreted as a plant response mechanism to environmental stress induced by climatic conditions [30].
5. Conclusions
This study consists in the development of a customized NMR analytical protocol for EVOO samples including: a) a tailored sample preparation; b) an experimental workflow comprising three distinct 1H-NMR acquisition and one 13C-NMR acquisition; c) an original data processing approach (using Mestrenova and MATLAB), based on alignment and integration of the three 1H-NMR experiments (RICC-NMR) along with the 13C-NMR profile; d) a targeted integration analysis to determine the compositional profile of olive oil samples (MARA-NMR). Such an original throughput was delivered to Sicilian and Sardinian samples known to belong to the same Olea europaea strain [19,34,35]. Statistical chemometric methods allowed us to distinguish sample belongings and discuss the differences mostly related to geographical origin.
This NMR approach targeting minor components evidences the key role of such species in characterizing the origin and features of complex food matrices such as olive oil and might pave the way to wider chemometric analyses.
Supplementary Materials
The following supporting information can be downloaded at the website of this paper posted on Preprints.org, Paragraph S.1 Details about Materials and Methods; SubPar S.1.1 Matlab processing ; Figure S1 Overlapped 1H aligned traces restored by three experiments (RICC-NMR) for all the analyzed samples; Figure S2 Staking of the 1H aldehydic region aligned for the analysed samples and main assignments determining important metabolites for the quantification; Figure S3 . 13C stack plot for some selected regions, icoshift alignment allows fair integration and quantification of signals.: title; Table S1: 1H targeted integration assignments at the best of our actual extent.
Author Contributions
Conceptualization, A.R., M.S and N.C.; methodology, G.L. L.T. and P.D., and A.R.; software, A.R., F.N. and G.B.; validation, F.N., P.A.T. and G.P.; formal analysis, G.B. and F.N.; investigation, A.R.; resources, N.C. and G.L.L.T.; data curation, N.C., and A.R.; writing—original draft preparation, A.R.; writing—review and editing, G.L.L.T.; visualization, G.P.; supervision, N.C.; project administration, N.C. All authors have read and agreed to the published version of the manuscript.
Funding
This research received no external funding.
Institutional Review Board Statement
Not applicable.
Informed Consent Statement
Not applicable.
Data Availability Statement
Data sharing is not applicable.
Conflicts of Interest
The authors declare no conflicts of interest.
Abbreviations
The following abbreviations are used in this manuscript:
| NMR | Nuclear Magnetic Resonance Spectroscopy |
| MARA | Least square optimization algorithm called Multiple Assignment Recovered Analysis |
| RICC | Restored Intensity through Customized Crops (from NMR experiments) is a combined NMR profile |
| EVOO | Extra-Virgin Olive Oil |
| SFA | Saturated Fatty Acids |
| MUFA | Mono-Unsaturated Fatty Acids |
| PUFA | Poly-Unsaturated Fatty Acids |
| HPLC | High-performance Liquid Chromatography |
| GC-FID | Gas Chromatography with Flame Ionization Detector |
| DAD | Diode Array Detection |
| LD | Linear dichroism |
| PCA | Principal Component Analysis |
| PLS-DA | Partial Least Square – Discriminant Analysis |
| SIC | Sicilian Belonging Samples |
| SAR | Sardinian Belonging Samples |
| NOESYGPPS | Nuclear Overhauser Effect Spectroscopy by Gradient Pulsed for Pure Shift |
| TMS | Tetramethyl Silane standard |
| Compound CODE | All the detected compounds are identified with a code reported in Table 1 |
| MUF7 | Mono-Unsaturated fatty esters with the cis unsaturation in the nineth position |
| VIP | Variable Importance in Projection |
| PLS | Projection to Latent Structures |
References
- Esposto, S.; Taticchi, A.; Urbani, S.; Selvaggini, R.; Veneziani, G.; Di Maio, I.; Sordini, B.; Servili, M. Effect of Light Exposure on the Quality of Extra Virgin Olive Oils According to Their Chemical Composition. Food Chem. 2017, 229, 726–733. [Google Scholar] [CrossRef] [PubMed]
- Boskou, D.; Tsimidou, M.; Blekas, G. Olive Oil: Chemistry and Technology, 2nd ed.; AOCS Publishing: Champaign, IL, USA, 2015. [Google Scholar]
- Salvo, A.; Tuttolomondo, A. The Role of Olive Oil in Cardiometabolic Risk. Metabolites 2025, 15, 190. [Google Scholar] [CrossRef]
- Gorzynik-Debicka, M.; Przychodzen, P.; Cappello, F.; Kuban-Jankowska, A.; Gammazza, A.M.; Knap, N.; Wozniak, M.; Gorska-Ponikowska, M. Potential Health Benefits of Olive Oil and Plant Polyphenols. Int. J. Mol. Sci. 2018, 19, 686. [Google Scholar] [CrossRef] [PubMed]
- Martín-Peláez, S.; Covas, M.I.; Fitó, M.; Kušar, A.; Pravst, I. Health Effects of Olive Oil Polyphenols: Recent Advances and Possibilities for the Use of Health Claims. Mol. Nutr. Food Res. 2013, 57, 760–771. [Google Scholar] [CrossRef]
- Xiang, C.; Xu, Z.; Liu, J.; Li, T.; Yang, Z.; Ding, C. Quality, Composition, and Antioxidant Activity of Virgin Olive Oil from Introduced Varieties at Liangshan. LWT 2017, 78, 226–234. [Google Scholar] [CrossRef]
- Kouka, P.; Priftis, A.; Stagos, D.; Angelis, A.; Stathopoulos, P.; Xinos, N.; Skaltsounis, A.L.; Mamoulakis, C.; Tsatsakis, A.M.; Spandidos, D.A.; et al. Assessment of the Antioxidant Activity of an Olive Oil Total Polyphenolic Fraction and Hydroxytyrosol from a Greek Olea Europea Variety in Endothelial Cells and Myoblasts. Int. J. Mol. Med. 2017, 40, 703–712. [Google Scholar] [CrossRef] [PubMed]
- Andrewes, P.; Busch, J.L.H.C.; De Joode, T.; Groenewegen, A.; Alexandre, H. Sensory Properties of Virgin Olive Oil Polyphenols: Identification of Deacetoxy-Ligstroside Aglycon as a Key Contributor to Pungency. J. Agric. Food Chem. 2003, 51, 1415–1420. [Google Scholar] [CrossRef]
- The European Commission. II of the European Parliament and of the Council as Regards Marketing Standards for Olive Oil, and Repealing Commission Regulation (EEC) No 2568/91 and Commission Implementing Regulation (EU) No 29/2012. Off. J. Eur. Union 2022, L 284, 1–22. [Google Scholar]
- Bella, G.; Rotondo, A. Theoretical Prediction of 13C NMR Spectrum of Mixed Triglycerides by Mean of GIAO Calculations to Improve Vegetable Oils Analysis. Chem. Phys. Lipids 2020, 232, 104973. [Google Scholar] [CrossRef]
- Revelou, P.K.; Pappa, C.; Kakouri, E.; Kanakis, C.D.; Papadopoulos, G.K.; Pappas, C.S; Tarantilis, P.A. Discrimination of botanical origin of olive oil from selected Greek cultivars by SPME-GC-MS and ATR-FTIR spectroscopy combined with chemometrics. J. Sci. Food Agric. 2021, 101, 2994–3002. [Google Scholar] [CrossRef]
- Carvalho, M.S.; Mendonça, M.A.; Pinho, D.M.M.; Resck, I.S.; Suarez, P.A.Z. Chromatographic Analyses of Fatty Acid Methyl Esters by HPLC-UV and GC-FID. J. Braz. Chem. Soc. 2012, 23, 763–769. [Google Scholar] [CrossRef]
- Ammar, S.; Kelebek, H.; Zribi, A.; Abichou, M.; Selli, S.; Bouaziz, M. LC-DAD/ESI-MS/MS Characterization of Phenolic Constituents in Tunisian Extra-Virgin Olive Oils: Effect of Olive Leaves Addition on Chemical Composition. Food Res. Int. 2017, 100, 477–485. [Google Scholar] [CrossRef] [PubMed]
- Ruiz-Aracama, A.; Goicoechea, E.; Guillén, M.D. Direct Study of Minor Extra-Virgin Olive Oil Components without Any Sample Modification. 1H NMR Multisupression Experiment: A Powerful Tool. Food Chem. 2017, 228, 301–314. [Google Scholar] [CrossRef] [PubMed]
- Calò, F.; Girelli, C.R.; Angilè, F.; Del Coco, L.; Mazzi, L.; Barbini, D.; Fanizzi, F.P. 1H-NMR Profiling Shows as Specific Constituents Strongly Affect the International EVOO Blends Characteristics: The Case of the Italian Oil. Molecules 2021, 26, 2233. [Google Scholar] [CrossRef]
- Maestrello, V.; Solovyev, P.; Bontempo, L.; Mannina, L.; Camin, F. Nuclear Magnetic Resonance Spectroscopy in Extra Virgin Olive Oil Authentication. Compr. Rev. Food Sci. Food Saf. 2022, 21, 4056–4075. [Google Scholar] [CrossRef]
- Simmler, C.; Napolitano, J.G.; McAlpine, J.B.; Chen, S.N.; Pauli, G.F. Universal Quantitative NMR Analysis of Complex Natural Samples. Curr. Opin. Biotechnol. 2014, 25, 51–59. [Google Scholar] [CrossRef] [PubMed]
- Cevallos-Cevallos, J.M.; Reyes-De-Corcuera, J.I.; Etxeberria, E.; Danyluk, M.D.; Rodrick, G.E. Metabolomic Analysis in Food Science: A Review. Trends Food Sci. Technol. 2009, 20, 557–566. [Google Scholar] [CrossRef]
- Belaj, A.; Ninot, A.; Gómez-Gálvez, F.J.; El Riachy, M.; Gurbuz-Veral, M.; Torres, M.; Lazaj, A.; Klepo, T.; Paz, S.; Ugarte, J.; et al. Utility of EST-SNP Markers for Improving Management and Use of Olive Genetic Resources: A Case Study at the Worldwide Olive Germplasm Bank of Córdoba. Plants 2022, 11, 921. [Google Scholar] [CrossRef]
- Rotondo, A.; Bartolomeo, G.; Spanò, I.M.; La Torre, G.L.; Pellicane, G.; Molinu, M.G.; Culeddu, N. Comparison between Traditional and Novel NMR Methods for the Analysis of Sicilian Monovarietal Extra Virgin Olive Oils: Metabolic Profile Is Influenced by Micro-Pedoclimatic Zones. Molecules 2024, 29, 4532. [Google Scholar] [CrossRef]
- Klikarová, J.; Rotondo, A.; Cacciola, F.; Česlová, L.; Dugo, P.; Mondello, L.; Rigano, F. The Phenolic Fraction of Italian Extra Virgin Olive Oils: Elucidation Through Combined Liquid Chromatography and NMR Approaches. Food Anal. Methods 2019, 12, 1759–1770. [Google Scholar] [CrossRef]
- Angilè, F.; Coco, L.D.; Girelli, C.R.; Calò, F.; Mazzi, L.; Fanizzi, F.P.; Vivaldi, G.A.; Camposeo, S. Proton Nuclear Magnetic Resonance (1H NMR) Metabolic Profiles Discriminate Two Monovarietal Extra Virgin Olive Oils, Cultivars Arbequina and Koroneiki, with Different Geographical Origin. Horticulturae 2023, 9, 66. [Google Scholar] [CrossRef]
- Dugo, G.; Rotondo, A.; Mallamace, D.; Cicero, N.; Salvo, A.; Rotondo, E.; Corsaro, C. Enhanced Detection of Aldehydes in Extra-Virgin Olive Oil by Means of Band Selective NMR Spectroscopy. Phys. A Stat. Mech. Its Appl. 2015, 420, 258–264. [Google Scholar] [CrossRef]
- Rastrelli, F.; Schievano, E.; Bagno, A.; Mammi, S. NMR quantification of trace components in complex matrices by band-selective excitation with adiabatic pulses. S. Magn. Reson. Chem. 2009, 47, 868–872. [Google Scholar] [CrossRef] [PubMed]
- Savorani, F.; Tomasi, G.; Engelsen, S.B. icoshift: A versatile tool for the rapid alignment of 1D NMR spectra. J. Magn. Res. 2010, 202, 190–202. [Google Scholar] [CrossRef]
- Rotondo, A.; Mannina, L.; Salvo, A. Multiple Assignment Recovered Analysis (MARA) NMR for a Direct Food Labeling: The Case Study of Olive Oils. Food Anal. Methods 2019, 12, 1238–1245. [Google Scholar] [CrossRef]
- Trygg, J.; Wold, S. Orthogonal Projections to Latent Structures (O-PLS). J. Chemom. 2002, 16, 119–128. [Google Scholar] [CrossRef]
- Eriksson, L.; Trygg, J.; Wold, S. CV-ANOVA for Significance Testing of PLS and OPLS® Models. J. Chemom. 2008, 22, 594–600. [Google Scholar] [CrossRef]
- Piravi-Vanak, Z.B.; Ghasemi, J.B.; Ghavami, M.; Ezzatpanah, H.; Zolfonoun, E. J. Am. Oil Chem. Soc. 2012, 89, 371–378. [CrossRef]
- Rey-Giménez, R.; Sanchez-Gimeno, A.C. Effect of cultivar and environment on chemical composition and geographical traceability of Spanish olive oil. J. Am. Oil Chem. Soc. 2024, 101, 371–382. [Google Scholar] [CrossRef]
- Uncu, O.; Ozen, B. Importance of some minor compounds in olive oil authenticity and quality. Trends Food Sci. Technol. 2020, 100, 164–176. [Google Scholar] [CrossRef]
- Pianeta PSR. Available online: https://www.panetapsr.it/flex/cm/pages/ServeBLOB.php/L/IT/IDPagina/3012 (accessed on 15-01-2025).
- Lukić, M.; Lukić, I.; Moslavac, T. Sterols and Triterpene Diols in Virgin Olive Oil: A Comprehensive Review on Their Properties and Significance, with a Special Emphasis on the Influence of Variety and Ripening Degree. Horticulturae 2021, 7, 493. [Google Scholar] [CrossRef]
- Baldoni, L.; Cultrera, N.G.; Mariotti, R.; et al. A consensus list of microsatellite markers for olive genotyping. Mol. Breeding 2009, 24, 213–231. [Google Scholar] [CrossRef]
- Marchese, A.; Bonanno, F.; Marra, F.P.; Trippa, D.A.; Zelasco, S.; Rizzo, S.; Giovino, A.; Imperiale, V.; Ioppolo, A.; Sala, G.; Granata, I.; Caruso, T. Recovery and genotyping ancient Sicilian monumental olive trees. Front. Conserv. Sci. 2023, 4, 1206832. [Google Scholar] [CrossRef]
Figure 1.
The 1H{13C} (Experiment I), 1H{13C} multi-presaturated over main signals (Experiment II) and the 8.5-10.5 ppm band selective 1H experiments (Experiment III) are combined into just one trace called RICC-NMR keeping the most worthed information on any interesting region.
Figure 1.
The 1H{13C} (Experiment I), 1H{13C} multi-presaturated over main signals (Experiment II) and the 8.5-10.5 ppm band selective 1H experiments (Experiment III) are combined into just one trace called RICC-NMR keeping the most worthed information on any interesting region.
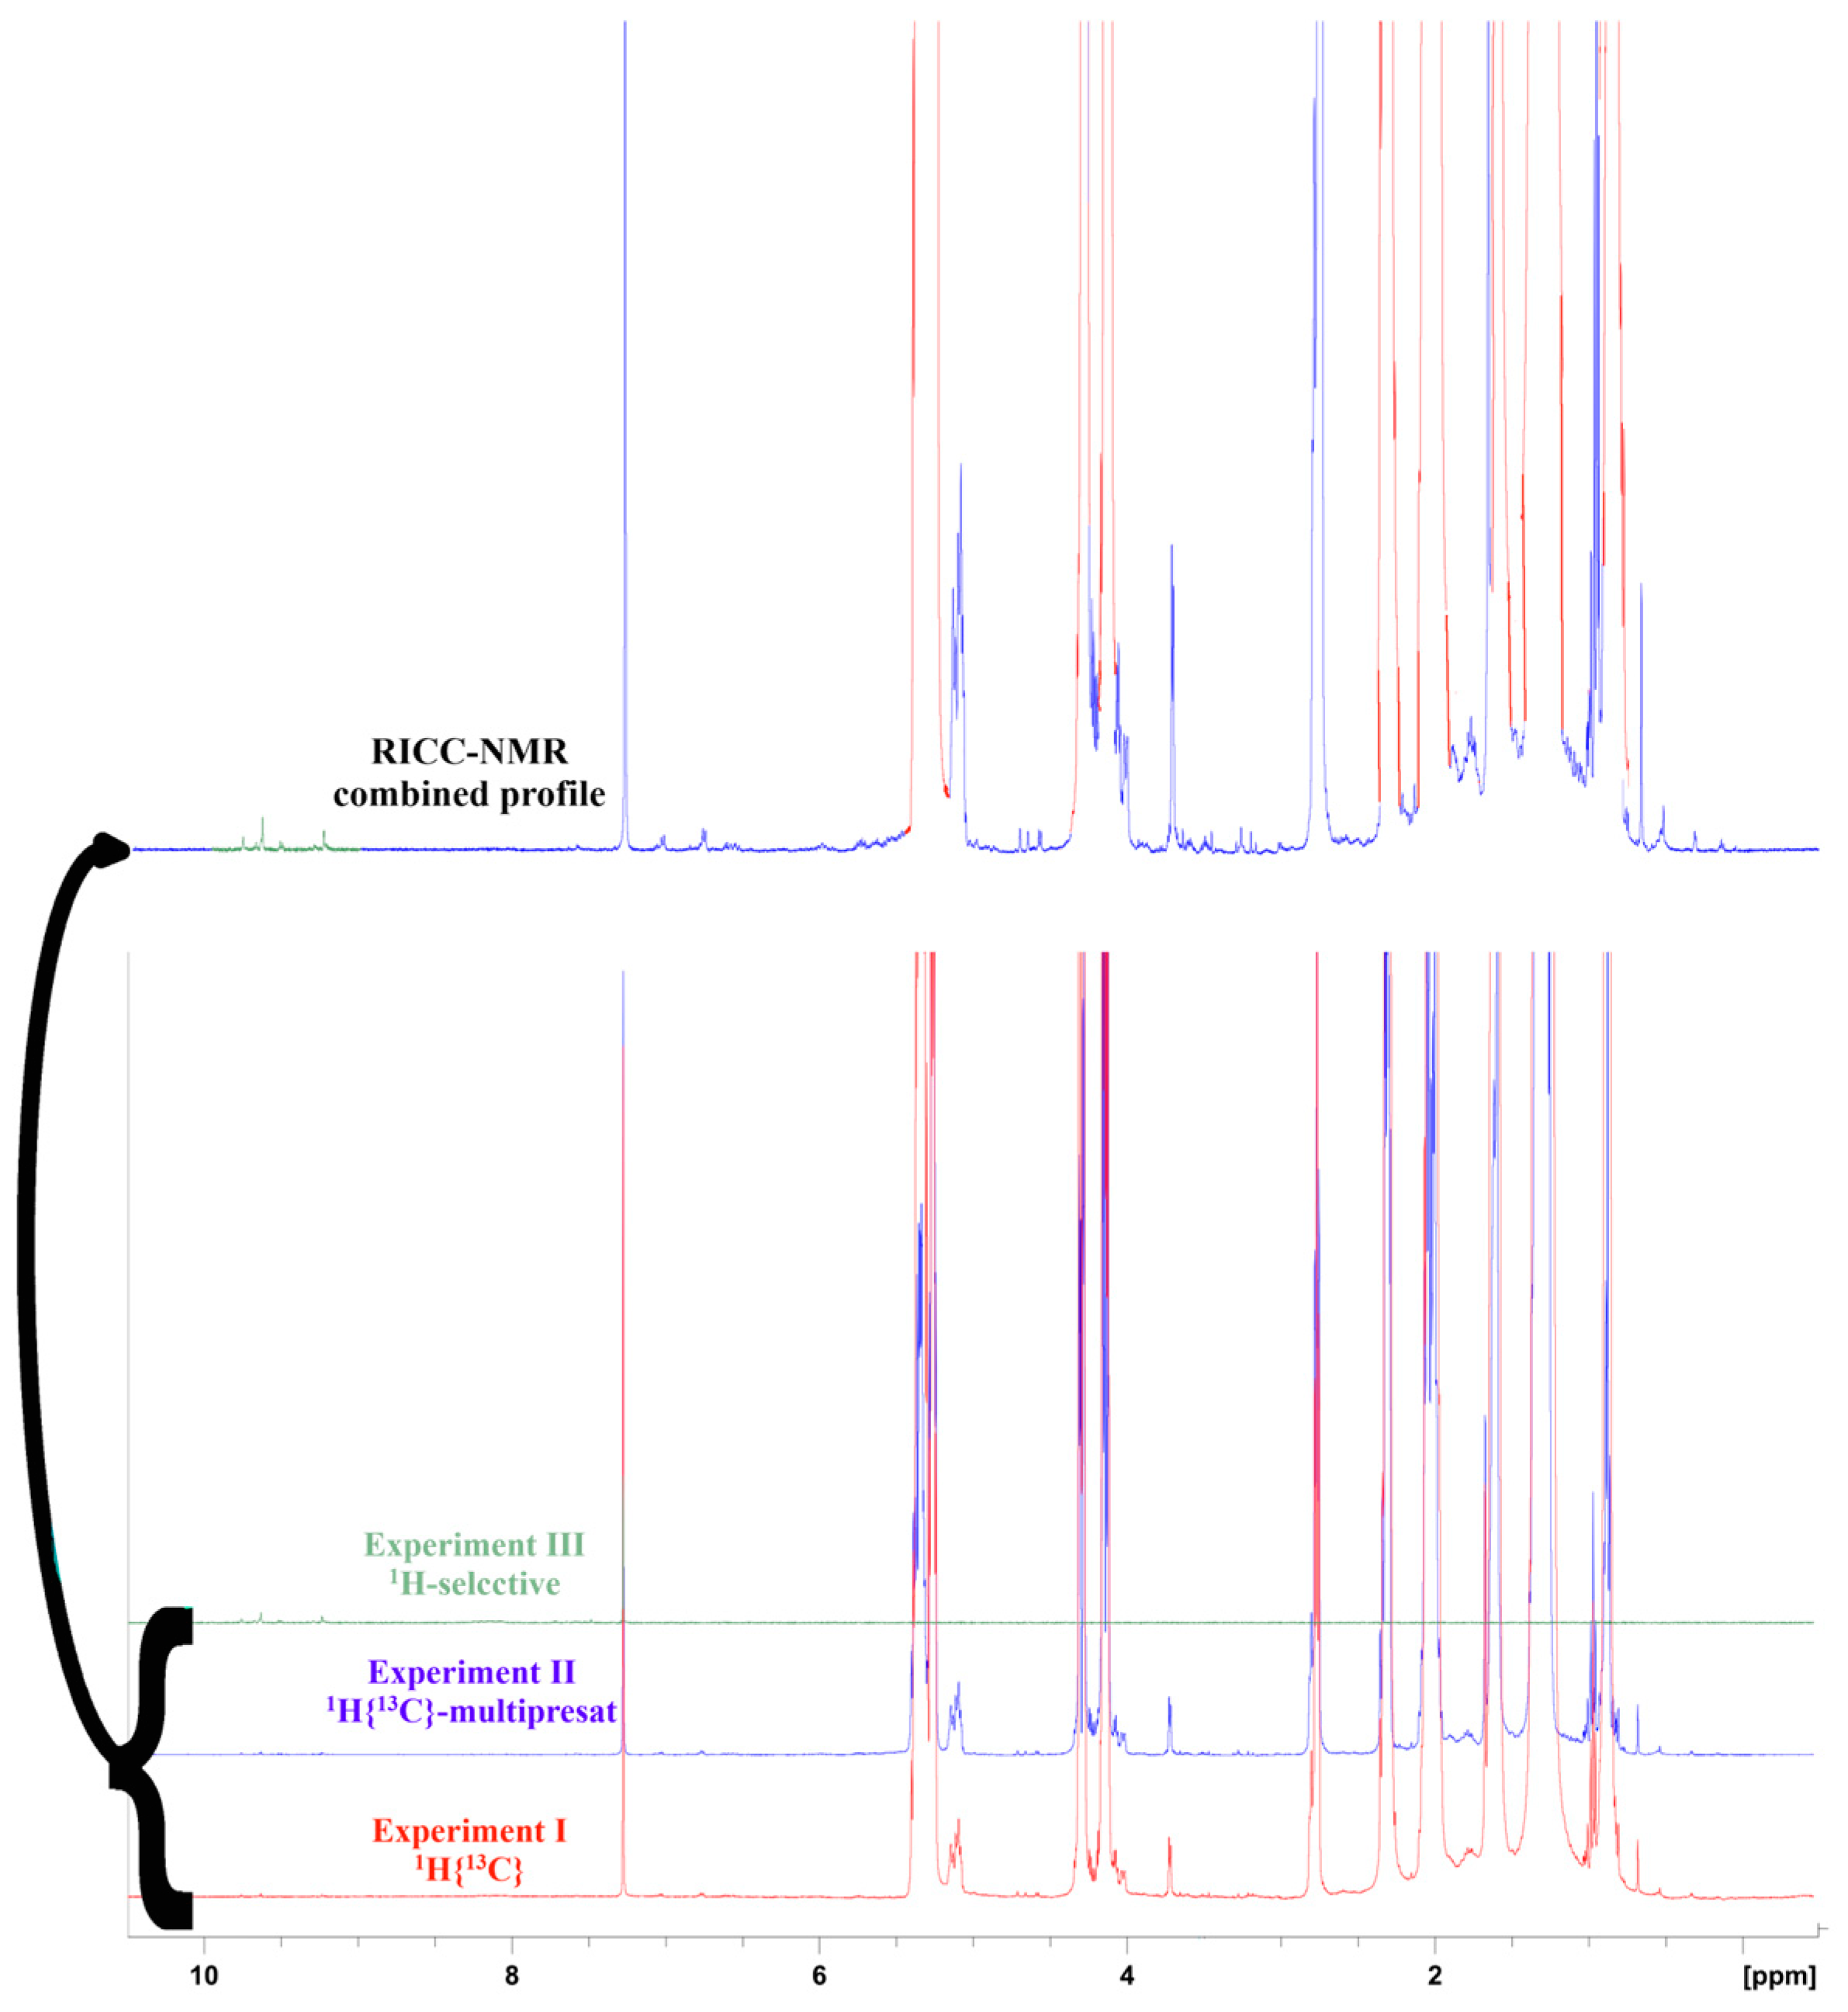
Figure 2.
Statistical graphs: (a) PCA (Principal Component Analysis) plot was performed for exploratory purposes and outliers’ recognition. The plot shows a promising clustering trend. (b) OPLS-DA plot model successfully able to discriminate samples of different origins; (c) VIP Variable Importance of Model; (d) Permutation plot.
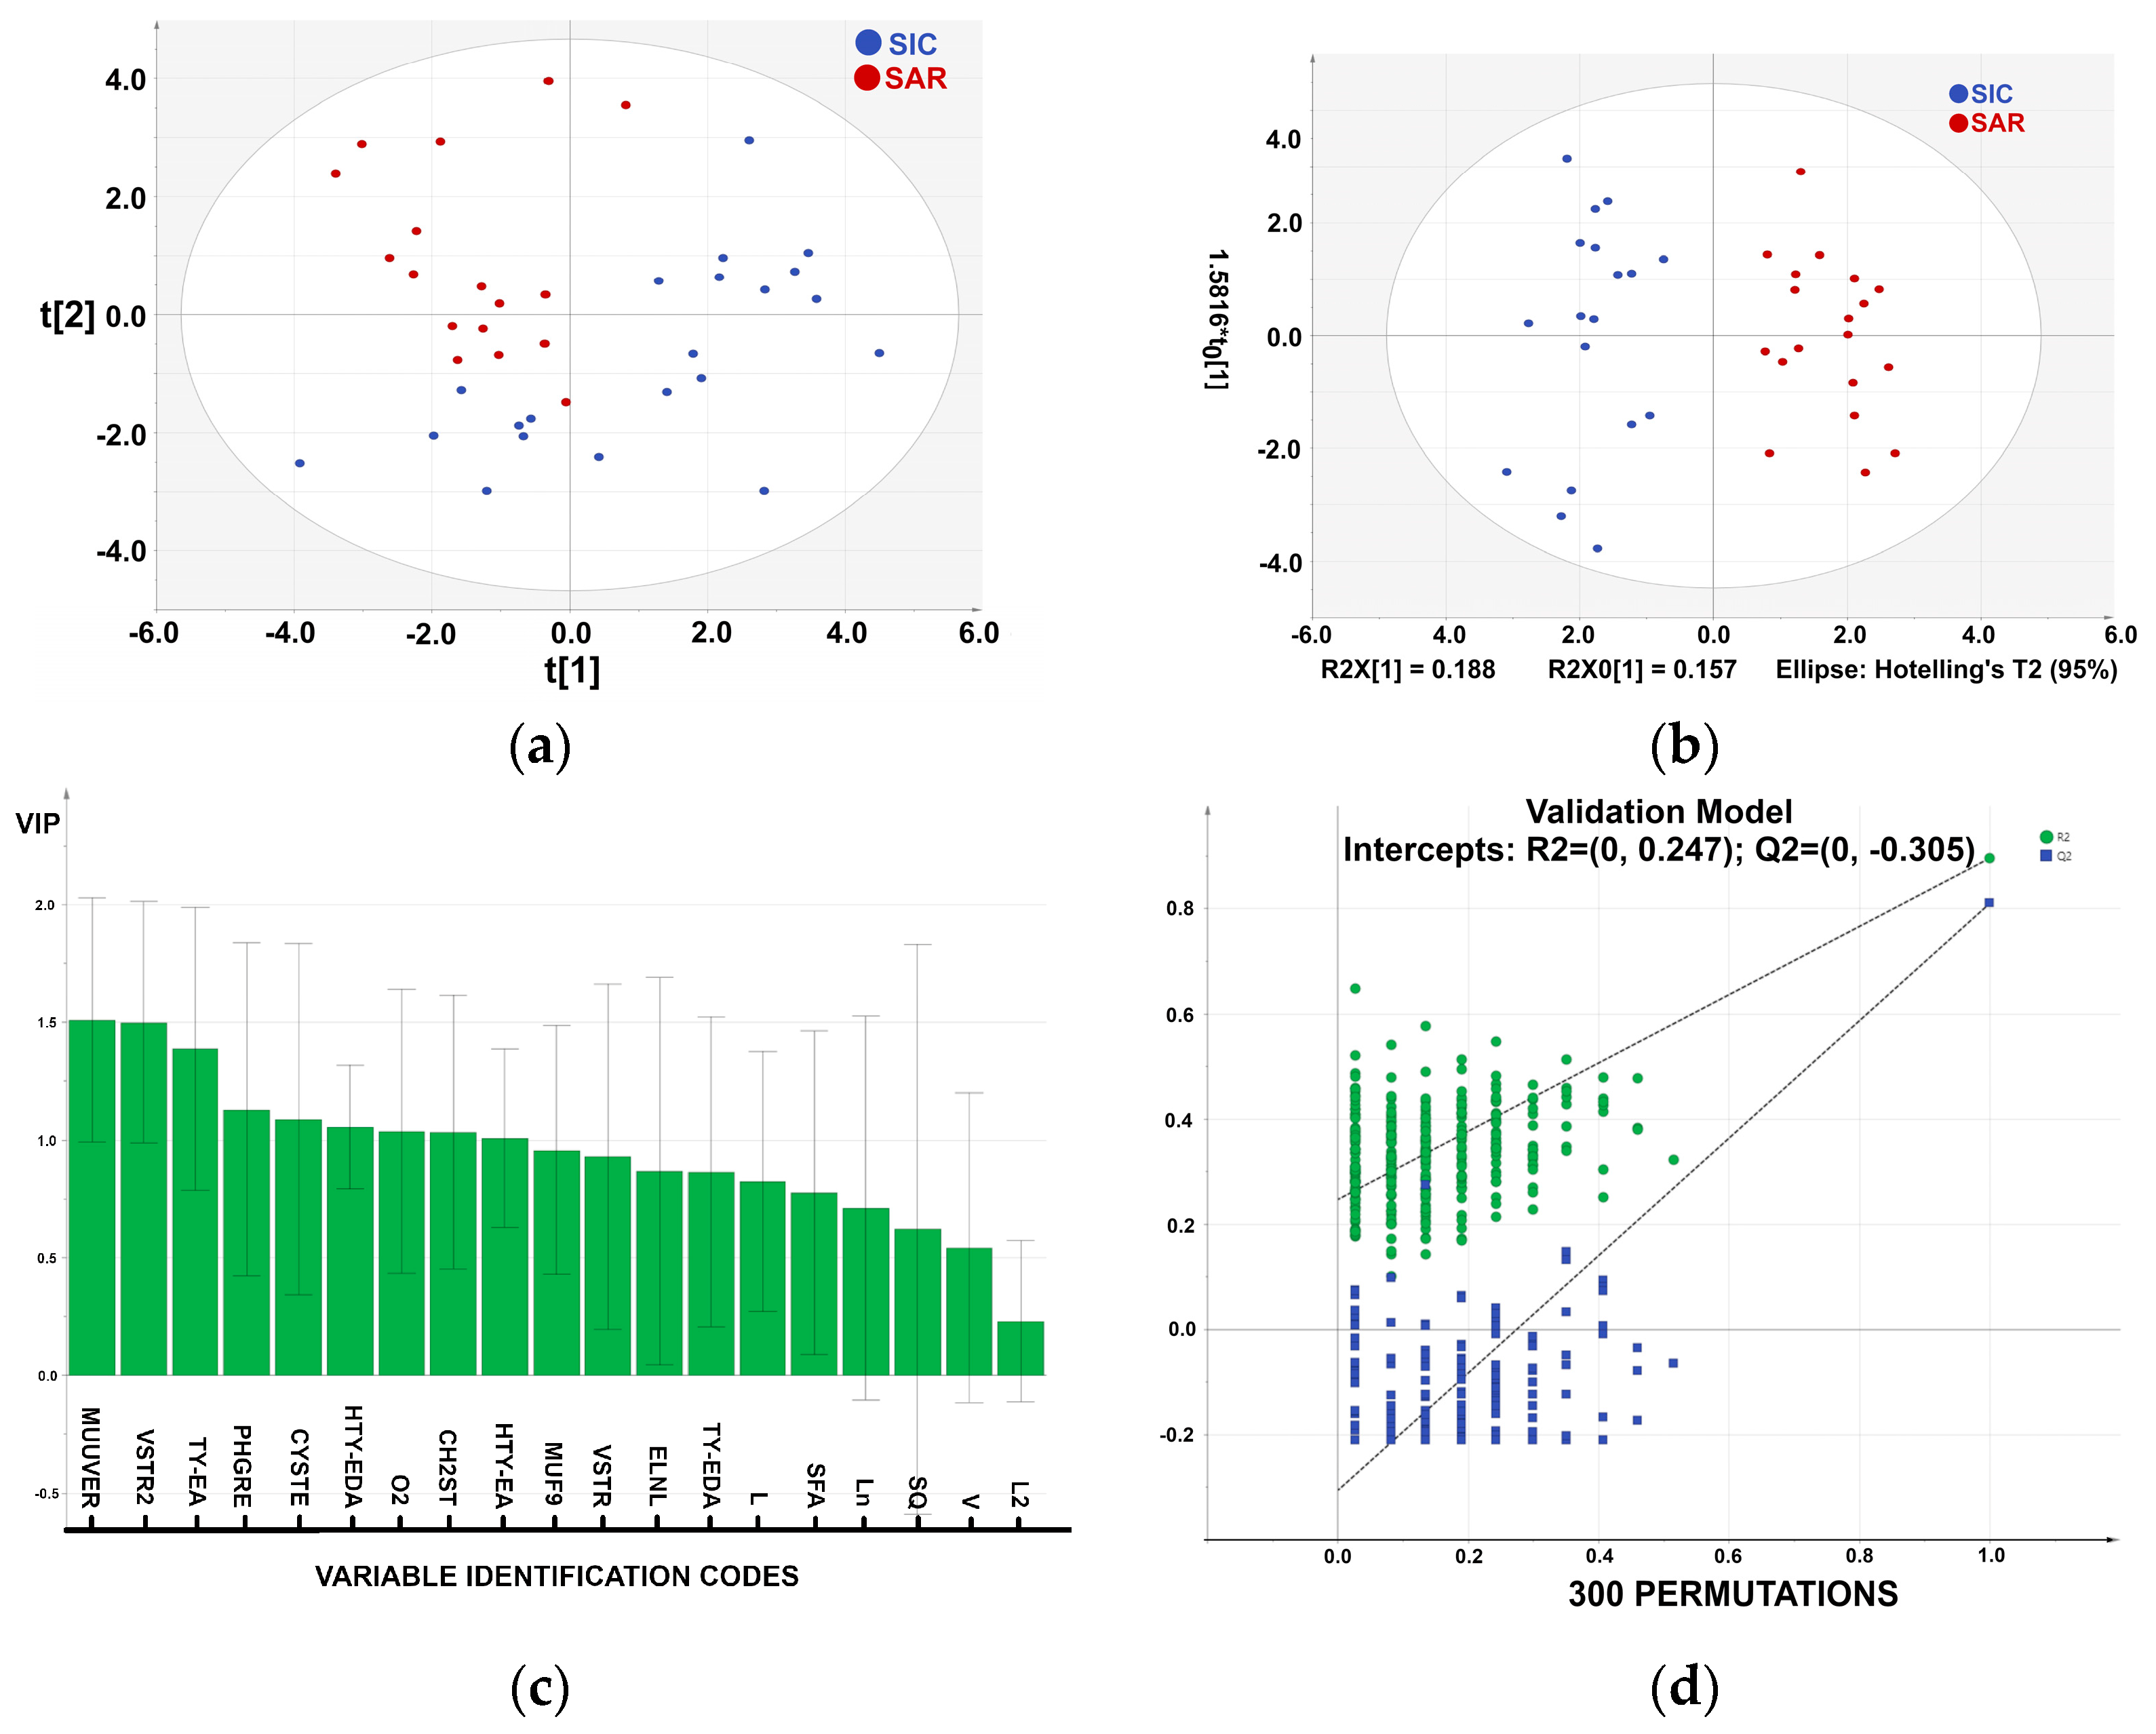

Table 1.
The chemical name and quantification unit for the nineteen components used, with their abbreviation code, measured mean value, and relative standard deviation.
Table 1.
The chemical name and quantification unit for the nineteen components used, with their abbreviation code, measured mean value, and relative standard deviation.
| Quantified Compound(s) (units) | Code | Average values | SD | |
| Squalene (mol ppm) | SQ | 1514.994 | 398.483 | |
| Linolenate esters (%) | Ln | 0.745 | 0.098 | |
| Linoleate esters (%) | L | 9.856 | 1.245 | |
| Oleate and Palmitoleate esters (%) | MUF9 | 66.291 | 3.089 | |
| cis-Vaccenate esters (%) | V | 3.765 | 0.546 | |
| Palmitate and Stearate esters (%) | SFA | 19.343 | 2.344 | |
| 2-Glyceril Linoleate esters (%) | L2 | 4.743 | 0.588 | |
| 2-Glyceril Oleate esters (%) | O2 | 26.111 | 1.190 | |
| β-Sitosterol, Δ5-Avenasterol, Δ5-Campesterol (mol ppm) |
VSTR | 2503.748 | 335.051 | |
| Cycloeucalenol, 24-Methylene Cycloartenol, Gramisterol (mol ppm) | CH2ST | 842.772 | 390.310 | |
| Esters of Cycloartenol, 24-Methylene Cycloartenol and Cyclobranol (mol ppm) | CYSTE | 618.625 | 235.650 | |
| Citrostadienol, Δ7-Avenasterol, Δ7-Campesterol (mol ppm) | VSTR2 | 479.817 | 115.195 | |
| Maslinic and Urosolic acid, Uvaol and Erythrodiol (mol ppm) | MUUVER | 1664.113 | 415.099 | |
| Phytol and Geranylgeraniol esters (mol ppm) | PHGRE | 410.641 | 159.199 | |
| Oleocanthal (mol ppm) | TY-EDA | 397.855 | 201.281 | |
| Olaceine (mol ppm) | HTY-EDA | 252.839 | 166.735 | |
| Ligustroside aglycone (all the derivates) (mol ppm) | TY-EA | 163.956 | 150.862 | |
| Oleuropein aglycone (all the derivates) (mol ppm) | HTY-EA | 116.228 | 105.437 | |
| Elenolide (mol ppm) | ELNL | 54.802 | 170.958 |
Table 2.
The misclassification test summarizes the number of observations with known class memberships that were correctly classified in class or PLS-DA models. All samples are correctly classified.
Table 2.
The misclassification test summarizes the number of observations with known class memberships that were correctly classified in class or PLS-DA models. All samples are correctly classified.
| Members | Correct | SIC | SAR | |
| SIC | 18 | 100% | 18 | 0 |
| SAR | 19 | 100% | 0 | 19 |
| Total | 37 | 100% | 18 | 19 |
| Fisher’s prob. | 5.7e-011 |
Disclaimer/Publisher’s Note: The statements, opinions and data contained in all publications are solely those of the individual author(s) and contributor(s) and not of MDPI and/or the editor(s). MDPI and/or the editor(s) disclaim responsibility for any injury to people or property resulting from any ideas, methods, instructions or products referred to in the content. |
© 2025 by the authors. Licensee MDPI, Basel, Switzerland. This article is an open access article distributed under the terms and conditions of the Creative Commons Attribution (CC BY) license (http://creativecommons.org/licenses/by/4.0/).
Copyright: This open access article is published under a Creative Commons CC BY 4.0 license, which permit the free download, distribution, and reuse, provided that the author and preprint are cited in any reuse.


