Submitted:
24 March 2025
Posted:
24 March 2025
You are already at the latest version
Abstract
In supply chain management, the accuracy of demand forecasting is essential to optimize inventory and improve operational efficiency. However, there are often outliers in the demand data (such as sudden demand changes or human error) that, if not effectively addressed, can seriously interfere with the forecasting model. This study discusses how to improve the accuracy of supply chain demand forecasts by anomaly detection and treatment. The IQR is used to detect and smooth the abnormal demand data, and the demand prediction model is used to correct it. The experimental results show that the accuracy of demand prediction after smoothing is improved, especially when the demand changes and fluctuations are captured. KPI analysis shows that the prediction model after anomaly detection is better than the unprocessed data on RMSE and MAE indicators. This method provides an effective solution for demand forecasting for dealing with large fluctuations or abnormal data and can optimize supply chain management decisions.
Keywords:
Machine Learning
; supply chain
; prediction accuracy
1. Introduction
Since 2020, with the soaring demand for online shopping, home improvement, home entertainment, and more, the supply chain has been stretched, resulting in shortages, delivery delays, and lost items. According to economist John Rutledge, the coronavirus pandemic will continue to affect all areas of the global supply chain until 2023 [1]. Supply chain managers are under unprecedented pressure to improve processes and shorten decision cycles while handling massive amounts of data. However, the complexity and scale of supply chain data can lead to high signal-to-noise ratios, making it difficult for decision-makers to capture useful information accurately. In this context, anomaly detection using AI technology is critical to help supply chain managers quickly identify abnormal behavior, optimizing supply chain resilience and improving customer satisfaction.
Supply chains manage thousands of global transactions every day and need to be highly adaptable to changes in internal and external pressures. By identifying anomalies in the data, anomaly detection technology can effectively locate and resolve issues such as order volume, delivery time, pricing, and upstream transaction performance, thereby providing comprehensive support for supply chain management. For example, order volume anomalies often occur during promotional events, which can lead to a sharp increase in demand for certain long-tail items, thus accelerating inventory depletion [2]. Similarly, delivery anomalies can occur due to inconsistent distribution times, while pricing anomalies can result from abnormal fluctuations in vendor-specific SKU prices.
In addition, upstream transaction performance anomalies are a common challenge in the supply chain. The fulfillment of transactions in online trading systems can be affected by network delays, system failures, and other issues, thus dragging down supply chain efficiency. To solve this problem, anomaly detection and prediction models based on large-scale time series data can provide forward-looking solutions for enterprises. These models capture anomalies in real-time and predict potential risks, helping companies optimize supply chain resource allocation and improve overall operational efficiency. This paper focuses on constructing an anomaly detection and prediction model based on large-scale time series data, aiming to help enterprises find and solve the key anomaly problems in the supply chain in real-time. Through the integrated application of AI technologies, this paper provides innovative solutions for optimizing supply chain decision-making to improve operational efficiency and resilience.
2. Related Work
1.1. Traditional Supply Chain Anomaly Detection
Traditional supply chain anomaly detection methods mainly rely on rule-driven techniques and statistical analysis. These methods detect anomalies by setting predefined rules or statistical patterns based on historical data. For example, threshold-based rules can be used to flag anomalies in order volumes, delivery times, or inventory levels, while regression analysis and time series models are used to capture deviations in data trends. These methods play an important role in supply chain operations but cannot often deal with the complexity and dynamics of modern supply chain data, especially in environments where data volumes are large and frequently changing.
Ana E. Glaser, Jake P. Harrison, and David Joseph, et al., explore the use of anomaly detection techniques to improve supply chain data quality and operational efficiency. Their research highlights how the complexity, diversity, and quality of supply chain data can significantly impact an organization’s financial performance and customer satisfaction. By developing accurate anomaly detection methods, we can effectively identify and process abnormal data that may affect supply chain operations, thereby reducing operational disruptions and revenue losses caused by data errors [3].
This study analyzes in detail the application, advantages, and disadvantages of three main anomaly detection methods - unsupervised, supervised, and semi-supervised - in supply chain scenarios. Unsupervised methods are suitable for processing data that lacks labels but may assume data schema consistency; Some monitoring methods rely on labeled data but are limited by the accuracy of unbalanced data. Semi-supervised methods show higher sensitivity by focusing on deviations from normal data. The study further points out that the integrated approach using unsupervised and semi-supervised techniques can significantly improve the overall performance of anomaly detection, providing strong support for supply chain data management and optimization.
2.1. Impact of Digitization and Machine Learning on Supply Chain Anomaly Detection
Liu, H., Li, N et al. studied the interaction between supply chain digitization and environmental technology development and analyzed the impact of inflation and consumption on supply chain operation efficiency in G7 countries. Research has shown that digital supply chains can promote environmental technology research and development by enhancing transparency and data analysis capabilities and improving resource efficiency [4]. However, inflation and the dynamics of consumer behavior have also increased the uncertainty of supply chain operations. In the context of large-scale time series data, supply chain anomaly detection and prediction models can provide support for addressing these challenges by accurately identifying abnormal data, optimizing supply chain operations, and providing a more stable foundation for the development of environmental technologies.
In addition, Gong, C., Zhong, Y, et al. studied the application of machine learning technology based on unstructured data in the prediction of extreme volatility in financial markets, demonstrating the advantages of machine learning in dealing with complex dynamic data. This study highlights the importance of using advanced models to process nonlinear and non-stationary data and is highly aligned with the core concepts of supply chain anomaly detection and prediction. Large-scale time series data in supply chain management is also highly complex and dynamic [5]. Through machine learning technology, abnormal fluctuations in the data can be accurately captured to provide support for supply chain optimization decisions and reduce operational risks caused by anomalies.
2.3. Analysis and Clustering of Large-Scale Time Series Data
The analysis and processing of large-scale time series data is an important field in modern data science, especially in supply chain anomaly detection and prediction. Ding et al. (2015) proposed a fast-clustering algorithm named “Yading”, which aims to deal with the clustering problem of large-scale time series data. By using efficient algorithm design, this method realizes fast clustering of large-scale data sets with low computational complexity and high processing efficiency [6]. When processing high-dimensional time series data, Yading can effectively reduce the consumption of computing resources and maintain high clustering quality in the face of data noise and missing values.
The core advantage of this method is that it can cluster large-scale data efficiently in a short period, which is of great significance for supply chain anomaly detection. The cluster analysis of the time series data in the supply chain allows abnormal behavior in different supply chain modes to be quickly identified, such as abnormal inventory, order fluctuation, and delivery delay. Therefore, the clustering method based on the Yading algorithm not only improves the speed of data processing but also provides important support for supply chain optimization.
With the development of big data and artificial intelligence technologies, the analysis methods for large-scale time series data are also evolving, especially in the field of supply chain. By utilizing massively parallel processing and distributed storage, AI technology can efficiently process massive time series data and realize real-time monitoring and prediction of complex supply chain dynamics. [7]. For example, deep learn-based models such as Transformer and LSTM show significant advantages in capturing long-term dependencies and complex patterns in time series data.
Case studies show that the application of these technologies in the supply chain can effectively identify abnormal behavior, predict potential risks, and optimize decision support, greatly improving the efficiency and flexibility of the supply chain. However, the current research is still faced with limitations such as insufficient adaptability to complex scenarios, insufficient real-time support, and lack of in-depth exploration of anomaly root cause analysis. The innovation of this paper lies in the combination of more advanced deep learning models (such as Transformer and LSTM). To provide more intelligent and automated decision support for supply chain anomaly detection and prediction.
3. Methodology
Real-time data stream processing technology mainly includes data collection, data processing, data storage, and data analysis. Data collection usually involves the data collection of various devices and systems, such as log collection and monitoring collection. Data processing is to clean, transform, and filter the collected data to facilitate subsequent analysis and processing. Data storage is to save the processed data to a database or other storage system [8]. Data analysis is the mining and analysis of stored data to find hidden patterns and rules.
Anomaly detection and early warning systems play a crucial role in data analysis and consist of the following steps:
- Data preprocessing: Cleaning, transforming, and filtering raw data for effective anomaly detection.
- Anomaly detection: Identifying abnormal behavior in processed data using various algorithms or rules.
- Early warning: Notifying relevant personnel or systems of detected anomalies to facilitate timely corrective actions.
In practical applications, anomaly detection and early warning can be applied to various fields, such as finance, e-commerce, network security, Internet of Things, etc. For example, in the field of IoT, anomaly detection can be used to identify equipment failures.
3.1. Algorithm Principle and Mathematical Formula
3.1.1. Z-Value
The Z-value method is a statistical approach that identifies anomalies by measuring the deviation of data points from the mean. The formula is:
Where:
- X is the data point,
- μ is the mean,
- σ is the standard deviation.
If exceeds a threshold (typically 3 or 4), the data point is considered an anomaly.
Interquartile Range (IQR) Method
The IQR method detects anomalies based on quartiles. The formula is [9]:
IQ2=Q3-Q1
A data point X is considered an anomaly if:
X < Q1 − 1.5 × IQR or X > Q3 + 1.5 × IQR
Where:
- Q1 is the first quartile,
- Q2 is the third quartile.
Although the IQR method is widely used, it primarily works well for moderate outliers and may not be effective for extreme outliers or highly skewed data distributions. To address this limitation, other techniques such as Z-scores, Isolation Forest, or DBSCAN clustering can be explored. A comparative analysis of these methods could further highlight the advantages and constraints of the IQR approach.
3.1.2. DBSCAN Clustering Method
The Density-Based Spatial Clustering of Applications with Noise (DBSCAN) method is effective in identifying outliers in complex datasets. It groups data points into clusters based on density and labels points in low-density regions as anomalies.
Key parameters:
- ε (epsilon): Defines the neighborhood radius.
- MinPits: Minimum number of points required to form a dense region.
A point P is classified as an anomaly if it does not belong to any cluster, meaning it is a noise point in the dataset.
3.2. Regular Method
3.2.1. Fixed Threshold Method
The fixed threshold method is a rule-based anomaly detection method, which identifies anomalies by setting a fixed threshold. The formula for the fixed threshold method is as follows:
if X > T or X < T, then X is an anomaly
Where X is the data point and T is the fixed threshold.
3.2.2. Clustering Method
The clustering method is a rule-based anomaly detection method that identifies anomalies by dividing data points into multiple clusters. The formula of the clustering method is as follows:
if X is not in any cluster, then X is an anomaly
Where X is the data point and cluster is the cluster.
3.3. The Difference Between Anomaly Detection and Early Warning
Anomaly detection and early warning are two important links of anomaly detection, and their differences mainly lie in:
- Anomaly detection refers to the process of identifying abnormal behavior in data through some algorithm or rule. The purpose of anomaly detection is to find out the different or inconsistent behavior compared with the normal behavior, to conduct subsequent early warning processing.
- Early warning refers to the process of alerting the identified abnormal behavior to the relevant person or system. The purpose of early warning is to remind relevant personnel or systems through alarm information so that appropriate measures can be taken to deal with abnormal behavior.
3.4. Application Scenarios of Anomaly Detection and Early Warning [11]
Anomaly detection and early warning systems are widely applied in various fields, including:
- Finance: Fraud detection, market volatility monitoring, credit risk assessment.
- Network security: Identifying cyberattacks, malware, and network anomalies.
- Manufacturing and logistics: Detecting equipment failures, inventory shortages, and supply chain disruptions.
- Healthcare: Disease diagnosis, medical resource allocation, and case management.
- Transportation: Identifying traffic congestion, cargo damage, and route deviations.
3.5. The Challenge of Anomaly Detection and Early Warning
The challenges of anomaly detection and early warning include:
- Data quality and integrity: Anomaly detection and early warning require high-quality and complete data, but there may be problems in the actual data such as missing, errors, and noise, which will affect the effect of detection and early warning.
- Algorithm complexity and efficiency: anomaly detection and early warning require efficient algorithms, but the complexity of the algorithm in practice may affect the real-time and accuracy.
- Model update and maintenance: Anomaly detection and early warning require regular updates and maintenance of the model to adapt to changing application scenarios and data characteristics.
- Human intervention and collaboration: Anomaly detection and early warning require human intervention and collaboration to ensure the effectiveness and timeliness of early warning.
4. Experiment and Conclusions
In time series analysis, outliers are data points that deviate significantly from other observations, often affecting the performance of a predictive model. In supply chain management, there are often anomalies in demand data, which may be caused by a variety of factors, such as human error, sudden changes in demand, a sharp drop in demand, or a short-term surge in demand caused by promotional activities. If these abnormal demands are not dealt with effectively in the demand forecast, the abnormal data will seriously interfere with the effect of the forecast model.
Impact on Forecasting: Short-Term vs. Long-TermWhile methods such as the IQR method can significantly improve short-term forecast accuracy by smoothing demand fluctuations, their impact on long-term predictions warrants closer consideration. Excessive smoothing may mask key trends or seasonal patterns that are essential for longer-term forecasting. In cases where there is a significant long-term growth or seasonal variability in demand, smoothing outliers could unintentionally distort these important trends. As such, a balance must be struck between improving short-term accuracy and preserving long-term forecasting reliability. Future research could explore methods to better preserve long-term patterns while addressing short-term anomalies.
Key challenges include:
- Defining and detecting anomalous demand.
- Effectively handling detected anomalies.
- Therefore, dealing with anomalies in demand becomes an important step to improve the accuracy of demand forecasting. Specifically, handling exceptional requirements involves two key issues [10]:
- How to define and detect abnormal requirements?
- How to deal with abnormal demand effectively after it is detected?
4.1. IQR Model
The Interquartile Range (IQR) method works well for detecting moderate outliers and is a reliable tool for anomaly detection in demand forecasting. However, it may struggle with extreme outliers or highly skewed data, especially in cases where demand surges occur, such as during promotions or unexpected events. In such instances, the IQR method may either fail to identify extreme outliers or smooth them out too aggressively, thereby distorting the underlying demand trend.
To address these issues, future work could explore combining the IQR method with other anomaly detection techniques, such as machine learning models like Isolation Forest or DBSCAN, which are better suited for handling highly skewed data or non-normal distributions. This hybrid approach could enhance the robustness of the anomaly detection process, allowing the method to adapt to varying levels of anomaly severity and different data distributions. Such an adaptive technique could be particularly valuable when dealing with demand surges or highly irregular data.
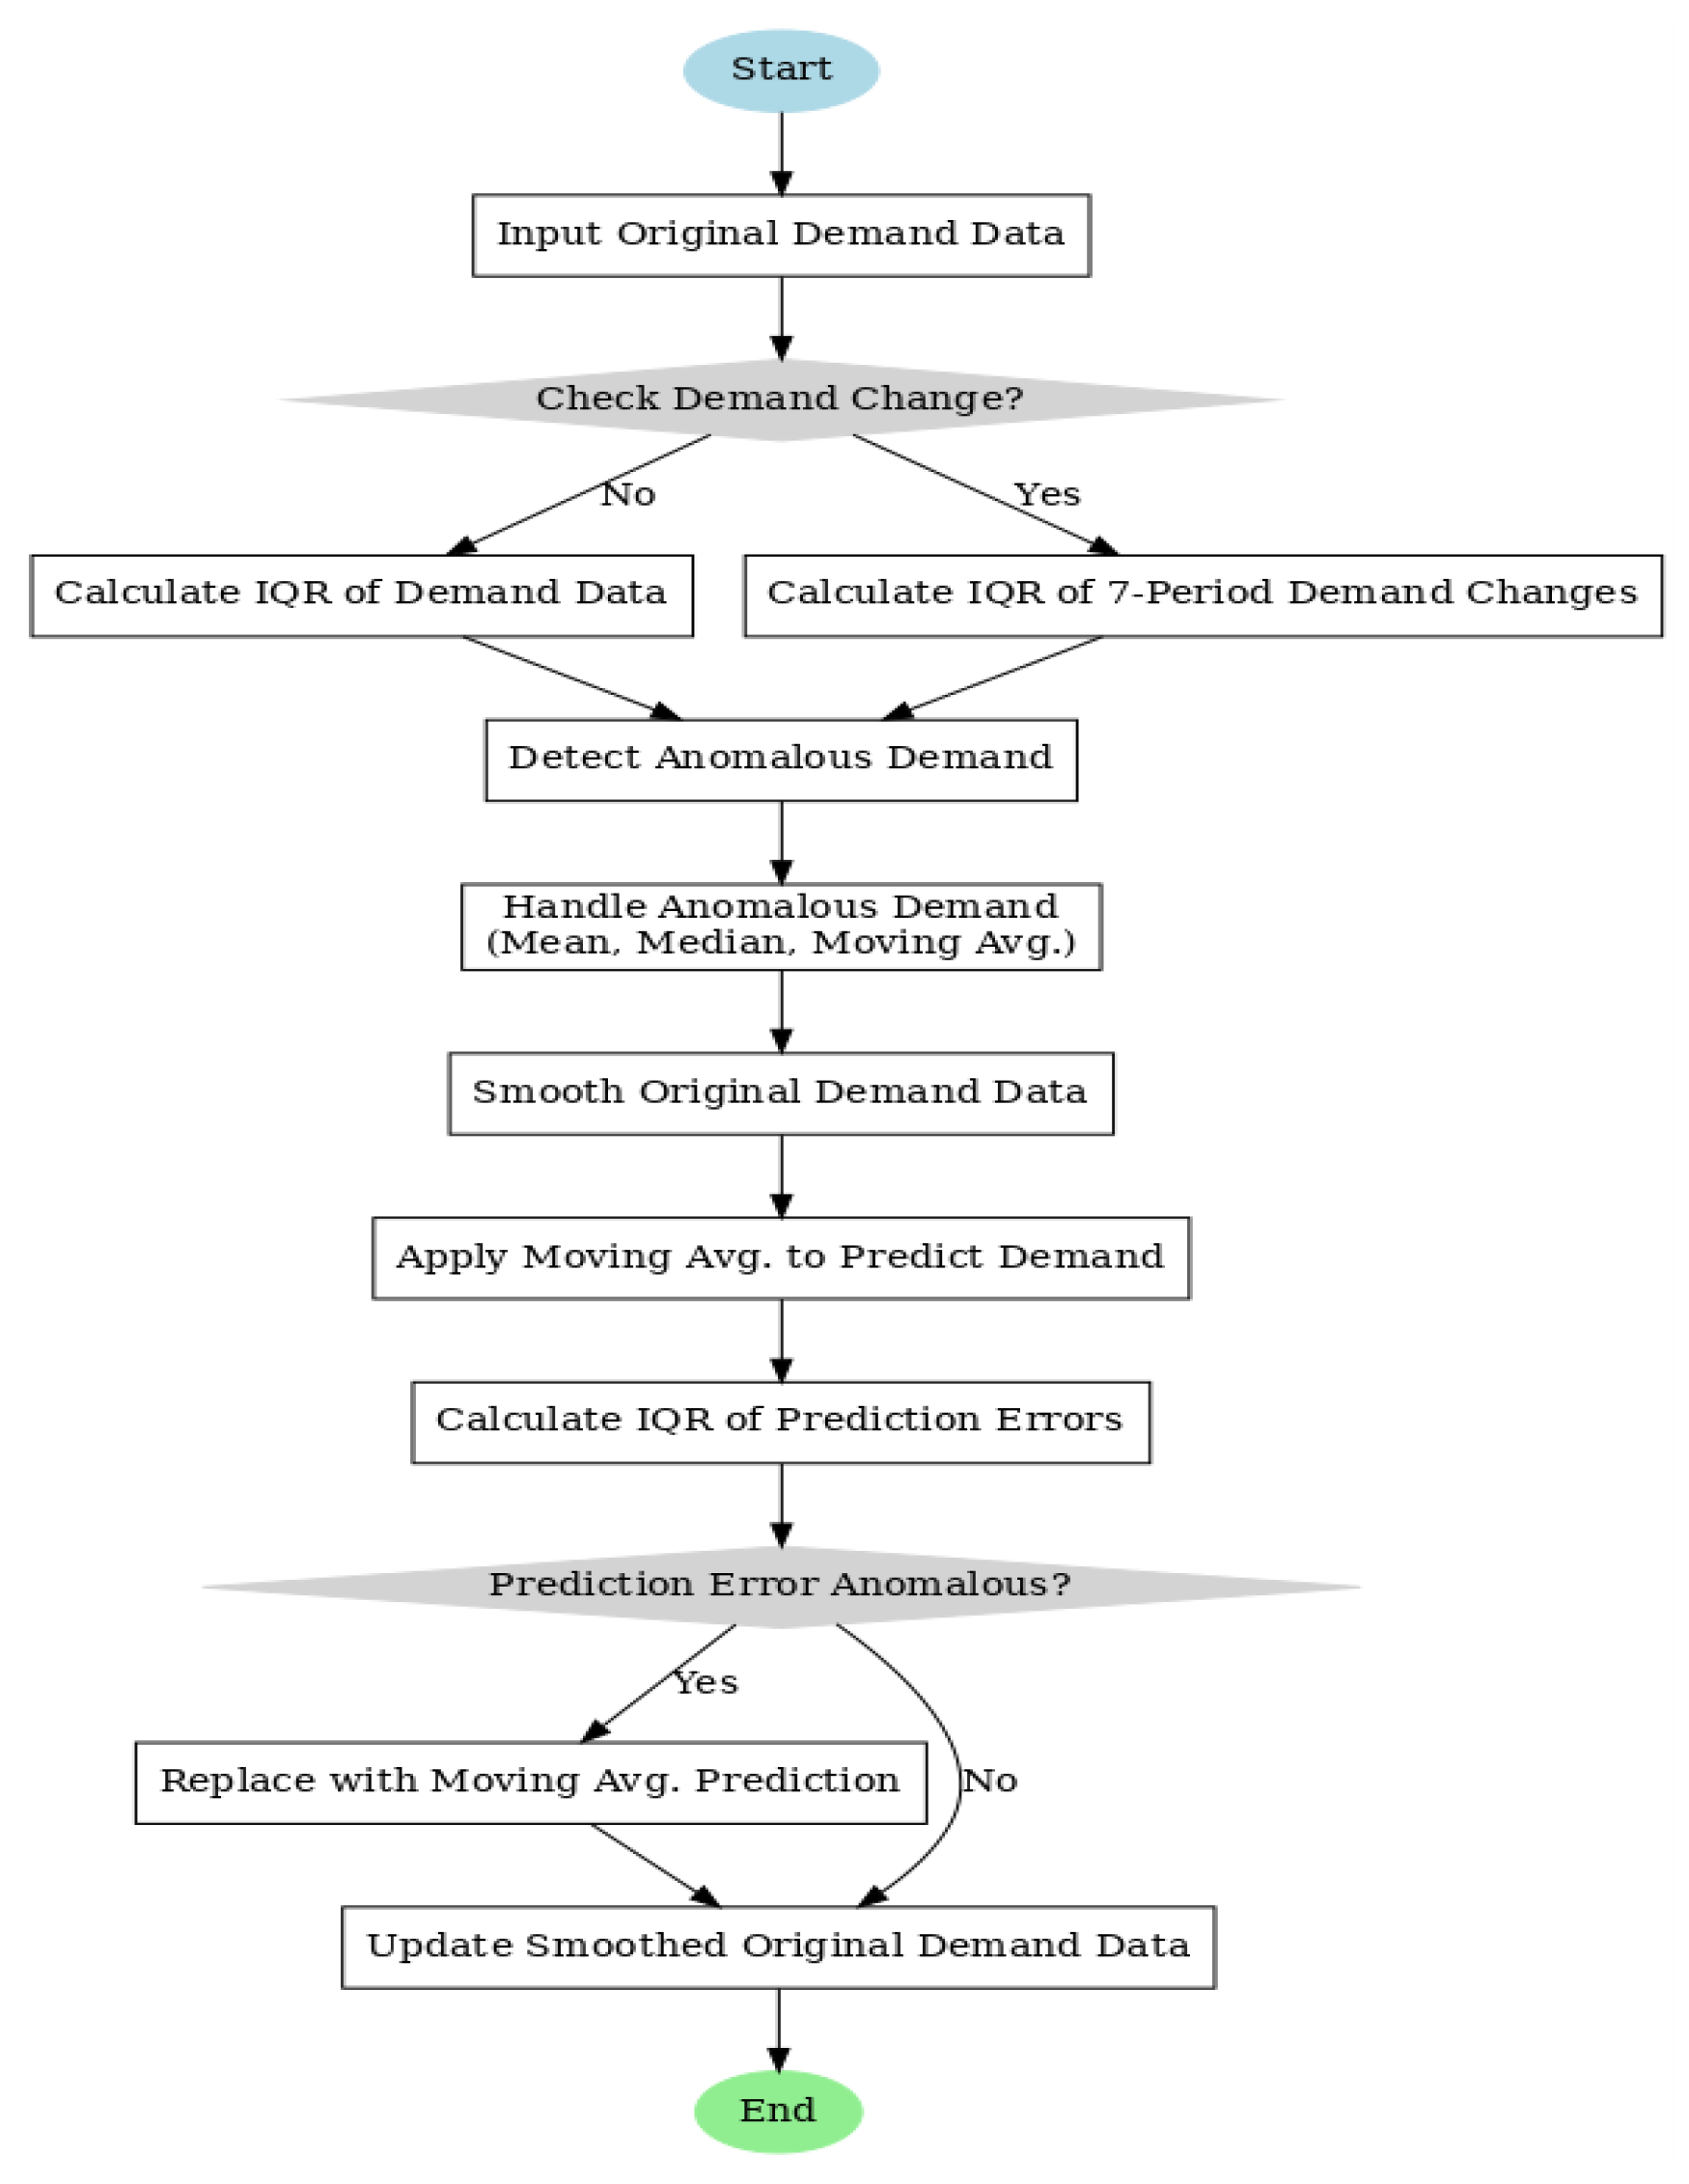
Combining the methods based on distribution and prediction, this paper proposes two abnormal demand detection and processing strategies:
- Use the IQR (quartile range) method to detect abnormal demand, smooth abnormal demand, and adjust it using mean, median, or moving average.
- The IQR method is used to detect the demand changes in the adjacent 7 periods, and the abnormal demand detected is smoothed.
For abnormal prediction errors detected, the corresponding demand value is replaced with the moving average forecast value, otherwise the original demand value is retained. By sorting the data and calculating the quartiles (Q1 and Q3), the IQR method determines the data points smaller than Q1-1.5*IQR or larger than Q3+1.5*IQR as outliers according to IQR=Q3-Q1, thus effectively detecting and processing the abnormal demand data.
Figure 1.
Supply chain abnormal demand detection and processing.
4.2. Abnormal Detection of Warehouse Requirement Data
In this experiment, we used the IQR method to detect anomalies in the weekly demand data of product B East China Warehouse and smoothed the anomalies. First, the demand_agg function was used to aggregate the original data by product, region, and time granularity. When the time granularity is selected as “week”, we perform abnormal detection on the demand. By setting the model argument to None, we detect the IQR exception directly on the “requirement”. The abnormal demand points detected are smoothed using the moving mean (ma).
Figure 2.
The demand curve for outliers.
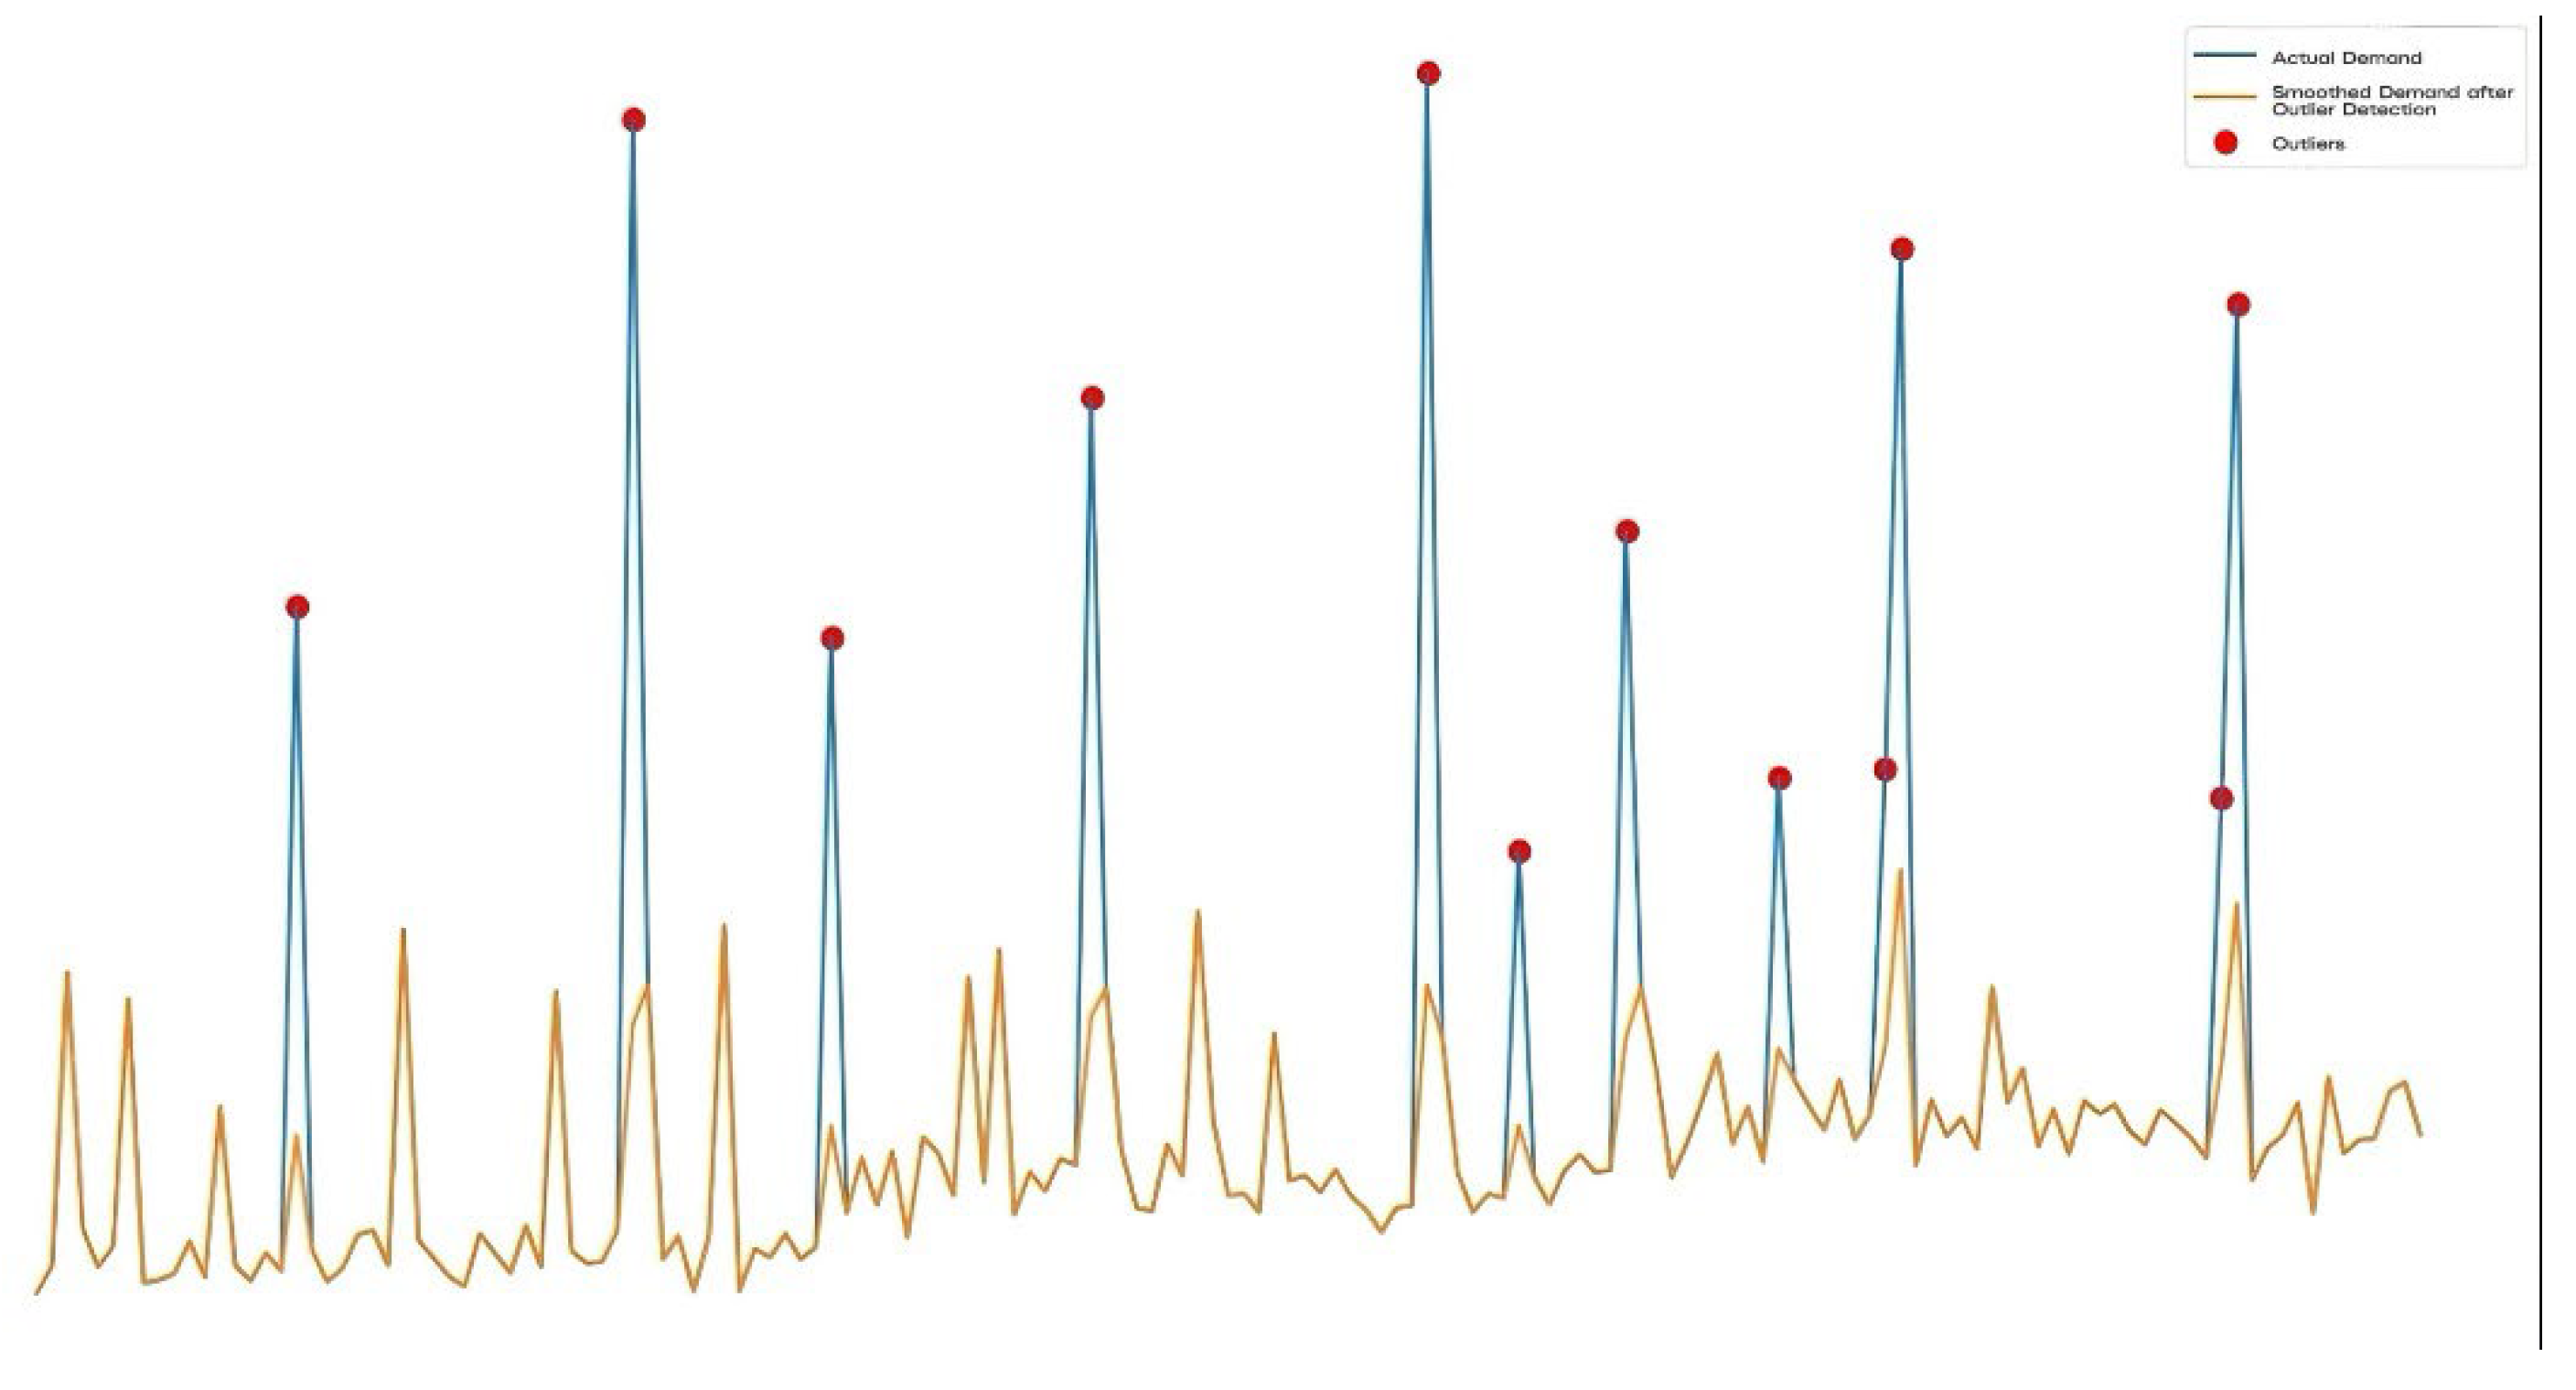
In graphical analysis, the blue line represents the raw demand data, the red dots represent the detected abnormal demand points, and the orange line represents the smoothed demand curve. In this way, we can see that the smoothed demand curve is significantly less volatile, reducing the impact of outliers on the overall trend. To further verify the effect of the anomaly detection method, we also conducted anomaly detection for “demand change” by setting the model parameter to diff. In this case, the anomaly detection still uses the IQR method, but the detection target is the amount of change in the requirement rather than the original requirement. This method can more accurately capture abnormal fluctuations in demand.
In this experiment, we applied the IQR method to detect and smooth outliers in the weekly demand data for Product B at the East China warehouse. The analysis involved two scenarios: one where we detected outliers in the original “demand” and smoothed them using a moving average, and another where we focused on detecting outliers in the “demand change” (the difference between consecutive periods). The results showed that, in the first case, the demand curve (actual demand) exhibited significant fluctuations due to outliers, while the smoothed demand curve after outlier treatment was much smoother, reflecting a more stable trend. In the second case, by detecting outliers in the demand change, we were able to identify and address sudden fluctuations more effectively, resulting in a smoother trend and reducing the impact of these irregular spikes. Both methods successfully reduced the volatility caused by outliers, but the “demand change” approach provided better detection for abrupt changes in demand patterns.
4.3. Demand Forecasting and Anomaly Detection Results Analysis
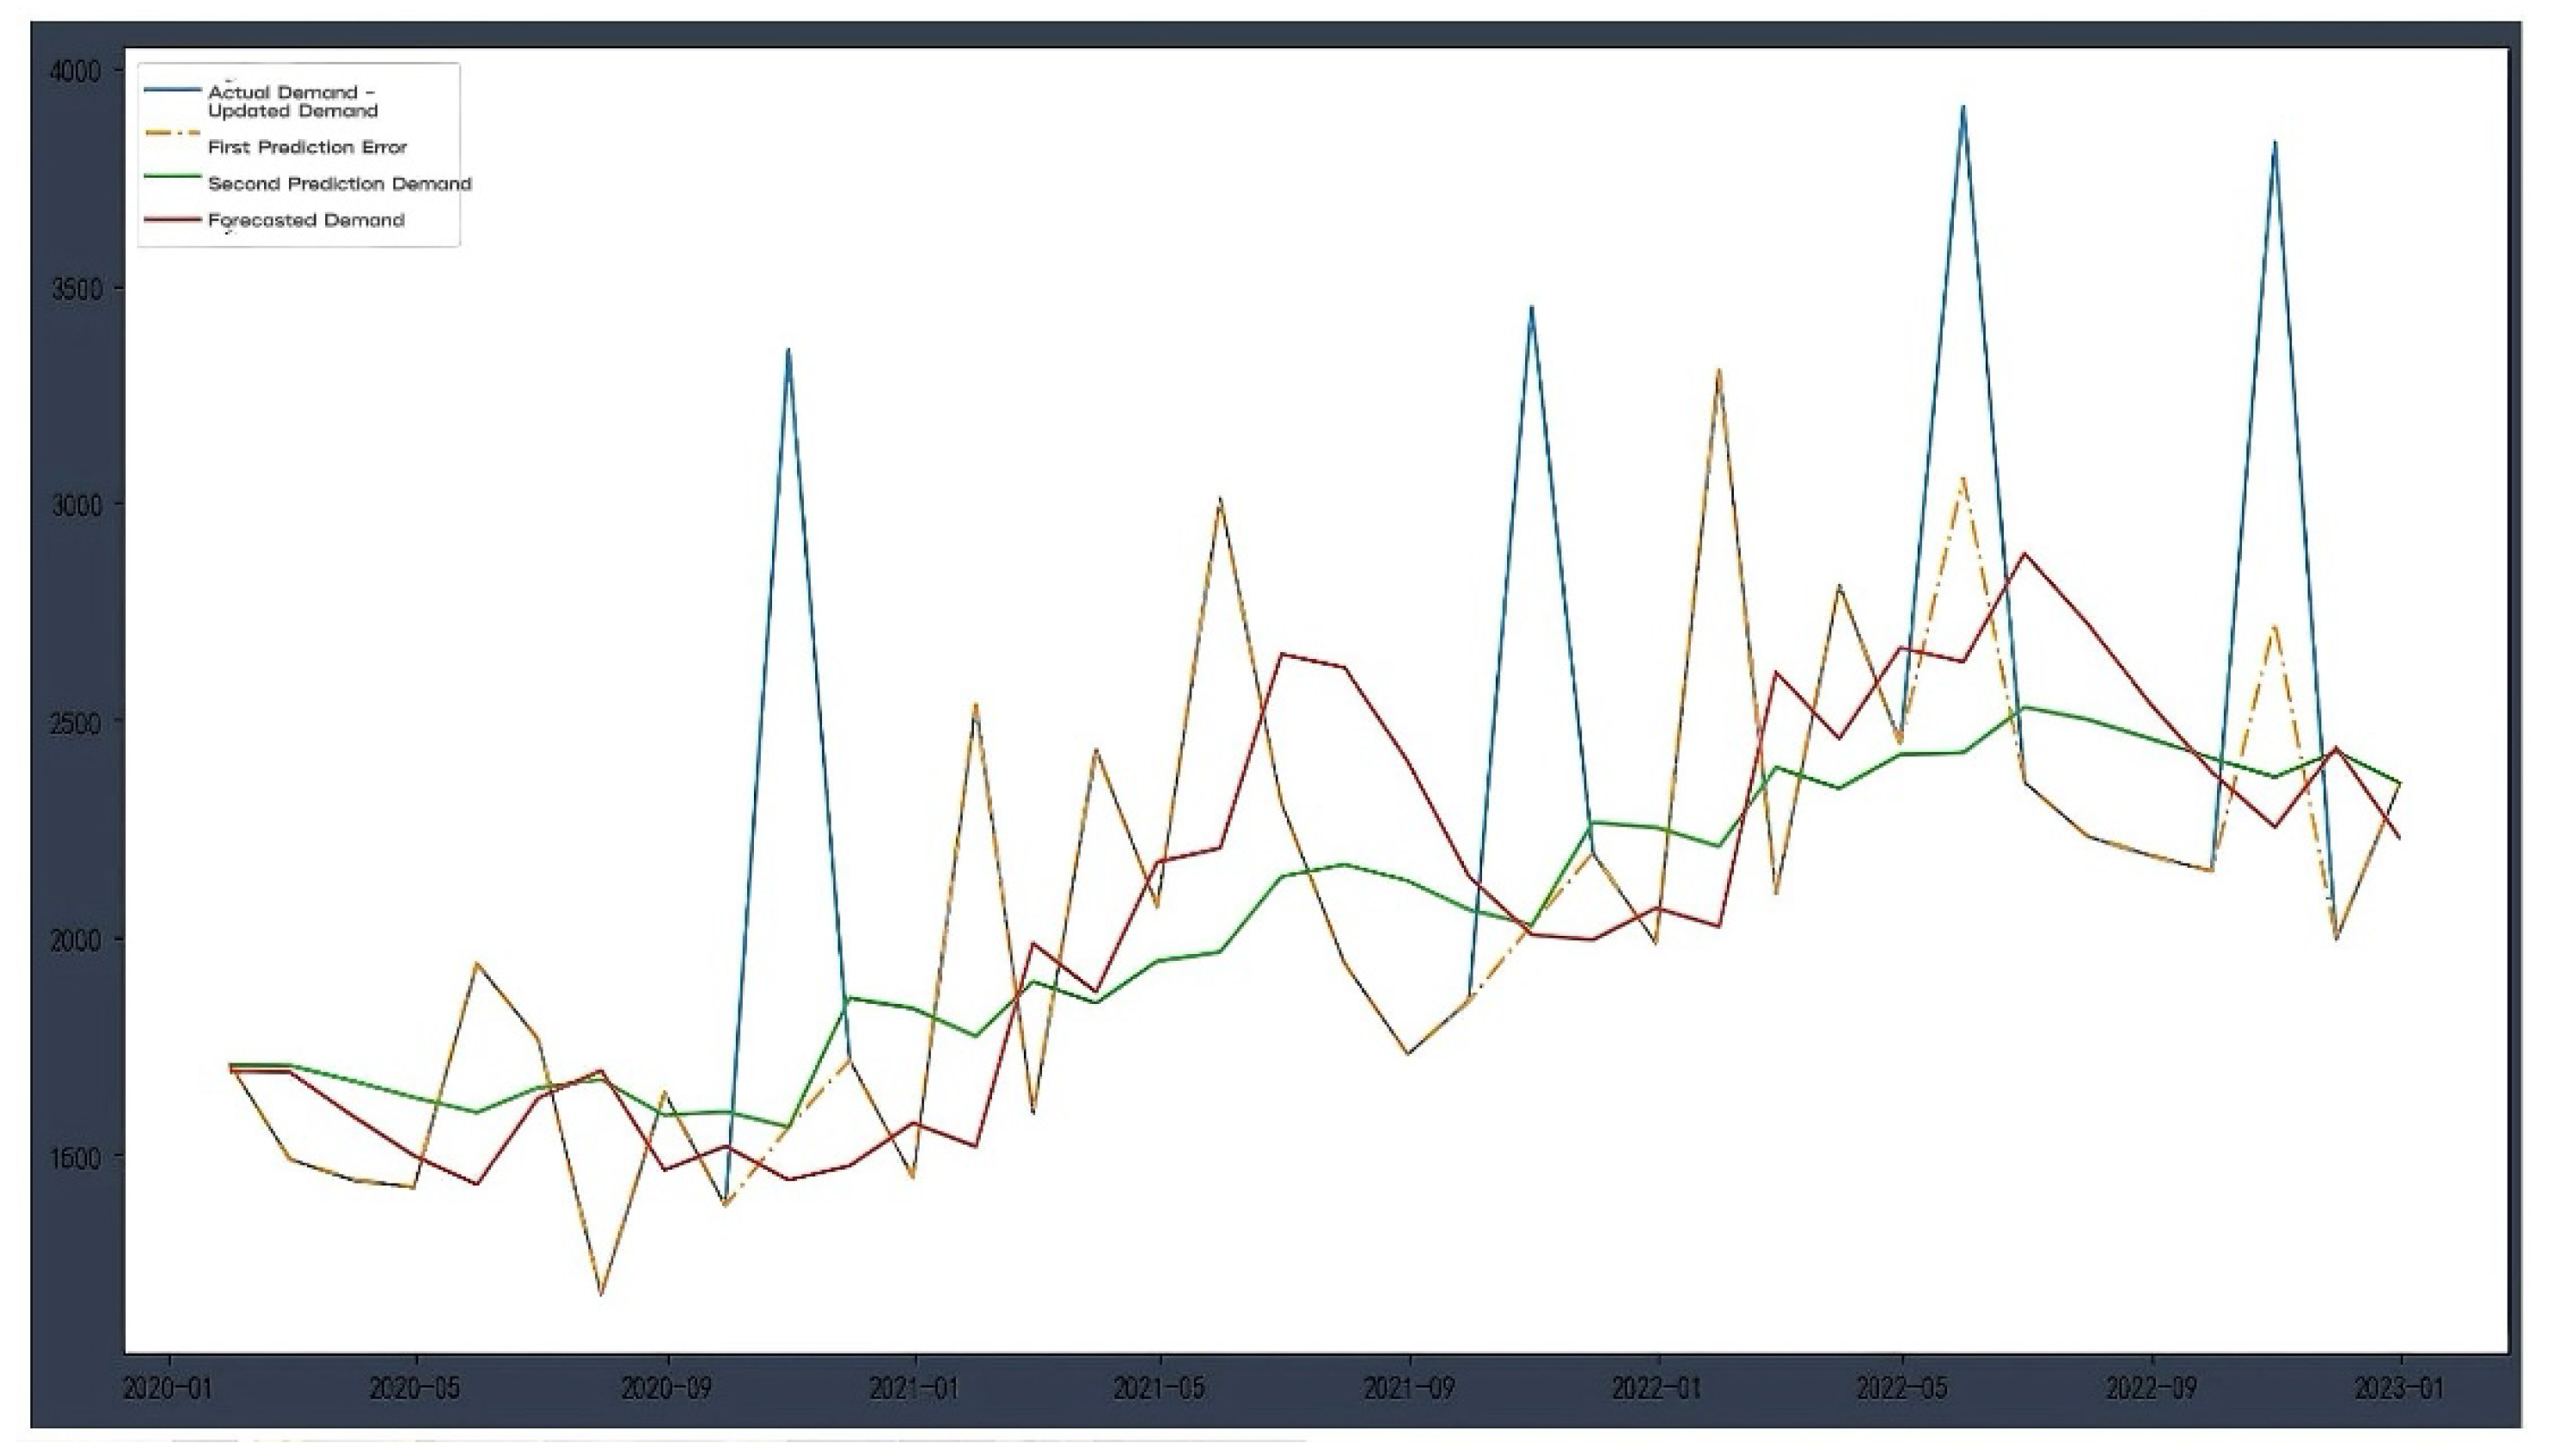
In this section, we show the forecasting effect based on demand forecasting and anomaly detection methods. By making the first prediction of a simple exponential smoothing model on the original demand data and combining the prediction error with the IQR method for anomaly detection, we realize the processing of abnormal demand. By replacing the outliers with the first forecast and making further predictions using the damped Holt exponential smooth-addition model (damped trend), we obtain the updated demand forecast results.
In Figure 3, two different prediction methods are shown: one is “demand without anomaly detection processing + anomaly detection processing based on prediction error”, and the other is “demand anomaly detection and moving average processing + anomaly detection processing based on prediction error”. As can be seen from the figure, the demand prediction results of the data input model with moving average smoothing are significantly better than those without smoothing. This shows that abnormal fluctuations can be effectively eliminated, and the accuracy of prediction can be improved by smoothing.
4.4. Prediction Model Evaluation
To assess which approach is more effective, we introduce the KPI (Key Performance indicator) function to calculate the forecast root mean square error (RMSE%) and the mean absolute error (MAE%). According to the KPI results, we can judge which method performs better under different forecasting models and provide a basis for the subsequent demand forecasting optimization.
4.5. KPI Result Analysis
- The following is a comparison of KPI results based on the above two demand forecasting methods:
- Coefficient of variation: The first method has a higher coefficient of variation, indicating that the demand data without exception processing is more volatile; The second method is smoothed by moving average, and the coefficient of variation is significantly reduced, indicating that the stability of the data is improved.
- Root mean square error (RMSE%): The second method has a lower root mean square error, indicating that the forecast results are closer to the actual demand.
- Mean absolute value error (MAE%): The second method also performs better in terms of mean absolute value error, further demonstrating its superiority.
With these KPI results, we can better understand which forecasting methods have higher accuracy and stability when dealing with different types of demand data.
5. Conclusions
By comparing and analyzing the forecast results of the monthly demand for product B in the East China warehouse, we can draw the following conclusions:
- Impact of Prediction Models on Forecast Accuracy: The choice of prediction model significantly affects the forecasting performance. In this experiment, we compared the method of “demand anomaly processing and prediction error-based anomaly detection” with “demand anomaly detection and moving average processing + prediction error-based anomaly detection.” The comparison shows differences in forecast accuracy, as observed from the root mean square error (RMSE) and mean absolute error (MAE):
- Root Mean Square Error (RMSE): The second method (demand anomaly detection and moving average processing) demonstrated lower prediction error (0.20184 < 0.213496), indicating better demand data prediction accuracy.
- Mean Absolute Error (MAE): The first method (no anomaly processing on demand) showed a slightly better performance (0.144684 < 0.146127), reflecting a more accurate representation of the actual data when anomalies were processed minimally.
- Role of Anomaly Detection and Processing: The smoothing of outliers in the demand data, particularly using the moving average method, can improve prediction results to a certain extent. Although the second method (with anomaly detection and moving average smoothing) performed better in terms of RMSE, the slight increase in MAE suggests that anomaly detection and processing, particularly when smoothing data, can result in some loss of information. The trade-off between improving short-term forecast accuracy and retaining key data features for long-term predictions remains an important consideration.
- Trade-off Between Short-Term and Long-Term Forecasting: While short-term accuracy is improved through smoothing techniques like the moving average, the smoothing process could interfere with long-term trends and seasonal patterns. For instance, demand forecasting that accounts for long-term growth or cyclical variations may be compromised if smoothing overly flattens the data. This paper calls for future research to examine how data smoothing techniques can be adapted to preserve long-term trends, ensuring that the model strikes an effective balance between short-term accuracy and long-term forecasting.
- Application of KPI Functions: By defining KPI functions, we can quantitatively evaluate the effectiveness of different forecasting methods in terms of RMSE and MAE. This allows for the flexible selection of anomaly detection methods depending on the requirements of the specific forecasting scenario, optimizing the model’s performance.
This experiment demonstrates the significance of anomaly detection and processing in demand forecasting for supply chains. Through a comparative analysis of different anomaly processing methods, the study highlights how anomaly handling can improve forecast accuracy, particularly when dealing with large fluctuations or outliers in complex data. The method and models explored here provide valuable insights for optimizing demand forecasting in supply chains, showing that careful anomaly detection and processing can enhance the accuracy and reliability of forecasts. The KPI function offers a powerful tool for quantitatively assessing and selecting the best forecasting models, providing data-driven support for demand forecasting in various supply chain contexts. Moreover, future work should explore the impact of anomaly smoothing on long-term forecasts and the balance between maintaining short-term forecast accuracy and respecting long-term trends.
References
- Charavanan, Varun. Investigating the Financial Implications of Converting Manufacturing from Existing Portfolio to PPE Products During COVID-19 for Canadian Manufacturing Companies-Ontario Case Study. MS thesis. University of Windsor (Canada), 2023.
- Chen, Yuh-Min, Tsung-Yi Chen, and Jyun-Sian Li. “A Machine Learning-Based Anomaly Detection Method and Blockchain-Based Secure Protection Technology in Collaborative Food Supply Chain.” International Journal of e-Collaboration (IJeC)19.1 (2023): 1-24. [CrossRef]
- Glaser, Ana E., Jake P. Harrison, and David Josephs. “Anomaly Detection Methods to Improve Supply Chain Data Quality and Operations.” SMU Data Science Review 6.1 (2022): 3.
- Liu, H., Li, N., Zhao, S., Xue, P., Zhu, C., & He, Y. (2024). The impact of supply chain and digitization on the development of environmental technologies: Unveiling the role of inflation and consumption in G7 nations. Energy Economics, 108165.
- Gong, C., Zhong, Y., Zhao, S., & Liu, Y. (2024). Application of Machine Learning in Predicting Extreme Volatility in Financial Markets: Based on Unstructured Data. [CrossRef]
- Ding, R., Wang, Q., Dang, Y., Fu, Q., Zhang, H., & Zhang, D. (2015). Yading: Fast clustering of large-scale time series data. Proceedings of the VLDB Endowment, 8(5), 473-484. [CrossRef]
- Nguyen, H. Du, et al. “Forecasting and Anomaly Detection approaches using LSTM and LSTM Autoencoder techniques with the applications in supply chain management.” International Journal of Information Management 57 (2021): 102282. [CrossRef]
- Zeevenhoven, M. H. J. (2020). Anomaly detection to improve the quality of customer forecast data (Doctoral dissertation, Master’s thesis, Eindhoven University of Technology).
- Davuluri, M. (2023). Optimizing Supply Chain Efficiency Through Machine Learning-Driven Predictive Analytics. International Meridian Journal, 5(5).
- El Filali, Aicha, et al. “Machine Learning Applications in Supply Chain Management: A Deep Learning Model Using an Optimized LSTM Network for Demand Forecasting.” International Journal of Intelligent Engineering & Systems 15.2 (2022).
- Chuang, H. H. C., Chou, Y. C., & Oliva, R. (2021). Cross-item learning for volatile demand forecasting: An intervention with predictive analytics. Journal of Operations Management, 67(7), 828-852. [CrossRef]
Figure 3.
Prediction results of demand without anomaly detection processing + anomaly detection processing based on prediction error”.
Figure 3.
Prediction results of demand without anomaly detection processing + anomaly detection processing based on prediction error”.
Disclaimer/Publisher’s Note: The statements, opinions and data contained in all publications are solely those of the individual author(s) and contributor(s) and not of MDPI and/or the editor(s). MDPI and/or the editor(s) disclaim responsibility for any injury to people or property resulting from any ideas, methods, instructions or products referred to in the content. |
© 2025 by the authors. Licensee MDPI, Basel, Switzerland. This article is an open access article distributed under the terms and conditions of the Creative Commons Attribution (CC BY) license (http://creativecommons.org/licenses/by/4.0/).
Copyright: This open access article is published under a Creative Commons CC BY 4.0 license, which permit the free download, distribution, and reuse, provided that the author and preprint are cited in any reuse.


