
Submitted:
24 February 2025
Posted:
25 February 2025
You are already at the latest version
Abstract
This paper investigates the virtualization of LoRaWAN end nodes through Linux containers (LXC) to improve scalability, flexibility, and resource management. By leveraging lightweight Dockerbased virtualization, we break down the core functions of the LoRaWAN node, comprising the application, LoRaWAN, and LoRa layers, into modular containers. In this work a fully virtualized endnode is demonstrated. The obtainable performance are not only compared against the standard approach that leverages on LoRaWANcompliant module, but also against an emulated solution that mimics the desired functinalities purely in software. A controlled, uniform testbed, exploiting the capability of virtual machine hypervisor to change the way the underlying hardware is abstracted to guest environments, is considered. Key metrics, including resource utilization and latency, are purposely defined and evaluated. The results underscore the potential of container technologies to transform the deployment and management of communication solution targeting Internet of Things (IoT) scenarios not only for the infrastructure but also for end devices, with implications for future advancements in wireless network virtualization.
Keywords:
WSNs
; LPWAN
; LoRaWAN
; Virtualization
; SDR
; Containers
1. Introduction
In recent years, wired networks have evolved to offer higher and higher flexibility, largely due to the shift from dedicated hardware solutions to software-driven functionalities. This trend has enhanced network performance and scalability, enabling network services to be provisioned, scaled, and optimized with remarkable efficiency. In the past, when dedicated hardware was used for implementing specific network functionalities, the update of an already deployed infrastructure required the introduction of new equipment; additionally, supporting novel user application scenarios, that require disruptive network changes, resulting in the need for new (standard) specifications and the communication infrastructure redesign. Software Defined Networking (SDN) and Network Function Virtualization (NFV) technologies, just to mention a few, have played pivotal roles in this transformation by introducing programmability, flexibility, and cost-efficiency into the network infrastructure, for enabling the dynamic reconfiguration of available resources to meet diverse and changing demands [1].
Softwarization and virtualization of networks [2,3] have recently extended into the wireless domain, where challenges such as the efficient use of spectrum and the need for low-latency, high-throughput communication are prominent [4]. The integration of the previously mentioned SDN and NFV solutions into wireless networks has opened new possibilities for flexible network and traffic management. Among the many advancements, the Software Defined Radio (SDR) concept has gained attention for its ability to virtualize the radio functions, enabling real-time changes in radio access technology without requiring hardware modifications. In turn, these approaches permitted the so-called Network Disaggregation, that can be split into i) vertical disaggregation, when the software part is decoupled from the hardware part, allowing multiple combinations to be used and ii) horizontal disaggregation, when network functionalities are implemented using more granular elements interconnected by purposely designed interfaces. Such an approach is a fundamental pillar of the latest mobile communication generation, minimizing both the capital expenditure (CAPEX) in deploying new architectures and the operating expenditure (OPEX) related to the upgrade of network functionalities, that in turn result in higher revenues for operators and service providers.
However, despite leveraging different business models, also the Internet of Things (IoT) like applications demand for efficient and scalable network solutions. In particular, Low Power Wide Area Networks (LPWANs) emerged as viable solutions that trade off the coverage and battery lifetime with the data rate and the latency. LoRaWAN, based on the LoRa physical layer, merges these requirements with simple infrastructure devices (the gateways) and an innovative backend, where most of the infrastructure complexity is concentrated. Such a combination makes LoRaWAN ideal for a range of IoT applications, as confirmed by the wide adoption in both the academia and the industrial world. However, as the LoRaWAN ecosystem evolves, there is a growing demand for more dynamic and reconfigurable network solutions to accommodate the diverse requirements of the connected devices. Traditional LoRaWAN architectures, characterized by their monolithic and hardware-dependent setups, are ripe for innovation through the application of software-centric approaches. As regards the connectivity towards the backend, it must be highlighted that the gateway is a relatively dumb and transparent device that is only in charge of en/decapsulating in/from a LoRa frame the user payload, i.e., it is a simple hardware depending on the backend software. On the other hand, virtualizing the entire functionality of the LoRaWAN end nodes could offer a promising solution that allows modular, scalable, and flexible deployment of LoRaWAN applications.
By integrating concepts from the provided reference and our previous research [5,6], this paper delves into the application of LXC [7] technology, specifically leveraging on the Docker lightweight virtualization, to disaggregate the LoRaWAN end node stacks into more manageable and dynamic components. Once encapsulating LoRaWAN end-node functionalities within containers, the use of SDR allows for the complete virtualization of all the stack layers, significantly enhancing the deployment, scalability, and management of the overall application. However, despite the feasibility of this strategy has been somehow already demonstrated, a comprehensive characterization is still missing.
This work provides an answer to this research question. The novel and original contributions are the following:
- the fully virtualization of a LoRaWAN end node, across all the stack layers, is proposed based on the use of LXCs and low-cost SDR device;
- a uniform environment for performance evaluation is described, exploiting virtualization of the underlying physical device to easily change the memory and computational resource availability;
- multiple scenarios, based on different implementations of the same network functionality, are described and realized in real-world experiments to carry out rigorous testing and measuring and comparing key performance indicators such as latency, throughput, and system resource utilization;
- analysis of the obtained results and insights about the benefits and challenges of the proposed architecture is carried out.
The paper is arranged as follows. First of all, in Section 2 the relevant literature about topics of interest is addressed. In Section 3 the proposed approach is briefly described. In Section 4, some characteristics of the LoRaWAN technology are resumed. In Section 5, some key aspects of Docker virtualization technologies are explored. In Section 6 the experimental setup is detailed. In Section 7 and Section 8 the obtained results are discussed. Finally, some conclusions are drawn.
2. Related Works
In recent developments within IoT architectures, the integration of SDN and containerization technologies like Docker has shown promising results for improving network management and efficiency. As outlined by Bedhief et al. [8], SDN decouples networking control and data planes, providing a flexible management layer that enhances IoT operations. Concurrently, Docker enables portable, scalable application deployment across diverse IoT devices, streamlining network operations and facilitating rapid service deployment. This dual approach advances the scalability and flexibility required in heterogeneous IoT environments.
In the realm of IoT applications, lightweight virtualization via Docker containers [9,10] has demonstrated flexibility and efficiency for deploying and managing LoRaWAN end nodes. As described by Sisinni et al., the integration of Docker-based microservices within the LoRaWAN architecture not only enhances operational agility but also promotes robust, scalable configurations for diverse IoT applications [6]. This approach underpins the notion of disaggregation and decomposition of the traditional hardware-centric LoRaWAN nodes, facilitating a transition to a more versatile and dynamic network infrastructure.
In the context of SDR for wireless networks, the potential to enhance flexibility and resource utilization is significant. Liu et al. [11] provides an overview of the network reconfigurability enabled by softwarization and virtualization in wireless domains. They discuss how technologies like NFV and SDN have been adapted for wireless communications, offering insights into their benefits for improved management and efficiency in network operations.
In the field of IoT communication, the utilization of SDR and LXC for the virtualization of network functionalities presents a transformative approach, particularly for LoRaWAN technologies. This methodology, as explored in the paper [5] , leverages container-based architectures to enhance the flexibility and scalability of network operations, allowing for the dynamic adaptation of network behaviors in real-time environments. The adoption of Docker containers facilitates the deployment and management of these network functions, simplifying the integration and scaling of LoRaWAN infrastructures across diverse application scenarios. Similar approaches are discussed in [12,13,14,15].
In examining virtualization techniques for Radio Access Networks (RAN), the use of both Virtual Machines (VMs) and Docker containers has garnered considerable attention. The paper [16] explores these methods, particularly highlighting Docker’s superior performance in the deployment of network functions compared to traditional VMs. Their work supports the transition towards more flexible and efficient network architectures by leveraging container technology, which offers quicker deployment times and reduced overhead.
In the domain of container migration and virtualization for wireless networks, [17] propose a novel approach for live migration of containerized Baseband Units (BBUs) in Cloud-RANs, focusing on ensuring network continuity, particularly in LoRaWAN and LTE networks. Their work highlights the use of containerization technologies such as Docker, which enables the migration of BBUs with minimal downtime, thus preserving network stability and optimizing resource usage. Similarly, the study [18] explores the impact of Docker container virtualization on wireless mesh networks (WMNs) using SDN. Their study demonstrates how Docker containers can replace traditional, costly networking devices, optimizing WMNs by reducing operational and capital expenditures. By integrating SDN controllers like POX and Ryu, their work improves routing protocol redistribution, enhancing packet transfer, reducing latency, and improving overall network performance. In this context, also a container-based architecture is proposed to virtualize LoRaWAN end nodes in this study [19], enabling seamless communication between LoRaWAN and IP-based networks. Additionally, similar methodologies are explored in [20,21,22,23].
In addition to the focus on network virtualization, we aim to experiment with an additional scenario, emulation. The paper[24] discusses the potential of lightweight virtualization technologies, especially containerization, for end-to-end LoRaWAN network emulation. Their work highlights how containerizing both the node functionalities and backend services enables scalable and flexible deployments, facilitating realistic emulation of LoRaWAN networks with minimal hardware. This approach allows for the evaluation of network performance in complex environments, which aligns with our goal of testing LoRaWAN emulation in diverse IoT scenarios.
3. The Proposed Approach
This paper focuses on evaluating the performance of a regular end device against a fully decomposed functionalities node. Starting from Figure 1, various disaggregation and decomposition strategies are detailed, showcasing how functionalities within end devices are segmented and containerized in different implementation scenarios. Each scenario uniquely handles the relevant stack layers, namely: a) the end-user Application, b) the LoRaWAN stack (including the management of the initial binding procedure and the payload (de)ciphering) and c) the LoRa physical layer, utilizing either software virtualization or dedicated hardware. Further details are furnished in Section 4.
More in detail, based on the previous activities described in [5,6,24] the considered scenarios are:
- Standard: This is the reference scenario, representing a typical implementation of a LoRaWAN end node, exploiting a commercially available module. In this architecture, a clear separation between the hardware-based communication functionalities and the software-based application execution exists. Specifically, the LoRaWAN communication stack is fully handled by the hardware module, which also embeds the LoRa radio. Conversely, the end-user application, which is generally implemented by an external system/processor, is virtualized by means of an LXC.
- Fully virtualized: This scenario represents the proposed, holistic virtualization strategy. Disaggregation and decomposition of functionalities are implemented across all the layers of the communication stack. In particular, this setup relies on an LXC per each layer and takes advantages from the versatility of SDR technology to manage the LoRa radio modulation and demodulation functionalities (occurring at the base band) through software instead of hardware.
- Emulation: In this scenario, the end node functionalities are still confined in LXCs, as for the fully virtualized one, but the physical layer is completely abstracted out, demonstrating an implementation in which regular radio communications are omitted. Instead of utilizing LoRa radios linking the end nodes and the gateways, message forwarding towards the backend (and vice versa) is also containerized in a sort of virtual gateway.
4. LoRaWAN: Description and Definitions
Understanding the architecture of LoRaWAN is of paramount importance for exploring the virtualization of its network components. LoRaWAN stands for Long Range Wide Area Network [25]. It is standardized by the LoRa alliance, that manages the specifications and certification procedures, but relies on a proprietary radio technology, named LoRa and patented by Semtech. As suggested by the name, it is a protocol for high-range communications, but operating on low power Accordingly, LoRaWAN is typically used for the IoT-like applications, where the traffic is mainly from the field towards the users (the uplink direction) and devices have several constraints, in particular limited resources in terms of available power. This section delineates the core components of the LoRaWAN architecture: the end node, the gateway, and the backend. As a matter of fact, there is no network layer in a LoRaWAN network, due to the simple star-of-stars topology (i.e., there is no need for path discovery and routing). Two tiers can be identified:
- the wireless tier, that includes the end-devices, located a single hop away from the gateway (the center of the star);
- the backend tier, better defined in the following, that concentrates most of the computational resources and it is often offered as a Platform as a Service (PaaS) in the cloud; it acts as a collector for the data from/to the gateways, thus forming another star consisting of wired (and wireless) links, generally based on the Internet (or Intranet for on premises solutions).
4.1. End-Node
Within the LoRaWAN architecture, the end node operates hosts the sensor or device endpoint that interacts with the physical world and transmits (refined) data to the final sink through one or more gateways.
Focusing on end node protocol stack functionalities and services, it is possible to identify three primary components and layers:
- Application Layer: The top layer or the end-user application, which generates traffic (uplink) and handles specific user-defined tasks and processes data before sending it over the network. It is important to stress that the LoRaWAN specifications do not define how data must be formatted, since only a generic binary user payload field is defined for the message; this task is in charge of the implementer. For this reason, real-world LoRaWAN backends permit to creation of payload formatters. These code snippets interpret and process data going to and from end devices, e.g., converting binary payloads to human-readable values.
- Medium Access Control Layer: LoRaWAN actually defines a Medium Access Control (MAC) protocol, that sits directly above the physical LoRa layer. LoRaWAN is responsible for coordinating the data transmission and reception processes across the wireless tier. A pure ALOHA access scheme is adopted, a contention-based method that simplifies the transmission process; generally, robust mechanisms to handle potential collisions are typically not needed, because of the non real-time nature of data transactions. The LoRaWAN layer ensures efficient use of the available communication medium by managing several critical tasks. These tasks include frame formatting, adding headers and trailers to the frame for structuring the data for the transmission; additionally, data rate selection is also performed, which adjusts the transmission rate to match network conditions and optimize energy consumption: the Adaptive Data Rate (ADR) mechanism managed by the backend. Furthermore, the LoRaWAN layer regulates the duty-cycle, ensuring compliance with regional regulations on transmission times and preventing network congestion. The communication paradigm depends on the node class it belongs to, which dictates its transmission and reception patterns. In particular: a) Class A must be supported by any nodes; communication is initiated by transmitting an uplink message to the backend after a relevant event occurs, and it followed by two reception windows (often named RX1 and RX2), to receive a downlink message if needed, either for providing acknowledgment or additional data. b) Class B introduces additional beacon messages for time synchronization, allowing for extra reception windows, which improves the potential throughput along the downlink direction. c) Class C offers continuous listening for downlink messages, limiting the usage to devices that do not suffer from limited power availability (e.g., because they are main-powered or provided with some form of energy harvesting).
-
Physical Layer: The LoRa physical layer (PHY) is primarily responsible for the physical transmission and reception of radio signals. This layer utilizes the LoRa modulation technique, an implementation of Chirp Spread Spectrum (CSS) modulation, which is especially effective for long-range communications due to its robustness against interference and signal attenuation. Operating within the sub-GHz frequency spectrum, the LoRa PHY layer capitalizes on the properties of CSS modulation to enable communication over long distances while maintaining low-power consumption. The modulation process within the LoRa PHY layer involves encoding a variable number of bits in a symbol that modulates into upchirps with a fixed bandwidth (), and a variable time duration (). The encoding efficiency is determined by the Spreading Factor (SF), which allows for distinct initial chirp frequencies, thus accommodating the diverse number of bits per symbol. The SF can be set between 7 to 12, offering a versatile scale of data transmission rates and enhancing signal robustness against noise due to the additional processing gain.Indeed, the relationship must be satisfied, underpinning the balance among the communication range (the sensitivity), the data rate and the noise immunity. This relationship highlights the flexibility of the LoRa modulation technique, which can be finely tuned to meet specific operational demands of IoT applications, ranging from throughput in the order of several down to hundreds of . For increasing message reliability, forward error correction mechanisms are applied; the redundant code bits are determined by the configurable coding rate parameter . Additional insights into the intricacies of LoRa’s modulation strategy and its implications for network performance are discussed in further detail in [26].Operating in unlicensed sub-GHz regions of the spectrum, regional parameters are defined that, when applied in the EU, results in in the proximity of the 868 MHz region. In this case, In Europe, the duty-cycle is regulated by section 4.3.3 of the ETSI EN300.220-2 standard, requiring , depending on the actual channel.
4.2. Gateway
Gateways act as the communication bridge between end nodes and the backend server. They receive frames from multiple co-located end nodes, and relay this information to the backend. Unlike end nodes, that operate on configurable but fixed channels and , gateways are designed to concurrently receive traffic leveraging different channels and , thus minimizing the impact of the limited bandwidth and the simple MAC strategy. As regards the connectivity towards the backend, the specifications do not define how it is actually implemented, however, they are typically connected to an IP-based wired or wireless infrastructure. In particular, the executes the so-called packet forwarder software, in charge of embedding/extracting LoRaWAN payloads into the payload of the protocol connecting with the backend. Currently, two main packet forwarders exist:
- The UDP packet forwarder, also referred to as the legacy packet forwarder, is the original one, initially proposed by Semtech. It uses UDP as the transport protocol to transfer LoRaWAN packets. This solution is widely spread in the industry and academia, and most of manufacturers preinstall it on their gateways. The protocol is quite simple, facilitating the implementation, but also has some drawbacks. Notably, the link between the gateway and the backend is not encrypted and the use of the unreliable UDP protocol can lead to message loss. However, these drawbacks are overcome using VPN tunneling, that ensures both privacy and reliability.
- The LoRa Basics Station, uses the WebSockets technology to communicate, natively supporting data encryption as it moves between the gateway and the network server. A two-steps procedure is supported, in which a preliminary discovery procedure occurs before the actual connection with the gateway; additionally, a Configuration and Update Server (CUPS) is defined, which allows for easy management of device update and configuration.
4.3. The Backend
The backend of a LoRaWAN network is the core of operations, comprising several key entities that manage the flow of data and ensure secure and efficient network functionality. These entities include the Network Server (NS), Application Server (AS), and Join Server (JS):
- NS The NS manages the routing of data across the network, ensuring efficient message delivery by deduplicating messages from multiple gateways and maintaining data integrity through network session keys. It also handles network responses such as acknowledgments and adaptive data rate commands. The NS is the end point of the packet forwarder connection.
- AS The AS interfaces with user applications, providing secure data delivery by decrypting messages using application-specific keys. It tailors data processing to meet the specific needs of various applications.
- JS The JS enhances network security by managing the authentication and initial device onboarding processes. It securely handles device root keys and session key generation, ensuring that each device’s identity is secure and unique.
Additional details can be found in [27].
5. Docker Virtualization
Virtualization technologies, especially lightweight ones, e.g., based on containers as for the Docker solution [28], have become central to the flexibility and scalability of IoT networks. An example is the implementation of the edge computing paradigm, as shown in [29].
Docker has become a cornerstone of modern containerization, providing a lightweight and efficient solution for deploying and managing applications across different environments. It enables operating system-level virtualization, where multiple isolated containers share the same kernel, but each has its own file system, processes, and network interfaces. This isolation allows Docker to run applications independently without the need for a full-fledged virtual machine, reducing both overhead and resource consumption. Docker also simplifies the orchestration of these containers. With Docker-Compose [30], users can define and manage multicontainer applications in a single configuration file, making deployment and scaling straightforward.
Docker includes an engine that changes an image (stored somewhere) into a running container. Exploiting an overlay filesystem, additional layers can be added on the initial image, so that the final image consists of many overimposed layers, that are efficiently stored on disk and can be easily removed if no longer needed.
Furthermore, Docker enhances the portability of applications. Containers encapsulate all dependencies required to run an application, ensuring that the application can be deployed across different environments—whether on a local machine, a cloud server, or a remote device—without worrying about compatibility issues. This portability is particularly valuable in IoT networks, where devices may run on different hardware and software configurations, yet need to interact in a standardized way.
6. The Experimental Setup
A purposely designed testbed has been realized to evaluate how demanding is the proposed approach from the computational, storage and connectivity point of view. Efforts have been carried out to ensure that experiments are carried out in well-defined conditions, to easily and effectively compare results. In particular, it has been decided to leverage on a virtual machine to host the containerized functionalities. Accordingly, the underlying hardware components and platform are completely abstracted, and consistency is ensured for all the testing conditions. Indeed, despite we can suffer from additional latencies due to such an additional abstraction layer, in this work we are mainly interested in comparing the impact of different memory and computational resources availability, rather than analyzing the absolute performance. For this reason, a uniform, configurable environment is a main concern.
The main characteristics of the host and guest systems are resumed in Table 1. As shown in Figure 2, the setup is based on a ML350 Gen10 server from HPE; the host operating system is Ubuntu Server 20.04.6 LTS; as regards the hypervisor, the open-source Kernel-based Virtual Machine (KVM) has been considered, which is integrated in Linux from Kernel version 2.6.20. As a matter of fact, the KVM architecture mimics the Linux arrangement, being based on i) a native kernel module, switching the processor in a new guest state, executing the guest code and leveraging the virtualization features offered by recent CPUs, and ii) a virtual machine monitor, based on the Quick EMulator (QEMU), which virtualizes the hardware devices and provides some virtual networking functions. An interesting feature is that the guest code is emulated in a Posix thread, that can be managed by means of regular Linux tools; when a 2- or 4-core guest is needed, 2 or 4 threads are created, each of them calling the KVM kernel module to start the execution. If enough real cores are available (or scheduling if not), concurrent execution is managed by the normal Linux scheduler, keeping the code small. The KVM environment is configured by means of the Cockpit, a free and open-source front-end tool, furnishing an intuitive web interface that permits to manage and modify the relevant system features and resources easily and intuitively.
In this way, the core setup remains consistent, but available (virtual) resources can be modified easily. Accordingly, different configurations can be devised, to explore and evaluate significant aspects of the LoRaWAN containerized end device (see also Figure 3). The guest OS is the Ubuntu 20.04.6 LTS; the VM is configured for using the different number of virtual cores , virtual memory space GB; the virtual disk has a 215 GB size.
As shown in Figure 2, the gateway used for communication is the Laird RG186 LoRaWAN gateway [31], which runs the Semtech UDP packet forwarder protocol, allowing communication between the end node and the backend services. In terms of backend services, the system relies on The Things Stack (TTS) [32], a popular open-source LoRaWAN framework that provides all the necessary network management services.
6.1. Configurations
The experimental framework adopted for this study utilizes four distinct setups, as shown in Figure 3. Indeed, other than the setups mimicking the aforementioned Standard and Emulation scenarios, two other setups have been defined for implementing different “flavors” of the Fully virtualized scenario, as better detailed in the following. In all the experiments, message length is and the message interval period is . The overall experiment duration is . Other relevant settings are resumed in Table 2, resulting in the message duration .
-
Reference setup A top level container hosts an application developed using Node-RED[33], an open-source flow-based development tool, leveraging on JavaScript code for data manipulation. This Node-RED flow simulates the behavior of an end-user application that triggers the transmission of a fixed length message based on a predefined schedule, possibly representing the uplink traffic of a sensor device in a real world IoT-like application.A second container serves as the bridge between the containerized Node-RED application and the LoRaWAN module, the RN2483 from Microchip, shown in Figure 2, that is connected through a virtual COM above a USB link. This container handles the serialization of the application payload into the ATcommands that are interpreted by the module.The containers communicate publishing and subscribing MQTT messages exchanged across a (containerized) Mosquitto broker [34].
-
Fully Virtualized (MATLAB-based LoRa) In this setup, the application container implements the same functions of the Standard setup. The user payload is processed by the next container, named "LoRaWAN". This container runs a C script responsible for managing various LoRaWAN operations; other than adding headers and trailers, it performs tasks such as ciphering and deciphering the payload and appending the necessary headers and trailers to prepare the data for transmission using the LoRa radio.Once the message is formatted, it is passed to the LoRa container, which hosts a MATLAB-based model [35] of the LoRa modulation process. This model has been compiled into a standalone application and it is responsible for encoding (and decoding) symbols and performing the actual baseband (de)modulation. The MATLAB-based container outputs in-phase (I) and quadrature (Q) baseband samples, supposing a sample rate. Each I/Q sample is a 2B-long signed integer value.The subsequent container, named Serializer, is responsible for streaming the I/Q components to the SDR device for actual signal transmission. The low-cost ADALM-PLUTO [36] from Analog Devices is adopted, capable of operating up to 6 GHz with a maximum 20 MHz real-time bandwidth. This SDR is supported by the Linux Industrial Input/Output (IIO) driver, which is part of the Linux kernel. The ADALM-PLUTO is connected to the system via a USB 2.0 interface, which imposes a throughput limit of several MSa/s, adequate for the low-bandwidth requirements of LoRa. As also described in [5], a fixed buffer of 10 MSa stores the samples (i.e., 40 MB are transferred each time to the SDR), enough to contain the actual message. Indeed, since , the number of samples per message is in the order of .All containers communicate via an MQTT broker, except for the Serializer, that sends the I/Q streams to the SDR using a TCP/IP client-server flow.
- Fully Virtualized (C-based LoRa) In this setup, our proposed method adopts a virtualization strategy similar to that of the MATLAB-based SDR driven scenario, with a distinct implementation approach for the LoRa layer. In this case, the LoRa model is developed using the C programming language, known for its efficiency and control over system resources, and is executed by its own dedicated container.
- Emulation This setup demonstrates the flexibility of the proposed approach. As already described in Section 3, this configuration does not involve any actual LoRa transmissions. Instead, communication is emulated through a virtualized component known as the Virtual Gateway (VGW). The VGW collects the Application container output, which is immediately forwarded to the backend by means of the implemented packet forwarder functionality.
Table 3 shows the network traffic for each container in the different experimental scenarios, with values for incoming (I) and outgoing (O) traffic, obtained by means of the docker stats –no-stream command. These values represent the amount of data the container has sent and received over its network interface, calculated as the incremental changes in the actual Net I and Net O metrics over time. This information provides a clear picture of data movement in kilobytes (kB) and megabytes (MB), highlighting the network load and communication patterns within the virtualized environments used in the study. These statistics are consistent with the expected traffic previously described. As expected, there is no difference in the Application traffic in all cases; similarly, both the Matlab- and the C-based LoRa containers for the Fully Virtualized configurations provide the same traffic levels.
7. Results - Resource-Related Metrics
This section presents and discusses the results of the experiments carried out using the previously introduced Fully Virtualized configurations; the focus is on resource-related metrics.
To compare the resource usage across containers, we employed a monitoring stack comprising Prometheus and Grafana [37], well-established tools for collecting and visualizing time series. This setup provides detailed insights into the resource consumption of different system components in real-time. For container-level resource monitoring, we used cAdvisor (Container Advisor)[38] to expose container-specific metrics, while node-exporter [39] offered system-level metrics.
In addition to the monitoring stack, we also used the docker stats –no-stream command-line tool, which provides real-time performance data for running containers. This tool was particularly useful for tracking the Process IDs (PIDs) and Network Traffic I/O for each container.
7.1. Resource Usage Comparison: MATLAB vs. C-Based LoRa
Both the C-based and Matlab-based LoRa containers are the most demanding, since algorithms for baseband (de)modulation process must be executed. Figure 4 illustrates the CPU usage of the LoRa containers as a percentage of the total computational capacity of the host machine. To monitor the container’s CPU usage, cAdvisor was employed to expose container-level metrics, container_cpu_usage_seconds_total, while node-exporter provided system-level metrics, machine_cpu_cores. These metrics were scraped by Prometheus every 15 s and queried using the following PromQL expression:
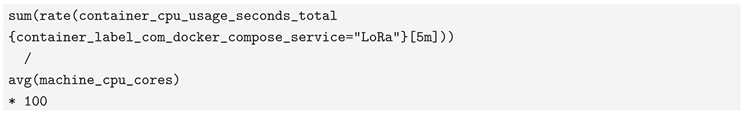
The numerator (rate(container_cpu_usage_seconds_total[5m])) calculates the rate of change of CPU time consumed by the LoRa containers, averaged over a 5 minute long window. The denominator (avg(machine_cpu_cores)) represents the total number of vCPU cores available on the host machine; the result is multiplied by 100 to express the CPU usage as a percentage.
It is interesting to highlight the relevant overhead introduced by MATLAB runtime environment, that, differently from the C-based implementation, exhibits a huge vCPU usage in the startup phase and is an order of magnitude more demanding than the plain C counterpart. As regards the number of the vCPUs, it can be shown a relevant impact moving from 1 to 3 vCPUs (the usage is almost divided by a factor of two), which is less evident when moving from 5 to 7 vCPUs.
Table 4 presents the distribution of PIDs between different vCPU cores for each container in the various configurations. A significant observation is the contrast in PID utilization within the LoRa containers in different scenarios. In the Fully Virtualized (C-LoRa) scenario, where the LoRa container is implemented using C, the container, as expected, consistently uses only a single process. In contrast, in the Fully Virtualized (M-LoRa) configuration, where the LoRa container is developed using MATLAB, the number of processes involved is substantially higher and it increases as more vCPU cores are allocated to the system. This behavior reflects the usage of the MATLAB native signal processing functions for implementing the algorithms of interest.
Figure 5 illustrates the memory usage of the LoRa containers, represented as a percentage of the total memory available on the guest machine (changing in the set {4,8,16}GB), when the number of available vCPU cores is limited to 1 core. These metrics were scraped by Prometheus every 15 s and queried using the following PromQL query:
As expected, memory usage scales almost linearly with the overall amount. Also in this case, the C-based LoRa container generally uses less memory and shows more stable usage compared to the MATLAB-based one.
As a concluding remark, it is possible to state that these stress the importance of an effective implementation and allow us to figure out the feasibility of this fully-virtualized LoRaWAN node on an embedded platform.
8. Results - Time-Related Metrics
After highlighting the need for resources, in this section the results of the experiments carried out using the previously introduced configurations are presented and discussed focusing on time-related metrics.
8.1. Time Synchronization
Given the distributed nature of the system, both the local devices and the backend need to be synchronized to a common reference time, such as UTC, to assess time-related performance. The LoRaWAN backend is inherently synchronized with UTC. Therefore, the local PC, which hosts the containers, runs the Network Time Protocol (NTP) service [40], managed by chrony [41], to periodically adjust the local time, based on measurements of offset and delay from previous steps.
The synchronization uncertainty is calculated using the formula , where is the average uncompensated systematic error introduced by the operating system (i.e., the average offset), and represents the random error (i.e., the standard deviation of the offset). The system logs were collected over a three-hour period to measure the residual time offset after compensation, yielding .
It is important to note that when calculating statistics based on differences in timestamps from the same clock, the systematic errors tend to cancel out. As a result, . A similar level of uncertainty can be attributed to timestamping accuracy, as discussed in prior studies [42]. It is also expected that the synchronization and timestamping accuracy of the backend servers do not exceed these values.
8.2. Time-Related Metrics
To evaluate the performance of each scenario from the time domain point of view, we tracked the uplink message path by capturing a series of timestamps at each stage. Within the virtualized environment, each container recorded timestamps when a message enters and exits, allowing us to measure the time taken at each step. An additional container, named Logger and specifically tasked with this function, managed the publication of these timestamps on the MQTT databus. In the backend sections, timestamp collection was facilitated by the TTS platform, which automatically timestamps the reception of the uplink message at the GW, NS, and AS.
Figure 6 illustrates the duration of each process in the different experimental configurations, identified by the subscript for the Standard, Fully Virtualized (M-LoRa), Fully Virtualized (C-LoRa), and Emulation, respectively. The timestamps , where the subscript i is nothing but the progressive index, as shown in Figure 6, permit the computation of duration intervals , better detailed in the following for the different configurations. In particular, in all configurations the Node Delay , representing the time spent within the virtualized environment and the End-to-End Delay , representing the overall time needed to complete a roundtrip LoRaWAN transaction, are computed as well.
-
Standard Configuration:
-
, representing the processing time taken by the Serializer service;
- -
- marks the moment when the Serializer service first receives a request for an uplink communication.
- -
- corresponds to the instant when the Serializer service has completed processing the request and forwards the uplink payload to the RN2483 module.
-
, representing the time taken for the message to be gathered by the gateway;
- -
- is defined as the instant when the physical gateway (GW) acknowledges the reception of the new uplink communication originating from the module.
-
, representing the time taken for the message to travel from the gateway to the NS;
- -
- identifies the moment the NS is notified of the new uplink communication.
-
, representing the time taken for the message to travel from the NS to the AS;
- -
- identifies the moment the AS is notified of the new uplink communication.
- is the End-to-End delay;
- is the Node delay;
-
-
Fully Virtualized (M-LoRa) Configuration:
-
, representing the time spent within the containerized service for managing the LoRaWAN layer, from receiving the uplink request to relaying the processed payload to the next layer.;
- -
- marks the moment when the LoRaWAN service initially receives a request for a new uplink communication.
- -
- corresponds to the instant when the LoRaWAN service has processed the request and relays the uplink payload to the subsequent lower layer.
-
, representing the time spent in the containerized service for managing the LoRa layer, from receiving the payload to generating the I/Q samples for transmission.
- -
- is the instant when the LoRa service has completed the LoRa encoding and baseband modulation, meaning the actual I/Q discrete samples have been generated.
-
, representing the time spent in the containerized service for setting up the link between the Serializer service and the SDR, ensuring the system is ready to transmit the samples;
- -
- denotes the point at which the Serializer service has successfully established the connection with the SDR and is ready to stream the samples.
-
, representing the time spent in the containerized service for streaming the I/Q samples to the SDR and propagating the uplink signal through the air until it is received by the gateway
- -
- is defined as the instant when the physical GW acknowledges the reception of the new uplink communication originating from the SDR.
-
, representing the additional time required for the uplink communication to reach the NS, capturing the time taken for the message to travel from the gateway to the NS
- -
- identifies the moment the NS is notified of the new uplink communication.
-
, representing the additional time required for the uplink communication to travel from the NS to the AS;
- -
- identifies the moment the AS is notified of the new uplink communication.
- is the End-to-End delay;
- is the Node delay;
-
-
Fully Virtualized (C-LoRa) Configuration:
- Durations, , , , and time points, , in this configuration are analogous to those in the previous one, the Fully Virtualized (MLoRa), with the only difference being their naming convention.
-
Emulation Configuration:
-
, representing the time spent within the containerized service for managing the LoRaWAN layer, from receiving the uplink request to relaying the processed payload to the next layer;
- -
- marks the moment when the LoRaWAN service initially receives a request for a new uplink communication.
- -
- corresponds to the instant when the LoRaWAN service has processed the request and relays the uplink payload to the subsequent lower layer.
-
, representing the time spent within the VGW container, from receiving the uplink payload to preparing it for transmission to the backend
- -
- is the instant when the VGW has processed the payload and is ready to send it to the backend.
-
, representing the time taken for the uplink communication to travel from the VGW to the backend;
- -
- is the instant when the backend acknowledges the reception of the new uplink communication originating from the VGW.
-
, representing the time taken for the uplink communication to forward from the backend to the NS;
- -
- identifies the instant when the NS is notified of the new uplink communication.
-
, representing the additional time required for the uplink communication to travel from the NS to the AS;
- -
- identifies the instant when the AS is notified of the new uplink communication.
- is the End-to-End delay;
- is the Node delay;
-
8.3. Performance Overview
Table 5,Table 6, Table 7, and Table 8 provide a summary of statistics for the time-related metrics, organized by different CPU (virtual) cores, with 8 GiB of memory allocated in all cases. Each table presents an overview of the performance metrics for specific intervals measured in milliseconds, allowing for an assessment of efficiency at each stage of the uplink message path across the virtualized environments and the overall path.
Additionally, Figure 7, Figure 8, Figure 9, and Figure 10 illustrate the End-to-End and the Node uplink delay for different vCPU cores for all the configurations. All results presented in these figures are filtered to the 95th percentile in order to better highlight variations imputable to an increasing amount of computational resources, excluding upper outliers.
Obviously, metrics depending on the Cloud-hosted backend are not affected by the changing number of vCPUs. On the other hand, it is also interesting to highlight that the time spent for processing the (de)modulation is not affected as well.
9. Conclusions
Our findings underline the substantial potential of container technologies in changing the way nodes of wireless networks are implemented, also for relatively simple protocol stack as the LoRWAN one. The transition to a fully virtualized design — where not only all layers of the LoRaWAN stack are disaggregated into containers, but also the radio is implemented by an SDR — proves particularly effective in enabling dynamic reconfiguration and efficient resource management, making it a promising solution for large-scale and flexible IoT deployments. This work not only confirms the feasibility of the proposed approach, but also quantifies objectively the importance of an effective implementation, comparing the MATLAB- and C-based versions of the LoRa baseband. As expected, the C-based implementation provides better resource utilization, stability, and scalability, features of paramount importance in real-world applications.
While the results from this study are promising, the proposed architecture would benefit from further validation in the field-based, dynamic environments to assess its performance when embedded platforms are considered. Additionally, integrating the containerized approach with other wireless communication technologies could provide insights into the broader applicability of this method in diverse IoT applications. This work paves the way for future innovations in wireless network virtualization, demonstrating the critical role of containerization in transforming IoT infrastructure management.
Author Contributions
Conceptualization and methodology, H. Khalilnasl and E. Sisinni; software, H. Khalilnasl; formal analysis, E. Sisinni and P. Ferrari; investigation and validation, H. Khalilnasl; data curation, H. Khalilnasl and E. Sisinni; writing, all the authors contributed to writing, review and editing; visualization, H. Khalilnasl; supervision, A. Flammini; project administration and funding acquisition, A. Flammini. All authors have read and agreed to the published version of the manuscript.
Abbreviations
The following abbreviations are used in this manuscript:
| IoT | Internet of Things |
| LPWANs | Low Power Wide Area Networks |
| LXC | Linux Containers |
| VMs | Virtual Machines |
| RAN | Radio Access Network |
| SDR | Software-Defined Radio |
| SDN | Software-Defined Networking |
| NFV | Network Function Virtualization |
| PaaS | Platform as a Service |
| CSS | Chirp Spread Spectrum |
| PHY | Physical layer |
| MAC | Medium Access Control |
| ADR | Adaptive Data Rate |
| NS | Network Server |
| AS | Application Server |
| JS | Join Server |
| KVM | Kernel-based Virtual Machine |
| QEMU | Quick EMulator |
| IIO | Industrial Input/Output |
| GW | Gateway |
| VGW | Virtual Gateway |
| NTP | Network Time Protocol |
| PromQL | The Prometheus Query Language |
| PIDs | Process IDs |
References
- Josbert, N.N.; Wei, M.; Wang, P.; Rafiq, A. A look into smart factory for Industrial IoT driven by SDN technology: A comprehensive survey of taxonomy, architectures, issues and future research orientations. Journal of King Saud University - Computer and Information Sciences 2024, 36, 102069. [Google Scholar] [CrossRef]
- Satpathy, A.; Sahoo, M.N.; Swain, C.; Bellavista, P.; Guizani, M.; Muhammad, K.; Bakshi, S. Virtual Network Embedding: Literature Assessment, Recent Advancements, Opportunities, and Challenges. IEEE Communications Surveys & Tutorials 2025, pp. 1–1. [CrossRef]
- Adel, A.; Alani, N.H.; Jan, T. Factories of the future in industry 5.0—Softwarization, Servitization, and Industrialization. Internet of Things 2024, 28, 101431. [Google Scholar] [CrossRef]
- Khan, U.S.; Mahboob, T. Network Softwarization and Virtualization: Management of QoS in Wireless and Mobile Networks. In Quality of Service (QoS); Hussein, Y.S., Al-Jumaily, A., Eds.; IntechOpen: Rijeka, 2024. [Google Scholar] [CrossRef]
- Khalilnasl, H.; Depari, A.; Ferrari, P.; Flammini, A.; Gaffurini, M.; Sisinni, E. Implementing a Software Defined LoRaWAN Node Exploiting Container-Based Lightweight Virtualization. In Proceedings of the 2024 IEEE International Symposium on Measurements & Networking (M&N). IEEE, 2024, pp. 1–6. [CrossRef]
- Sisinni, E.; Flammini, A.; Gaffurini, M.; Pasetti, M.; Rinaldi, S.; Ferrari, P. LoRaWAN end device disaggregation and decomposition by means of lightweight virtualization. Internet of Things 2024, 25, 101033. [Google Scholar] [CrossRef]
- Moravcik, M.; Segec, P.; Kontsek, M.; Uramova, J.; Papan, J. Comparison of LXC and Docker Technologies. In Proceedings of the 2020 18th International Conference on Emerging eLearning Technologies and Applications (ICETA); 2020; pp. 481–486. [Google Scholar] [CrossRef]
- Bedhief, I.; Kassar, M.; Aguili, T. Empowering sdn-docker based architecture for internet of things heterogeneity. Journal of Network and Systems Management 2023, 31, 14. [Google Scholar] [CrossRef]
- Sollfrank, M.; Loch, F.; Denteneer, S.; Vogel-Heuser, B. Evaluating Docker for Lightweight Virtualization of Distributed and Time-Sensitive Applications in Industrial Automation. IEEE Transactions on Industrial Informatics 2021, 17, 3566–3576. [Google Scholar] [CrossRef]
- Chowdhury, D.D. , 2025; pp. 125–158. https://doi.org/10.1007/978-3-031-71440-5_4.Networking. In Future of Networks: Modern Communication Infrastructure; Springer Nature Switzerland: Cham, 2025; pp. 125–158. [Google Scholar] [CrossRef]
- Liu, W.; Santos, J.F.; de Belt, J.v.; Jiao, X.; Moerman, I.; Marquez-Barja, J.; DaSilva, L.; Pollin, S. Enabling virtual radio functions on software defined radio for future wireless networks. Wireless Personal Communications 2020, 113, 1579–1595. [Google Scholar] [CrossRef]
- Machado, E.R.; Feldman, M.; Müller, I. A Container-based Architecture to Provide Services from SDR Devices. In Proceedings of the 2023 IEEE 21st International Conference on Industrial Informatics (INDIN); 2023; pp. 1–6. [Google Scholar] [CrossRef]
- Mehr, I.E.; Minetto, A.; Dovis, F.; Pica, E.; Cesaroni, C.; Romano, V. An Open Architecture for Signal Monitoring and Recording Based on SDR and Docker Containers: A GNSS Use Case. In Proceedings of the IEEE EUROCON 2023 - 20th International Conference on Smart Technologies; 2023; pp. 66–71. [Google Scholar] [CrossRef]
- Schiller, E.; Weber, S.; Stiller, B. Design and Evaluation of an SDR-based LoRa Cloud Radio Access Network. In Proceedings of the 2020 16th International Conference on Wireless and Mobile Computing, Networking and Communications (WiMob); 2020; pp. 1–7. [Google Scholar] [CrossRef]
- Costache, C.; Machidon, O.; Mladin, A.; Sandu, F.; Bocu, R. Software-defined networking of Linux containers. In Proceedings of the 2014 RoEduNet Conference 13th Edition: Networking in Education and Research Joint Event RENAM 8th Conference; 2014; pp. 1–4. [Google Scholar] [CrossRef]
- Aravinthan, G.; Herculea, D.; Chen, C.; Roullet, L. Virtualization of radio access network by Virtual Machine and Docker: Practice and performance analysis. In 2017 IFIP. In Proceedings of the IEEE Symposium on Integrated Network and Service Management (IM); 2017; pp. 680–685. [Google Scholar]
- Schiller, E.; Ajayi, J.; Weber, S.; Braun, T.; Stiller, B. Toward a live BBU container migration in wireless networks. IEEE Open Journal of the Communications Society 2022, 3, 301–321. [Google Scholar] [CrossRef]
- Kadam, S.S.; Ingle, D.R. Impact of Docker Container Virtualization On Wireless Mesh Network by Using Software-Defined Network.
- Cilfone, A.; Davoli, L.; Ferrari, G. LoRa Meets IP: A Container-Based Architecture to Virtualize LoRaWAN End Nodes. IEEE Transactions on Mobile Computing 2024, 23, 9191–9207. [Google Scholar] [CrossRef]
- Yang, R.; Zhang, J. imuLab: Internet of Things Simulation Platform Based on OpenStack and Container Technology. In Proceedings of the 2021 IEEE 6th International Conference on Computer and Communication Systems (ICCCS); 2021; pp. 927–932. [Google Scholar] [CrossRef]
- Kobo, H.I.; Abu-Mahfouz, A.M. A Distributed Control System for Software Defined Wireless Sensor Networks Through Containerisation. In Proceedings of the 2019 International Multidisciplinary Information Technology and Engineering Conference (IMITEC); 2019; pp. 1–6. [Google Scholar] [CrossRef]
- Makris, N.; Zarafetas, C.; Valantasis, A.; Korakis, T. Service Orchestration Over Wireless Network Slices: Testbed Setup and Integration. IEEE Transactions on Network and Service Management 2021, 18, 482–497. [Google Scholar] [CrossRef]
- Gopalasingham, A.; Herculea, D.G.; Chen, C.S.; Roullet, L. Virtualization of radio access network by Virtual Machine and Docker: Practice and performance analysis. In Proceedings of the 2017 IFIP/IEEE Symposium on Integrated Network and Service Management (IM); 2017; pp. 680–685. [Google Scholar] [CrossRef]
- Gaffurini, M.; Flammini, A.; Ferrari, P.; Fernandes Carvalho, D.; Godoy, E.P.; Sisinni, E. End-to-End Emulation of LoRaWAN Architecture and Infrastructure in Complex Smart City Scenarios Exploiting Containers. Sensors 2024, 24, 2024. [Google Scholar] [CrossRef] [PubMed]
- de Campos, M.G.; de Almeida, L.G.; Matheus, L.E.M.; Borin, J.F. On the Simulation of LoRaWAN Networks: A Focus on Reproducible Parameter Configuration. Computer Networks and Communications 2024, 148–171. [Google Scholar] [CrossRef]
- Colombo, R.M.; Mahmood, A.; Sisinni, E.; Ferrari, P.; Gidlund, M. Low-cost SDR-based Tool for Evaluating LoRa Satellite Communications. In Proceedings of the 2022 IEEE International Symposium on Measurements & Networking (M&N), 2022, pp. 1–6. [CrossRef]
- Vangelista, L.; Centenaro, M. Worldwide Connectivity for the Internet of Things Through LoRaWAN. Future Internet 2019, 11, 57. [Google Scholar] [CrossRef]
- Merkel, D. Docker: lightweight Linux containers for consistent development and deployment. 2014. Accessed: 2025-02-04. [CrossRef]
- Morabito, R.; Cozzolino, V.; Ding, A.Y.; Beijar, N.; Ott, J. Consolidate IoT Edge Computing with Lightweight Virtualization. IEEE Network 2018, 32, 102–111. [Google Scholar] [CrossRef]
- Eng, K.; Hindle, A.; Stroulia, E. Patterns of Multi-Container Composition for Service Orchestration with Docker Compose. Empirical Software Engineering 2024, 29, 65. [Google Scholar] [CrossRef]
- Laird Connectivity (now Ezurio). RG186 LoRaWAN Gateway: Technical Specification. https://www.ezurio.com/part/rg186, 2025. Originally by Laird, now rebranded under Ezurio. Accessed: 2025-02-04.
- Hernandez, C.F.; Iova, O.; Valois, F. Downlink Scheduling in LoRaWAN: ChirpStack vs The Things Stack. In Proceedings of the 2024 IEEE Latin-American Conference on Communications (LATINCOM); 2024; pp. 1–6. [Google Scholar] [CrossRef]
- Conway-Jones, D.; O’Leary, N.; Rees, J. Node-RED: Low-code programming for event-driven applications. https://nodered.org/, 2023. Accessed: 2025-02-04.
- Light, R.A. Mosquitto: Server and Client Implementation of the MQTT Protocol. The Journal of Open Source Software 2017, 2, 265. [Google Scholar] [CrossRef]
- Inc., T.M. Inc., T.M. Industrial Communication and Signal Processing Toolbox version: 23.2 (MATLAB R2023b). https://www.mathworks.com/products/matlab.html, 2023.
- Devices, A. ADALM-PLUTO Software-Defined Radio Active Learning Module. https://www.analog.com/en/resources/evaluation-hardware-and-software/evaluation-boards-kits/adalm-pluto.html, 2025. Accessed: 2025-02-04.
- Jani, Y. Unified monitoring for microservices: Implementing prometheus and grafana for scalable solutions. J Artif Intell Mach Learn & Data Sci 2024, 2, 848–852. [Google Scholar]
- Google. cAdvisor: Analyzes Resource Usage and Performance Characteristics of Running Containers. https://github.com/google/cadvisor, 2024. Accessed: 2025-02-04.
- Graf, F.; Watteyne, T.; Villnow, M. Monitoring performance metrics in low-power wireless systems. ICT Express 2024, 10, 989–1018. [Google Scholar] [CrossRef]
- Mills, D.L. Internet time synchronization: the network time protocol. IEEE Transactions on communications 1991, 39, 1482–1493. [Google Scholar] [CrossRef]
- Dinar, A.E.; Merabet, B.; Ghouali, S. NTP Server Clock Adjustment with Chrony. In Applications of Internet of Things: Proceedings of ICCCIOT 2020.
- Sisinni, E.; Fernandes Carvalho, D.; Depari, A.; Bellagente, P.; Flammini, A.; Pasetti, M.; Rinaldi, S.; Ferrari, P. Assessing a Methodology for Evaluating the Latency of IPv6 with SCHC Compression in LoRaWAN Deployments. Sensors 2023, 23. [Google Scholar] [CrossRef] [PubMed]
Figure 1.
Overview of Functional Split Scenarios in LoRaWAN Node Implementations.
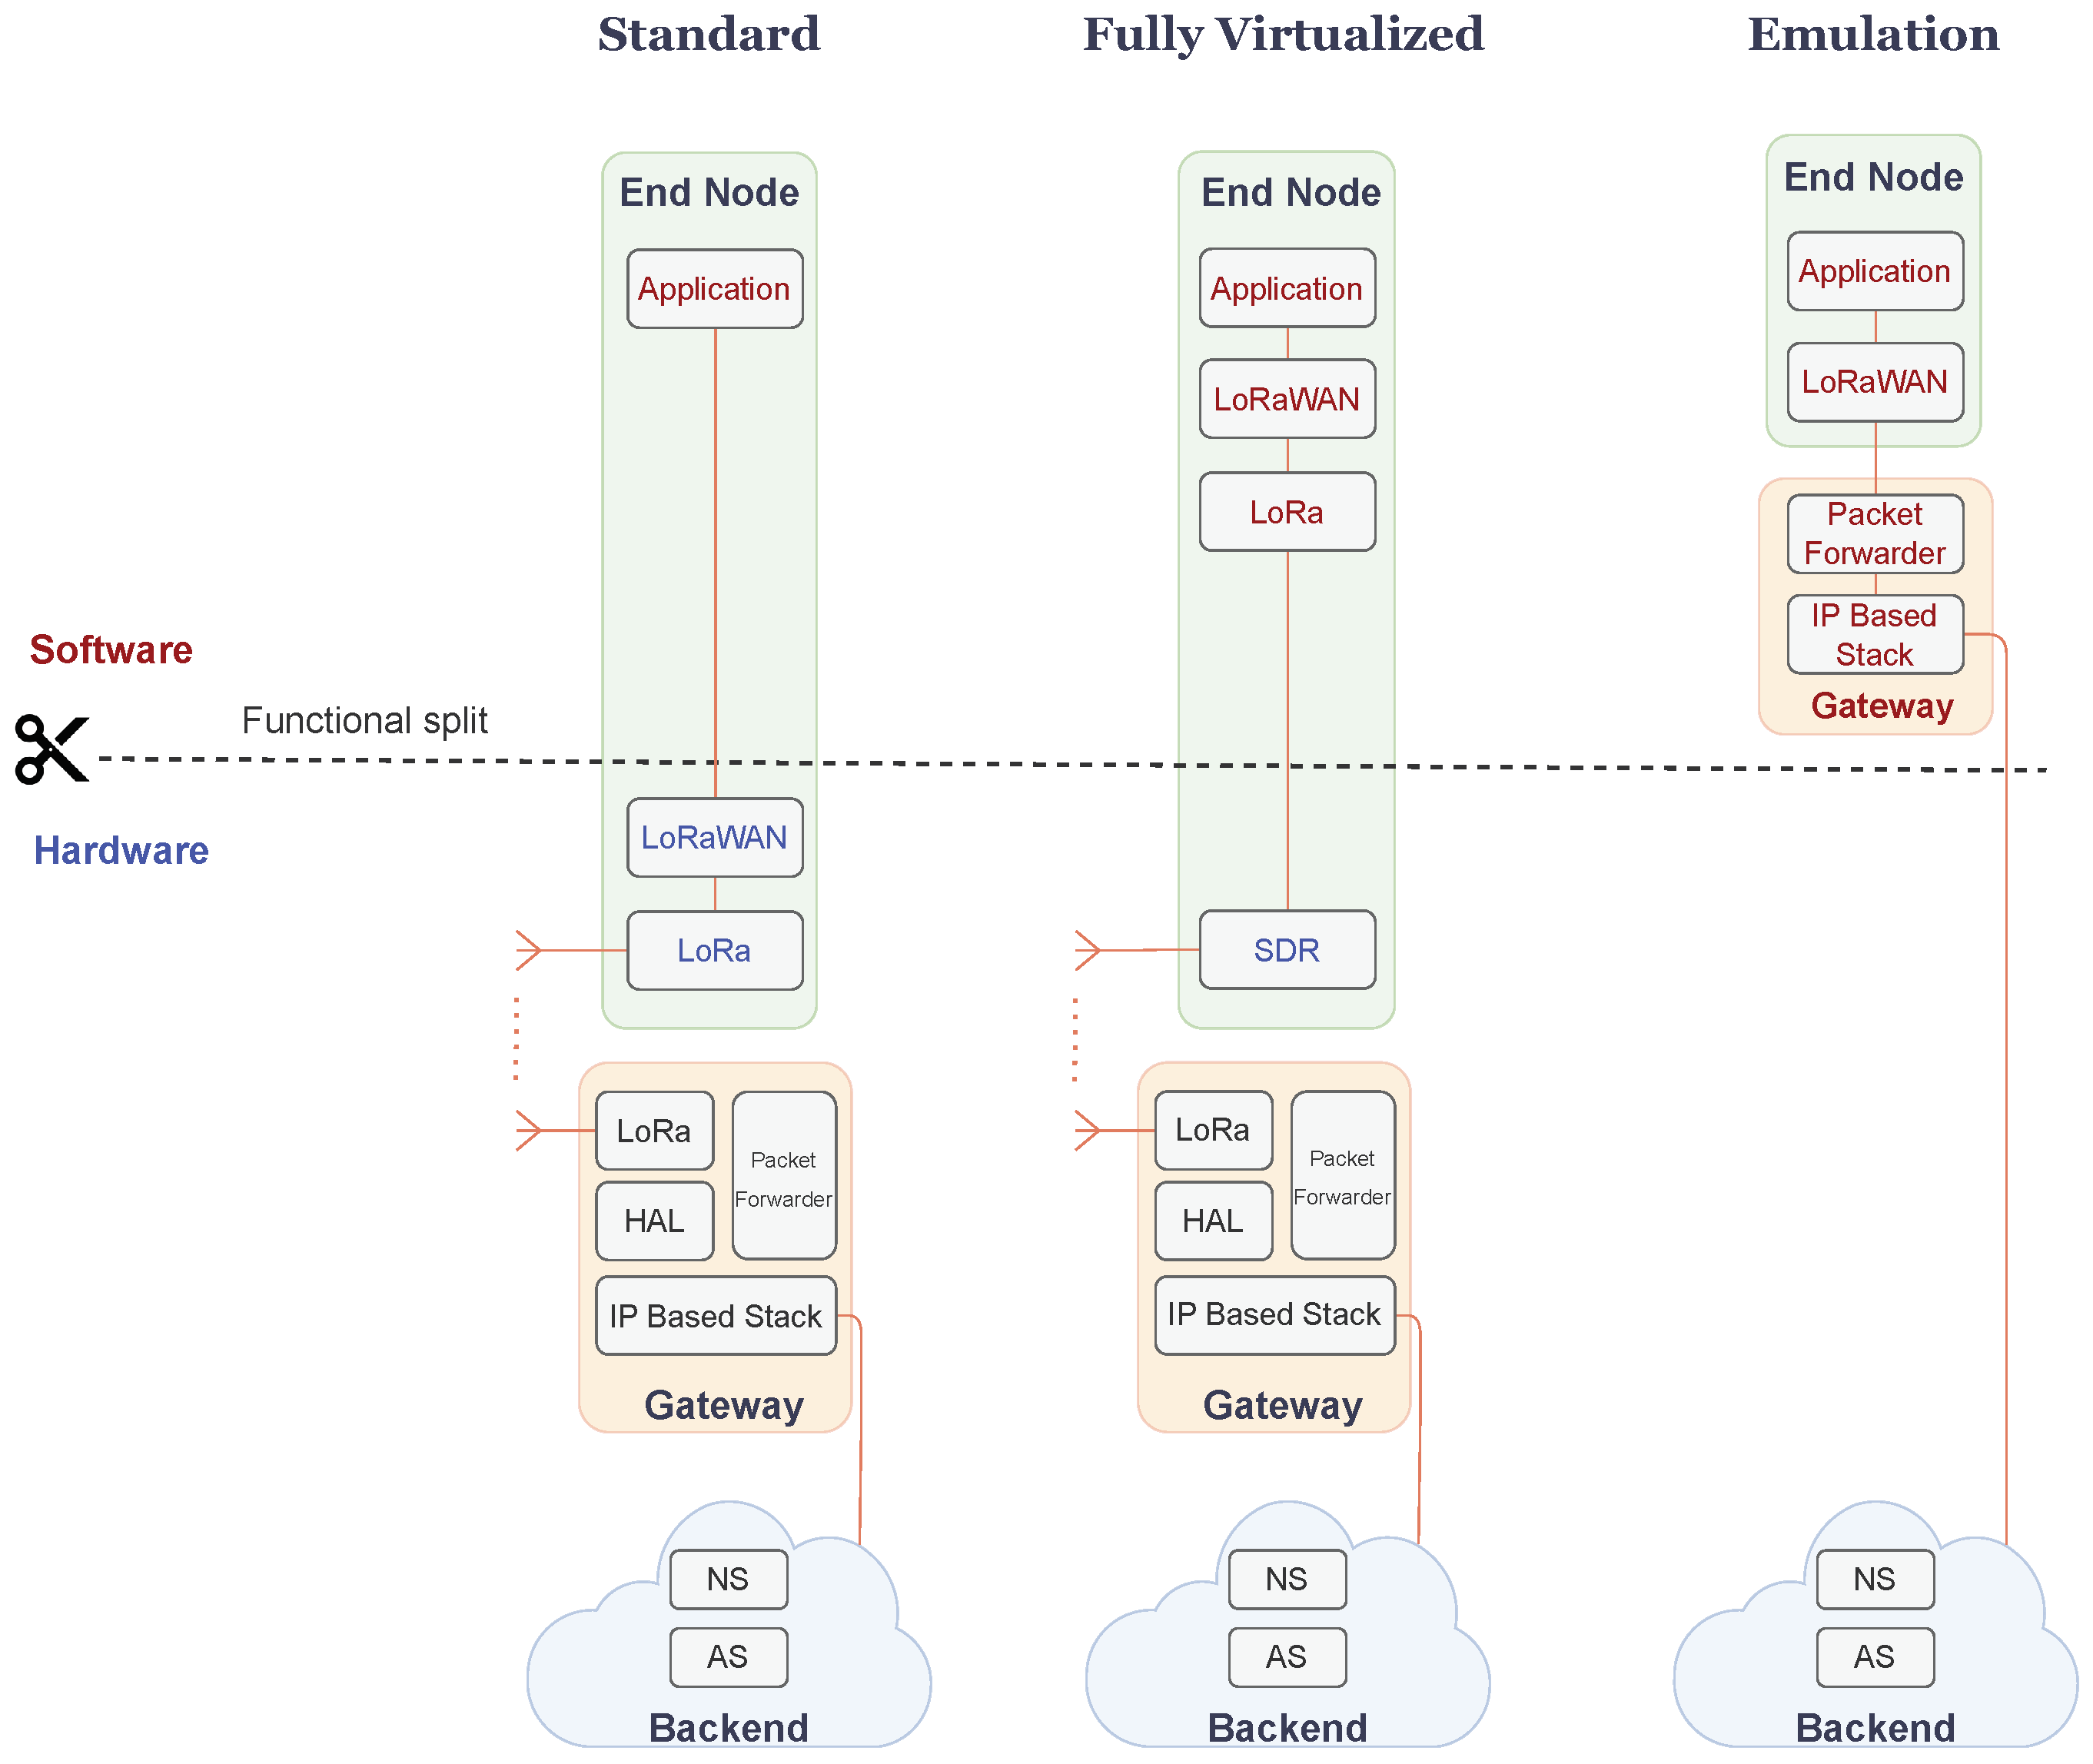
Figure 2.
The experimental setup including the LoRaWAN GW, the SDR, the module, and the Host.
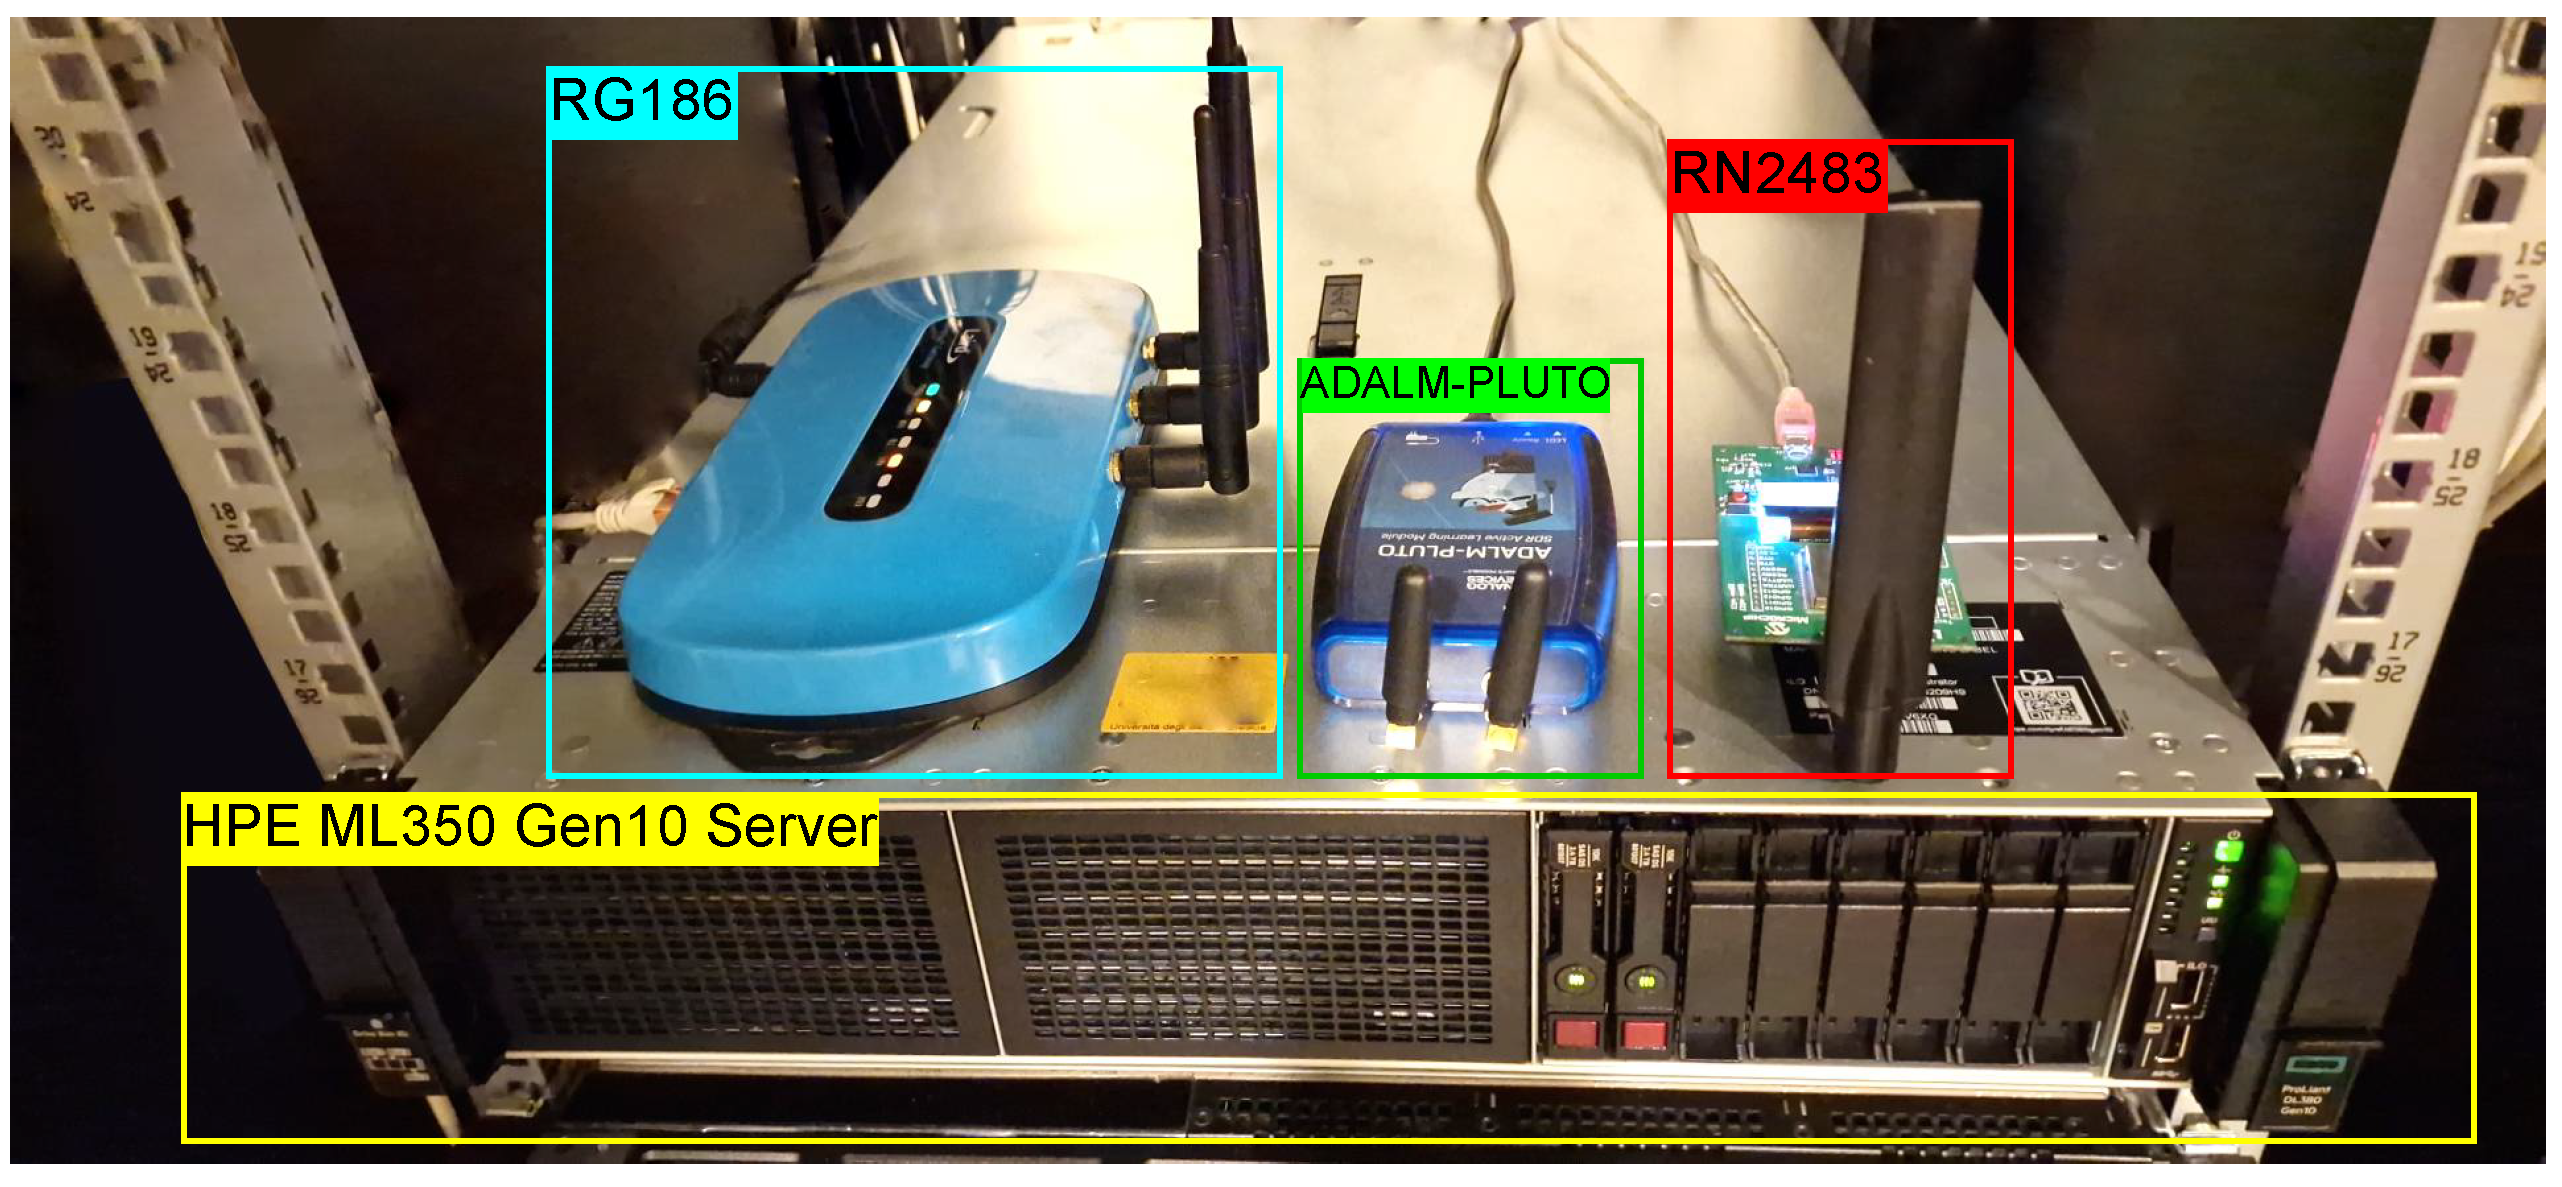
Figure 3.
Experimental setups for virtualized LoRaWAN environments, showcasing different communication and network configurations across scenarios.
Figure 3.
Experimental setups for virtualized LoRaWAN environments, showcasing different communication and network configurations across scenarios.
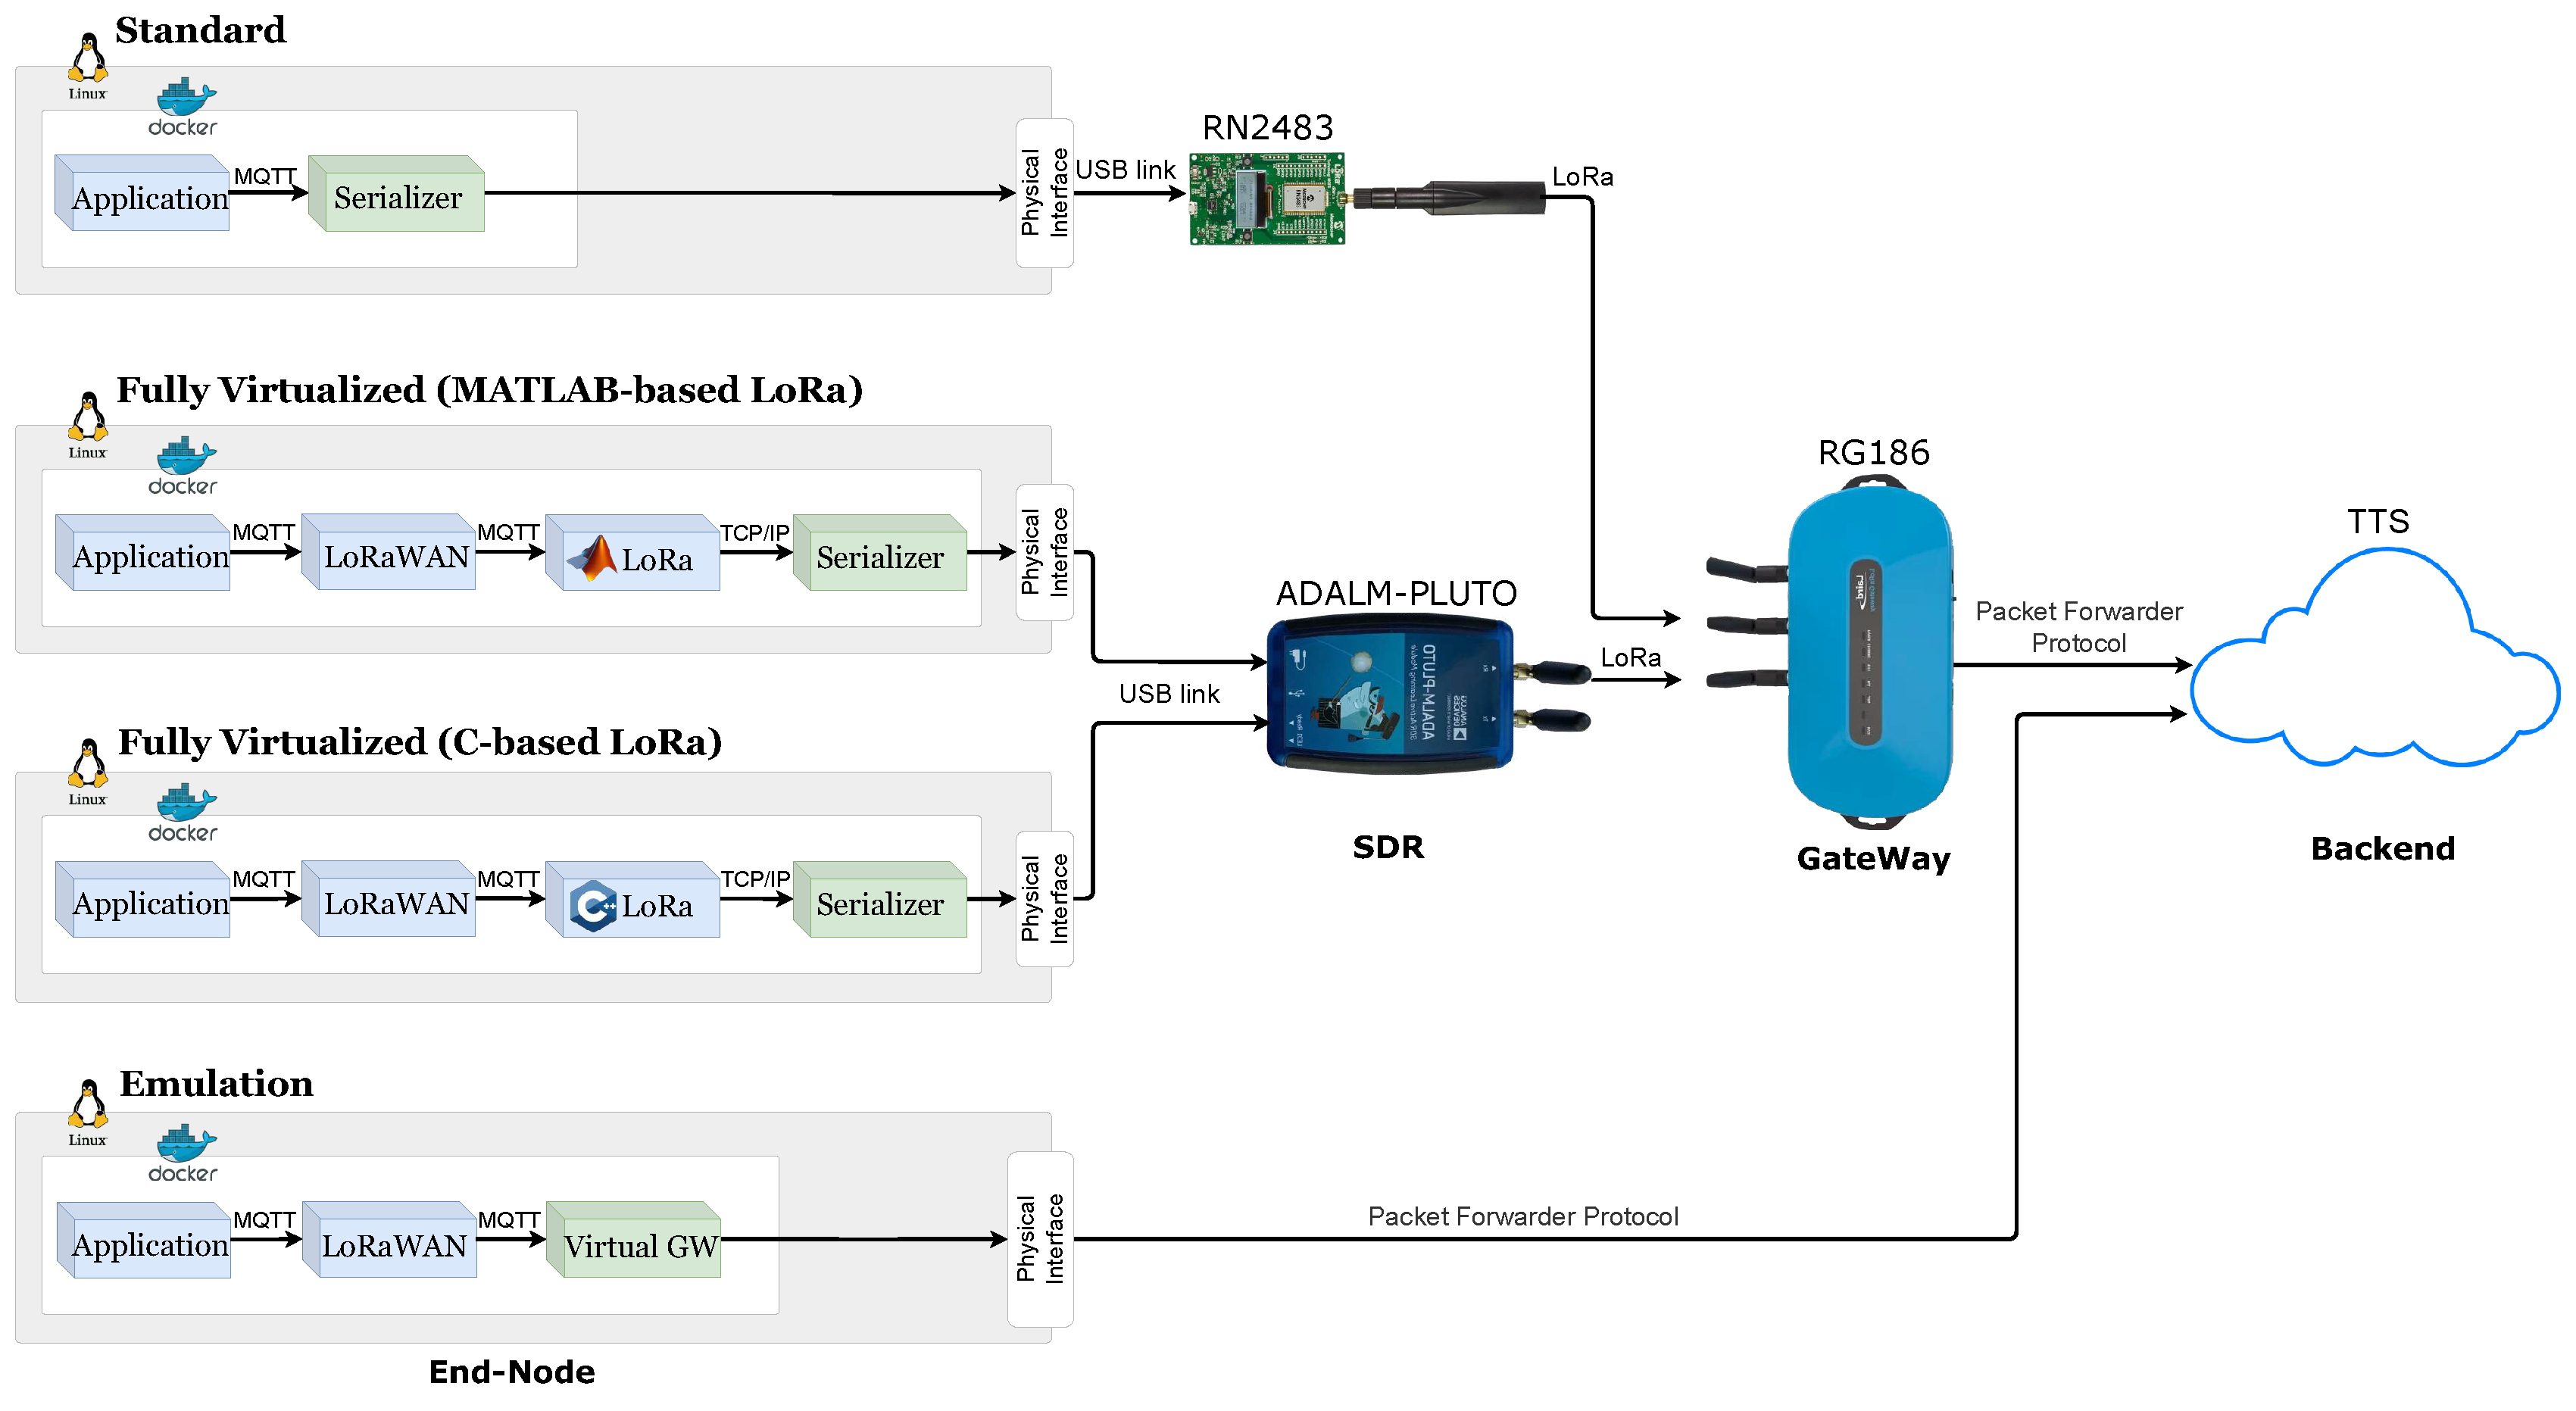
Figure 4.
CPU usage of the Cand MATLAB-based LoRa containers as a percentage of the total capacity.
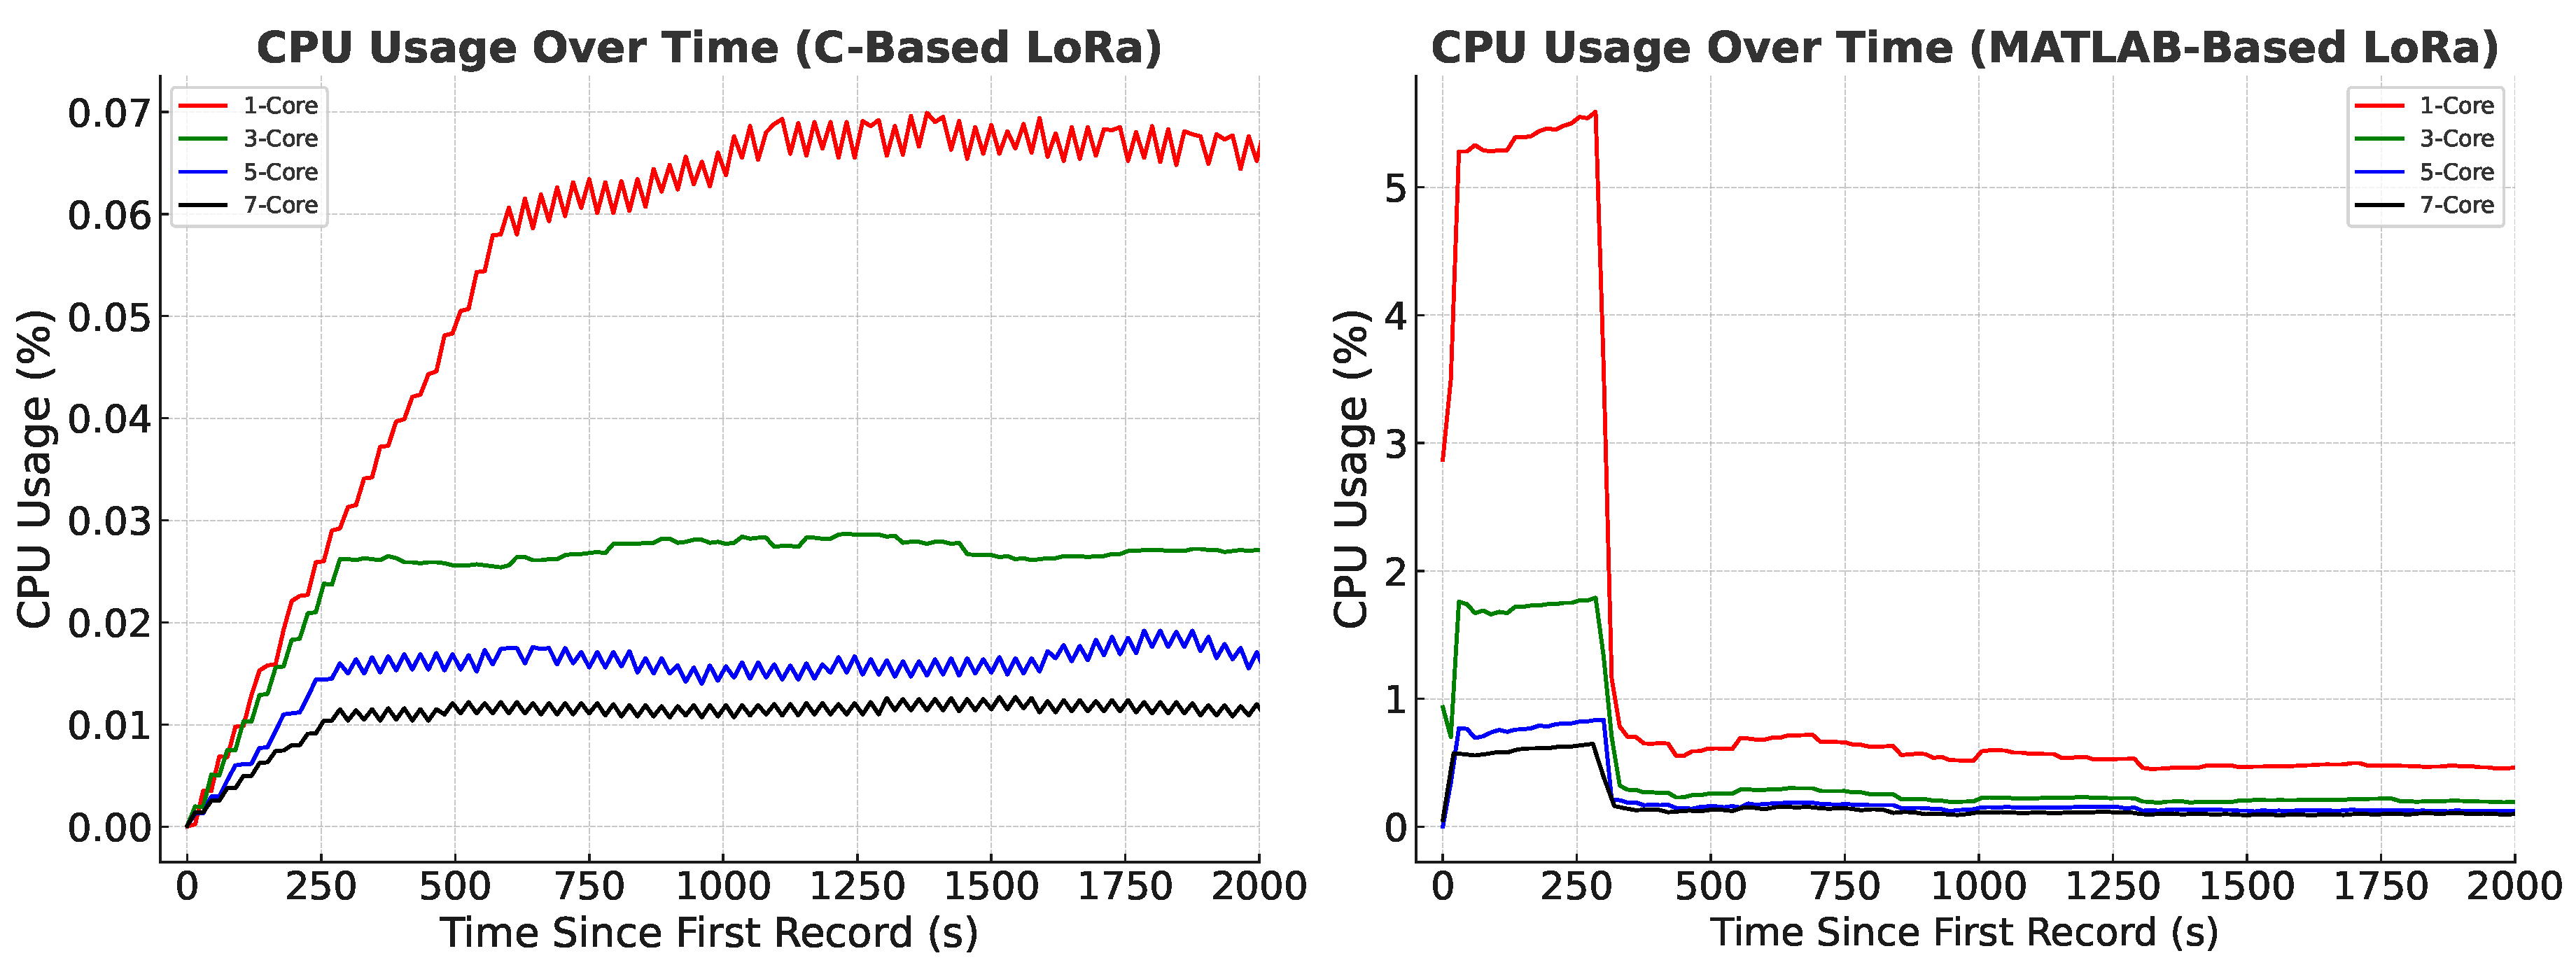
Figure 5.
Memory usage of the LoRa containers as a percentage of total guest memory capacity
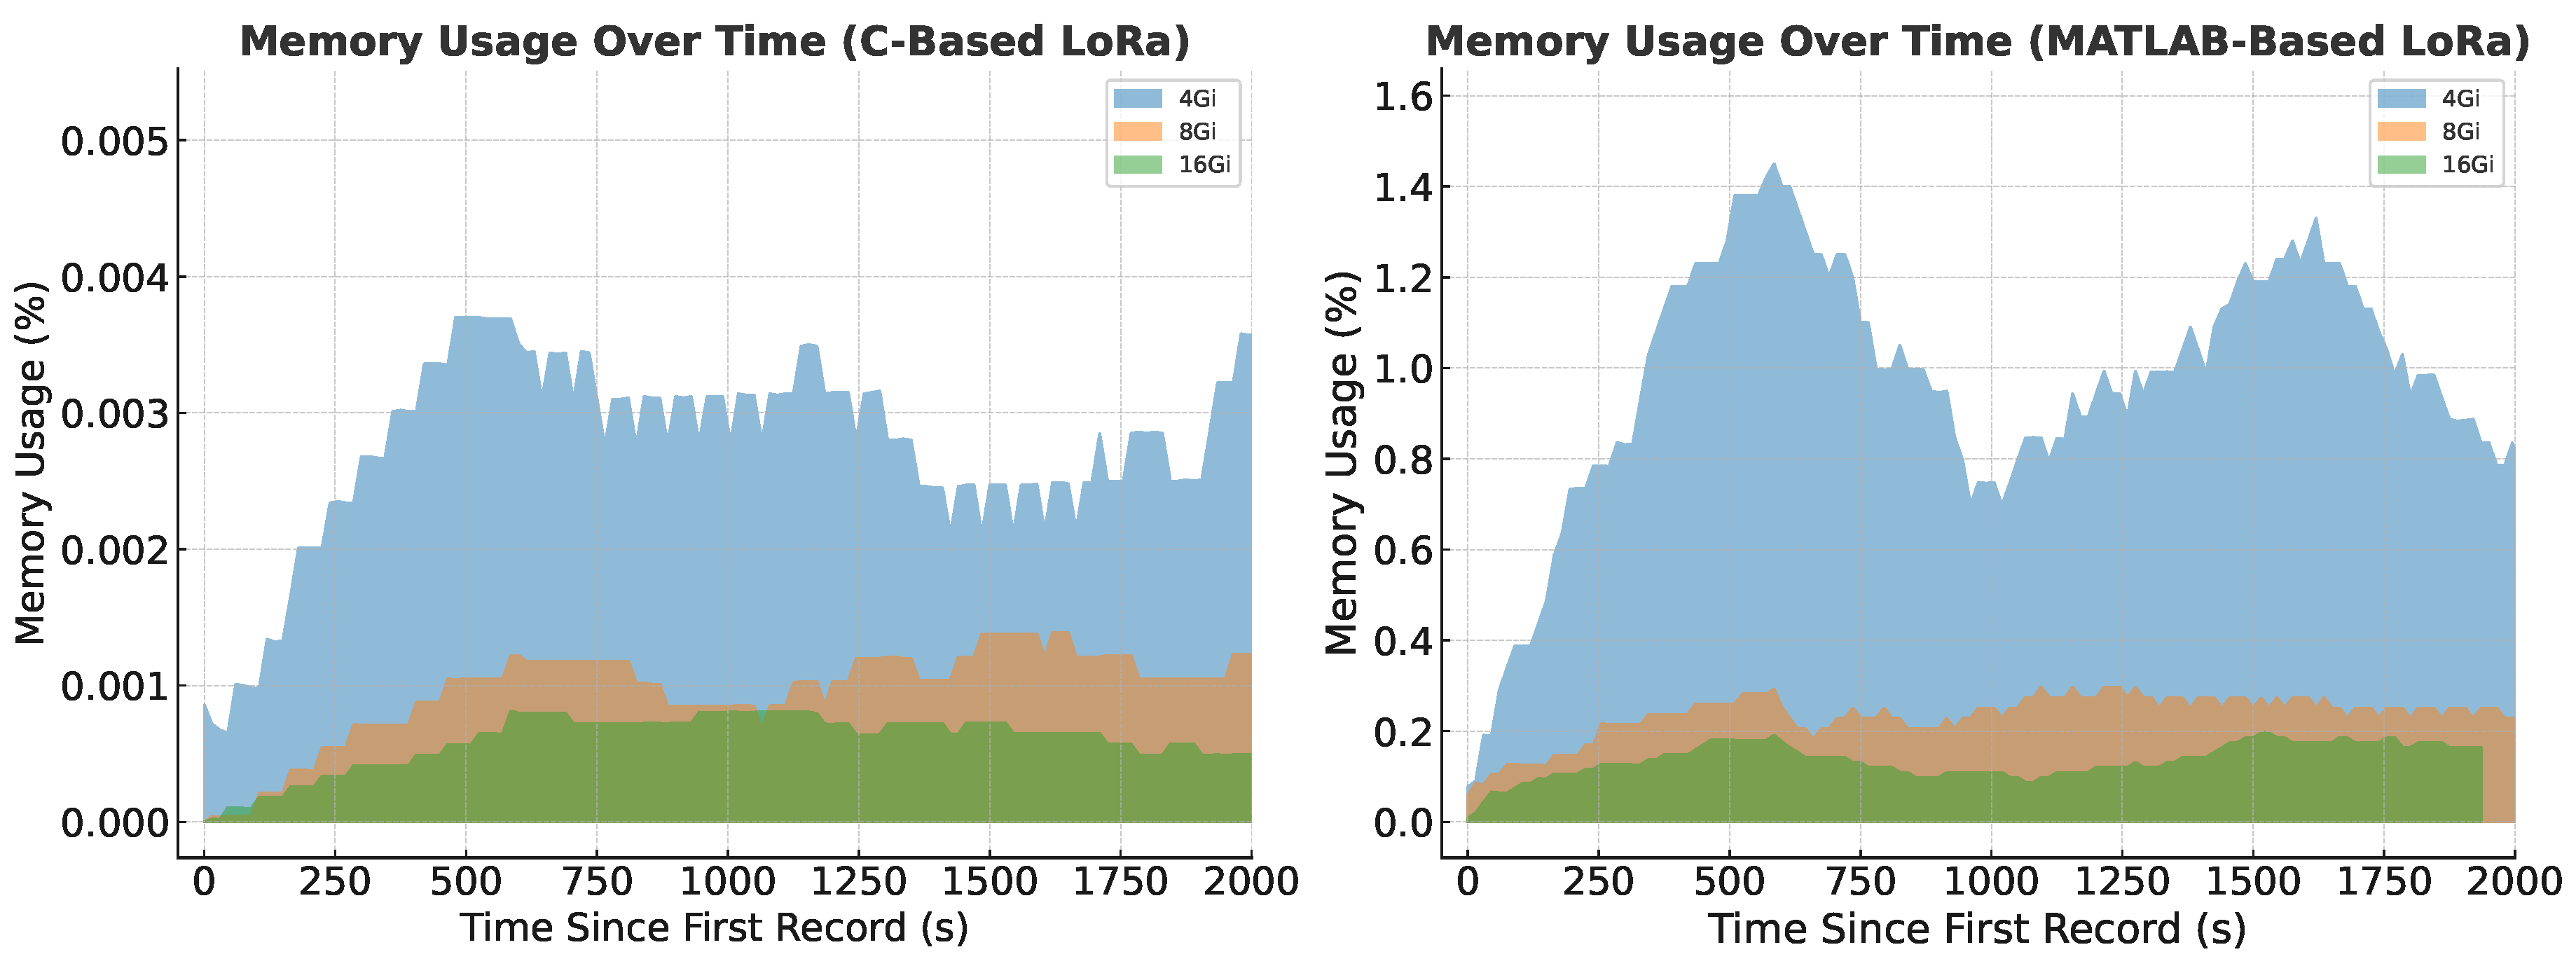
Figure 6.
Time-related metrics for each stage of the uplink message path across different experimental configurations.
Figure 6.
Time-related metrics for each stage of the uplink message path across different experimental configurations.
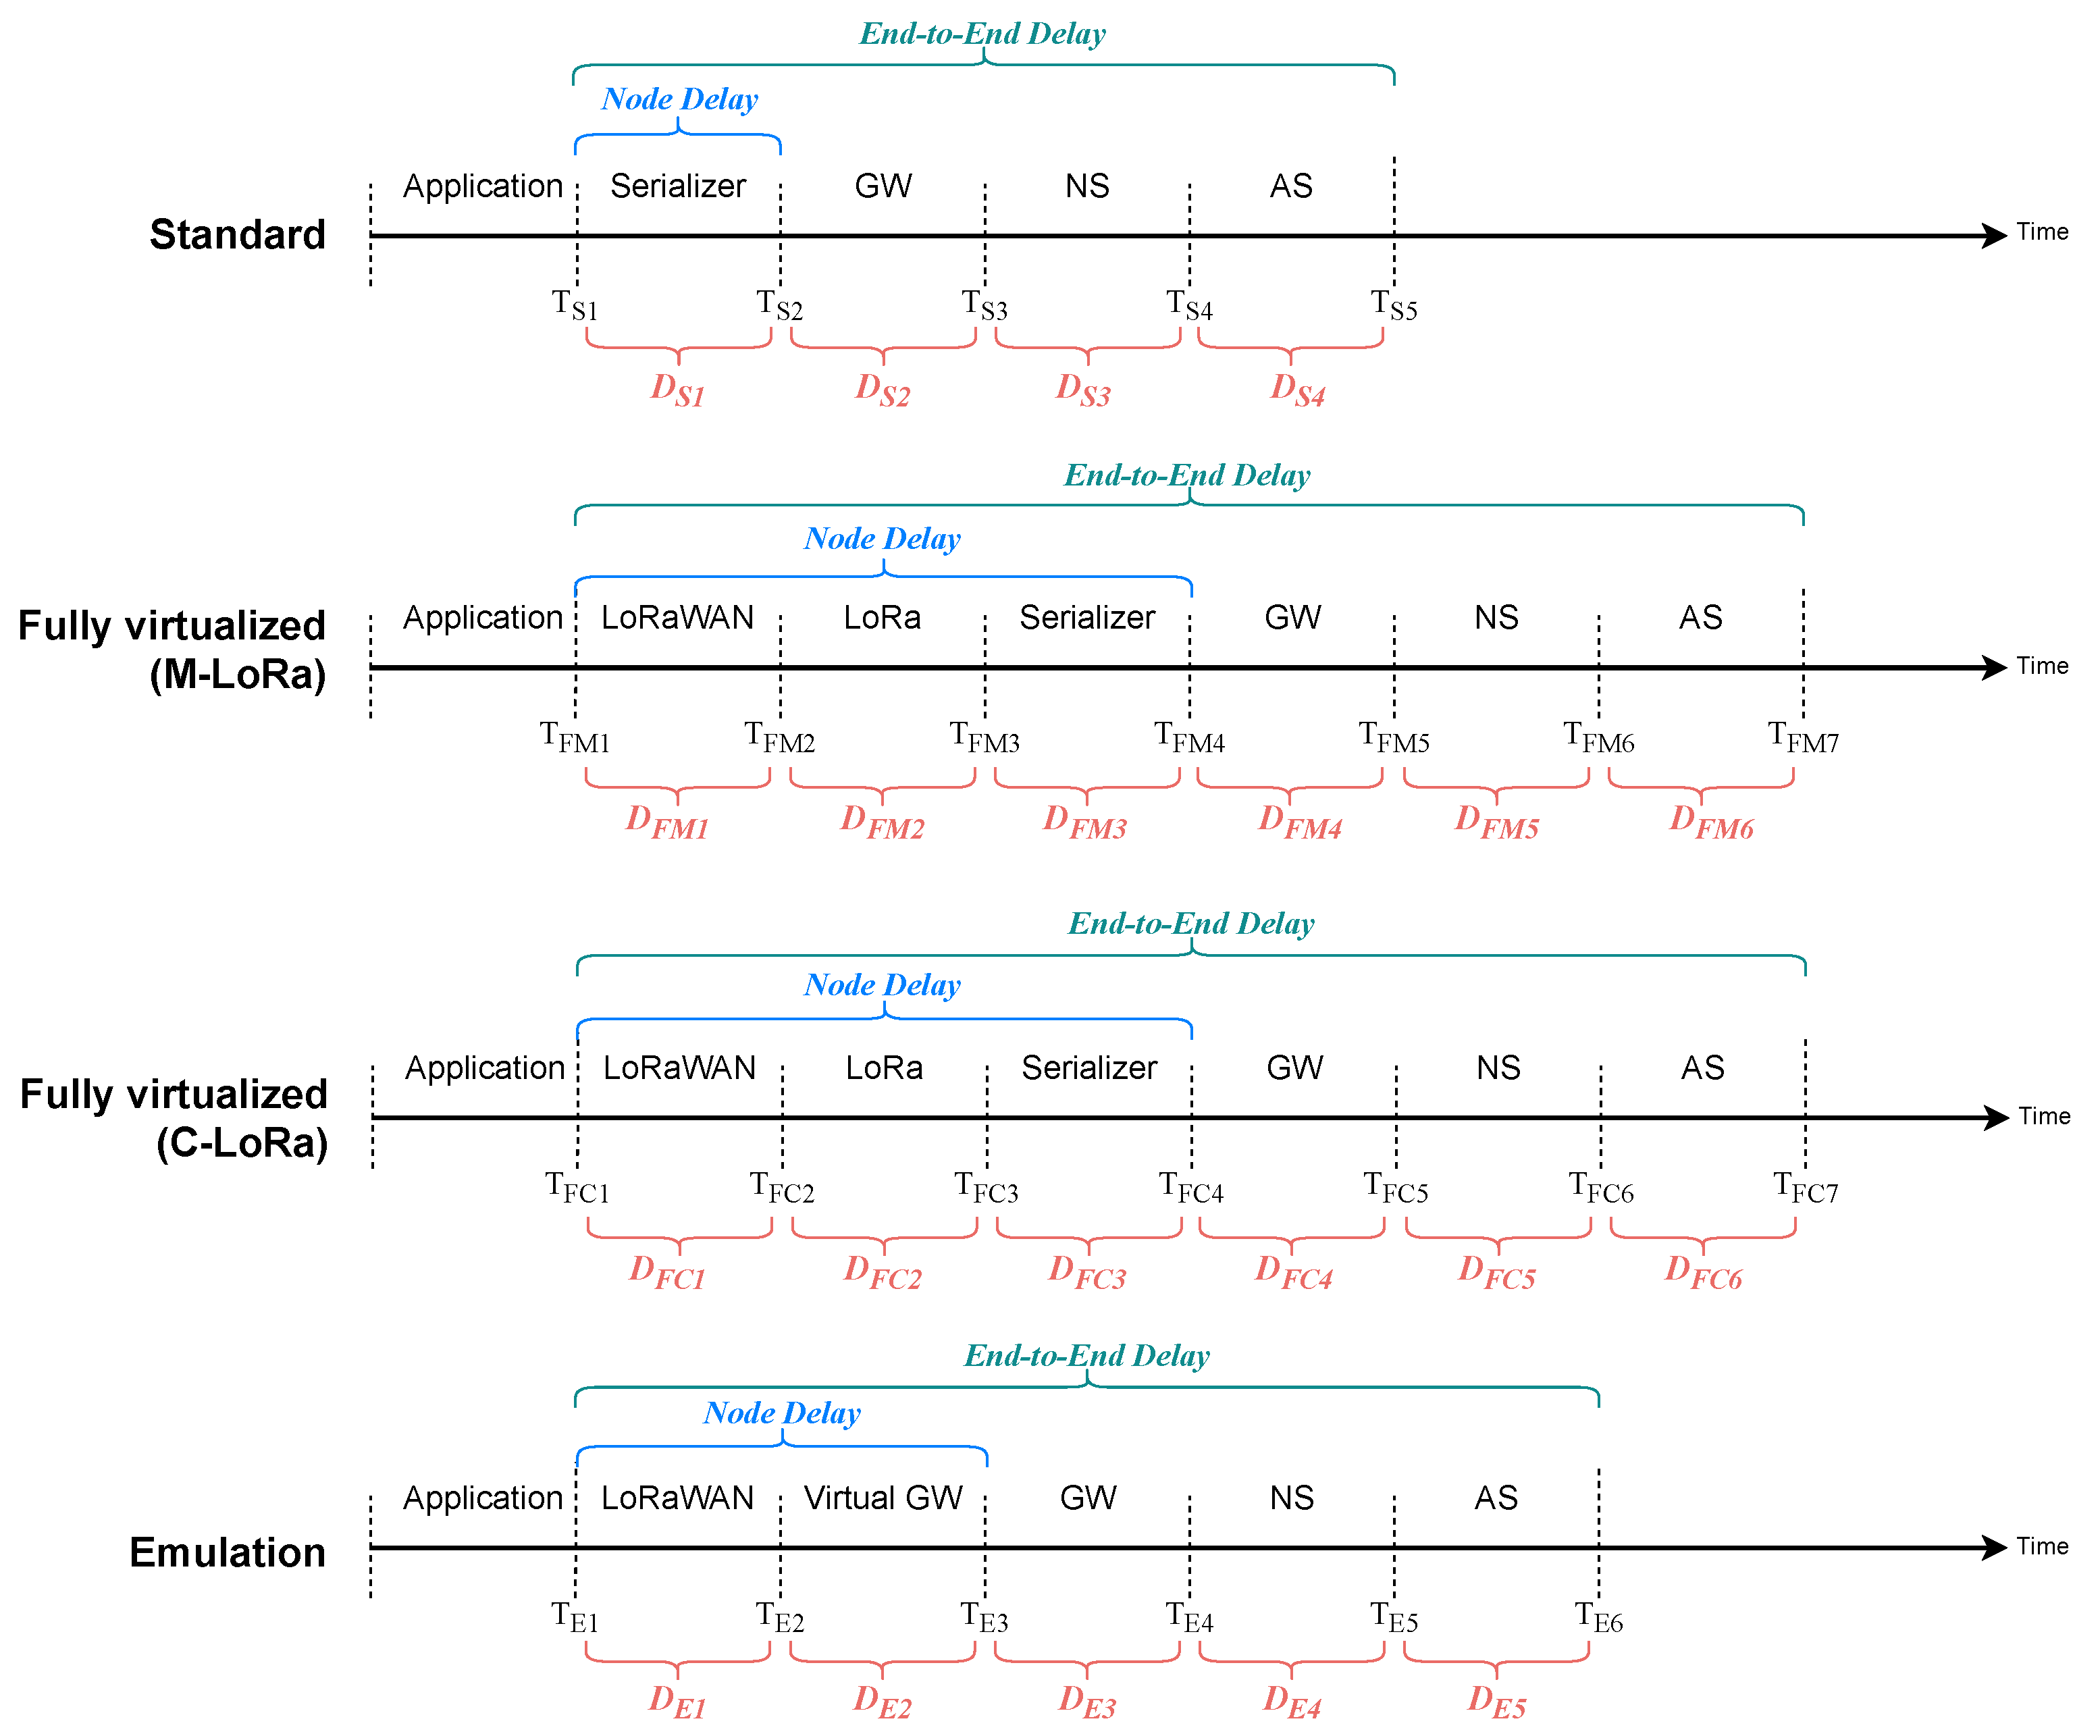
Figure 7.
End-to-End and Node delays for different vCPU cores in the Standard configuration.
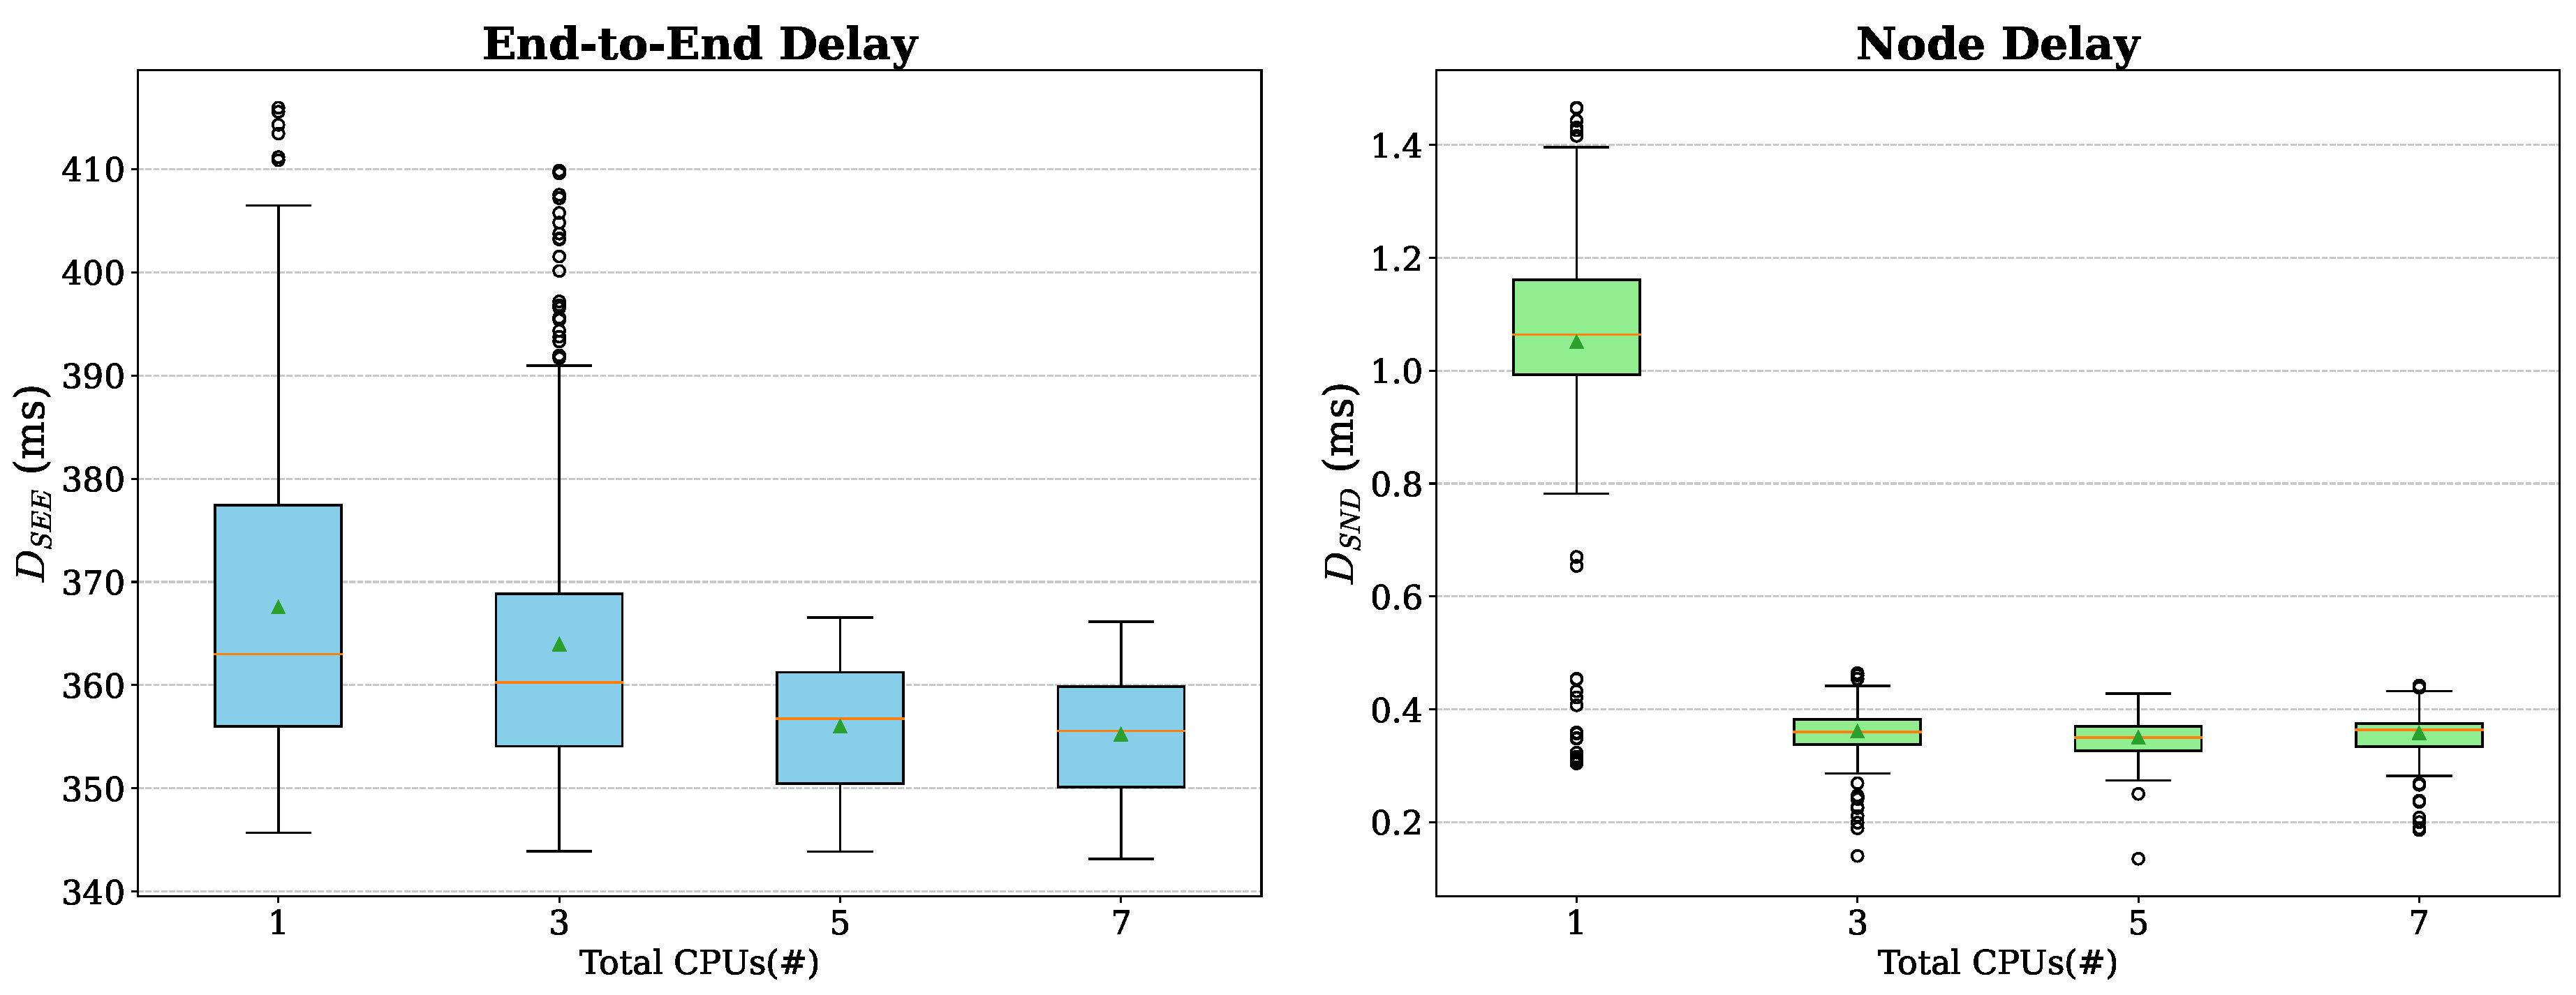
Figure 8.
End-to-End and Node delays for different vCPU cores in the Fully Virtualized (M-LoRa) configuration.
Figure 8.
End-to-End and Node delays for different vCPU cores in the Fully Virtualized (M-LoRa) configuration.
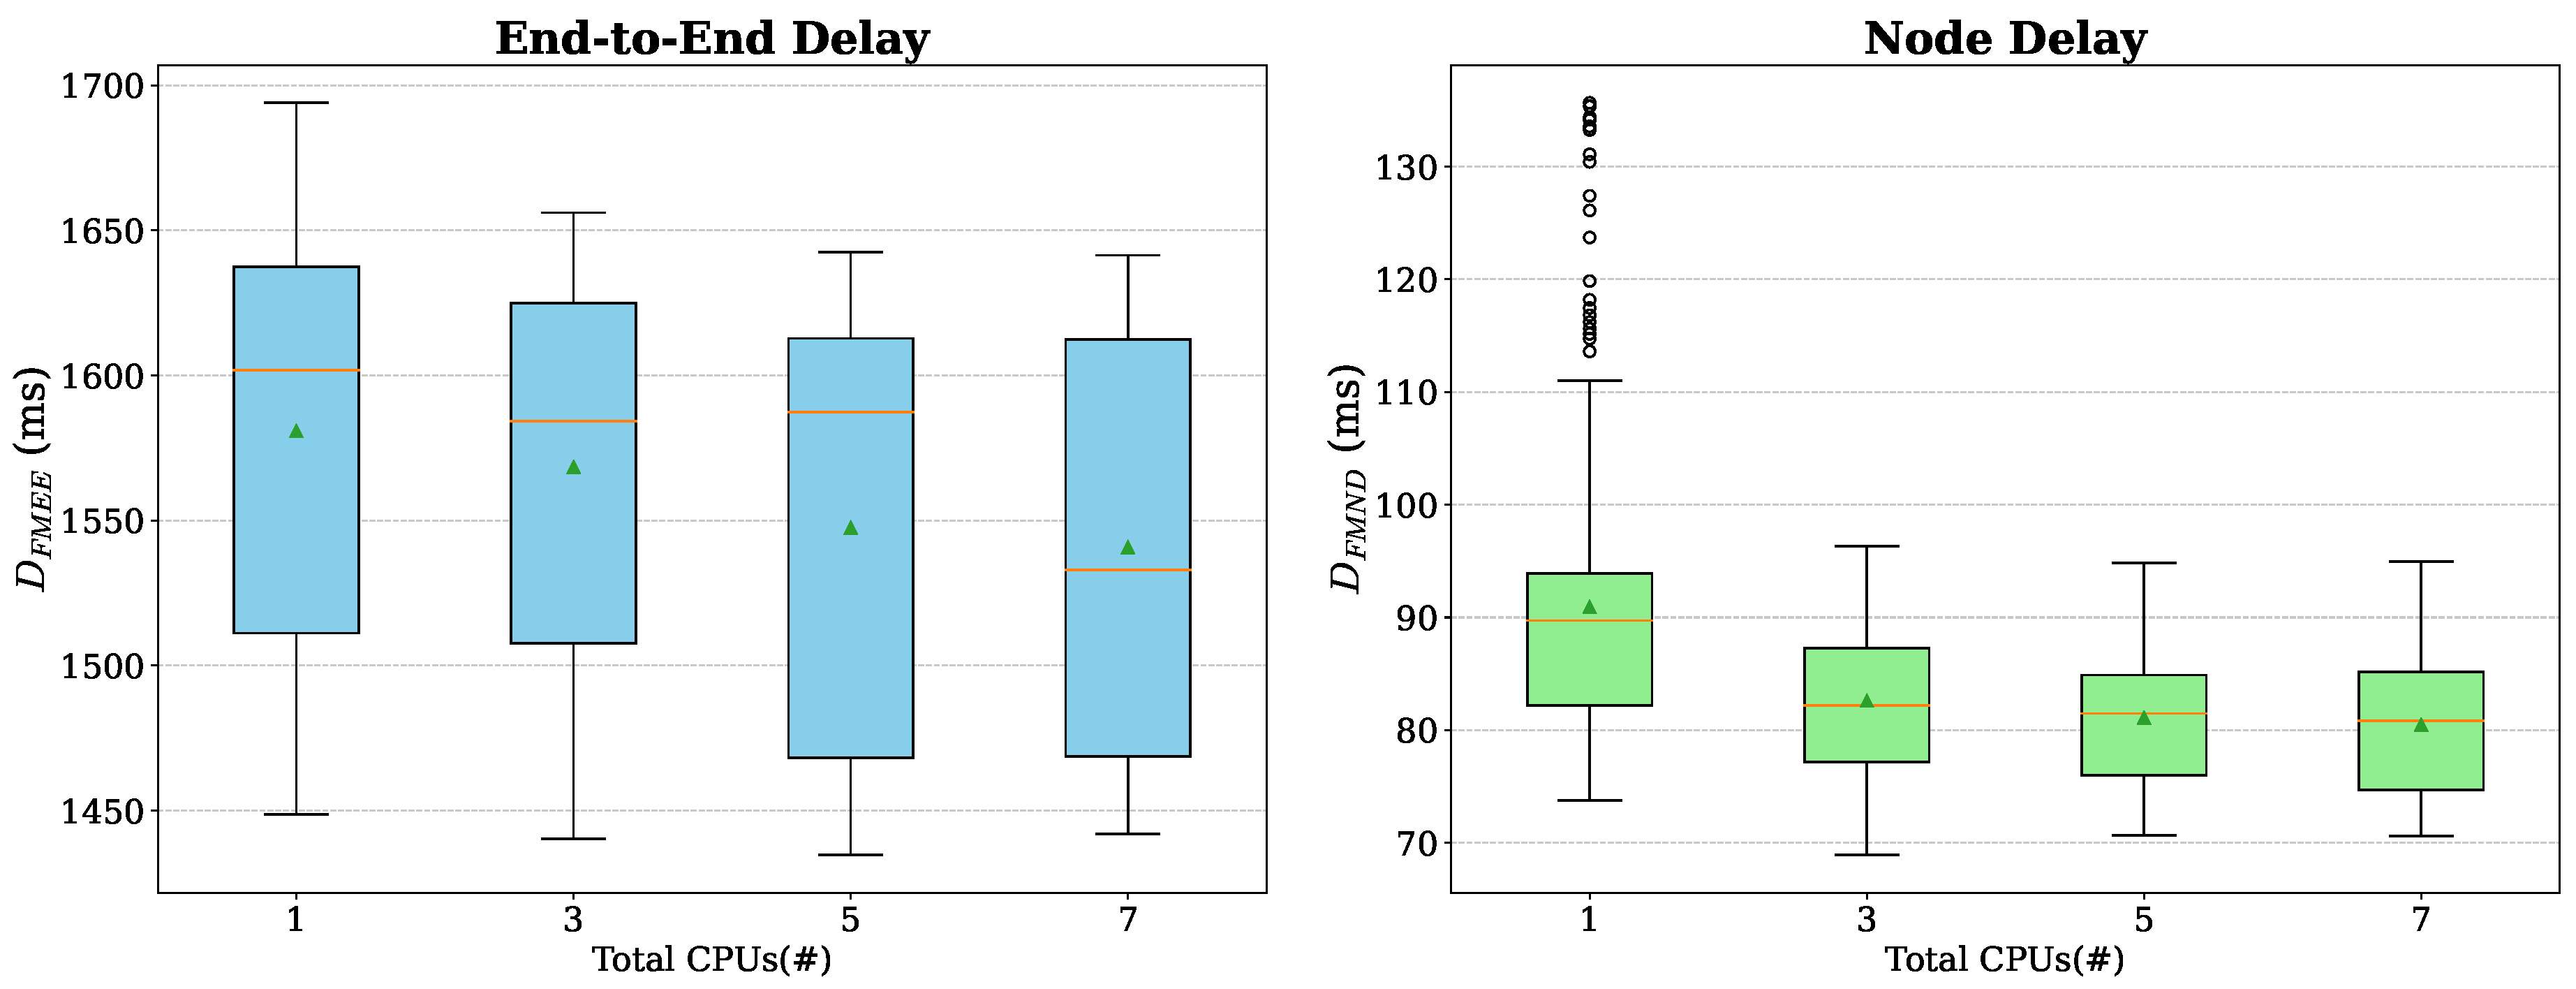
Figure 9.
End-to-End and Node delays for different vCPU cores in the Fully Virtualized (C-LoRa) configuration.
Figure 9.
End-to-End and Node delays for different vCPU cores in the Fully Virtualized (C-LoRa) configuration.
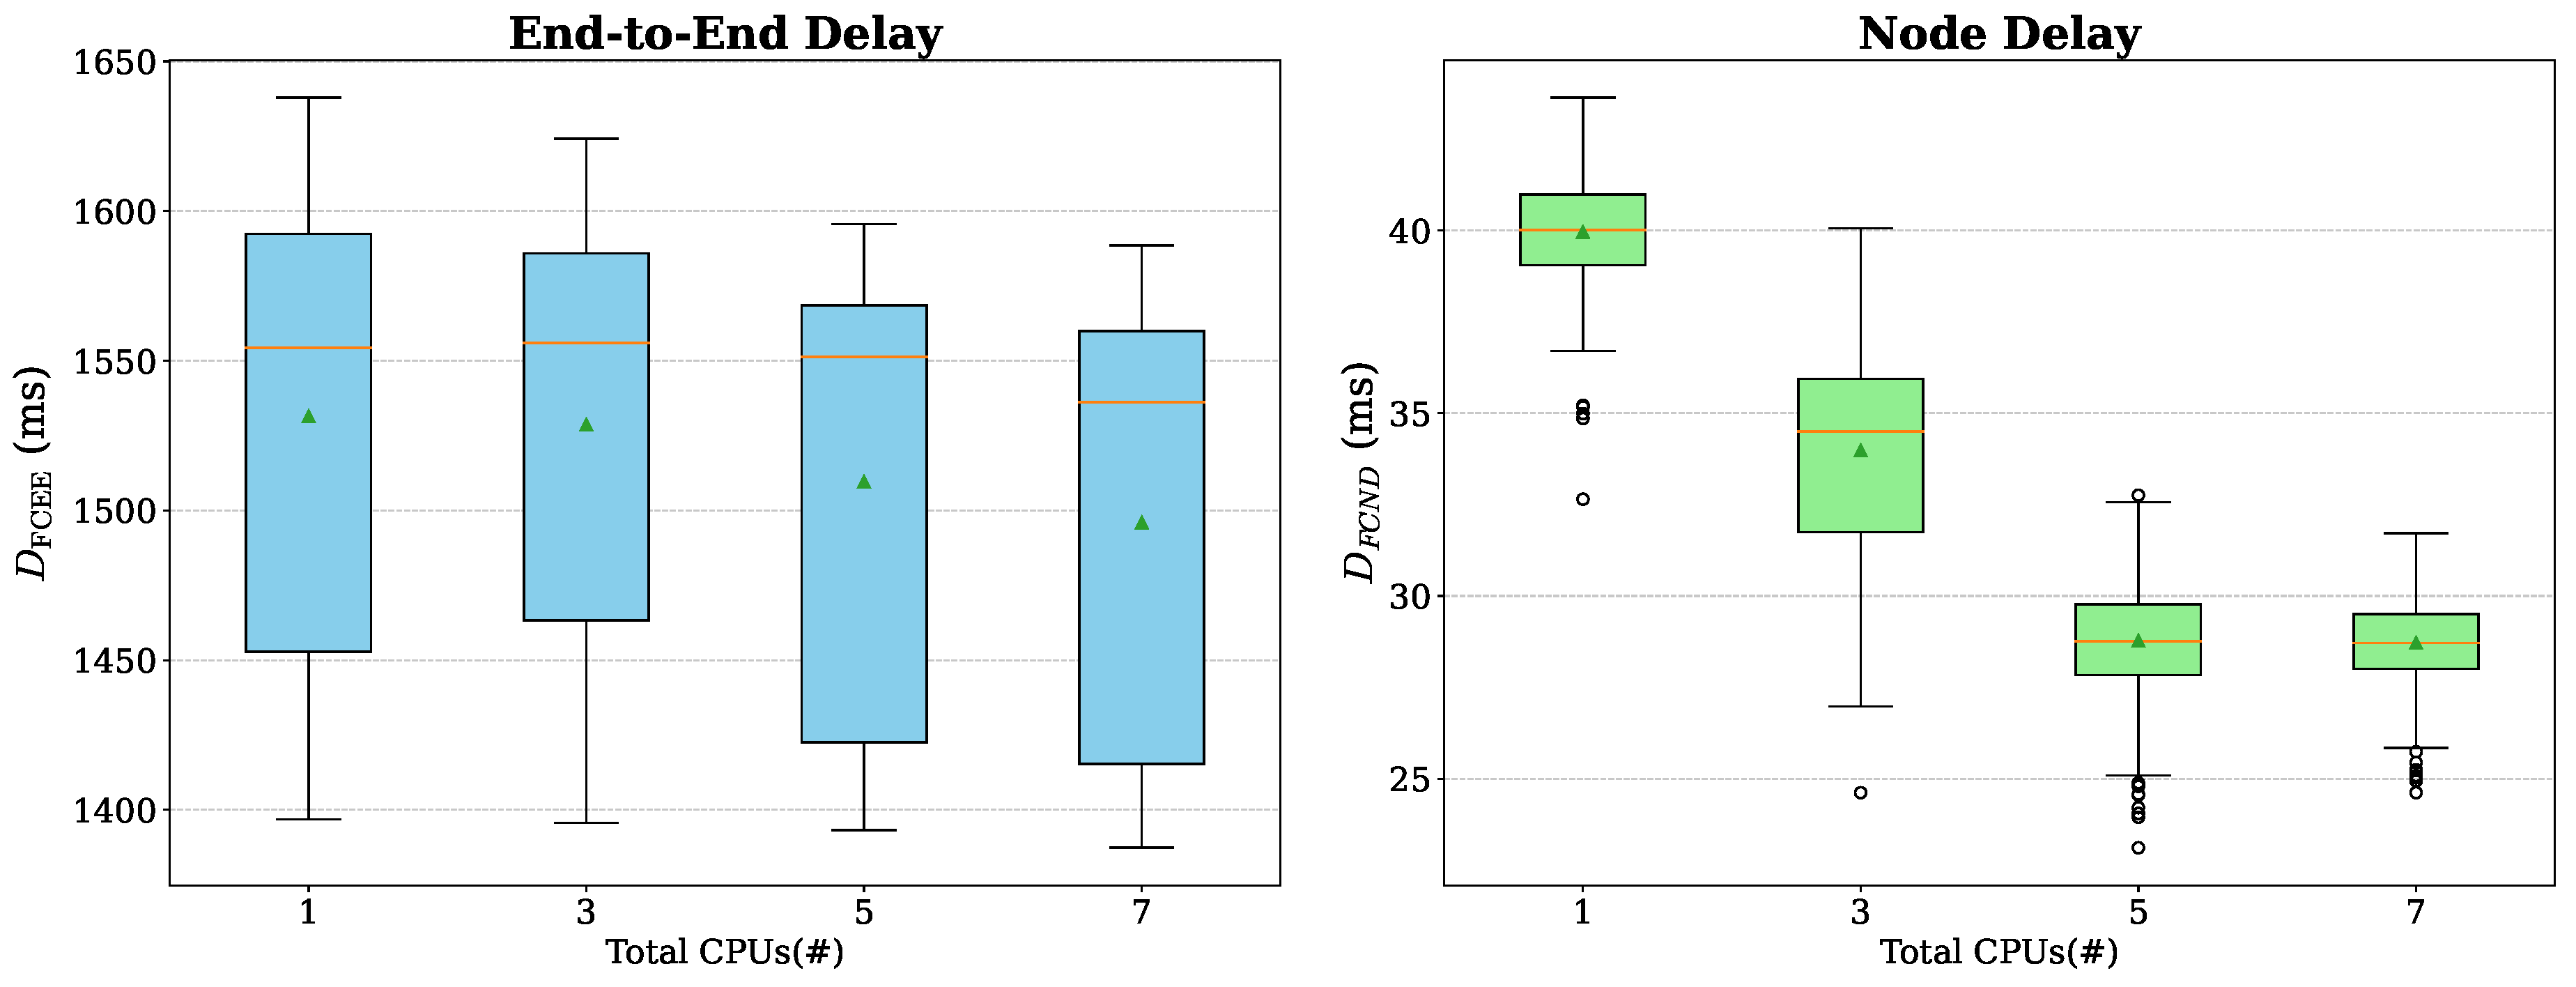
Figure 10.
End-to-End and Node delays for different vCPU cores in the Emulation configuration.
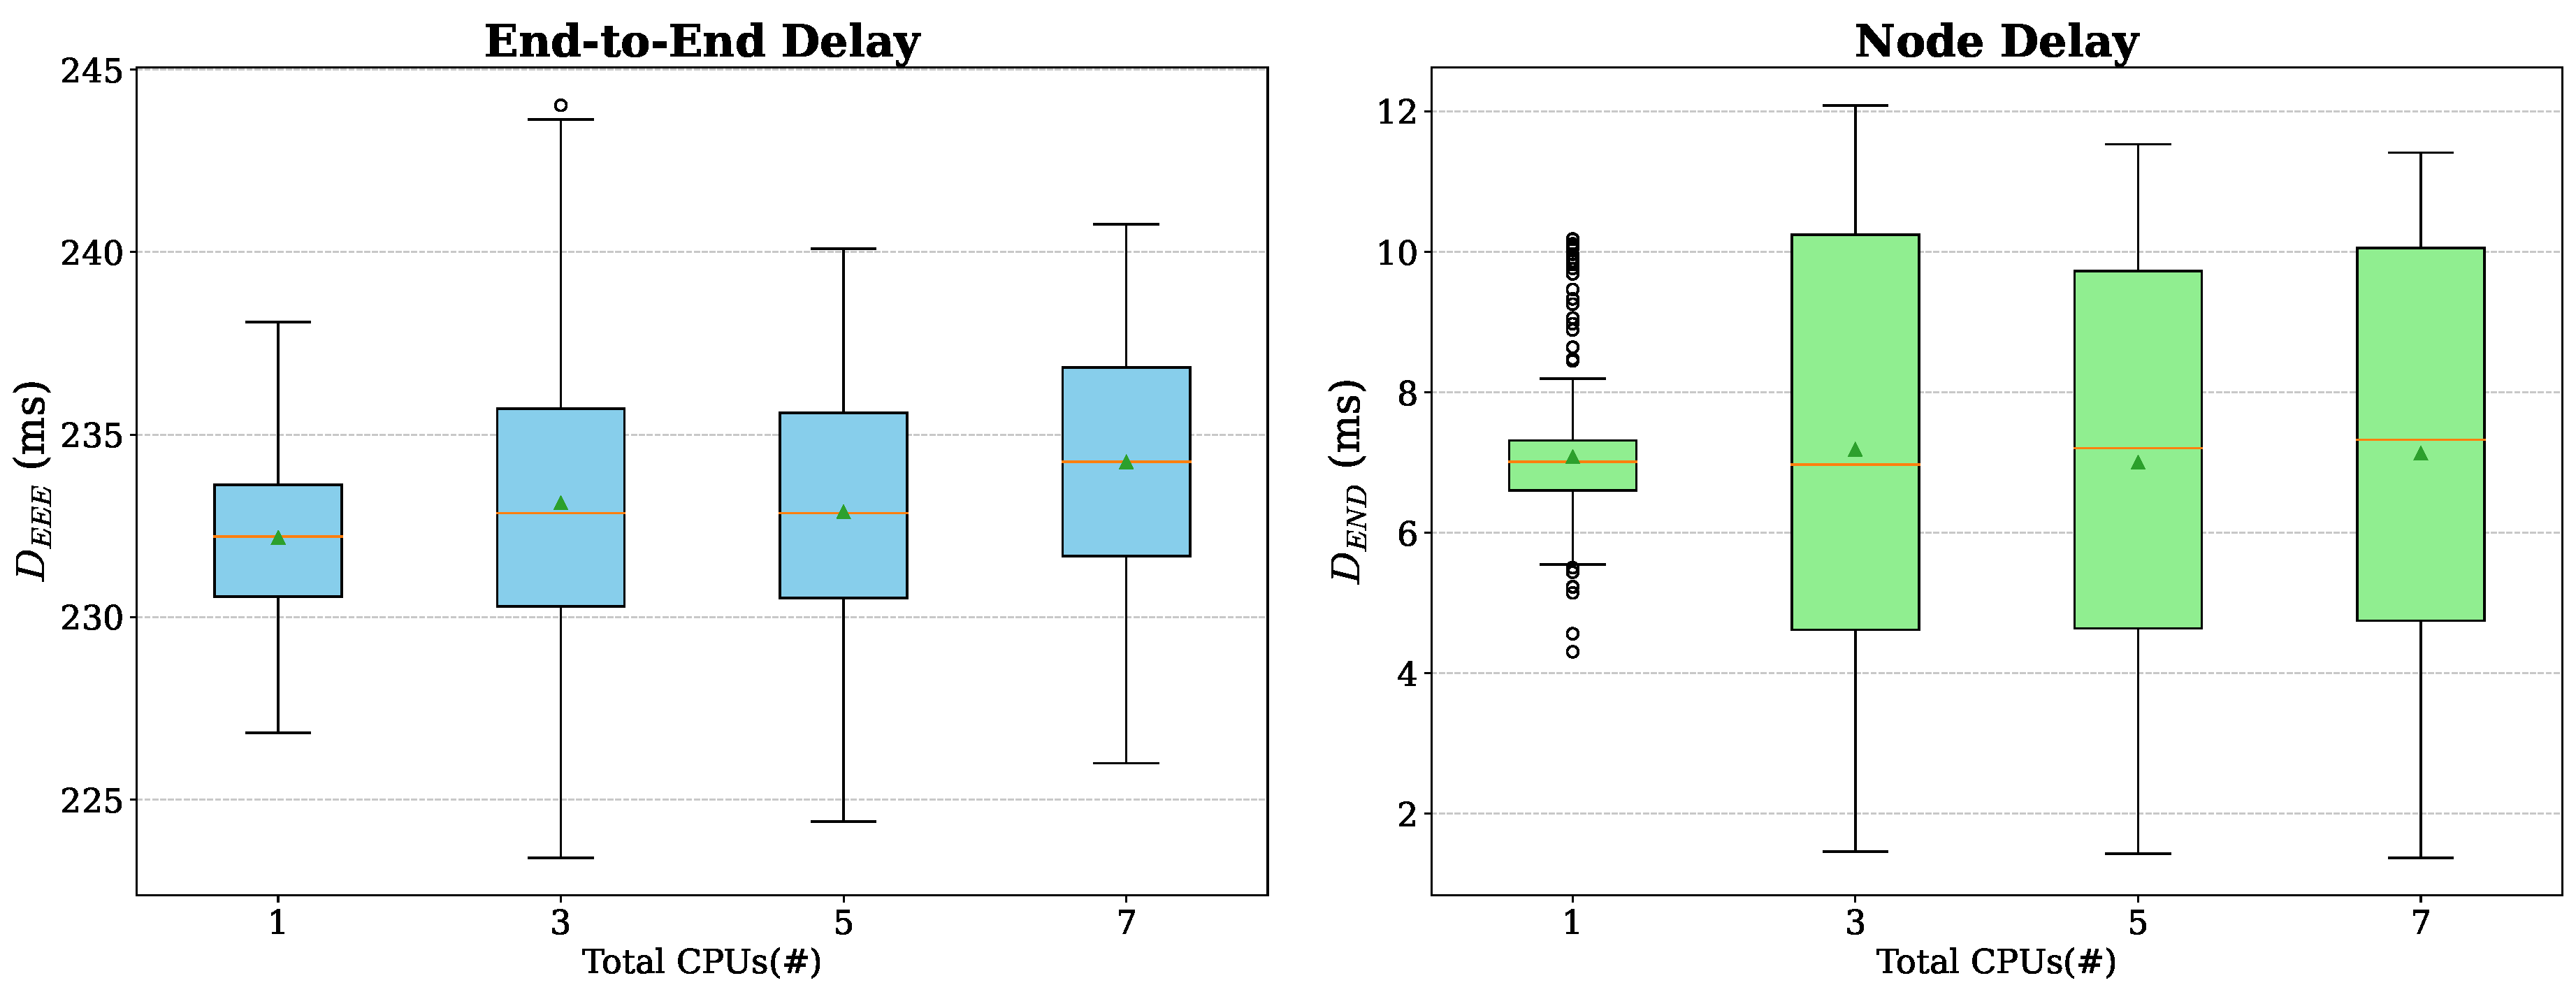

Table 1.
Hardware and Platform Specification of the Experimental Setup.
| Host Processor | Intel(R) Xeon(R) Silver 4208 CPU @ 2.10GHz (Cascadelake) |
| Host OS | Ubuntu Server 20.04.6 LTS |
| Guest vCPU Core (s) | {1, 3, 5, 7} Cores |
| Guest OS | Ubuntu 20.04.6 LTS |
| Guest vMemory | {4, 8, 16} GB |
| Guest vHardDisk | 215 GB |
| Platform | Docker 27.4.0, Docker compose 2.20.0, MATLAB R2023b |
| Monitoring Tools | cAdvisor v0.39.3, node-exporter v1.8.2, Prometheus v3.1.0, Grafana v11.4.0 |
Table 2.
Configuration Parameters for LoRaWAN end node Setup.
| Stack | Parameter | Assumption |
|---|---|---|
| Application | Payload Size | |
| Message Interval | ||
| Experimental Period | ||
| LoRaWAN | version | LoRaWAN Specification 1.0.4 |
| Class | A | |
| LoRa | Spreading Factor | |
| Coding Rate | ||
| Band | 868 MHz | |
| Bandwidth | ||
| Airtime |
Table 3.
Network Traffic
| Scenarios | Container | Network Traffic | |
|---|---|---|---|
| I | O | ||
| Standard | Application | 0 | 0.1 kB |
| Serializer | 0.4 kB | 1.2 kB | |
| Fully Virtualized (M-LoRa) | Application | 0 | 0.1 kB |
| LoRaWAN | 0.4 kB | 0.6 kB | |
| LoRa | 1.7 kB | 0.5 MB | |
| Serializer | 1.3 MB | 40 MB | |
| Fully Virtualized (C-LoRa) | Application | 0 | 0.1 kB |
| LoRaWAN | 0.4 kB | 0.6 kB | |
| LoRa | 1.7 kB | 0.5 MB | |
| Serializer | 1.3 MB | 40 MB | |
| Emulation | Application | 0 | 0.1 kB |
| LoRaWAN | 0.4 kB | 0.6 kB | |
| Virtual GW | 0.6 kB | 1.7 kB | |
Table 4.
Distribution of PIDs across CPU cores for containers in different experimental scenarios
| Scenarios | Container | CPU Cores | |||
|---|---|---|---|---|---|
| # 1 | # 3 | # 5 | # 7 | ||
| Standard | Application | 21 | 21 | 21 | 21 |
| Serializer | 1 | 1 | 1 | 1 | |
| Emulation | Application | 21 | 21 | 21 | 21 |
| LoRaWAN | 3 | 3 | 3 | 3 | |
| Virtual GW | 5 | 5 | 5 | 5 | |
| Fully Virtualized (C-LoRa) | Application | 21 | 21 | 21 | 21 |
| LoRaWAN | 3 | 3 | 3 | 3 | |
| LoRa | 1 | 1 | 1 | 1 | |
| Serializer | 5 | 5 | 5 | 5 | |
| Fully Virtualized (M-LoRa) | Application | 21 | 21 | 21 | 21 |
| LoRaWAN | 3 | 3 | 3 | 3 | |
| LoRa | 25 | 31 | 36 | 39 | |
| Serializer | 5 | 5 | 5 | 5 | |
Table 5.
Resume of time-related statistics for the Standard configuration.
| CPU# | Statistic (ms) | End-to-End | ||||
|---|---|---|---|---|---|---|
| CPU1 | Mean | 1.103 | 138.496 | 12.461 | 219.366 | 371.425 |
| Std | 0.400 | 10.478 | 9.271 | 22.767 | 23.785 | |
| Median | 1.071 | 137.309 | 19.168 | 208.269 | 363.636 | |
| Min | 0.304 | 120.324 | 0.556 | 202.886 | 345.685 | |
| Max | 6.838 | 159.625 | 30.921 | 359.219 | 516.022 | |
| 5th Pctl | 0.484 | 123.095 | 0.642 | 203.646 | 347.992 | |
| 95th Pctl | 1.497 | 156.833 | 20.509 | 260.058 | 416.620 | |
| CPU3 | Mean | 0.376 | 138.174 | 12.210 | 216.399 | 367.159 |
| Std | 0.092 | 10.574 | 8.907 | 18.713 | 19.706 | |
| Median | 0.362 | 137.456 | 18.889 | 207.070 | 361.409 | |
| Min | 0.140 | 120.250 | 0.560 | 203.083 | 343.897 | |
| Max | 1.295 | 161.385 | 26.186 | 298.126 | 451.522 | |
| 5th Pctl | 0.316 | 122.813 | 0.633 | 203.580 | 347.655 | |
| 95th Pctl | 0.467 | 156.853 | 19.678 | 260.683 | 410.096 | |
| CPU5 | Mean | 0.357 | 132.085 | 18.177 | 206.253 | 356.872 |
| Std | 0.050 | 6.810 | 3.325 | 4.435 | 7.414 | |
| Median | 0.352 | 132.091 | 18.861 | 205.137 | 357.266 | |
| Min | 0.135 | 120.232 | 0.758 | 202.522 | 343.874 | |
| Max | 0.710 | 157.389 | 29.595 | 245.883 | 396.458 | |
| 5th Pctl | 0.305 | 122.248 | 17.918 | 203.417 | 345.756 | |
| 95th Pctl | 0.429 | 141.138 | 19.618 | 212.657 | 366.738 | |
| CPU7 | Mean | 0.365 | 136.863 | 12.528 | 206.501 | 356.256 |
| Std | 0.049 | 11.034 | 9.340 | 4.184 | 7.567 | |
| Median | 0.366 | 135.949 | 19.508 | 205.521 | 356.014 | |
| Min | 0.186 | 119.126 | 0.636 | 202.592 | 343.174 | |
| Max | 0.744 | 159.278 | 41.206 | 231.535 | 406.053 | |
| 5th Pctl | 0.318 | 120.957 | 0.693 | 203.455 | 345.833 | |
| 95th Pctl | 0.446 | 155.653 | 20.201 | 215.862 | 366.599 |
Table 6.
Resume of time-related statistics for the Fully Virtualized (M-LoRa) configuration.
| CPU# | Statistic (ms) | End-to-End | ||||||
|---|---|---|---|---|---|---|---|---|
| CPU1 | Mean | 3.077 | 63.747 | 28.435 | 1254.330 | 19.093 | 221.506 | 1590.188 |
| Std | 0.757 | 22.839 | 7.938 | 66.981 | 1.008 | 42.424 | 84.692 | |
| Median | 2.977 | 57.090 | 29.614 | 1271.438 | 18.945 | 209.555 | 1604.391 | |
| Min | 0.157 | 49.896 | 16.147 | 1136.795 | 18.080 | 203.078 | 1448.641 | |
| Max | 6.942 | 338.310 | 109.459 | 1367.985 | 35.139 | 889.988 | 2254.066 | |
| 5th Pctl | 2.691 | 54.845 | 17.019 | 1153.186 | 18.782 | 203.842 | 1468.904 | |
| 95th Pctl | 3.809 | 102.914 | 36.966 | 1336.185 | 19.833 | 272.145 | 1694.090 | |
| CPU3 | Mean | 0.499 | 65.664 | 18.728 | 1258.625 | 19.037 | 212.172 | 1574.725 |
| Std | 0.418 | 16.297 | 3.671 | 62.712 | 0.413 | 13.728 | 67.151 | |
| Median | 0.270 | 64.332 | 18.102 | 1275.234 | 18.930 | 206.596 | 1591.873 | |
| Min | 0.117 | 53.600 | 14.368 | 1142.156 | 18.729 | 203.102 | 1440.253 | |
| Max | 2.103 | 300.902 | 67.459 | 1347.932 | 23.384 | 290.774 | 1903.769 | |
| 5th Pctl | 0.213 | 55.861 | 15.310 | 1156.576 | 18.797 | 203.727 | 1466.188 | |
| 95th Pctl | 1.411 | 76.755 | 23.123 | 1332.375 | 19.744 | 244.304 | 1656.257 | |
| CPU5 | Mean | 0.273 | 65.453 | 17.390 | 1245.473 | 18.198 | 206.604 | 1553.391 |
| Std | 0.126 | 13.885 | 2.904 | 73.764 | 0.453 | 3.778 | 75.676 | |
| Median | 0.219 | 65.186 | 17.367 | 1288.709 | 18.022 | 205.442 | 1592.710 | |
| Min | 0.089 | 55.081 | 13.886 | 1134.827 | 17.733 | 203.003 | 1434.621 | |
| Max | 0.894 | 248.150 | 62.538 | 1349.601 | 20.639 | 231.533 | 1842.127 | |
| 5th Pctl | 0.199 | 56.918 | 14.865 | 1146.110 | 17.866 | 203.730 | 1450.479 | |
| 95th Pctl | 0.602 | 77.618 | 19.945 | 1333.669 | 19.169 | 212.677 | 1642.595 | |
| CPU7 | Mean | 0.244 | 64.854 | 17.202 | 1238.718 | 18.332 | 207.290 | 1546.640 |
| Std | 0.088 | 13.308 | 2.502 | 74.188 | 0.724 | 4.642 | 74.625 | |
| Median | 0.218 | 65.012 | 17.176 | 1271.380 | 18.352 | 206.605 | 1577.603 | |
| Min | 0.105 | 52.474 | 13.570 | 1138.849 | 17.443 | 203.579 | 1441.945 | |
| Max | 0.949 | 258.073 | 57.379 | 1355.924 | 21.150 | 258.361 | 1703.294 | |
| 5th Pctl | 0.203 | 55.797 | 14.786 | 1147.882 | 17.519 | 203.972 | 1451.935 | |
| 95th Pctl | 0.317 | 77.103 | 19.044 | 1331.395 | 19.560 | 212.428 | 1641.435 |
Table 7.
Resume of time-related statistics for the Fully Virtualized (C-LoRa) configuration.
| CPU# | Statistic (ms) | End-to-End | ||||||
|---|---|---|---|---|---|---|---|---|
| CPU1 | Mean | 2.975 | 24.172 | 13.162 | 1261.525 | 19.994 | 215.693 | 1537.520 |
| Std | 0.547 | 1.702 | 1.448 | 70.653 | 1.259 | 17.722 | 75.449 | |
| Median | 2.963 | 23.926 | 13.000 | 1289.530 | 19.791 | 207.085 | 1565.277 | |
| Min | 0.133 | 18.140 | 8.000 | 1132.531 | 19.565 | 203.063 | 1396.831 | |
| Max | 5.558 | 33.081 | 19.000 | 1362.278 | 35.340 | 296.815 | 1691.212 | |
| 5th Pctl | 2.437 | 22.210 | 11.000 | 1152.206 | 19.648 | 203.912 | 1419.026 | |
| 95th Pctl | 3.593 | 26.648 | 16.000 | 1348.793 | 20.702 | 257.668 | 1637.980 | |
| CPU3 | Mean | 0.400 | 26.451 | 7.673 | 1267.809 | 19.689 | 212.490 | 1534.513 |
| Std | 0.368 | 2.963 | 2.558 | 68.490 | 1.187 | 14.757 | 71.085 | |
| Median | 0.251 | 25.908 | 8.000 | 1297.608 | 19.607 | 206.513 | 1561.665 | |
| Min | 0.083 | 15.525 | 3.000 | 1136.675 | 18.626 | 203.088 | 1395.617 | |
| Max | 2.428 | 58.778 | 18.000 | 1364.697 | 33.113 | 306.447 | 1668.700 | |
| 5th Pctl | 0.211 | 23.987 | 4.000 | 1155.515 | 18.752 | 203.759 | 1417.508 | |
| 95th Pctl | 1.228 | 31.007 | 11.150 | 1346.367 | 20.388 | 241.613 | 1624.121 | |
| CPU5 | Mean | 0.290 | 22.851 | 5.905 | 1259.138 | 19.360 | 206.594 | 1514.137 |
| Std | 0.195 | 1.418 | 1.469 | 72.263 | 1.767 | 4.180 | 72.185 | |
| Median | 0.219 | 22.568 | 6.000 | 1299.792 | 19.178 | 205.624 | 1553.839 | |
| Min | 0.190 | 18.939 | 2.000 | 1138.660 | 17.921 | 203.061 | 1393.222 | |
| Max | 1.601 | 31.693 | 13.000 | 1352.913 | 49.466 | 244.842 | 1609.577 | |
| 5th Pctl | 0.200 | 21.139 | 3.000 | 1152.890 | 18.062 | 203.780 | 1408.988 | |
| 95th Pctl | 0.696 | 25.231 | 8.000 | 1339.763 | 20.401 | 212.012 | 1595.753 | |
| CPU7 | Mean | 0.236 | 22.656 | 6.043 | 1247.001 | 19.356 | 206.102 | 1501.395 |
| Std | 0.059 | 1.193 | 1.235 | 72.868 | 0.838 | 3.073 | 72.973 | |
| Median | 0.221 | 22.410 | 6.000 | 1288.602 | 19.171 | 205.388 | 1541.454 | |
| Min | 0.142 | 20.725 | 2.000 | 1130.179 | 18.938 | 202.792 | 1387.329 | |
| Max | 0.744 | 30.936 | 10.000 | 1346.013 | 30.304 | 237.397 | 1598.844 | |
| 5th Pctl | 0.205 | 21.167 | 4.000 | 1149.004 | 18.999 | 203.656 | 1402.240 | |
| 95th Pctl | 0.288 | 24.467 | 8.000 | 1334.168 | 20.216 | 209.989 | 1588.620 |
Table 8.
Resume of time-related statistics for the Emulation configuration
| CPU# | Statistic (ms) | End-to-End | |||||
|---|---|---|---|---|---|---|---|
| CPU1 | Mean | 2.988 | 4.310 | 17.661 | 1.041 | 206.644 | 232.644 |
| Std | 0.973 | 0.933 | 0.706 | 0.862 | 2.615 | 3.100 | |
| Median | 2.911 | 4.182 | 17.950 | 0.834 | 206.471 | 232.328 | |
| Min | 0.298 | 1.981 | 14.607 | 0.584 | 203.115 | 226.830 | |
| Max | 7.941 | 9.060 | 20.237 | 11.394 | 225.908 | 252.066 | |
| 5th Pctl | 1.346 | 3.391 | 16.714 | 0.666 | 203.524 | 228.716 | |
| 95th Pctl | 5.301 | 6.313 | 18.305 | 2.114 | 211.176 | 238.089 | |
| CPU3 | Mean | 0.516 | 6.950 | 18.090 | 1.382 | 207.329 | 234.266 |
| Std | 0.351 | 3.087 | 1.705 | 4.954 | 4.189 | 7.333 | |
| Median | 0.347 | 6.900 | 17.687 | 0.821 | 206.565 | 233.118 | |
| Min | 0.156 | 1.137 | 15.566 | 0.591 | 202.669 | 223.405 | |
| Max | 2.243 | 13.362 | 25.468 | 85.180 | 239.199 | 313.516 | |
| 5th Pctl | 0.296 | 2.033 | 16.048 | 0.652 | 203.606 | 227.222 | |
| 95th Pctl | 1.334 | 11.380 | 19.917 | 2.047 | 216.235 | 244.661 | |
| CPU5 | Mean | 0.378 | 6.871 | 18.553 | 0.985 | 206.696 | 233.484 |
| Std | 0.136 | 3.051 | 0.187 | 0.942 | 3.073 | 4.410 | |
| Median | 0.336 | 7.039 | 18.567 | 0.831 | 206.303 | 233.127 | |
| Min | 0.170 | 1.122 | 17.536 | 0.574 | 202.859 | 224.395 | |
| Max | 1.486 | 11.861 | 19.649 | 16.581 | 226.068 | 256.010 | |
| 5th Pctl | 0.307 | 1.709 | 18.138 | 0.652 | 203.285 | 227.087 | |
| 95th Pctl | 0.645 | 11.170 | 18.761 | 1.674 | 211.360 | 240.102 | |
| CPU7 | Mean | 0.370 | 6.990 | 19.715 | 0.989 | 206.958 | 235.021 |
| Std | 0.105 | 3.011 | 0.351 | 0.665 | 4.592 | 5.544 | |
| Median | 0.333 | 7.185 | 19.679 | 0.834 | 206.496 | 234.724 | |
| Min | 0.199 | 1.052 | 19.016 | 0.599 | 202.755 | 225.999 | |
| Max | 1.201 | 11.653 | 23.148 | 9.318 | 265.534 | 296.767 | |
| 5th Pctl | 0.310 | 1.908 | 19.440 | 0.655 | 203.519 | 228.480 | |
| 95th Pctl | 0.601 | 11.018 | 19.920 | 1.892 | 211.362 | 240.759 |
Disclaimer/Publisher’s Note: The statements, opinions and data contained in all publications are solely those of the individual author(s) and contributor(s) and not of MDPI and/or the editor(s). MDPI and/or the editor(s) disclaim responsibility for any injury to people or property resulting from any ideas, methods, instructions or products referred to in the content. |
© 2025 by the authors. Licensee MDPI, Basel, Switzerland. This article is an open access article distributed under the terms and conditions of the Creative Commons Attribution (CC BY) license (http://creativecommons.org/licenses/by/4.0/).
Copyright: This open access article is published under a Creative Commons CC BY 4.0 license, which permit the free download, distribution, and reuse, provided that the author and preprint are cited in any reuse.


