Preprint
Article

This version is not peer-reviewed.

Comprehensive Analysis of a PV System Integrated with Battery Storage, Electric Vehicle (EV) Charging, and Smart Energy Management

A peer-reviewed article of this preprint also exists.

Submitted:

19 February 2025

Posted:

20 February 2025

You are already at the latest version

Abstract

The transition to renewable energy is a crucial step toward sustainability and integrating photovoltaic (PV) systems with battery storage and electric vehicle (EV) charging plays a key role in optimizing energy consumption and reducing reliance on fossil fuels. This study examines the design, performance, and impact of a grid-connected PV system in Constanta, Romania, assessing its ability to enhance energy efficiency, improve self-sufficiency, and contribute to environmental sustainability. By leveraging battery storage, surplus solar power is retained for later use, reducing dependency on the grid and ensuring a stable electricity supply. The study further investigates the economic and environmental benefits of renewable energy integration, including reductions in carbon emissions and operational costs. The analysis was conducted using PV*SOL for system simulation and performance evaluation, while Global Solar Atlas provided solar irradiance data for accurate energy yield assessment. The results demonstrate that integrating PV systems with battery storage and EV charging significantly enhances energy independence, with 92.2% of total consumption covered by solar energy and a reduction of 6239 kg in CO₂ emissions annually. This research provides a comprehensive model for renewable energy adoption, supporting the transition toward a cleaner and more sustainable energy.

Keywords: 
;  ;  ;  ;  ;  ;  

1. Introduction

The integration of photovoltaic (PV) systems, battery storage, and electric vehicle (EV) charging has emerged as a critical strategy for enhancing energy sustainability and efficiency [1]. The transition to renewable energy is driven by the need to reduce carbon emissions, enhance energy security, and optimize resource utilization [2]. Numerous studies have explored various aspects of renewable energy integration, providing valuable insights into system performance, economic feasibility, and environmental impact [3].
The growing demand for sustainable energy solutions has highlighted the importance of solar power as a key renewable resource [4]. By integrating solar PV systems with battery storage, households and businesses can maximize self-consumption, store surplus energy for later use, and ensure a stable energy supply. Additionally, with the rise of electric vehicles, leveraging solar energy for EV charging further promotes sustainability by reducing dependence on fossil fuels and lowering transportation-related emissions [5]. The integration of smart energy management further enhances system performance by efficiently distributing power between different components, optimizing energy flows, and minimizing waste [6]. This approach not only supports cost savings but also contributes to a more resilient and decentralized energy infrastructure capable of withstanding fluctuations in energy demand and supply [7].
This study explores the design, implementation, and benefits of a grid-connected PV system integrated with battery storage and EV charging in Constanta, Romania. The key objectives include assessing solar potential in the region and its suitability for energy generation, analyzing energy consumption patterns to determine how solar energy can be effectively utilized, evaluating battery storage efficiency in balancing energy supply and demand, examining the role of EV charging in promoting clean transportation, and investigating economic and environmental benefits, including carbon footprint reduction and energy cost savings [8].
Many studies have been conducted on this topic for instance, Green [9] reviewed photovoltaic technologies and their role in energy policy, emphasizing efficiency improvements and cost reductions. Similarly, Firoozzadeh et al. [10] investigated methods to enhance PV panel efficiency using phase change materials, demonstrating potential performance gains. Several studies have focused on hybrid renewable energy systems, such as Babatunde et al. [11], who examined off-grid PV-micro wind turbine systems with hydrogen and battery storage, showing improved energy reliability. Additionally, Ma et al. [12] optimized solar and air-source heat pump systems to enhance heating efficiency, contributing to overall energy savings.
The role of PV integration in transportation has also been a subject of extensive research. Osman et al. [13] analyzed renewable energy participation in Sudan, emphasizing the impact of solar energy on sustainable transportation. Furthermore, Zakaria et al. [14] developed models for large-scale PV power plants, addressing operational and grid-integration challenges.
Advancements in battery storage solutions have also been extensively studied. Gangopadhyay et al. [15] reviewed the state-of-the-art in solar PV technology, discussing the latest developments in energy storage and grid integration. Kumar and Tiwary [16] analyzed cadmium selenide thin-film photovoltaic applications, showing enhanced energy conversion efficiencies. Dubey et al. [17] examined the effect of temperature on PV performance, emphasizing the need for thermal management strategies. Additionally, Rousis et al. [18] used HOMER Pro to design hybrid AC/DC microgrid solutions, demonstrating the feasibility of integrating PV and battery storage systems.
Recent studies have further explored smart energy management in grid-connected PV systems. Buitenhuis and Pearce [19] investigated open-source PV development and its impact on system adoption and cost reduction. Osman et al. [20] analyzed solar radiation patterns in Sudan, identifying optimal locations for PV installations. Abarro et al. [21] reviewed advancements in nickel-iron battery technologies for renewable energy applications, emphasizing their potential for long-term storage. Mousavi et al. [22] conducted a comprehensive review of flywheel energy storage systems, evaluating their compatibility with PV-based microgrids.
Economic and policy-driven factors influencing PV adoption have also been addressed in recent research. Hossain et al. [23] examined sustainability strategies in global seaports, showcasing the role of PV integration in reducing energy costs. Wang et al. [24] developed optimal charging strategies for lithium-ion batteries to enhance their performance in solar applications. Vartiainen et al. [25] assessed the impact of capital expenditure and financing models on PV system affordability and adoption. Finally, Bashir et al. [26] proposed an innovative energy scheduling framework for grid-connected microgrids, improving the reliability and economic performance of renewable energy systems.
This study builds upon the extensive body of research on PV system integration, battery storage, and smart energy management. By evaluating a real-world grid-connected PV system in Constanta, Romania, this research aims to provide a comprehensive analysis of its performance, self-sufficiency, and environmental benefits. The study leverages PV*SOL and Global Solar Atlas to simulate and assess energy flows, ensuring accurate system performance evaluation. The findings contribute to the ongoing development of smart energy solutions that support a more sustainable and resilient future [27].
This analysis serves as a model for the broader implementation of renewable energy systems in both residential and commercial settings. By examining real-world data, this study provides insights into the effectiveness of integrating solar power, battery storage, and EV charging to create a self-sufficient energy ecosystem [28]. The findings contribute to the ongoing efforts to establish more sustainable urban energy frameworks that align with global climate action goals [29]. As solar energy adoption continues to expand, its integration with battery storage and EV infrastructure presents a viable and sustainable solution for addressing modern energy challenges. This study demonstrates how smart energy systems can enhance efficiency, promote environmental sustainability, and drive the transition toward a low-carbon energy future [30]. The results of this analysis highlight the potential for further innovation in renewable energy technology, paving the way for smarter and more resilient energy networks [31].

2. Materials and Methods

2.1. System Configuration and Installation

The study was conducted using a grid-connected photovoltaic (PV) system integrated with battery storage and electric vehicle (EV) charging in Constanta, Romania., based on historical records from 2024 to 2025, shows an annual global irradiation of 1445 kWh/m², indicating moderate solar potential for energy generation [32]. The annual average temperature is 12.9°C, which is ideal for photovoltaic efficiency, as solar panels perform best in moderate temperatures. Located at a latitude of 44.22° and longitude of 28.63° (UTC+2 time zone), Constanta has favorable conditions for solar energy production, making it a suitable location for photovoltaic installations [33].

2.2. Energy Consumption and Monitoring

Energy consumption data for both residential and commercial applications were collected using a combination of direct metering and simulations. The total energy consumption was approximately 1000 kWh annually, which includes household appliances, inverter standby consumption, and electric vehicle charging [34]. Energy flow was monitored across various system components, including the PV generation system, battery storage, EV charging station, and grid interaction [2]. The energy consumption was further broken down into direct self-consumption, battery storage use, and grid imports, with specific attention paid to the contribution of PV power and the electric vehicle [16,35].
The study used real-time monitoring tools and sensors to track the energy production from the PV system and the energy consumption by the building, battery, and electric vehicle [5]. A time-step interval of one hour was used to record energy flows and simulate performance under various environmental conditions [36].
The Total Consumption in Figure 1 heatmap illustrates energy usage patterns throughout the year, with higher consumption between 7:00 AM and 4:00 PM (shown in yellow, orange, and red) and lower consumption during nighttime hours (represented by blue and green). The x-axis represents the days of the year (1 to 365), while the y-axis shows the hours of the day (0 to 24).
The consistent daytime peak suggests regular household, commercial, or industrial activity, while the nighttime reduction indicates minimal energy usage. The pattern remains stable across all months, showing that daily routines primarily drive energy consumption rather than seasonal changes [19].
This visualization provides valuable insights for optimizing energy efficiency, enabling better load balancing, smart energy planning, and integration of renewable energy sources like solar power [37].

2.3. Simulation and Data Analysis

The simulation model was built using a standard energy management tool to assess the behavior of the system under varying solar irradiance conditions. Data on solar irradiance were gathered from local weather stations, showing an annual global irradiation of 1445 kWh/m² for Constanta, Romania, which is considered a moderate level of solar potential [38]. The PV system’s energy output was simulated over the course of the year, with specific attention paid to peak generation periods during the summer months and lower generation in the winter months. Energy losses during charging and discharging cycles of both the battery and the EV were also accounted for, as these can impact overall system efficiency [39].
Energy losses were estimated based on typical efficiency rates for inverters (96%) and battery systems, with additional losses factored in for inefficiencies associated with the EV charging process. These losses were categorized into different types: battery charging and discharging losses, internal battery losses, and EV charging losses. The energy production and consumption for each component were analyzed in terms of their seasonal variations, focusing on how solar power, battery storage, and EV charging contribute to the system’s overall energy independence and carbon reduction goals [40].
It features a grid-connected photovoltaic (PV) system installed in Constanta, Romania. The system in Table 1 is integrated with a 230V, 3-phase AC supply, operating at a time-step simulation interval of 1 hour, and it does not allow maximum feed-in power to the grid [41].
The total energy consumption of the system is 1000 kWh, with a load peak of 0.4 kW. The system includes 24 monocrystalline silicon PV modules, each rated at 0.4 kWp, giving a total power output of 9.6 kWp. These modules are installed in a roof-parallel configuration with a 30° inclination and 180° orientation [42].
To convert the DC power generated by the PV modules into usable AC power, the system utilizes two inverters, each rated at 5 kW and 14 A, resulting in a total inverter power of 10 kW. The configuration follows an MPP (Maximum Power Point) tracking arrangement of 1 x 12, and the sizing factor of the inverters is 96%, ensuring efficient energy conversion [43].
The system also integrates an electric vehicle (EV) component, consisting of a Honda e: Ny1 model with AC charging capabilities. There is one EV in the setup, featuring a battery capacity of 68.8 kWh and a charging power of 11 kW. This vehicle offers a range of 512 km per charge, contributing to sustainable transportation [3].
A battery storage system is included to enhance the energy resilience of the setup. This system consists of one AC-coupled battery unit with a nominal output of 2 kW and a storage capacity of 14.4 kWh. The battery type used is a 12V, 1050 Ah valve-regulated unit, designed to store excess solar energy for use when solar generation is insufficient.
The cabling system has been designed efficiently, resulting in zero power loss (0 kW). This ensures that all generated and stored energy is used effectively without unnecessary losses [24].
This project is a well-balanced solar power system with energy storage and electric vehicle integration, ensuring efficient power utilization, sustainability, and economic feasibility.
This energy flow diagram illustrates in Figure 2. shows how electricity is generated, consumed, stored, and lost in a system integrating solar power, battery storage, and an electric vehicle (EV).
The solar generation system produces 13710 kWh of electricity. A portion of this energy, 1000 kWh, is directly consumed, while an additional 77 kWh is used in standby operation by the inverter. The system also exports 9641 kWh of electricity to the grid, while drawing 317 kWh from it [25].
Battery storage plays a role in energy management, initially holding 14 kWh of charge. Throughout the process, 152 kWh is lost due to charging and discharging inefficiencies, and an additional 207 kWh is lost within the battery itself. Ultimately, the battery supplies 750 kWh to the system.
The electric vehicle (EV) also interacts with the energy flow, starting with 22 kWh of charge. Due to inefficiencies, 177 kWh is lost during charging and discharging, and 455 kWh is lost within the battery. However, the EV still uses 2354 kWh of energy for driving.
Figure 3 illustrates the relationship between solar irradiance, diffuse irradiance, and outside temperature over the course of a day.
The orange line represents the total solar irradiance received on a horizontal plane. It begins increasing in the morning, reaches its peak around noon at approximately 200 W/m², and then gradually declines as the sun sets [26].
The blue line shows the diffuse irradiance, which represents the sunlight scattered by the atmosphere. It follows a similar pattern to total irradiance but remains lower throughout the day, peaking at around 150 W/m². The difference between the two curves suggests that a significant portion of the solar radiation was direct sunlight, meaning there were likely clear or partly cloudy conditions [13].
The gray line, plotted on the right axis, represents the outside temperature in degrees Celsius. The temperature starts relatively low in the early morning, rises gradually, and peaks later in the afternoon at approximately 11-12°C between 14:00 and 16:00. After that, it slowly decreases as the evening progresses. This delay in peak temperature compared to peak irradiance is due to the thermal inertia of the environment, meaning that heat accumulates before reaching its maximum [44].
Overall, Figure 3 demonstrates a typical daily solar radiation pattern, where irradiance peaks at midday and temperature peaks in the afternoon. The data is useful for solar energy production analysis, climate studies, and evaluating thermal efficiency in renewable energy applications.
These pie charts illustrate in Figure 4 and Figure 5 show how photovoltaic (PV) energy is distributed and utilized across different areas.
The Figure 4 (a) chart (Charge of the Electric Vehicle - Total) reveals that the electric vehicle is primarily charged by PV power (yellow). A smaller portion comes from the battery (green), and a minimal amount is sourced from the grid (blue).
The Figure 4 (b) chart (Total Consumption) highlights that most of the energy consumption is covered by PV power (yellow). Some energy is drawn from the grid (blue), while a portion comes from battery storage (green). A smaller share is linked to the electric vehicle’s contribution (purple).
The Figure 5 (a) chart (Battery Charge - Total) indicates that almost all battery charging is covered by PV power (yellow), with only a small fraction being supplied by the grid (blue).
The Figure 5 (b) (PV Generator Energy - AC Grid) shows that most of the PV-generated energy is exported to the grid (blue). A portion is used for charging an electric vehicle (purple) and battery storage (green), while a smaller amount is directly consumed (gray). There are also clipping losses (orange), which represent energy that could not be used or stored [45].
The system represents in Table 2 has a peak capacity of 9.60 kWp and produces 13710 kWh per year. However, only 29.3% of this energy is used directly, while the majority is exported to the grid. With a performance ratio of 88.48%, the system effectively converts sunlight into usable electricity with minimal losses.
A portion of the generated energy is used for household consumption, battery storage, and electric vehicle charging, ensuring energy independence. Notably, there are no clipping losses, meaning all available energy is efficiently utilized. Additionally, the system contributes to environmental sustainability by reducing CO₂ emissions by 6239 kg per year [29].
From Table 3 the total annual energy consumption is 4042 kWh, which includes 1000 kWh used by household appliances, 77 kWh for the inverter’s standby consumption, and 2965 kWh for charging an electric vehicle. Most of this energy is covered by solar power, with 3053 kWh directly supplied by the PV system and 672 kWh sourced from battery storage. Only 317 kWh is drawn from the grid, demonstrating minimal reliance on external electricity. The electric vehicle does not contribute energy back to the household.
The solar fraction is 92.2%, meaning that 92.2% of the total consumption is covered by solar energy, either directly or through battery storage [46]. This indicates a high level of self-sufficiency, with only 7.8% dependence on grid electricity.
Table 4 summarizes the annual energy consumption and efficiency of an electric vehicle, showing that out of the total 2965 kWh used for charging, 2335 kWh was supplied by solar power, 398 kWh by the battery, and 232 kWh by the grid, with losses of 455 kWh in the battery and 177 kWh due to charging/discharging, enabling a total mileage of 18250 km, of which 16820 km was powered by solar energy [31].
Table 5 shows that the system efficiently utilizes 1094 kWh of energy annually, with 93% covered by solar power and only 7% sourced from the grid. Of this, 750 kWh is used for consumption, where 398 kWh powers an electric vehicle and 351 kWh supports household needs. However, charging/discharging inefficiencies lead to 152 kWh of losses, while battery storage losses account for 207 kWh. With a cycle load of just 0.8%, the system maintains an estimated service life of over 12 years [47].
With a self-sufficiency level of 92.2%, most of the energy consumption is sourced independently, significantly reducing reliance on the grid. Of the total annual consumption of 4042 kWh, only 317 kWh is drawn from the grid, while the remaining 3725 kWh is provided through alternative energy sources. This demonstrates a strong commitment to sustainability, showing the ability to meet most energy needs through self-generated power [33].

3. Results and Discussion

The integration of photovoltaic (PV) systems with battery storage and electric vehicle (EV) charging has shown promising results in enhancing energy efficiency and sustainability. This section presents a comprehensive analysis of the system’s performance, focusing on energy generation, consumption patterns, self-sufficiency, and environmental impact. The results demonstrate that the PV system generated approximately 13710 kWh annually, with a self-sufficiency rate of 92.2%, significantly reducing reliance on grid electricity. Additionally, the study evaluates seasonal variations in energy production, battery utilization, and EV charging efficiency, providing insights into the system’s overall effectiveness in optimizing renewable energy utilization. The findings also highlight the economic and environmental benefits, including a reduction of 6239 kg of CO₂ emissions per year, reinforcing the importance of smart energy management strategies.
To further illustrate these findings, the following figures and tables provide detailed insights into energy generation, storage performance, and consumption patterns.
The Production Forecast with Consumption chart illustrates in Figure 6 shows the balance between solar energy generation, consumption, storage, and grid interaction throughout the year. During the summer months (May–August), solar generation is at its peak, leading to high battery charging and significant grid exports. In contrast, winter months (November–February) show lower solar production, resulting in greater reliance on grid energy to meet demand [48].
The yellow bars represent PV generation, which varies seasonally, with the highest production occurring in the summer. Energy consumption is divided into different categories, including appliance usage (gray), electric vehicle charging (purple), and battery energy for covering consumption (green). The battery charge (dark green) fluctuates, depending on available solar power and consumption needs.
Additionally, the blue bars below zero indicate excess solar energy being exported to the grid, while the light blue sections above zero show energy drawn from the grid when solar and battery power are insufficient. This highlights the interplay between self-sufficiency and external grid dependency [5].
The system demonstrates strong solar self-sufficiency in summer, with surplus energy being sent to the grid, while in winter, the need for grid energy increases due to reduced solar availability. The battery system helps balance fluctuations, ensuring energy is available when needed.
The Cumulative Total Energy Generation chart illustrates the progressive increase in solar energy generation over the year. The black line represents cumulative energy generation, which follows a steady upward trend, reaching 9568 kWh per year by December.
The yellow bars indicate monthly PV generator energy (AC grid), showing that solar energy production is higher in the summer months (May–August) and lower in the winter months (November–February). The gray bars represent appliance consumption, which remains relatively stable throughout the year [6].
During the first few months of the year, energy generation starts gradually, but as sunlight increases, the cumulative curve becomes steeper, indicating higher production rates in spring and summer. By late summer, the curve starts to flatten, reflecting the decline in solar generation in autumn and winter [25].
Figure 7 highlights the seasonal variation in solar energy production, with peak generation during the middle of the year and lower production towards the end. The steady increase in cumulative energy confirms that the solar system consistently generates power, even as monthly variations occur [7].
The use of PV energy chart illustrates represent in Figure 8 shows how the generated solar energy is utilized throughout the year. The yellow bars represent PV Generator Energy (AC grid), showing the seasonal variation in solar production, with higher generation in summer months (May–August) and lower in winter months (November–February).
The energy usage is divided into different categories:
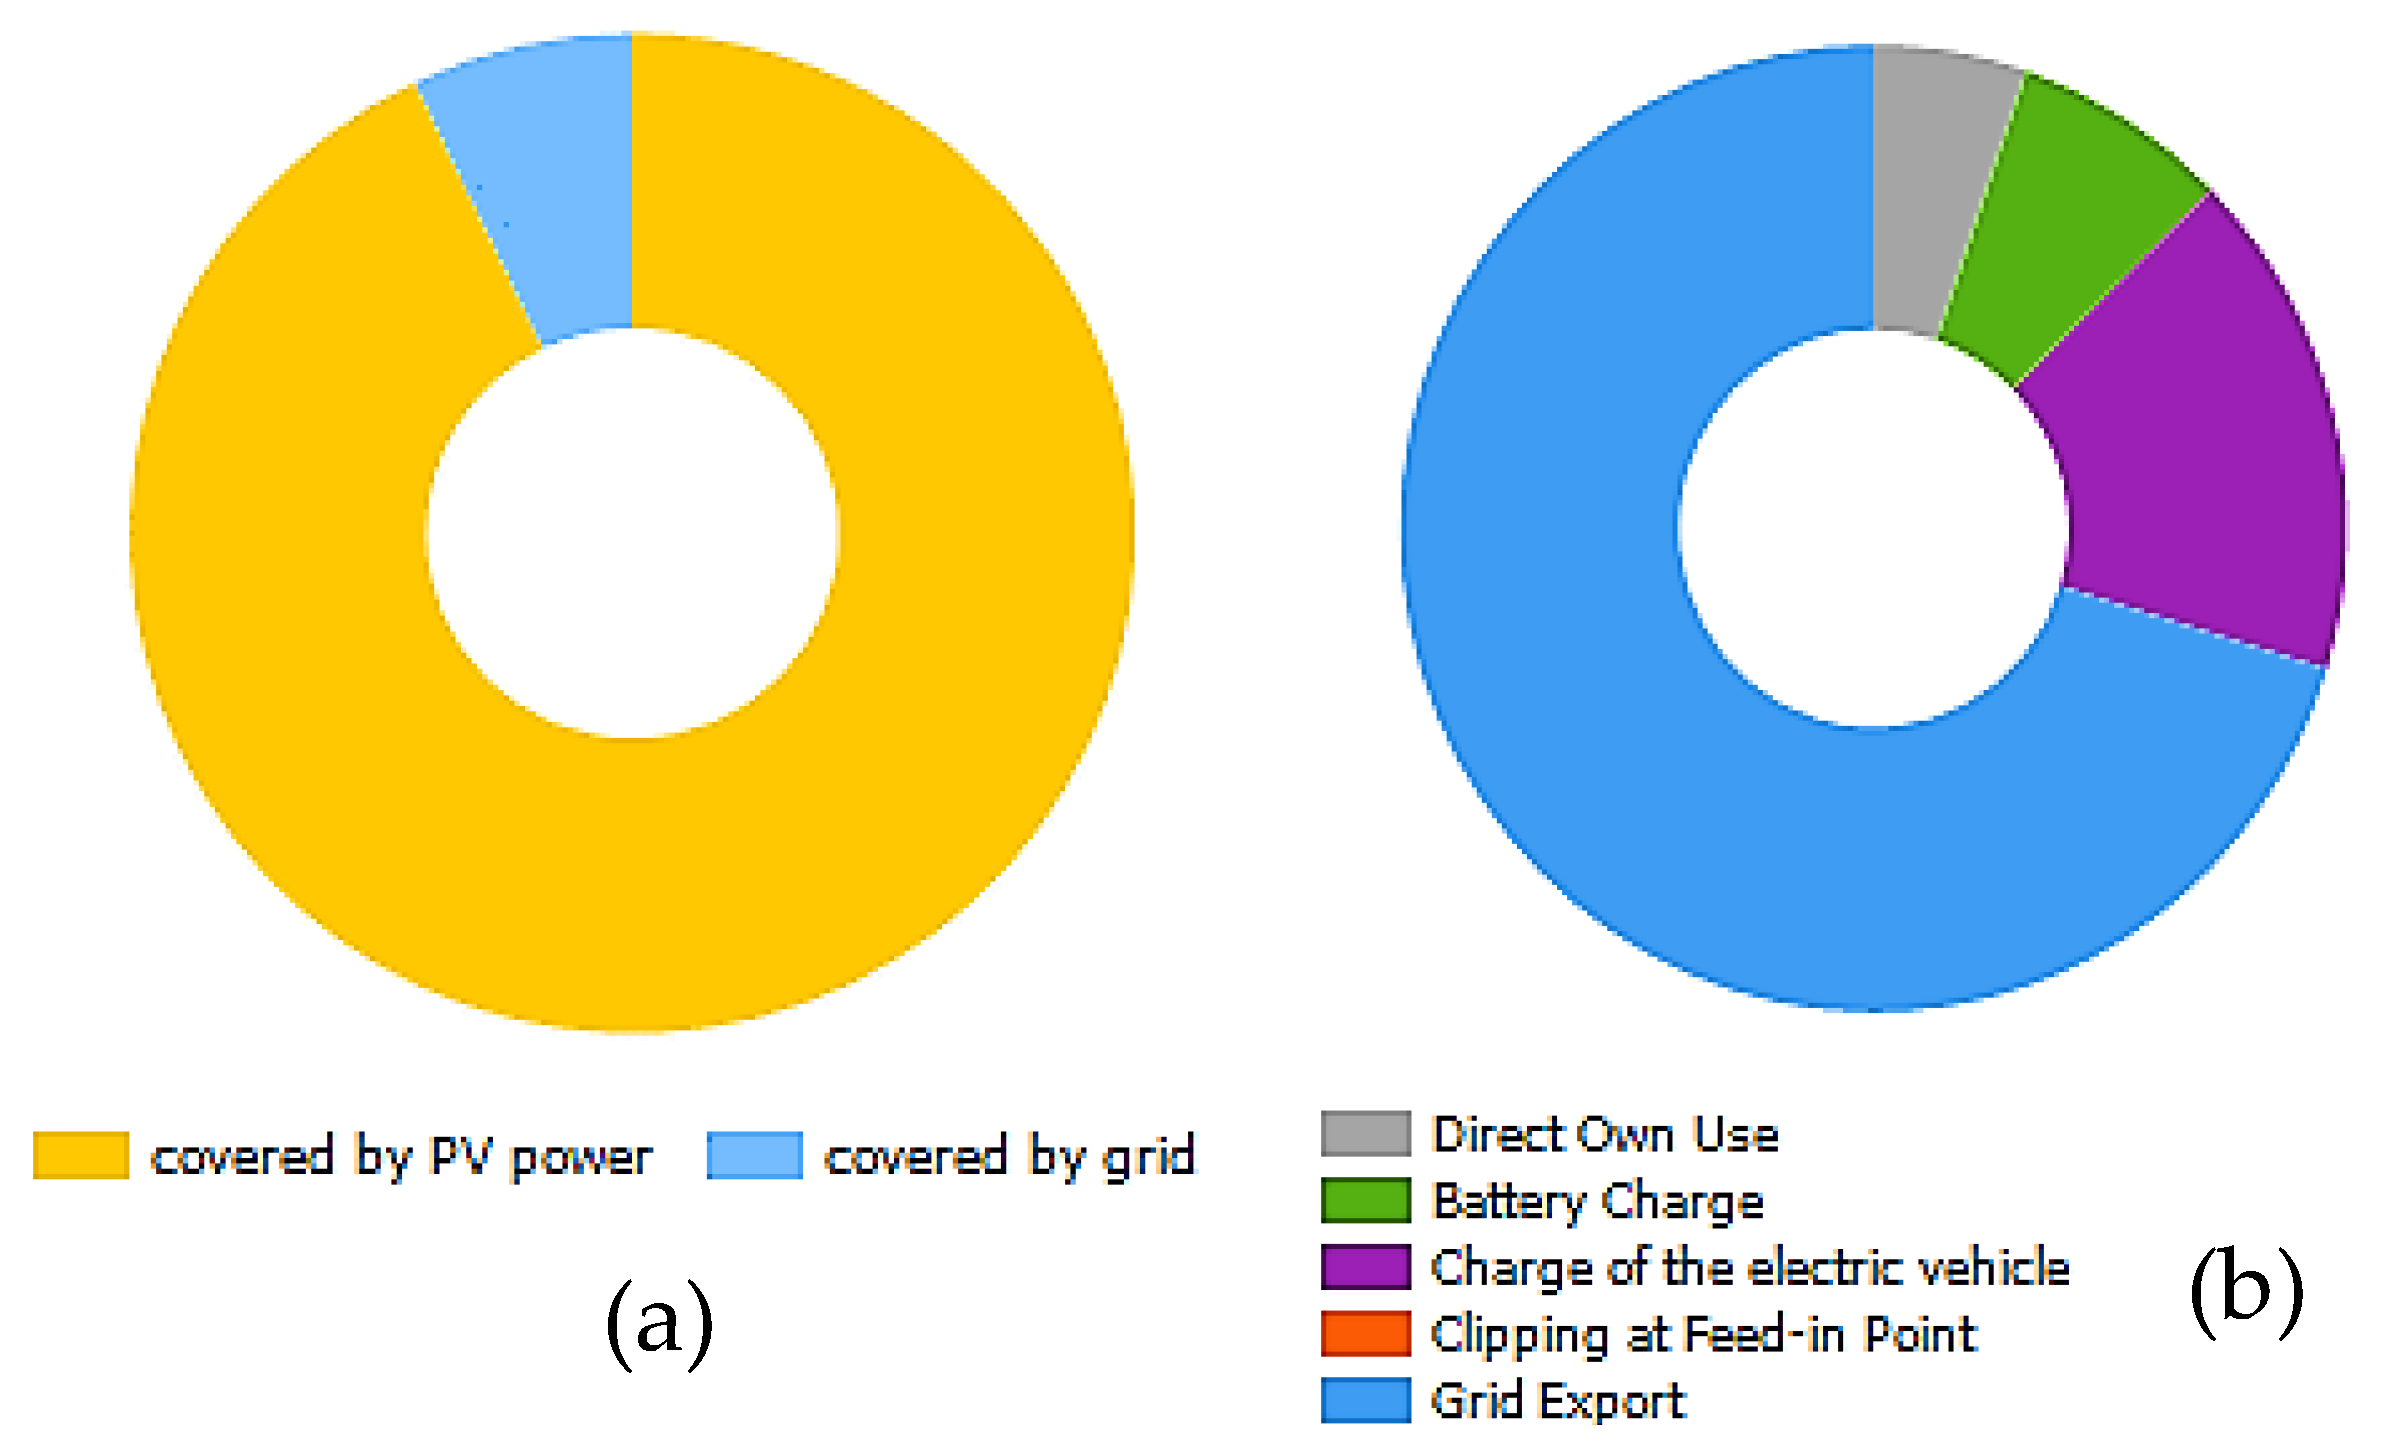
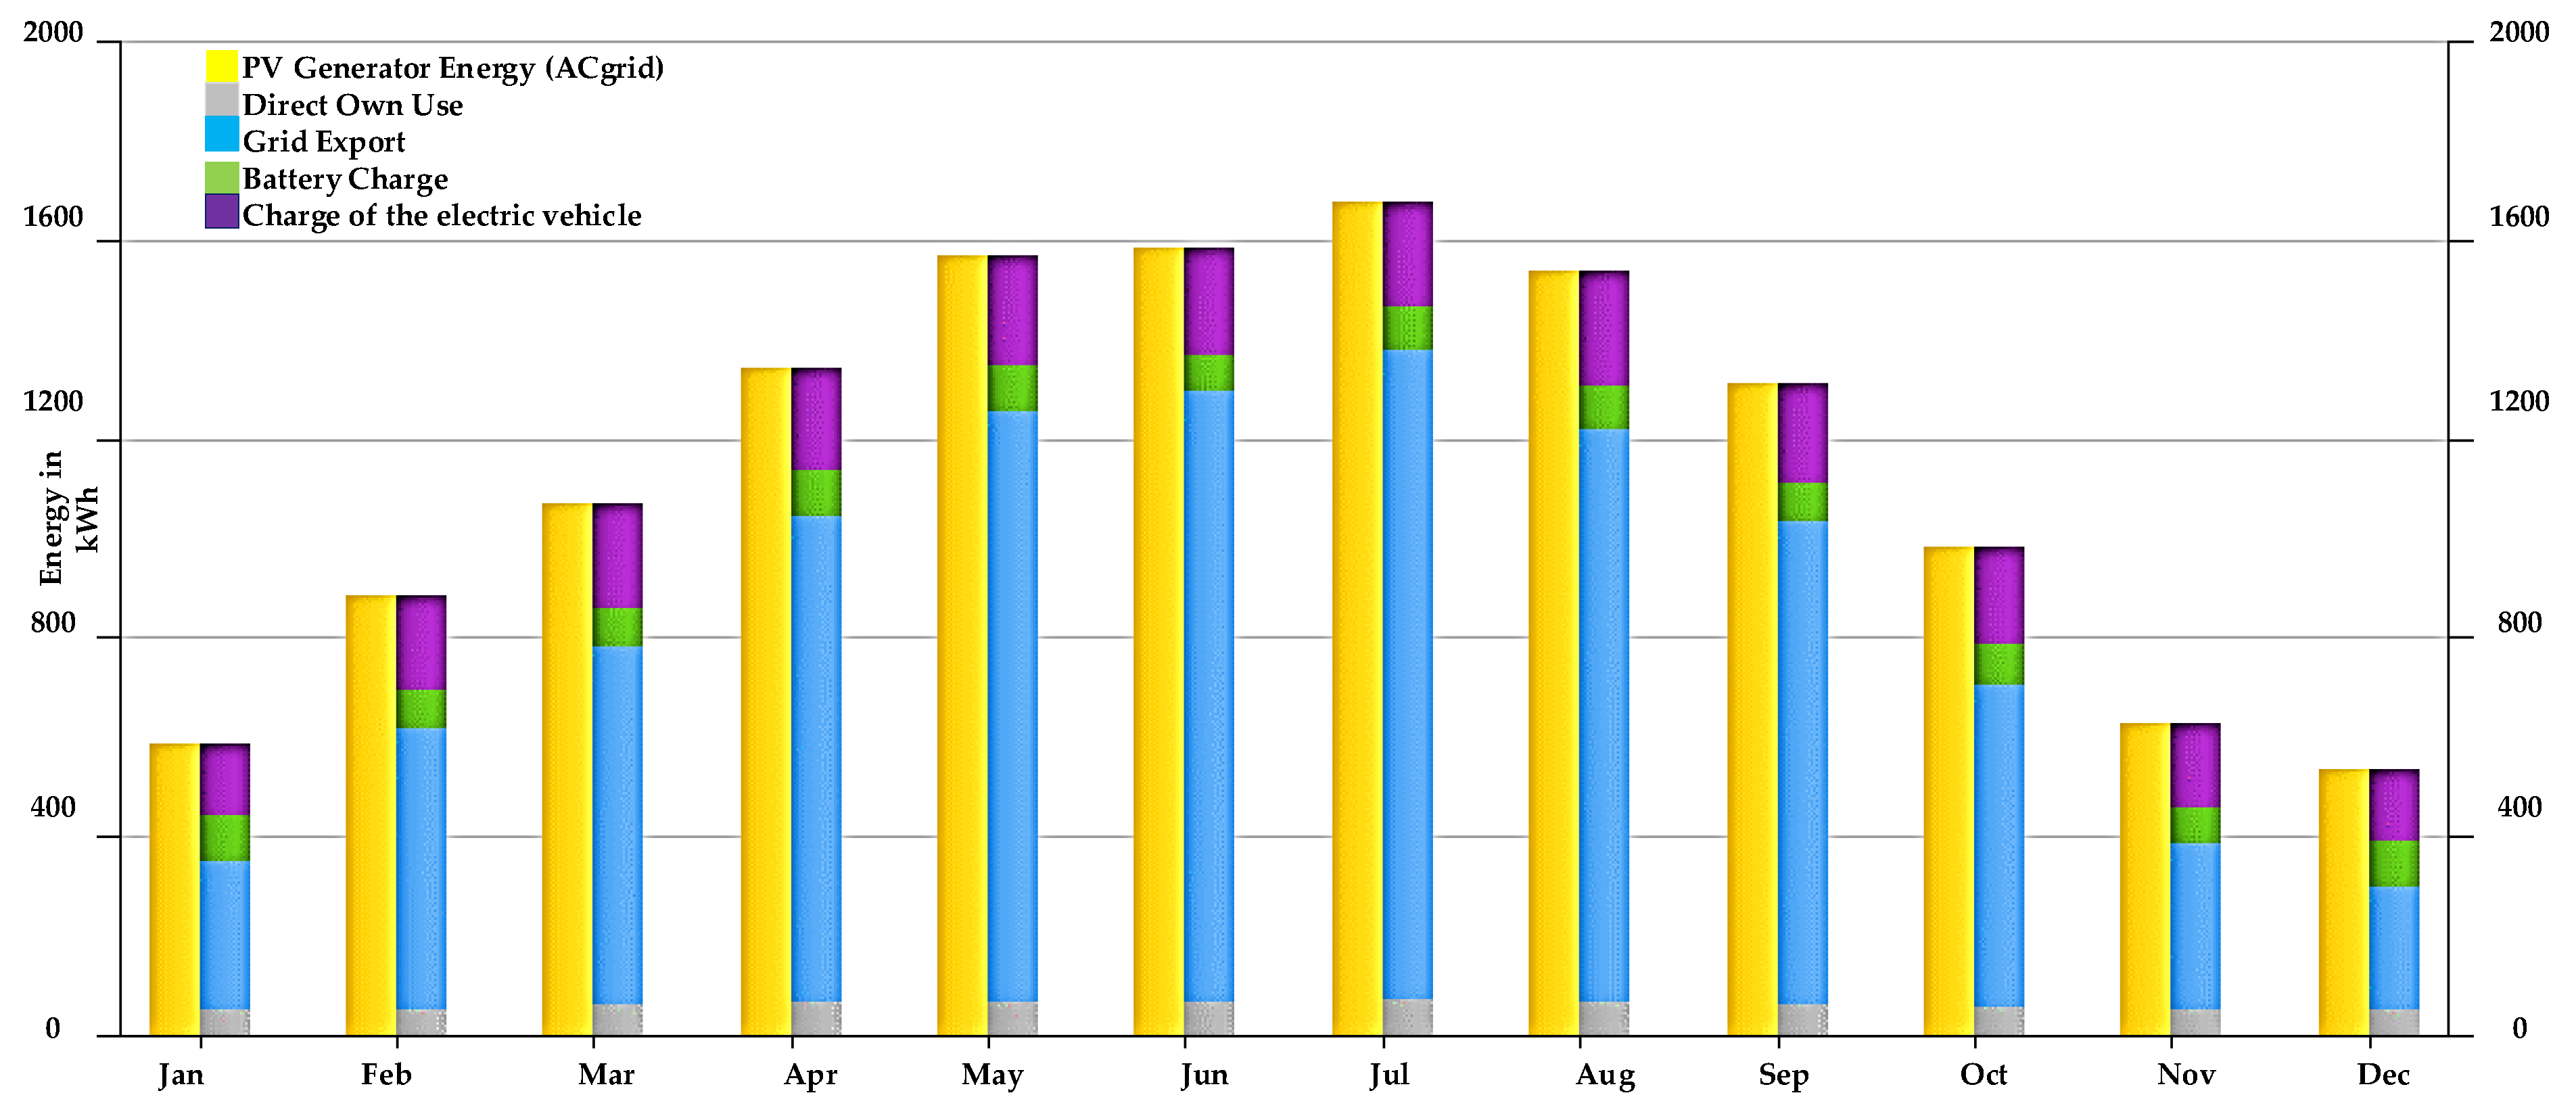
  • Gray sections represent direct own use, which remains relatively stable across all months.
  • Blue sections indicate grid export, showing that during high-production months (May–August), a significant portion of solar energy is sent to the grid.
  • Green sections represent battery charge, which increases during months of higher solar production, allowing for energy storage [49].
  • Purple sections show energy used for charging the electric vehicle, demonstrating that a portion of PV energy is directly allocated to EV charging.
In the winter months, lower solar generation results in less energy available for grid export and battery charging, while in summer, excess energy is exported to the grid due to surplus solar power. The chart highlights that solar energy usage is optimized to cover self-consumption first, with excess energy stored in batteries or sent to the grid [19].
The Coverage of Consumption chart illustrates in Figure 9 shows how household energy consumption is met through different energy sources across the year. The total height of each bar represents the overall energy demand, which includes appliances (gray) and standby consumption (black).
The breakdown of energy coverage includes:
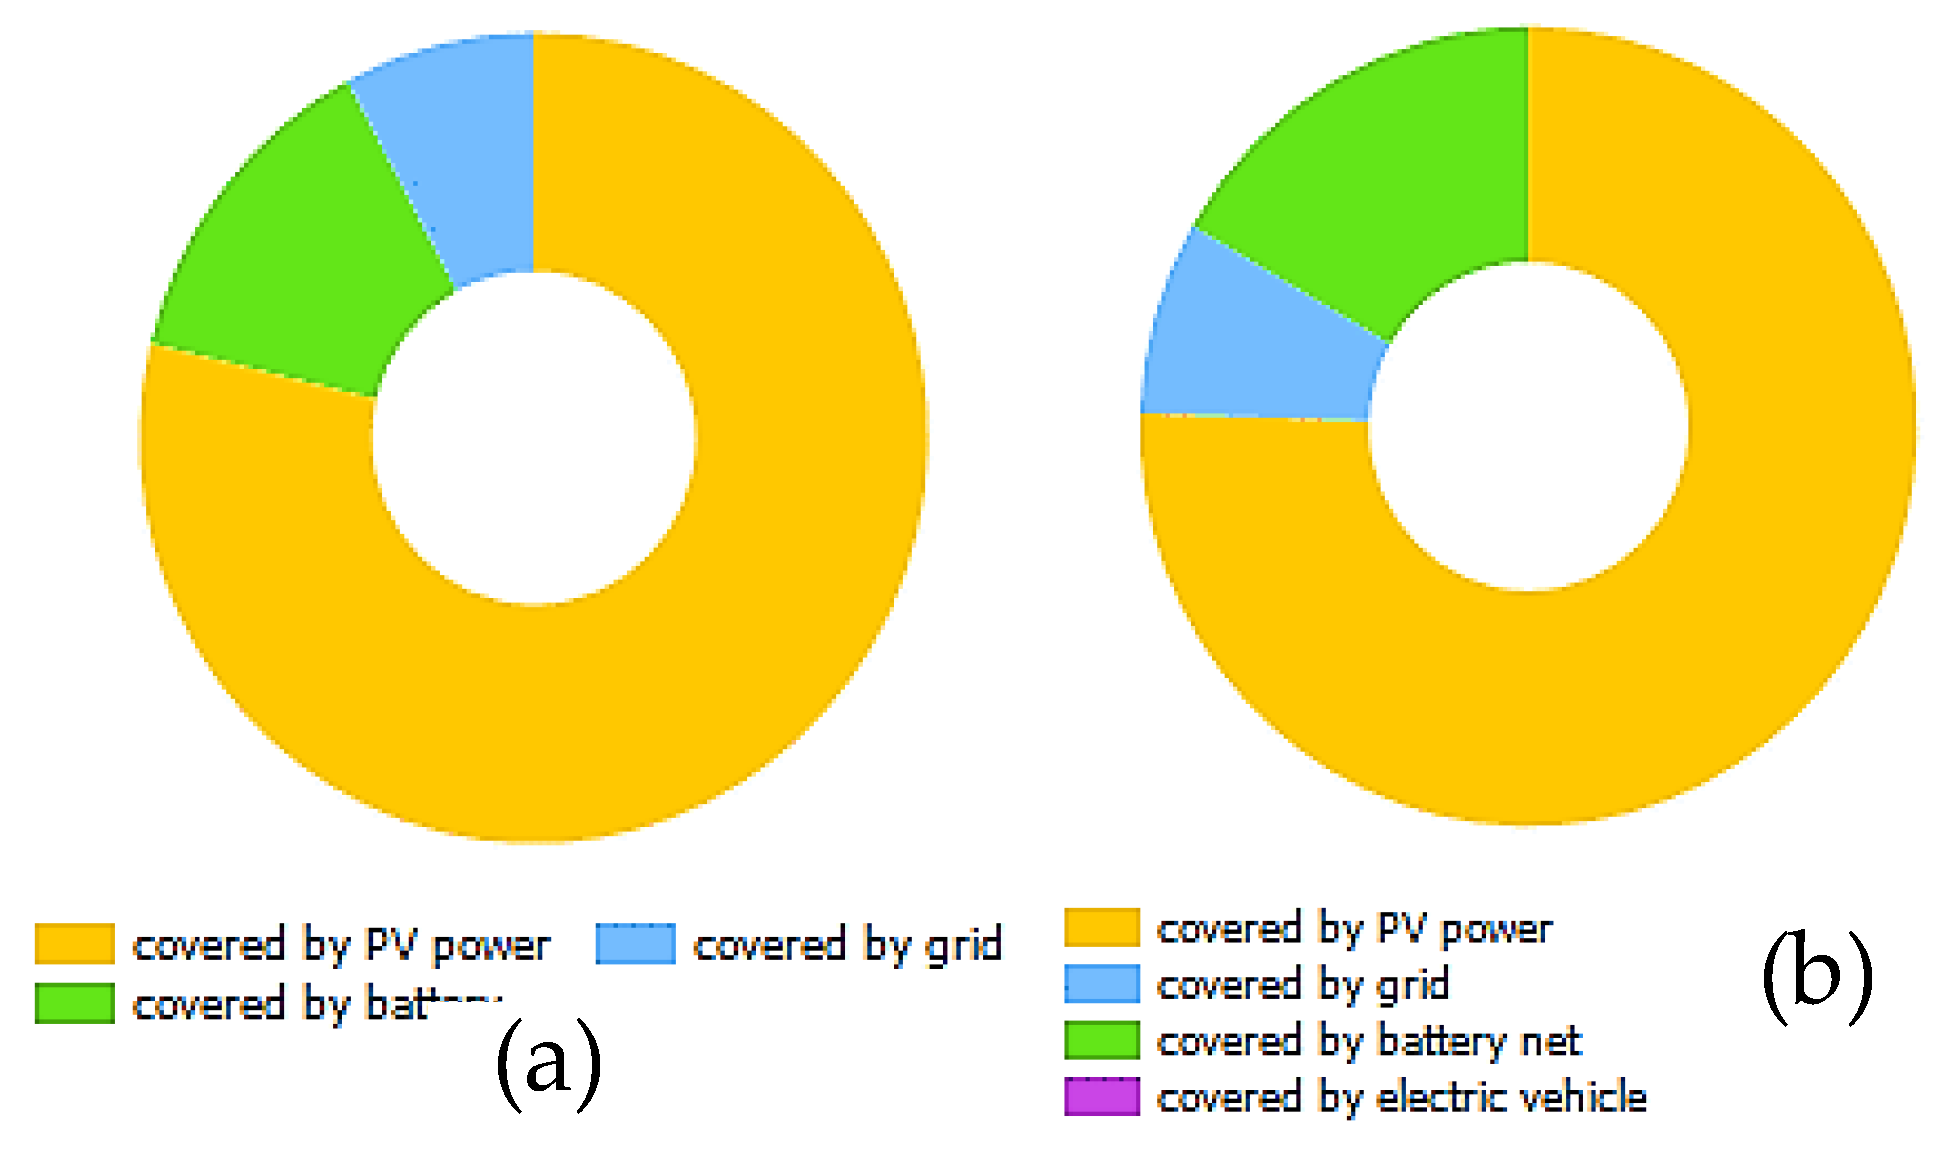
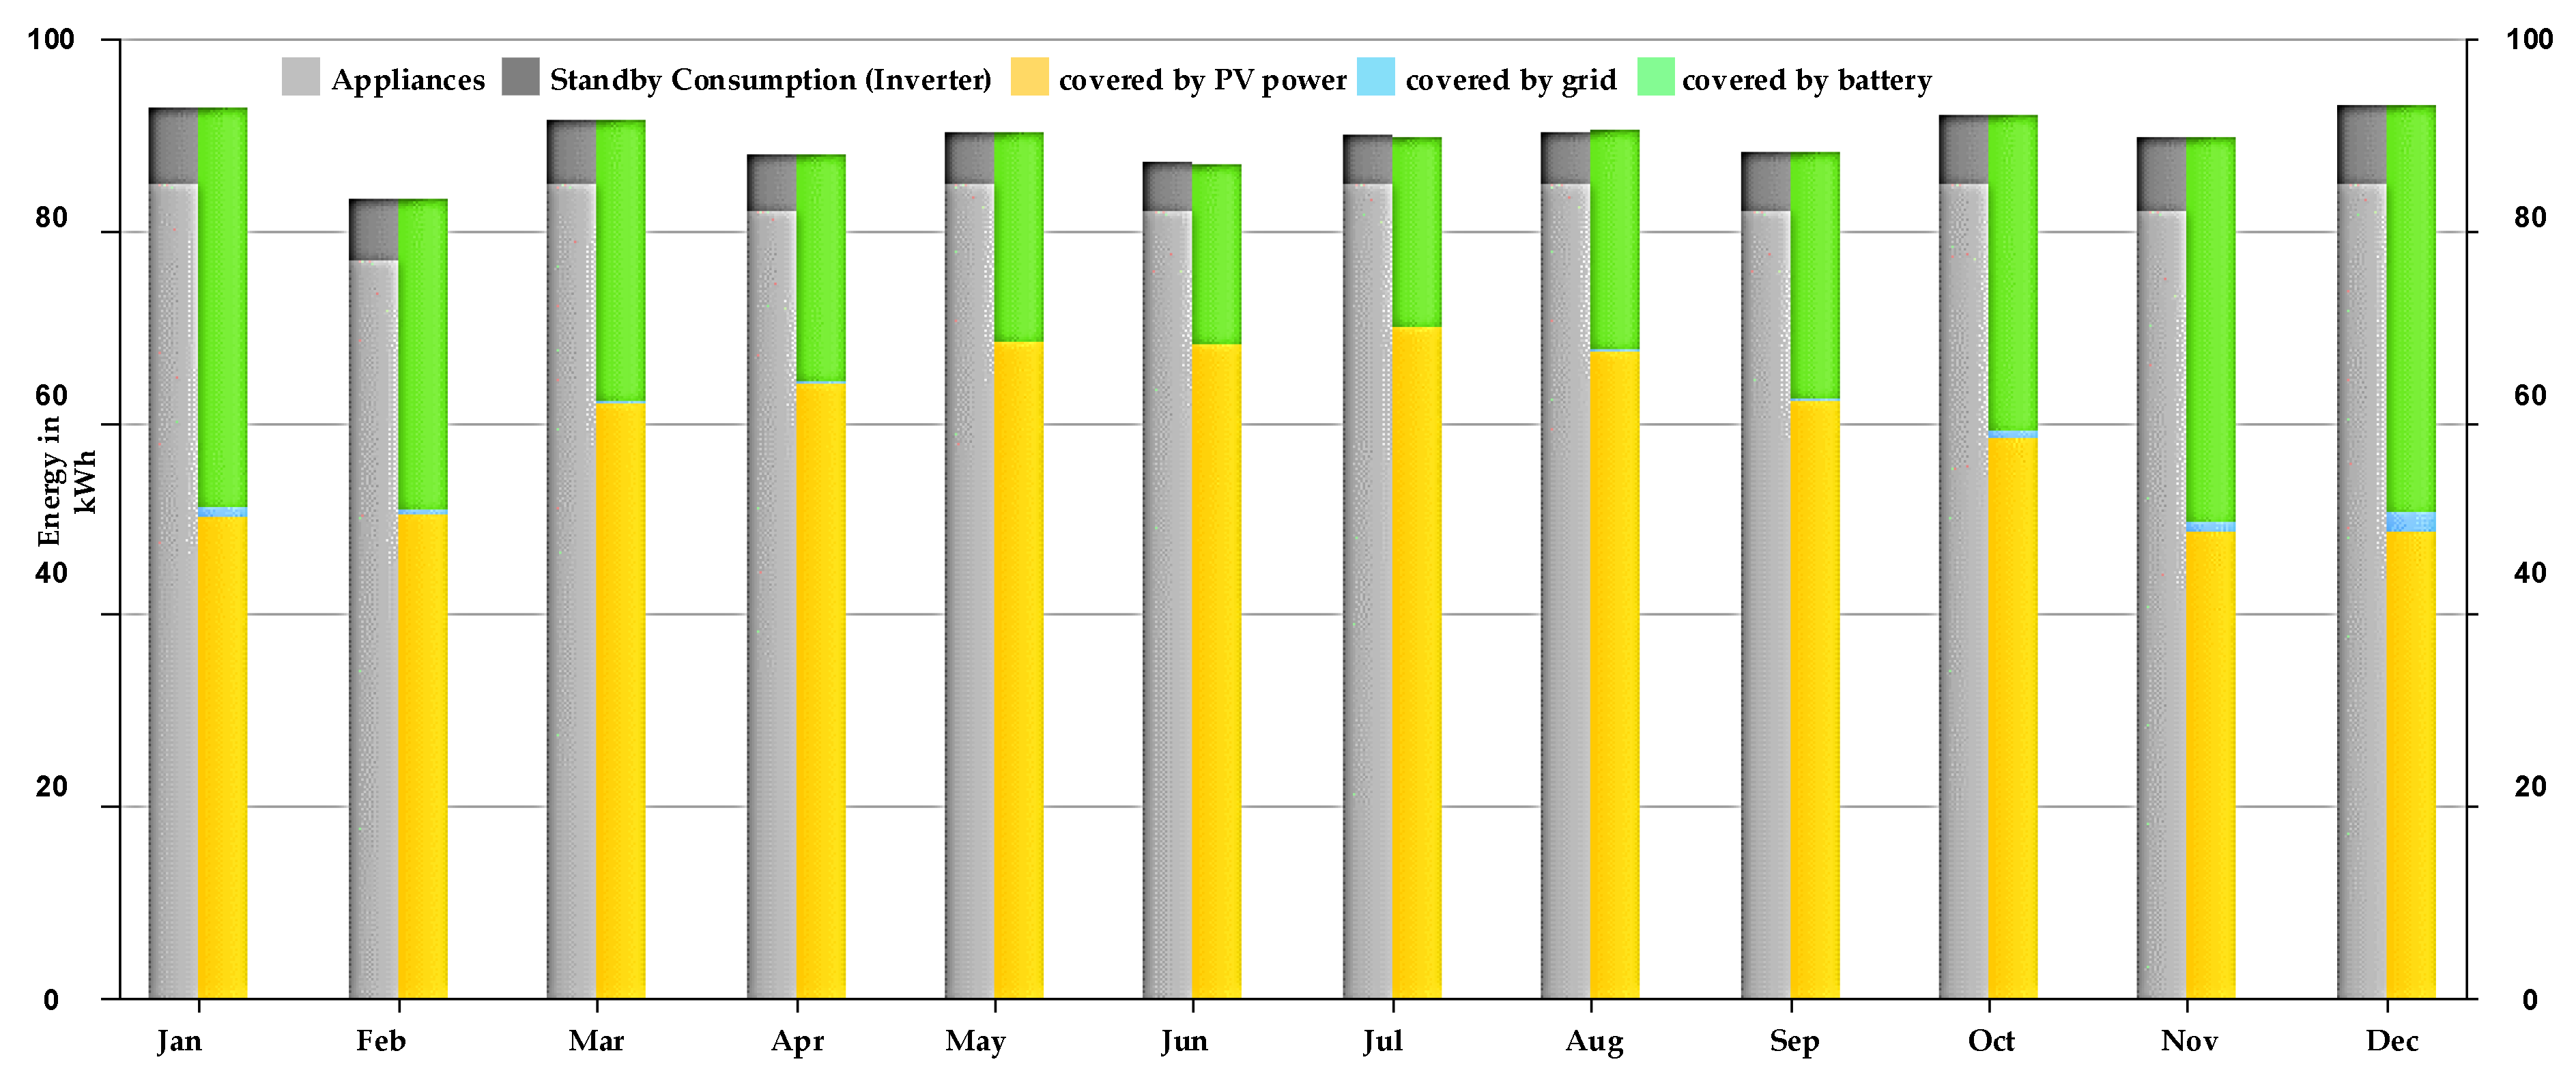
  • Yellow sections representing energy covered by PV power, which fluctuates based on solar generation, with higher coverage in summer and lower in winter.
  • Green sections indicating energy covered by the battery, showing that stored solar energy is used to supplement consumption.
  • Small blue sections representing energy covered by the grid, which appear mainly in winter months when solar and battery power are insufficient.
  • Purple sections indicating energy covered by the electric vehicle, showing the portion of PV or battery power used for EV charging. [50]
During summer months (May–August), a larger portion of energy is covered by PV power and battery storage, reducing reliance on the grid. However, in winter months (November–February), grid dependency slightly increases as solar production decreases. This chart demonstrates effective self-sufficiency, where solar power and battery storage significantly contribute to meeting household energy needs throughout the year [51].
Figure 10. Monthly Coverage of Total Energy Consumption from Various Sources.
Preprints 149915 g010
The Coverage of Total Consumption in Figure 9 illustrates how different energy sources contribute to meeting overall energy demand throughout the year. The total height of each bar represents the monthly energy consumption, which includes both appliances and standby consumption (gray sections).
Breakdown of Energy Coverage:
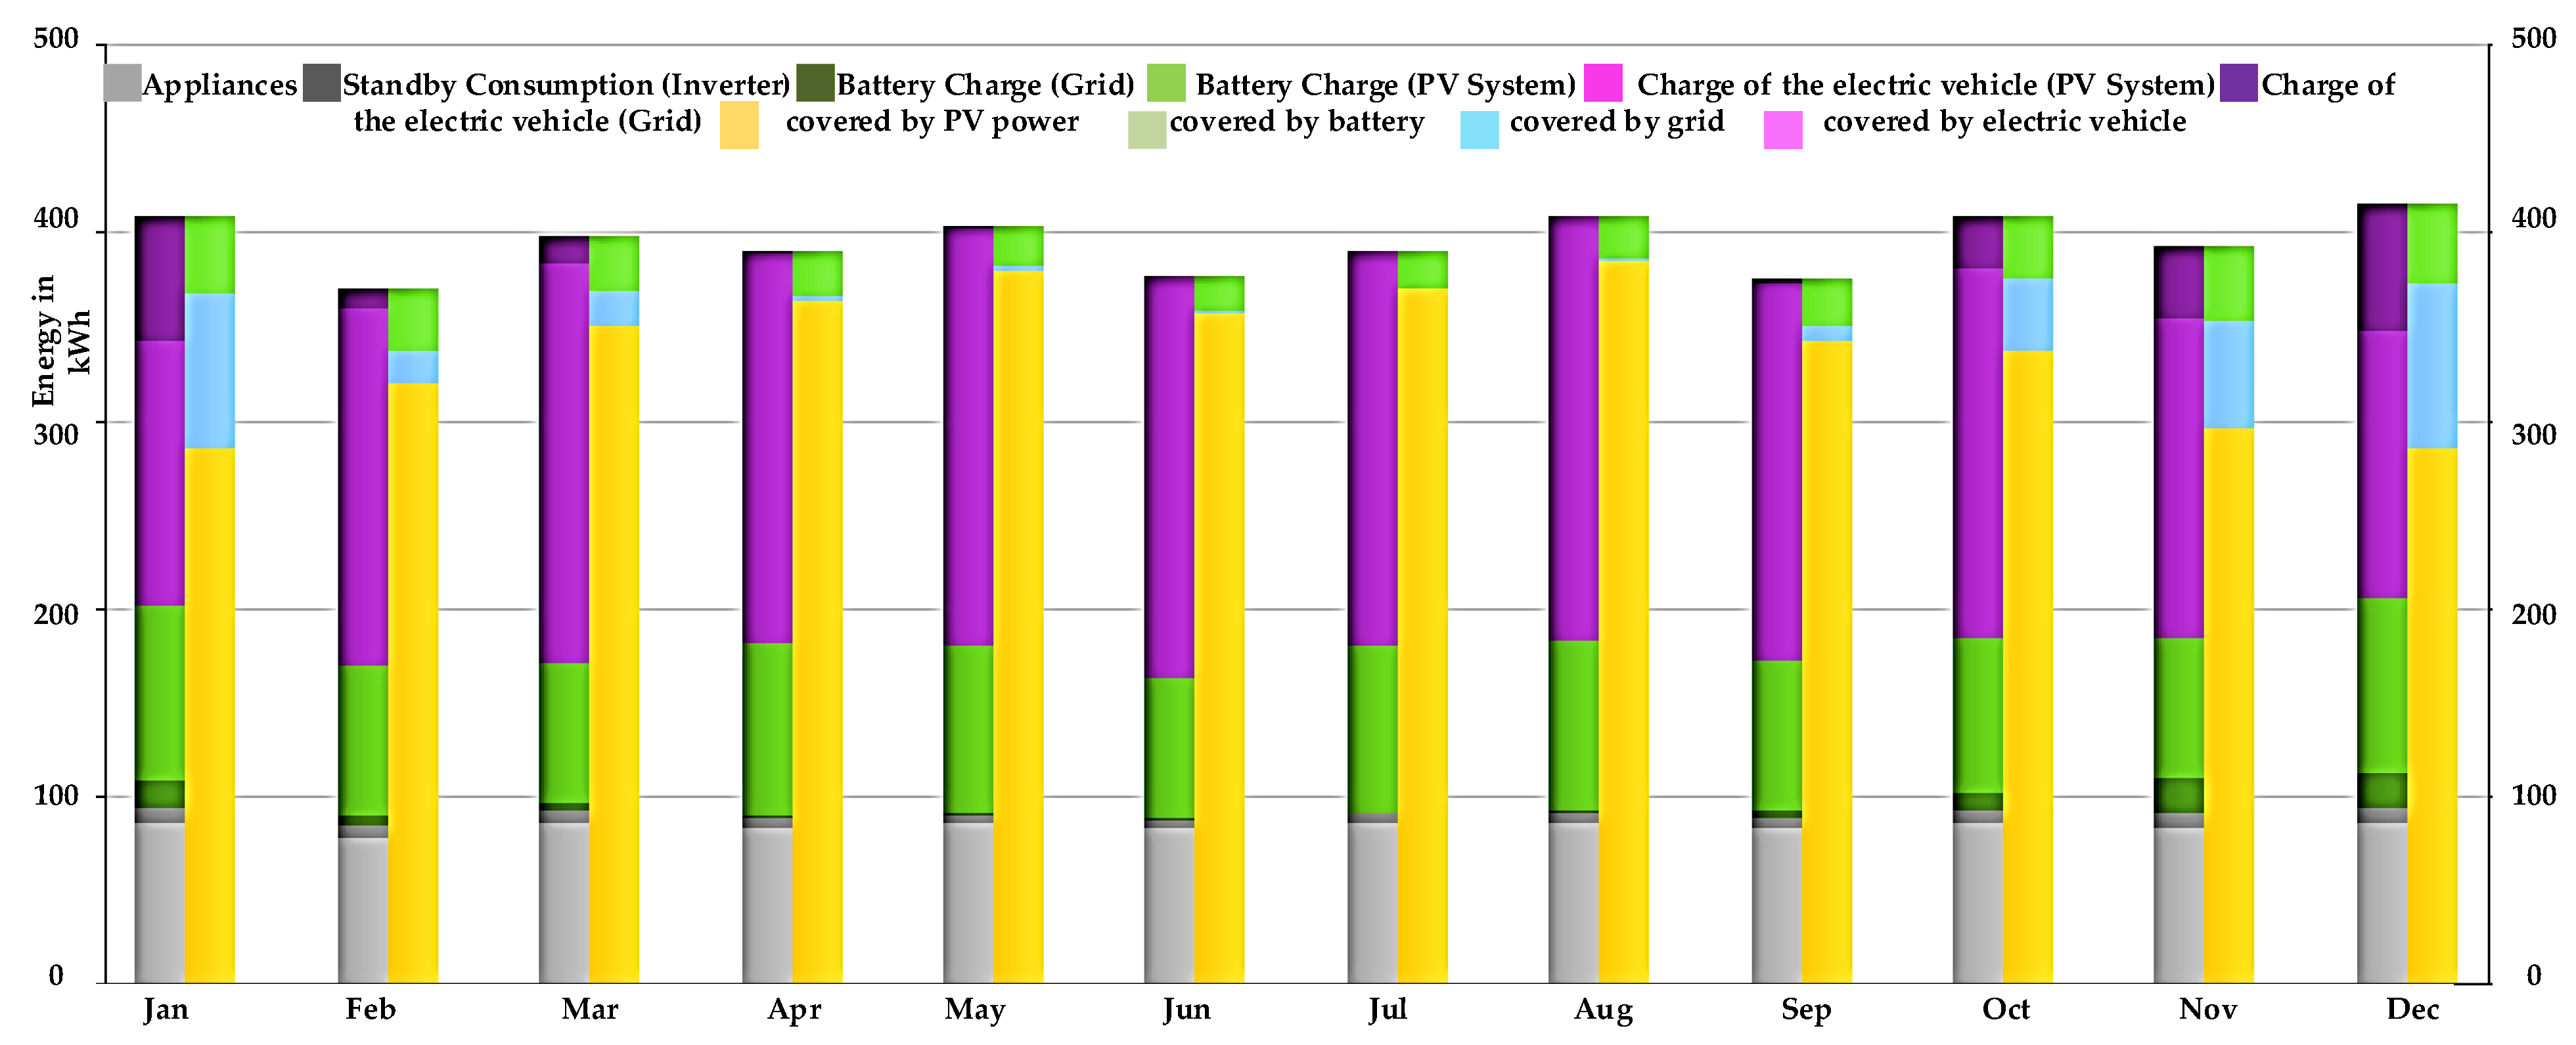
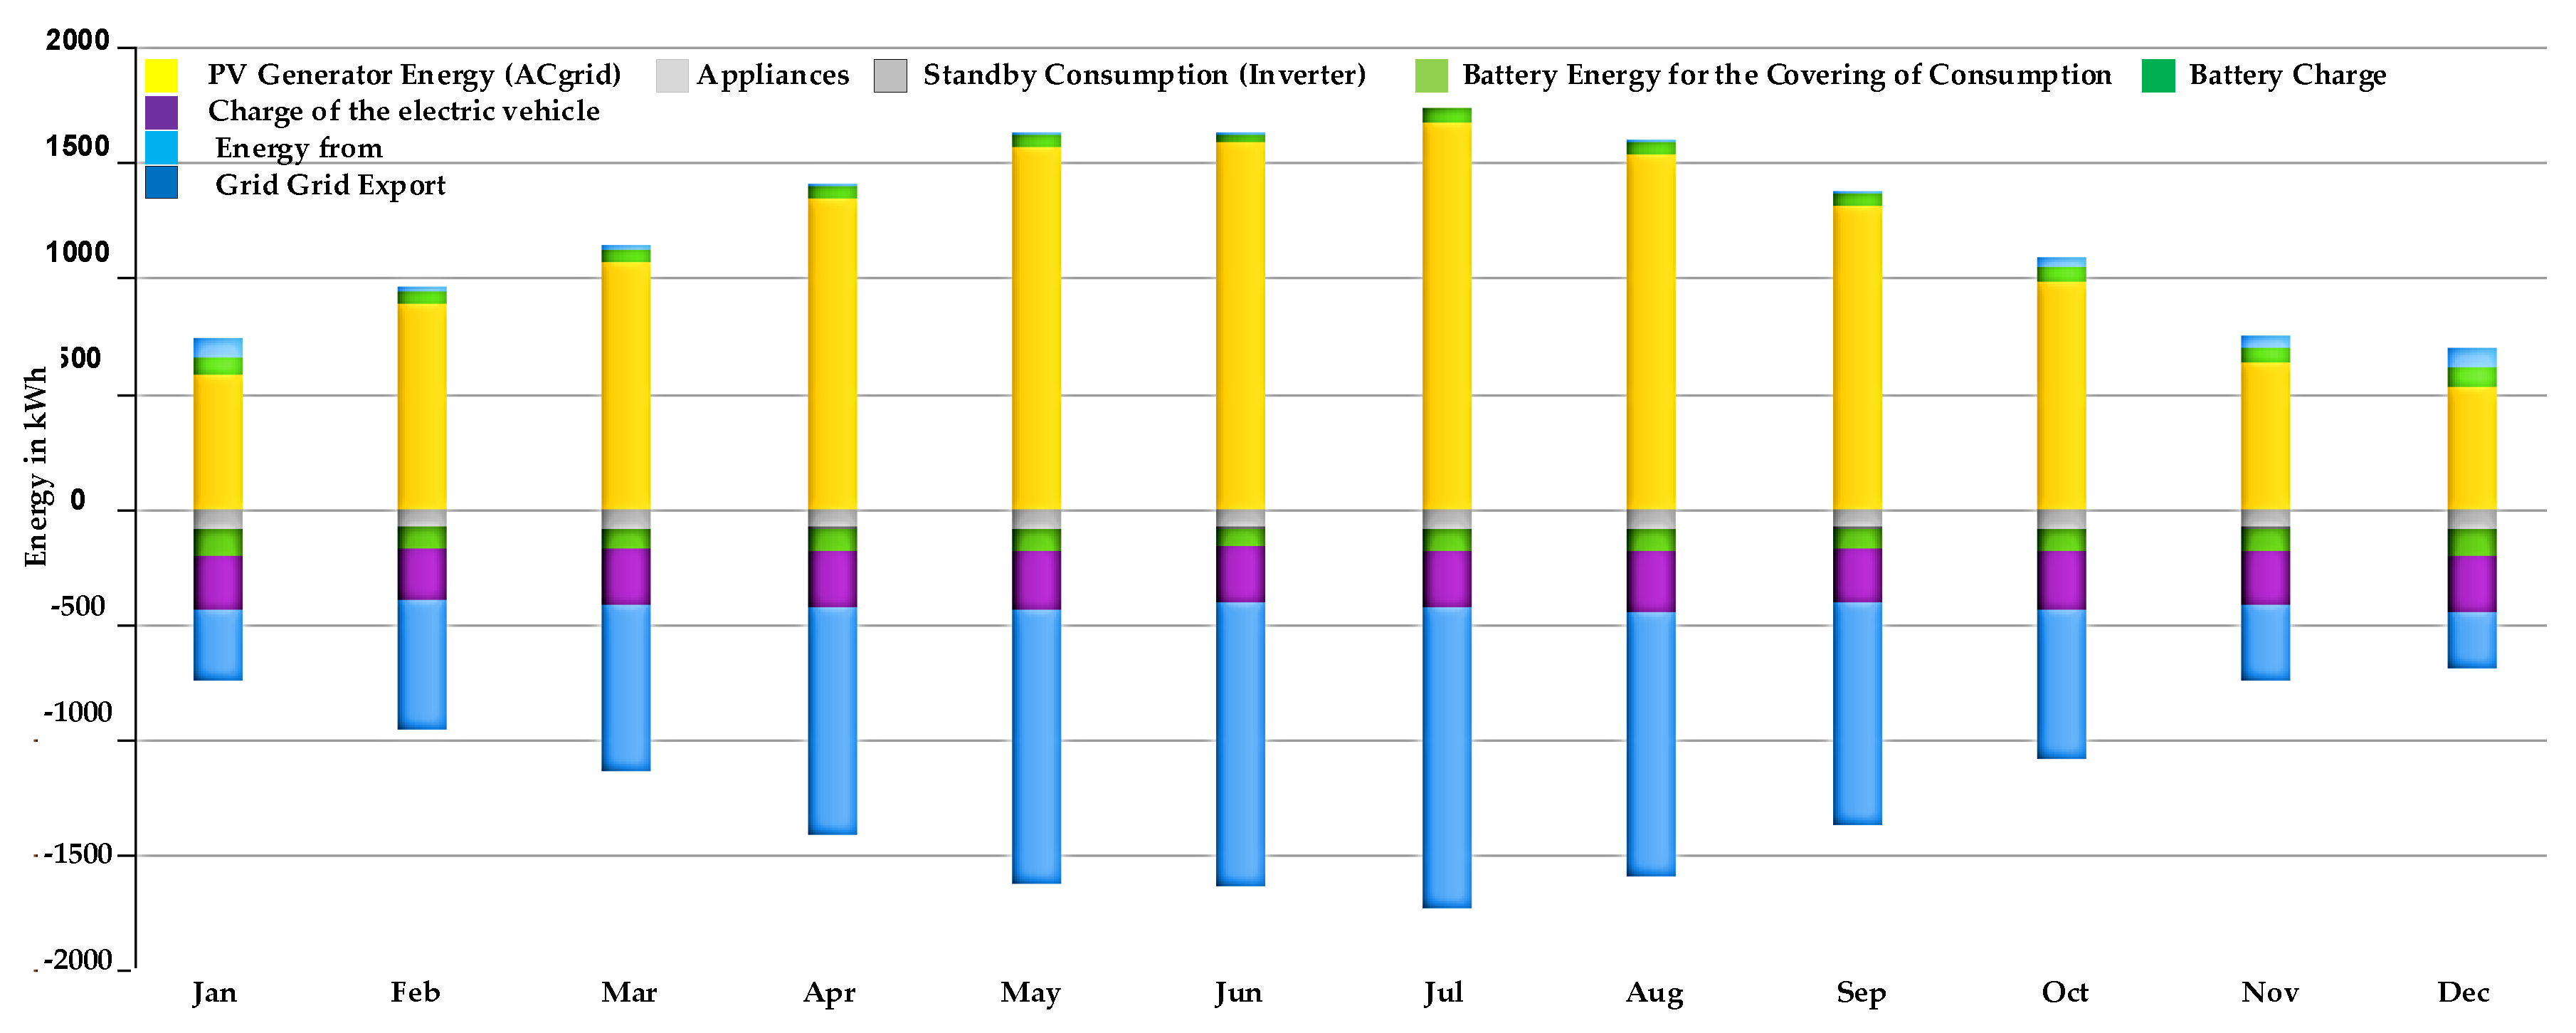
  • Yellow sections represent energy covered by PV power, which remains a significant contributor throughout the year, with higher values in summer months.
  • Green sections indicate battery energy use, including battery charge from PV (light green) and battery charge from the grid (dark green), showing how stored energy supports consumption.
  • Purple sections represent energy used for charging the electric vehicle, with contributions from both PV and the grid.
  • Blue sections show grid energy use, which appears more prominently in winter months (November–February) when solar generation is lower, indicating an increased reliance on the grid.
Seasonal Trends:
  • During summer months (May–August), a larger portion of energy is covered by PV power and battery storage, reducing dependence on the grid.
  • In winter months (November–February), grid energy contribution increases, as solar production is lower, requiring additional support from external sources.
  • Battery storage plays a key role in balancing energy use, ensuring that stored solar energy can be utilized efficiently across different months.
Key Insights:
Figure 9 demonstrates strong solar self-sufficiency, with PV power and battery storage covering a significant portion of the total consumption. However, in months of lower solar generation, grid power supplements the energy needs, ensuring a stable and reliable supply. The electric vehicle charging demand remains relatively consistent, showing the importance of balancing solar, battery, and grid sources to optimize overall energy usage.
Table 6 show the PV generator system has a capacity of 9.60 kWp and covers a surface area of 46.89 m². It receives global radiation of 1580.30 kWh/m², with an adjusted value of 1607.93 kWh/m² without reflection, indicating the amount of solar energy available for conversion.
With a high-performance ratio (PR) of 88.98%, the system efficiently converts solar energy into electricity while minimizing losses. As a result, it generates 13710.45 kWh of AC electricity per year, contributing significantly to energy needs. The system also has a specific annual yield of 1428.17 kWh/kWp, meaning each kilowatt of installed capacity produces 1428 kWh annually, demonstrating strong performance. PV system is well-optimized, ensuring high energy output and efficiency while making effective use of the available solar radiation.
The Production Forecast per Inverter in Figure 11 illustrates the expected monthly energy generation from the PV generator system, as processed by the inverter. The x-axis represents the months of the year, while the y-axis shows the energy production in kWh.
Key Trends:
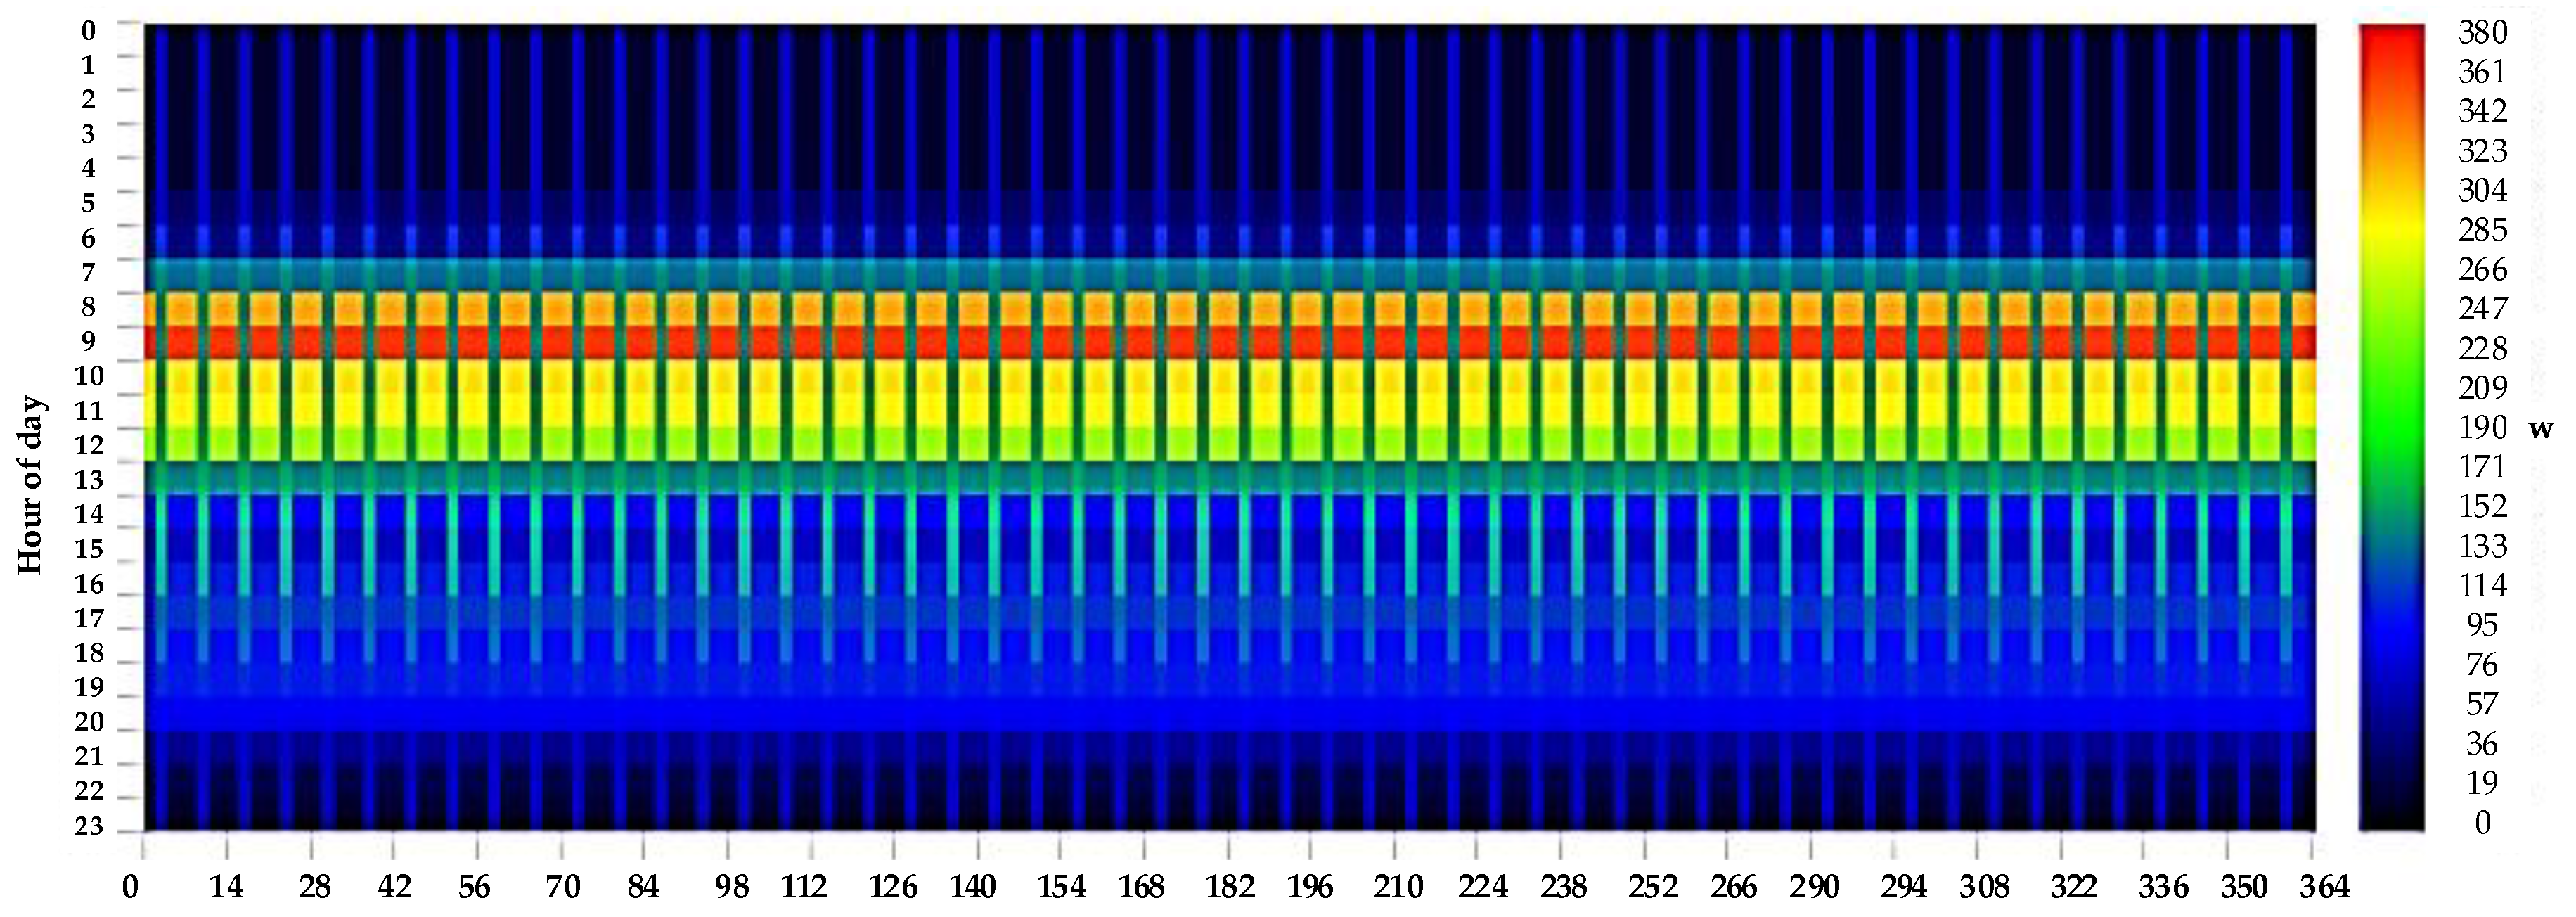
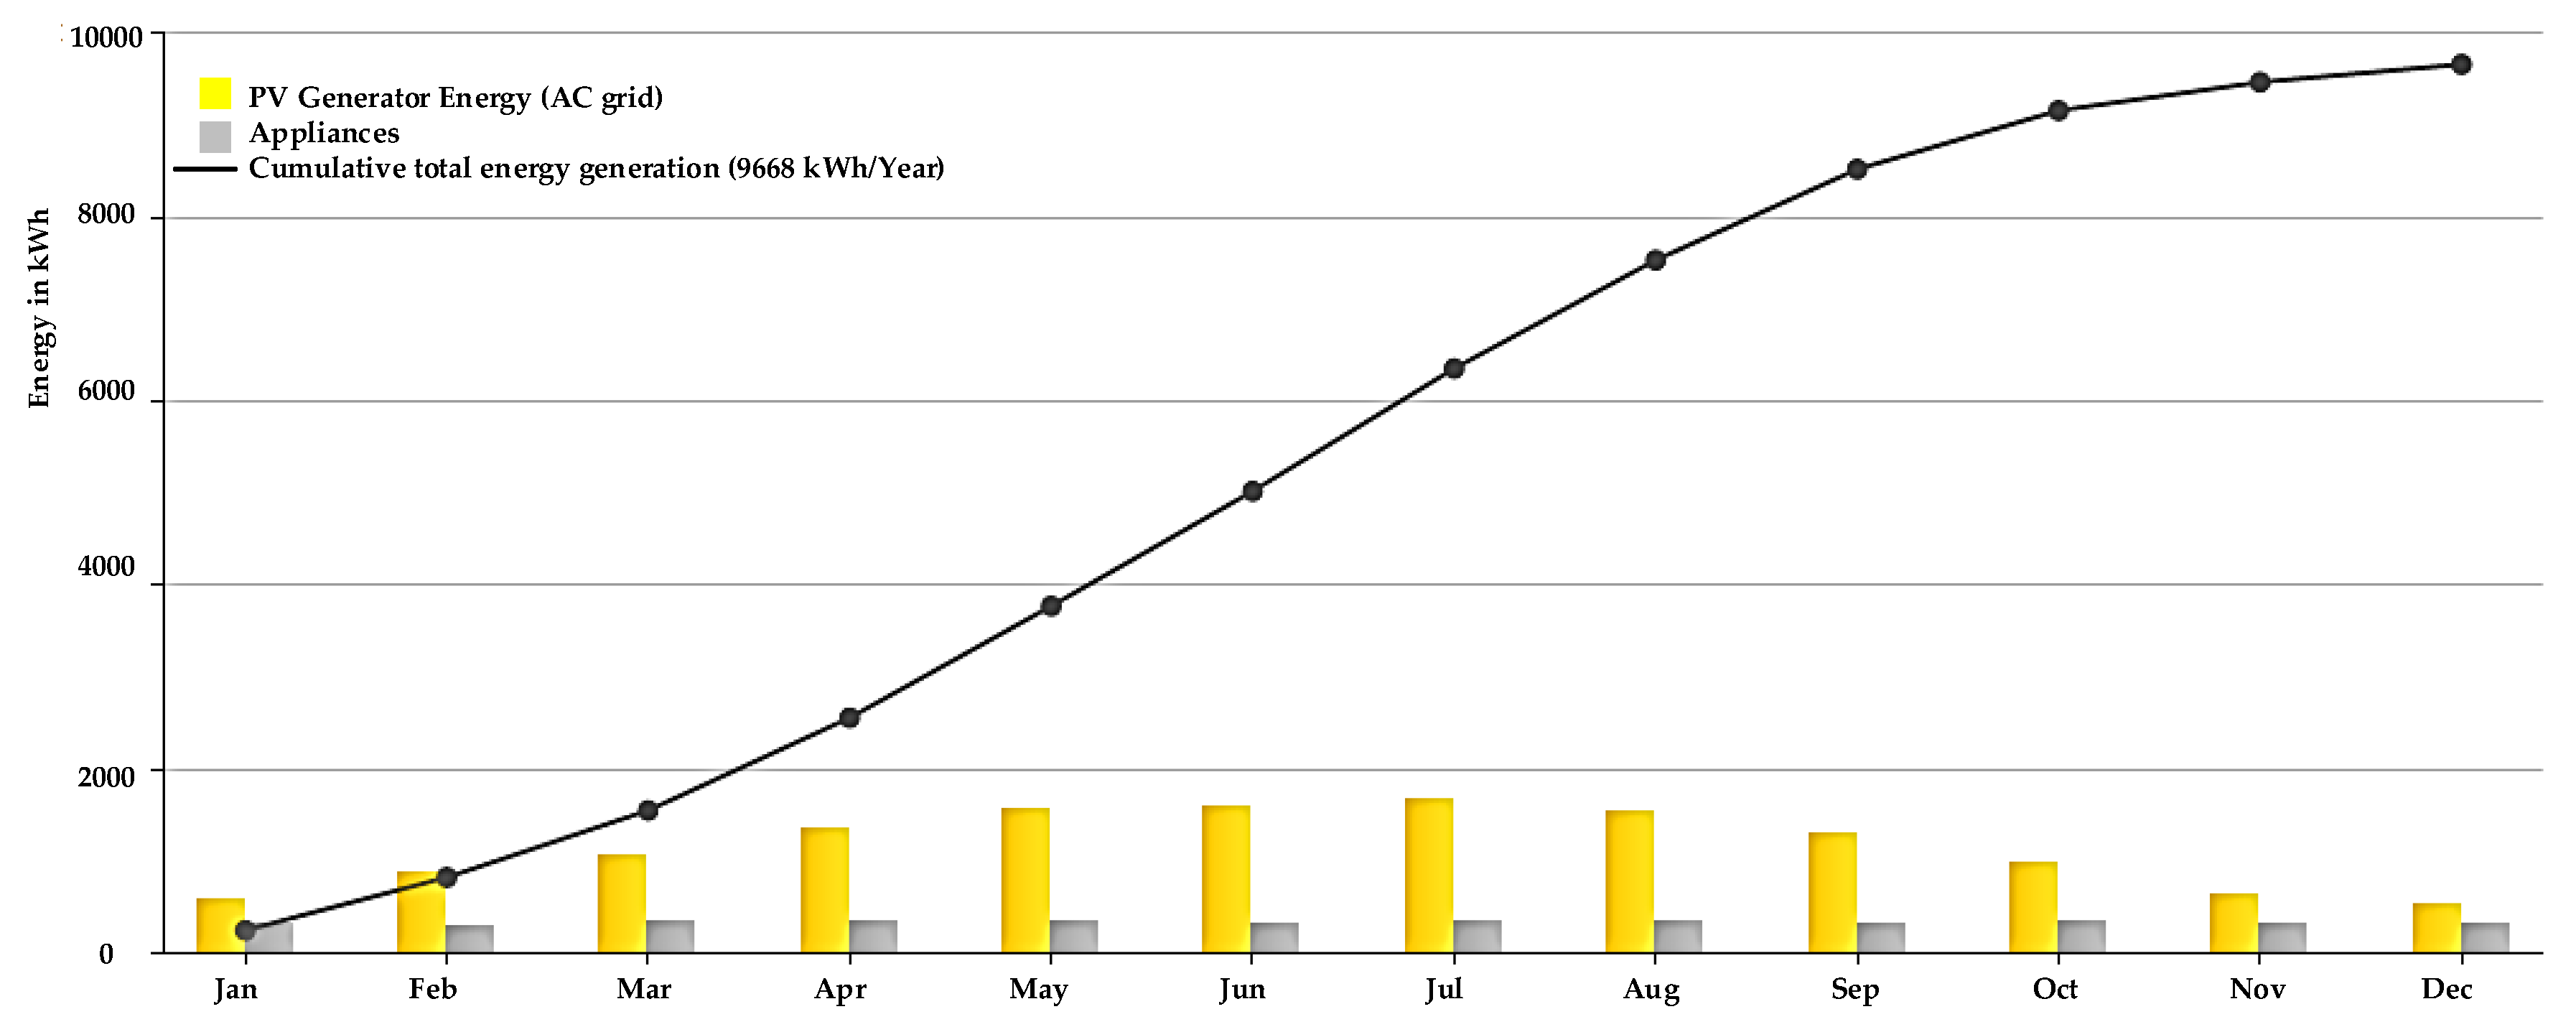
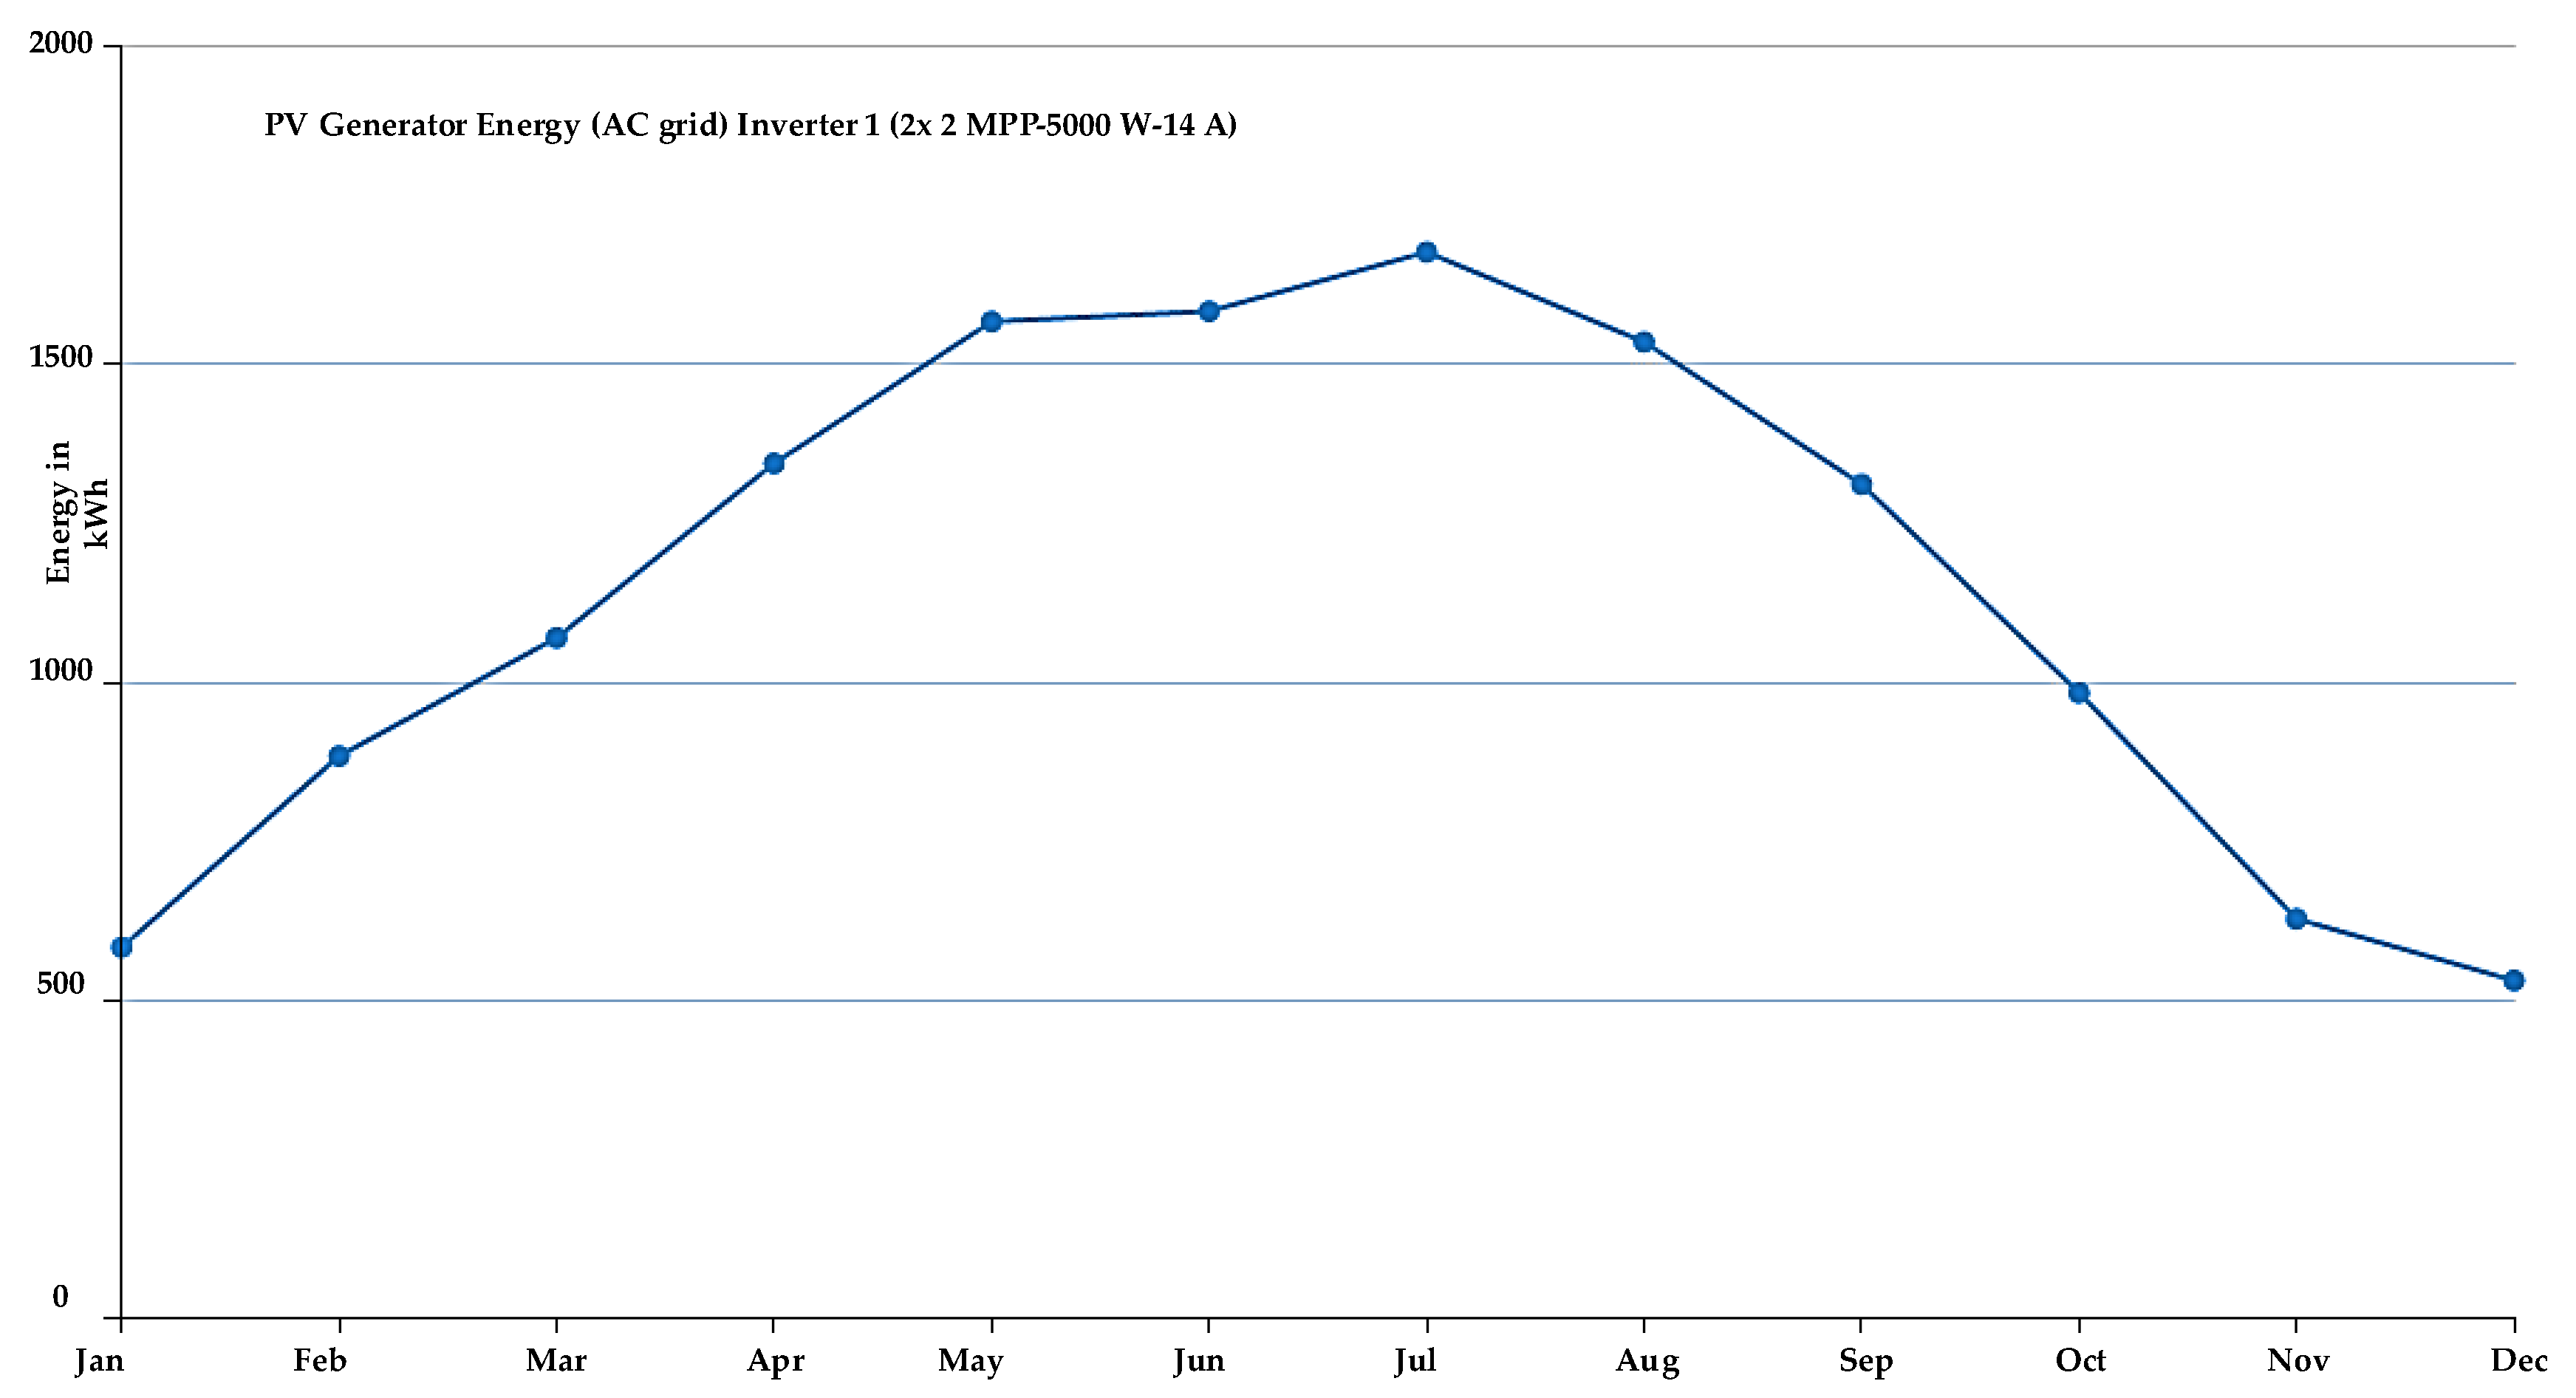
  • The energy output is lowest in January and December, with values below 600 kWh.
  • As sunlight increases, generation rises steadily from February to May, reaching over 1500 kWh.
  • The peak production occurs in June and July, with the highest monthly output exceeding 1700 kWh.
  • After July, generation gradually declines, following a downward trend from August to November due to reduced sunlight hours.
Interpretation:
  • The curve mirrors seasonal solar availability, with higher production in spring and summer and lower production in autumn and winter.
  • The inverter efficiently processes PV energy, ensuring stable performance across the year.
  • This seasonal variation is typical for solar power systems, as sunlight duration and intensity fluctuate annually.
Figure 11 demonstrates that the PV system is well-optimized, with peak energy production occurring when solar radiation is highest and a steady decline as daylight hours decrease in winter.
The Performance Ratio (PR) per Inverter in Figure 12 shows how efficiently the PV system converts available solar energy into usable electricity throughout the year. The performance ratio starts high in January, close to 100%, indicating optimal energy conversion. However, as the months progress, there is a gradual decline from February to July, reaching its lowest point in the summer months at around 85%.
This drop in efficiency during May to August is likely due to higher temperatures, which can negatively impact the performance of both solar panels and inverters. As the weather cools from September onwards, the PR begins to recover steadily, returning near its peak efficiency by December.
the PR remains above 80% throughout the year, demonstrating consistent system efficiency despite seasonal variations. The chart highlights that while summer months reduce efficiency slightly due to heat, the system performs optimally in cooler months, ensuring stable and reliable energy production year-round.
The Irradiance per Module Area in Figure 13 shows that solar irradiance increases from January to July, peaking in mid-summer, before declining towards December. The tilted surface (orange line) consistently receives more solar radiation than the horizontal plane (blue line), particularly in winter and early spring, when the sun is lower in the sky. In summer, the difference is minimal, as the sun is higher and more direct. The total annual irradiance is higher for the tilted module (1580.3 kWh/m²) compared to the horizontal plane (1444.8 kWh/m²), demonstrating the benefit of panel tilting for maximizing solar energy absorption throughout the year.

4. Conclusions

This study explores the integration of photovoltaic (PV) systems with battery storage and electric vehicle (EV) charging to enhance energy efficiency and sustainability. Conducted in Constanta, Romania, the research evaluates the effectiveness of a grid-connected PV system in reducing reliance on traditional energy sources, improving self-sufficiency, and minimizing carbon emissions. The findings indicate that the system generates approximately 13710 kWh annually, with 92.2% of total consumption covered by solar energy.
By incorporating battery storage, the system ensures a more stable power supply, reducing dependency on the grid to just 317 kWh per year. The study also highlights that electric vehicle charging, which accounts for 2965 kWh annually, is predominantly supported by solar energy, further demonstrating the benefits of renewable integration in transportation. Additionally, the PV system achieves a high-performance ratio of 88.48%, reflecting its efficiency in converting solar radiation into usable electricity.
The research concludes that integrating PV systems with battery storage and EV charging not only enhances energy independence but also contributes to significant economic and environmental benefits. With an estimated reduction of 6239 kg in CO₂ emissions per year, the system presents a viable and scalable model for future smart energy solutions. These results underscore the importance of renewable energy adoption in both residential and commercial settings to achieve long-term sustainability and cost savings.

Author Contributions

All authors contributed equally to the creation of the article. All authors have read and agreed to the published version of the manuscript.

Funding

This work was supported by a grant of the Ministry of Research, Innovation and Digitalization, project number PNRR-C9-I8-760111/23.05.2023, code CF48/14.11.2022.

Institutional Review Board Statement

Not applicable.

Informed Consent Statement

Not applicable.

Data Availability Statement

Not applicable.

Conflicts of Interest

The authors declare no conflict of interest.

References

  1. H. Feng, J. Liu, Y. Zhang, and D. Liu, “Solar energy storage in an all-vanadium photoelectrochemical cell: structural effect of titania nanocatalyst in photoanode,” Energies (Basel), vol. 15, no. 12, p. 4508, 2022. [CrossRef]
  2. Gmal Osman M., Strejoiu CV., Panait C., Lazaroiu G., Lazaroiu AC. Renewable energy integration, climate analysis, and efficiency optimization for greener transportation - case study in Dobrogea. International Multidisciplinary Scientific GeoConference-SGEM; 2023; (pp. 675-687).
  3. POWER | Data Access Viewer.” Accessed: Sep. 29, 2024. [Online]. Available: https://power.larc.nasa.gov/data-access-viewer/.
  4. M. Firoozzadeh, A. H. Shiravi, and M. Shafiee, “Experimental and Analytical Study on Enhancing Efficiency of the Photovoltaic Panels Using Polyethylene-Glycol 600 (PEG 600) as a Phase Change Material,” Iranian (Iranica) Journal of Energy & Environment, vol. 10, no. 1, pp. 23–32, 2019. [CrossRef]
  5. O. M. Babatunde, J. L. Munda, and Y. Hamam, “Off-grid hybrid photovoltaic–micro wind turbine renewable energy system with hydrogen and battery storage: Effects of sun tracking technologies,” Energy Convers Manag, vol. 255, p. 115335, 2022. [CrossRef]
  6. Strejoiu, C.V., Osman, M.G. and Cernat, A.C., 2023. Towards sustainable transportation: modeling and simulation of pv panel implementation on national highways for charging electric vehicles which leads to mitigate carbon emission. UPB Scientific Bulletin, Series C: Electrical Engineering and Computer Science, 85(4), pp.321-334.
  7. Ma, Y., Chen, L., & Zhao, H., 2021. Optimization of water heating systems using solar energy and air-source heat pumps. Journal of Renewable Energy Studies, 48(2), pp.145-157.
  8. Osman, M.G., Strejoiu, C.V., Panait, C., Lazaroiu, G. and Lazaroiu, A.C., 2023. Renewable energy integration, climate analysis, and efficiency optimization for greener transportation-case study in Dobrogea. International Multidisciplinary Scientific GeoConference: SGEM, 23(6.2), pp.675-687.
  9. Green, M.A., 2000. Photovoltaics: technology overview. Energy policy, 28(14), pp.989-998.
  10. Firoozzadeh, M., Shiravi, A.H. and Shafiee, M., 2019. Experimental and Analytical Study on Enhancing Efficiency of the Photovoltaic Panels Using Polyethylene-Glycol 600 (PEG 600) as a Phase Change Material. Iranica Journal of Energy & Environment, 10(1), pp.23-32.
  11. Babatunde, O.M., Munda, J.L. and Hamam, Y., 2022. Off-grid hybrid photovoltaic–micro wind turbine renewable energy system with hydrogen and battery storage: Effects of sun tracking technologies. Energy Conversion and Management, 255, p.115335.
  12. Gangopadhyay, U., Jana, S. and Das, S., 2013. State of art of solar photovoltaic technology. In Conference papers in science (Vol. 2013, No. 1, p. 764132). Hindawi Publishing Corporation.
  13. Kumar, S. and Tiwary, K.P., 2022. Cadmium selenide thin film deposition and characterization for photovoltaic applications. In Nanomaterials for Innovative Energy Systems and Devices (pp. 333-367). Singapore: Springer Nature Singapore.
  14. Osman, M.G., Ciupagenau, D.A., Lazaroiu, G. and Pisa, I., 2022, September. Increasing Renewable Energy Participation in Sudan. In 2022 11th International Conference on Renewable Energy Research and Application (ICRERA) (pp. 169-173). IEEE.
  15. Zakaria, Z.A., Chen, B.C. and Hassan, M.O., 2008, October. Modeling of photovoltaic power plants. In 2008 International Conference on Electrical Machines and Systems (pp. 3835-3839). IEEE.
  16. Zhu, C.X., Sun, T., Liu, Y., Zhou, Y. and Chen, Y., 2021. Capacity matching and operation optimization of solar energy and air source heat pump combined heating system. Acta Solar Energy Sinica, 42(08), pp.215-222.
  17. Dubey, S., Sarvaiya, J.N. and Seshadri, B., 2013. Temperature dependent photovoltaic (PV) efficiency and its effect on PV production in the world–a review. Energy procedia, 33, pp.311-321. [CrossRef]
  18. Oulis Rousis, A., Tzelepis, D., Konstantelos, I., Booth, C. and Strbac, G., 2018. Design of a hybrid AC/DC microgrid using Homer Pro: Case study on an islanded residential application. Inventions, 3(3), p.55. [CrossRef]
  19. Buitenhuis, A.J. and Pearce, J.M., 2012. Open-source development of solar photovoltaic technology. Energy for Sustainable Development, 16(3), pp.379-388. [CrossRef]
  20. Osman, M.G., Ciupageanu, D. and Stan, A., 2022. Analysis of Solar Radiation in Sudan and Optimal Location of Photovoltaic Panels. UPB Sci. Bull. Series C, 84(4).
  21. Abarro, J.M.E., Gavan, J.N.L., Loresca, D.E.D., Ortega, M.A.A., Esparcia Jr, E.A. and Paraggua, J.A.D., 2023. A Tale of Nickel-Iron Batteries: Its Resurgence in the Age of Modern Batteries. Batteries, 9(7), p.383.
  22. Faraji, F., Majazi, A. and Al-Haddad, K., 2017. A comprehensive review of flywheel energy storage system technology. Renewable and Sustainable Energy Reviews, 67, pp.477-490. [CrossRef]
  23. Hossain, T., Adams, M. and Walker, T.R., 2021. Role of sustainability in global seaports. Ocean & Coastal Management, 202, p.105435. [CrossRef]
  24. Wang, B., Min, H., Sun, W. and Yu, Y., 2021. Research on optimal charging of power lithium-ion batteries in wide temperature range based on variable weighting factors. Energies, 14(6), p.1776. [CrossRef]
  25. Gao, Y., Zhang, X., Cheng, Q., Guo, B. and Yang, J., 2019. Classification and review of the charging strategies for commercial lithium-ion batteries. Ieee Access, 7, pp.43511-43524.
  26. Vade, A., Sharma, P., & Kiran, D., 2017. Carbon emissions in wool wet processing: Renewable energy solutions. Journal of Environmental Impact Studies, 29(2), pp.567-574.
  27. A. K. Zahra Vahidinasab, Alireza Javadi, “Performance and Reliability of Photovoltaic Modules: A Review of Testing Methods. Progress in Photovoltaics: Research and Applications,” vol. 26(5), pp. 393-412.
  28. Z. A. Zakaria, B.-C. Chen, and M. O. Hassan, “Modeling of photovoltaic power plants,” in 2008 International Conference on Electrical Machines and Systems, IEEE, 2008, pp. 3835–3839.
  29. U. Gangopadhyay, S. Jana, and S. Das, “State of art of solar photovoltaic technology,” in Conference papers in science, Hindawi, 2013.
  30. Dorel S, Gmal Osman M, Strejoiu CV, Lazaroiu G. Exploring Optimal Charging Strategies for Off-Grid Solar Photovoltaic Systems: A Comparative Study on Battery Storage Techniques. Batteries. 2023 Sep 18;9(9):470.
  31. S. Kumar and K. P. Tiwary, “Cadmium Selenide Thin Film Deposition and Characterization for Photovoltaic Applications,” in Nanomaterials for Innovative Energy Systems and Devices, Springer, 2022, pp. 333–367.
  32. S. Dubey, J. N. Sarvaiya, and B. Seshadri, “Temperature dependent photovoltaic (PV) efficiency and its effect on PV production in the world–a review,” Energy Procedia, vol. 33, pp. 311–321, 2013.
  33. A. Oulis Rousis, D. Tzelepis, I. Konstantelos, C. Booth, and G. Strbac, “Design of a hybrid AC/DC microgrid using Homer Pro: Case study on an islanded residential application,” Inventions, vol. 3, no. 3, p. 55, 2018.
  34. A. J. Buitenhuis and J. M. Pearce, “Open-source development of solar photovoltaic technology,” Energy for Sustainable Development, vol. 16, no. 3, pp. 379–388, 2012.
  35. Lazaroiu, G., Gmal Osman, M. and Strejoiu, C.V., 2023. Performance Evaluation of Renewable Energy Systems: Photovoltaic, Wind Turbine, Battery Bank, and Hydrogen Storage. Batteries, 9(9), p.468. [CrossRef]
  36. J. M. E. Abarro, J. N. L. Gavan, D. E. D. Loresca, M. A. A. Ortega, E. A. Esparcia Jr, and J. A. D. R. Paraggua, “A Tale of Nickel-Iron Batteries: Its Resurgence in the Age of Modern Batteries,” Batteries, vol. 9, no. 7, p. 383, 2023. [CrossRef]
  37. Dow, 2001. Product Information: SYLTHERM 800. Available at: https://www.npl.washington.edu/TRIMS/sites/sand.npl.washington.edu.TRIMS/files/manuals_documentation/syltherm-800-technical-data-sheet.pdf (Accessed: Jul /05/2024).
  38. O.-L. Harpalete, “Estimating Travel Demand with a Multimodal Transport Model Including E-Scooters in Iași, Romania,” Promet-Traffic&Transportation, vol. 35, no. 3, pp. 349–363, 2023.
  39. “PZU: Raport PIP si Volum Tranzactionat.” Accessed: Jul. 16, 2024.[Online]. Available: https://www.opcom.ro/grafice-ip-raportPIP-si-volumTranzactionat/ro.
  40. K. B. Hueso, M. Armand, and T. Rojo, “High temperature sodium batteries: Status, challenges and future trends,” Energy Environ Sci, vol. 6, no. 3, pp. 734–749, 2013,.
  41. S. M. Mousavi G, F. Faraji, A. Majazi, and K. Al-Haddad, “A comprehensive review of Flywheel Energy Storage System technology,” Renewable and Sustainable Energy Reviews, vol. 67, pp. 477–490, 2017.
  42. Lazaroiu, A.C., Gmal Osman, M., Strejoiu, C.V. and Lazaroiu, G., 2023. A comprehensive overview of photovoltaic technologies and their efficiency for climate neutrality. Sustainability, 15(23), p.16297. [CrossRef]
  43. A. A. Bashir, M. Pourakbari-Kasmaei, J. Contreras, and M. Lehtonen, “A novel energy scheduling framework for reliable and economic operation of islanded and grid-connected microgrids,” Electric Power Systems Research, vol. 171, no. February, pp. 85–96, 2019. [CrossRef]
  44. F. Spertino, G. Malgaroli, A. Amato, M. A. E. Qureshi, A. Ciocia, and H. Siddiqi, “An Innovative technique for energy assessment of a highly efficient photovoltaic module,” in Solar, MDPI, 2022, pp. 321–333. [CrossRef]
  45. A. P. Adeagbo, F. K. Ariyo, K. A. Makinde, S. A. Salimon, O. B. Adewuyi, and O. K. Akinde, “Integration of solar photovoltaic distributed generators in distribution networks based on site’s condition,” in Solar, MDPI, 2022, pp. 52–63. [CrossRef]
  46. S. Chtita, A. Derouich, A. El Ghzizal, and S. Motahhir, “An improved control strategy for charging solar batteries in off-grid photovoltaic systems,” Solar Energy, vol. 220, pp. 927–941, 2021. [CrossRef]
  47. E. Al. Ismail and S. M. Hashim, “An economic evaluation of grid connected photovoltaic system for a residential house in Khartoum,” in 2018 International Conference on Computer, Control, Electrical, and Electronics Engineering (ICCCEEE), IEEE, 2018, pp. 1–6.
  48. E. Vartiainen, G. Masson, C. Breyer, D. Moser, and E. Román Medina, “Impact of weighted average cost of capital, capital expenditure, and other parameters on future utility-scale PV levelised cost of electricity,” Progress in photovoltaics: research and applications, vol. 28, no. 6, pp. 439–453, 2020.
  49. T. Hossain, M. Adams, and T. R. Walker, “Role of sustainability in global seaports,” Ocean Coast Manag, vol. 202, p. 105435, 2021. [CrossRef]
  50. B. Wang, H. Min, W. Sun, and Y. Yu, “Research on optimal charging of power lithium-ion batteries in wide temperature range based on variable weighting factors,” Energies (Basel), vol. 14, no. 6, p. 1776, 2021. [CrossRef]
  51. S. Wang, L. Wen, X. Gong, J. Liang, X. Hou, and F. Hou, “Piezoelectric-Based Energy Conversion and Storage Materials,” Batteries, vol. 9, no. 7, p. 371, 2023. [CrossRef]
Figure 1. Scheme of total consumption system.
Preprints 149915 g001
Figure 2. Energy Flow Diagram: Generation, Storage, Consumption, and Losses.
Preprints 149915 g002
Figure 3. Daily Variation of Solar Irradiance and Outside Temperature on a Horizontal Plane.
Preprints 149915 g003
Figure 4. Total charge and consumption of electric vehicle.
Preprints 149915 g004
Figure 5. Total battery charge and PV generations.
Preprints 149915 g005
Figure 6. Monthly Production Forecast and Energy Consumption Distribution.
Preprints 149915 g006
Figure 7. Cumulative Total Energy Generation and Monthly PV Output.
Preprints 149915 g007
Figure 8. Monthly Distribution of PV Energy Utilization.
Preprints 149915 g008
Figure 9. Monthly Coverage of Energy Consumption from Various Sources.
Preprints 149915 g009
Figure 11. Monthly Production Forecast per Inverter.
Preprints 149915 g011
Figure 12. Monthly Performance Ratio (PR) per Inverter.
Preprints 149915 g012
Figure 13. Monthly Irradiance per Module Area on Horizontal and Tilted Surfaces.
Preprints 149915 g013
Table 1. Technical Specifications of a Grid-Connected PV System with Battery Storage and EV Integration.
Category Parameter Value
System Type, Climate and Grid Type of System Grid-connected PV system
Climate Data Constanta, ROU
AC Mains 230 V, 3-phase, cos φ = 1
Consumption Total Consumption 1000.0 kWh
Load Peak 0.4 kW
PV Modules Module Area Module Area
Module Data 0.4 kWp - Si monocrystalline
Number of PV Modules 24
PV Generator Output 9.6 kWp
Inclination 30°
Orientation 180°
Installation Type Roof parallel
Inverters Total Power 10 kW
Inverter 2 MPP - 5 kW - 14 A
Configuration MPP 1+2: 1 x 12
Sizing Factor 96%
Electric Vehicles Electric Vehicle Group Group 1
Electric Vehicle Model Honda e: Ny1 (AC charging)
Charging Power 11 kW
Battery Capacity 68.8 kWh
Range (as per standard) 512 km
Battery System Battery System Group Group 1
Battery System 2 kW - AC Coupling - 14.4 kWh
Type of Coupling AC coupling
Nominal Output 2 kW
Battery Type 12V 1050 Ah valve regulated
Battery Capacity 14.4 kWh
Table 2. Annual Energy Performance of a 9.60 kWp Photovoltaic System.
PV Generator Output 9.60 kWp Battery Charge 1016 kWh/Year
Spec. Annual Yield 1420.18 kWh/kWp Charge of the electric vehicle 2335 kWh/Year
Performance Ratio (PR) 88.48 % Clipping at Feed-in Point 0 kWh/Year
Grid Export 9641 kWh/Year
PV Generator Energy (AC grid) 13710 kWh/Year Own Power Consumption 29.3 %
Direct Own Use 719 kWh/Year CO₂ Emissions avoided 6239 kg / year
Table 3. Annual Energy Consumption and Coverage Breakdown.
Appliances 1000 kWh/Year covered by grid 317 kWh/Year
Standby Consumption (Inverter) 77 kWh/Year covered by battery net 672 kWh/Year
Charge of the electric vehicle 2965 kWh/Year covered by PV power 3053 kWh/Year
Total Consumption 4042 kWh/Year Solar Fraction 92.2 kWh/Year
Table 4. Annual Energy Balance and Coverage for Electric Vehicle Charging.
Charge at beginning 22 kWh Losses due to charging/discharging 177 kWh/Year
Charge of the electric vehicle (Total) 2965 kWh/Year Losses in Battery 455 kWh/Year
covered by PV power 2335 kWh/Year Consumption due to km driven 2354 kWh/Year
covered by battery 398 kWh/Year Mileage per year 18250 km/Year
covered by grid 232 kWh/Year of which is solar 16820 km/Year
Table 5. Annual Battery Performance and Energy Distribution.
Charge at beginning 14 kWh Consumption 351 kWh/Year
Battery Charge (Total) 1094 kWh/Year Losses due to charging/discharging 152 kWh/Year
covered by PV power 1016 kWh/Year Losses in Battery 207 kWh/Year
covered by grid 78 kWh/Year Cycle Load 0.8 %
Battery Energy for Covering Consumption 750 kWh/Year Service Life >12 Years
Charge of the electric vehicle 398 kWh/Year
Table 6. Photovoltaic System Specifications and Performance Metrics.
Module Area
PV Generator Output 9.60 kWp
PV Generator Surface 46.89
Global Radiation at the Module 1580.30 kWh/m²
Global Radiation on Module without reflection 1607.93 kWh/m²
Performance Ratio (PR) 88.98 %
PV Generator Energy (AC grid) 13710.45 kWh/Year
Spec. Annual Yield 1428.17 kWh/kWp
Disclaimer/Publisher’s Note: The statements, opinions and data contained in all publications are solely those of the individual author(s) and contributor(s) and not of MDPI and/or the editor(s). MDPI and/or the editor(s) disclaim responsibility for any injury to people or property resulting from any ideas, methods, instructions or products referred to in the content.
Copyright: This open access article is published under a Creative Commons CC BY 4.0 license, which permit the free download, distribution, and reuse, provided that the author and preprint are cited in any reuse.
Prerpints.org logo

Preprints.org is a free preprint server supported by MDPI in Basel, Switzerland.

Subscribe

Disclaimer

Terms of Use

Privacy Policy

Privacy Settings

© 2025 MDPI (Basel, Switzerland) unless otherwise stated