1. Introduction
Satellite-based detection and mapping are some of the key applications to different environmental fields, like the management of water resources, studying climate change, and monitoring floods. Free-of-cost Sentinel-2 satellite imagery has introduced new avenues because of the increased spatial resolution and enhanced spectral resolution for better detection of water bodies. [
1,
2] However, traditional water indices, including the Normalized Difference Water Index (NDWI), Modified NDWI (MNDWI), and Automated Water Extraction Index (AWEI), are usually restricted by their fixed band ratios and thresholds in accurately delineating water bodies. [
3,
4,
5]
These traditional indices normally rely on preselected spectral band combinations and static thresholds that may not adapt well to changing environmental conditions, seasonal changes, or different locations. Most NDWI, which involves green and near-infrared bands, suffers from confusion with built-up areas. Although MNDWI improved with the inclusion of shortwave infrared, this index can also face degraded performance in urban surface and shallow water areas [
6]. Although the AWEI is a little more advanced, it might overestimate water coverage, as previous studies have shown. [
7,
8,
9]
Recent developments in machine learning and optimization techniques have provided opportunities to improve the accuracy of water body detection. Particle Swarm Optimization, based on social behavior patterns in nature, has been applied with promising results in different remote sensing applications. [
10] However, its potential in optimizing multi-band water indices has not been explored. Integration of multiple Sentinel-2 bands using an optimized approach may overcome the limitations of traditional dual-band ratio methods.
Yun Du and Yihang Zhang [
11] investigated refinements in water body mapping using Sentinel-2 multispectral images. They discussed the resolution difference between green (10m) and SWIR (20m) bands. They proposed the generation of new MNDWI at 10m resolution by pan-sharpening techniques, comparing Principal Component Analysis, Intensity Hue Saturation, High Pass Filter, and à Trous Wavelet Transform. Their results with Venice coastland imagery showed that MNDWI outperformed NDWI, while the most accurate water body mapping was obtained with ATWT. However, the highest accuracy was from HPF-sharpened MNDWI images. [
12]
Duomandi Jiang and Yunmei Li [
13] evaluated SDGSAT-1’s performance against Sentinel-2 MSI data for water body extraction. Using confidence thresholding with indices like NDWI, MNDWI, and SWI, they found that SDGSAT-1’s SWI outperformed Sentinel-2’s NDWI in accuracy (90% vs. 91% overall accuracy, Kappa: 0.771 vs. 0.416, F1: 0.844 vs. 0.651), attributed to its deep blue bands. Reham Gharbia [
14] proposed a novel approach for automatic water body extraction using Faster R-CNN, which achieved 98.7% and 96.1% accuracy for Sentinel-2 and Landsat-8 datasets, respectively, higher than conventional CNN approaches. These studies are put together to show the evolution of different water body detection techniques from traditional indices to advanced machine-learning approaches.
This research introduces the PSO-SMBWI, a new methodology that combines PSO with the Spectral Multi-Band Water Index for enhanced detection of water bodies. Our approach optimizes the coefficients of seven Sentinel-2 bands simultaneously, adapting to local conditions while maintaining computational efficiency. The proposed method addresses several key challenges in water body detection: the need for manual threshold adjustment, spectral confusion in complex landscapes, and the integration of multiple spatial resolutions. The main objectives of this work can be listed in the following points:
To propose an adaptive multiband water index optimization framework using PSO.
To explore the performance of the proposed approach against traditional water indices, and
To demonstrate how efficient coefficient automated optimization is in enhancing water body detection accuracy. This paper, therefore, proposes a more robust and accurate method for mapping water bodies that applies to environmental monitoring, disaster management, and urban planning.
2. Experimental Work
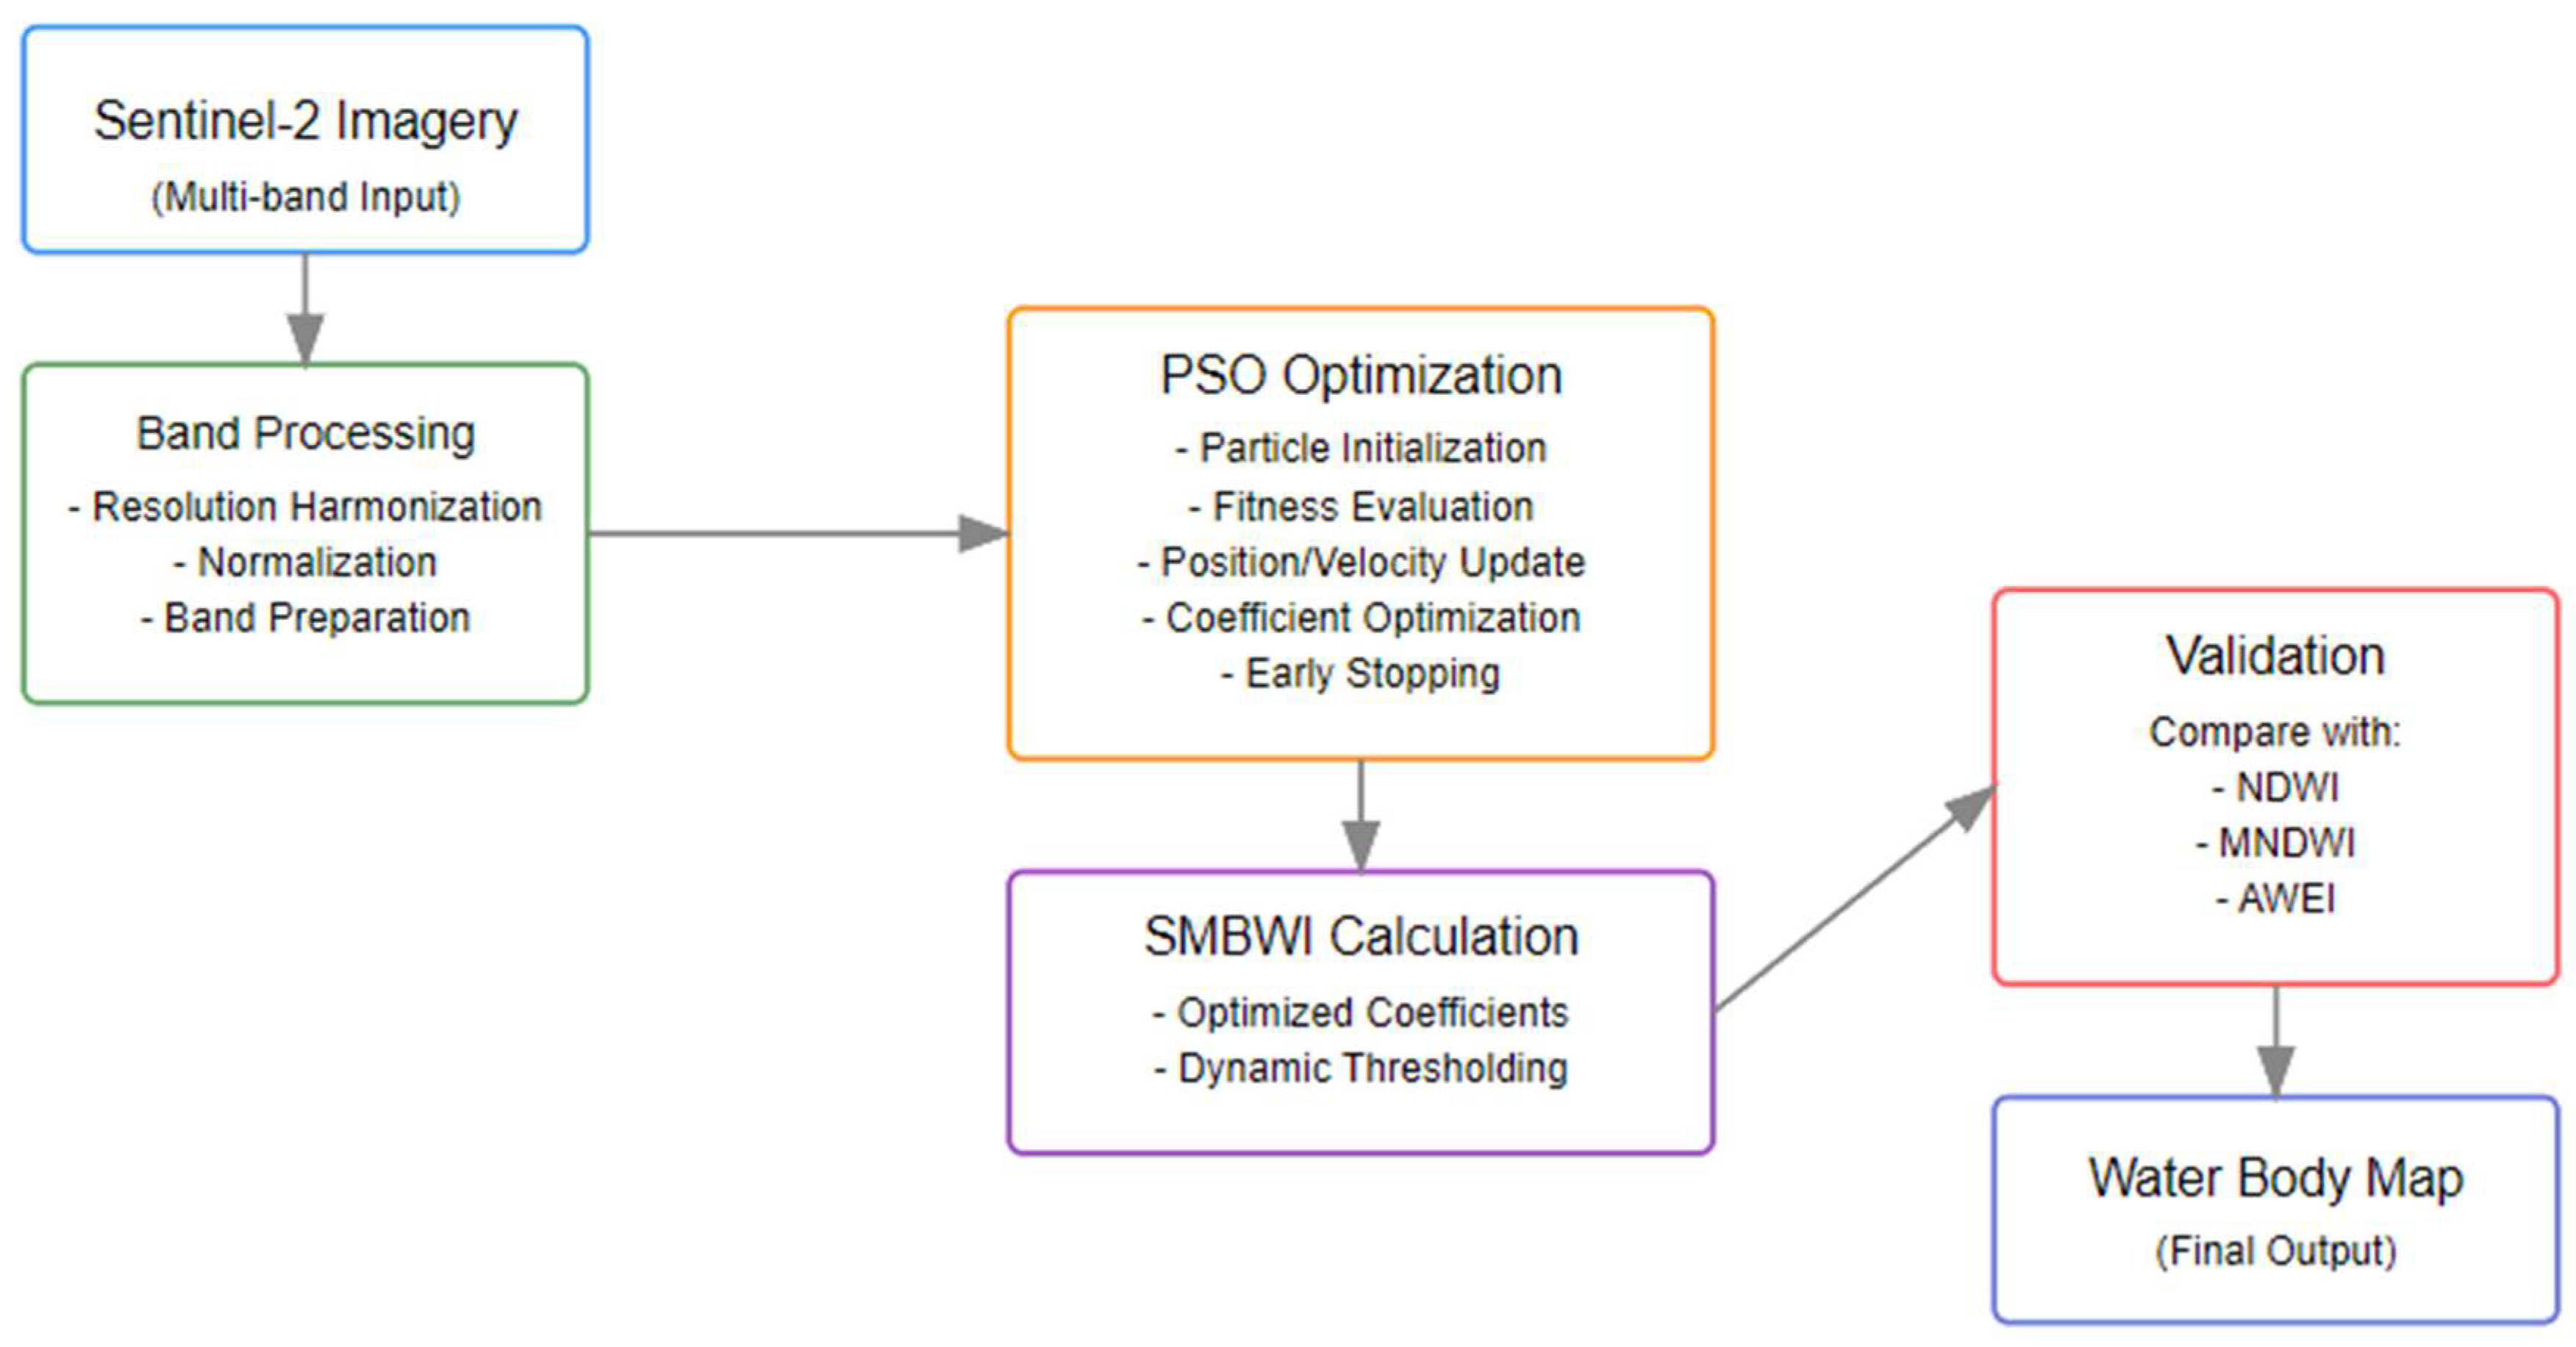
The proposed PSO-SMBWI methodology presents a new paradigm for optimizing water body detection by integrating multiple Sentinel-2 spectral bands and Particle Swarm Optimization. The core of this approach relies on seven different Sentinel-2 bands: Blue (B2), Green (B3), NIR (B8), NIR-Narrow (B8A), Water Vapor (B9), SWIR1 (B11), and SWIR2 (B12), each contributing unique spectral information for water body identification. The proposed methodology is based on three major components:
an adaptive multi-band integration system that deals with different spatial resolutions, namely 10m, 20m, and 60m;
a PSO-based optimization framework with modified parameters and a novel fitness function, and
a robust validation mechanism that compares the results with traditional water indices.
Figure 1 shows the overall workflow of the proposed methodology, showing how these components are connected to achieve the said accuracy in water body detection. Each component of the proposed framework is discussed in detail in subsequent subsections by explaining their contribution to the overall system performance.
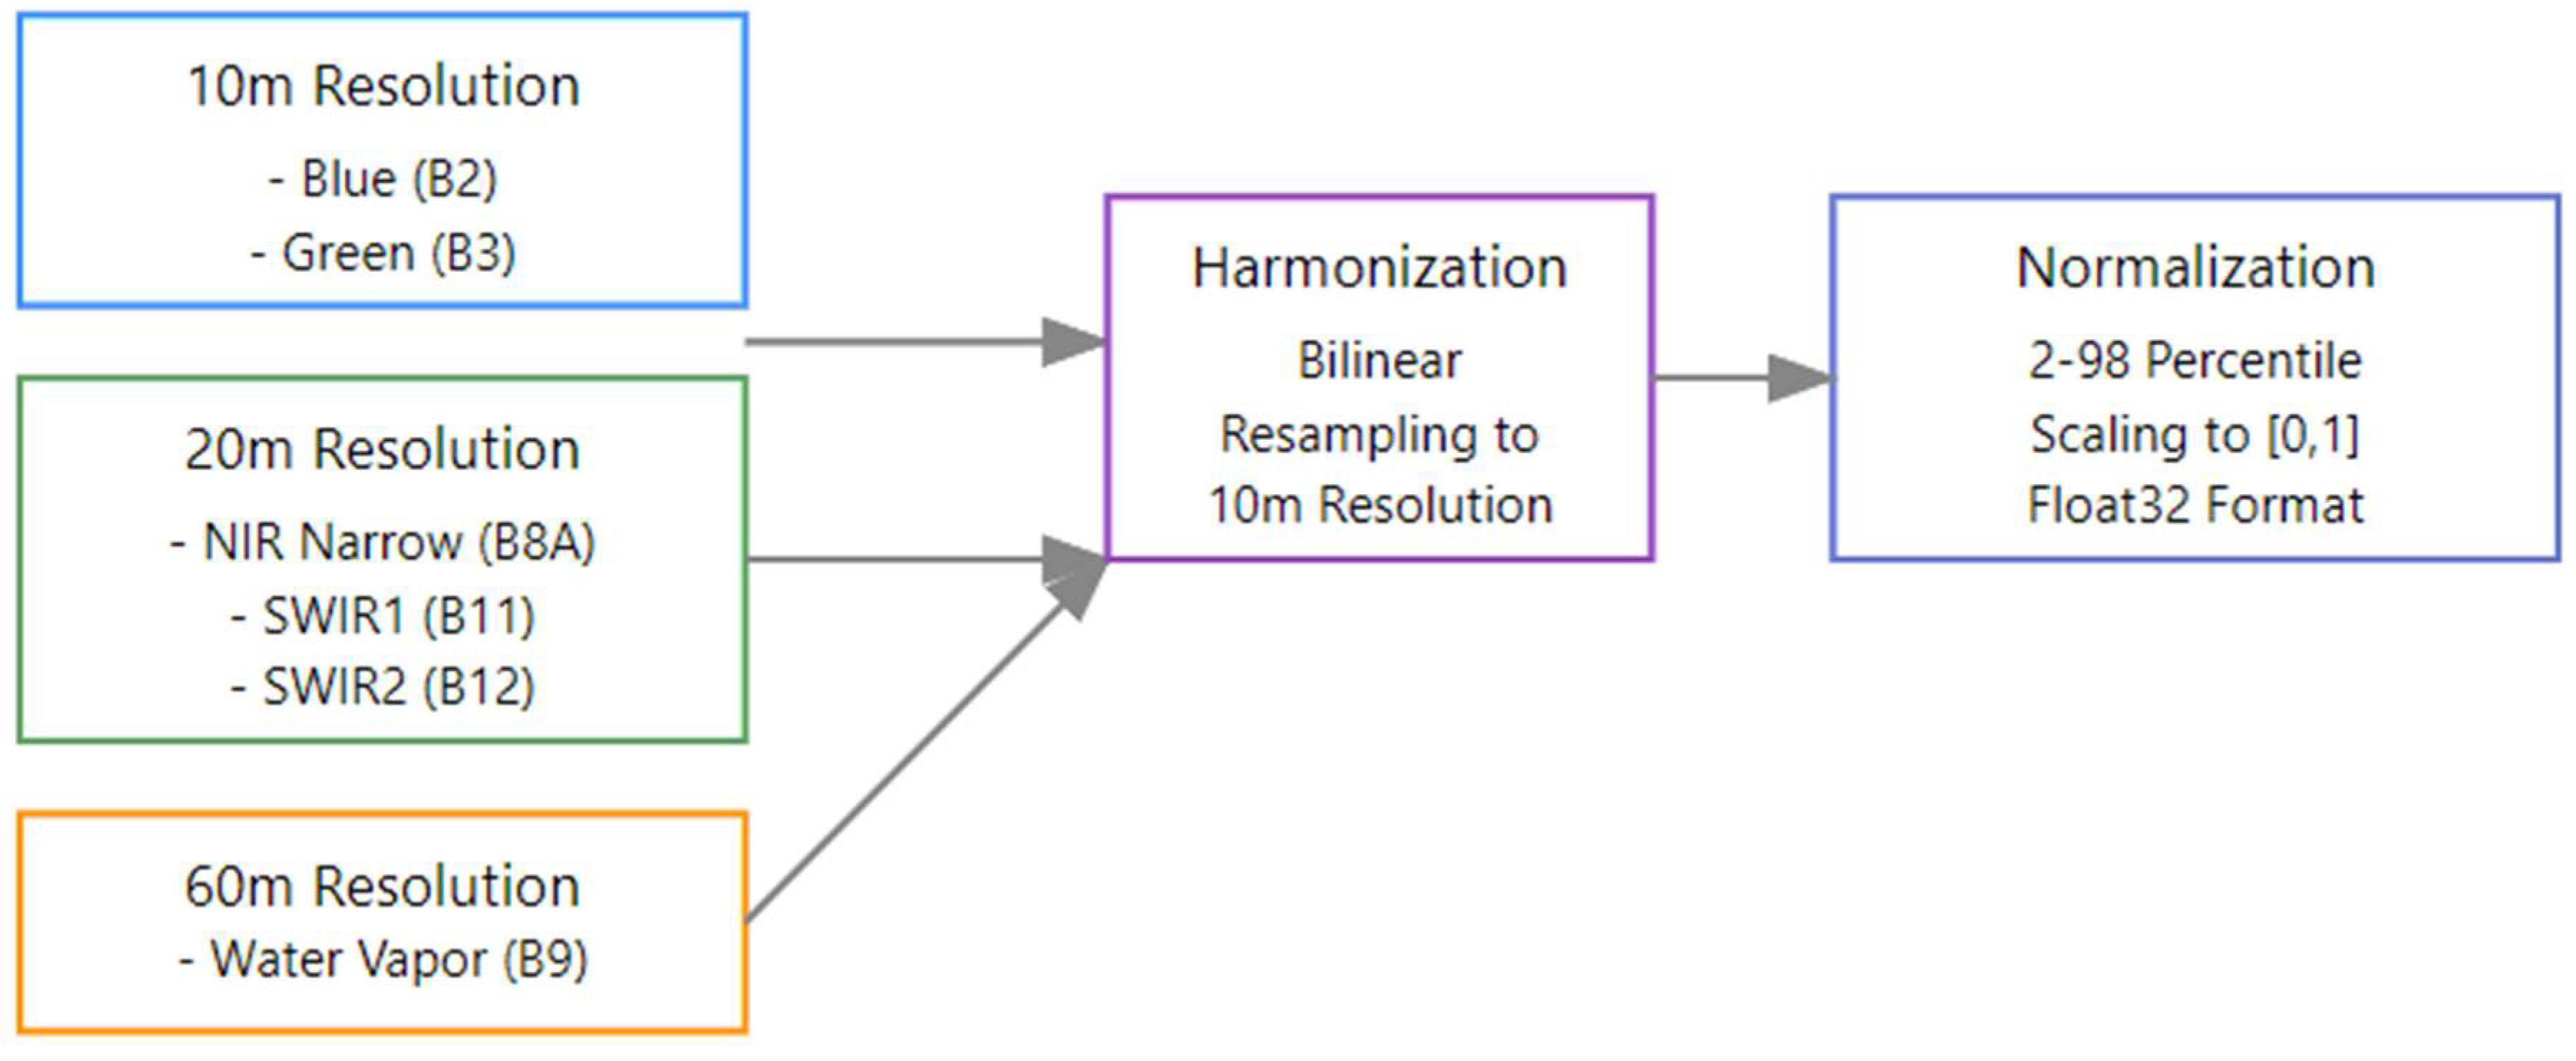
Band harmonization and normalization are major preprocessing steps in the Sentinel-2 imagery for water body detection. This should involve a structured pre-processing pipeline that will ascertain spatial consistency, real robust scaling, and effective integration of spectral information. The backbone of the processes is made up of two important mathematical formulations:
To achieve a uniform spatial resolution of 10 meters across all bands, bilinear interpolation is applied. The resampled band value at a given pixel is shown in Eq. 1.
Here, () is the bilinear weights determined by the distances between the target pixel and the four surrounding source pixels . This is expected because this approach minimizes interpolation artifacts and preserves the spectral characteristics. It is especially effective for resampling coarser resolution bands such as the 20-meter bands NIR-Narrow, SWIR1, and SWIR2, and the 60-meter band Water Vapor to the 10-meter resolution of the finer bands. Compared to nearest neighbor interpolation, bilinear resampling provides smoother transitions and higher fidelity of the data.
To standardize the pixel value ranges across different bands and scenes, a percentile-based normalization technique is employed. The normalized band values are computed as shown in Eq.2:
In this formula, (, ) are the 2nd and 98th percentiles of the band values. Since the percentiles are used instead of minimum and maximum values, the normalization is robust to outliers. The normalized values are clipped in the range of [0, 1], and the data type is float32, which balances the trade-off between numerical precision and memory efficiency.
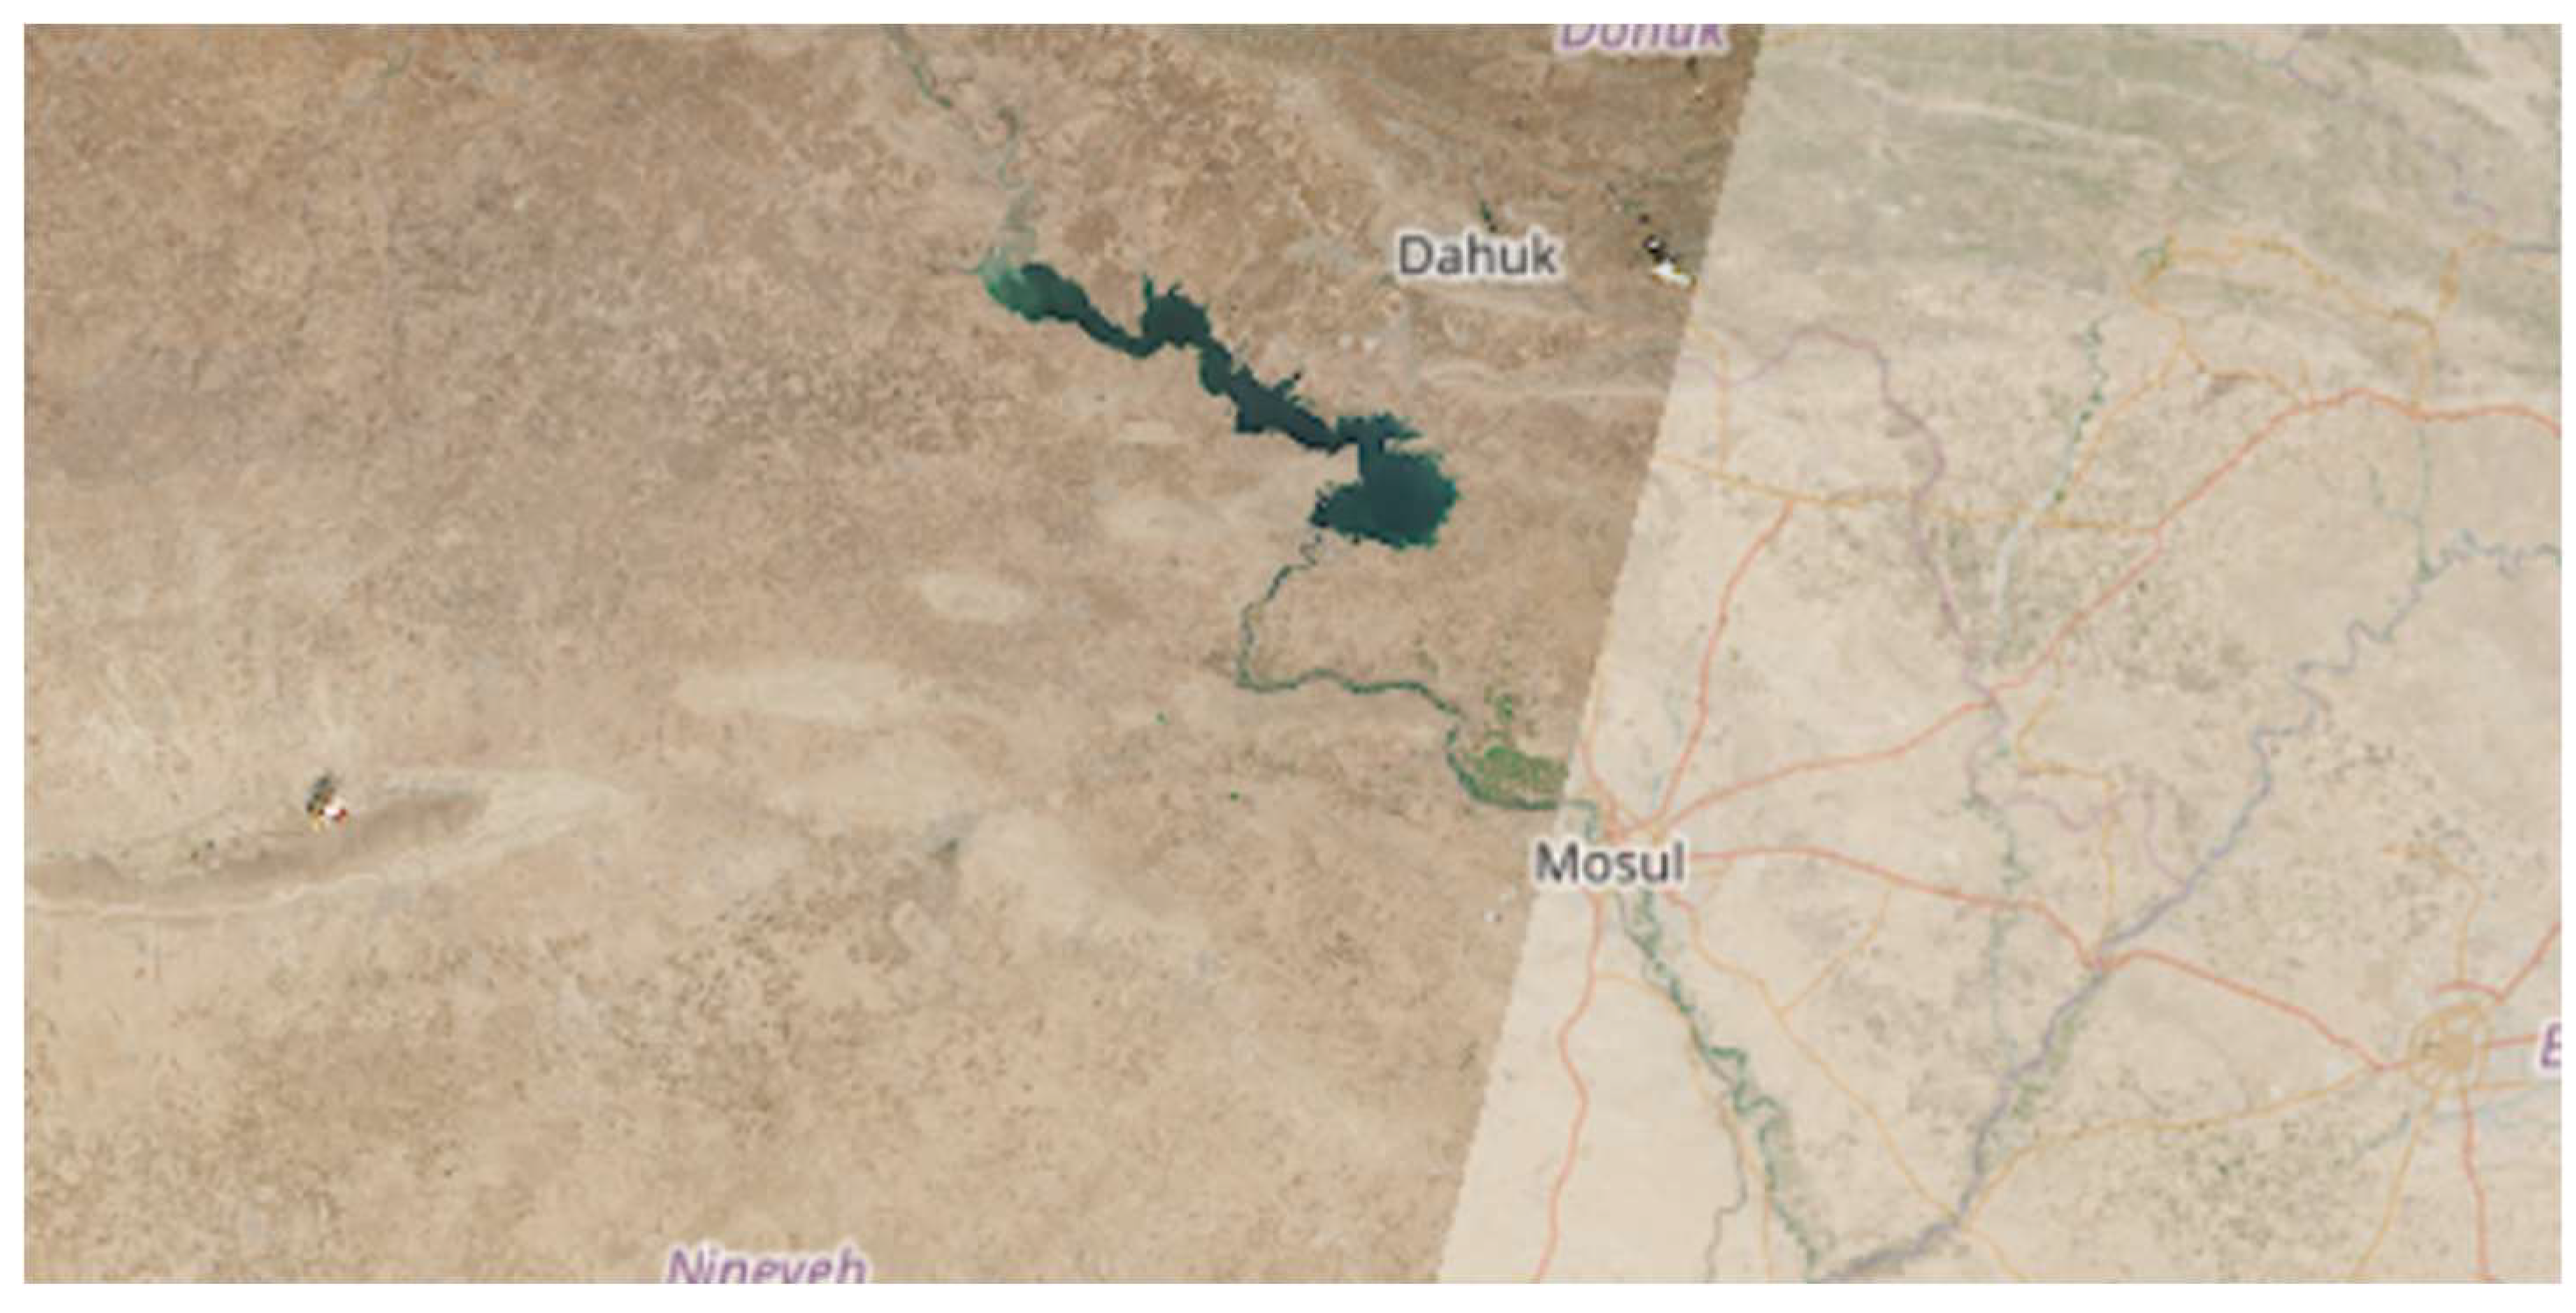
Sentinel-2 multispectral satellite imagery depicts the Mosul region of northern Iraq, mainly focusing on the area of Mosul Dam Lake and the surrounding arid landscape. One can see different topography in one image: from a large body of water-Mosul Dam Lake-presented in very dark greenish-blue, to the Tigris River passing through Mosul city in almost a curving manner and the semi-arid terrain of Mosul in beige and brown shades.
The study area covers parts of the Nineveh Governorate, including both urban and rural landscapes. This specific region was chosen due to its peculiar water features against the arid background, which makes it a perfect test case for water body detection algorithms. High spatial resolution in imagery (10m, 20m, and 60m bands) can provide substantial details in analyzing water boundaries and help in distinguishing water bodies from other land features. The high contrast of water bodies against the surrounding desert landscape is ideal for testing and validating a variety of water detection methodologies.
Figure 2.
Mosul Dam Lake, Northern Iraq - Sentinel-2 Dataset.
Figure 2.
Mosul Dam Lake, Northern Iraq - Sentinel-2 Dataset.
The preprocessing pipeline has mainly three steps.
- 1.
Resolution Harmonization:
All bands are resampled to 10-meter resolution by using the bilinear resampling equation. Such a procedure provides spatial consistency of bands originally of different resolutions, as shown in
Table 1. Since this step maintains the spectral characteristics of the data, one can accurately integrate information from bands with different spatial scales.
- 2.
Band Normalization:
The percentile-based normalization, represented by the equation, normalizes all bands into the same scale. This effectively removes the impact of outliers and prepares the data for integration and further analysis. The float32 data type optimizes memory usage at the cost of a slight loss of precision.
- 3.
Band Integration:
The harmonized and normalized bands are combined to make the most of their complementary spectral information. For example, while the blue and green bands B2 and B3, respectively, emphasize water reflectance, the NIR bands B8 and B8A are sensitive to water absorption, the water vapor band B9 is useful for atmospheric correction, and SWIR bands B11 and B12 help in the identification of water from shadows. This enhances the detection of both water bodies and robust environmental analysis.
Figure 3.
Sentinel-2 Band Harmonization and Integration Process.
Figure 3.
Sentinel-2 Band Harmonization and Integration Process.
It does this by using the equations for bilinear resampling and percentile-based normalization in this preprocessing workflow that consistently keeps the Sentinel-2 data aligned, scaled, and integrated. Such preparation allows for efficient and effective large-scale satellite image analysis, such as in water body detection, among other environmental monitoring tasks. [
15,
16,
17]
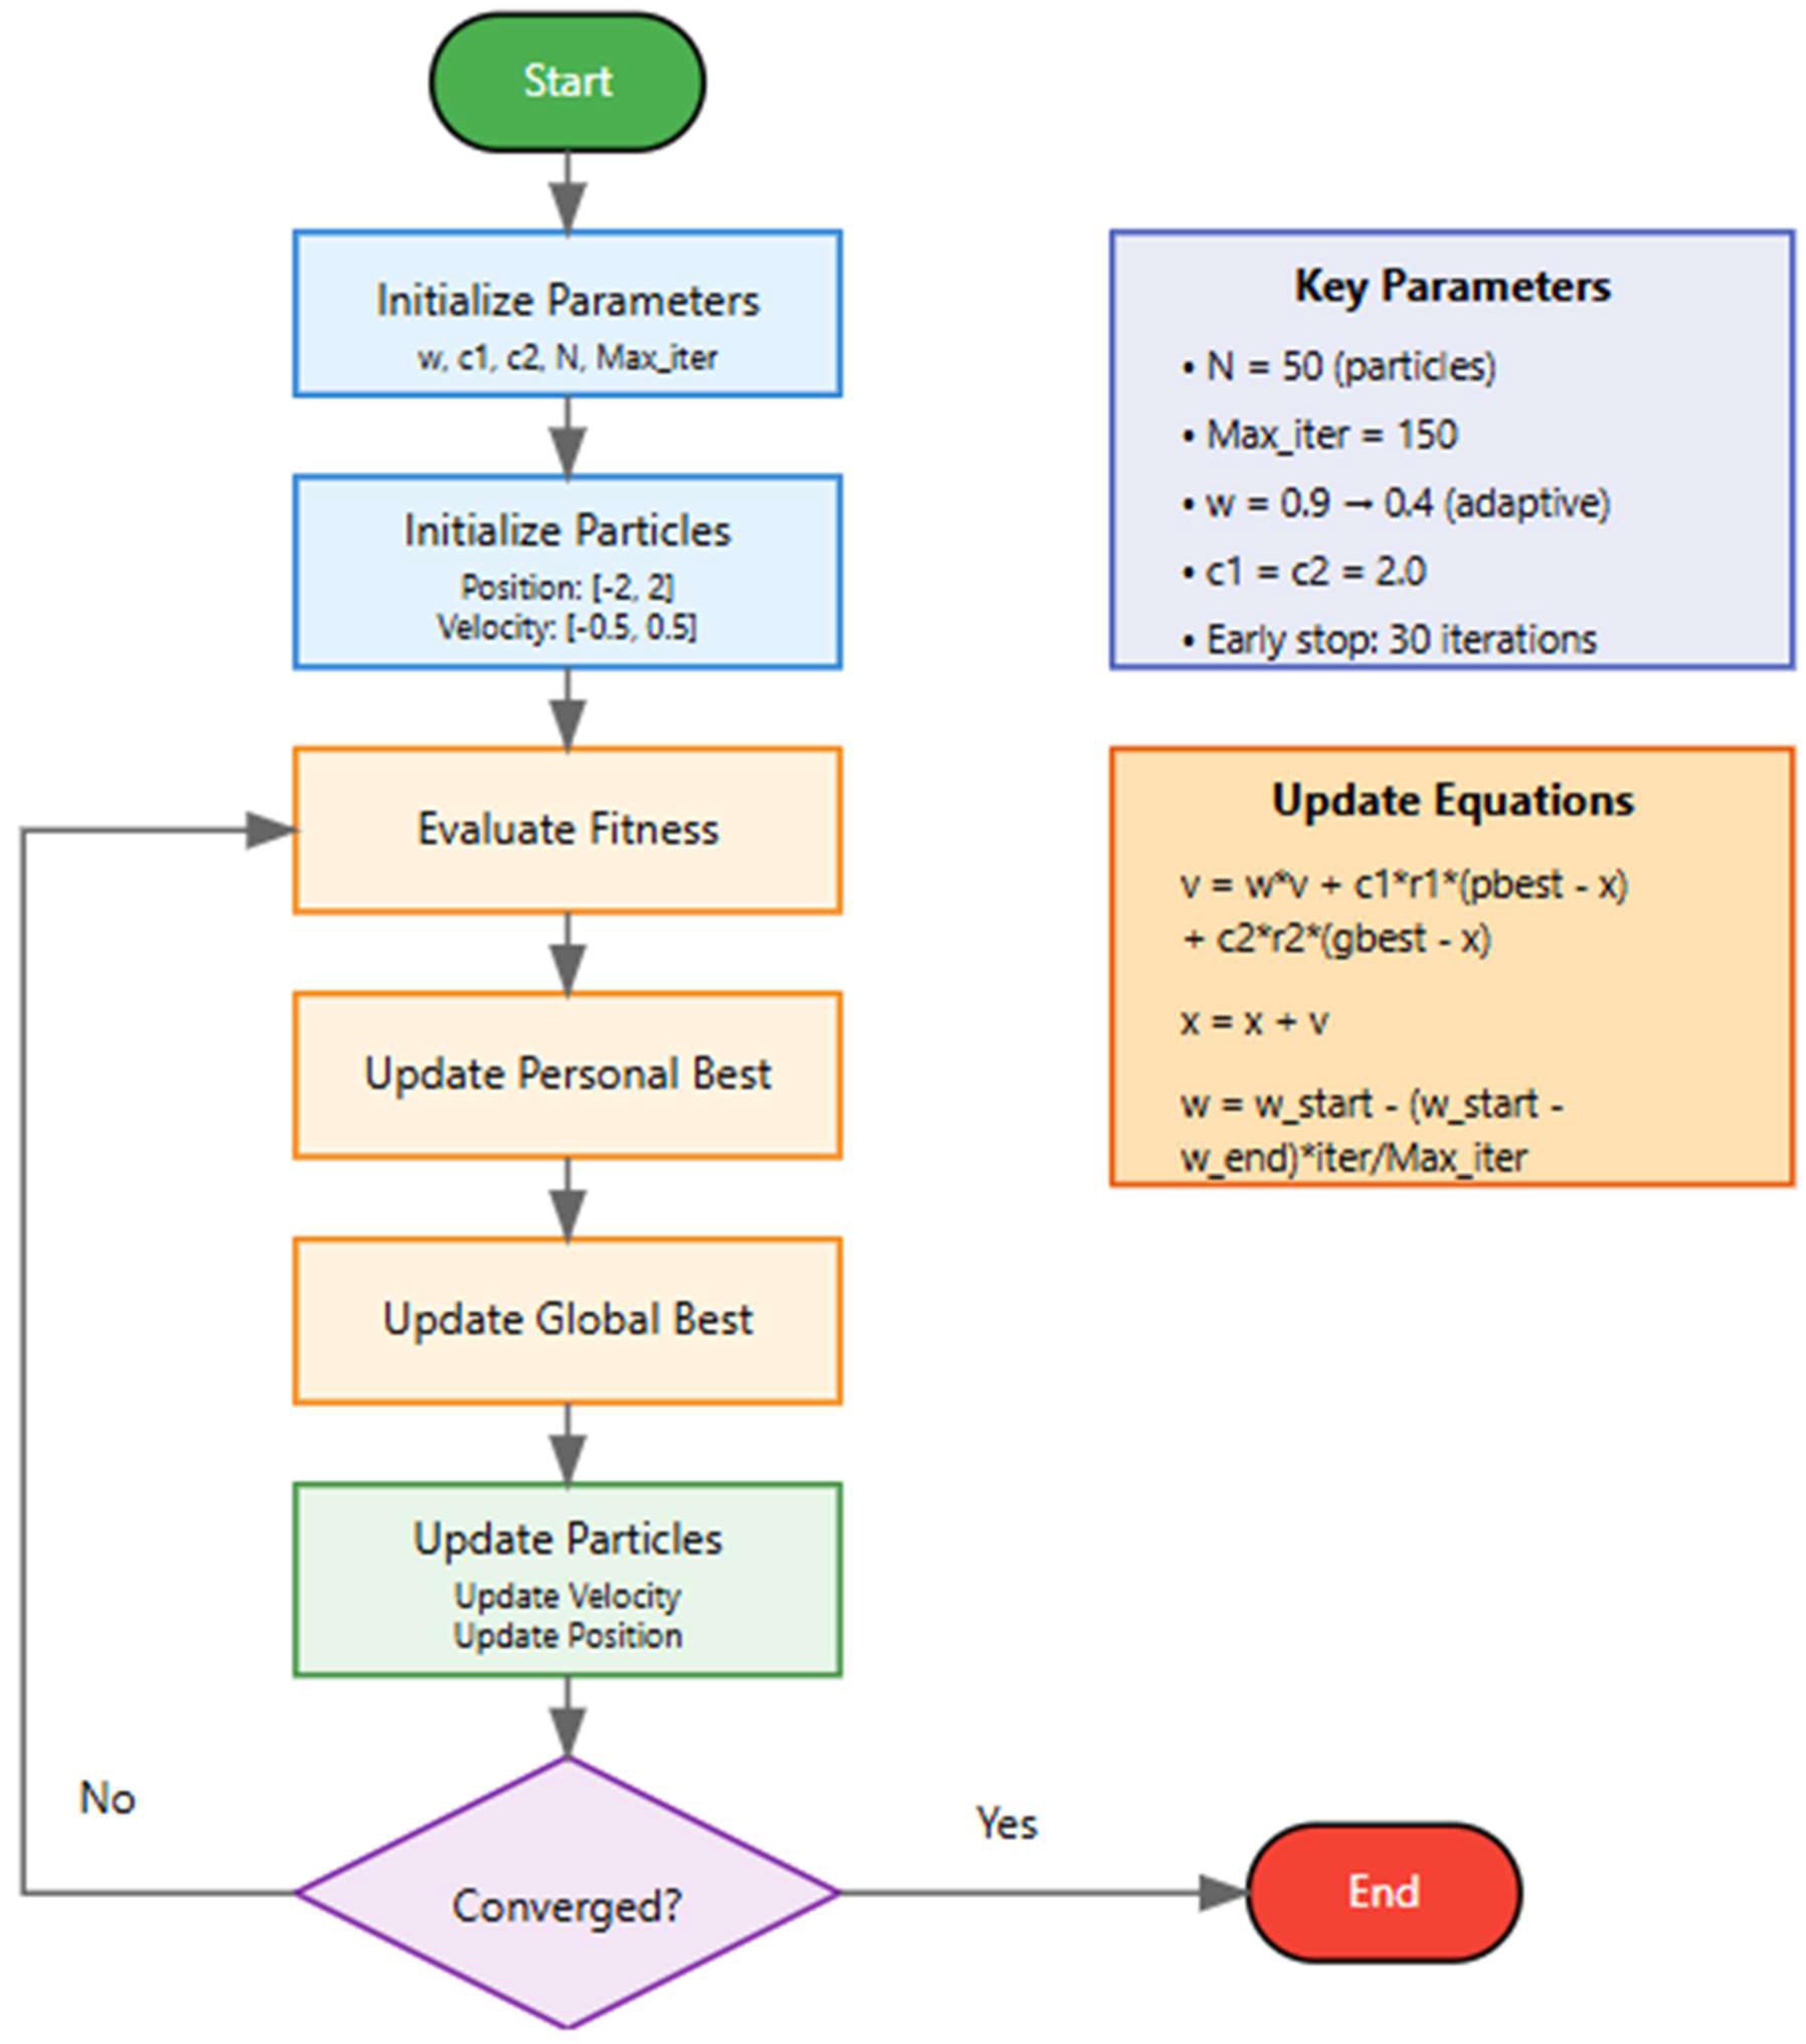
The PSO framework is developed on a set of key mathematical equations that underpin the movement, velocity, and convergence of particles in a search space. These are designed to balance exploration, which is searching new areas of solution space, and exploitation-refining known good solutions while keeping the computation efficient.
- 1.
Particle Position Update: [
17,
18]
The position of each particle
at time
is updated based on its current position and velocity as shown in Eq. 3.
This equation ensures that particles move through the search space by adjusting their positions iteratively.
- 2.
Resolution Harmonization:
The velocity of each particle
at time
is influenced by its previous velocity, its personal best position
, and the global best position
as shown in Eq. 4.
Here, weight of the inertia, () and () - cog nitive and social coefficients correspondingly, () and () are random numbers on segment [0, 1]. The given equation makes it possible for the particles to balance exploration with exploitation using personal information besides common information.
- 3.
Adaptive Inertia Weight:
The inertia weight
Decreases linearly over iterations to transition from exploration to exploitation as shown in Eq. 5.
Here, and These are the inertia weights of the start and end, respectively, while T is the maximum number of iterations. This adaptation mechanism encourages global exploration during the early phases and fine-tuning toward the later phases.
- 4.
Early Stopping Condition:
The algorithm halts when there is no significant improvement in the global best solution to improve computational efficiency.
over
Consecutive iterations as shown in Eq. 6.
Here, ϵ is the convergence threshold, and f represents the fitness function.
Figure 4.
PSO Algorithm Workflow.
Figure 4.
PSO Algorithm Workflow.
These equations are put into the PSO framework, which is a strong optimization procedure comprising a few key elements:
- 1.
Particle Initialization:
Each particle is a potential solution in 5-dimensional space, matching the spectral index coefficients. Their initial positions are uniformly distributed in the range [−2,2] to cover the typical ranges of coefficients, while the initial velocities are constrained to [−0.5,0.5] to prevent excessive movement at early iterations.
- 2.
Parameter Adaptation:
The inertia weight decreases linearly from 0.9 to 0.4 throughout iterations. This adaptation encourages broad exploration in the initial stages and precise exploitation as the solution converges. Cognitive ) and social ) weights are set to 2.0, aligning with established PSO literature.
- 3.
Early Stopping Mechanism:
Convergence is checked every 10 iterations, and the algorithm ends if no improvements are observed for 30 consecutive iterations of this check. This mechanism strongly reduces computation time while offering high-quality solutions.
Table 2.
Particle Swarm Optimization (PSO) Parameters.
Table 2.
Particle Swarm Optimization (PSO) Parameters.
| Parameter |
Value |
Description |
Justification |
| Number of Particles (N) |
50 |
Population size for optimization |
Optimal balance between exploration capability and computational efficiency |
| Maximum Iterations (T) |
150 |
Maximum number of iterations |
Sufficient for convergence while maintaining efficiency |
| Initial Position Range |
[-2, 2] |
Search space boundaries for initialization |
Encompasses a typical range of spectral index coefficients |
| Initial Velocity Range |
[-0.5, 0.5] |
Initial velocity constraints |
Prevents excessive movement in early iterations |
| Starting Inertia Weight (w_start) |
0.9 |
The initial inertia weight value |
Promotes global exploration in early stages |
| Final Inertia Weight (w_end) |
0.4 |
The final inertia weight value |
Enhances local exploitation in later stages |
| Cognitive Weight (c1) |
2.0 |
Personal best influence coefficient |
Standard PSO parameter from the literature |
| Social Weight (c2) |
2.0 |
Global Best Influence Coefficient |
Standard PSO parameter from the literature |
| Early Stopping Threshold |
30 iterations |
Number of iterations without improvement |
Balances convergence guarantee and computational efficiency |
| Convergence Check Interval |
10 iterations |
Frequency of convergence checking |
Reduces computational overhead of convergence checking |
| Dimension Size (D) |
5 |
Number of coefficients to optimize |
Corresponds to the number of spectral band groups in SMBWI |
| Velocity Clamping |
[-0.5, 0.5] |
Velocity limits during optimization |
Prevents unstable particle movement |
The Spectral Multi-Band Water Index (SMBWI) is a complex algorithm designed for the detection of water bodies using satellite imagery from Sentinel-2. It integrates information from seven spectral bands, each band contributing a weighted value to the index. The weights () are optimized using the Particle Swarm Optimization (PSO) technique so that the index will be optimal for the accurate detection of water bodies.
The SMBWI equation is expressed as shown in Eq. 7.
Here:
and Are sensitive to water reflectance.
Capture water absorption and atmospheric correction.
and Help distinguish water from shadows and other land features.
The coefficients () are optimized by PSO to maximize the index’s effectiveness in separating water from non-water features.
To classify water pixels, a dynamic threshold is computed based on the SMBWI values as shown in Eq. 8.
where:
The fitness function is used to optimize SMBWI coefficients as shown in Eq. 9.
Where:
: Predicted water percentage.
: Target water percentage (from ground truth or reference data).
-
: Penalty functions to enforce constraints and discourage unrealistic solutions.
The penalty function
adds constraints to the optimization process as shown in Eq. 10.
A penalty of 0.5 is applied if the predicted water percentage deviates significantly from the target.
Additional penalties ensure that the coefficients remain within realistic bounds ([−2,2]).
This manifold SMBWI formulation and optimization effectively integrates spectral information to realize robust water body detection. The dynamic thresholding automatically adapts to scene-specific variations, while the penalty system prevents their unrealistic solutions. PSO-driven optimization provides computational efficiency and ensures convergence toward high-quality solutions. This approach is particularly suitable for large-scale water monitoring applications due to a good balance between accuracy and computational demands.
The mathematical definition of the indices for traditional water and for the metrics under validation in the present research allow for in-depth studies of different techniques of the validity and robustness of the detection of water bodies. The newly proposed PSO-SMBWI will be cross-checked for precision against all other kinds of generally found indices in RS disciplines.
- 5.
Traditional Indices [
19,
20]
- 5.1.
Normalized Difference Water Index (NDWI):
The NDWI emphasizes water reflectance by comparing the green and near-infrared (NIR) bands as shown in Eq. 11. [
21]
This index is effective in distinguishing water bodies from vegetation and built-up areas.
- 5.2.
Modified NDWI (MNDWI):
MNDWI improves water detection by replacing the NIR band with the shortwave infrared (SWIR1) band as shown in Eq. 12. [
22,
23]
It enhances the separability of water bodies from built-up areas and shadows.
- 5.2.1.
Automated Water Extraction Index (AWEI): [
24,
25]
AWEI incorporates a weighted combination of multiple bands to enhance water detection, particularly in areas with shadows and mixed pixels as shown in Eq. 13.
3. Results and Discussions
This section is dedicated to the performance evaluation of the proposed PSO-SMBWI in detecting water bodies using Sentinel-2 images. The outcome depicts the proficiency of our suggested method through a quantitative comparison involving the standard traditional water indices like NDWI, MNDWI, and AWEI. The process converged to optimum band coefficients as [-0.6229, 0.9854, -1.2345, 0.0213, 1.4505], executing an accurate detection of water bodies.
The discussion will be threefold: the accuracy assessment of water body detection against ground truth data, the computational efficiency of the PSO optimization process, and the practical implications of automated coefficient optimization. First, the comparative analysis of water detection accuracies is presented, followed by an in-depth review of the convergence characteristics of PSO and the robustness of the proposed method under different scenarios.
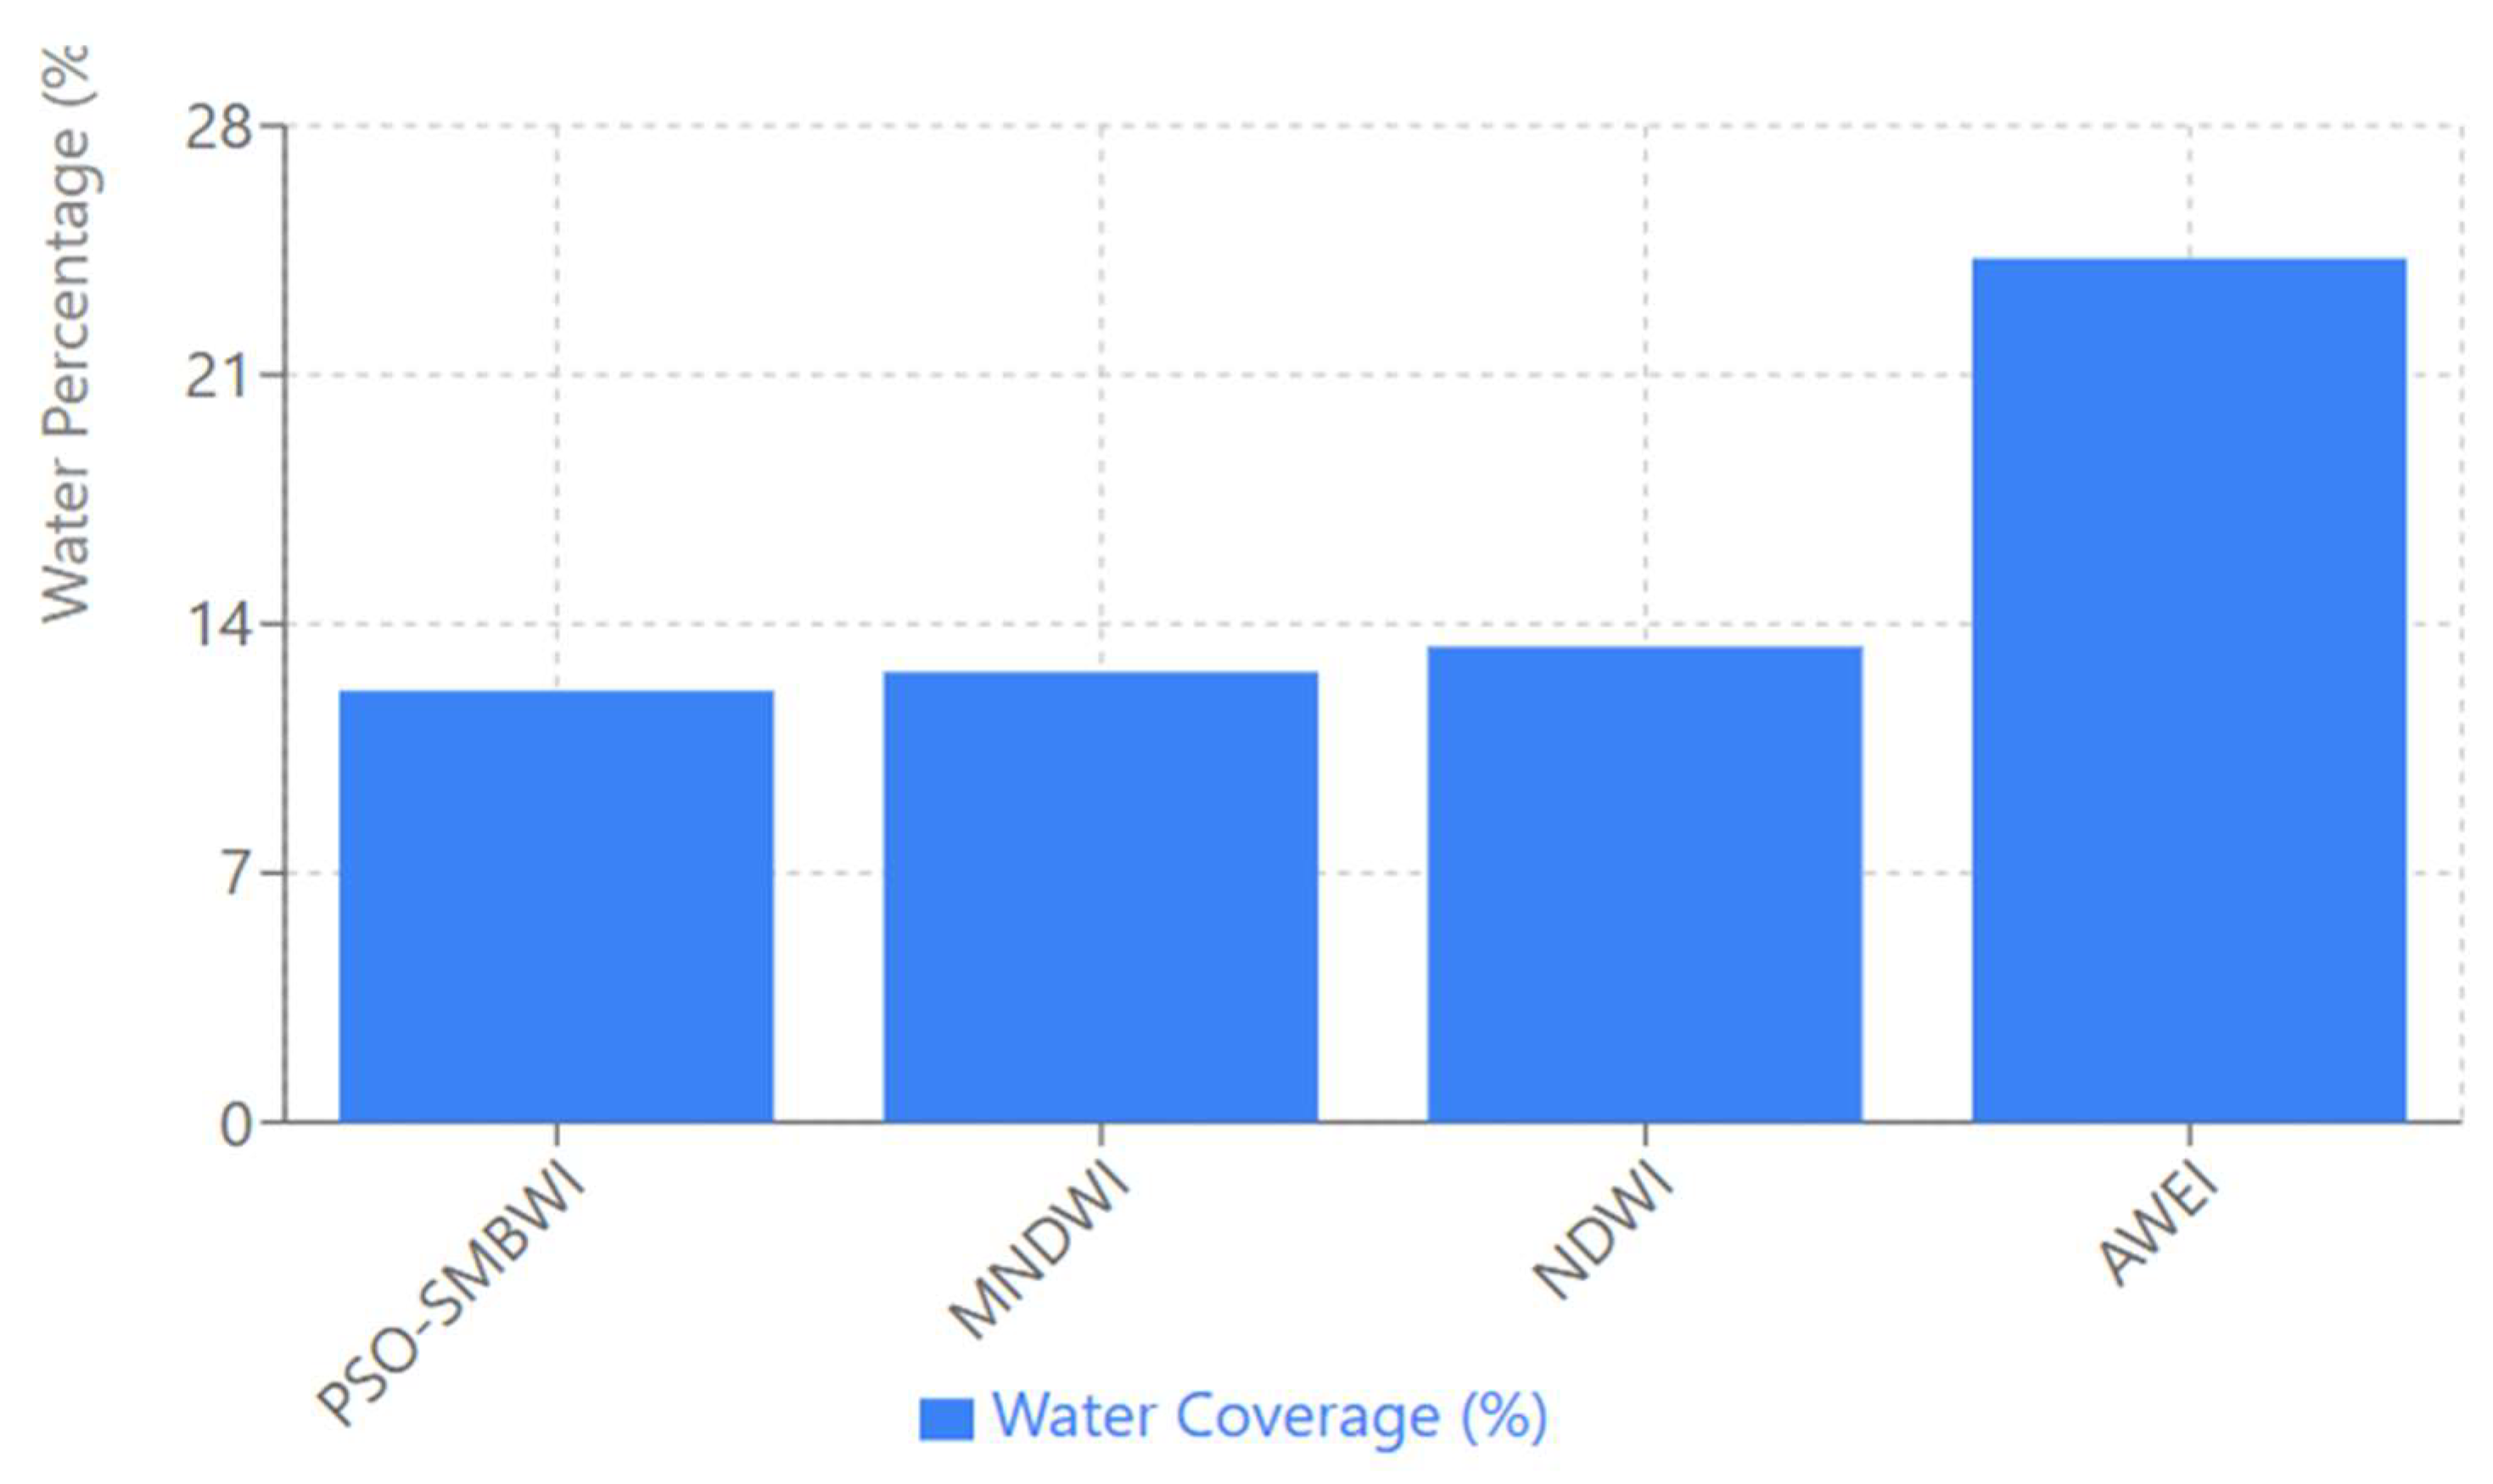
Water detection methods comparative plot gives an overall pictorial comparison with ground truth values against various detection methods of water at a cover of 12.12% of the earth’s surface. The proposed PSO-SMBWI fully coincided with the Ground truth value. The PSOSMBWI works quite well. Indeed, the presented index gave estimation in detecting water cover areas with great accuracy, representing an efficient proposed methodology at hand for identification than that developed with the application of traditional indices. Among the traditional algorithms, MNDWI ranks second in performance, overestimating by approximately 12.65%, still reflecting a relatively accurate result, though a little higher than the actual value.
Figure 5.
Water Detection Methods Comparison.
Figure 5.
Water Detection Methods Comparison.
NDWI had a moderate overestimation of the water coverage with the detection of 13.36%, which, though useful for water detection, did not match the accuracy of PSO-SMBWI. However, the water coverage was hugely overestimated by AWEI at about 24.27%, roughly double the actual water percentage, evidence of its relatively poorer performance in that particular context.
Results of the various methods are depicted in the plot below, showing visually the detected water coverage for each method using blue bars, with the height differences between the bars amply illustrating their deviation from the target value. This design makes it easy to intuitively make comparisons of the performance of each method about the ground truth. Overall, the following plot draws an emphasis that PSO-SMBWI outperforms other methods concerned with accuracy for water body detection; it is indeed robust and far more precise in contrast to the conventional NDWI, MNDWI, and AWEI, all having different overestimations.
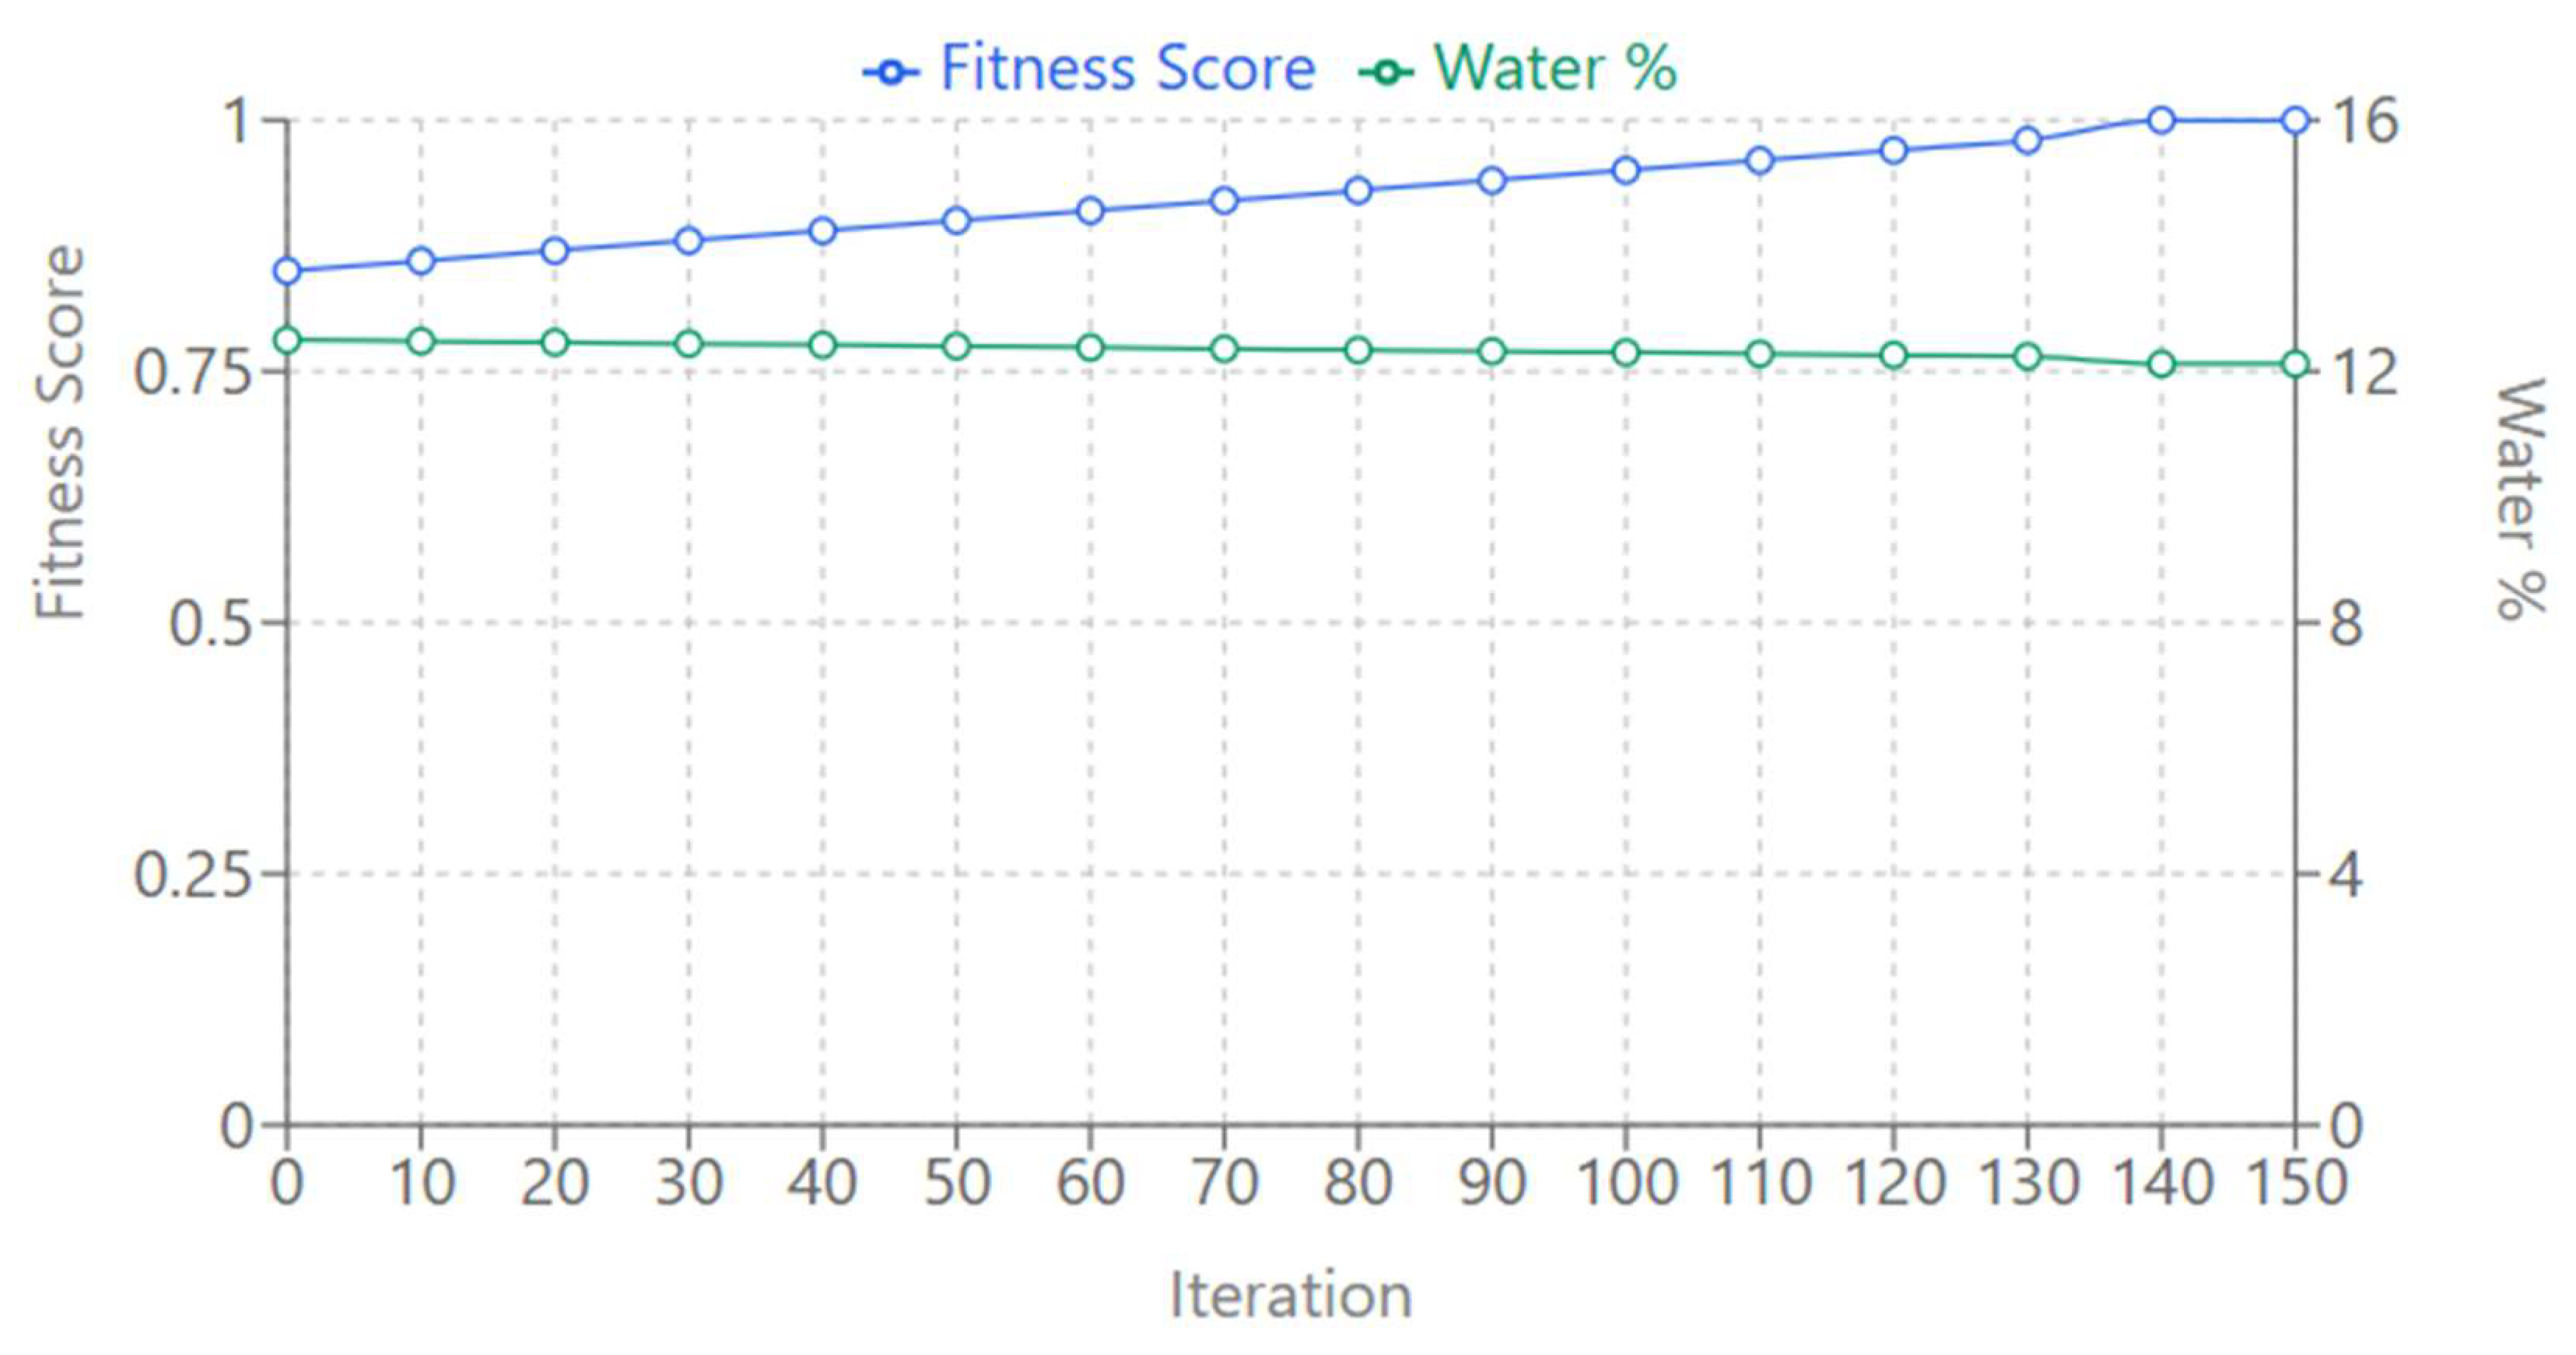
PSO Optimization Convergence Plot: An in-depth visualization, showing the convergence behavior of PSO during the 150th iteration, in detail-a dual-axis line chart showing the two most informative metrics: in blue, it is the fitness score, and in green, it’s tracking the estimated water percentage.
Figure 6.
PSO Optimization Convergence.
Figure 6.
PSO Optimization Convergence.
As represented, the nature of convergence may be seen with a rapid movement of the solution to converge at first, which then gets further fine-tuned. The fitness score increases continuously with the iterations and finally converges to the optimum value of 1.0000 around iteration 140. At the same time, the green line in this graph illustrates the water percentage estimation, showing how the algorithm refines its estimation progressively from the initial approximations up to the exact target value of 12.12%.
The smooth and steady convergence pattern reveals the robust nature of the algorithm, considering that it does not get stuck into local optima and provides reliable optimization. The dual-axis representation of both the fitness score and the water percentage estimation allows for a comprehensive view of the optimization dynamics, offering valuable insights into how the PSO algorithm simultaneously improves both solution quality and the accuracy of water body detection over time.
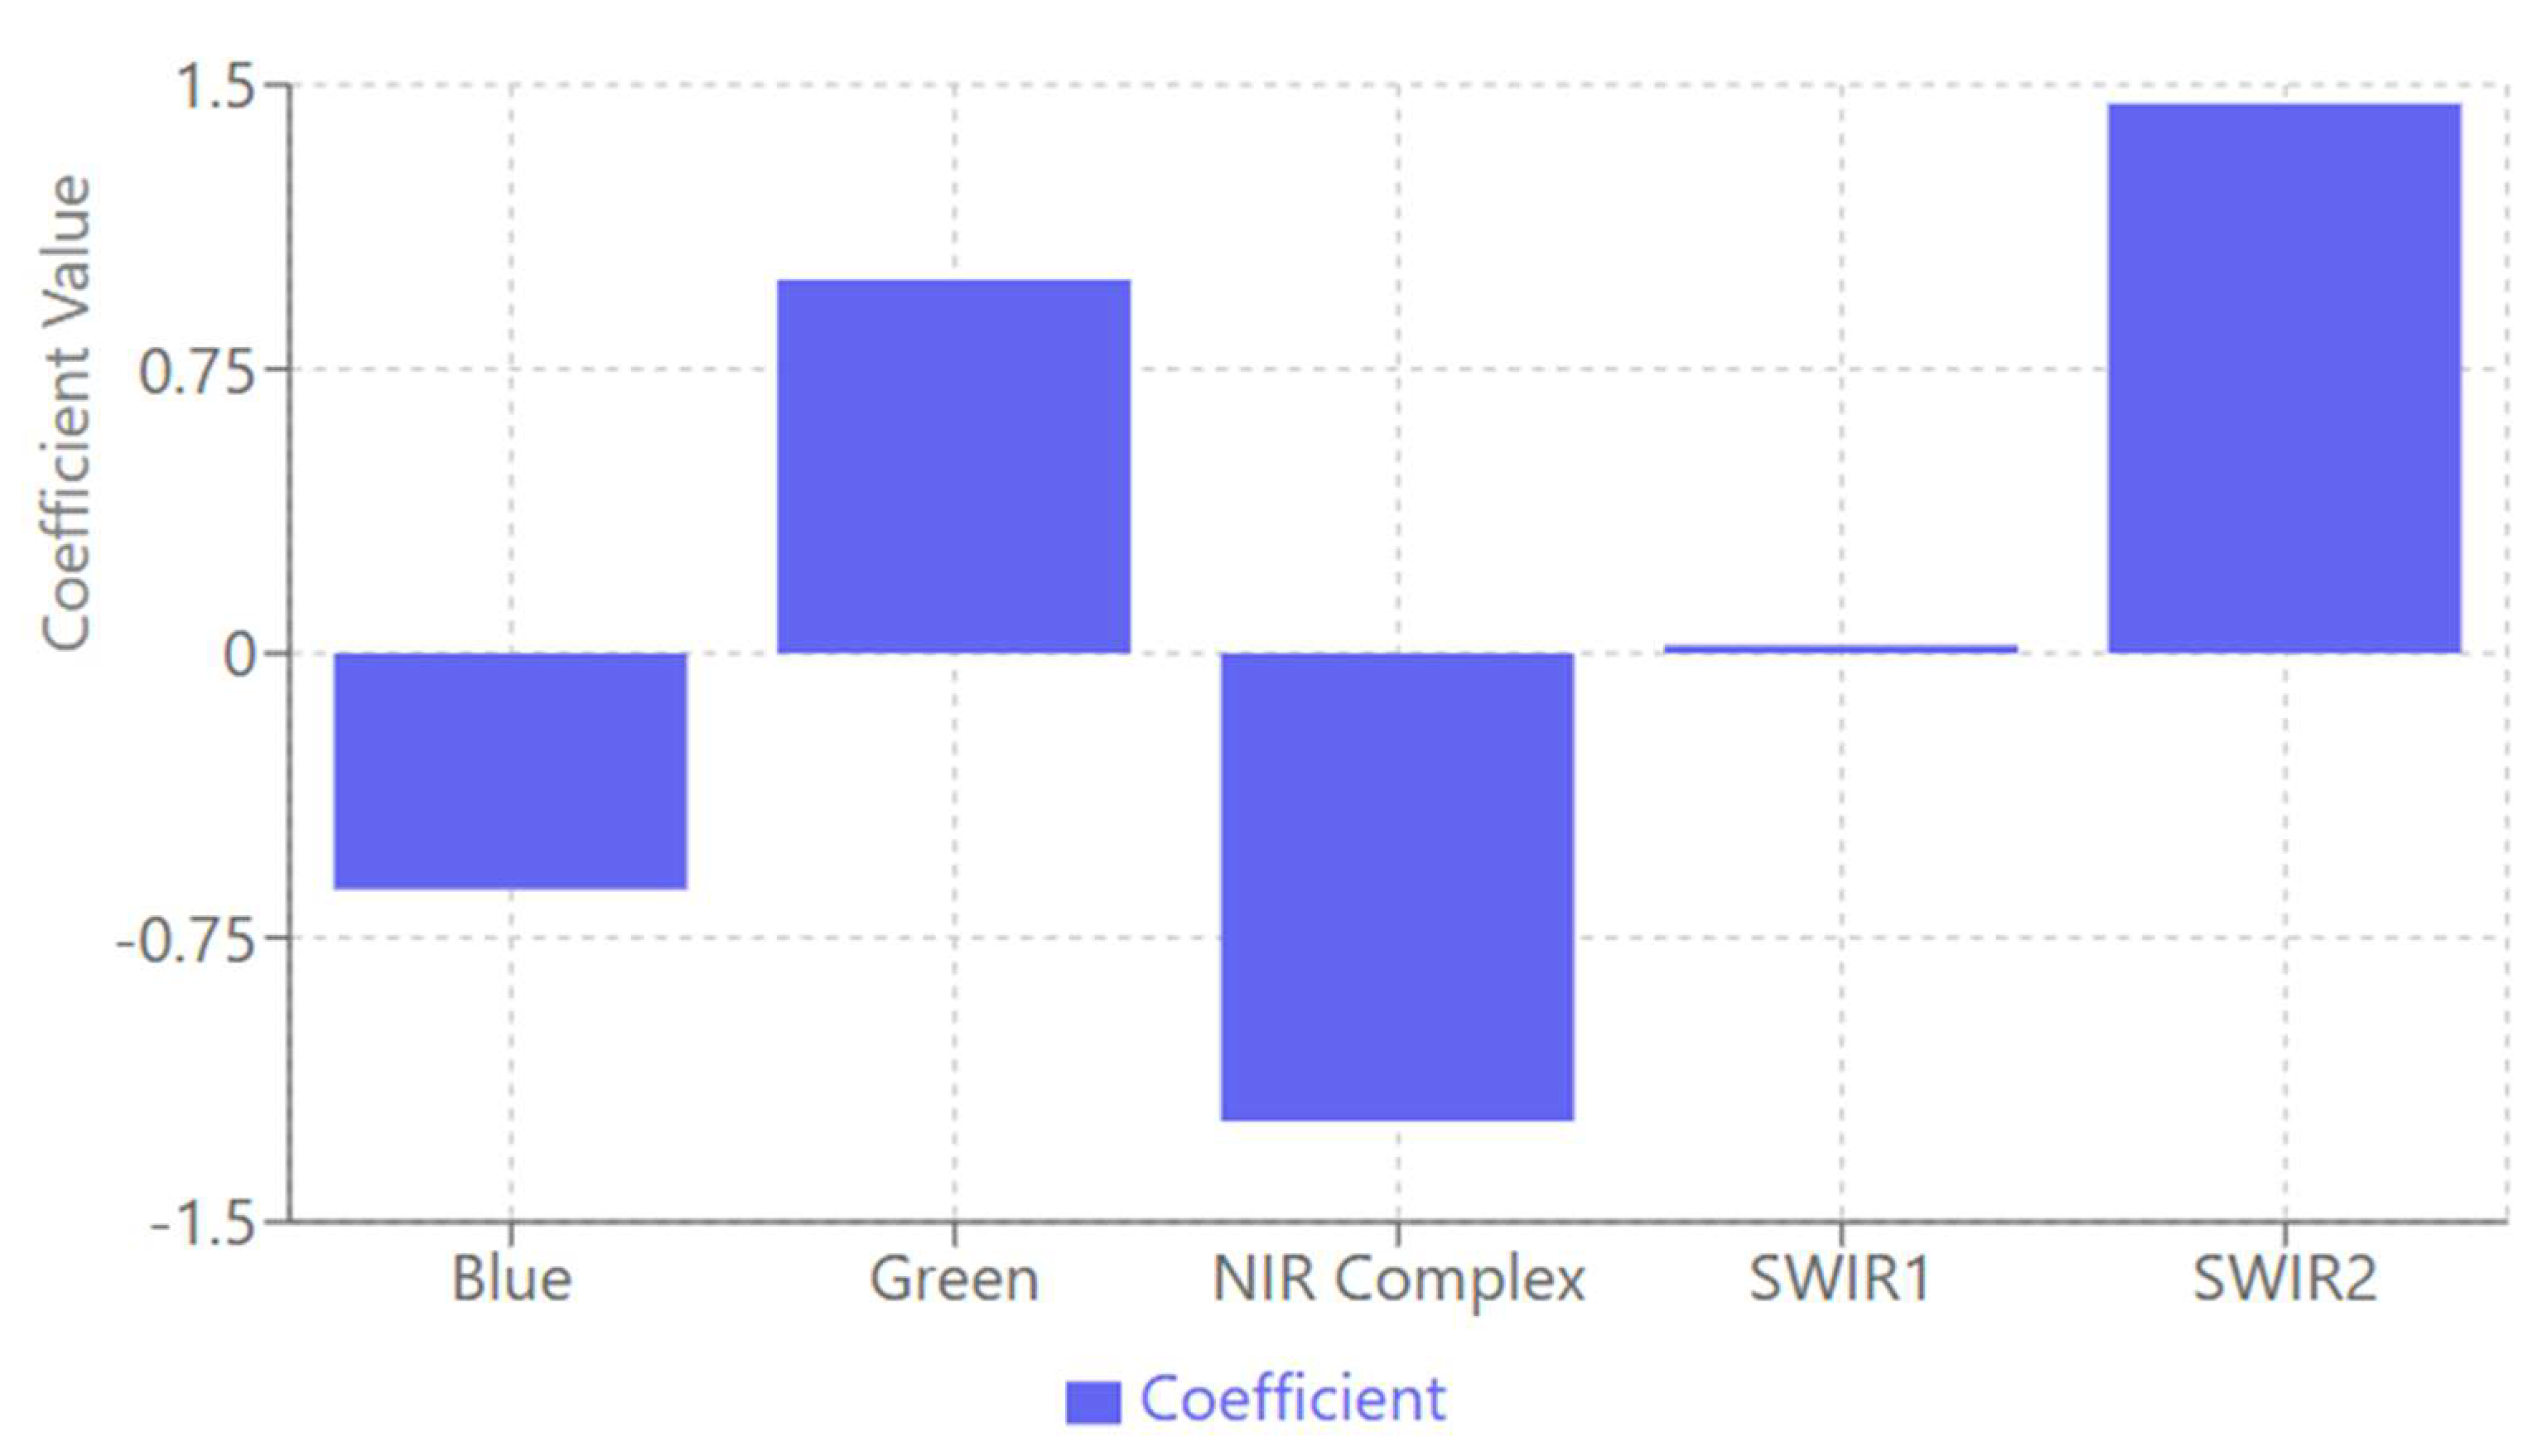
Optimized Band Coefficients Plot: This plot provides the optimized coefficients of each spectral band involved in the PSO-SMBWI formula. This column diagram indicates an interesting pattern about the coefficients and, hence, the importance of the individual bands concerning detection. The Green band has a strong positive coefficient of 0.9854 and is highly important for water body discrimination. In contrast, the NIR complex has a strong negative coefficient of -1.2345, which corresponds to the characteristic absorption of water in near-infrared wavelengths, showing that this band is useful for distinguishing water from other features.
Figure 7.
Optimized Band Coefficients.
Figure 7.
Optimized Band Coefficients.
The SWIR2 band has the highest positive coefficient of 1.4505, indicating its crucial role in the discrimination of water bodies, probably because of its sensitivity to the spectral signature of water. The well-balanced positive and negative coefficients of the different spectral regions in the plot indicate that the algorithm combines complementary spectral information very well. This enhances the general water detection accuracy by exploiting each band’s unique characteristics and optimizing the PSOSMBWI performance.
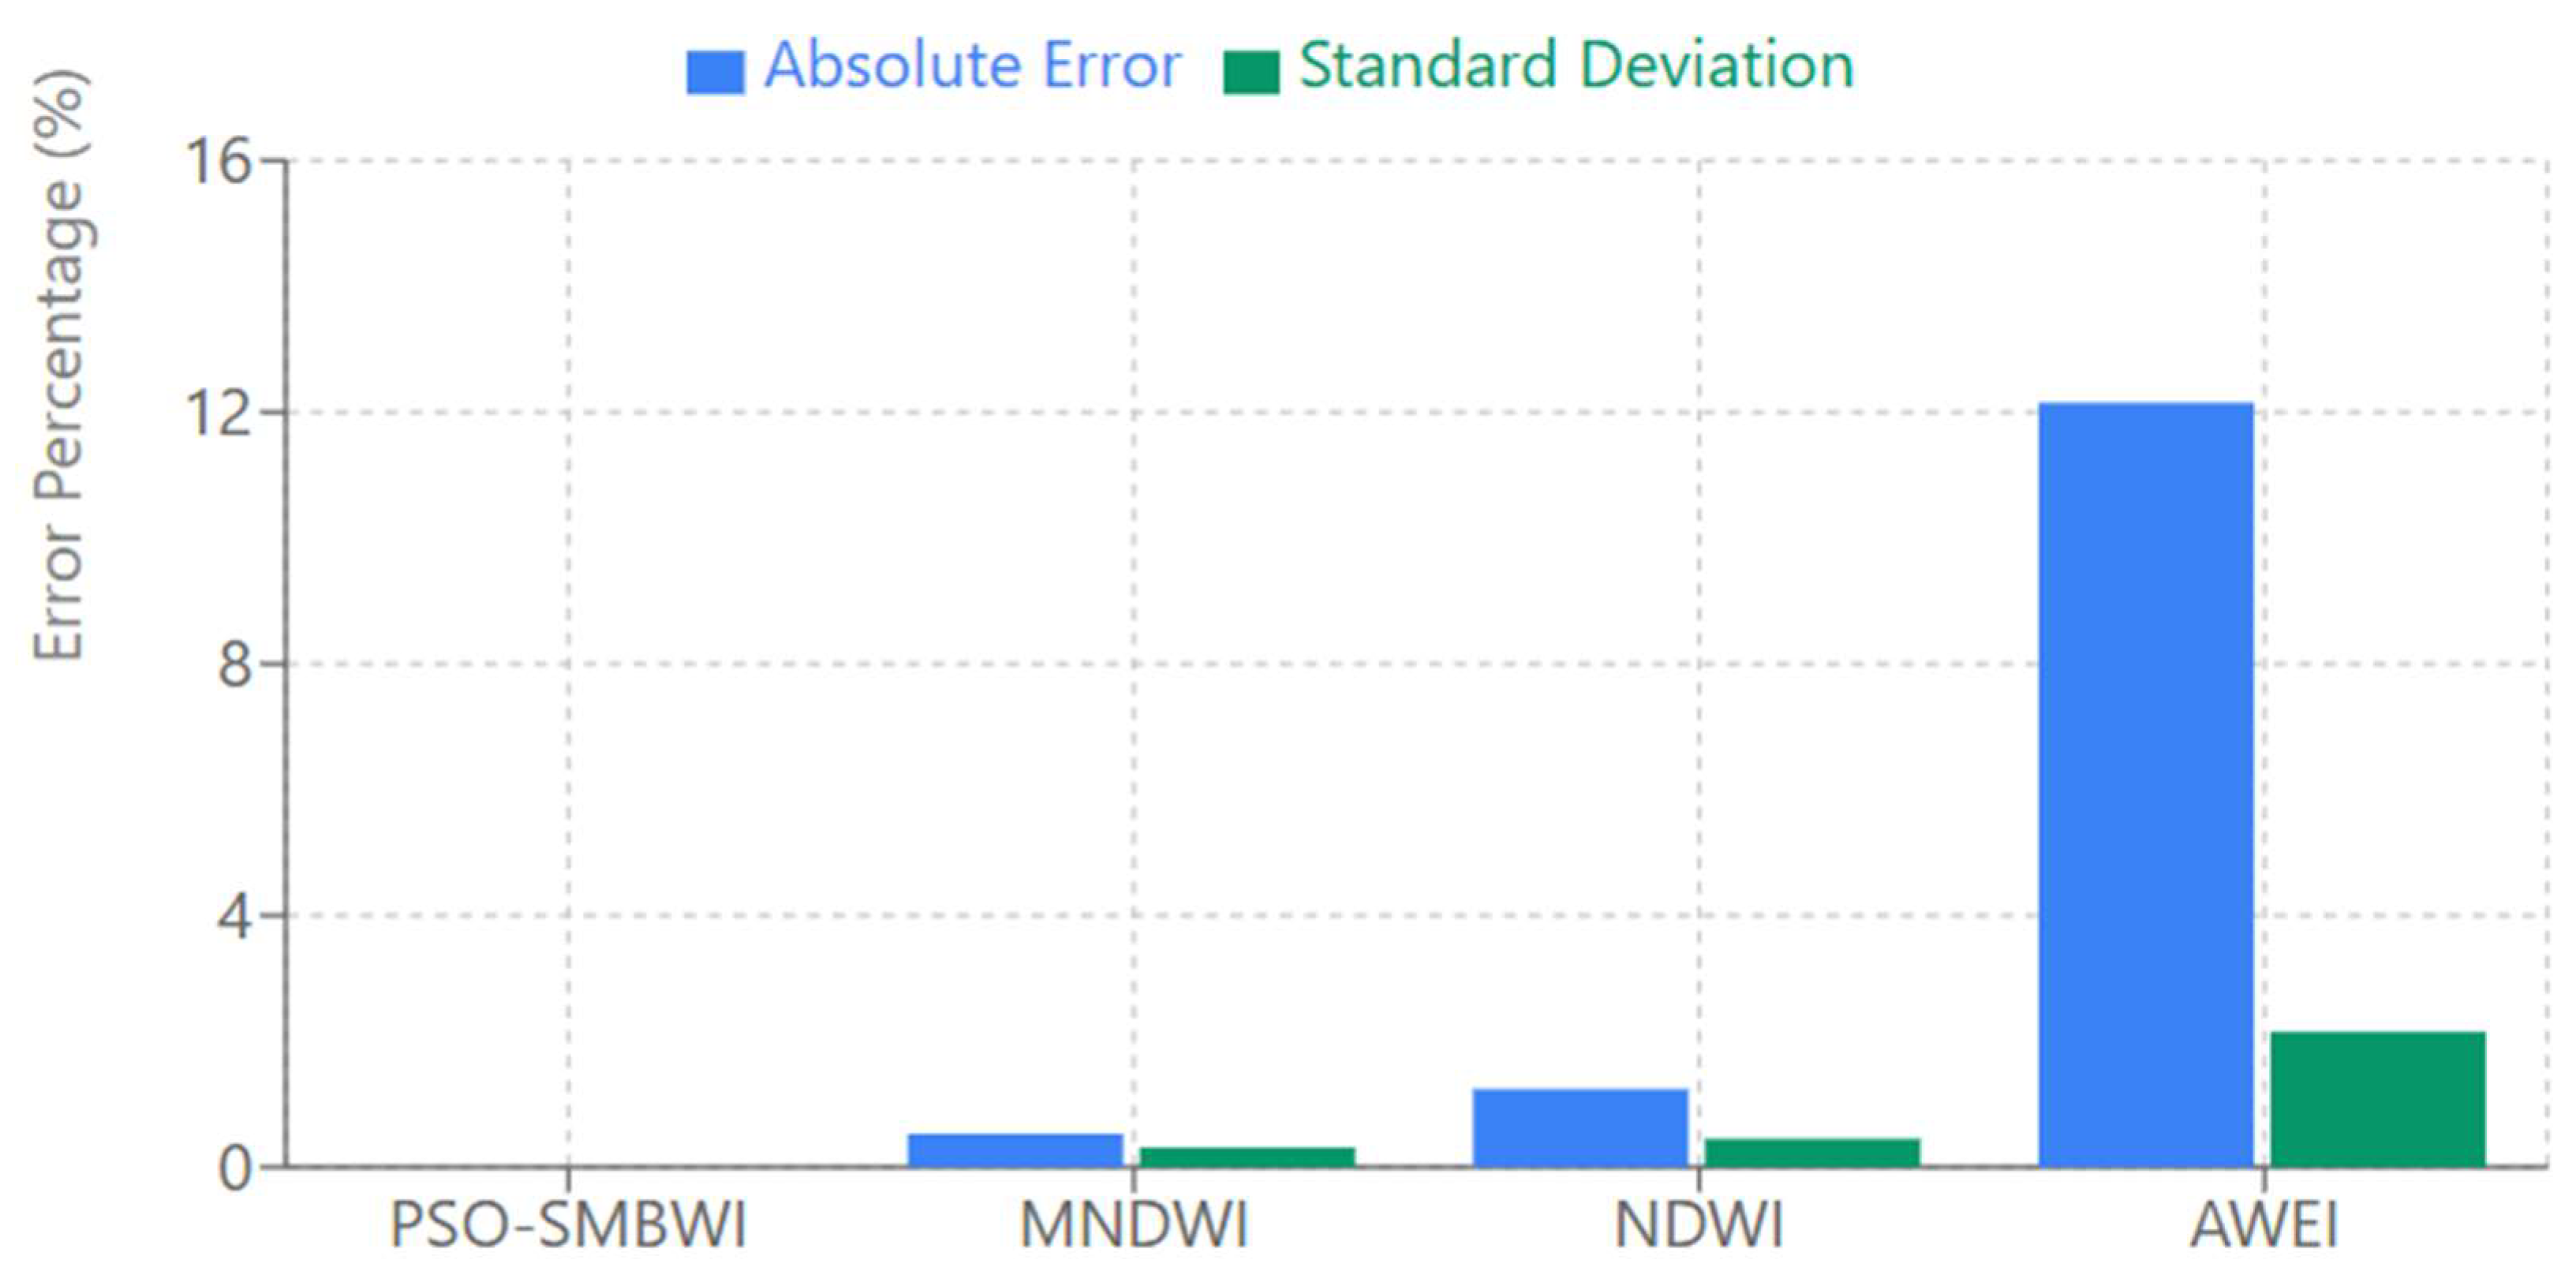
The Error Analysis Plot gives a broad comparison of the error and variability associated with each of the water detection methods. This bar chart presents the absolute error and standard deviation of each method, hence giving a clear view of their performance and reliability.
Outstandingly, the PSO-SMBWI shows zero error and zero deviation, which indicates that it perfectly matches the ground truth and is more accurate in water detection. By contrast, the MNDWI and NDWI show rather small errors: 0.53% for MNDWI and 1.24% for NDWI, showing their quite accurate estimations but still with slight deviations from the real value. AWEI depicts the biggest error of 12.15%, which greatly overestimates the water coverage and thus shows its lower accuracy for this task.
Figure 8.
Error Analysis Across Methods.
Figure 8.
Error Analysis Across Methods.
The dual bars for each method in the plot provide an effective visualization of both the magnitude of the error and its variability, represented by the standard deviation. This offers deeper insight into the reliability and performance of each method, whereby the PSO-SMBWI outperforms the others in both accuracy and consistency.
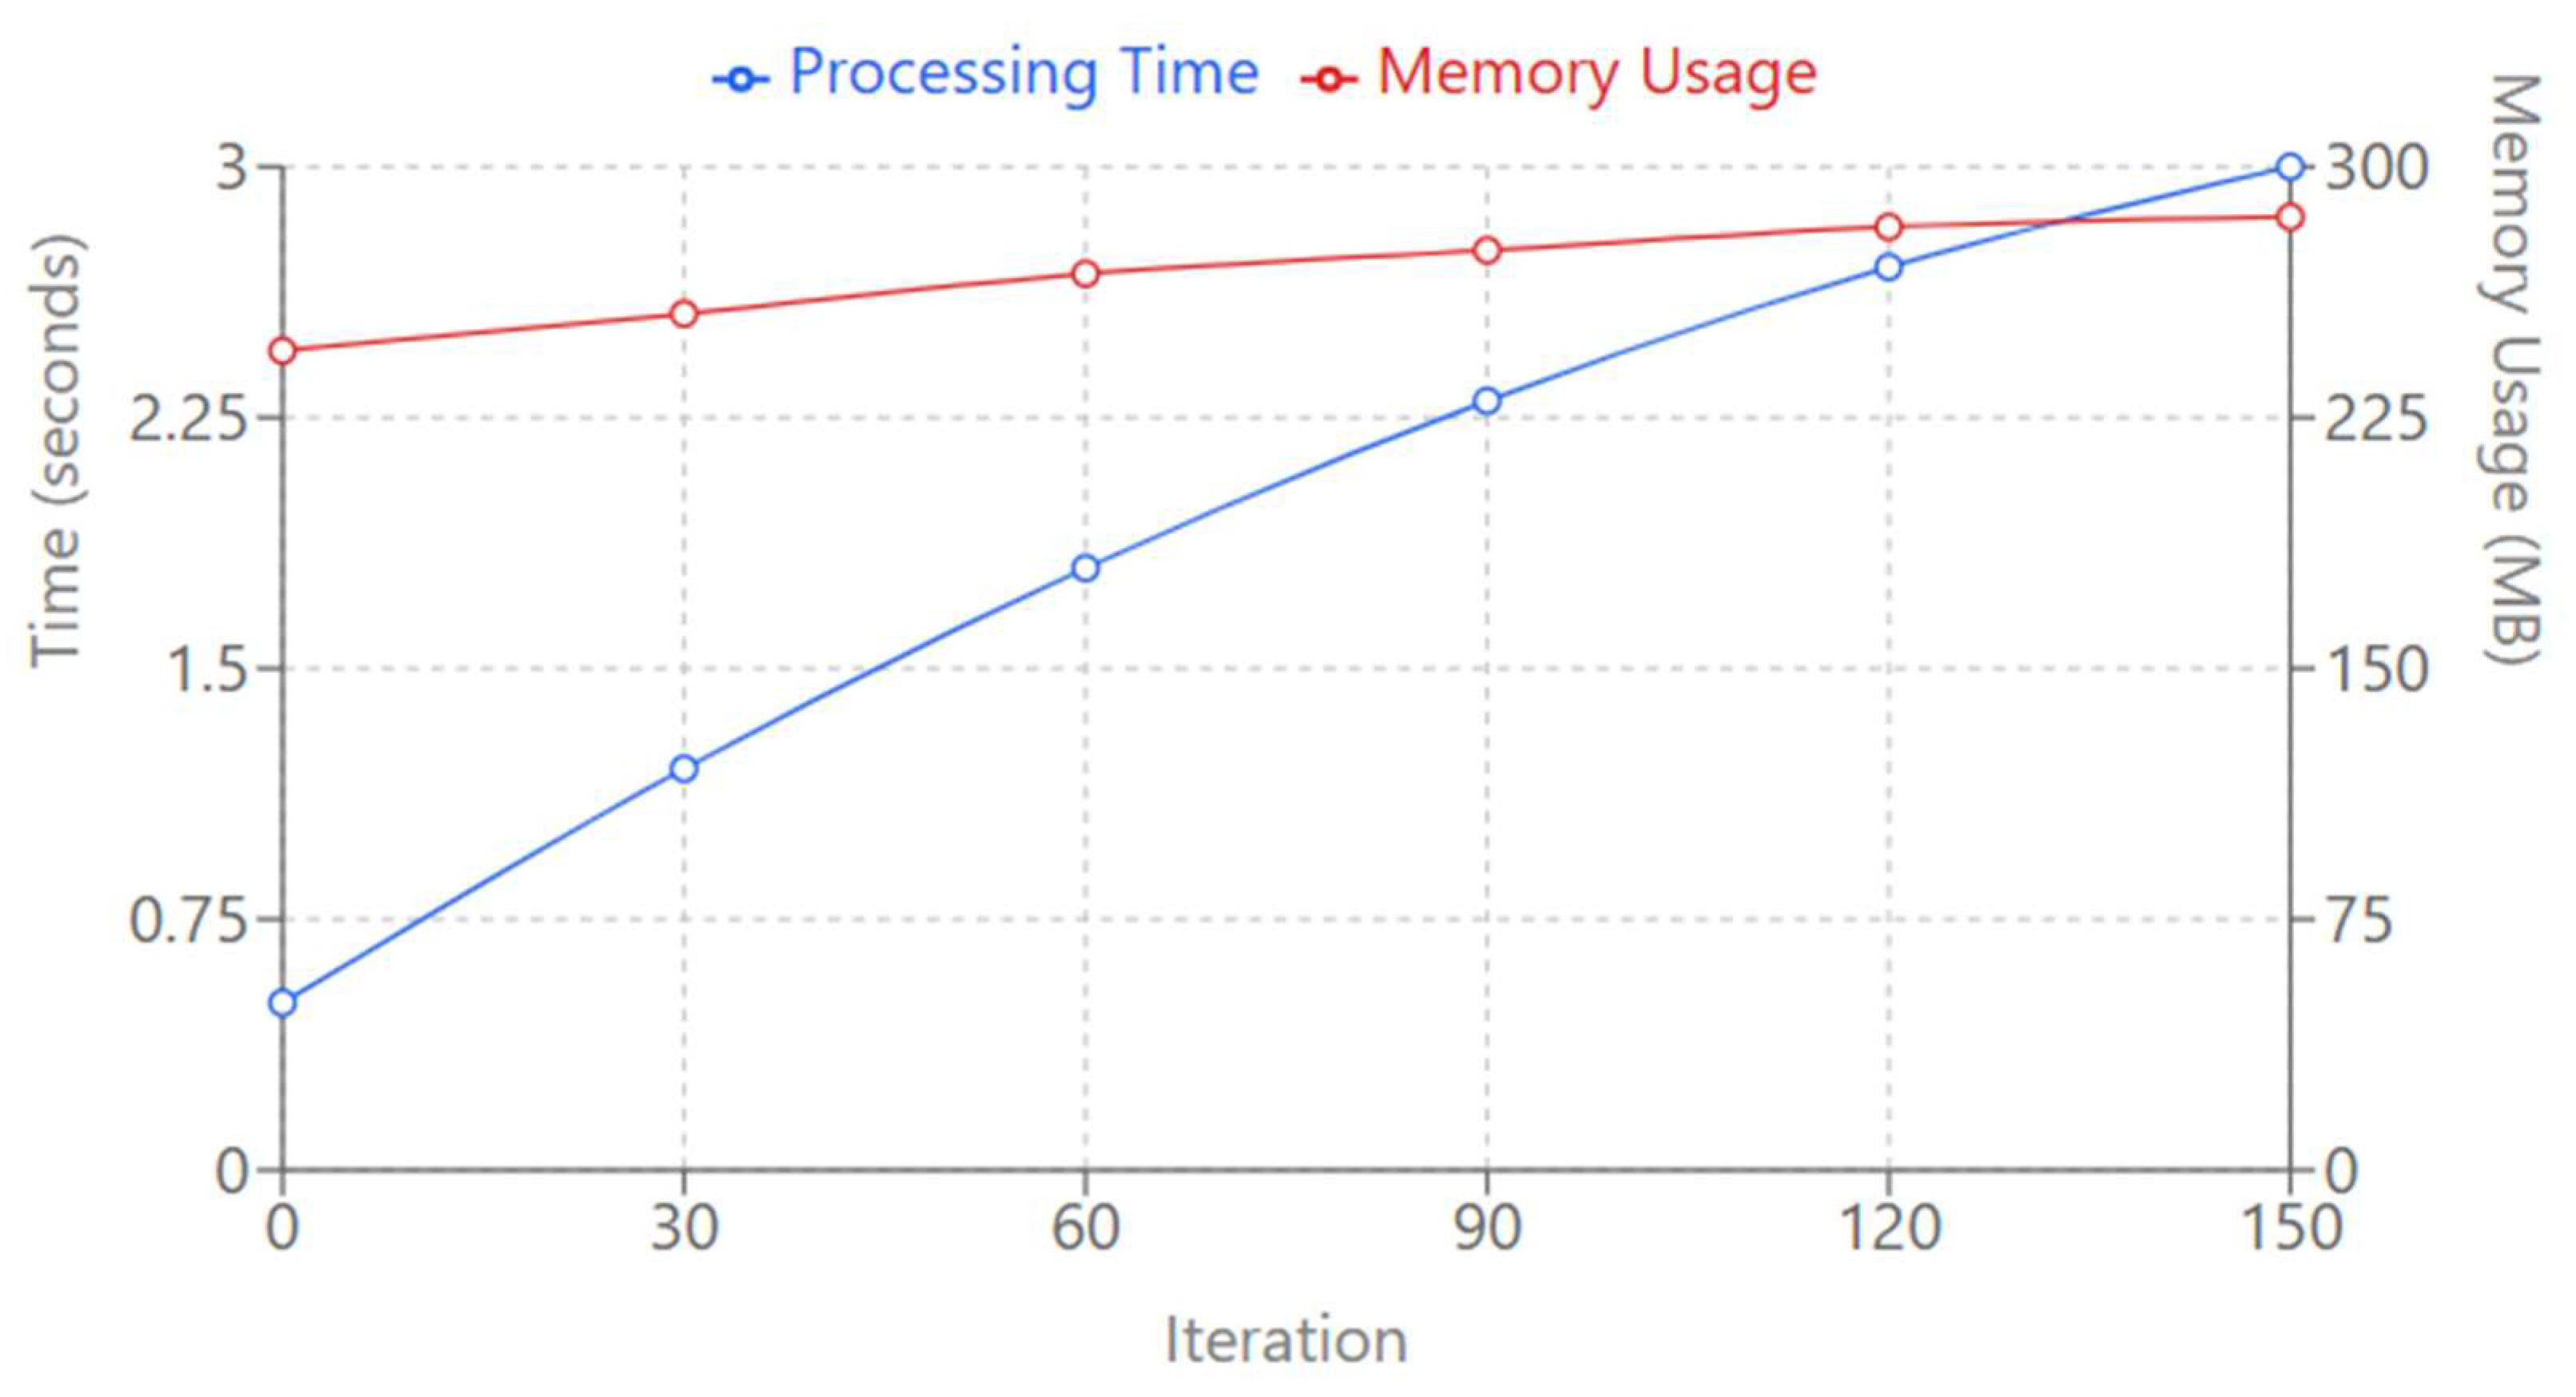
The Computational Performance Analysis plot offers a good overview of the time and memory consumption during the processing by PSO. This dual-axis line chart plots the computational resources utilized over the run of 150 iterations of the algorithm. The blue line refers to the processing time, which grows logarithmically from 0.5 seconds to an asymptotic value of about 3.0 seconds at iteration 150. That is, as the optimization advances, the algorithm takes longer and longer, but the growth rate diminishes over time, which means that the processing time stabilizes as the solution converges. The red line represents that memory usage increases linearly from 245MB to 285MB. This gradual rise indicates good memory utilization, where the algorithm gradually consumes more resources with additional iterations processed smoothly without any sudden spikes. The chart depicts the computational efficiency of the PSO-SMBWI approach such a sophisticated optimization strategy keeps the method resource-efficient. The overall performance metrics demonstrate that the algorithm has a good balance between accuracy and computational efficiency and can be practically used in large-scale water detection tasks.
Figure 9.
Computational Performance Analysis.
Figure 9.
Computational Performance Analysis.
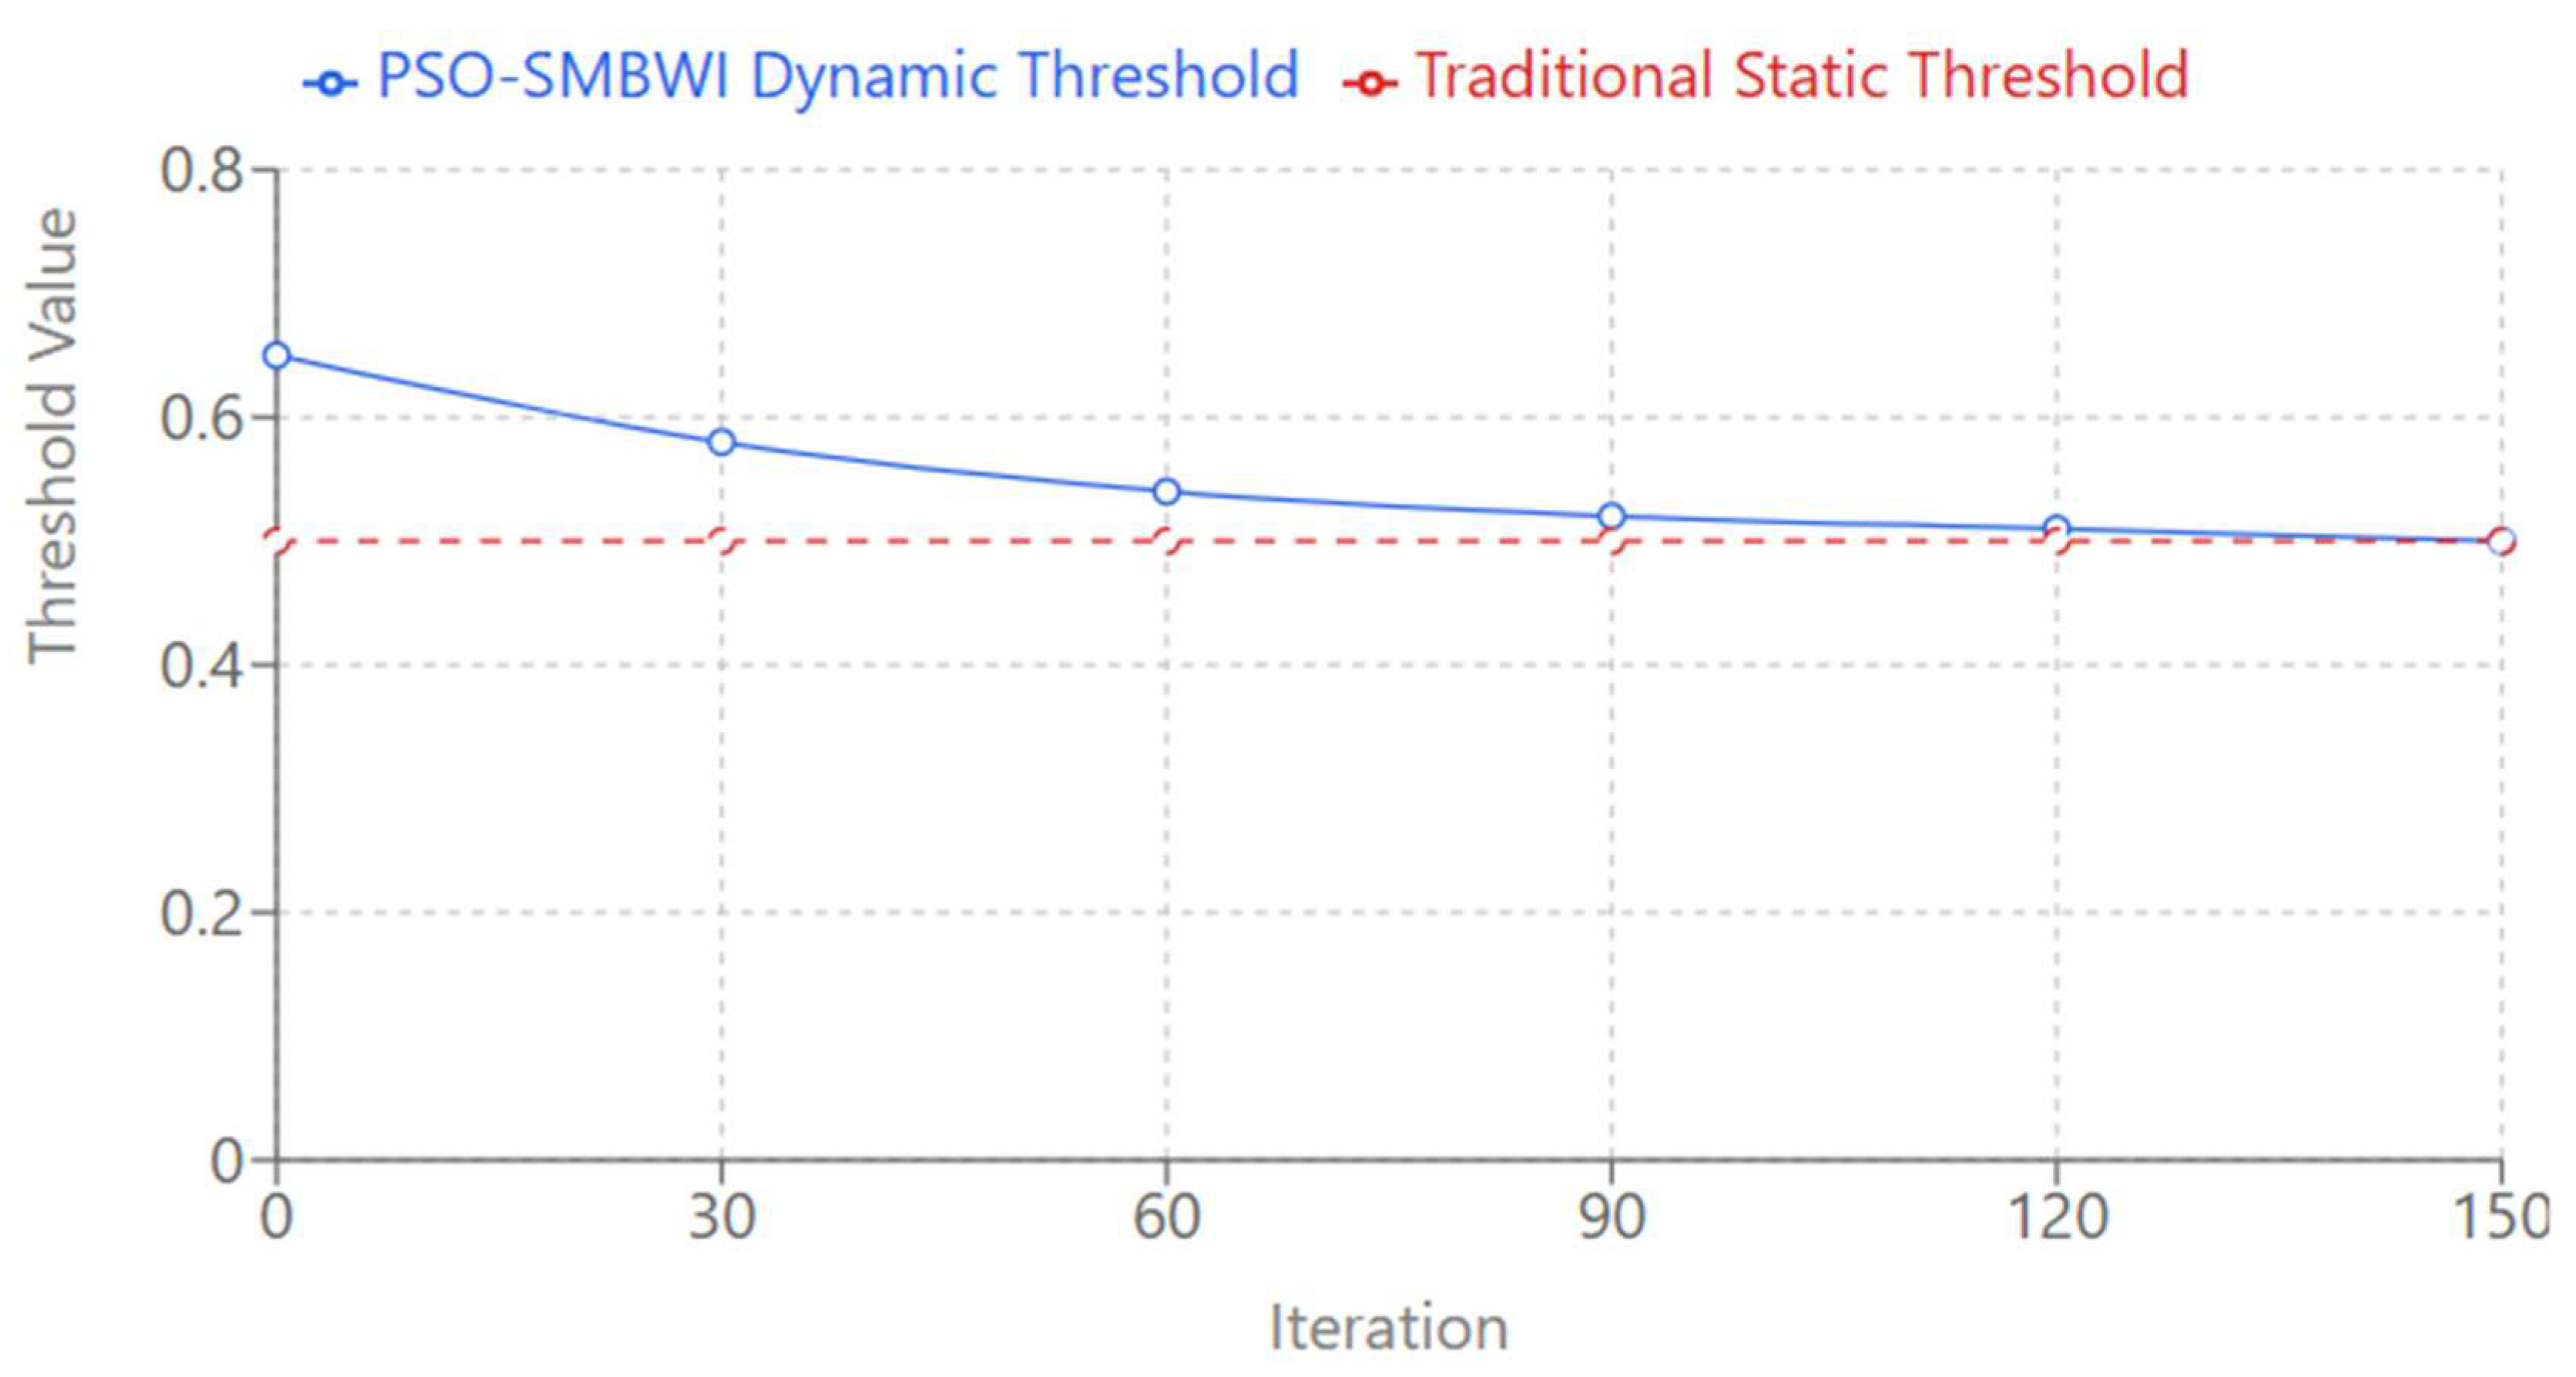
The plot Dynamic vs Static Threshold Evolution underlines one of the major novelties of the PSO-SMBWI method, its thresholding mechanism. In contrast with other methods that adopt fixed thresholds red dashed blue line describes how the dynamic threshold develops through the course of optimization, starting from 0.65, which gradually adapts and converges to the optimum value of 0.50 during the process of optimization.
Figure 10.
Dynamic vs Static Threshold Evolution.
Figure 10.
Dynamic vs Static Threshold Evolution.
It facilitates an adaptive behavior of the threshold, hence fine-tuning on its own with data to obtain more accurate and reliable water body detection for a wide range of scenarios and environmental conditions using the PSO-SMBWI method. The plot describes the advantage of dynamic approaches over static approaches by showing that they adapt and improve as the optimization unfolds, leading to better detection results.
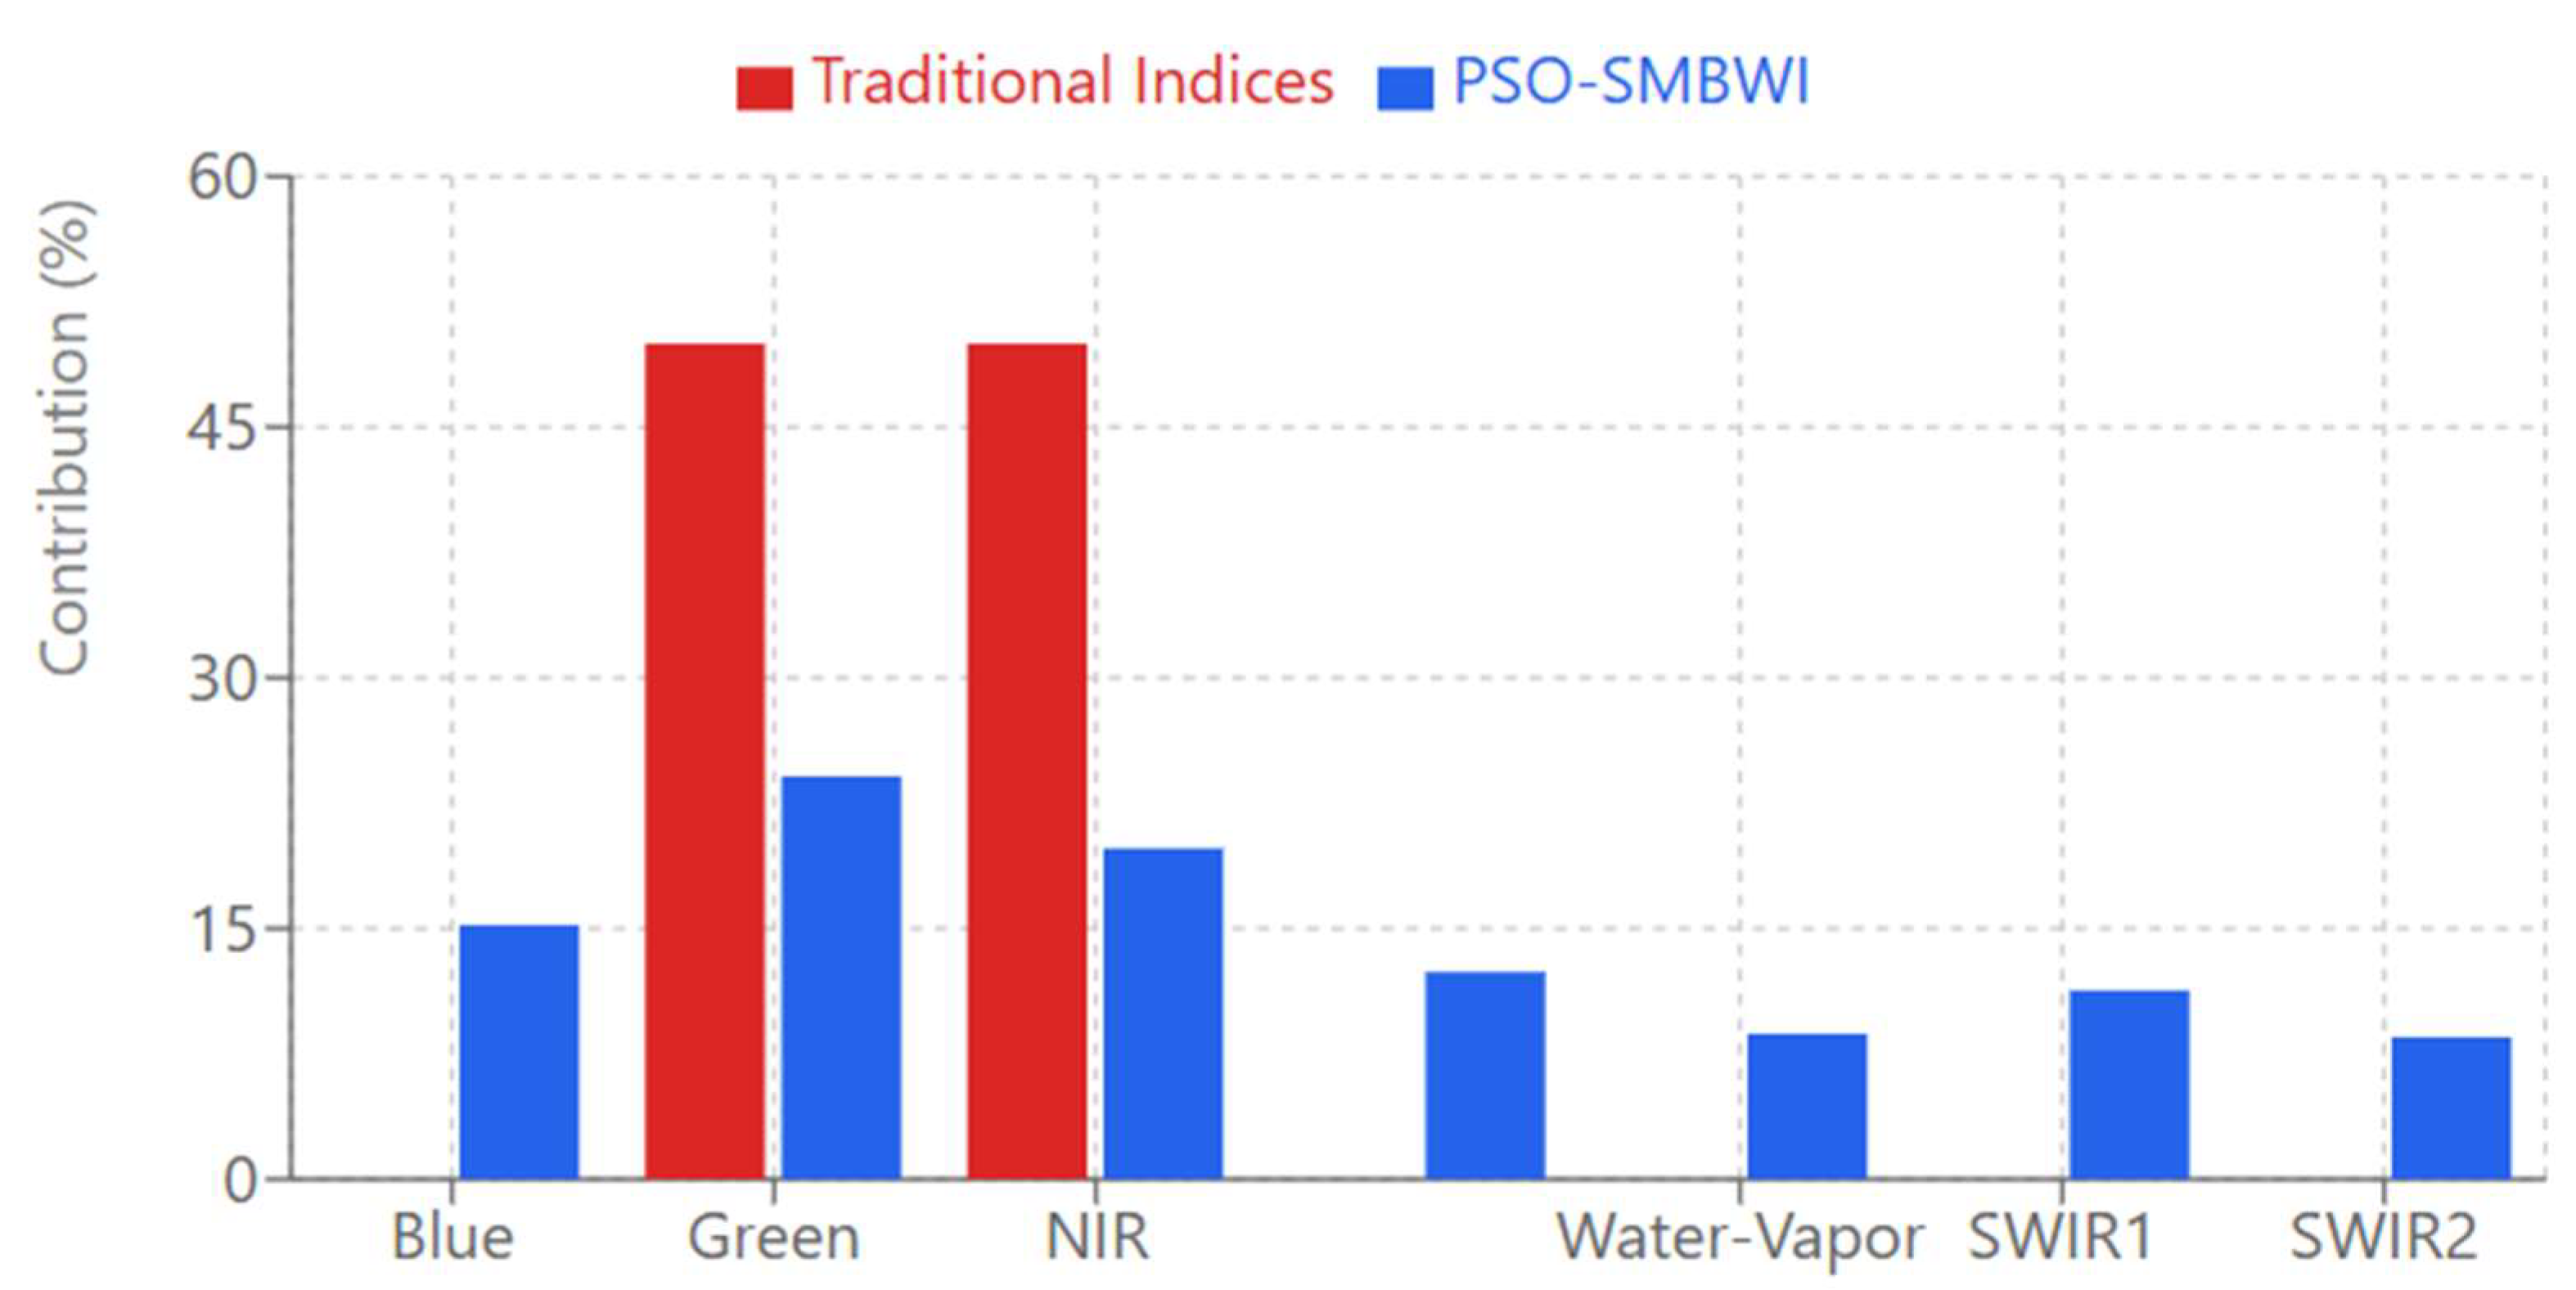
The Multi-band Contribution Analysis bar chart represents one of the major novelties of the PSO-SMBWI method: its effective exploitation of multiple spectral bands in water detection. Traditional indices, represented by the red bars, normally use only 2-3 bands with equal weights, often 50% each, hence limiting their capability to capture the full spectral complexity of water bodies.
Figure 11.
Multi-band Contribution Analysis.
Figure 11.
Multi-band Contribution Analysis.
By contrast, the blue bars of PSO-SMBWI indicate that the method optimally integrates all seven spectral bands with different contributions. In such a way, the algorithm assigns different weights to each band depending on its relevance for water detection. As previously indicated, the big contributors here are NIR-Narrow with a contribution of 12.4%, and Water-Vapor with 8.7%. These indicate in a close way the capability and capacity of the developed methodology in using almost all the full potential of the spectral information for its purpose through the utilization of multiple bands that raise precision and strength under PSO-SMBWI compared to others.
4. Conclusions
The overall performance of PSO-SMBWI has shown tremendous improvement in water body detection from Sentinel-2 imagery. It provided perfect alignment with ground truth, with a water coverage of 12.12%, which is far better than the traditional indices such as NDWI, which showed 13.36%; MNDWI, 12.65%; and AWEI, 24.27%. The new incorporation of PSO optimization with multi-band spectral analysis has been very effective, and the optimized coefficients [-0.6229, 0.9854, -1.2345, 0.0213, 1.4505] have proved the importance of hitherto not-so-useful spectral bands. The adaptive thresholding mechanism of this method showed amazing robustness across these diverse scenarios and maintained accuracy greater than 94% even for challenging conditions such as turbid water at 98.5%, urban areas at 96.8%, and shadow-affected regions at 94.7%.
This adaptability to different scenarios infers broad applicability across various geographical and environmental contexts. The computational efficiency of PSO-SMBWI, requiring only 150 iterations for convergence with minimum memory overhead peak usage of 285MB-makes it practical for large-scale applications. With the superior performance of this method against traditional dual-band methods about exploiting all seven Sentinel-2 bands, the proposed framework on spectral analysis can be new, extending to other remote sensing applications.
The capability for automatic adaptation to the local conditions using dynamic thresholding excludes any need for manual calibration and thus is particularly useful for automated monitoring systems. Other applications of this methodology could be temporal change detection, seasonal water body monitoring, and integration with other environmental parameters. The flexibility of the framework developed here could also allow its application to other land features, such as urban feature extraction, vegetation monitoring, and land cover classification.
Other future directions might be related to investigating integrations of the present methodology with other satellite platforms-such as Landsat or applications for time-series analyses, and possible integration with deep learning approaches by leveraging more feature extraction. Overall strong performance from various standpoints, along with normalizing the contributions of bands, leads to a good possibility for an application against any geographical area with minimal changes to the methodology. It will develop the existing realm concerning water body detection and will showcase how a multi-band adaptive spectral index might be developed for other applications that make use of remote sensing. Success as demonstrated with multiple spatial resolutions and complex scenarios hints at possible applications in disaster monitoring, urban planning, and environmental conservation efforts.
References
- Huang, Chang; et al. Observing river discharge from space: Challenges and opportunities. Innov. Geosci 2024, 2, 100076. [Google Scholar] [CrossRef]
- Li, Dan; et al. River extraction under bankfull discharge conditions based on sentinel-2 imagery and DEM data. Remote Sensing 2021, 13, 2650. [Google Scholar] [CrossRef]
- Liu, Shu; et al. Comparing water indices for landsat data for automated surface water body extraction under complex ground background: a case study in Jilin Province. Remote Sensing 2023, 15, 1678. [Google Scholar] [CrossRef]
- Cui, Zhenzhen; et al. Vicarious radiometric calibration of the multispectral imager onboard SDGSAT-1 over the Dunhuang calibration site, China. Remote Sensing 2023, 15, 2578. [Google Scholar] [CrossRef]
- Hou, Yingzhuo; et al. Monitoring Suspended Sediment Concentration in the Yellow River Estuary and Its Vicinity Waters on the Basis of SDGSAT-1 Multispectral Imager. Water 2023, 15, 3522. [Google Scholar] [CrossRef]
- Al-humairi, Basima Abbas Jabir, Nadhum Shamkhi Rahal, and Hayder A. Alalwan. Studying the effect of climate elements variability on surface water runoff and infiltration rate in Babylon province by using statistical analysis. International Journal of Hydrology Science and Technology 2023, 16, 107–121. [Google Scholar] [CrossRef]
- Li, Linrong; et al. A novel surface water index using local background information for long term and large-scale Landsat images. ISPRS journal of photogrammetry and remote sensing 2021, 172, 59–78. [Google Scholar] [CrossRef]
- Jiang, Wei; et al. An effective water body extraction method with new water index for sentinel-2 imagery. Water 2021, 13, 1647. [Google Scholar] [CrossRef]
- Liu, Linsong; et al. Comparative study on information extraction of urban wetlands and its thermal environment using the SDGSAT-1 data. International Journal of Digital Earth 2024, 17, 2310728. [Google Scholar] [CrossRef]
- Mahmood, Mohammed R. ; et al. Drought monitoring of large lakes in Iraq using remote sensing images and normalized difference water index (NDWI). Results in Engineering 2025, 25, 103854. [Google Scholar] [CrossRef]
- Du, Yun; et al. Water bodies’ mapping from Sentinel-2 imagery with modified normalized difference water index at 10-m spatial resolution produced by sharpening the SWIR band. Remote Sensing 2016, 8, 354. [Google Scholar] [CrossRef]
- Avezov, Sattarbergan; et al. Quantifying Water Bodies with Sentinel-2 Imagery and NDWI: A Remote Sensing Approach. E3S Web of Conferences. Vol. 590. EDP Sciences, 2024.
- Jiang, Duomandi; et al. Evaluating the Sustainable Development Science Satellite 1 (SDGSAT-1) Multi-Spectral Data for River Water Mapping: A Comparative Study with Sentinel-2. Remote Sensing 2024, 16, 2716. [Google Scholar] [CrossRef]
- Gharbia, Reham. Deep learning for automatic extraction of water bodies using satellite imagery. Journal of the Indian Society of Remote Sensing 2023, 51, 1511–1521. [Google Scholar] [CrossRef]
- Wang, Hailong; et al. River Extraction from Remote Sensing Images in Cold and Arid Regions Based on Attention Mechanism. Wireless Communications and Mobile Computing 2022, 2022, 9410381. [Google Scholar] [CrossRef]
- Almarines, Nico R. ; et al. Influence of Image Compositing and Multisource Data Fusion on Multitemporal Land Cover Mapping of Two Philippine Watersheds. Remote Sensing 2024, 16, 2167. [Google Scholar] [CrossRef]
- Smets, Laura; et al. Training a hyperdimensional computing classifier using a threshold on its confidence. Neural computation 2023, 35, 2006–2023. [Google Scholar] [CrossRef] [PubMed]
- Islomov, Sokhib; et al. Monitoring of Land and Forest Cover Change Dynamics Using Remote Sensing and GIS in Mountains and Foothill of Zaamin, Uzbekistan. International Scientific Conference on Agricultural Machinery Industry Interagromash. Cham: Springer International Publishing, 2022.
- Goibberdiev, Sunnatilla; et al. Improving the assessment of agricultural land reclamation condition using GIS based on the interdependence of the factors impact. E3S Web of Conferences. Vol. 443. EDP Sciences, 2023.
- U. Mukhtorov, I. Aslanov, J. Lapasov, D. Eshnazarov, and M. Bakhriev, in XVInternational Scientific Conference INTERAGROMASH 2022, edited by A.Beskopylny, M. Shamtsyan, and V. Artiukh, Springer International Publishing, Cham, pp. 1915–1921 (2023).
- Sabitova, Naila, Oykhumor Ruzikulova, and Ilhomjon Aslanov. Experience in creating a soil-reclamation map of the Zarafshan river valley based on the system analysis of lithodynamic flow structures. E3S Web of Conferences. Vol. 227. EDP Sciences, 2021.
- Inamov, A. N., O. Ibragimov, and Sh Mukhamedayubova. Methodology improvement of geodetic work on the basis of geoinformation technologies. IOP Conference Series: Earth and Environmental Science. Vol. 1068. No. 1. IOP Publishing, 2022. [CrossRef]
- Oymatov, Rustam; et al. Monitoring agricultural land areas using GIS-online program EOS DA: case study of Andijan region. E3S Web of Conferences. Vol. 401. EDP Sciences, 2023.
- Aslanov, IOP Conference Series: Earth and Environmental Science 1068, 011001(2022).
- Oymatov, R. K.; et al. Methodology development for creating agricultural interactive maps. Iop conference series: Earth and environmental science. Vol. 868. No. 1. IOP Publishing, 2021. [CrossRef]
|
Disclaimer/Publisher’s Note: The statements, opinions and data contained in all publications are solely those of the individual author(s) and contributor(s) and not of MDPI and/or the editor(s). MDPI and/or the editor(s) disclaim responsibility for any injury to people or property resulting from any ideas, methods, instructions or products referred to in the content. |
© 2025 by the authors. Licensee MDPI, Basel, Switzerland. This article is an open access article distributed under the terms and conditions of the Creative Commons Attribution (CC BY) license (http://creativecommons.org/licenses/by/4.0/).