
Submitted:
08 February 2025
Posted:
10 February 2025
You are already at the latest version
Abstract
Removing high-concentration organic dye from wastewater is of great concern because the hazards can cause serious damage to the environment and human health.
In this study, the hybrid dimensionally stable anode (DSA) with Ce-doped and SnO2-
Sb2O5 intermediate layer was fabricated and used for the electro-catalytic oxidation of
three kinds ultra-high concentration organic dyes.Scanning electron microscopy (SEM), X-ray diffraction (XRD) and X-ray photoelectron spectroscopy (XPS) confirmed the more dense surface structure and morphology of the composite Ti/SnO2-Sb2O5/Ce-PbO2 electrode, Moreover, the electrode exhibited excellent oxygen evolution potential of 1.58 V. The effect on the removal efficiencies of high concentrations up to 1 g/L of methyl orange, methylene blue, and neutral red solutions with the above composite electrode were investigated.The research results illustrated that target molecules in the three different dye solutions were rapidly decolorized and decomposed by electro-catalytic oxidation less than 35 min. Additionally, the degradation process still followed pseudo-first-order kinetics for high concentrations dye solution. The removal efficiency of TOC and COD for the three dye solutions was more than 98%, and the results of the GC-MS analysis showed that it had the best degradation effects for neutral red, which decomposed more thoroughly. More than 80 h of accelerated life also revealed excellent performance of the composite electrode in face of high-concentration dye solution degradation. Considering these results, the Ti/SnO2-Sb2O5/Ce-PbO2 anode could be utilized to treat wastewater containing high-concentration dyes with high efficiency.
Keywords:
ultra-high concentration organic dyes
; degradation
; electro-catalytic oxidation
; titanium based composite electrode
1. Introduction
Due to the continuous development and expansion of the scale of industrial production, the type and amount of industrial pollutants are increasing [1,2]. If discharged without further treatment, it may cause serious damage to people and other animals or plants [3]. As one kind of common industrial pollutants, dye wastewater is harmful to the health of human and aquatic organisms due to its high chroma and toxicity, so it is necessary to develop an effective method to degrade wastewater of organic dyes [4,5]. During the last few decades, numerous techniques such as physical absorption, biodegradation, and chemical catalytic oxidation have been reported to degrade different type organic dyes from wastewater and achieve better effects [6,7,8,9].As one of the representative chemical catalytic oxidation methods, the dimensionally stable anode (DSA) used for electro-catalytic oxidation has been given more attention because of its advantages such as simple operation, environmentally friendly, and high degradation efficiency [10,11,12]. At present, mature DSA electrocatalysis technologies mainly use titanium as matrix and metal oxide, including IrO2 [13], RuO2 [14], PbO2 [15,16] and SnO2 [17] and so on as active coating to construct the catalytic electrode. Although IrO2 and RuO2 coatings have shown excellent catalytic activities, the prices of such electrodes are still expensive from an industrial point of view. Given the obvious advantages in low-cost and high oxygen evolution potential represented by the PbO2 electrode, therefore, it is of great significance to improve its electro-catalytic performance based on different metal oxide coatings such as Mn [18], Sn [19], and Pb [20].
Intermediate protective layer import and ion doping are two common effective measures to improve the catalytic performance of the electrode. For example, TiO2 [21] and SnO2 [22] or Sb2O5 [23] layers and doping with F- [24], Zr2+ [25], La3+ [26] can improve electrode conductivity or regulate the microstructure of the coating surface. Although such modified DSA anodes have been used to degrade the organic pollutants, they are usually used for low concentration (the average concentration is less than 200 mg/L) organic dyes or other phenolic wastewater due to the short lifetime of coating on the target electrode and the degradation effect is greatly affected in a high concentration organic medium. Although high concentration wastewater can be degraded through the combination of physical adsorption [27], ozone oxidation [28], Fenton oxidation [29] or other treatments, the entire treatment process is still relatively complex.
Because most DSA anodes lack experience for ultra-high concentration dyes wastewater degradation, it is unclear whether the high concentration dye wastewater can be efficiently degraded with the rare-earth elements modified titanium-based DSA electrode. Additionally, the degradation kinetics and the total organic carbon (TOC) , chemical oxygen demand (COD) removal efficiency in different types of high concentration dye wastewater have not been completely investigated so far. The principal objective of this study was to fabricate a Ti/SnO2-Sb2O5/Ce-PbO2 electrode through the combined thermal decomposition and electrodeposition methods and to further use the prepared electrode for the electro-catalytic oxidation of high-concentration dye solutions including methyl orange (MO), methylene blue (MB), and neutral red (NR). A series of high-concentration dye solutions (from 200 mg/L to 1 g/L) were selected as degradation targets for systematic investigation of the degradation efficiency well as the degradation kinetics with the above composite electrode. The TOC and COD of the model solutions after degradation with electro-catalytic oxidation were determined, and the possible degradation intermediates formed during the degradation process were proposed based on the GC-MS experiments. This study provided novel insights into the degradation of Different ultra-high concentration dye wastewater using Ti/SnO2-Sb2O5/Ce-PbO2 electrode.
2. Experimental Section
2.1. Chemicals
Methyl orange (MO), methylene blue (MB), and neutral red (NR) were purchased from Energy-chemical Co. Ltd. (Shanghai, China). Stannic chloride, antimonous chloride, lead nitrate, cerium nitrate (III) hexahydrate, sodium fluoride, sodium hydroxide, and hydrochloric acid were purchased from Sinopharm Chemical Reagent Co. All of the chemicals used were of analytical purity and were used without any further purification. Pure Ti sheets (50 mm×50 mm×0.5 mm, purity: 99.9%) were obtained from Titanium Anode Science and Technology Co. Ltd. (Baoji, China)
2.2. Electrode Preparation and Characterization
After being polished with 800 mesh sandpaper to remove TiO2 flm on the surface, Ti sheets (50 mm×50 mm×0.5 mm) were submerged in the solution of 6 M sodium hydroxide for 30 min at 100°C and then rinsed with distilled water. The resulting Ti sheets were then placed in 1 M oxalic acid solution and etched for 2 h at 100 °C. After the reaction, the Ti sheets were washed with distilled water with ultrasonication for 30 min and then dried in air. The SnO2-Sb2O5 coating was prepared using the thermal decomposition method on the pretreated Ti sheets. In summary, 1-butanol was used as the solvent, SnCl4·5H2O and SbCl3 were stirred fully to dissolve and mixed with a mass ratio of 10:1. After scrubbing the above mixed solution on the surface of the pretreated Ti sheets, they were calcined at 450 °C in a muffle furnace for 20 min with a heating rate of 5 °C·min-1. After repeated the above steps 8 times and cooled to room temperature, intermediate SnO2-Sb2O5 layers were successfully imported to the Ti sheet. Subsequently, the Ti/SnO2-Sb2O5/Ce-PbO2 electrode was prepared by the electrodeposition method.Typically, a preprocessed Ti/SnO2-Sb2O5 sheet was used as anode and an equal stainless steel sheet as cathode, the active Ce-PbO2 layer was electrodeposited in 100 ml of electrolyte containing 0.2 mol·L−1 HNO3, 100 g·L−1 Pb(NO3)2, 0.4 g·L−1 NaF, and 1.5 g·L−1 Ce(NO3)3 at the current density of 25 mA·cm-2 and bath temperature of 40 °C for 1 h.
The morphologies of the Ti/SnO2-Sb2O5/Ce-PbO2 electrode were characterized by scanning electron microscopy (SEM, TM-3000). The crystalline phase of the prepared electrodes was analyzed with X-ray diffraction (XRD, D/Max-3c) using Cu Ka radiation (λ= 1.5406), scanning from 5 ° to 80 ° and using an operating voltage and a current of 40 kV and 15 mA. Surface atoms and chemical state of electrodes were determined by XPS (PHI Quantera II). Electrochemical analysis was conducted at the electrochemical work station (CHI660E, Shanghai Chenhua) using a standard three-electrode system.
2.3. Electrochemical Degradation Experiments
Electro-catalytic oxidation of MO, MB or NR solutions was carried out in the glass reactor with Na2SO4 (1 M, 200 ml) as electrolyte. The prepared Ti/SnO2-Sb2O5/Ce-PbO2 electrode was used as anode and an equal stainless steel sheet as cathode.A regulated DC power supply (PS-305D, TRAIS) was used to connect electrodes and provide different voltages for degradation experiments. To explore the infuence of different conditions on the effects of electro-catalytic oxidation on MO, MB and NR solutions, the different current density (10, 20, 30 and 40 mA·cm−2), initial concentrations of the target pollutants (50, 100, 200, 500 and 1000 mg·L−1) and the pH values of the reactiong systems (1, 5, 7, 9, 11 and 14) were adjusted. The concentration of MO, MB or NR solutions was analyzed at corresponding wavelengths of 465 nm, 664 nm or 540 nm using the UV–Vis spectrophotometer (U3900, Tech comp). Samples of these dyes were collected from the reaction solution at regular intervals for analysis.
The concentrations of TOC and COD were measured using the TOC analyzer (V13 5B-1B, Lianhua technology) and COD analyzer (V11 5B-3B, Lianhua technology) during different electrochemical degradation processes. The removal efficiency and degradation kinetic parameters of different dyes were determined by the following Equations (2) and (3).
where η is the removal efficiency (%). C0 and Ct (mg L−1) represent the initial concentration and the concentration at a certain time after the degradation of MO, MB or NR, respectively. k (min1) represents the pseudo-frst-order kinetic coefficient.
2.4. Analysis of the Degradation Products with GC-MS
The degradation products of MO, MB or NR were identified by mass spectrometry gas chromatography (GC-MS, Agilent) equipped with an HP-5 MS column (30 mm × 0.25 mm × 0.25 mm). The suspension after thorough reaction was filtered and 5 ml of filtrate was acidized to approximately pH = 2 and extracted with 3 ml of ethyl acetate four times to obtain the extracts in a 10 ml separate funnel. The extract solution was then dehydrated with 2 g of anhydrous magnesium sulfate for 20 min. Ethyl acetate was removed using a termovap sample concentrator to approximately 1 ml. 0.1 ml of hexamethyldisilazane was added to the derivate for at least 1 hour at room temperature. The derivation solution was transferred to a 1.5 ml chromatographic bottle for GC-MS analysis. The initial solution was diluted and treated with the same method and the corresponding experimental results were used as the control. The GC parameters are listed as follows: injector temperature of 250 °C, an initial oven temperature of 40 °C for 2 min, and then programmed increased to 300 °C at the rate of 10 °C/min and held for 2 min.
3. Results and Discussions
3.1. The Crystal Structure and Surface Morphology of the Ti/SnO2-Sb2O5/Ce-PbO2 Electrodes
To determine the crystal structure of the Ti/SnO2-Sb2O5/Ce-PbO2 electrode, XRD was used to analyze the objective electrode, the electrodes that only coated with the intermediate layer (Ti/SnO2-Sb2O5) and without doped cerium(Ti/SnO2-Sb2O5/PbO2) were also determined as a control. As shown in Figure 1, the diffraction peaks of the electrode appeared at 2θ= 26.7 °, 51.8 °, 61.7 ° and 65.7 °, which belonged to (110),
Figure 2 is the SEM images of the Ti/SnO2-Sb2O5/Ce-PbO2 electrode, as well as the Ti / SnO2-Sb2O5 and Ti/SnO2-Sb2O5/PbO2 electrodes which have only intermediate coating or without cerium doping. As shown in Figure 2a, there are large cracks on the surface of the Ti / SnO2-Sb2O5 electrode, which is related to the cracking of the SnO2-Sb2O5 coating during the high temperature calcination process [33]. However, the surface morphology of the Ti/SnO2-Sb2O5/PbO2 electrode is more compact compared to the Ti/SnO2-Sb2O5/PbO2 electrode, which indicated that the active layer of PbO2 obtained by electrodeposition has completely covered the intermediate coating of SnO2-Sb2O5. (Figure 2b Fig.S1). Compared with the above electrodes, the surface morphology of the Ti/SnO2-Sb2O5/Ce-PbO2 electrode is more dense and its specific surface area is larger, which is conducive to improving the catalytic activity of the electrode (Figure 2c). At the same time, the crystal state of the surface coating is more obvious, which is consistent with the previous XRD results. The EDS mapping results of the composite electrode are shown in Figure 2d. The elements of Pb, O, and Ce were uniformly distributed on the outer surface of titanium martix. The statistical results of the element content are shown in Tab. S1. It revealed that the composition of Pb and O on the electrode was consistent with the stoichiometric ratio and Ce had been successfully doped into the active layer of PbO2.
In order to further investigate the chemical properties and the element state of the composite electrode, XPS was performed to analyze the composite electrode. As shown in Figure 3a, objective elements including Pb, Sn, Sb, Ce, and O were detected in the XPS survey spectrum. The high-resolution Pb 4f spectra exhibited two splitting peaks at about 137.1 and 142.2 eV, which corresponded to Pb 4f7/2 and Pb 4f5/2, respectively (Figure 3b). The difference value of the binding energy between the above two peaks was 5.1 eV, further confirming the formation of β-PbO2 on the objective electrode [33,34]. Fig.3c shows the Sn3d5/2 spectra, which indicated that tin existed in the form of sn4+ (SnO2) in the intermediate layer of the electrode [32]. According to the results of the Ce 3d fitting curve, the peaks with a binding energy of 898 and 901 eV were assigned to Ce 3d3/2 and Ce 3d5/2, respectively (Figure 3d) [35], indicating that the Ce element existed in the form of Ce3+ on the electrode surface. The fitting curve of the Sb 3d5/2 peak is shown in Figure 3e, which overlapped with the location of O1s (530.1 eV) and was disliked for the metal oxides Sb2O5 [36]. Because Sb2O3 usually has a lower binging energy. According to all these results, it can be confirmed that the Ti/SnO2-Sb2O5/Ce-PbO2 electrode has been successfully prepared.
3.2. Electrochemical Properties of the Ti/SnO2-Sb2O5/Ce-PbO2 Electrode
The electrochemical active area is an important parameter that plays a key role in the electro-catalytic oxidation process, so it is often used to evaluate the catalytic performance of an objective electrode. The most common parameter in the evaluation is the voltammetric charge quantity (q *) and is often used to assess the active electrochemical surface area of the objective electrode [37,38]. To calculate q*, the CV curves of the Ti/SnO2-Sb2O5 and Ti/SnO2-Sb2O5/Ce-PbO2 electrodes were analyzed. It can be seen from Figure 4a that the area enclosed by the CV curve of the electrode, and did not have an obvious oxidiation peak, which can be attributed to the absence of the active layer of PbO2. The Ti/SnO2-Sb2O5/Ce-PbO2 electrode has a larger CV curve area and shows a certain oxidation peak at approximately 1.58 V under the same experiment conditions. According to Eq. (1), the values of q* corresponding to Ti/SnO2-Sb2O5 and Ti/SnO2-Sb2O5/Ce-PbO2 were 0.025 C/cm2 and 0.367 C/cm2, respectively. So the active Ce-PbO2 layer played a favorable role in enhancing the electroactive surface area of the objective electrode.
Linear scan voltammetry (LSV) curves of the different electrodes are shown in Figure 4 (b). The oxygen evolution potential (OEP) of the Ti/SnO2-Sb2O5/Ce-PbO2 electrode was 1.58 V, which was higher than that of the Ti/SnO2-Sb2O5/PbO2 electrode (1.47 V). It is well known that high OEP is beneficial to improve current utilization efficiency during the electro-catalytic process, so imported Ce-PbO2 as the active layer would significantly improve the electrochemical oxidation performance of the composite electrode. Because the SnO2-Sb2O5 coating mainly plays a role in protecting the Ti substrate from electrolyte corrosion during the electrochemical oxidation process, while the Ce-PbO2 coating can promote the stability and catalytic activity of the electrode. Therefore, the Ti/SnO2-Sb2O5/Ce-PbO2 electrode should be more suitable to degrade wastewater with high concentration organic dyes.
3.3. Electrochemical Degradation of Different High Concentration Organic Dyes
Because of the linear relationship between the concentration and the UV-vis absorbance value of those dye solutions in thespecific concentration range, the electro-catalytic degradation efficiency to the dyes described abovewith the composite electrode can be assessed by monitoring the changes of the absorption peaks of the corresponding samples. As shown in Figure 5a,c,e, the concentration of the three dye solutions (initial concentration 1 g/L) decreased rapidly. All of these solutions faded to colorless after being treated, which indicated that the corresponding chromogenic groups for these dye molecules had been decomposed. The corresponding UV-vis characteristic absorption peaks also obviously decreased, which further confirmed the above results (inset). However, the decolorization rate of the MB solution was significantly slower than that of the MO and NR solution. The reason may be that MO and NR are typical azo dyes, so azo chromophore groups can be more easily degraded into small azo fragments 39, 40. However, the chromophore group of MB is a large aromatic phenothiazine system41, so it is more difficult for the whole structure of the aromatic system to be degraded and have a slow decolorization rate.
The reason is that the concentrations and types of wastewater from different sources have an obvious difference and that the degradation process for different dyes also has their own characteristics. Therefore, further investigations are needed to investigate the degradation efficiency and relevant degradation kinetics of dye solutions at different concentrations during the electro-catalytic degradation process.
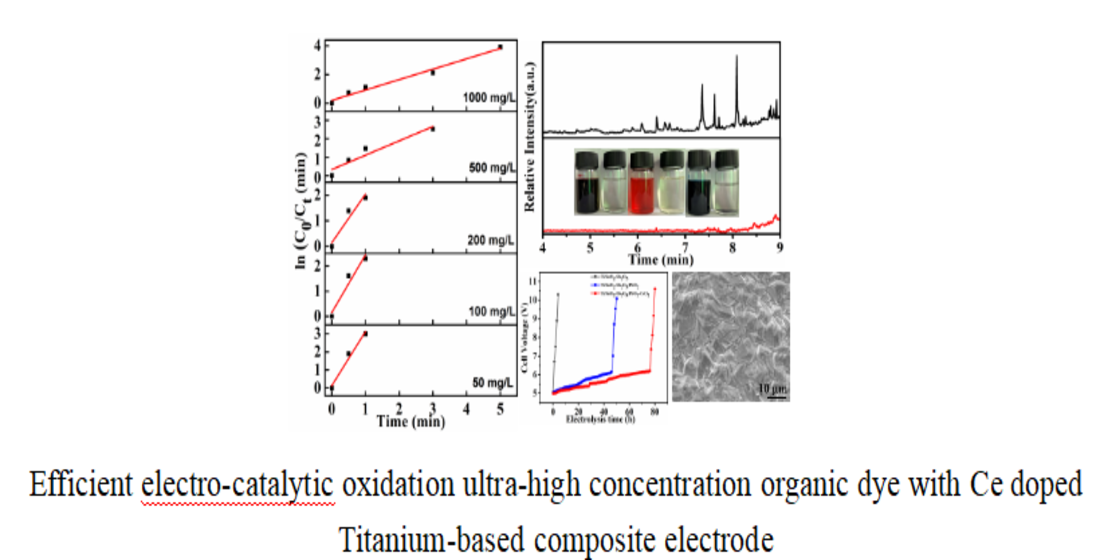
The effect of the initial concentration of MO in the range of 20–1000 mg/L on its removal effciency was investigated (Figure 6a). Although the overall rates were relatively fast (all samples in each group were decolorized in 8 min), the trends of MO degradation rates decreased with increasing initial concentration. The reason can be attributed to the accumulation of a larger number of intermediate products, which prevented the contact of pollutant molecules with the active sites of the electrode surface, and therefore the degradation rate was reduced when the initial concentration of MO was increased.
The fitting equations of degradation kinetics under different MO concentration were calculated from the fitting curve and shown in Figure 6b. Due to the too fast decolorization rate for a low concentration MO solution, there are fewer points to be collected for the linear fitting curve. The fitting curves at all concentrations were approximate straight lines, which indicated the pseudofirst-order kinetic characteristics of these electro-catalytic degradation reactions. The degradation efficiency and kinetics curves for MB and NR solutions at different concentrations are shown in Figure 7 and Figure 8, and the results revealed the same change trend as the degradation of methyl orange. The kinetic parameters for the degradation of three organic dyes (1 g/L) are listed in Table 1. Among the three dyes, MB has the smallest kinetic parameter for degradation, while MO and NR have more larger parameters. From the above results, it can be confirmed that azo dyes have more fast degradation rates than large phenothiazine aromatic dyes during the electro-catalytic degradation process with the composite electrode, which was consistent with the previous results.
3.4. Effect of pH on the Degradation Efficiency of Different Organic Dyes
Because of the pH response properties of the dyes described above, the change of the target molecular structure under different pH systems may lead to different degradation efficiency. As shown in Figure 9, the electro-catalytic degradation efficiency of the three dyes was significantly different with the change of pH. The degradation efficiency of MO decreased with increasing pH, while MB and NR showed an inverse variation trend. The degradation efficiency of MO can reach 100% in an acid environment with a pH of 2, while the degradation efficiency was only 29% in an alkaline environment with a pH of 12. However, the degradation efficiency of NR and MB was 100% and 65.1% respectively in the same alkaline environment, as well as 28.4% and 9.5% respectively in a similar acidic environment. This may be closely related to the structural properties of the three dyes. The chromogenic group of MO is negatively charged and belongs to an anionic dye, while the chromogenic group of MB and NR is positively charged and belongs to a cationic dye. Because the cationic dye may form quaternary amine bases and change its own structure in the reaction system with high pH values, it is more helpful for MB and NR to be electro-catalytically degraded under alkaline condition. MO, on the other hand, is more suitable for acidic conditions.
3.5. Analyzation of the Degraded Product During Electro-Catalytic Degradation
On the basis of the experiments results presented herein, it can be inferred that the organic molecules in the high-concentrationdye solution have been degraded by electro-catalytic oxidation. To evaluate the degree of organic molecular degradation and the specific reaction process, the index of TOC and COD, as well as the degradation intermediates of the degraded Solution were analyzed. As shown in Table 2 and Table 3, TOC and COD have been significantly reduced in the degraded solution indicating that the total content of organic matter and oxygen consumption in the solution have been greatly reduced. At the same time, the degraded samples were analyzed with GC-MS to identify possible intermediates. As shown in Figure 10, compared with three blank samples, the intensity of diffraction peaks for the degraded samples were significantly weakened at the corresponding time, which is strong evidence of organic molecules degradation. According to the preliminary comparison from the database, the peaks that appeared later than 7 minutes in the gas chromatogram were regarded as related derivative reagent products because they were reflected both in the samples and blanks of the three dye solutions due to the precision of the derivatization reagents utilized for the experimental results. Therefore, the diffraction peaks in the gas chromatograms appeared less than 7 minutes and were analyzed by mass spectrometry. Among these degraded solutions, NR showed the best degradation effect. According to the chemical substance standard database, NR standard mass spectrometry has maximum peak strength at 252 (m/z), but the degraded sample has maximum peak strength at 190 (m/z) and more peak groups appeared below 100 (m/z) that were usually identified as small fragment ions (Tab. S2), further confirming that the target object has been degraded during electro-catalytic oxidation. There was a similar result for MB and MO degradation, for example, some new peak groups appeared at a low m/z area, as well as the diffraction peak intensity decreases at a high m/z area, revealing that the initial dye molecules have been preliminarily degraded into small molecular groups (Figure 10 a-c-e). At the same time, the results of TOC and COD analysis for the degraded solutions also supported this effective degradation, although small TOC can still be determined in the degraded system, which can be recognized as intermediate products Combined with common small molecule fragment data from mass spectrometry, the possible degradation pathways of the three dyes were analyzed and the partial possible degraded products in the above three samples were listed (Figure 11).
3.6. Accelerated Lifetime Tests
The cycled time of the electrode is crucial for the product, which directly determined its application range. In general, the electrode cycle time is evaluated by accelerated lifetime tests [42]. The test conditions were kept with 0.5 A·cm-2 current density and 0.5 M H2SO4 electrolyte at room temperature. Generally, when the loop voltage reaches more than 10 v, it is regarded the end point of the electrode-accelerated life experiment (Figure 12). Without the active layer of PbO2 on the outer surface of the electrode, the Ti/SnO2-Sb2O5 electrode could only survive for 4.3 h in the accelerated lifetime test. This experimental result showed that the matrix of the electrode without active coating had been oxidated, resulting in a rapid increase in loop voltage. On the contrary, when the metal element cerium was doped onto the Ti/SnO2-Sb2O5 electrode or Ti/SnO2-Sb2O5/PbO2 electrode, the lifetime of the electrodes increased over 40 h and 80 h respectively, implying that the option of Ce doped played an important role in enhancing the cycled time of the Ti/SnO2-Sb2O5/PbO2 anode. As discussed in the previous experiment, after the active layer of Ce-doped PbO2, the surface morphology of the electrode was more dense and it was not easy to crack or fall off during the electrolysis process, so it can help prevent rapid rise in electrode groove voltage and prolong its life. The long lifetime indicated a promising application prospect for the Ti/SnO2-Sb2O5/Ce-PbO2 anode in industry. At the same time, the morphology of the electrode after the accelerated life test was also analyzed. Compared with the morphology of the electrode before the accelerated lifetime test, the dense morphology of the electrode surface was damaged after the test and the effect of the loop current on the electrode plate substrate led to increased of the electrode resistance and the loop voltage. Therefore, it is important to design a reasonable composition of electrode coating to improve its lifetime and catalytic effect of the target electrode. At the same time, the degradation effect of the composite electrode on organic dyes was compared with the literature (Table 4), which showed that the composite electrode had excellent performance in terms of degradation time, TOC and COD removal efficiency in the face of high concentration dye wastewater.
4. Conclusions
In this study, the Ti/SnO2-Sb2O5/Ce-PbO2 electrode was prepared by a two-step thermal decomposition and electrodeposition process. The electrode with Ce doped in the active layer of PbO2 has a more dense structure and shows an oxygen evolution potential of 1.62 V and an accelerated life time of 80 h compared to the undoped modified electrode. Methyl orange, methylene blue, and neutral red solutions with concentrations up to 1g/L can be rapidly degraded, and the initial rates of decrease in TOC and COD are more than 98%. The results of GC-MS showed that neutral red decomposed more thoroughly and possible degradation pathways and intermediate molecules were given, which would eventually decompose into CO2 and H2O of the above three dyes. The results indicated that the prepared Ti/SnO2-Sb2O5/Ce-PbO2 electrode had great prospects for the degradation of different types of pollutants with high concentration.
Author Contributions
The manuscript was written through contributions of all authors. All authors have given approval to the final version of the manuscript.
Acknowledgments
This work was financially supported by the local service special project of Shaanxi Provincial Department of Education (23JC003), College student innovation and entrepreneurship project (S202310721064) Shaanxi Province key research and development projects of coordination between the government office and city (2022GDTSLD-27).
Conflicts of interest
There are no conflicts to declare.
References
- X. Chang, S. S. Thind, M. Tian, M. M. Hossain and A. Chen, Electrochimica Acta, 2015, 173, 728-735.
- W. Subramonian, T. Y. Wu and S.-P. Chai, Journal of Alloys and Compounds, 2017, 695, 496-507.
- J.-J. Lu, Y.-H. Gu, Y. Chen, X. Yan, Y.-J. Guo and W.-Z. Lang, Separation and Purification Technology, 2019, 210, 737-745.
- J. Wu, Y. Liu, X. Yang, J. Wang and J. Yang, Chinese Chemical Letters, 2021, 32, 2503-2508.
- P. Wang, H. Tang, Y. Ao, C. Wang, J. Hou, J. Qian and Y. Li, Journal of Alloys and Compounds, 2016, 688, 1-7.
- C. Belda Marín, C. Egles, J. Landoulsi and E. Guénin, 2022, 12, 9152.
- S. R. Hormozi Jangi, H. Khoshalhan Davoudli, Y. Delshad, M. R. Hormozi Jangi and A. R. Hormozi Jangi, Surfaces and Interfaces, 2020, 21, 100771.
- J. Y. Zheng, J. He, C. B. Han, G. Huang, B. C. Sun, W. K. Zhao, Y. Wang, L. Sun, J. Si and H. Yan, International Journal of Biological Macromolecules, 2023, 237, 124152.
- A. Molla and J. H. Youk, Dyes and Pigments, 2022, 202, 110237.
- Z. Deng, S. Xu, C. Liu, X. Zhang, M. Li and Z. Zhao, Nano Research, 2024, 17, 949-959.
- H. W. Lim, D. K. Cho, J. H. Park, S. G. Ji, Y. J. Ahn, J. Y. Kim and C. W. Lee, ACS Catalysis, 2021, 11, 12423-12432.
- V. Krstić and B. Pešovski, Hydrometallurgy, 2019, 185, 71-75.
- I. M. D. Gonzaga, A. R. Dória, R. S. S. Castro, M. R. R. Souza, M. A. Rodrigo, K. I. B. Eguiluz and G. R. Salazar-Banda, Electrochimica Acta, 2022, 426, 140782.
- H. Lv, S. Wang, J. Li, C. Shao, W. Zhou, X. Shen, M. Xue and C. Zhang, Applied Surface Science, 2020, 514, 145943.
- X. Sui, X. Duan, F. Xu and L. Chang, Journal of the Taiwan Institute of Chemical Engineers, 2019, 100, 74-84.
- L. Wu, C. Zhang, Y. Sun, Y. Wang, B. Lian, Y. Chen, Y. Tu and T. D. Waite, Chemical Engineering Journal, 2022, 450, 138188.
- H. Bian, Y. Tian, C. Lee, M.-F. Yuen, W. Zhang and Y. Y. Li, ACS Applied Materials & Interfaces, 2016, 8, 28862-28871.
- Y. Fan, H. Li, X. He, Y. Huang, C. Sun, T. Zhu, H. Liu, E. Huangzhang, F. Sun and J. Nan, ACS Applied Energy Materials, 2022, 5, 10034-10044.
- D. Lakshmi, M. I. Diana, S. Jayapandi, P. C. Selvin and P. Balraju, Journal of Materials Science, 2023, 58, 15471-15484.
- C. Tang, Z. Liu, D. Cui, L. Yu, J. Xue and X. Yin, Electrochimica Acta, 2021, 399, 139398.
- W. Tan, A. R. Bowring, A. S. Babadi, A. C. Meng, R. Tang-Kong, M. D. McGehee and P. C. McIntyre, 2020, 7, 1902054.
- I. Kurisawa, M. Shiomi, S. Ohsumi, M. Iwata and M. Tsubota, Journal of Power Sources, 2001, 95, 125-129.
- F. A. Rodríguez, E. P. Rivero and I. González, MethodsX, 2018, 5, 1613-1617.
- H. Ma, X. Wang, Y. Fu, Y. Zhang, C. Ma, X. Dong and Z. Yu, Journal of Solid State Electrochemistry, 2019, 23, 1767-1777.
- J.-H. Lee, J. W. Kim, H.-Y. Kang, S. C. Kim, S. S. Han, K. H. Oh, S.-H. Lee and Y.-C. Joo, Journal of Materials Chemistry A, 2015, 3, 12982-12991.
- H. Beitollahi, H. Mahmoudi-Moghaddam, S. Tajik and S. Jahani, Microchemical Journal, 2019, 147, 590-597.
- M. A. Al-Ghouti, M. A. M. Khraisheh, S. J. Allen and M. N. Ahmad, Journal of Environmental Management, 2003, 69, 229-238.
- Z. Yang, Y. Zhang, W. Zhu, X. Zan, L. Zhang and Y. Liu, Chemosphere, 2020, 255, 126963.
- L. Yang, M. Sheng, H. Zhao, M. Qian, X. Chen, Y. Zhuo and G. Cao, Science of The Total Environment, 2019, 678, 821-829.
- L. Li, Z. Huang, X. Fan, Z. Zhang, R. Dou, S. Wen, Y. Chen, Y. Chen and Y. Hu, Electrochimica Acta, 2017, 231, 354-362.
- Z. Sun, Y. Ni, Y. Wu, W. Yue, G. Zhang and J. Bai, Environmental Science and Pollution Research, 2023, 30, 6262-6274.
- Y.-H. Cui, Y.-J. Feng and Z.-Q. Liu, Electrochimica Acta, 2009, 54, 4903-4909.
- Q. Wang, S. Tu, W. Wang, W. Chen, X. Duan and L. Chang, Colloids and Surfaces A: Physicochemical and Engineering Aspects, 2021, 628, 127244.
- H. Wang, Z. Li, F. Zhang, Y. Wang, X. Zhang, J. Wang and X. He, Separation and Purification Technology, 2021, 266, 118600.
- C. Wang, Y. Yu, L. Yin, J. Niu and L.-A. Hou, Chemosphere, 2016, 163, 584-591.
- M. Zheng, J. Ni, F. Liang, M.-C. Wang and X. Zhao, Journal of Alloys and Compounds, 2016, 663, 371-378.
- C. Wang, J. Niu, L. Yin, J. Huang and L.-A. Hou, Chemical Engineering Journal, 2018, 346, 662-671.
- X. Duan, Q. Wang, S. Tu, W. Wang, X. Sui and L. Chang, Separation and Purification Technology, 2022, 282, 120003.
- S. Schlichter, K. Sapag, M. Dennehy and M. Alvarez, Journal of Environmental Chemical Engineering, 2017, 5, 5207-5214.
- Z. Ma, C. Liu, C. Srinivasakannan, L. Li and Y. Wang, Arabian Journal of Chemistry, 2023, 16, 104767.
- P. Haouzi, M. McCann, N. Tubbs, A. Judenherc-Haouzi, J. Cheung and F. Bouillaud, Toxicological Sciences, 2019, 170, 82-94.
- R. Berenguer, J. M. Sieben, C. Quijada and E. Morallón, ACS Applied Materials & Interfaces, 2014, 6, 22778-22789.
Figure 1.
XRD patterns of Ti/SnO2-Sb2O5, Ti/SnO2-Sb2O5/PbO2 and Ti/SnO2-Sb2O5/Ce-PbO2 electrodes.(211), (310) and (301) of SnO2 (JCPDS PDF 46–1088), and 2θ=33.9 ° and 38.0 °, which belonged to (002) and (020) of Sb2O5 (JCPDS PDF 33-0110), respectively [30]. Furthermore, the diffraction peaks at 25.4 °, 32.1 °, 36.5 °, 49.2 °, 52.1 °, 58.9 °, 62.7 °, 66.9 ° and 74.5 ° corresponded to the planes (110), (101), (200), (211), (220), (310), (112), (202) and (321) of β-PbO2 of the Ti/SnO2-Sb2O5/PbO2 and Ti/SnO2-Sb2O5/Ce-PbO2 electrode, respectively (JCPDS Card No. 73–0851) [31]. Furthermore, no TiO2 or Ti substrate diffraction peaks were observed, indicating that the surface of the Ti/SnO2-Sb2O5/Ce-PbO2 electrode was completely covered by the β-PbO2 [32].
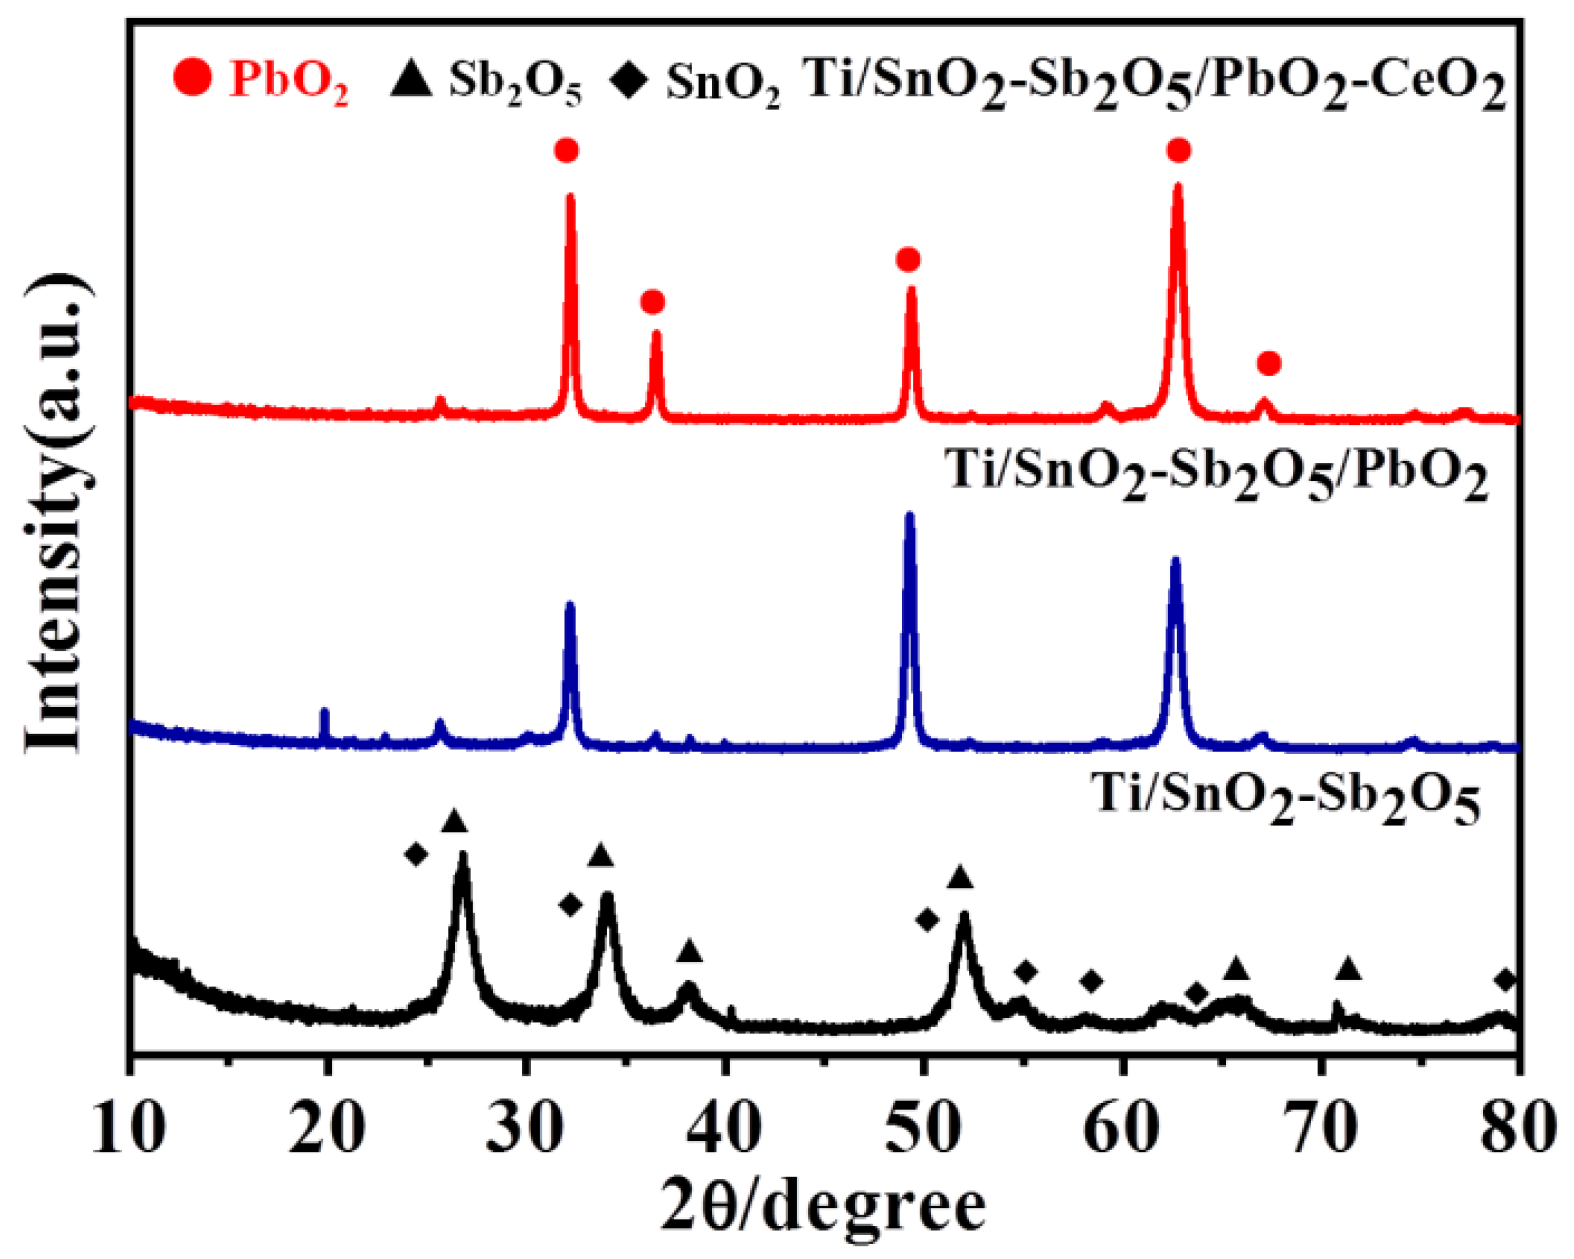
Figure 2.
SEM images of Ti/SnO2-Sb2O5 (a), Ti/SnO2-Sb2O5/PbO2 (b), Ti/SnO2-Sb2O5/Ce-PbO2 (c) electrodes and the energy spectrum of Ti/SnO2-Sb2O5/Ce-PbO2 electrode (d).
Figure 2.
SEM images of Ti/SnO2-Sb2O5 (a), Ti/SnO2-Sb2O5/PbO2 (b), Ti/SnO2-Sb2O5/Ce-PbO2 (c) electrodes and the energy spectrum of Ti/SnO2-Sb2O5/Ce-PbO2 electrode (d).
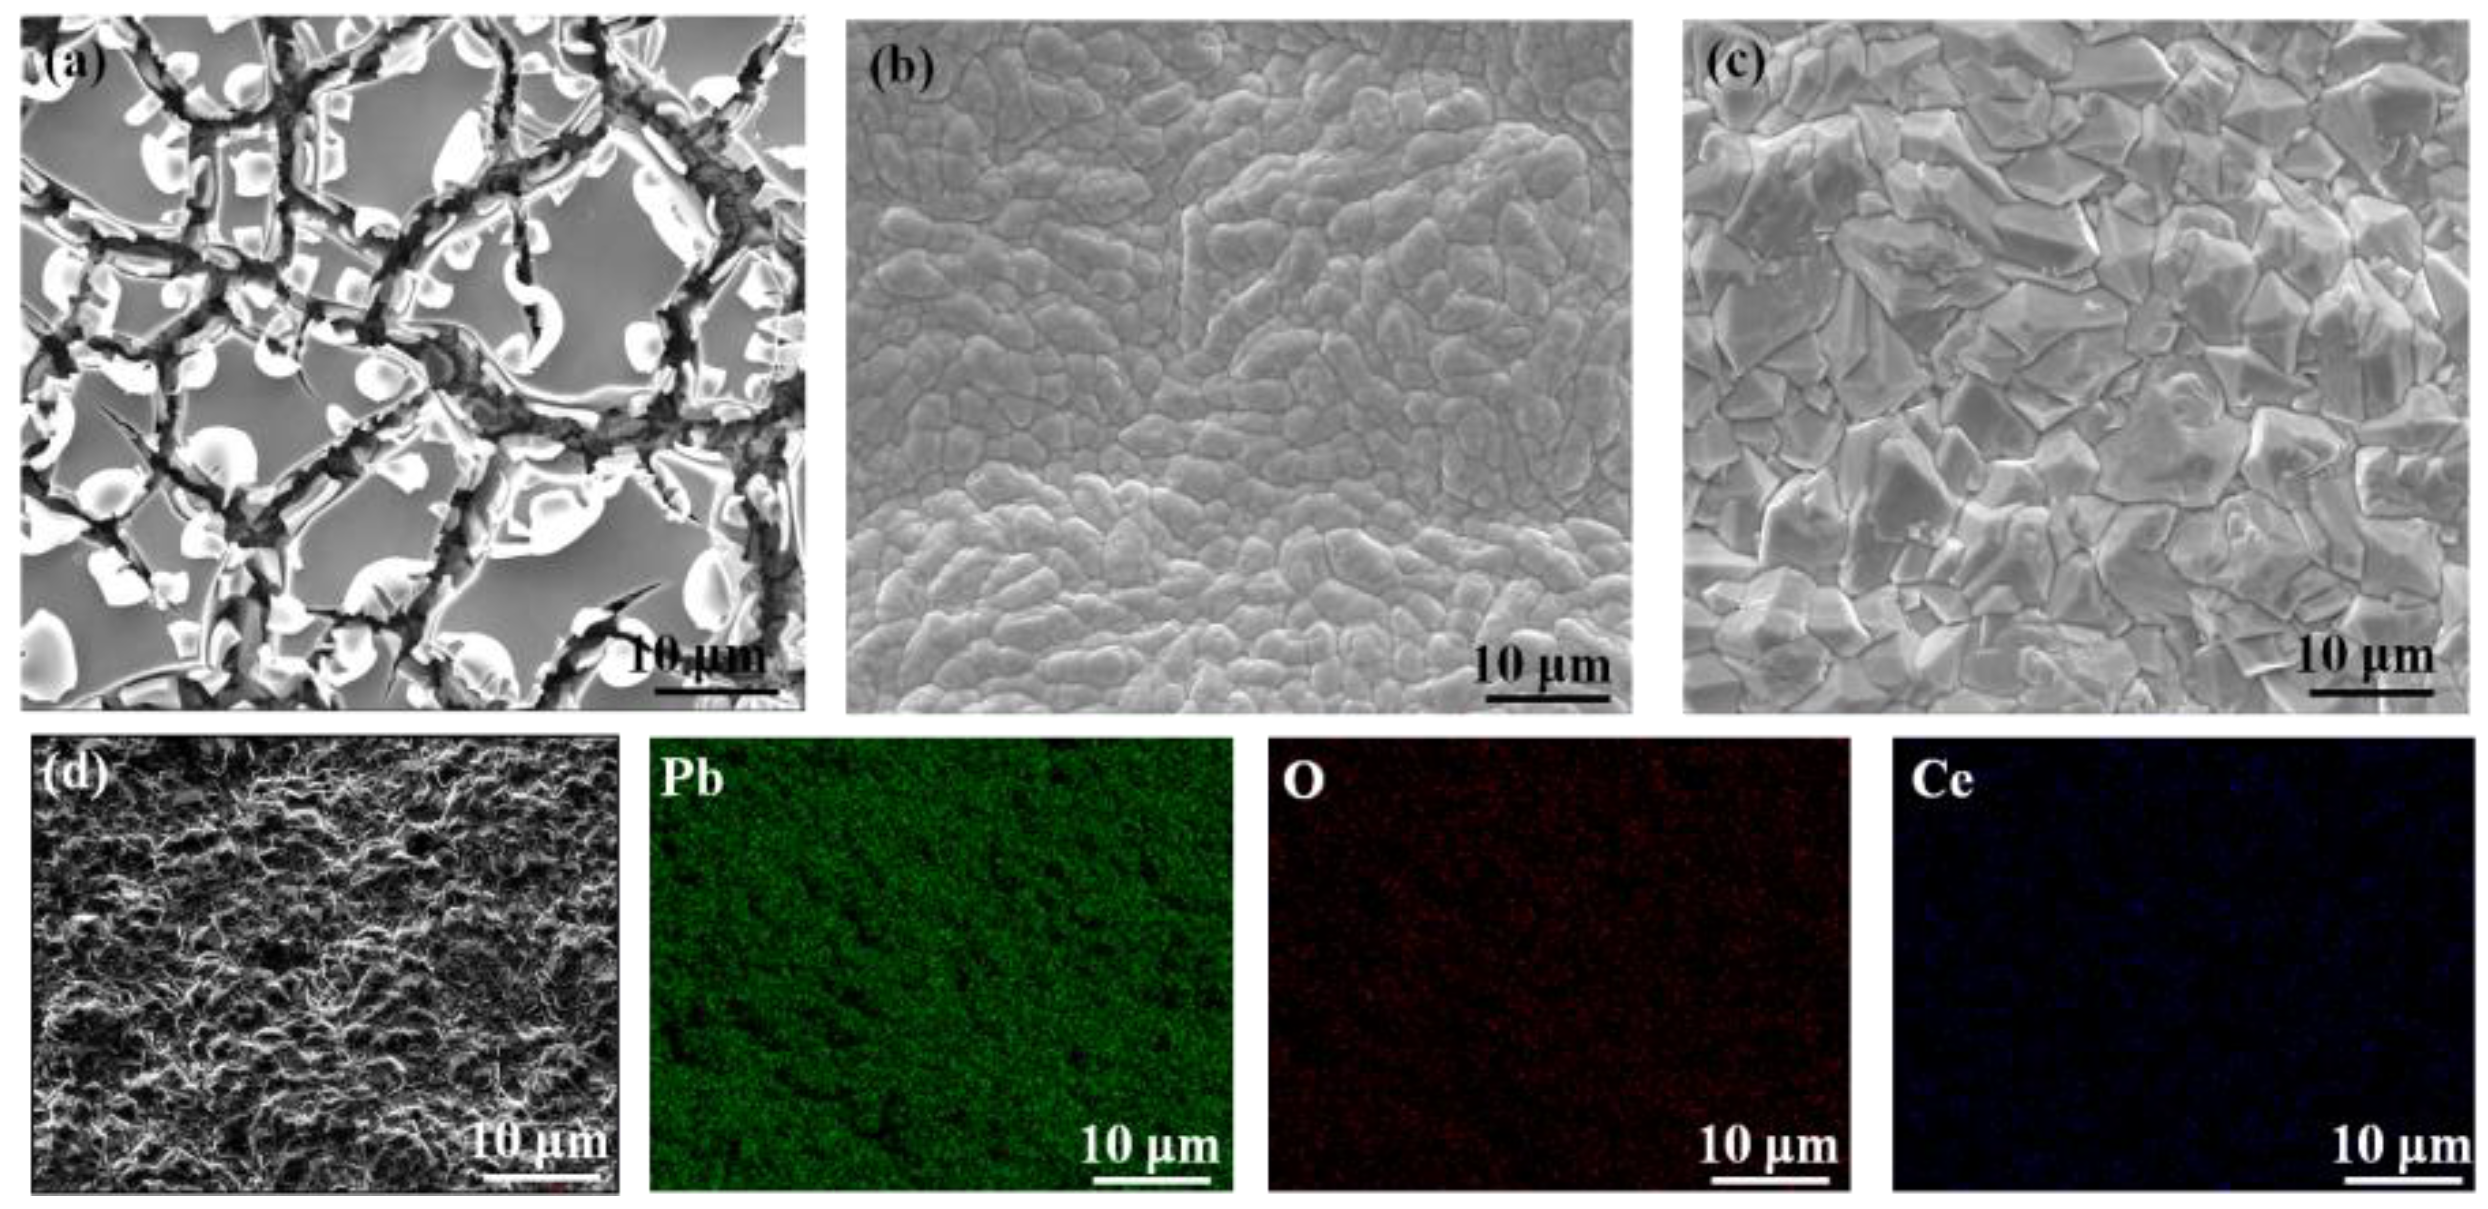
Figure 3.
XPS analysis of Ti/SnO2-Sb2O5/Ce-PbO2 electrode. full spectrum (a), Pb 4f spectra (b) Sn 3d spectra (c), Ce 3d spectra (d) and Sn 3d spectra (e).
Figure 3.
XPS analysis of Ti/SnO2-Sb2O5/Ce-PbO2 electrode. full spectrum (a), Pb 4f spectra (b) Sn 3d spectra (c), Ce 3d spectra (d) and Sn 3d spectra (e).
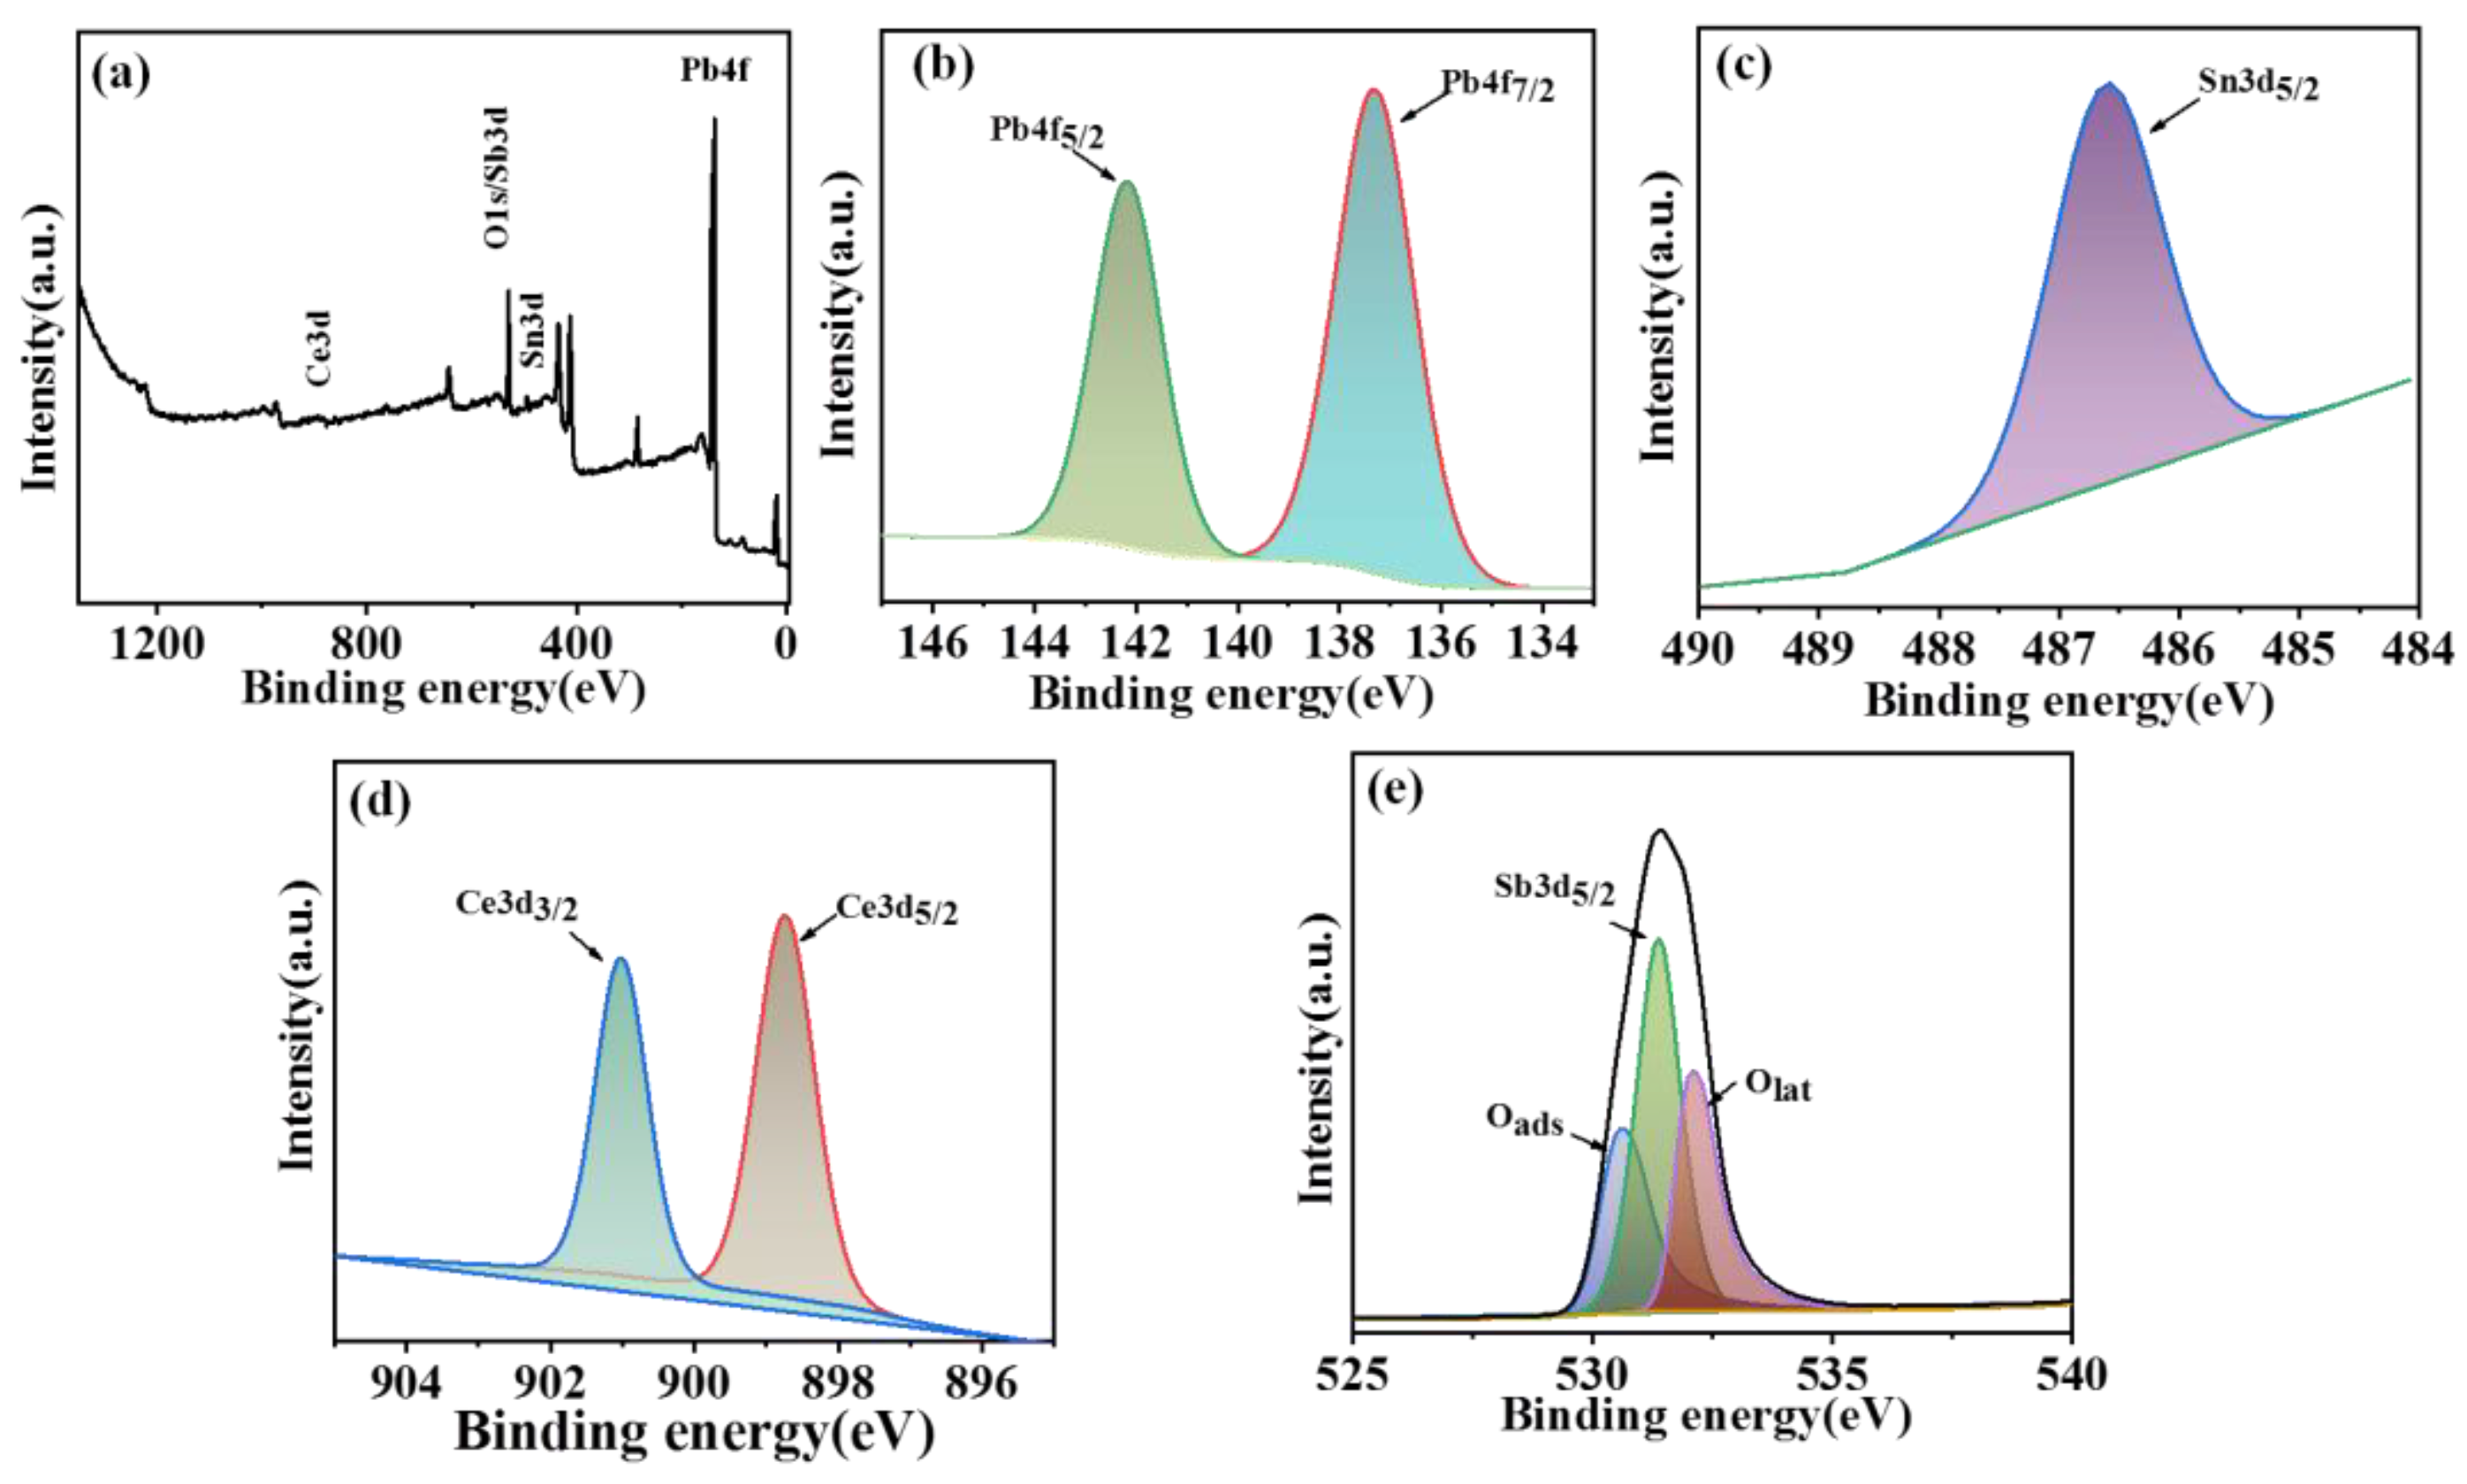
Figure 4.
CV (a) and LSV (b) curves of different electrodes.

Figure 5.
Effect of time on removal rate of different dye with Ti/SnO2-Sb2O5/CeO2/PbO2 electrode and the corresponding UV scanning spectra at different reaction time. Methyl orange (a,b),.methylene blue (c,d), neutral red (e,f).
Figure 5.
Effect of time on removal rate of different dye with Ti/SnO2-Sb2O5/CeO2/PbO2 electrode and the corresponding UV scanning spectra at different reaction time. Methyl orange (a,b),.methylene blue (c,d), neutral red (e,f).
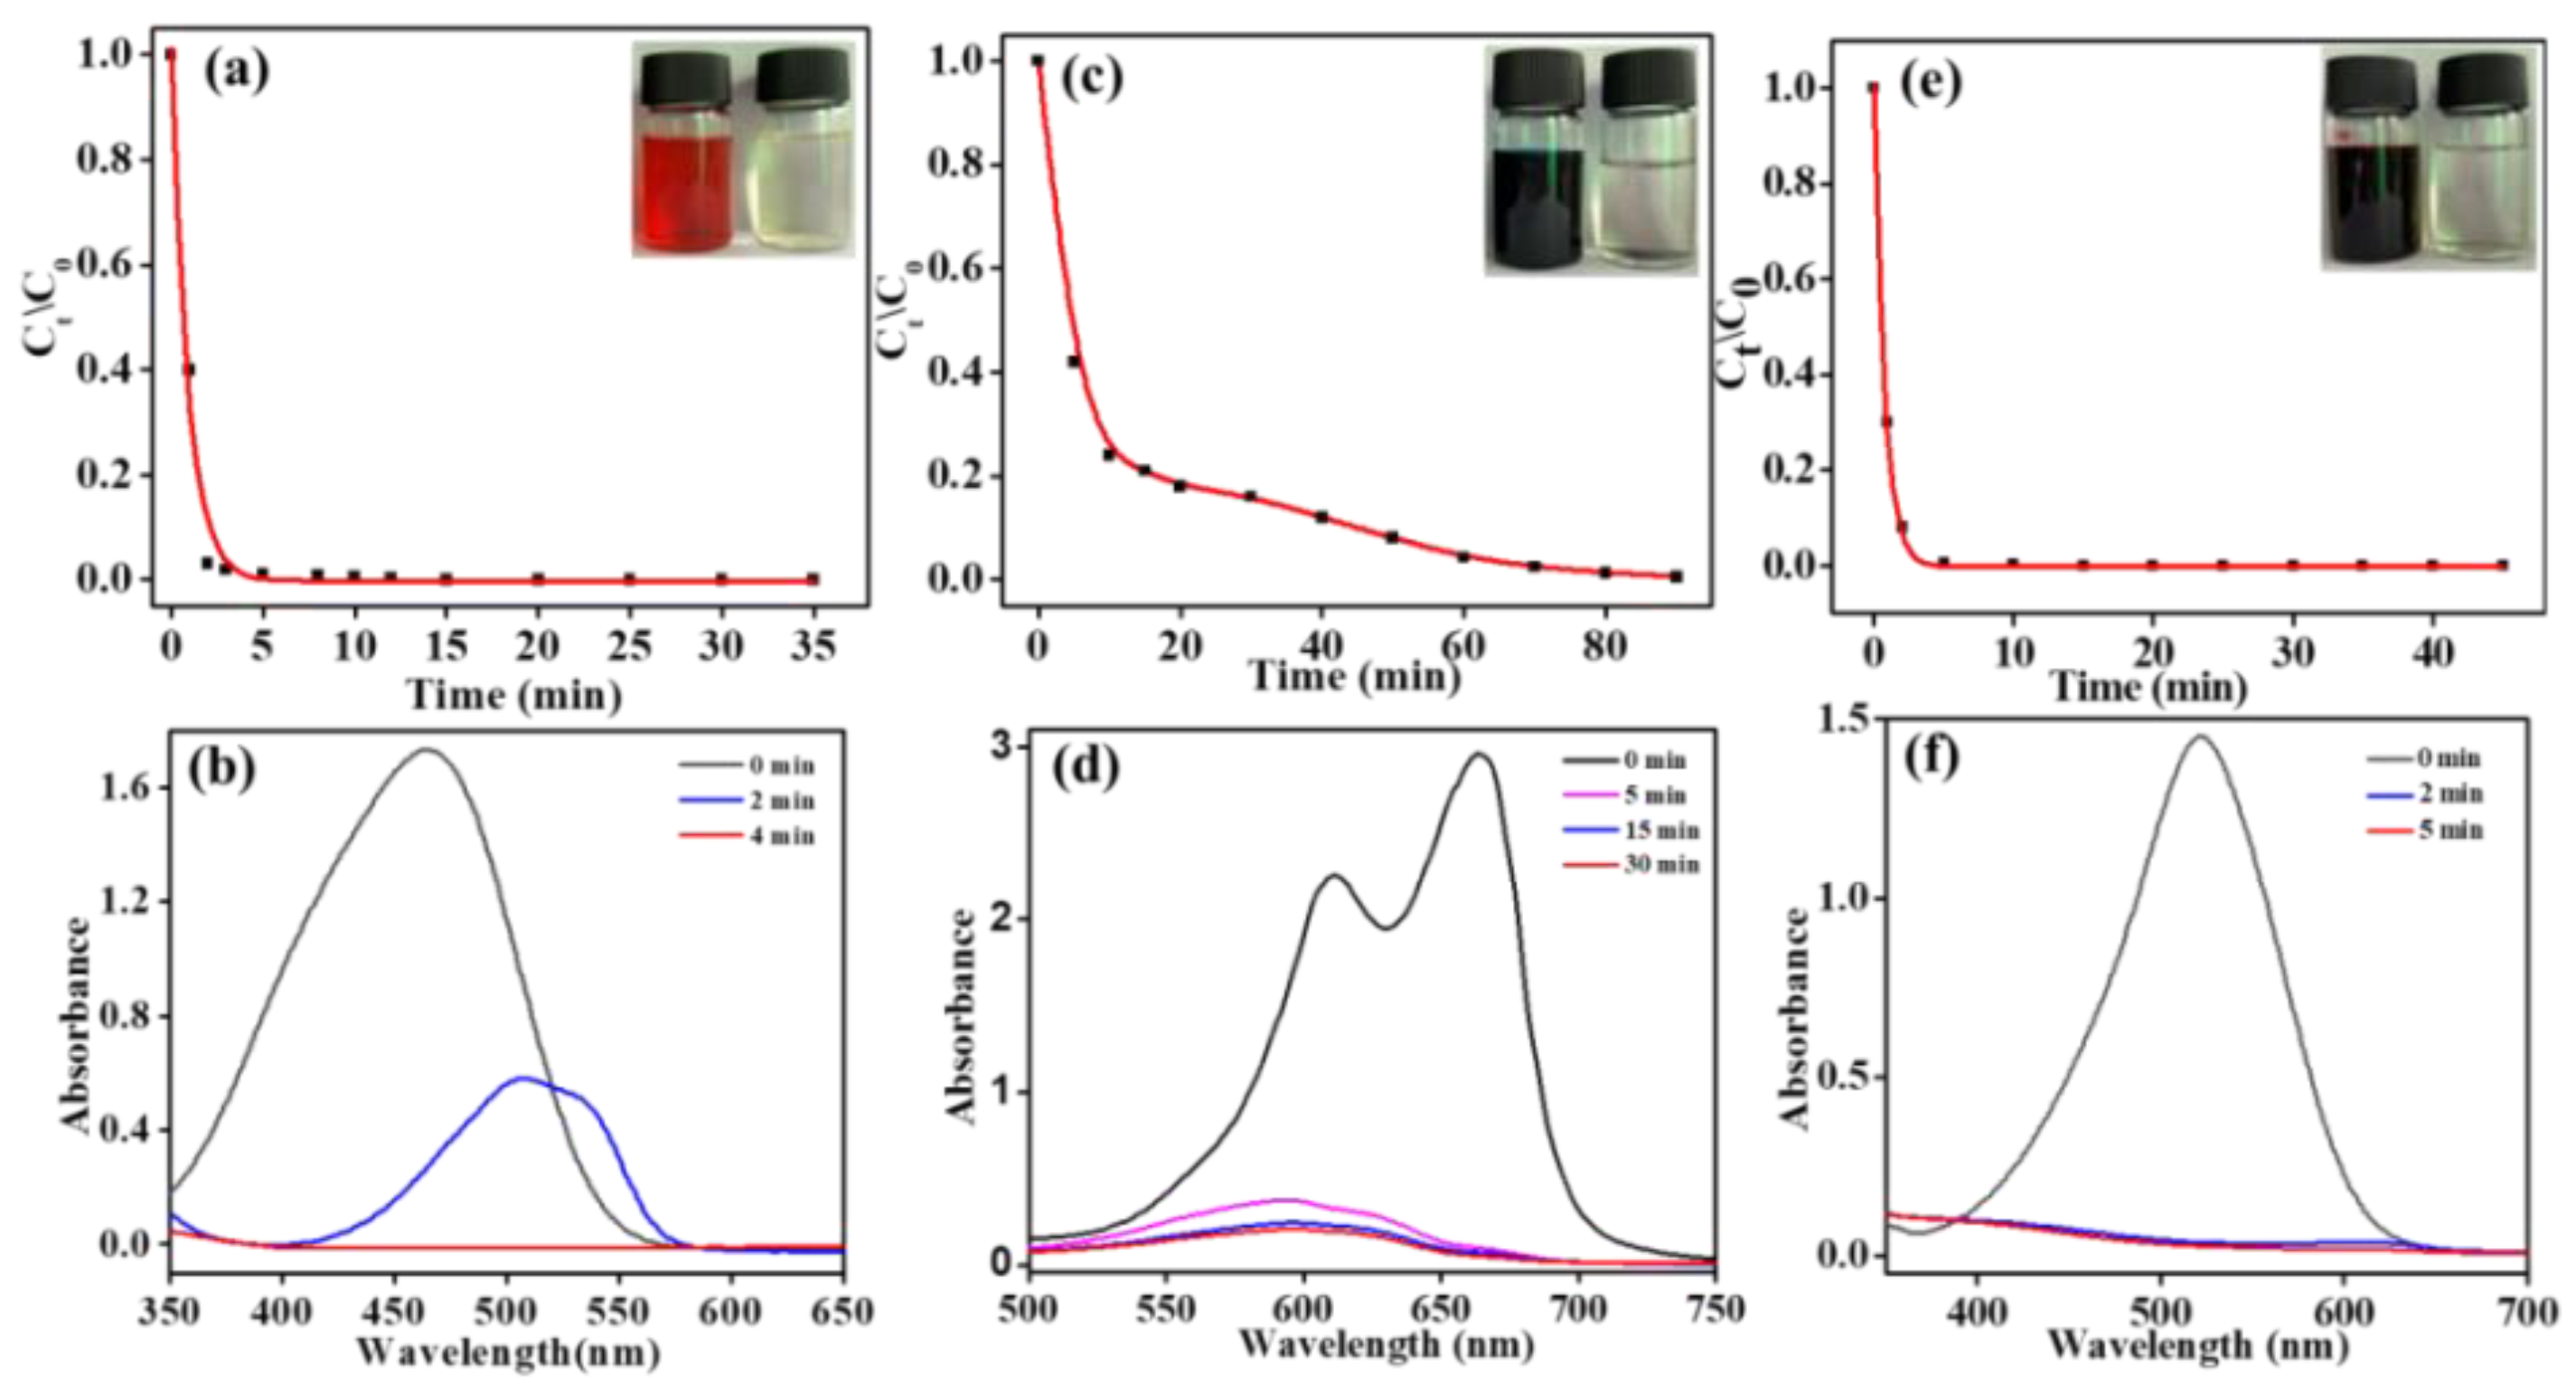
Figure 6.
Effect of initial concentration on the removal of methyl orange (a); pseudo-first order reaction kinetic at different initial concentrations (b).
Figure 6.
Effect of initial concentration on the removal of methyl orange (a); pseudo-first order reaction kinetic at different initial concentrations (b).
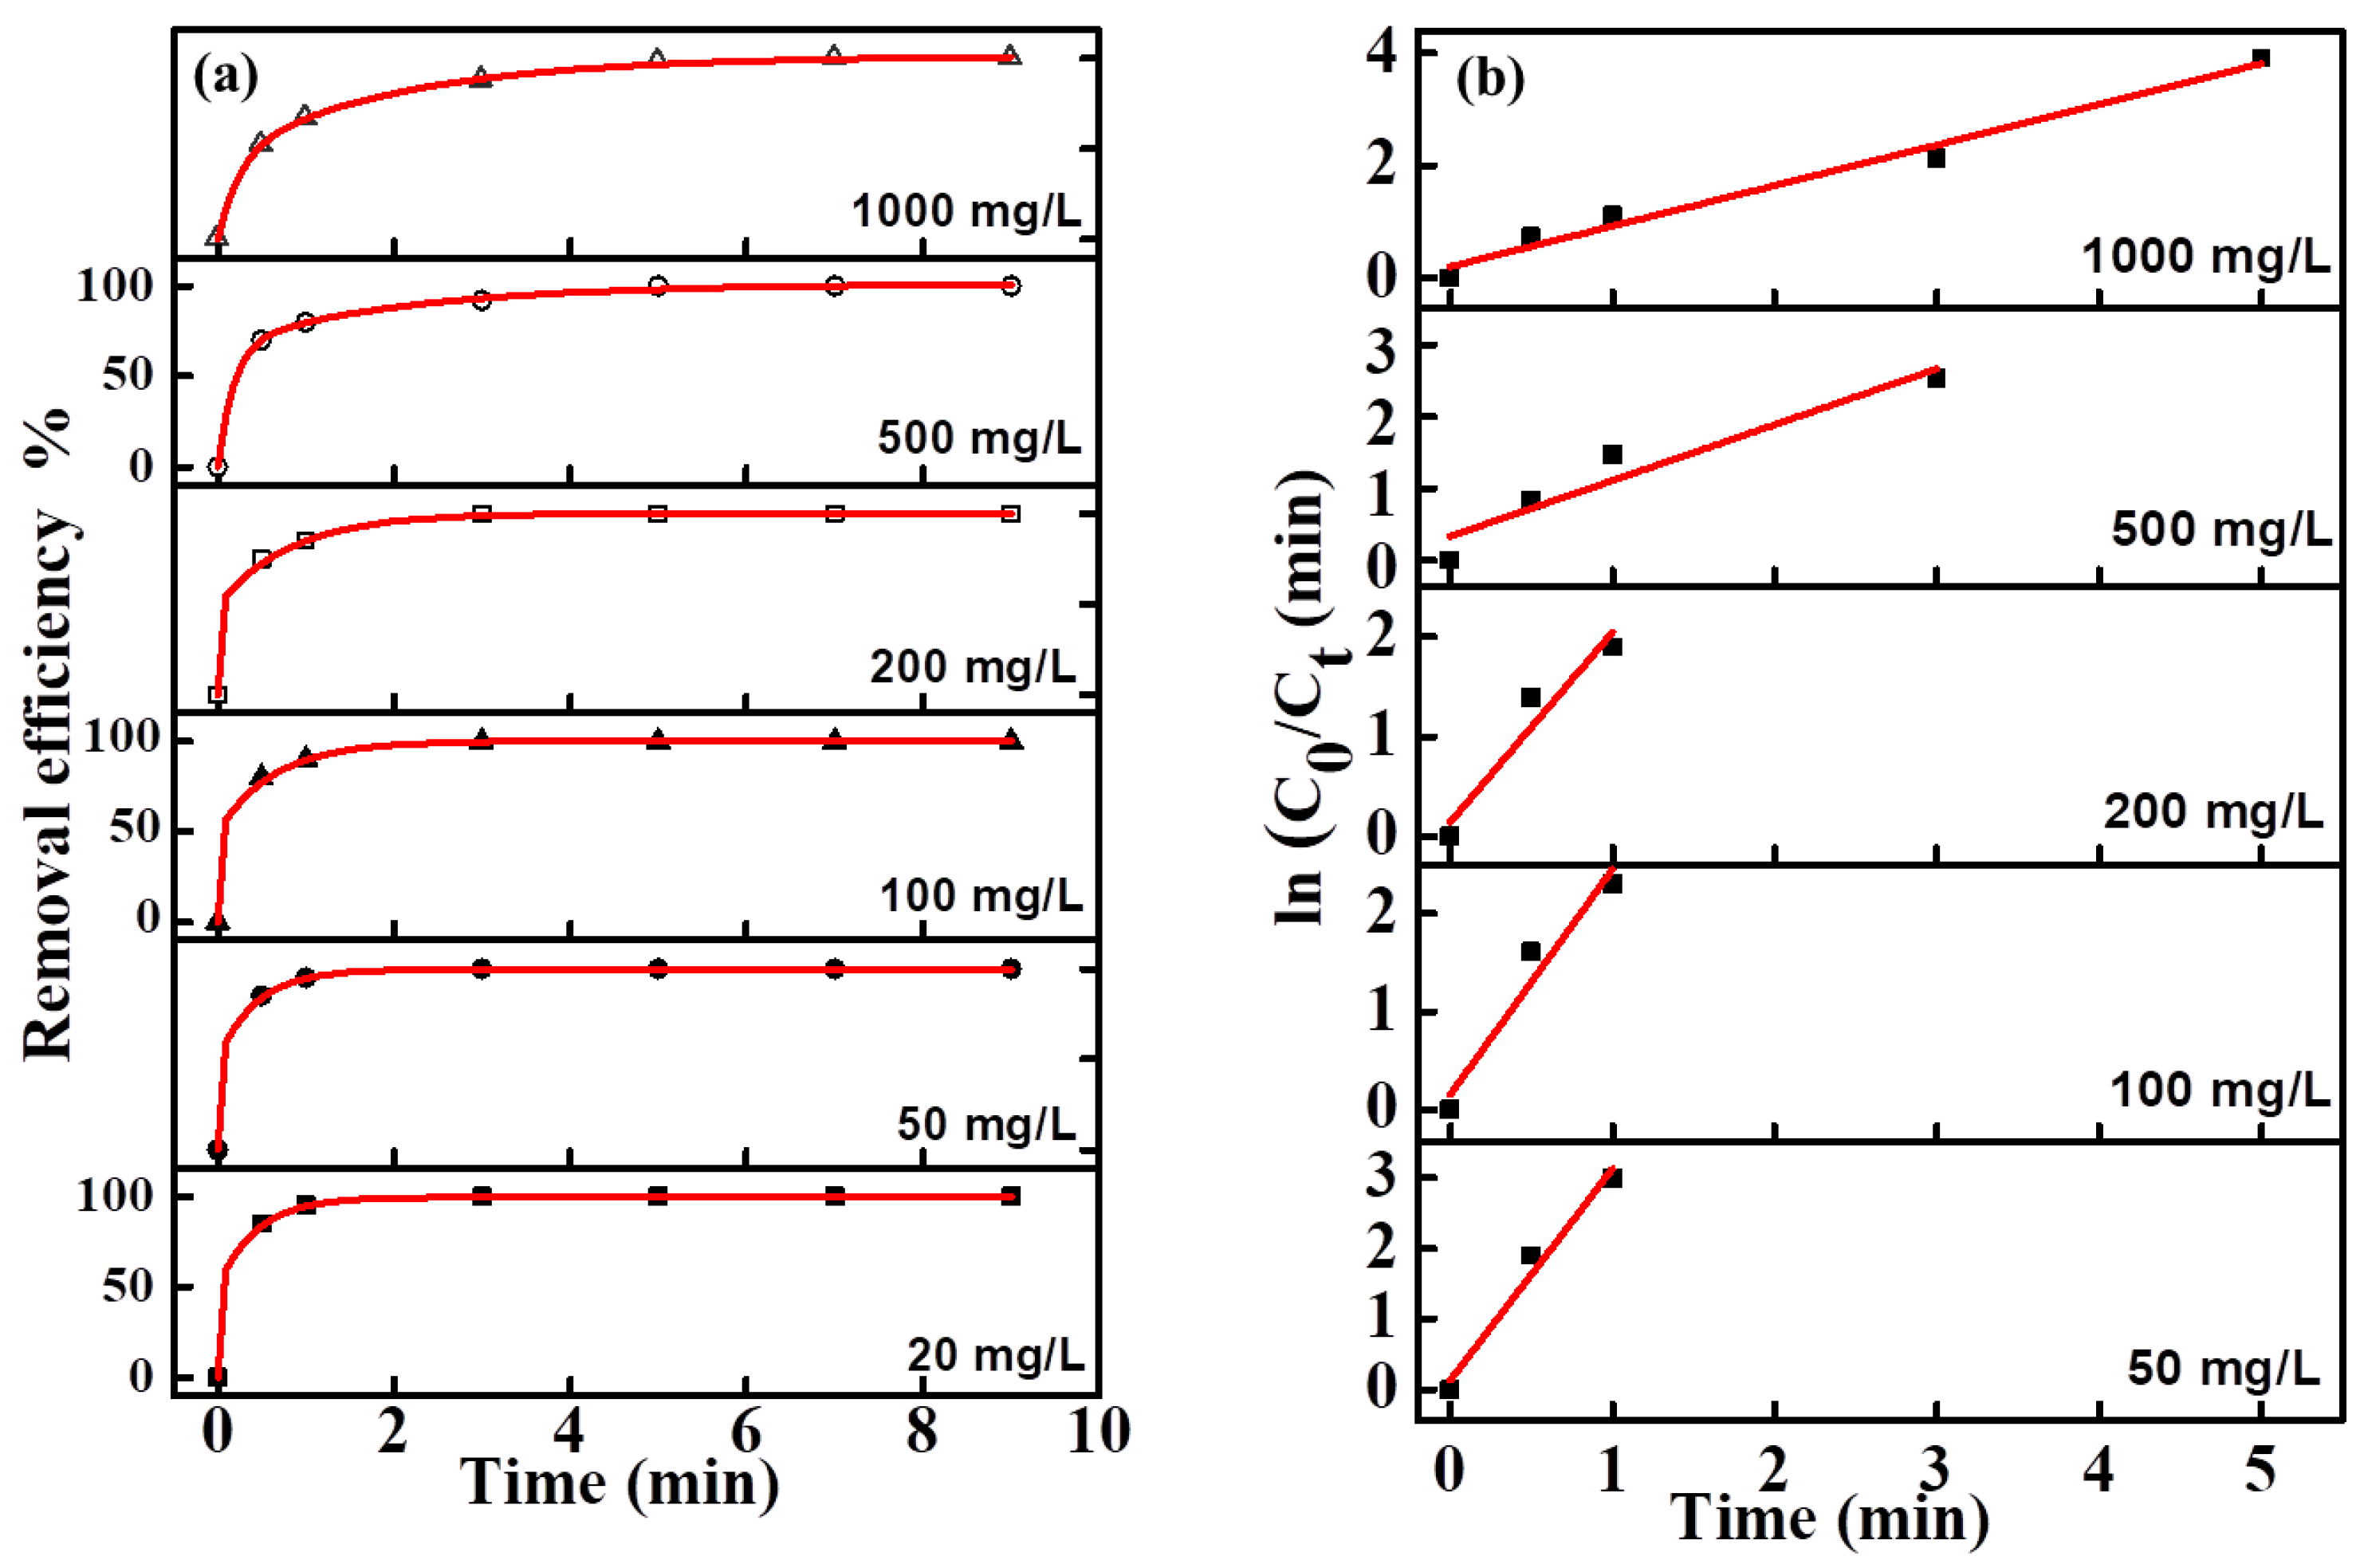
Figure 7.
Effect of initial concentration on the removal of Neutral red (a); pseudo-first order reaction kinetic at different initial concentrations (b).
Figure 7.
Effect of initial concentration on the removal of Neutral red (a); pseudo-first order reaction kinetic at different initial concentrations (b).
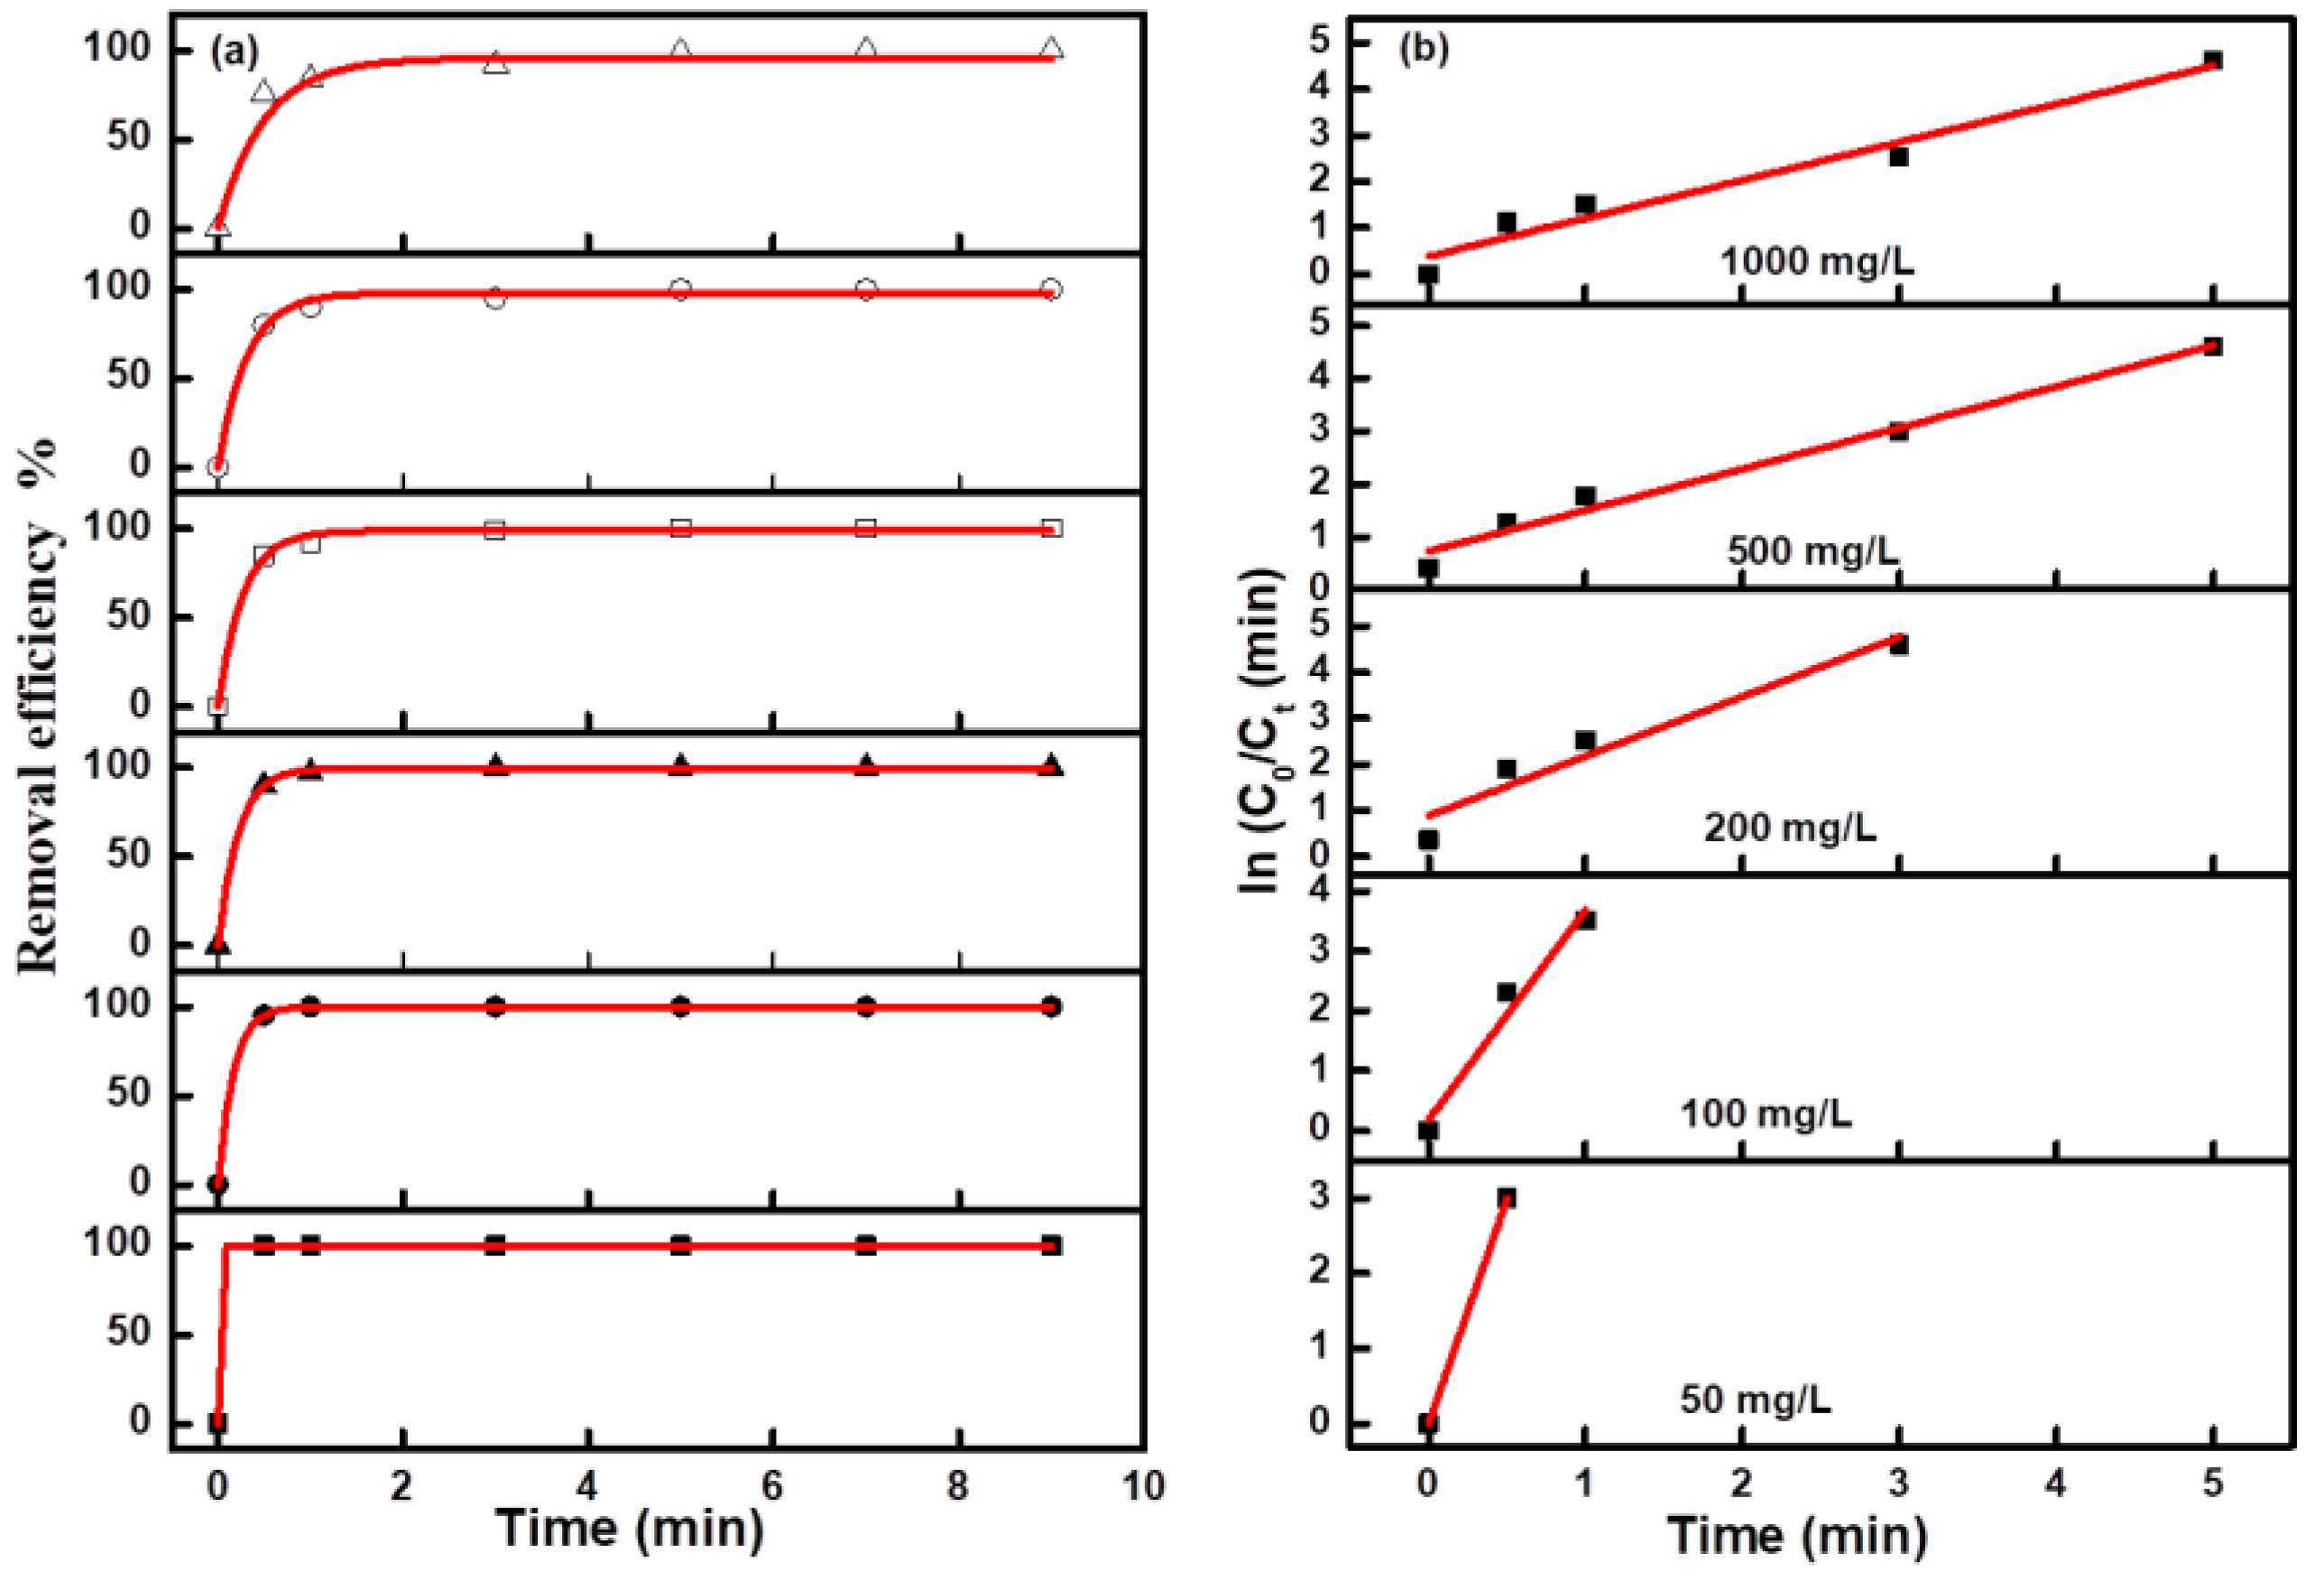
Figure 8.
Effect of initial concentration on the removal of Methylene blue (a); pseudo-first order reaction kinetic at different initial concentrations (b).
Figure 8.
Effect of initial concentration on the removal of Methylene blue (a); pseudo-first order reaction kinetic at different initial concentrations (b).
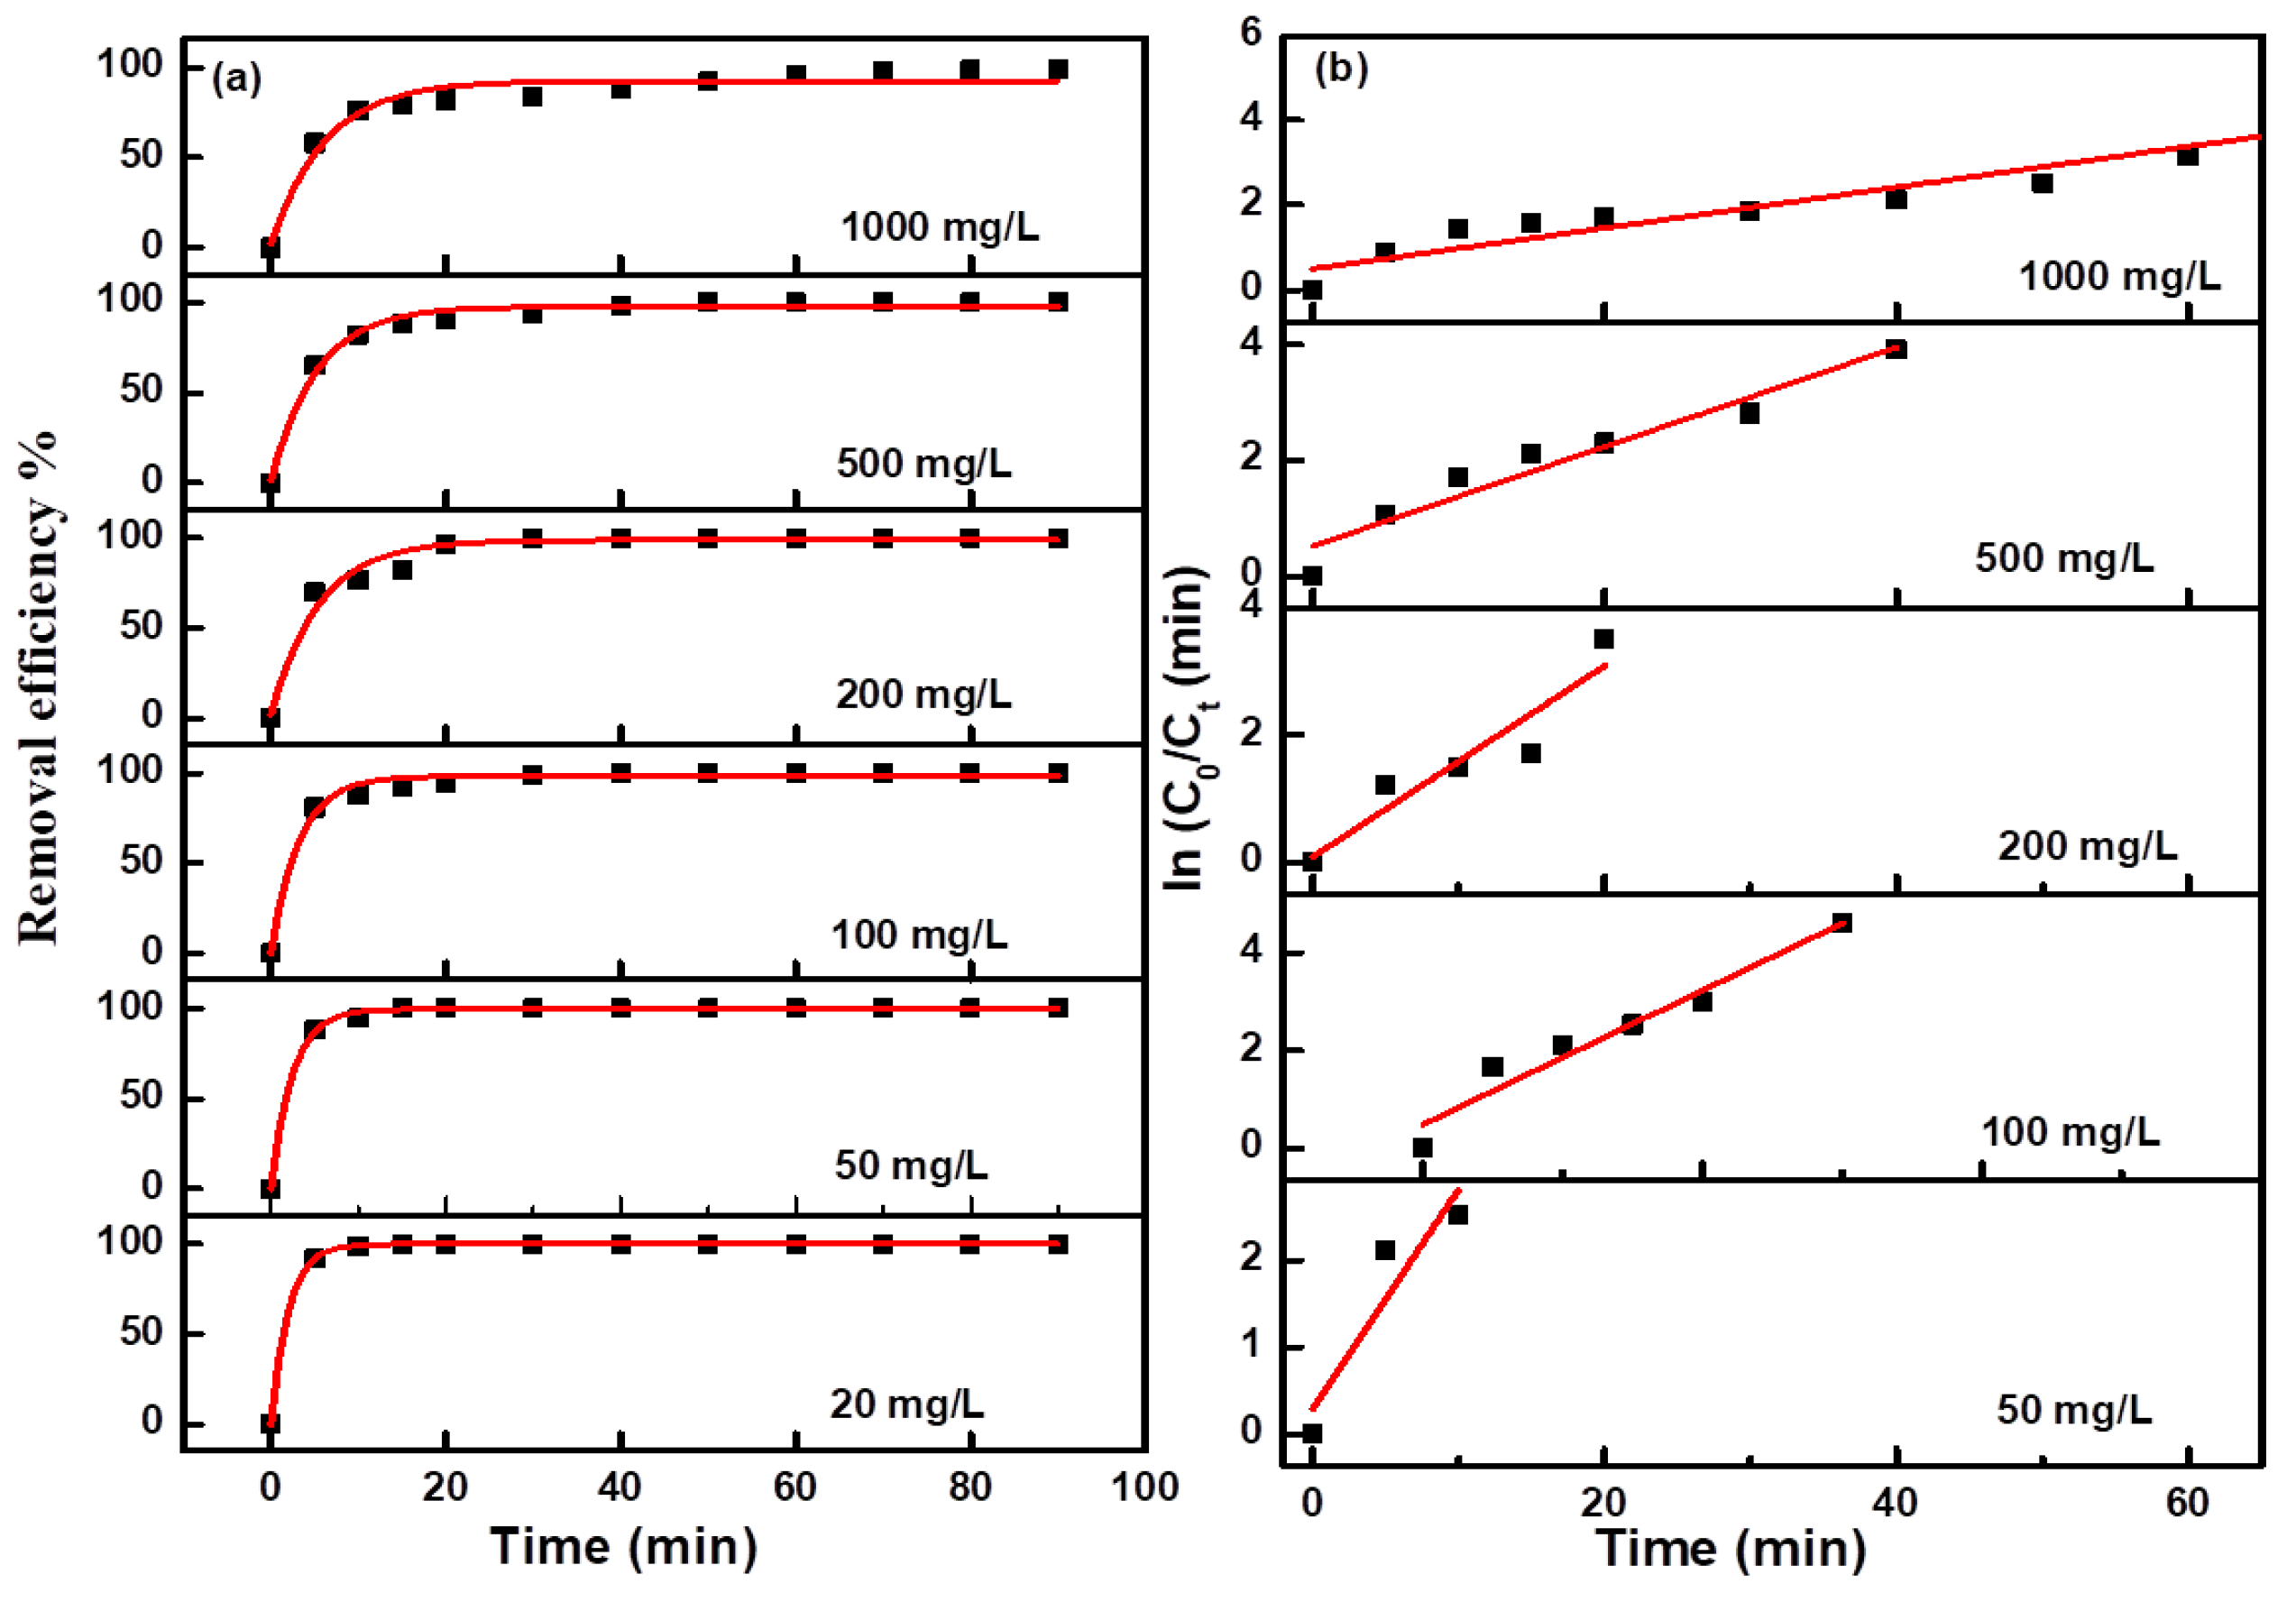
Figure 9.
Effect of pH value on removal rate of different dye with Ti/SnO2-Sb2O5/CeO2/PbO.
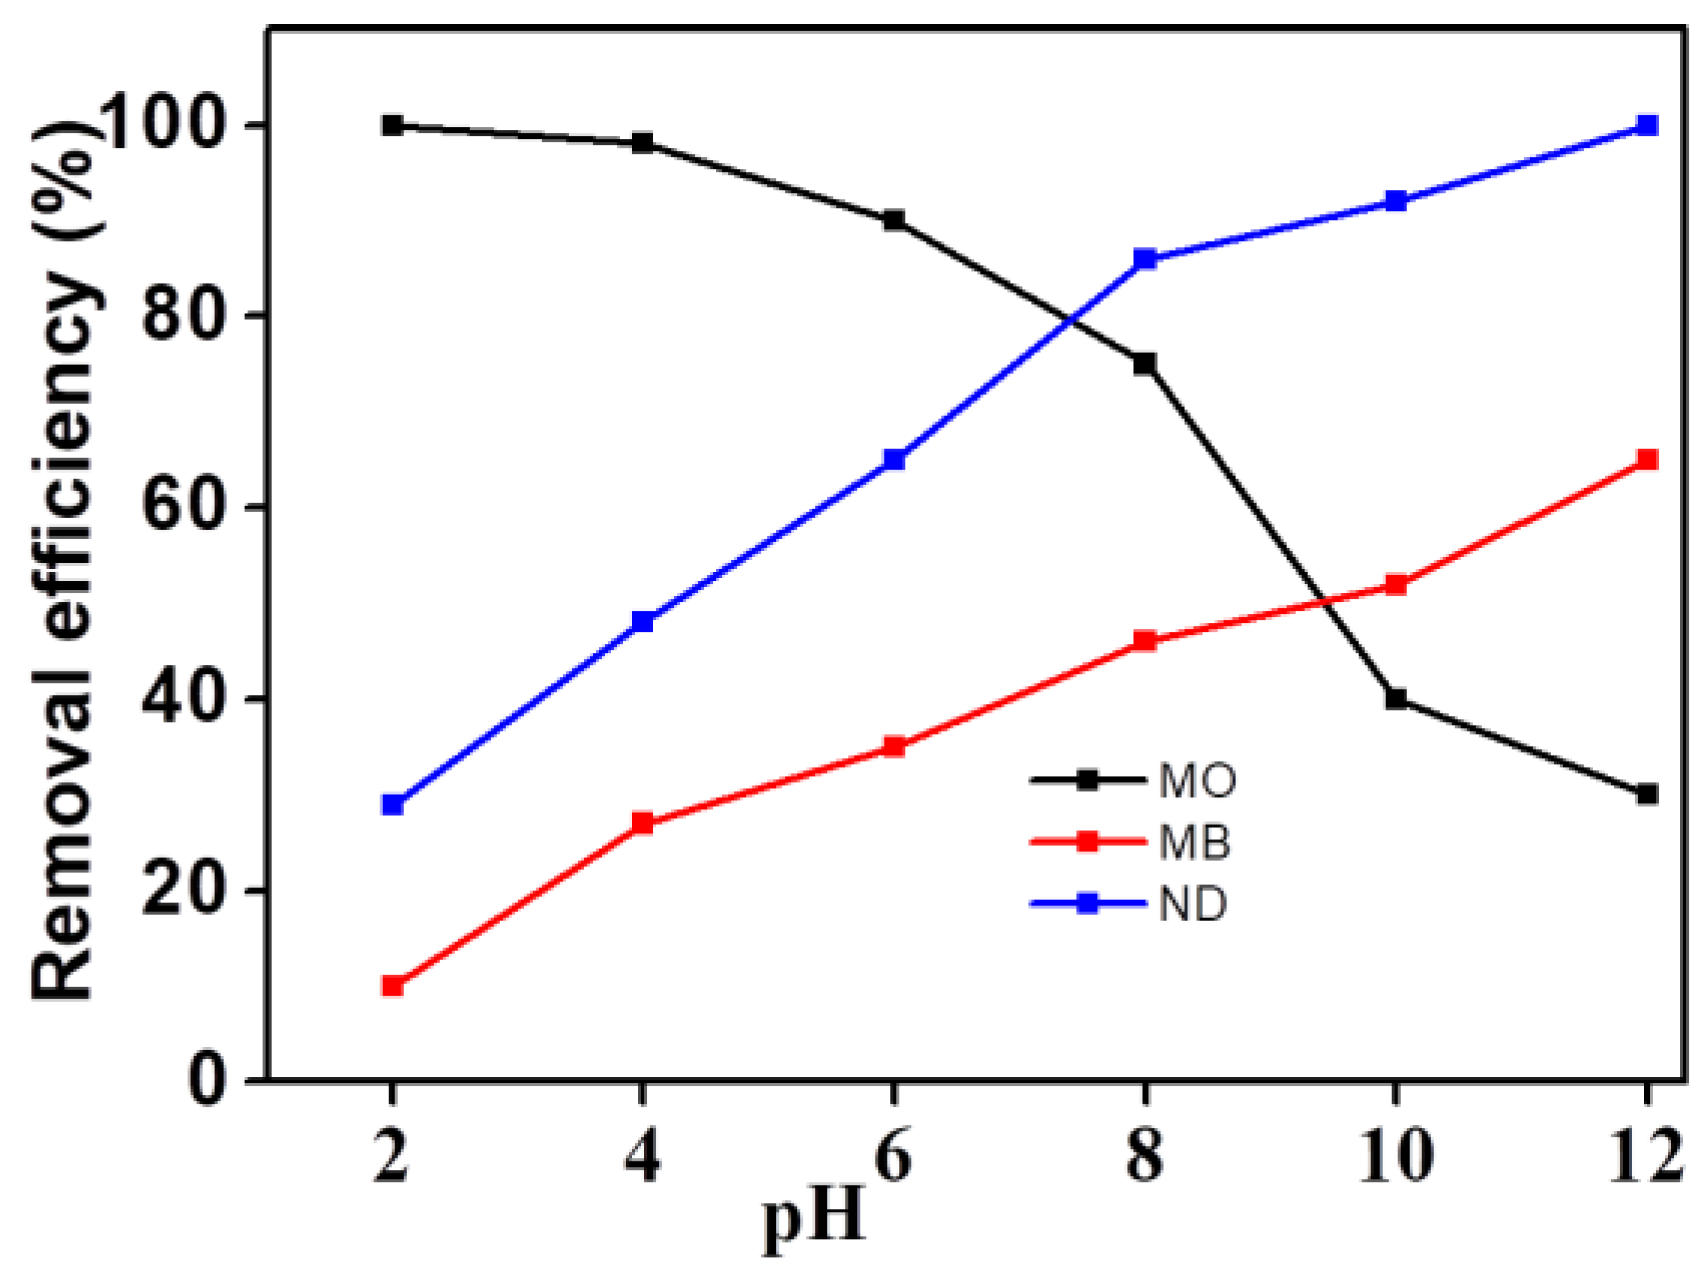
Figure 10.
Mass spectra of different dye solutions before(black line) and after degradation (red line). Methyl orange (a,b), neutral red (c,d), methylene blue (e,f). Embedded figures are the degradation chromatogram of the corresponding dye.
Figure 10.
Mass spectra of different dye solutions before(black line) and after degradation (red line). Methyl orange (a,b), neutral red (c,d), methylene blue (e,f). Embedded figures are the degradation chromatogram of the corresponding dye.
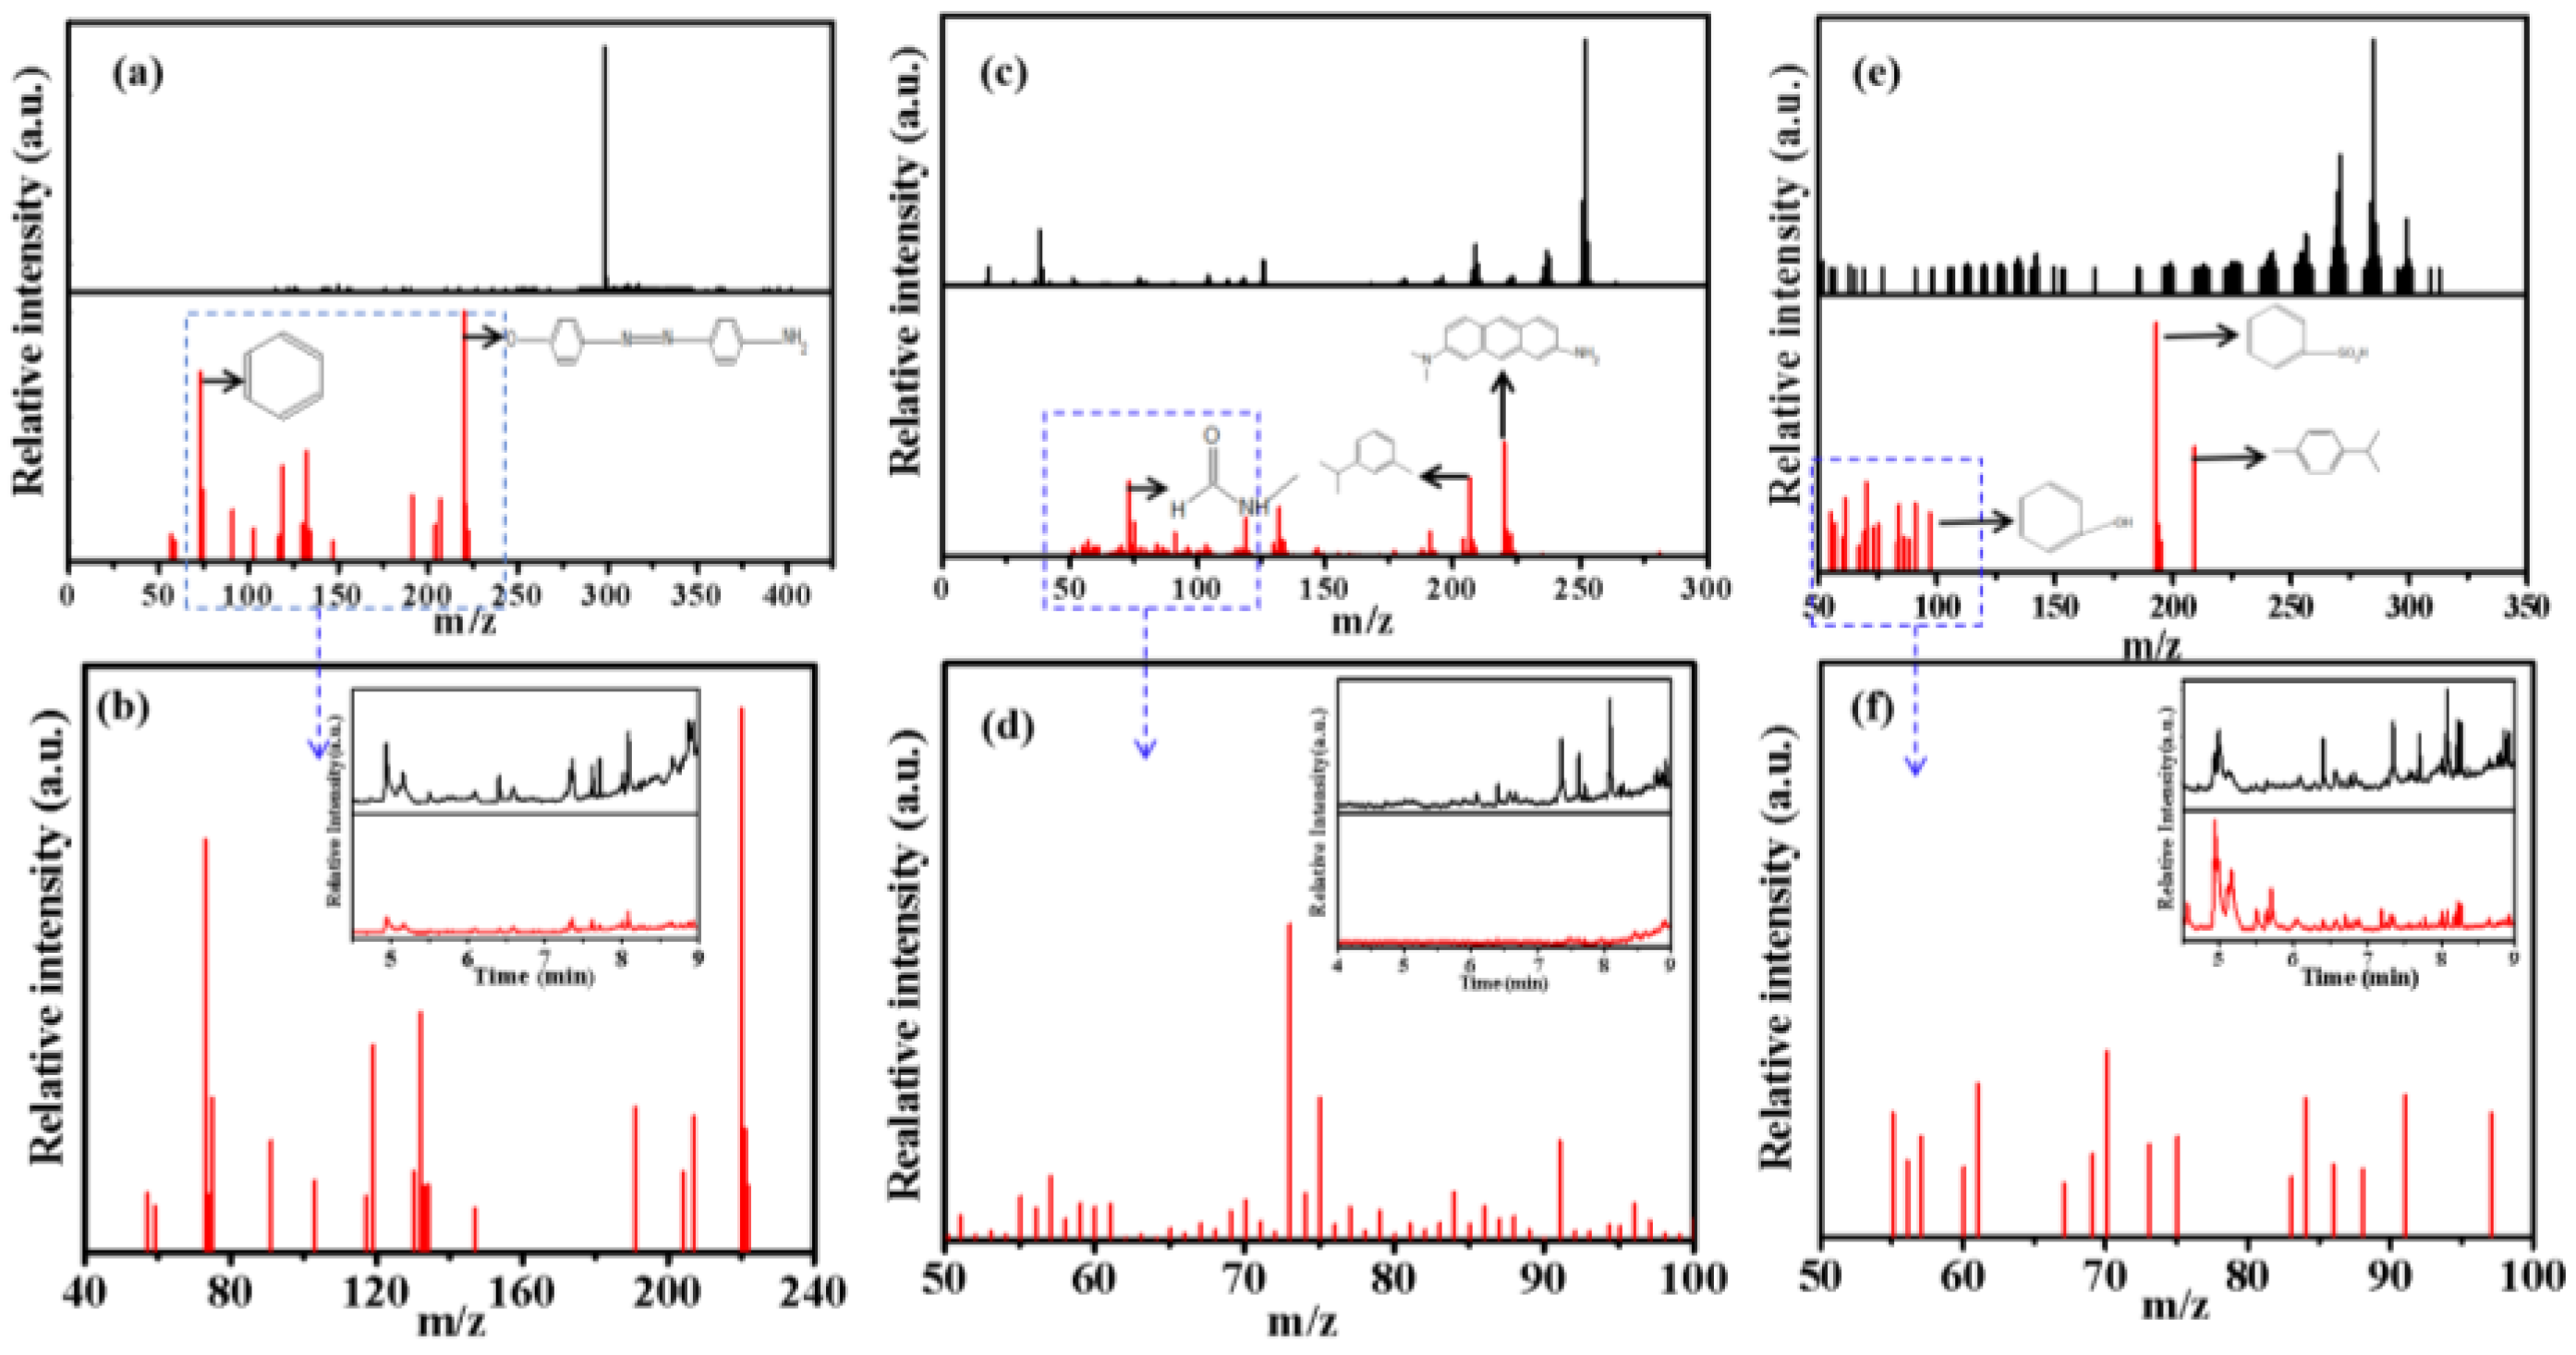
Figure 11.
Analysis of degradation intermediates and degradation paths for different dyes.
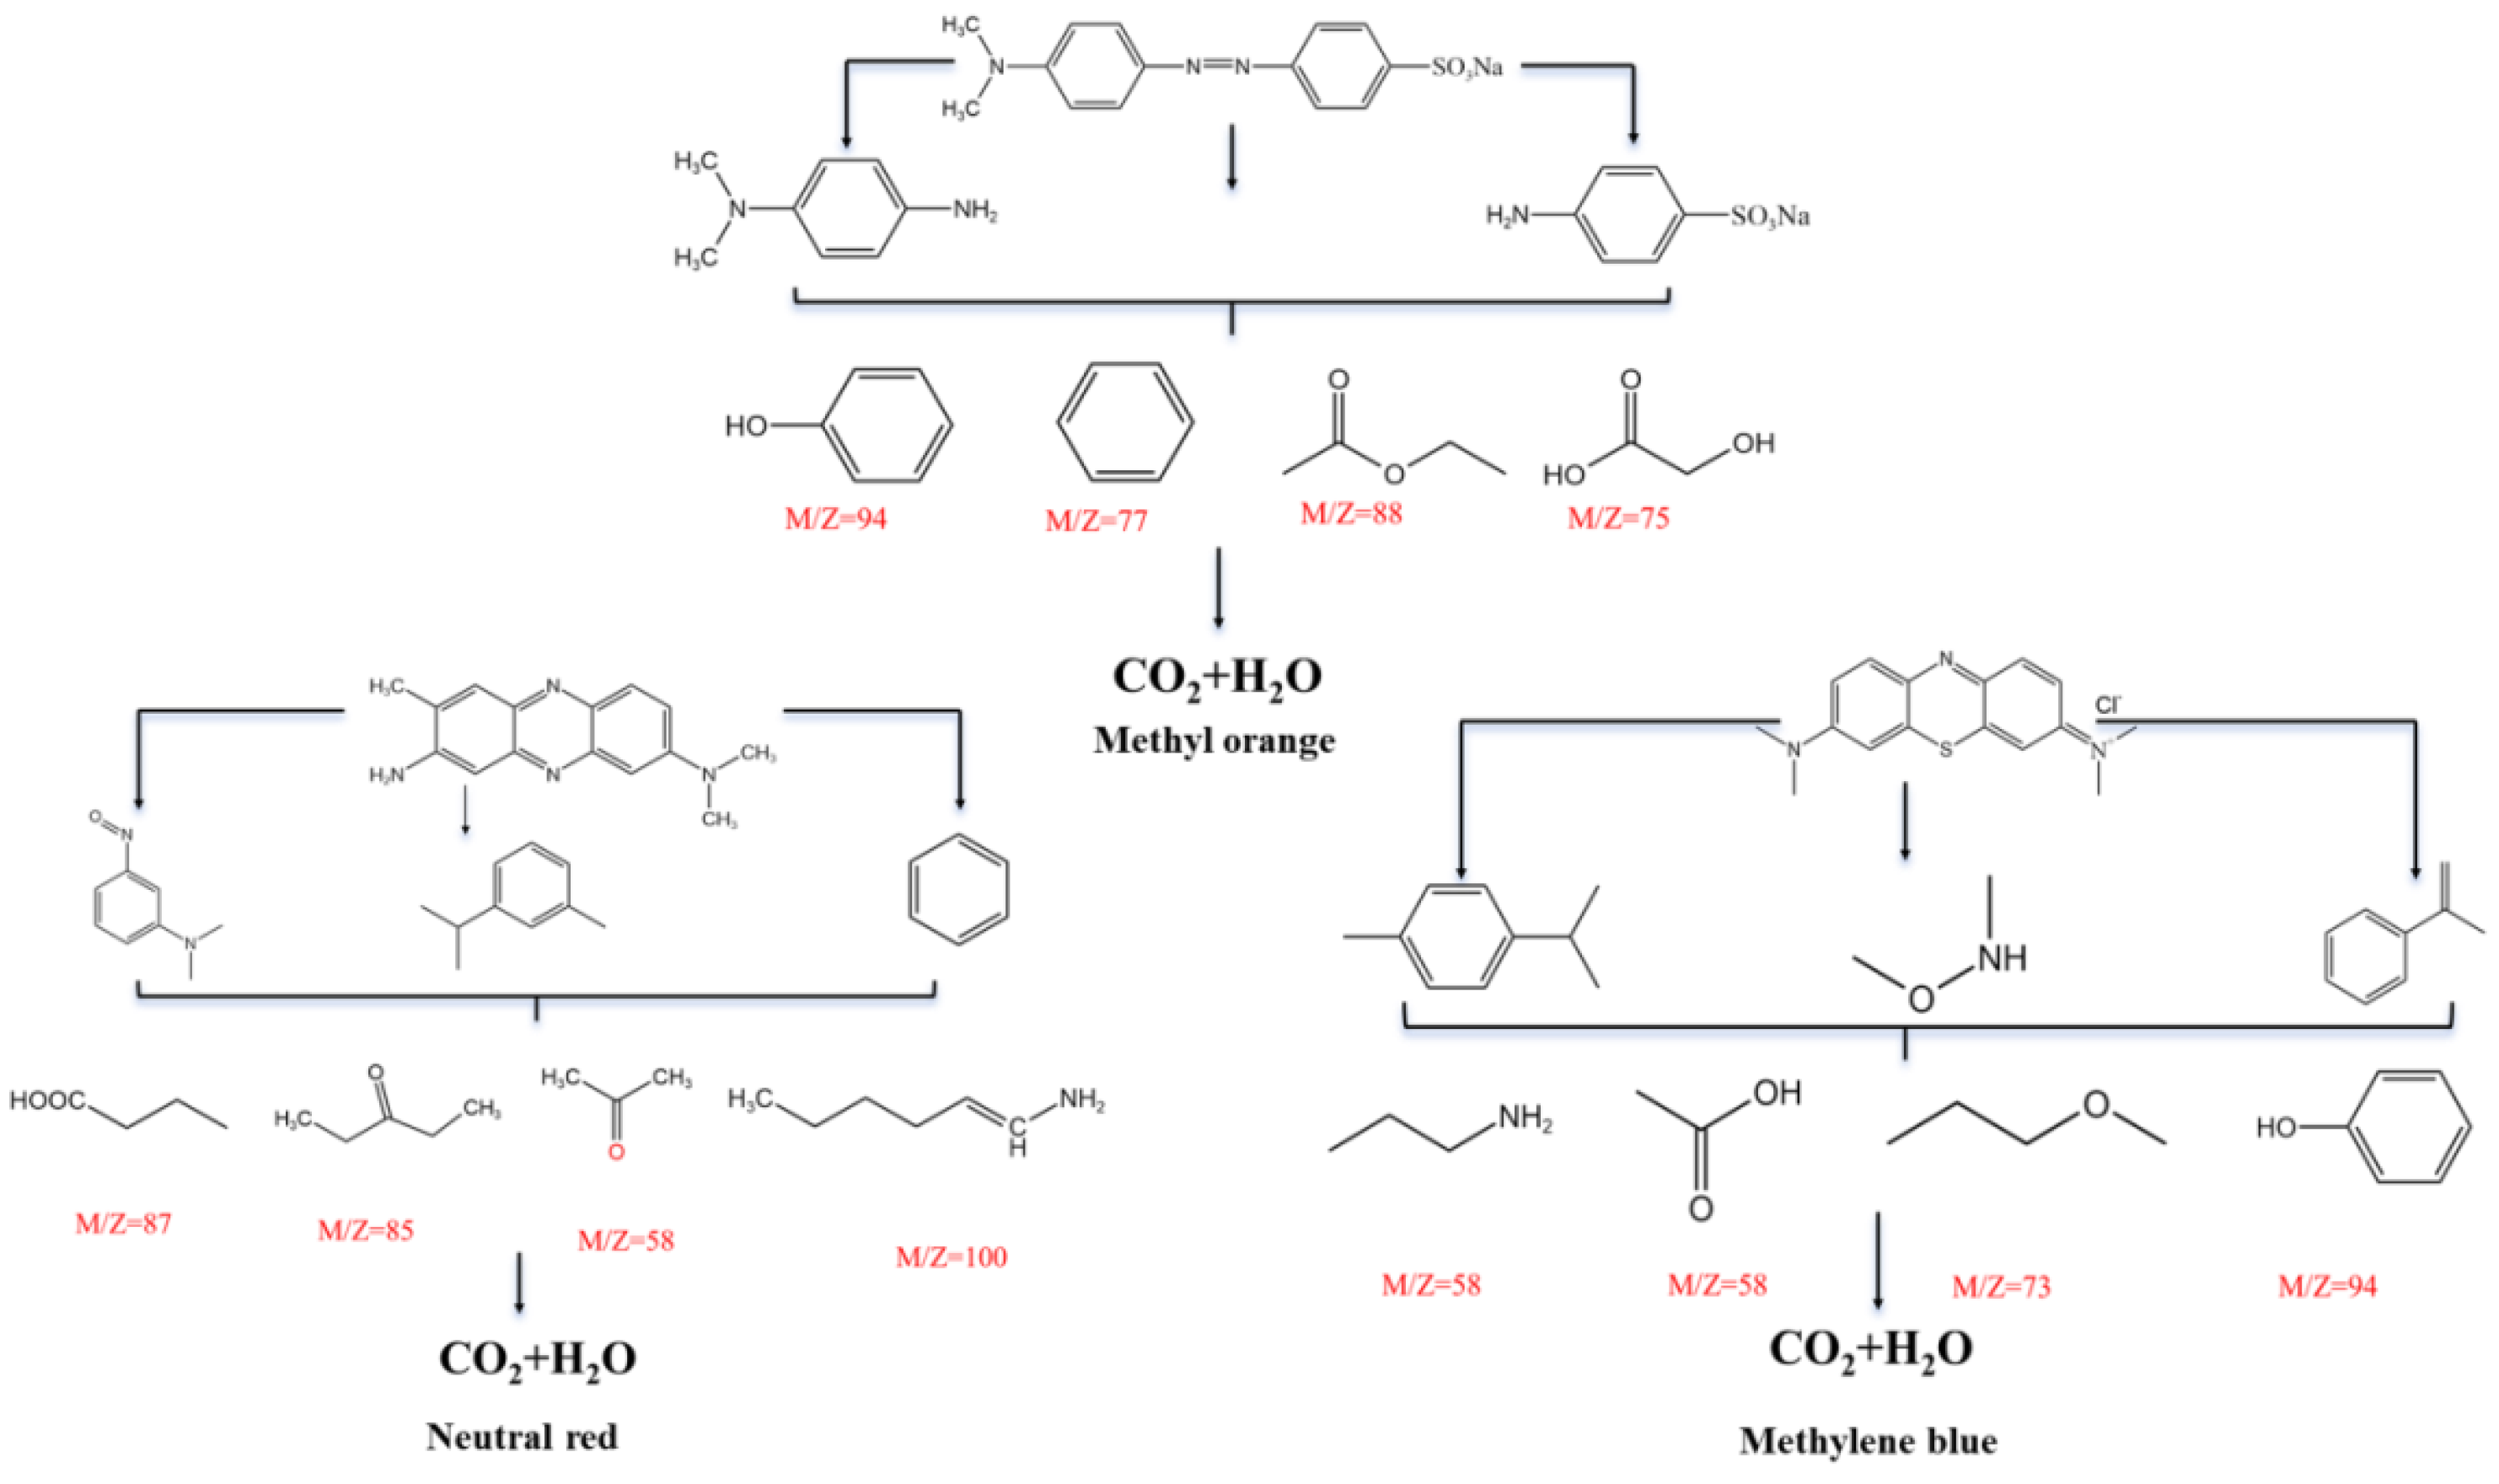
Figure 12.
Accelerated lifetime of different electrodes.
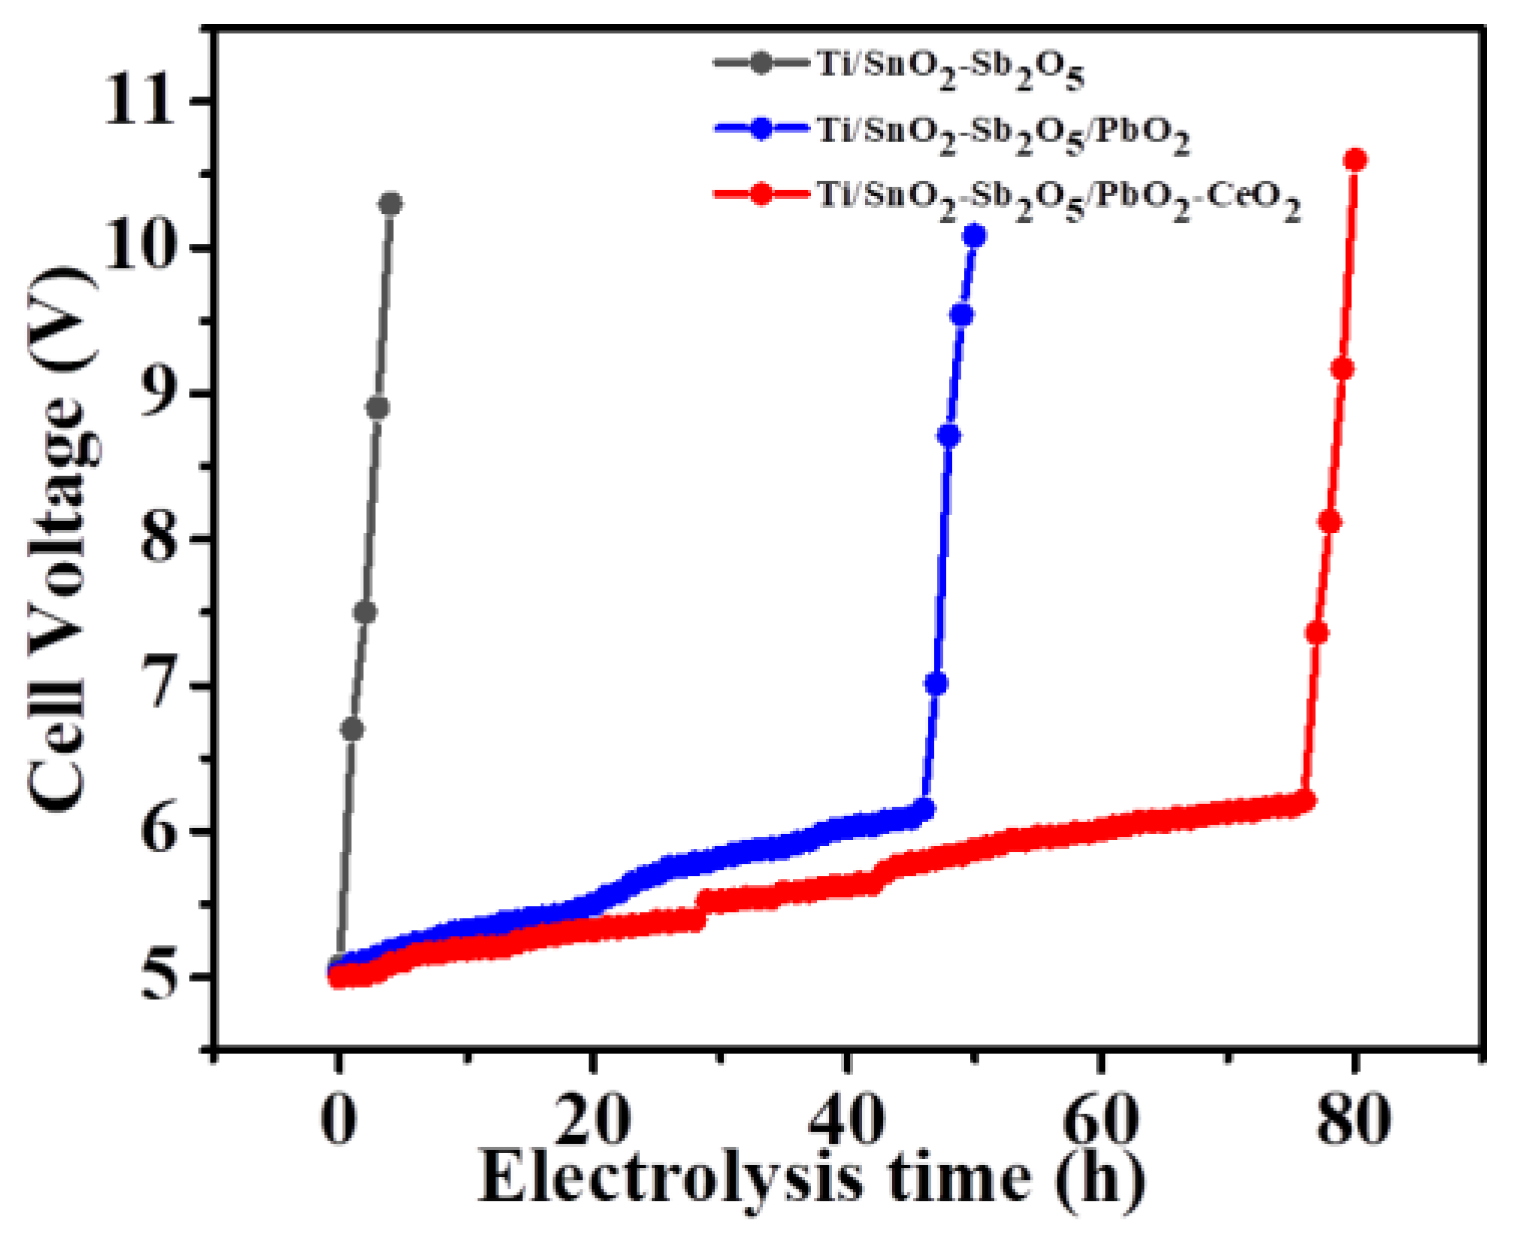

Table 1.
The kinetic parameters for the degradation of three organic dyes.
| Process | MO | MB | ND |
|---|---|---|---|
| Kinetic equations (t: min) |
y=0.72303x+0.20081 | y=0.04813x+0.49558 | y=0.82199x+0.3882 |
| Kinetic constant (t: min-1) |
0.73023 | 0.04813 | 0.82199 |
| Pearson's r | 0.9904 | 0.97607 | 0.98093 |
| Adj. R-Square | 0.97453 | 0.94799 | 0.94963 |
Table 2.
TOC for different dye solutions during degradation and its degradation efficiency.
| sample | Methyl orange | Neutral red | Methylene blue |
|---|---|---|---|
| Intial solution | 320.6 | 315.5 | 346.7 |
| After degradation | 33.8 | 27.8 | 36.4 |
| Efficiency % | 89.5 % | 91.2% | 89.6% |
Table 3.
COD for different dye solutions during degradation and its degradation efficiency.
| sample | Methyl orange | Neutral red | Methylene blue |
|---|---|---|---|
| Intial solution | 1615 | 2210 | 11320 |
| After degradation | 45 | 40 | 320 |
| Efficiency % | 97.2% | 98.2% | 97.2% |
Table 4.
Comparison of electro-catalytic oxidation performance for Ce-doped Ti/PbO2 electrode with other reported electrodes.
Table 4.
Comparison of electro-catalytic oxidation performance for Ce-doped Ti/PbO2 electrode with other reported electrodes.
| Electrodes | Object pollutants | Initial concentration (mg L-1) |
Degradation time (min) |
Current Density (mA cm-2) |
Removal efficiency of TOC (%) | Removal efficiency of COD (%) | References |
|---|---|---|---|---|---|---|---|
| Ti/TiO2-NTA/La-PbO2 | MO | 50 | 240 | 20 | 70.2 | ─ |
Environ. Sci. Pollut. 2022, 131, 19197-19202 |
| 2D PbO2 | MO | 100 | 100 | 50 | 90.7 | ─ | Int. J. Electrochem. Sci. 2019, 14, 7790 – 7810 |
| Composite biochar | MO | 50 | 200 | 50 | 94.9 | ─ |
J. Environ. Manage 2022, 304, 116445 |
| PbO2-ZrO2 | MB | 30 | 120 | 50 | 100 | ─ |
J. Hazard. Mater. 2021, 118, 2024619118 |
| Ni0.6Co0.4-oxide | MB | 50 | 60 | 20 | 100 | 100 |
Catalysts 2021,11(7), 793 |
| Graphite | ND | 40 | 120 | 200 | 86.0 | ─ |
Electrocatalysis 2021,12(7),579 |
| PbO2/α-Al2O3 | ND | 125 | 60 | ─ | 82.9 |
Sep. Purif. Technol. 2019, 227,115684 |
|
| Ti/SnO2-Sb2O5/Ce-PbO2 | MO/MB/ND | 50-1000 | 30 | 25 | >90 | >97 | (This Work) |
Disclaimer/Publisher’s Note: The statements, opinions and data contained in all publications are solely those of the individual author(s) and contributor(s) and not of MDPI and/or the editor(s). MDPI and/or the editor(s) disclaim responsibility for any injury to people or property resulting from any ideas, methods, instructions or products referred to in the content. |
© 2025 by the authors. Licensee MDPI, Basel, Switzerland. This article is an open access article distributed under the terms and conditions of the Creative Commons Attribution (CC BY) license (http://creativecommons.org/licenses/by/4.0/).
Copyright: This open access article is published under a Creative Commons CC BY 4.0 license, which permit the free download, distribution, and reuse, provided that the author and preprint are cited in any reuse.


