
Submitted:
28 January 2025
Posted:
29 January 2025
You are already at the latest version
Abstract
Recent research has demonstrated a strong correlation between the exponential growth of the transportation sector and the increase in urban phenomena such as traffic accidents and congestion. In this context, accurate congestion prediction has become a primary objective to improve urban mobility and mitigate the negative effects associated with traffic.The study proposes a machine learning-based classification model to predict vehicular congestion. Using a dataset that includes variables such as speed, traffic flow, and weather conditions, various classification algorithms were trained and evaluated. The results obtained indicate that models based on Random Forest offer superior performance in the task of congestion prediction.To evaluate the impact of these predictions on urban mobility, the model was integrated into a vehicular ad-hoc network (VANET) simulation environment. The simulation results demonstrated that providing real-time traffic information based on model predictions allows drivers to make more informed decisions, consequently reducing travel times and emissions.

Keywords:
Congestion prediction
; Urban mobility
; Machine learning
; Traffic optimization
1. Introduction
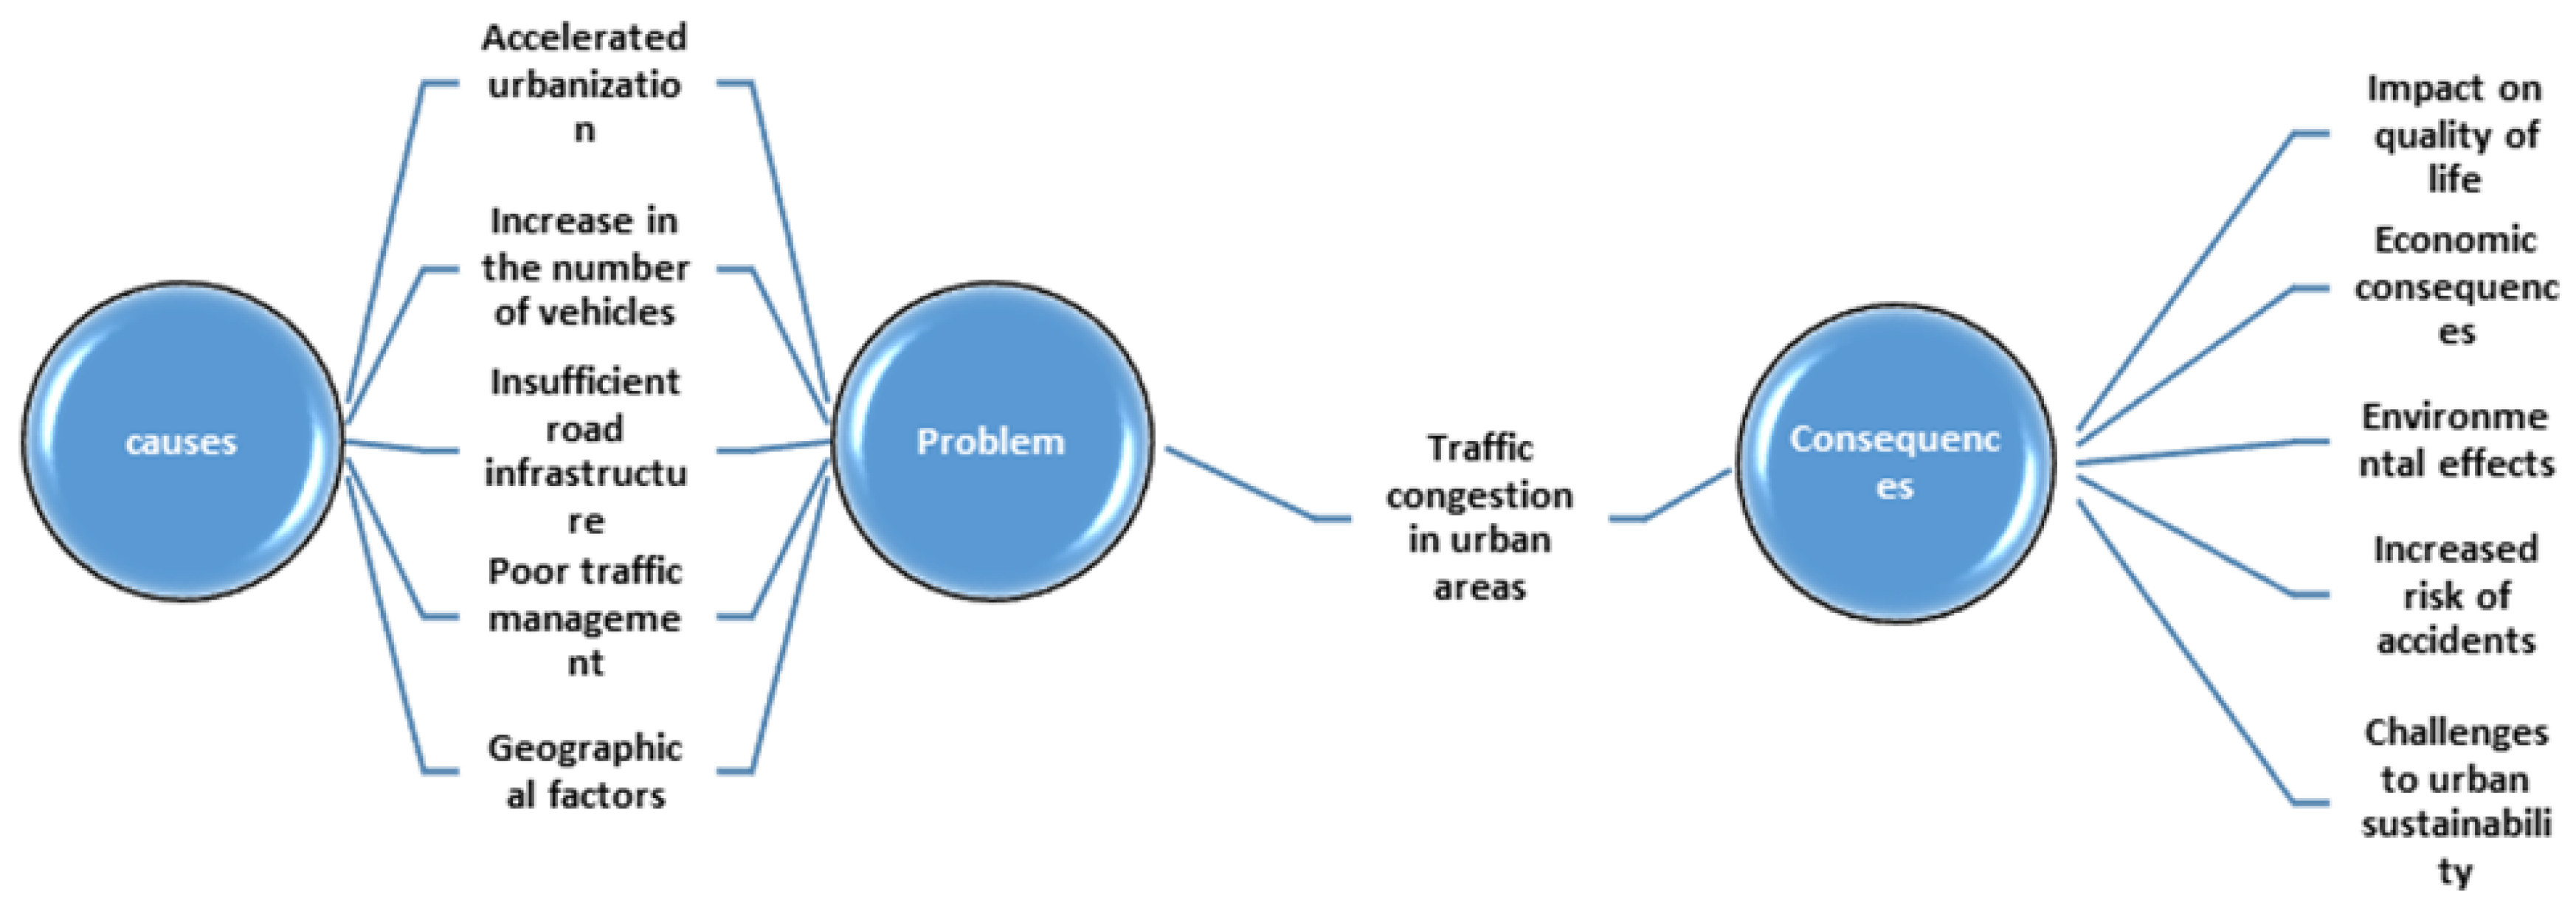
Traffic congestion poses a growing challenge to cities worldwide, driven by increasing urbanization and motorization. This phenomenon, which translates into significant problems for urban mobility, negatively impacts multiple aspects of daily life. Firstly, it affects the quality of life of citizens by causing prolonged delays in travel times, stress, and exposure to high levels of air pollution. Secondly, it impacts the local economy, increasing costs associated with excessive fuel consumption and loss of productivity. Moreover, emissions from traffic contribute to climate change, exacerbating global environmental problems [1].
In Ecuador, cities like Esmeraldas face this issue acutely. The sustained increase in the vehicle fleet, combined with limited road infrastructure and, in some cases, complex topography, has intensified urban mobility challenges [2]. In particular, in critical areas of these cities, users experience significant time losses and an increase in traffic accidents, highlighting the urgent need for effective traffic management solutions [3].
To address this problem, this study focuses on the development of Intelligent Transportation Systems (ITS) and Vehicular Ad Hoc Networks (VANETs). These networks, based on communication between vehicles and roadside stations, facilitate the generation of real-time data-driven solutions. Through the use of advanced technologies, VANETs enable monitoring and optimization of vehicular mobility, providing strategic information for decision-making [4].
Consequently, machine learning techniques, specifically the Random Forest algorithm, are employed, renowned for its ability to handle complex data and its performance in classification tasks. This approach facilitates the identification of patterns in historical traffic data, enabling the prediction of traffic congestion and, consequently, the adoption of proactive measures to mitigate its impact [5].
Furthermore, cities like Esmeraldas face significant challenges related to urban mobility management due to the lack of predictive tools that allow authorities to anticipate and manage traffic congestion. In this context, this study aims to contribute to the development of technological solutions that integrate predictive models and vehicular networks, offering innovative tools for traffic planning and optimization.
Specifically, the objectives of this research include analyzing the current state of vehicular mobility in critical urban areas, developing a predictive model of traffic congestion based on historical data and machine learning, and finally evaluating the accuracy and performance of the model using standard classification metrics.
Moreover, the sustained increase in traffic congestion in Ecuador demands immediate and sustainable solutions. This study seeks to address the need for technological tools that enable authorities to anticipate and mitigate the negative impacts of traffic on both citizens’ quality of life and the environment. Through the use of historical data, the development of predictive models, and the implementation of simulations, this research aims to reduce the adverse effects of congestion and lay the foundation for more efficient and sustainable traffic management.
Additionally, various studies conducted in Latin America have demonstrated the potential of vehicular networks and predictive algorithms in traffic management. For example, in Quito, Ecuador, a vehicular ad hoc network was simulated in the historic center, achieving significant improvements in vehicular mobility [6]. Similarly, in Ambato, traffic data has highlighted the urgent need for predictive tools to optimize road connectivity, especially in areas with high vehicle density [7]
Finally, the theoretical framework of this research is based on the use of Vehicular Ad Hoc Networks (VANETs) and machine learning techniques to identify complex patterns in large datasets. Furthermore, probability theory and statistics are fundamental for the development of predictive models such as Random Forest, which combines multiple decision trees to improve accuracy in classification and prediction tasks [8].
The research is conducted in the context of medium-sized Ecuadorian cities such as Esmeraldas, where traffic congestion represents a critical challenge for urban mobility. These cities have particular characteristics, such as challenging topography and limited road infrastructure, which exacerbate traffic problems and highlight the need to adopt technological solutions to improve traffic management [9].
Finally, as a research question to address this problem, the following is proposed: How can machine learning be applied to VANET data analysis to predict vehicular congestion at urban intersections with high accuracy?
2. Background
Accelerated urbanization and the growth of motorization worldwide have significantly intensified vehicular congestion in urban areas [10]. This problem affects the quality of life by prolonging travel times and generating higher stress levels in the population. Additionally, it has economic and environmental repercussions, such as increased fuel consumption, air pollution, and loss of productivity [11].
Traditional traffic management strategies, based on fixed infrastructure such as traffic lights and centralized control systems, have significant limitations in their ability to adapt to the changing dynamics of traffic [12]. In this context, Vehicular Ad Hoc Networks (VANETs) have emerged as a promising technology for traffic management in urban environments [13].
VANETs enable wireless communication between vehicles, facilitating the real-time exchange of data related to location, speed, and traffic conditions. This capacity for information sharing opens up new possibilities for the development of intelligent transportation systems, improving efficiency and road safety [14]. In particular, the analysis of data from VANETs to predict vehicular congestion represents a significant advance. This approach allows for the identification of real-time traffic patterns and the anticipation of traffic jams, facilitating the implementation of proactive measures such as optimizing traffic lights, demand management, and traffic rerouting [15].
Despite their potential, VANETs still face several challenges. These include the need for more robust and accurate prediction algorithms, the efficient management of large volumes of data, and the protection of the privacy and security of transmitted information [16]. Therefore, addressing these challenges is essential to maximize the effectiveness of this technology in mitigating vehicular congestion.
The present research addresses these challenges by developing a predictive model based on machine learning that uses VANET data to anticipate vehicular congestion at urban intersections. This study is expected to contribute to the advancement of the field of intelligent traffic management and provide valuable tools for informed decision-making by transportation authorities.
The study focuses on a critical intersection in the city of Esmeraldas, Ecuador, where traffic data was collected during peak hours through ESVIAL EP and ECU 911 [2]. Based on this analysis, the effectiveness of a simulated vehicular network was evaluated using the SUMO software, a specialized tool for simulating urban traffic [17]. Additionally, the Random Forest algorithm was used to identify patterns and accurately predict vehicular congestion [18].
The developed model seeks to contribute to more efficient and sustainable traffic management, responding to the urgent need for advanced technological solutions that mitigate the negative effects of vehicular congestion in Ecuadorian cities and in similar contexts in other regions.
3. Materials and Methods
This project was structured under a predictive research approach, with the primary objective of identifying the most effective machine learning algorithms for predicting vehicular congestion in complex urban environments [19]. In this context, ensemble methods were highlighted, playing a fundamental role in combining multiple models to improve the accuracy and robustness of predictions. These approaches allow for leveraging the individual strengths of each model, mitigating their weaknesses, and consequently optimizing the overall performance of the predictive system (seen in Figure 6).
Figure 1.
Problem identification
This study utilizes the Design Science Research methodology, a framework composed of three primary phases: relevance, design, and rigor. The relevance phase involves identifying the problem to be addressed and defining the context of the solution’s application, with a focus on ensuring significant impact [20]. The design phase centers on the creation of innovative solutions through the development of prototypes or models that directly meet the identified needs. The rigor phase then focuses on validating these proposed solutions, ensuring both their theoretical and practical robustness through scientific methods and thorough evaluations. This methodology facilitates a systematic process for developing useful and applicable artifacts in real-world settings (seen in Figure 2).
Figure 2.
Design Science Research (DSR)
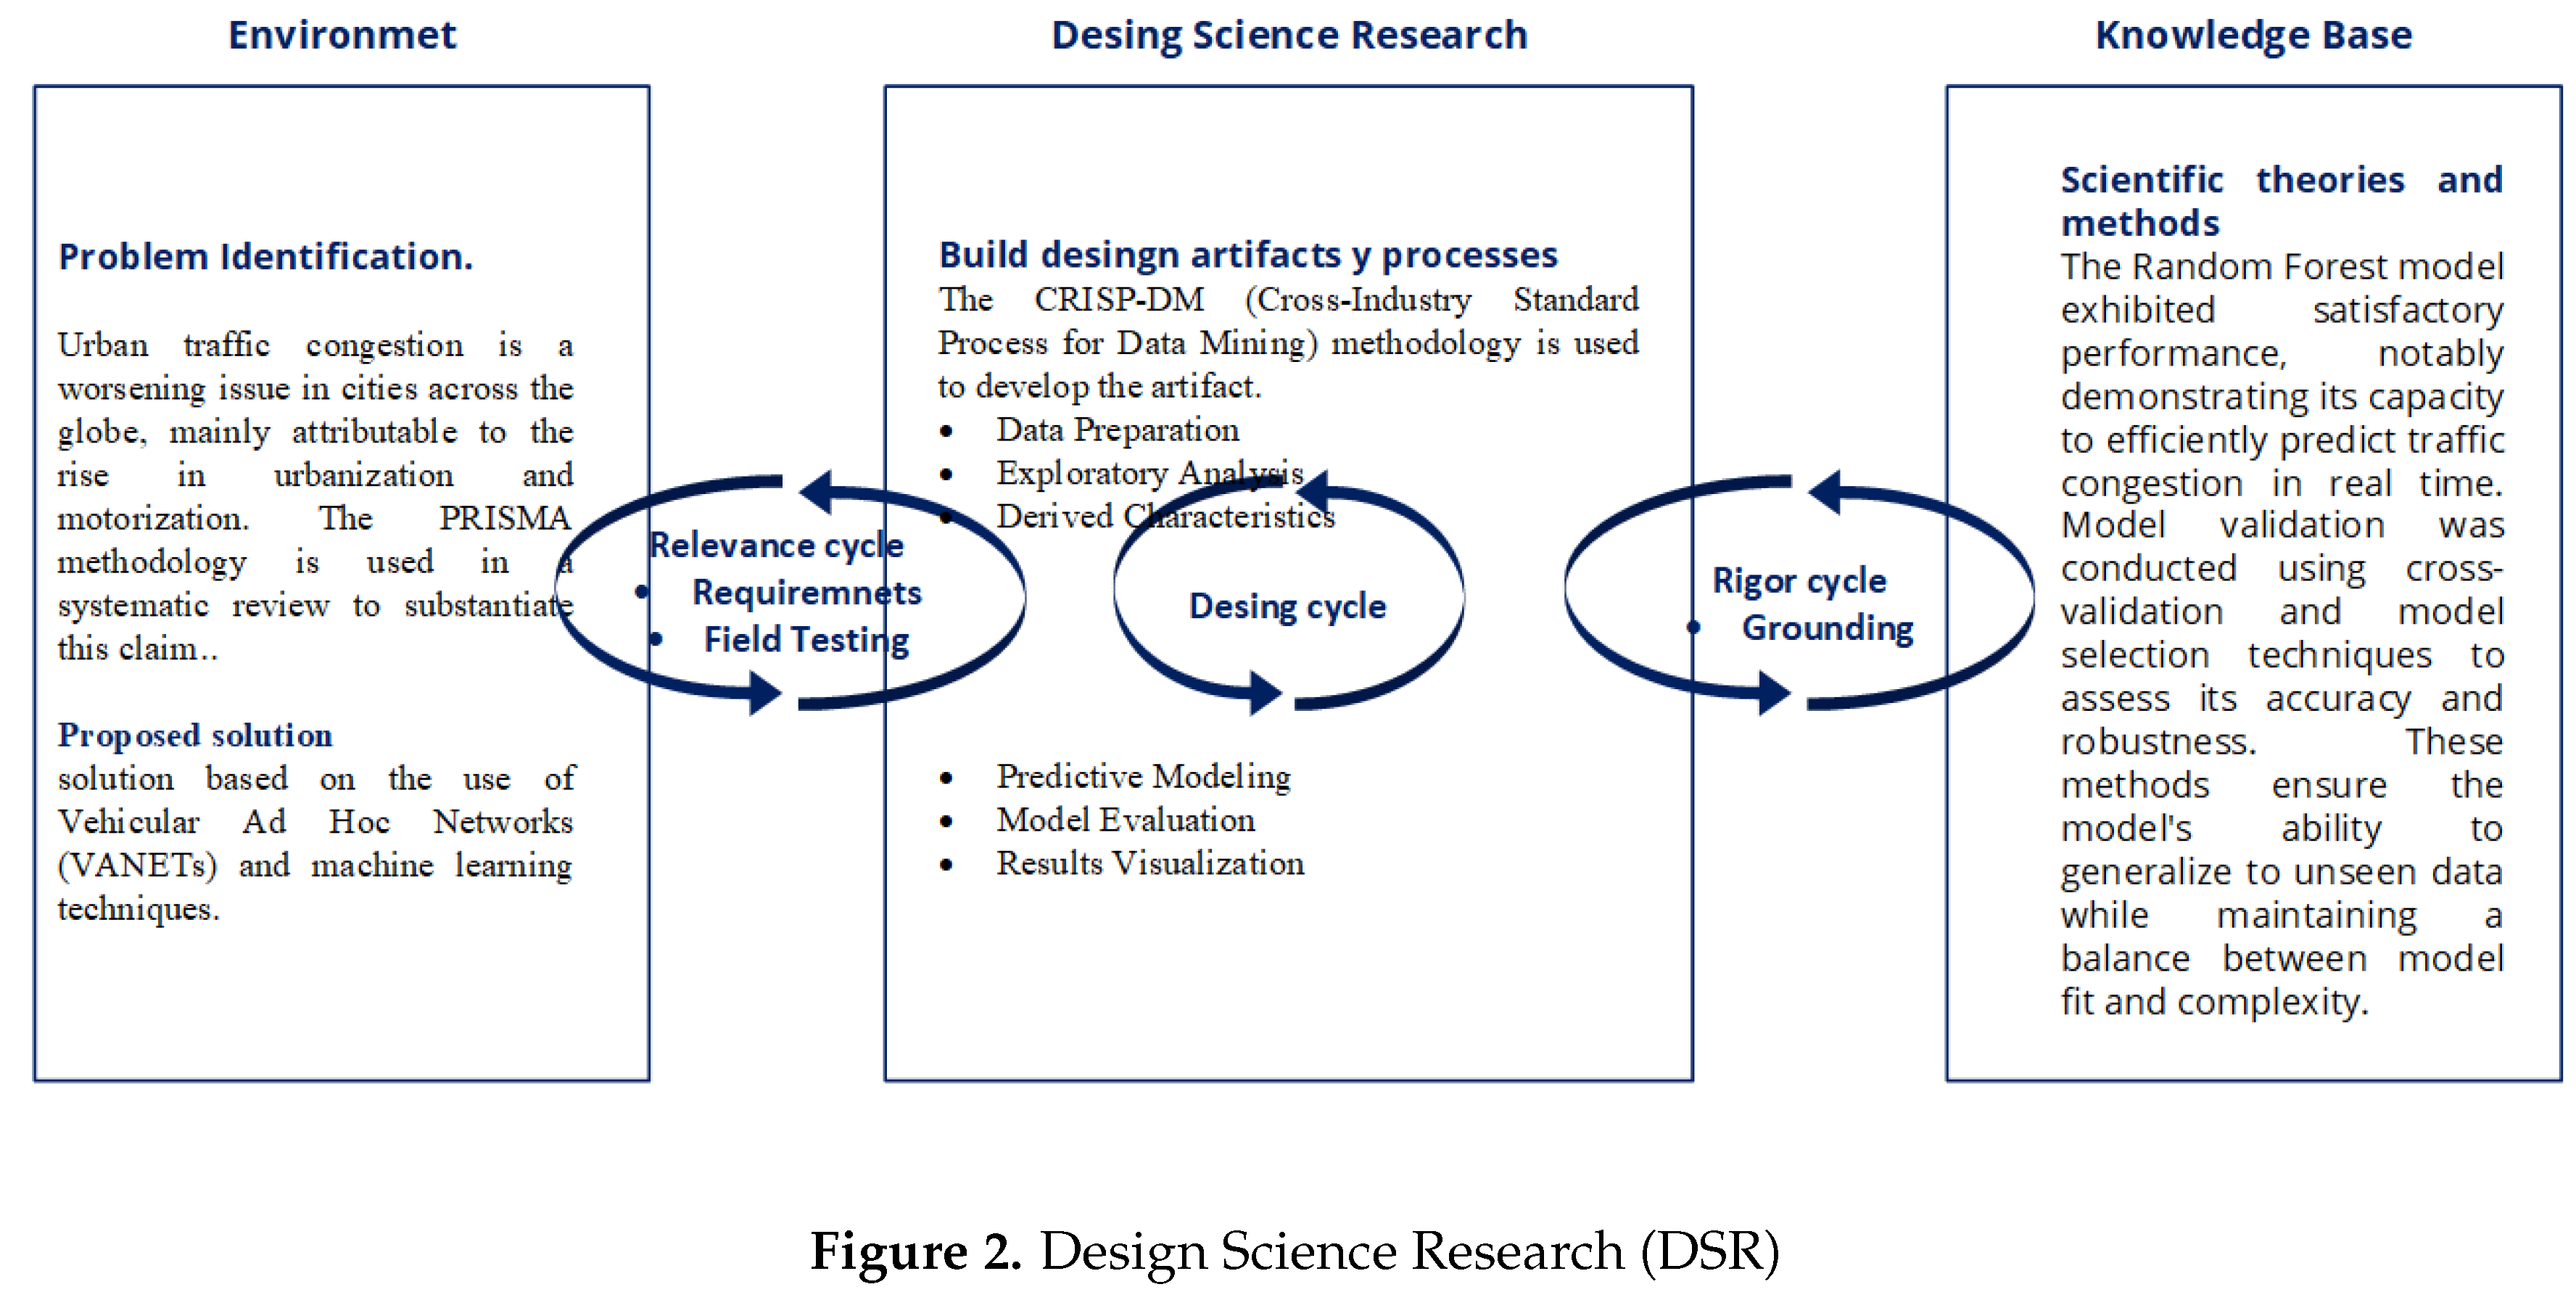
3.1. Relevance Cycle
In an initial phase, a predictive model was developed using methodologies based on ensemble techniques, widely recognized for their ability to improve predictive performance by combining multiple algorithms [21]. This process began with a comprehensive review of the scientific literature specialized in the field of machine learning applied to Vehicular Ad Hoc Networks (VANETs). To ensure the quality and relevance of the consulted sources, high-impact indexed databases such as IEEE Xplore, Springer, and Elsevier, among others, were accessed.
The PRISMA (Preferred Reporting Items for Systematic Reviews and Meta-Analyses) methodology was implemented to ensure a systematic, rigorous, and transparent approach to the selection of relevant literature for the development of the predictive model [22]. This methodological approach allowed for the identification, evaluation, and selection of studies based on predefined criteria, ensuring that the selected studies met high standards of quality, relevance, and scientific rigor. The PRISMA methodology consisted of four main stages, described below:
Identification: This initial stage involved a comprehensive literature search in recognized academic databases, such as IEEE Xplore [23], Springer, and Elsevier. The search process generated a total of 150 preliminary records. Subsequently, duplicate records (30 in total) were removed, as well as 10 additional records that were deemed ineligible using automated filtering tools, such as keyword and metadata analysis. This procedure resulted in a total of 110 unique records considered relevant for the initial analysis.
Screening: Once the 110 unique records were obtained, a screening process was conducted, which included reviewing the titles and abstracts of the studies. This preliminary analysis aimed to assess whether the records met predefined inclusion criteria, such as the specific topic of machine learning applied to traffic congestion prediction [24]. As a result, 30 records were excluded due to their lack of alignment with the research objectives, leaving 90 records that proceeded to the next phase for more in-depth analysis.
Eligibility Assessment: In this phase, the remaining 90 records underwent a detailed full-text review. This analysis aimed to evaluate the methodological quality, the robustness of the reported results, and the applicability of the studies to the research topic. Rigorous criteria were applied, such as the use of predictive approaches based on ensemble techniques and the relevance of the analyzed variables [25]. Following this process, 40 studies were selected that met all established criteria, standing out for their theoretical and empirical relevance in the context of machine learning applied to vehicular environments.
Inclusion: In the final stage, the 40 selected studies were integrated into the systematic analysis. These studies constituted the theoretical and methodological basis for the development of the proposed predictive model, providing key information on variables, approaches, and results applicable to the phenomenon of traffic congestion in VANETs (Vehicular Ad Hoc Networks).
The use of the PRISMA methodology allowed for the structured and transparent documentation of each step of the literature selection process, facilitating research replicability. Furthermore, this methodology ensured that the selected studies were of high quality and aligned with the research objectives, thus contributing to the robustness of the developed predictive model [26].
A critical aspect of this stage was the identification of the variables that would make up the model. These variables were selected based on their theoretical and empirical relevance, ensuring that they adequately captured the dynamics of the vehicular congestion phenomenon [27]. This initial analysis allowed for the structuring of a representative dataset that integrated temporal, spatial, and speed characteristics, fundamental elements for modeling complex phenomena in urban environments.
3.2. Desing Cycle
During this stage, the technological artifacts were conceptualized and developed, which in this case consisted of machine learning models. Ensemble methods, such as Random Forest [28].
-
Data preparation: In the first phase, a CSV file containing detailed information about vehicular traffic was used. This file included relevant variables such as vehicle speed, time intervals, and lane. To ensure the quality and usefulness of the dataset, various preprocessing tasks were performed, including:Date Conversion: Dates were converted to datetime format to enable temporal operations and analysis, such as grouping by time intervals. Time Interval Creation: Data was grouped into 10-minute intervals, facilitating temporal analysis and aggregation of values related to traffic dynamics. Average Speed Calculation: The average speed of vehicles was determined for each time interval and lane, providing a key measure for identifying patterns and trends.
-
Data exploration: The initial analysis focused on detecting and visualizing relevant patterns in traffic behavior. Among the activities carried out, the following stand out:Congestion Detection: A speed threshold of 10 km/h was defined as a criterion for identifying intervals with vehicular congestion. This definition allowed for data labeling and establishing clear differences between normal and congested conditions [29] . Temporal Visualization: Graphs were generated representing average speeds as a function of time for each lane, using a reference line to highlight moments when the speed fell below the established threshold [30].
-
Derived features: To enrich the dataset and improve the predictive capability of the model, new features were derived:Congestion Labeling: A binary column was added to classify each interval as congested (1) or not congested (0), based on the previously defined threshold. Temporal Variables: Additional features were added, such as time of day and day of the week, providing temporal context and allowing for capturing seasonal patterns in traffic [31].
-
Predictive modeling: The modeling stage involved training a machine learning algorithm to predict vehicular congestion. This process included:Model Selection: A Random Forest Classifier was used, known for its ability to handle large datasets and detect complex interactions between variables [32].Data Splitting: The dataset was split into an 80% training set and a 20% test set, ensuring a fair and representative evaluation of the model. Training and Prediction: The model was trained using historical data and evaluated through predictions on the test set.
-
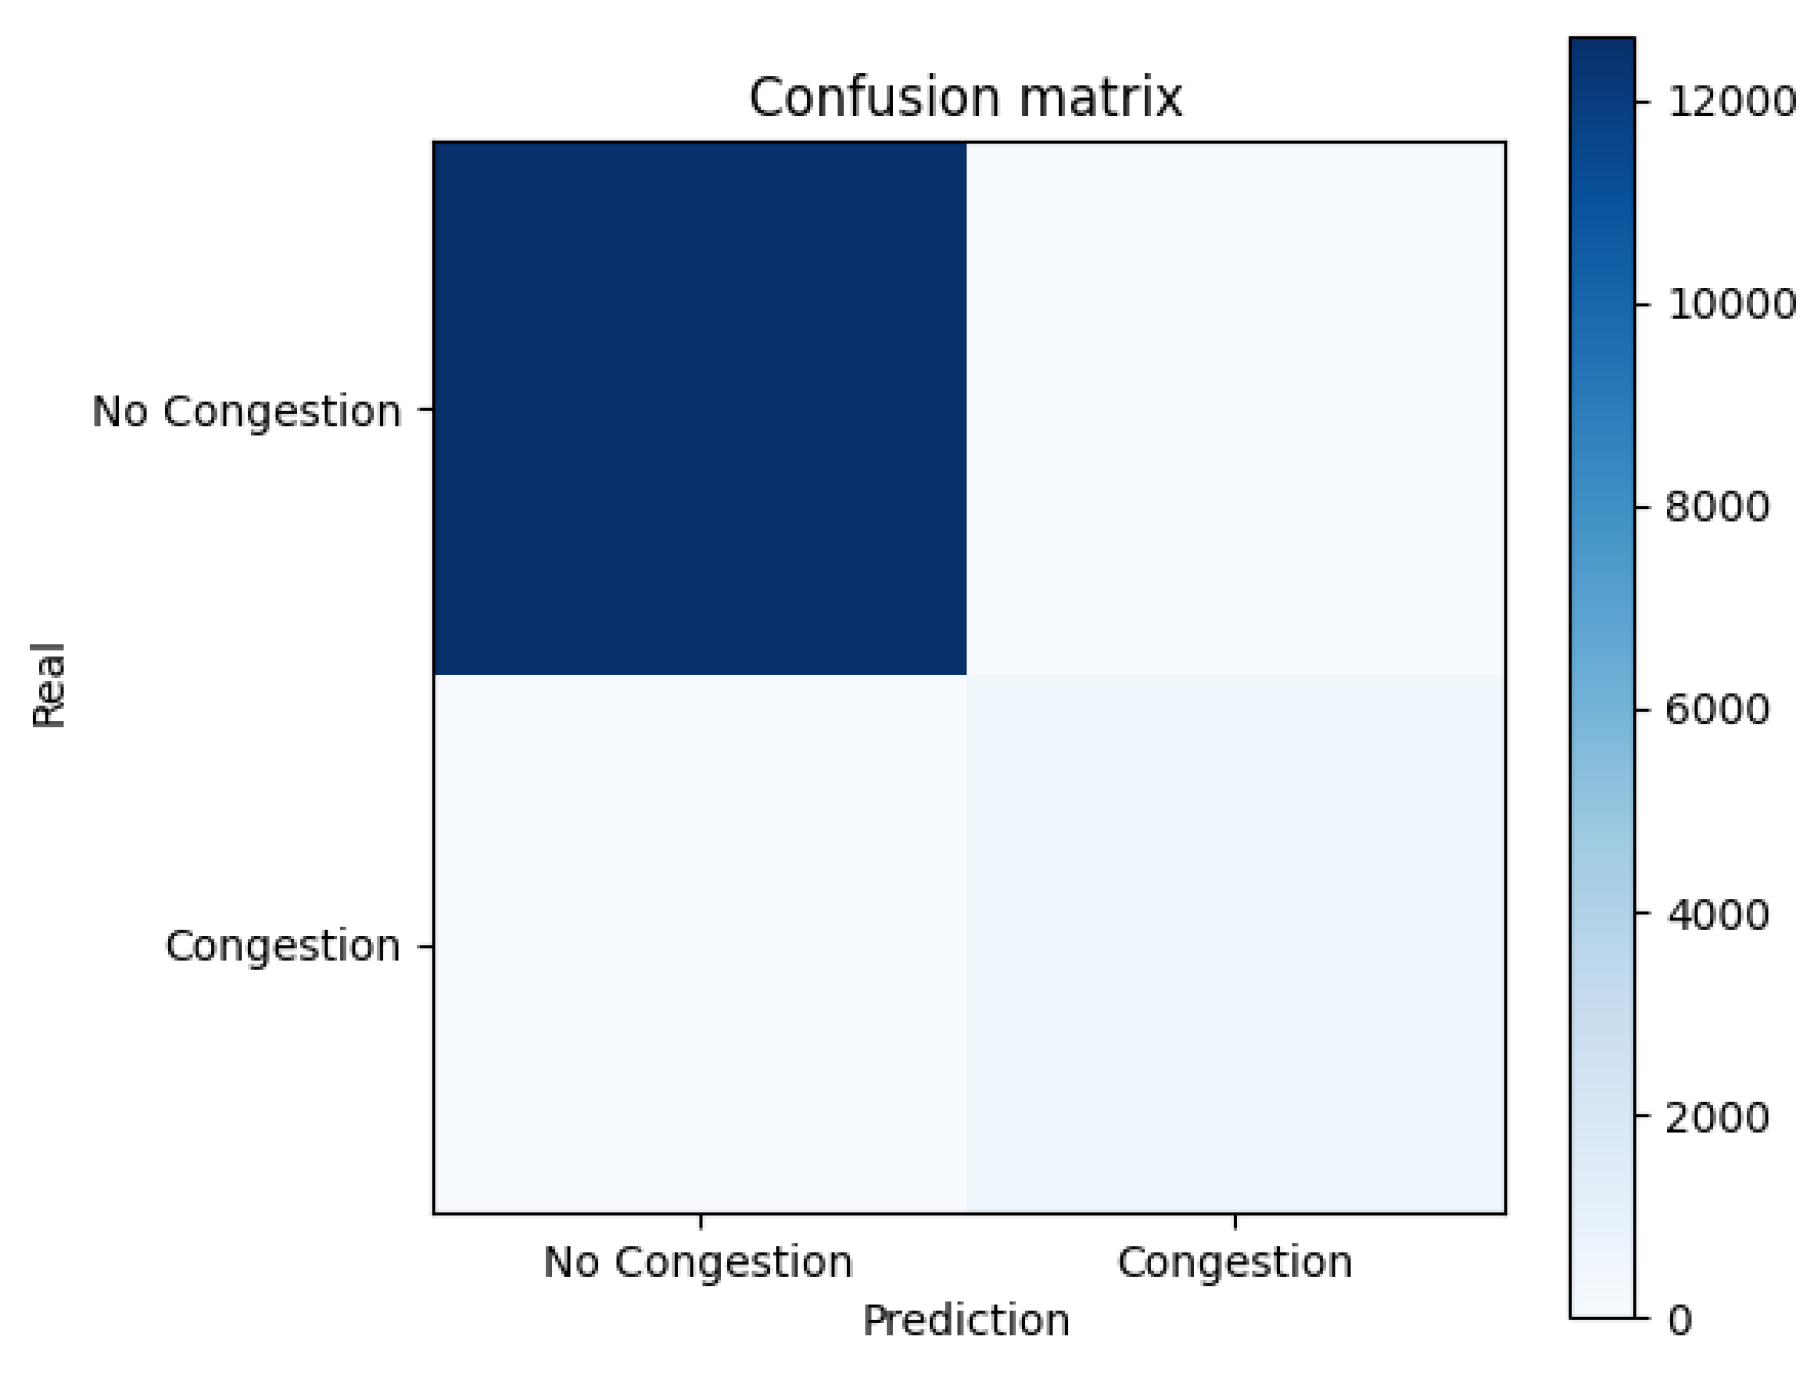
Model evaluation: The predictive model’s performance was evaluated using standard machine learning metrics:Classification Report: Metrics such as accuracy, sensitivity, and specificity were generated, demonstrating the model’s high ability to correctly identify intervals with and without congestion. Confusion Matrix: This matrix illustrated the number of true positives, true negatives, false positives, and false negatives, providing valuable information for interpreting results and making future adjustments [33].
-
Results visualization: To facilitate the interpretation of findings and communicate the results, key visualizations were developed:Average Speed Graph: Graphs clearly and comprehensibly displayed average speed patterns by lane, highlighting critical congestion moments [34]. Confusion Matrix Visualization: The confusion matrix was presented in a graphical format, allowing for a visual understanding of the model’s performance and identification of areas for improvement. This systematic and evidence-based approach provided a comprehensive view of vehicular traffic behavior and established a solid foundation for the development of intelligent traffic management systems in urban environments.
3.3. Rigor Cycle
This component ensured the robustness and scientific validity of the developed models. Standard metrics such as accuracy, sensitivity, specificity, and the confusion matrix were used to evaluate the performance of the selected algorithms. Additionally, the obtained results were compared with previous studies in the field of vehicular congestion prediction, ensuring that the proposed solutions align with the existing literature [35].
4. Results
4.1. Vanet Simulation
To model and evaluate the performance of Vehicular Ad Hoc Networks (VANETs) in a realistic urban environment, a specific road segment was selected. This segment, connecting the Pontificia Universidad Católica del Ecuador-Esmeraldas to the Multiplaza shopping center and spanning approximately 1.4 kilometers, was chosen for its ability to represent a dense and complex traffic scenario. The area bounded by Eugenio Espejo, Pichincha, Muriel, and Pedro Vicente Maldonado streets, characterized by intersections, traffic lights, and varying traffic flow, was defined as the study area (see Figure 3).
Figure 3.
Analysis Map of PUCESE and Multiplaza Shopping Mall
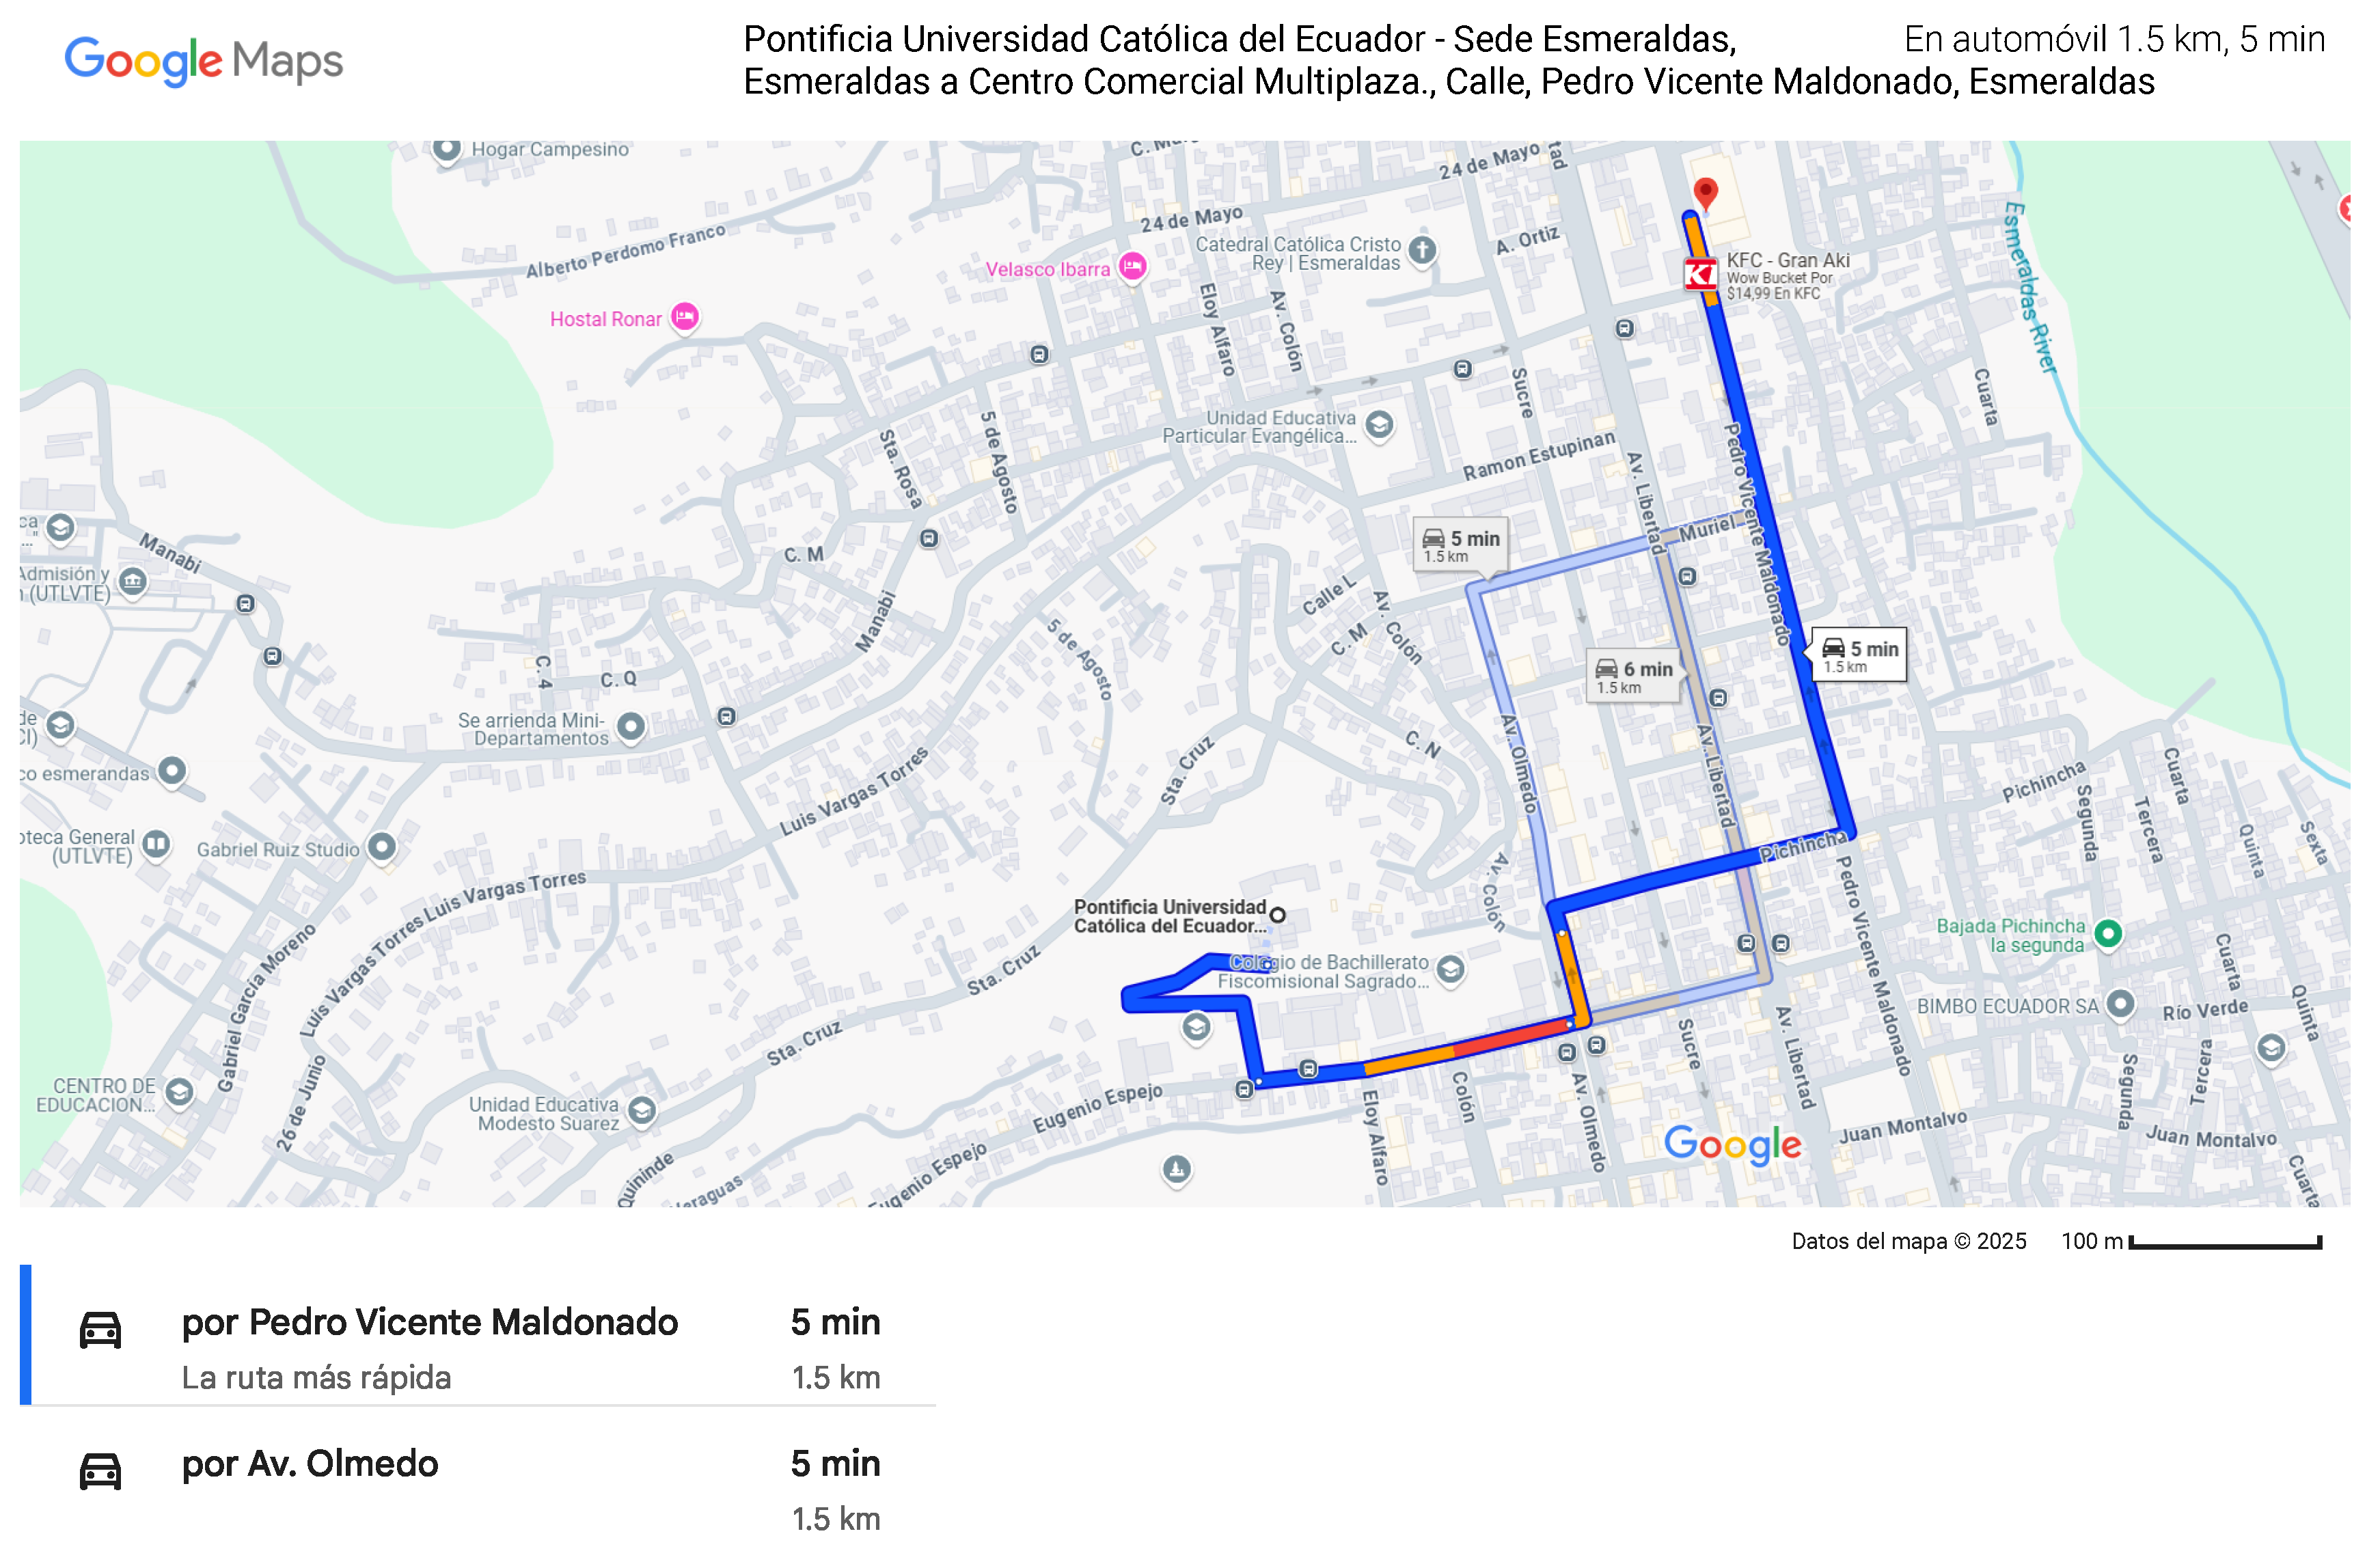
The different color codes of live traffic in the selected analysis area represent traffic speed on the road. According to Google, the official colors are as follows (see Table 1)
Geographic coordinates were obtained for the initial point, situated at the Pontifical Catholic University of Ecuador, Esmeraldas Campus (PUCESE), and the terminal point, located at the Multiplaza shopping mall, a key landmark in the city. These points were strategically chosen to represent routes of significant importance regarding vehicular traffic and urban mobility (see Table 2).
The map is composed of a structure of segments and nodes, which represent roads and their intersections, respectively. To customize the study area and make specific adjustments, it is necessary to use an additional tool called NETEDIT, which is integrated into the SUMO software. This tool allows for the graphical modification, editing, and optimization of the traffic network, facilitating the adaptation of the model to the specific needs of the analysis (see Figure 4).
Figure 4.
Node routes from PUCESE to Multiplaza
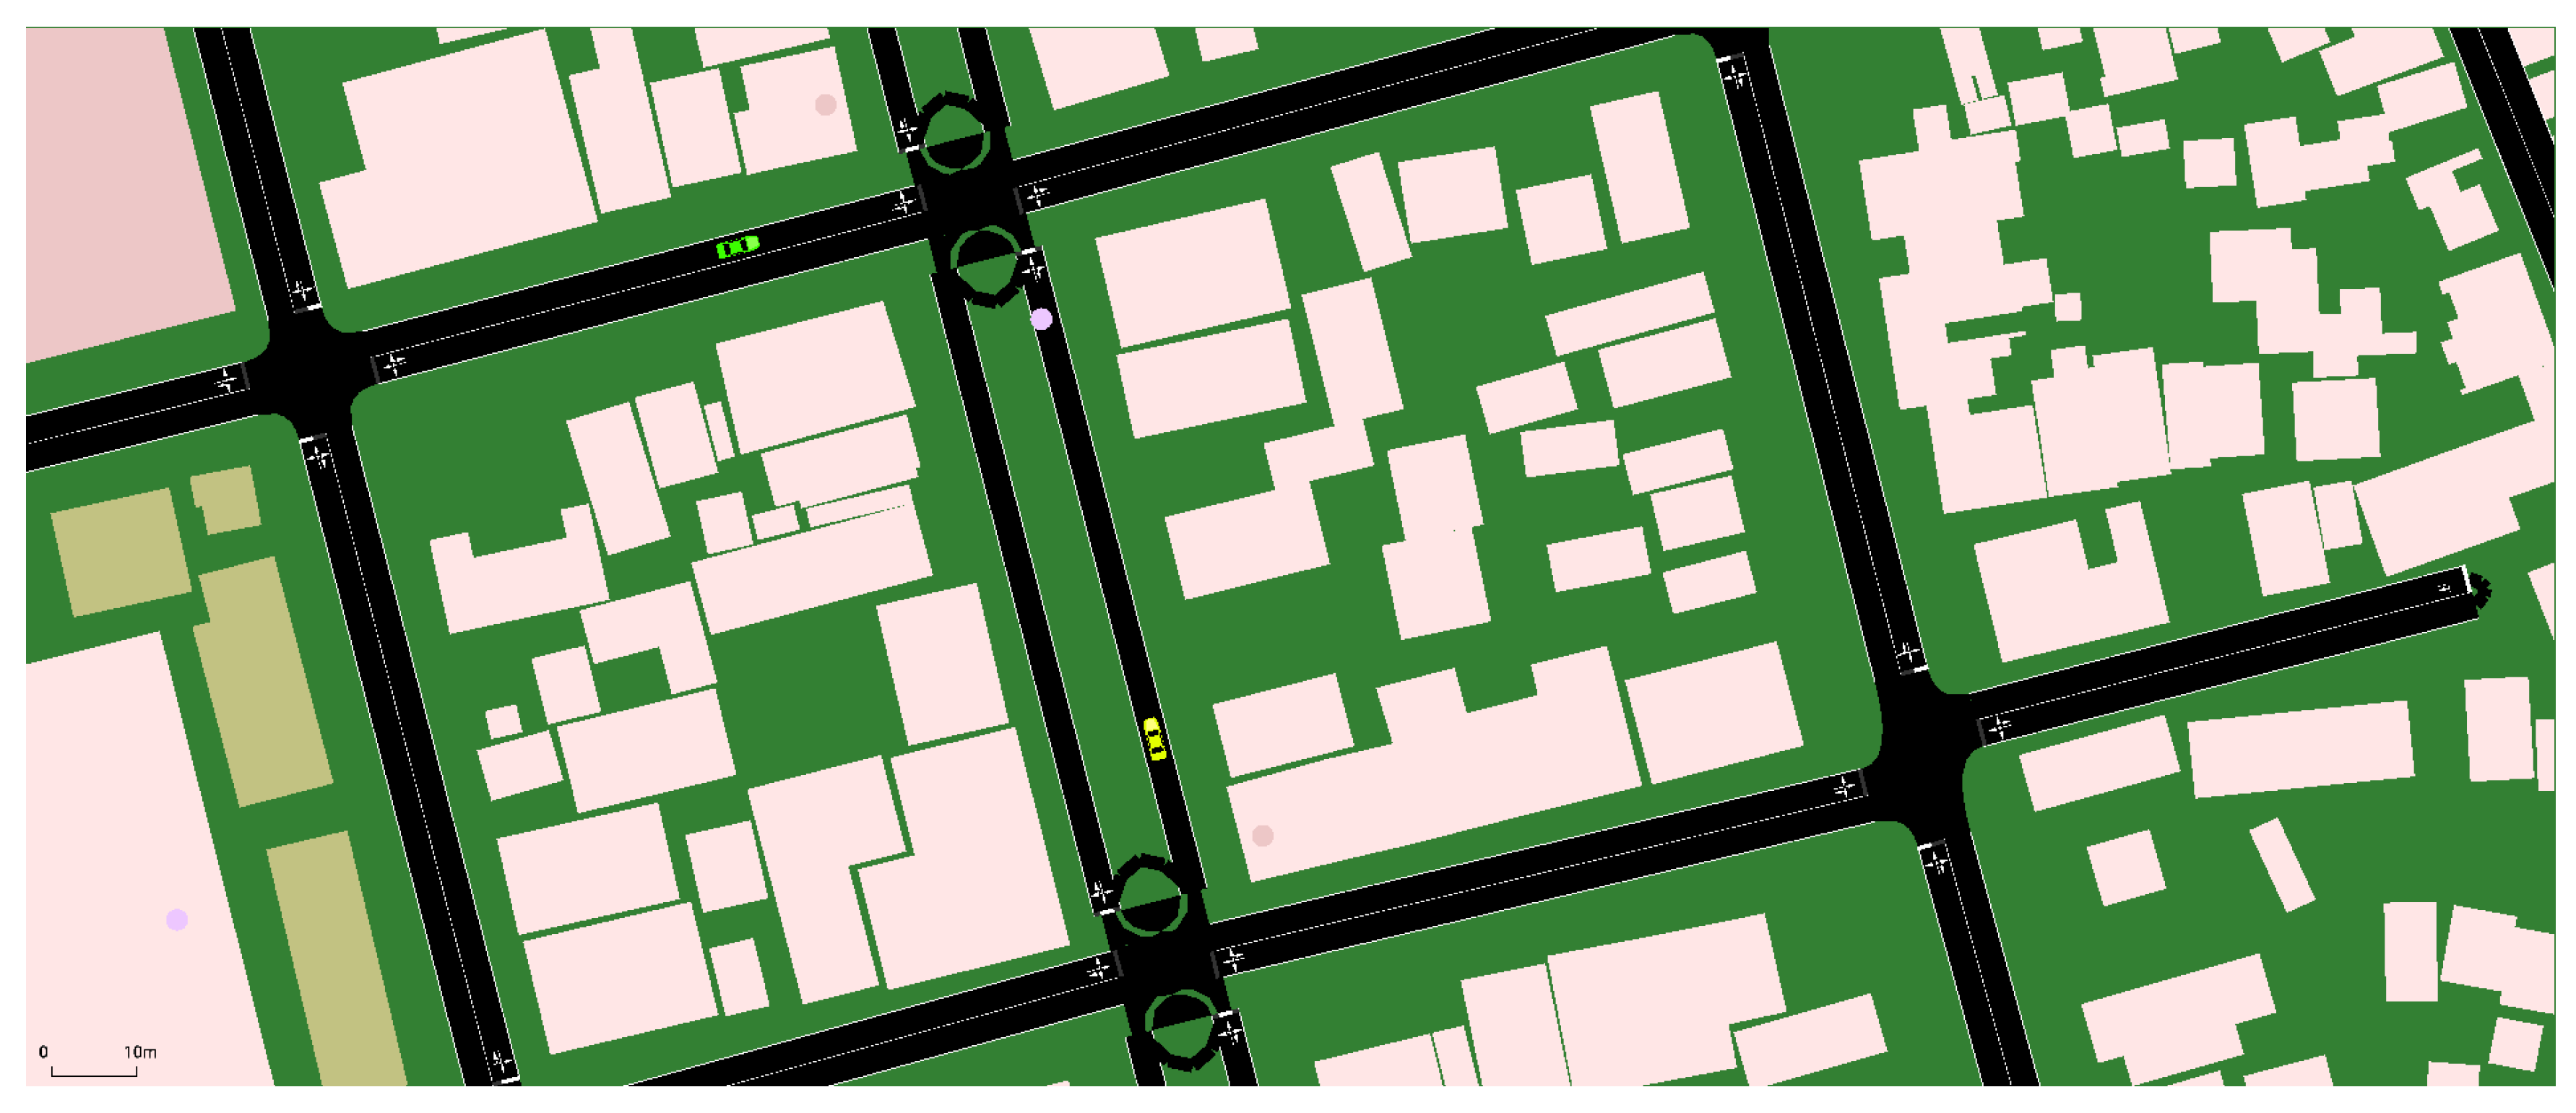
Examination of the nodal distribution across the various avenues indicates that certain nodes are common to multiple road segments, thus revealing the presence of key intersections or connectivity within the road network topology. For example, node 1143931858 is shared between the Espejo and Olmedo Avenue segments. Similarly, node 1143925281 connects the Olmedo and Pichincha Avenue segments, while node 1143927931 is located at the intersection of the Pichincha and Maldonado Avenue segments, further substantiating the identification of critical intersection points.
Conversely, avenues exhibiting a higher nodal count, such as Maldonado, which comprises three nodes, may correspond to longer road segments or areas with a higher concentration of points of interest within the network topology. Furthermore, the shared presence of certain nodes across different avenues may serve as an indicator of their significance in traffic flow analysis, as these areas may coincide with regions of increased congestion or strategic points within the road network (see Table ??).

Table 3.
Study area nodes
| 1lAvenue | Nodes |
|---|---|
| 1143925089 | |
| Espejo | 1143926012 |
| 1143931858 | |
| Olmedo | 1143931858 |
| 1143925281 | |
| Pichincha | 1143925281 |
| 1143927931 | |
| Maldonado | 1143927931 |
| 1143927077 | |
| 1142711596 |
To define the routes, modifications were made to the osm.passenger.trips.xml file. This file contains the specifications necessary to simulate vehicle trajectories in the virtual environment. However, to ensure that the simulation accurately reflects real-world traffic conditions, it is essential to analyze the characteristics of the main streets beforehand, especially those with higher traffic intensity.
This analysis allows for the identification of vehicular flow patterns and typical traffic concentrations, which are essential for reproducing realistic scenarios. Based on this data, a reasonable vehicle load can be established that faithfully reflects the conditions observed in real life, ensuring that the simulation accurately captures traffic dynamics and facilitates the evaluation of management or intervention strategies.
Therefore, the calibration of routes and vehicle loads becomes a key process to more accurately emulate behaviors under real urban conditions (see Table 4).
This scenario simulates real-world urban conditions, enabling the evaluation of routing algorithms and vehicular communication protocols designed to optimize traffic flow and minimize congestion. Through detailed simulations, the study aims to analyze the capability of VANETs to generate alternative routes, reduce travel times, and enhance road safety.
The selection of this specific road segment provides a solid foundation for future research in vehicular networks and intelligent urban traffic management. By simulating vehicle behavior in this controlled environment, empirical data can be obtained to validate theoretical models and compare the performance of different mobility strategies (see Table 5).
The simulation conducted in the context of Vehicular Ad Hoc Networks (VANETs) provided realistic results by considering a variety of traffic scenarios. Evaluated factors included vehicle density, vehicle movement patterns, and specific traffic conditions, allowing for modeling representative scenarios of real-world vehicular network behavior. These scenarios enabled the assessment of network performance under diverse circumstances, providing valuable insights into its performance in terms of metrics such as latency, packet loss, and throughput (see Table 6).
The analysis of the overall average speed indicates that vehicles travel at an average speed of 21.9 km/h. Furthermore, the distance between the Pontifical Catholic University of Ecuador, Esmeraldas Campus (PUCESE), and the Multiplaza Shopping Center has been determined to be approximately 1.5 km.
To calculate the time required to cover this distance at the average speed, the following formula is used:
In this case, substituting the values yields:
This value is then converted from hours to minutes using the following operation:
Therefore, the estimated travel time between PUCESE and the Multiplaza Shopping Center, considering an average speed of 21.9 km/h, is approximately 4.08 minutes.
A key aspect of this analysis is that the accuracy and applicability of the obtained results are directly influenced by the mathematical models and algorithms employed in the simulation. The defined assumptions and specific configurations used in setting up the simulator play a decisive role in the outcomes. For example, parameters such as the mobility model, the communication protocol used, or the representation of environmental interferences can have a significant impact on the obtained performance metrics.
4.2. Average Speeds per 10-Minute Interval and Lane
Congestion is identified by a True value in the congestion column, indicating that the average speed for that lane during a specific time interval is below the pre-established congestion threshold, which in this case is 10 km/h. This congestion value signals that traffic in that lane has slowed down, which may be due to a buildup of vehicles that reduces the speed of traffic flow (see Figure 5).
For example, the lane with the identifier -412782454 has an average speed of 7.82 km/h, which is below the 10 km/h threshold. As a result, this lane is marked as congested (congestion=True), indicating that traffic speed in that lane has decreased significantly during that time interval.
Figure 5.
Filtered Data: Average Speed vs Time Interval
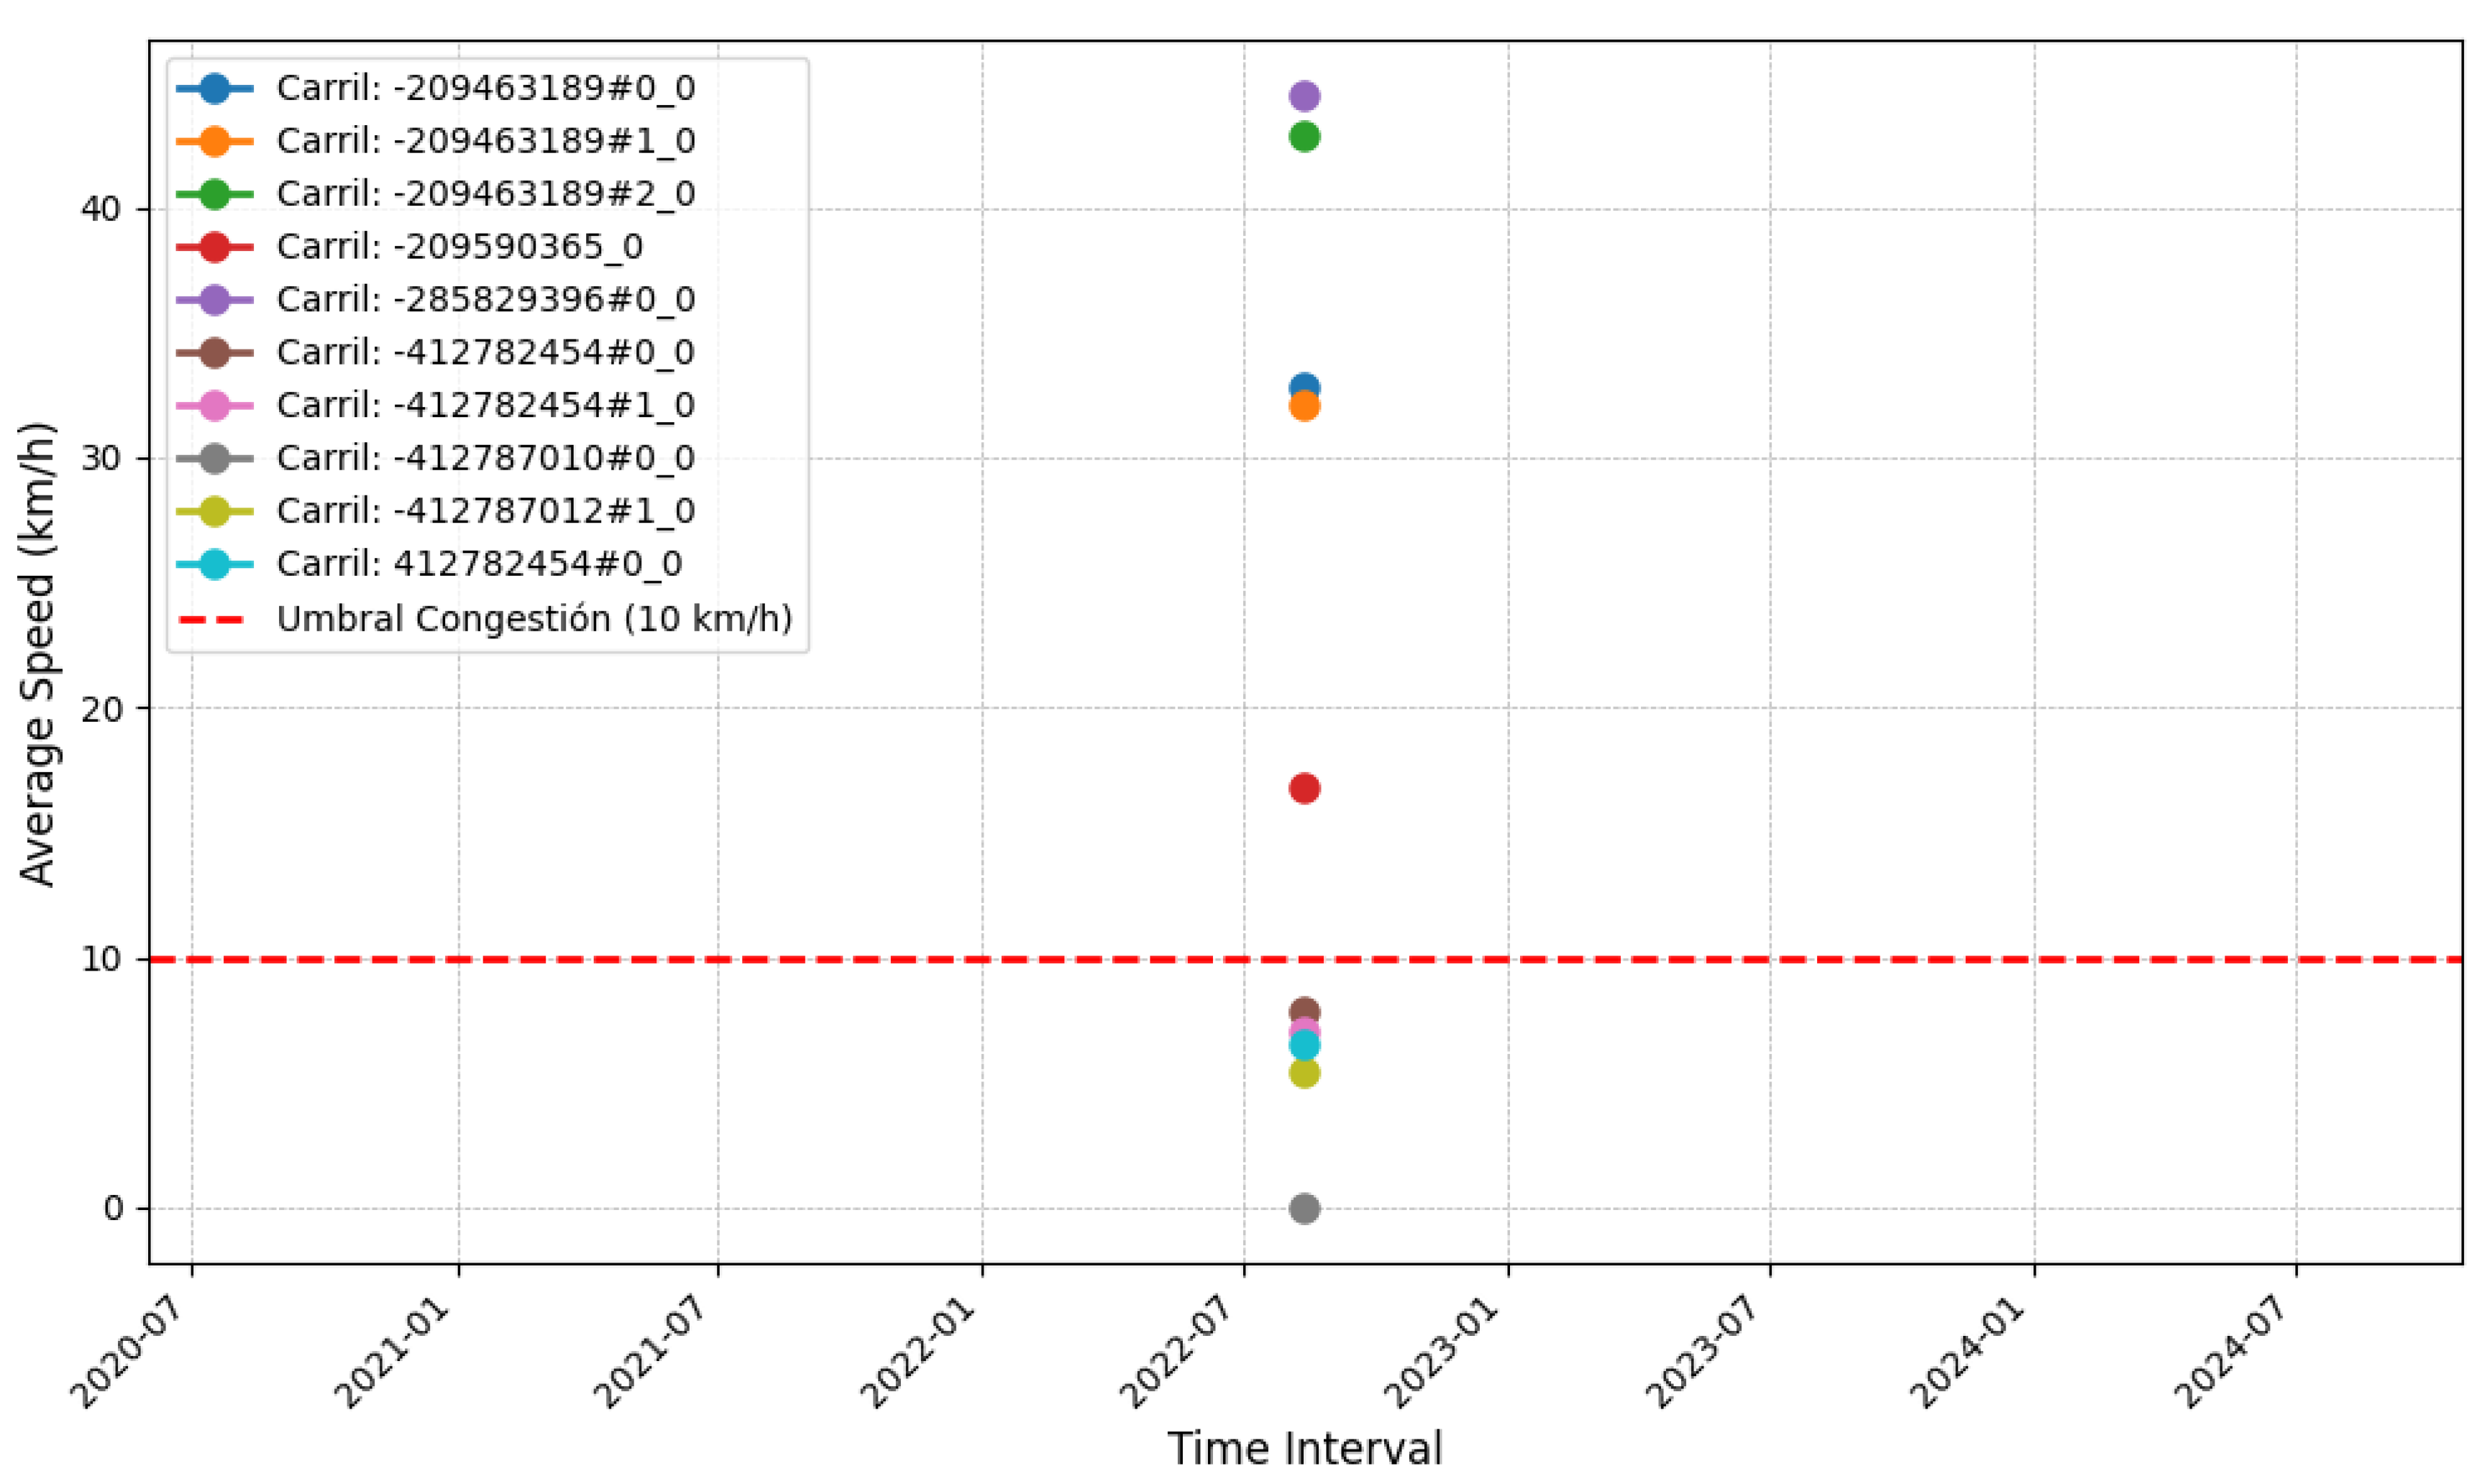
Similarly, the lane identified as:1142348508 has an average speed of 9.53 km/h, also below 10 km/h, which is also classified as congestion (congestion=True). This suggests that in this lane, the traffic flow experienced a decrease in speed during the same interval.
This type of analysis is crucial for monitoring traffic behavior and detecting potential congestion points over time in different lanes. By identifying these congested intervals, it is possible to implement measures to alleviate congestion or improve traffic management, optimizing vehicle circulation and reducing waiting times (see Table 7).
4.3. Congestion Prediction (Machine Learning Model)
The metrics employed to evaluate the model’s performance are fundamental to understanding its predictive capabilities. Each metric is detailed below (see Table 8):
Precision Precision measures the proportion of correct positive predictions among all positive predictions. It is a critical metric for assessing the model’s ability to avoid false positives, instances where a negative is incorrectly classified as positive.
Recall Recall measures the proportion of actual positives that were identified correctly. It is crucial in scenarios where false negatives (failing to identify a positive instance) are costly, such as in traffic congestion detection. Formula:
F1-Score The F1-Score is the harmonic mean of precision and recall, providing a single metric to evaluate a model. It is particularly useful when dealing with imbalanced classes as it considers both false positives and false negatives. Formula:
Support Support simply refers to the number of actual occurrences of a class in the dataset. It provides context for interpreting the class balance and the significance of the reported metrics. Interpretation of Classification Report The model was evaluated on two primary classes: "No Congestion" (Class 0) and "Congestion" (Class 1). The results indicate exceptional performance as follows:
By Class:
Class 0 (No Congestion): Support: 12,628 instances (96.38% of total). Precision, Recall, and F1-Score: 1.00. This implies the model correctly classifies all "No Congestion" instances without errors. This ideal result might be attributed to the strong correlation between the used features (speed, time, day) and the absence of congestion. Class 1 (Congestion): Support: 474 instances (3.62Precision, Recall, and F1-Score: 1.00. Despite being a minority class, the model correctly identifies all congestion instances. Achieving such precision in a minority class is uncommon in imbalanced datasets and might indicate overfitting. Overall Performance:
Accuracy: Value: 1.00. Represents the proportion of correct predictions across all instances. Formula:
Macro Average: The arithmetic mean of precision, recall, and F1-Score, regardless of class support. Value: 1.00. Indicates the model treats both classes equally. Weighted Average: The weighted average of precision, recall, and F1-Score, considering class support. Value: 1.00. Reflects the model’s excellent performance across both majority and minority classes.
Figure 6.
Confusion matrix
5. Discussion
Subsequently, the research question is analyzed, considering the results obtained from the conducted experiments.
5.1. Addressing the Research Question
The initial research question was: How can machine learning be applied to analyze VANET data to predict vehicular congestion at urban intersections with high accuracy?.
In the context of increasing urbanization and the rising number of vehicles on the road, the need for advanced traffic management systems has intensified. In this scenario, machine learning (ML) emerges as a promising tool for addressing complex problems such as predicting vehicular congestion at urban intersections with a high degree of accuracy.
5.2. VANET Modeling and Simulation
The use of vehicular ad hoc networks (VANETs) as a simulation platform proved fundamental for analyzing traffic patterns and evaluating the impact of different management strategies. In this study, an urban segment with high vehicular density and complex intersections was selected. This simulation enabled the collection of key empirical data, such as average speeds, movement patterns, and traffic conditions, essential for training machine learning models.
Previous studies, such as [36], have emphasized that the fidelity of data generated in simulations depends on their realism, as this ensures they reflect real-world urban dynamics.
5.3. Congestion Detection Based on Average Speeds
The approach based on analyzing average speeds per time interval and lane proved effective in identifying congestion situations. A speed threshold of 10 km/h was used to classify road segments as congested. This data, after being processed using clustering and supervised labeling techniques, was integrated into robust datasets for training predictive models.
According to [3], combining this type of data with machine learning algorithms improves the ability to detect congestion early and facilitates the implementation of corrective measures.
5.4. Performance of Predictive Models
The Random Forest model achieved perfect metrics (precision, recall, and F1-score of 1.00) in both classes: congestion and no congestion. These results highlight the model’s ability to classify data correctly. However, they should be interpreted with caution, as the class imbalance (96.38% non-congested versus 3.62% congested) may have influenced the performance.
In studies [1], it has been noted that in scenarios with imbalanced data, techniques like oversampling, undersampling, or cost-sensitive learning are useful to mitigate potential biases towards the majority class.
5.5. Potential of Machine Learning in Congestion Prediction
Machine learning offers multiple advantages for analyzing VANET data: Integration of multiple variables: Models can include additional factors, such as weather conditions, peak hours, and historical traffic patterns, improving the accuracy of predictions [37].
Adaptability to changing conditions: Algorithms can dynamically adjust to new traffic conditions, enabling real-time predictions. Generation of intervention strategies: Models can identify congestion patterns and propose solutions such as alternative routes or adaptive traffic signal control strategies to alleviate traffic.
5.6. Potential of Machine Learning in Congestion Prediction
Limitations and Future Opportunities While the results are promising, there are aspects that need to be addressed: Data quality and diversity: The representativeness of the data used to train the models is key to the accuracy of predictions. Greater integration with IoT sensors could improve data quality and variety.
Scalability: Adapting the model to larger and more complex urban networks represents a significant challenge. Techniques like federated learning could facilitate large-scale distributed analysis.
Validation in real-world environments: Although simulations are useful, they should be complemented with tests in real-world scenarios to evaluate the practical applicability of the proposed solutions [38].
In summary, the application of machine learning to VANET data analysis has the potential to revolutionize urban traffic management, providing accurate, adaptive, and scalable tools to address one of the major challenges of modern cities.
6. Conclusions
This research evaluated the application of machine learning to the analysis of vehicular ad hoc network (VANET) data to predict vehicular congestion at urban intersections with high accuracy. In this regard, the implemented simulation model, based on a representative urban segment, proved to be an effective tool for collecting empirical data necessary for the analysis and validation of traffic management strategies. Specifically, the selection of the road segment between PUCESE and the Multiplaza shopping center provided a realistic and complex scenario, which was essential for evaluating the performance of vehicular communication algorithms and protocols.
Furthermore, the use of average speed thresholds (< 10 km/h) to identify vehicular congestion resulted in an efficient methodology for generating datasets useful for predictive models. In this case, this simplified but robust approach allows for the early detection of critical traffic points, supporting its viability for continuous monitoring.
Regarding model performance, the Random Forest model achieved perfect metrics (precision, recall, and F1-score of 1.00) for both classes (congestion and no congestion). However, although these results reflect accurate classification, the marked imbalance in classes (96.38% non-congested and 3.62% congested) suggests the need to incorporate techniques such as oversampling or undersampling to avoid bias and improve generalization.
Finally, it is concluded that machine learning is a powerful tool for:
Firstly, integrating multiple variables, such as weather conditions and historical patterns, improving the accuracy of predictions.
Secondly, adapting dynamically to changing traffic conditions, allowing for real-time predictions.
Lastly, proposing intervention strategies such as alternative routes or adaptive traffic signal control, contributing to more efficient urban traffic management.
Funding
Please add: “This research received no external funding” or “This research was funded by NAME OF FUNDER grant number XXX.” and and “The APC was funded by XXX”. Check carefully that the details given are accurate and use the standard spelling of funding agency names at https://search.crossref.org/funding, any errors may affect your future funding.
Data Availability Statement
We encourage all authors of articles published in MDPI journals to share their research data. In this section, please provide details regarding where data supporting reported results can be found, including links to publicly archived datasets analyzed or generated during the study. Where no new data were created, or where data is unavailable due to privacy or ethical restrictions, a statement is still required. Suggested Data Availability Statements are available in section “MDPI Research Data Policies” at https://www.mdpi.com/ethics.
Acknowledgments
We express our sincere gratitude to Wilson Chango from PUCE Esmeraldas for his invaluable technical assistance and guidance in configuring the sensor systems and data acquisition processes for this research. This study was supported by PUCE Esmeraldas. Additionally, we acknowledge the facilities and general support provided by the Department of Computer Sciences, which greatly contributed to the successful completion of this work).
Conflicts of Interest
The authors declare that they have no conflict of interest related to this article.
References
- Kumar, P.G.; Lekhana, P.; Tejaswi, M.; Chandrakala, S. Effects of vehicular emissions on the urban environment- a state of the art. Materials Today: Proceedings 2021, 45, 6314–6320. [CrossRef]
- Chango, W.; Logroño, S.; Játiva, M.; Aguilar, P. Vehicular Ad-Hoc Network (VANET). Lecture Notes in Networks and Systems 2024, 870 LNNS, 160–176. [CrossRef]
- Berhanu, Y.; Alemayehu, E.; Schröder, D. Examining Car Accident Prediction Techniques and Road Traffic Congestion: A Comparative Analysis of Road Safety and Prevention of World Challenges in Low-Income and High-Income Countries. Journal of Advanced Transportation 2023, 2023, 6643412. [CrossRef]
- Ali, E.S.; Hasan, M.K.; Hassan, R.; Saeed, R.A.; Hassan, M.B.; Islam, S.; Nafi, N.S.; Bevinakoppa, S. Machine Learning Technologies for Secure Vehicular Communication in Internet of Vehicles: Recent Advances and Applications. Security and Communication Networks 2021, 2021, 8868355. [CrossRef]
- Boukerche, A.; Tao, Y.; Sun, P. Artificial intelligence-based vehicular traffic flow prediction methods for supporting intelligent transportation systems. Computer Networks 2020, 182, 107484. [CrossRef]
- Cárdenas, L.L.; Mezher, A.M.; Barbecho Bautista, P.A.; Astudillo León, J.P.; Igartua, M.A. A Multimetric Predictive ANN-Based Routing Protocol for Vehicular Ad Hoc Networks. IEEE Access 2021, 9, 86037–86053. [CrossRef]
- Molina-Campoverde, J.J.; Rivera-Campoverde, N.; Molina Campoverde, P.A.; Bermeo Naula, A.K. Urban Mobility Pattern Detection: Development of a Classification Algorithm Based on Machine Learning and GPS. Sensors 2024, Vol. 24, Page 3884 2024, 24, 3884. [CrossRef]
- Costa, V.G.; Pedreira, C.E. Recent advances in decision trees: an updated survey. Artificial Intelligence Review 2022 56:5 2022, 56, 4765–4800. [CrossRef]
- Paiva, S.; Ahad, M.A.; Tripathi, G.; Feroz, N.; Casalino, G. Enabling Technologies for Urban Smart Mobility: Recent Trends, Opportunities and Challenges. Sensors 2021, Vol. 21, Page 2143 2021, 21, 2143. [CrossRef]
- Faheem, H.B.; Shorbagy, A.M.E.; Gabr, M.E. Impact Of Traffic Congestion on Transportation System: Challenges and Remediations - A review. Mansoura Engineering Journal 2024, 49, 18. [CrossRef]
- Ali, Y.; Rafay, M.; Khan, R.D.A.; Sorn, M.K.; Jiang, H.; Ali, Y.; Rafay, M.; Khan, R.D.A.; Sorn, M.K.; Jiang, H. Traffic Problems in Dhaka City: Causes, Effects, and Solutions (Case Study to Develop a Business Model). Open Access Library Journal 2023, 10, 1–15. [CrossRef]
- Musa, A.A.; Malami, S.I.; Alanazi, F.; Ounaies, W.; Alshammari, M.; Haruna, S.I. Sustainable Traffic Management for Smart Cities Using Internet-of-Things-Oriented Intelligent Transportation Systems (ITS): Challenges and Recommendations. Sustainability 2023, Vol. 15, Page 9859 2023, 15, 9859. [CrossRef]
- Hosseinian, S.M.; Mirzahossein, H. Efficiency and Safety of Traffic Networks Under the Effect of Autonomous Vehicles. Iranian Journal of Science and Technology - Transactions of Civil Engineering 2024, 48, 1861–1885.
- Verma, S.K.; Verma, R.; Singh, B.K.; Sinha, R.S. Management of Intelligent Transportation Systems and Advanced Technology. Energy, Environment, and Sustainability 2024, Part F2419, 159–175. [CrossRef]
- Laanaoui, M.D.; Lachgar, M.; Mohamed, H.; Hamid, H.; Villar, S.G.; Ashraf, I. Enhancing Urban Traffic Management Through Real-Time Anomaly Detection and Load Balancing. IEEE Access 2024, 12, 63683–63700. [CrossRef]
- Aouedi, O.; Vu, T.H.; Sacco, A.; Nguyen, D.C.; Piamrat, K.; Marchetto, G.; Pham, Q.V. A Survey on Intelligent Internet of Things: Applications, Security, Privacy, and Future Directions. IEEE Communications Surveys and Tutorials 2024, [2406.03820]. [CrossRef]
- Tshibangu-Muabila, J.; Mouelhi, S.; Leserf, P.; Ramdane-Cherif, A. Refining SUMO Simulation Strategies for Realistic Traffic Patterns: Insights from Field Experience. 2023 7th International Conference on System Reliability and Safety, ICSRS 2023 2023, pp. 237–246. [CrossRef]
- Sun, S.; Yan, H.; Lang, Z. A study on traffic congestion prediction based on random forest model. Highlights in Science, Engineering and Technology 2024, 101, 738–749. [CrossRef]
- Majumdar, S.; Subhani, M.M.; Roullier, B.; Anjum, A.; Zhu, R. Congestion prediction for smart sustainable cities using IoT and machine learning approaches. Sustainable Cities and Society 2021, 64, 102500. [CrossRef]
- Blanka, C.; Krumay, B.; Rueckel, D. The interplay of digital transformation and employee competency: A design science approach. Technological Forecasting and Social Change 2022, 178, 121575. [CrossRef]
- Zounemat-Kermani, M.; Batelaan, O.; Fadaee, M.; Hinkelmann, R. Ensemble machine learning paradigms in hydrology: A review. Journal of Hydrology 2021, 598, 126266. [CrossRef]
- Schjerven Id, F.E.; Lindseth, F.; Steinsland, I. Prognostic risk models for incident hypertension: A PRISMA systematic review and meta-analysis. PubMed Central 2024. [CrossRef]
- Naqvi, S.B.; Ayton, L.J. A Periodic Extension to the Fokas Method for Acoustic Scattering by an Infinite Grating. Applied System Innovation 2025. [CrossRef]
- Angarita-Zapata, J.S.; Maestre-Gongora, G.; Calderín, J.F. A Bibliometric Analysis and Benchmark of Machine Learning and AutoML in Crash Severity Prediction: The Case Study of Three Colombian Cities. Sensors 2021, Vol. 21, Page 8401 2021, 21, 8401. [CrossRef]
- Abbasi, E.; Alavi Moghaddam, M.R.; Kowsari, E. A systematic and critical review on development of machine learning based-ensemble models for prediction of adsorption process efficiency. Journal of Cleaner Production 2022, 379, 134588. [CrossRef]
- Page, M.J.; Moher, D.; Bossuyt, P.M.; Boutron, I.; Hoffmann, T.C.; Mulrow, C.D.; Shamseer, L.; Tetzlaff, J.M.; Akl, E.A.; Brennan, S.E.; et al. PRISMA 2020 explanation and elaboration: updated guidance and exemplars for reporting systematic reviews. BMJ 2021, 372. [CrossRef]
- Ulvi, H.; Yerlikaya, M.A.; Yildiz, K. Urban Traffic Mobility Optimization Model: A Novel Mathematical Approach for Predictive Urban Traffic Analysis. Applied Sciences 2024, Vol. 14, Page 5873 2024, 14, 5873. [CrossRef]
- Kiangala, S.K.; Wang, Z. An effective adaptive customization framework for small manufacturing plants using extreme gradient boosting-XGBoost and random forest ensemble learning algorithms in an Industry 4.0 environment. Machine Learning with Applications 2021, 4, 100024. [CrossRef]
- Chiabaut, N.; Faitout, R. Traffic congestion and travel time prediction based on historical congestion maps and identification of consensual days. Transportation Research Part C: Emerging Technologies 2021, 124, 102920, [2011.05073]. [CrossRef]
- Lee, E.H.; Lee, E. Congestion boundary approach for phase transitions in traffic flow. Transportmetrica B: Transport Dynamics 2024, 12. [CrossRef]
- Ul Abideen, Z.; Sun, X.; Sun, C. Traffic flow prediction: A 3D adaptive multi-module joint modeling approach integrating spatial-temporal patterns to capture global features. Journal of Forecasting 2024, 43, 2766–2791. [CrossRef]
- Antoniadis, A.; Lambert-Lacroix, S.; Poggi, J.M. Random forests for global sensitivity analysis: A selective review. Reliability Engineering & System Safety 2021, 206, 107312. [CrossRef]
- Ng, S.; Masarone, S.; Watson, D.; Barnes, M.R. The benefits and pitfalls of machine learning for biomarker discovery. Cell and Tissue Research 2023, 394, 17–31.
- Shen, Y.; Jiang, S.; Chen, Y.; Yang, E.; Jin, X.; Fan, Y.; Campbell, K.D. To Explain or Not to Explain: A Study on the Necessity of Explanations for Autonomous Vehicles. preprints 2020, [2006.11684].
- Feroz Khan, A.B.; Ivan, P. Integrating Machine Learning and Deep Learning in Smart Cities for Enhanced Traffic Congestion Management: An Empirical Review. Journal of Urban Development and Management 2023, 2, 211–221. [CrossRef]
- Somanath, S.; Naserentin, V.; Eleftheriou, O.; Sjölie, D.; Wästberg, B.S.; Logg, A. Towards Urban Digital Twins: A Workflow for Procedural Visualization Using Geospatial Data. Remote Sensing 2024, Vol. 16, Page 1939 2024, 16, 1939. [CrossRef]
- Shaygan, M.; Meese, C.; Li, W.; Zhao, X.G.; Nejad, M. Traffic prediction using artificial intelligence: Review of recent advances and emerging opportunities. Transportation Research Part C: Emerging Technologies 2022, 145, 103921, [2305.19591]. [CrossRef]
- Fremont, D.J.; Kim, E.; Pant, Y.V.; Seshia, S.A.; Acharya, A.; Bruso, X.; Wells, P.; Lemke, S.; Lu, Q.; Mehta, S. Formal Scenario-Based Testing of Autonomous Vehicles: From Simulation to the Real World. 2020 IEEE 23rd International Conference on Intelligent Transportation Systems, ITSC 2020 2020, [2003.07739]. [CrossRef]
Table 1.
Google maps traffic color legend
| Colors | Legend |
|---|---|
| Green | No traffic delay |
| Orange | Average amount of traffic |
| Red | Traffic delay |
| Dark red | Very slow traffic speed or stopped vehicles |
Table 2.
Coordinates PUCESE - Multiplaza Shopping Mall
| Location | Latitude | Longitude |
|---|---|---|
| Pontifical Catholic University of Ecuador, Esmeraldas Campus | 0.9697314545985082 | -7.965.741.360.677.340 |
| Multiplaza Shopping Mall | 0.9765167208899496 | -796.534.656.373.013 |
Table 4.
File configuration for routes
| osm.net.xml, osm.passenger.trips.xml and osm.poly.xml files |
|---|
| <configuration xmlns:xsi="http://www.w3.org/2001/XMLSchema-instance" xsi:noNamespaceSchemaLocation="http://sumo.dlr.de/xsd/sumoConfiguration.xsd"> <input> <net-file value="osm.net.xml"/> //Road network archive <route-files value="osm.passenger.trips.xml"/> //Vehicle demand <additional-files value="osm.poly.xml"/> //polygons </input> <processing> <ignore-route-errors value="true"/> </processing> <routing> <device.rerouting.adaptation-steps value="18"/> <device.rerouting.adaptation-interval value="10"/> </routing> <gui_only> <gui-settings-file value="osm.view.xml"/> </gui_only> </configuration> |
Table 5.
Vehicle Movement Data
| No. | Vehicle | GPS Coordinates | Speed (km/h) | Edge | Lane | Displacement (m) | Rotation Angle |
| 1 | veh0 | [-79.6527244472348, 0.9724697345761849] | 0.00 | 416064999#0 | 416064999#0_0 | 0.00 | 256.58 |
| 2 | veh0 | [-79.65274218875825, 0.9724654799800492] | 7.31 | 416064999#0 | 416064999#0_0 | 2.03 | 256.58 |
| 3 | veh0 | [-79.6527770144728, 0.972457128422303] | 14.34 | 416064999#0 | 416064999#0_0 | 6.01 | 256.58 |
| 4 | veh0 | [-79.65283420828086, 0.9724434127688836] | 23.55 | 416064999#0 | 416064999#0_0 | 12.56 | 256.58 |
| 5 | veh0 | [-79.65290650082167, 0.9724260762846564] | 29.77 | 416064999#0 | 416064999#0_0 | 20.83 | 256.58 |
| 6 | veh0 | [-79.6529912316884, 0.9724057569608561] | 34.90 | 416064999#0 | 416064999#0_0 | 30.52 | 256.58 |
| 7 | veh0 | [-79.653090648525, 0.9723819157880809] | 40.94 | 416064999#0 | 416064999#0_0 | 41.89 | 256.58 |
| 8 | veh1 | [-79.65547536705684, 0.9726013953539084] | 0.00 | -98769545#0 | -98769545#0_0 | 0.00 | 151.07 |
| 9 | veh0 | [-79.65320457887624, 0.9723545941209514] | 46.92 | 416064999#0 | 416064999#0_0 | 54.93 | 256.58 |
| 10 | veh1 | [-79.65546332004871, 0.9725893245511535] | 6.81 | -98769545#0 | -98769545#0_0 | 1.89 | 143.21 |
| 11 | veh0 | [-79.6532899510483, 0.9723341209944739] | 35.16 | 416064999#0 | 416064999#0_0 | 64.69 | 256.58 |
| 12 | veh1 | [-79.65543637050122, 0.9725623217742456] | 15.23 | -98769545#0 | -98769545#0_0 | 6.12 | 134.85 |
| 13 | veh0 | [-79.65334443155311, 0.972321056006417] | 22.44 | 416064999#0 | 416064999#0_0 | 70.93 | 256.58 |
| 14 | veh1 | [-79.65540097928533, 0.972526860655301] | 20.01 | -98769545#0 | -98769545#0_0 | 11.68 | 134.85 |
| 15 | veh1 | [-79.65535672981196, 0.972482523782328] | 25.01 | -98769545#0 | -98769545#0_0 | 18.63 | 134.85 |
| 16 | veh1 | [-79.655299346461, 0.9724196949266831] | 33.97 | -98769545#0 | -98769545#0_0 | 28.07 | 137.78 |
| 17 | veh0 | [-79.65343859808162, 0.9721813555896256] | 28.01 | 99172472#8 | 99172472#8_0 | 94.52 | 165.66 |
| 65508 | veh1 | [-79.65523237359902, 0.972335033453903] | 43.12 | -98769545#0 | -98769545#0_0 | 40.04 | 143.35 |
Table 6.
Add caption
| Lane | Cluster start | Cluster end | Speed |
|---|---|---|---|
| -376593940#1 | 1143927076 | P_Don_Bosco | 22,2 |
| -376593940#0 | P_Don_Bosco | P_I_Cementerio | 22,2 |
| -98881766#7 | cluster_1143931389_1143931671 | 1389_1143931671 | 22,2 |
| -98881766#5 | cluster_1143931389_1143931671 | cluster_1143925301_1143931836 | 22,2 |
| -98881766#3 | 1143931858 | cluster_1143925301_1143931836 | 22,2 |
| -98881766#2 | 1143931858 | cluster_1143925021_1143927211 | 22,2 |
| 285832009#0 | cluster_1143925021_1143927211 | cluster_1143929880_1143932435 | 22,2 |
| 285832009#1 | cluster_1143929880_1143932435 | cluster_1143926346_1143929933 | 21,2 |
| 285832009#2 | cluster_1143926346_1143929933 | cluster_1143926446_1143932048 | 22,2 |
| 285832009#3 | cluster_1143926446_1143932048 | cluster_1142711217_1142713649 | 22,2 |
| 98769527#2 | cluster_1142711217_1142713649 | 1142711596 | 13,9 |
| -98739478#6 | 1142711596 | cluster_1142544813_1142545892 | 27,8 |
| Average | 21,9 | ||
Table 7.
Congested intervals and lanes
| N° | Interval_10min | Vehicle_travel_lane | Average_speed | Congestion |
|---|---|---|---|---|
| 1 | 12/8/2022 18:20 | -412782454#0_0 | 7,82 | True |
| 2 | 12/8/2022 18:20 | -412782454#1_0 | 7,62 | True |
| 3 | 12/8/2022 18:20 | -412787010#0_0 | 9,32 | True |
| 4 | 12/8/2022 18:20 | -412787012#1_0 | 5,40 | True |
| 5 | 12/8/2022 18:20 | :1142348508_0_0 | 9,53 | True |
| 6 | 12/8/2022 18:20 | :1142349518_7_0 | 8,94 | True |
| 7 | 12/8/2022 18:20 | :1142545047_10_0 | 9,52 | True |
| 8 | 12/8/2022 18:20 | :1142545329_1_0 | 9,86 | True |
| 310 | ... | ... | ... | ... |
Table 8.
Metric to evaluate model performance
| 1cMetrics | Accuracy | Recall | F1-score | Support |
|---|---|---|---|---|
| 0 | 1.00 | 1.00 | 1.00 | 12628 |
| 1 | 1.00 | 1.00 | 1.00 | 474 |
| accuracy | 1 | 1.00 | 13102 | |
| macro avg | 1.00 | 1.00 | 1.00 | 13102 |
| weighted avg | 1.00 | 1.00 | 1.00 | 13102 |
Disclaimer/Publisher’s Note: The statements, opinions and data contained in all publications are solely those of the individual author(s) and contributor(s) and not of MDPI and/or the editor(s). MDPI and/or the editor(s) disclaim responsibility for any injury to people or property resulting from any ideas, methods, instructions or products referred to in the content. |
© 2025 by the authors. Licensee MDPI, Basel, Switzerland. This article is an open access article distributed under the terms and conditions of the Creative Commons Attribution (CC BY) license (http://creativecommons.org/licenses/by/4.0/).
Copyright: This open access article is published under a Creative Commons CC BY 4.0 license, which permit the free download, distribution, and reuse, provided that the author and preprint are cited in any reuse.


