1. Introduction
With the current electrification efforts to move away from fossil fuels, the United States Government (U.S.) has set goals for clean electricity by 2035 and net-zero emissions by 2050 [
1]. To achieve net-zero by 2050, it is crucial to find cleaner ways to produce sustainable electricity and eliminate the use of fossil fuels. Solid Oxide Fuel Cells (SOFCs) could be a steppingstone in the path for cleaner electricity. Some of the advantages that SOFCs have over other technologies are their fuel flexibility, high efficiency, and low emissions. A report by IDTechEx has shown how SOFCs could use hydrocarbons as fuel, such as natural gas (NG) and biofuels, but also use zero/low emissions fuels like hydrogen (H
2) and ammonia (NH
4) [
2]. Additionally, studies have demonstrated SOFCs reaching an electrical efficiency of 50 – 60% depending on the conditions, with possibilities of increasing it even further with other techniques, such as pressurization and hybridization [
3,
4,
5]. The potential hybridization techniques include combining SOFCs with gas turbines (GT) or internal combustion engines (ICE).
Studies on SOFC-GT systems have demonstrated high efficiencies when paired with SOFCs, although integration challenges remain. Control schemes for GTs are complex, especially when operating conditions change, which makes the hybridization process more difficult. In an SOFC hybrid power generator, demand fluctuations can occur, leading to a reduction in GT operational efficiency. This, in turn, lowers the overall system efficiency if operational conditions deviate too much from the design point. Additionally, GTs are much more expensive than ICEs, increasing the cost per kilowatt (
$/kW). [
6,
7,
8,
9].
ICEs are an excellent solution for this type of power generation for many reasons, such as operational range, cost effectiveness, startup time, and simpler controls. Many studies have shown that ICEs could achieve similar performance to GTs, simplifying the controls with minimal drawbacks [
10,
11,
12,
13]. The two types of engines mostly used for hybridization are homogeneous charge compression ignited (HCCI) and spark ignited (SI). Researchers from Seoul National University have shown brake thermal efficiencies as high as 33.9% for HCCI engines that have led to hybrid system efficiencies close to 60% [
11]. The main concern the researchers noted when integrating HCCIs in a SOFC power generator is their sensitivity to temperature and pressure for auto-ignition [
14,
15,
16]. Since there is no direct way to control ignition, these two properties need to be at a certain range for the engine to combust the fuel mix, having similar problems as GTs when the conditions diverge from the design point. In a configuration where the engine is downstream of the SOFC, their narrow range of operations could cause issues since both properties were dependent on SOFC fuel utilization. Alternatively, SI engines can control ignition without being fully dependent on operational conditions. Consequently, researchers from Stony Brook University, Seoul National University, and Colorado State University (CSU) have tested the feasibility of using SI engines instead of HCCI for residual power generation.
Seoul National University demonstrated comparable performance and emissions to HCCI without the added complexity of controls, and they improved their SOFC-ICE model, achieving an overall system efficiency of 63.2%, up from the previously reported 59%. Meanwhile, Stony Brook University tested a SI engine running with a fuel blend representative of anode gas to compare the performance at three different water vapor rates. The results showed a maximum brake thermal efficiency (BTE) of 33.9% as part of a 1.1 MW SOFCI-HCCI model system with an estimated electrical efficiency of 70% [
10,
13,
17]. CSU has focused many of their efforts to model and experimentally test Sis with anode gas. Researcher Padhi [
18] developed a predictive model to simulate the combustion of anode gas in spark ignited CFR engine. The findings from this study were experimentally validated by researcher Balu who tested and optimized seven variations of anode gas with varying dewpoint temperatures [
19]. Results showed that the optimal system would include a water dropout heat exchanger to a dewpoint of 40°C to achieve a 2.5% water volume in the fuel with a brake thermal efficiency (BTE) of 22.2%. This led to further experimental optimization by researcher Countie of a diesel derived SI engine for further testing of anode fuels with spark assisted ignition [
20]. Results showed a maximum BTE of 27.37% at 1600rpm with a brake power of 5.77kW. Lastly, the engine model was further refined by Valles Castro by simulating different piston geometries and spark plug positions to find the optimal engine configuration for maximum efficiency [
21]. The results from these previous CSU studies were used to inform the design choices for the current research including compression ratio, piston geometry, and engine speed. The findings from all these institutions strongly support Sis as one of the best options for hybridization with SOFCs.
Despite the current research in SI engine use for SOFC hybridization, there are several gaps in the operational flexibility under varying SOFC loads. Nearly all the current research has included brake thermal efficiency optimization for SI engines operating on anode tail gas, but only Balu et al., Choi et al., and Nikiforakis et al. considered anode tail gas composition variation [
10,
11,
19]. In addition, these three studies have focused on composition variation at constant load, but in real-world scenarios, the engine will need to respond to changes in composition and fuel flow depending on fuel cell utilization and overall system power demand. There has yet to be a study which has focused on an experimental SI engine which is optimized at a variety of compositions and loads. This research aims to fill this gap and use the optimization results to suggest a simple control strategy that can be used to operate an SI engine in a SOFC-ICE hybrid system.
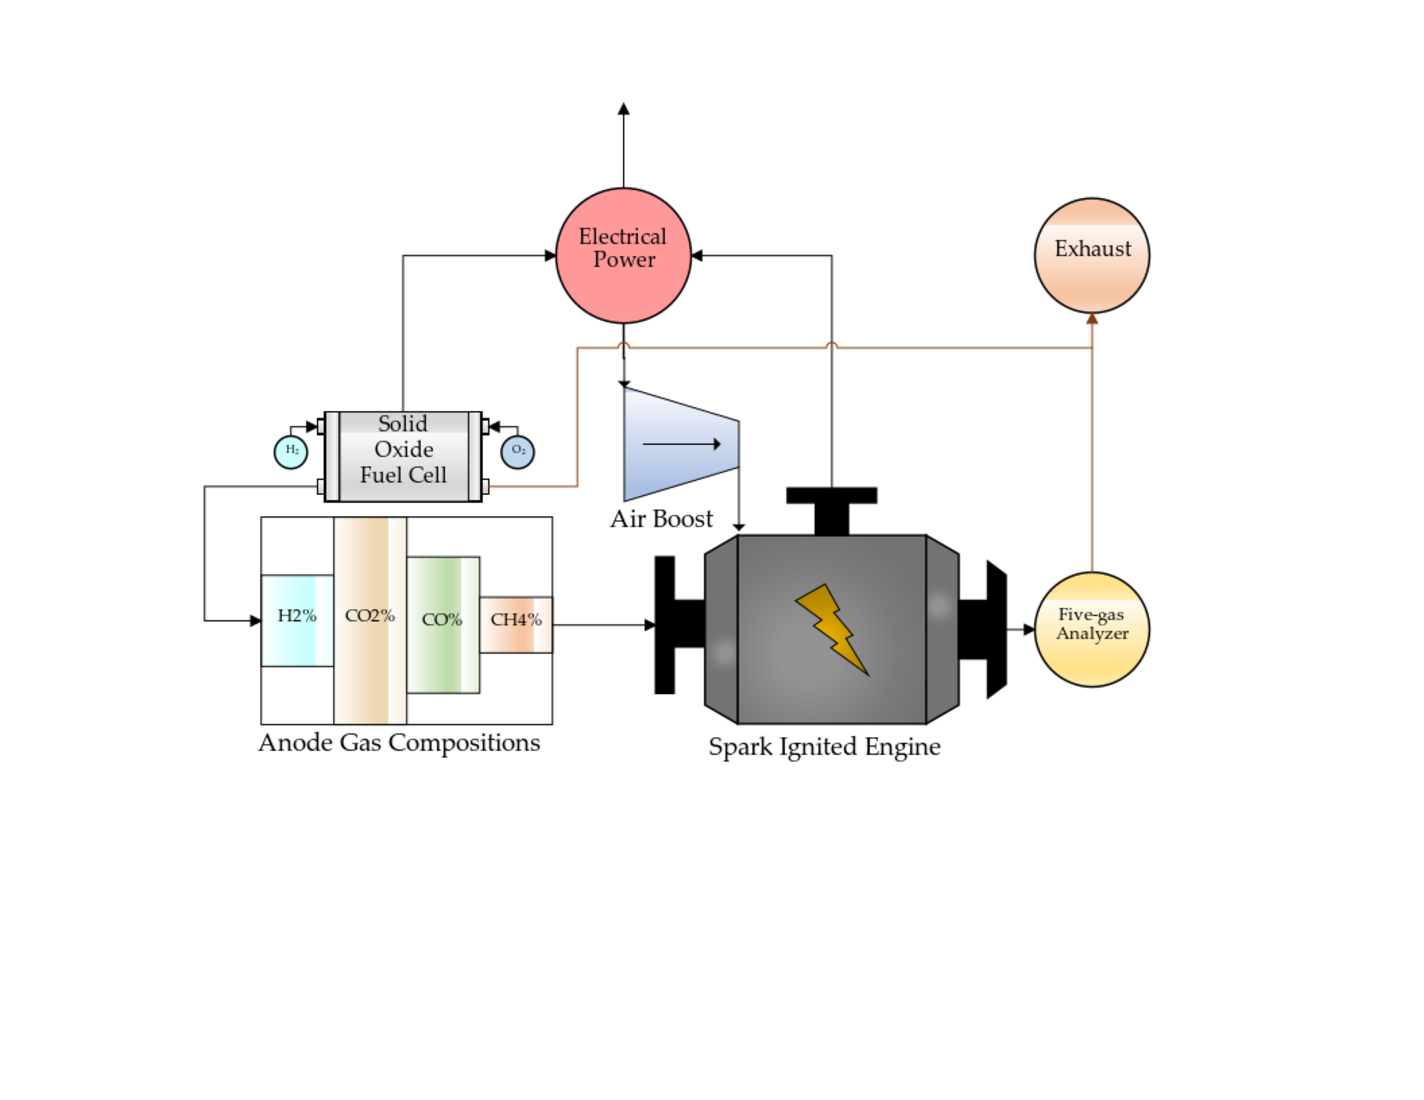
The hybrid system which this research is a part of is being developed under the ARPA-e INTEGRATE program and the full system flow chart has been displayed in previous publications [
22]. The system begins by processing the natural gas entering the system to remove any impurities that could advance the degradation of the Ceres Power SOFC modules. While details for the SOFC stack are proprietary, they include planar architecture with a ferritic-steel support and ceria electrolyte [
23,
24]. Physical dimensions of one stack are shown in
Table 1. The natural gas enters the recycle loop which is preheated and sent to the SOFC. After the SOFC uses most of the available fuel, high temperature anode gas (~ 630° C) is redirected back through the recycle loop to heat up the incoming fuel. A portion of anode gas is directed to an SI engine to combust the remaining fuel. The power produced by the engine is turned into electricity, which is used to power the auxiliary components needed for SOFC operation, increasing the overall efficiency of the system. The combination of these techniques and other optimization to the auxiliary components (compressors, heat exchangers, etc.) have the possibility of achieving overall system efficiency of over 70% of the lower heating value (LHV) at 80 kW of power generation, with a cost < 900
$/kW with low emissions [
22].
The purpose of this research was to experimentally test the SI engine within the hybrid system over a range of expected fuel compositions, optimize the engine for varying anode tail gas blends, and generate a set of operational conditions that could sustain maximum performance during operation. The optimization included finding the best spark timing to achieve maximum power generation, adjusting supercharger boost to reduce power losses, analyzing emissions data for all fuel blends, and performing a speed sweep to choose the optimal RPM. These tests provide a deeper understanding of Sis running with anode fuels, as this technology is the least researched in SOFC hybridization. Lastly, the findings of this research could also be used as the foundation of a future automated control scheme for anode fueled engines.
2. Materials and Methods
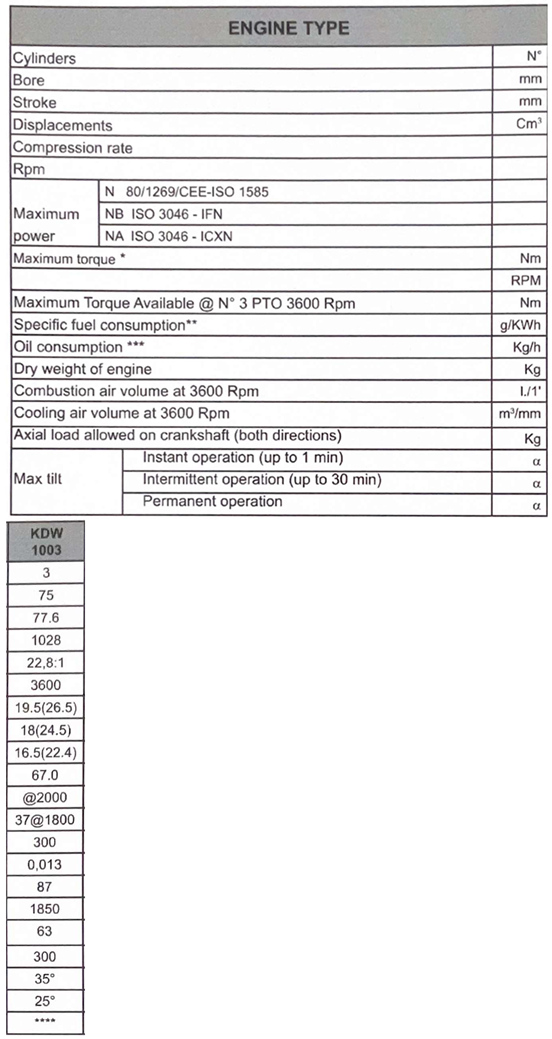
The experimental engine is located at the CSU Powerhouse Energy Campus and is part of a larger SOFC-ICE hybrid power generation system. The engine portion of the test facility consists of a 1.0-liter, 3-cylinder, Kohler diesel engine (KDW1002) modified for spark ignition, a scroll-type supercharger (P24H056A-BLDC), a Kohler alternator (GC74037), and a load bank (LCNFM1). There were several engine modifications to convert the engine from CI to SI. These modifications involved adding spark plugs, as well as altering the piston geometry and engine controls. The reason for using a modifying a diesel engine was to enhance its durability. Diesel engines are typically made of stronger materials to handle higher compression ratios, making them a more resilient platform to the embrittlement effects of H2 combustion [
25]. In addition, the piston geometry had to change to achieve the desired compression ratios with the SI modification.
Table 2 shows the engine specifications.
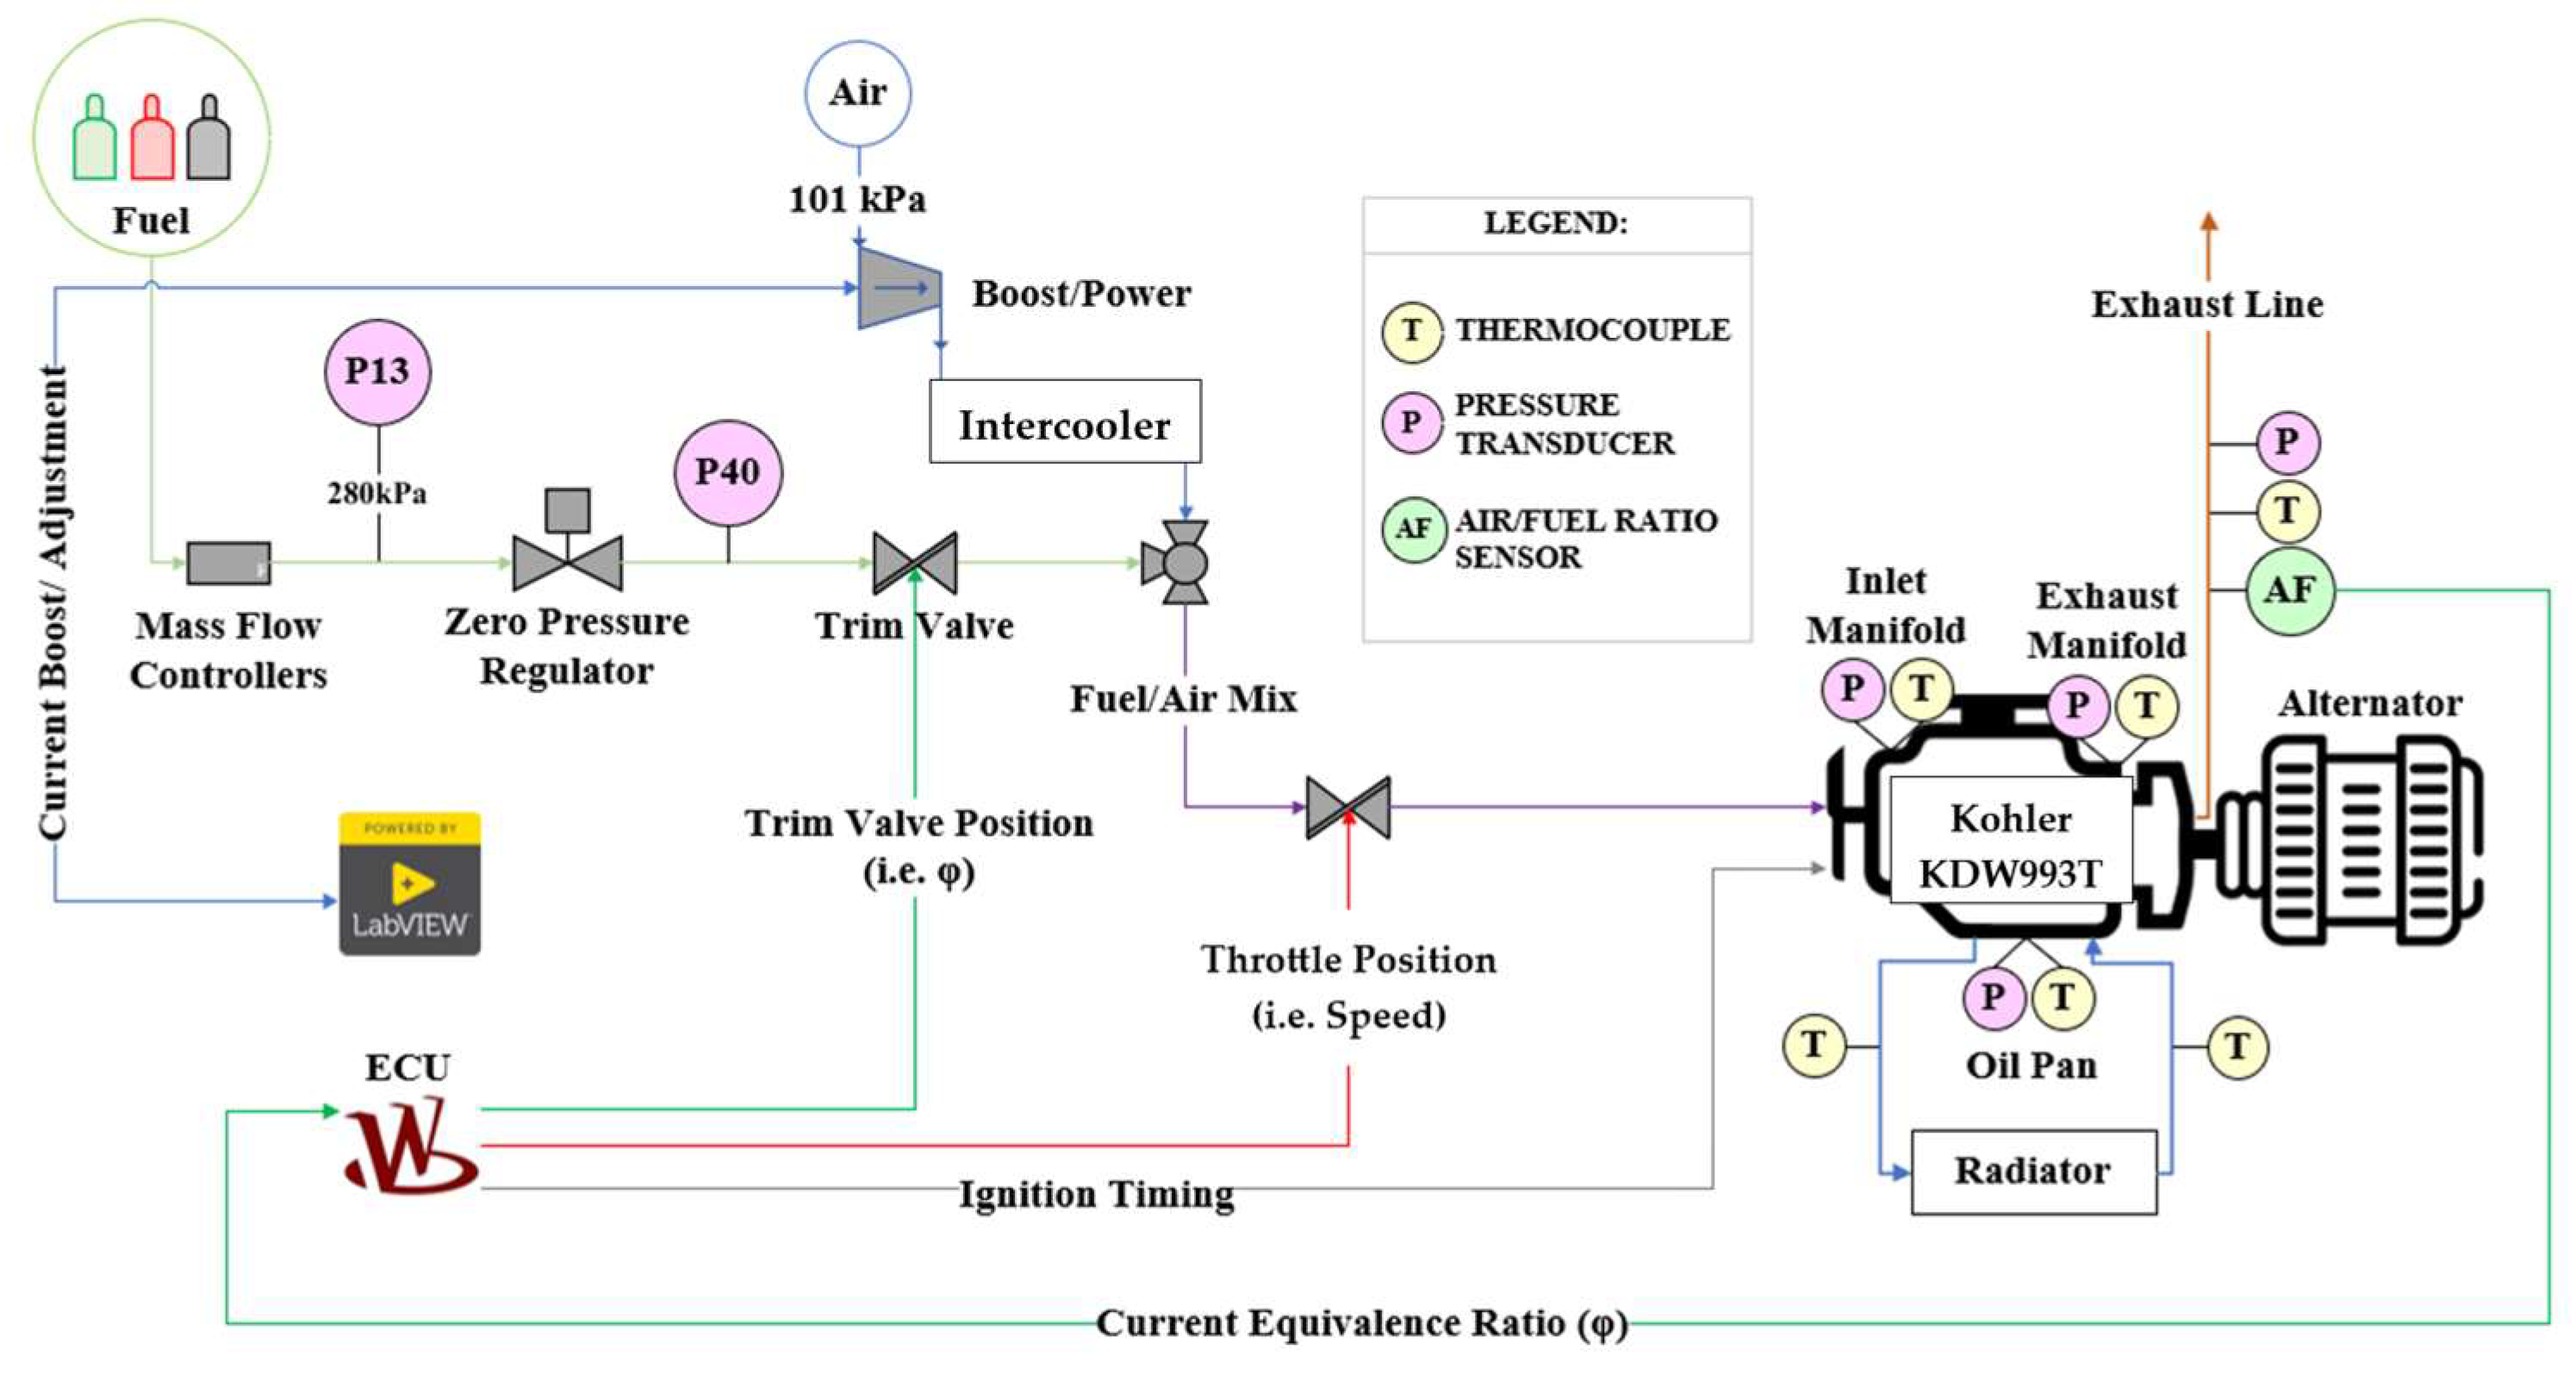
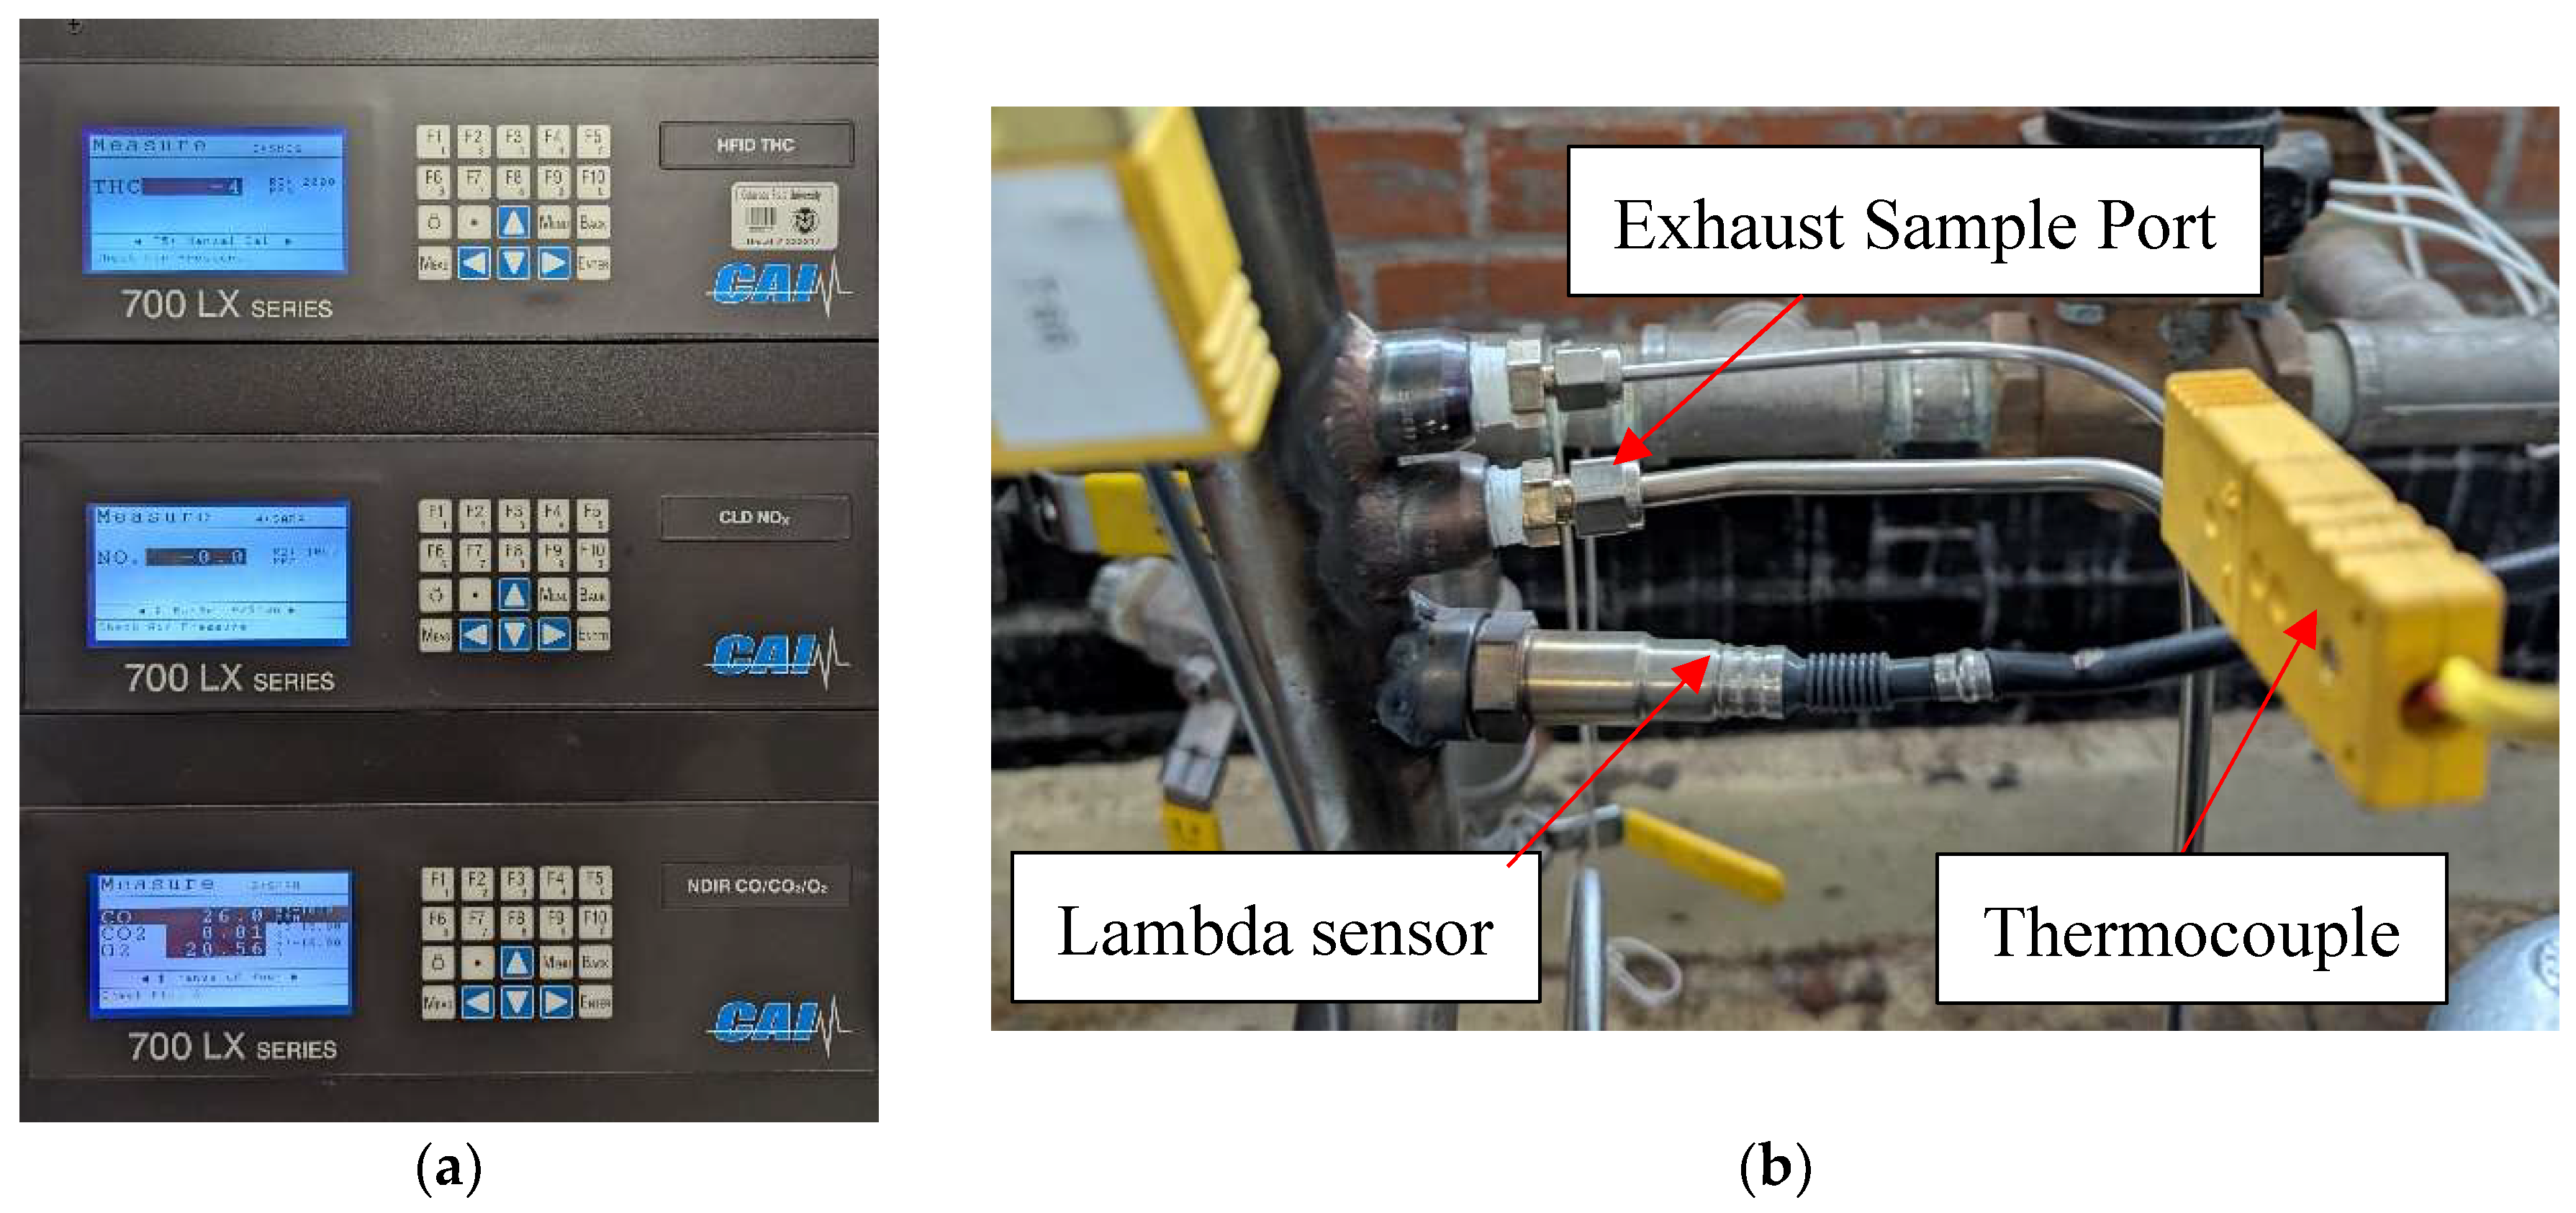
Additional instrumentation for the engine included six thermocouples (KQXL-116G-12), four pressure sensors (626-09-GH-P1-E1-S1) and a lambda sensor (LSU 4.9) shown in Figure 5 to monitor the engine’s operating conditions.
Figure 1 shows a schematic of the test facility. The fuel delivery was controlled by bottled gases that were blended using mass flow controllers (DPCS-010392) to meet the different anode gas compositions. The fuel blends consist of CO, CO
2, H
2, CH
4, steam, and N
2 at different amounts depending on SOFC load and fuel utilization. These compositions also have water as part of their constituents, but it is assumed to have been mostly removed by a water dropout heat exchanger to a dewpoint of 40°C. LabVIEW is utilized to manage each mass flow controller, with the mass fraction of each constituent provided as input to control the composition of the blend. The total fuel flow rate is the sum of the mass flow controllers. After the mass flow controllers, the fuel passes through a zero-pressure regulator to bias the fuel pressure to the air pressure. The boosted air is manually controlled by the engine operator. In this way, LabVIEW controls the gas mass flow controllers to hold a steady pressure always above the boosted air to ensure fuel mixing is possible. The engine control unit (ECU) then controls a trim valve to regulate fuel flow into the mixing valve, where air and fuel are mixed before entering the engine. Finally, the ECU adjusts the throttle to regulate engine speed to maintain steady-state operation.
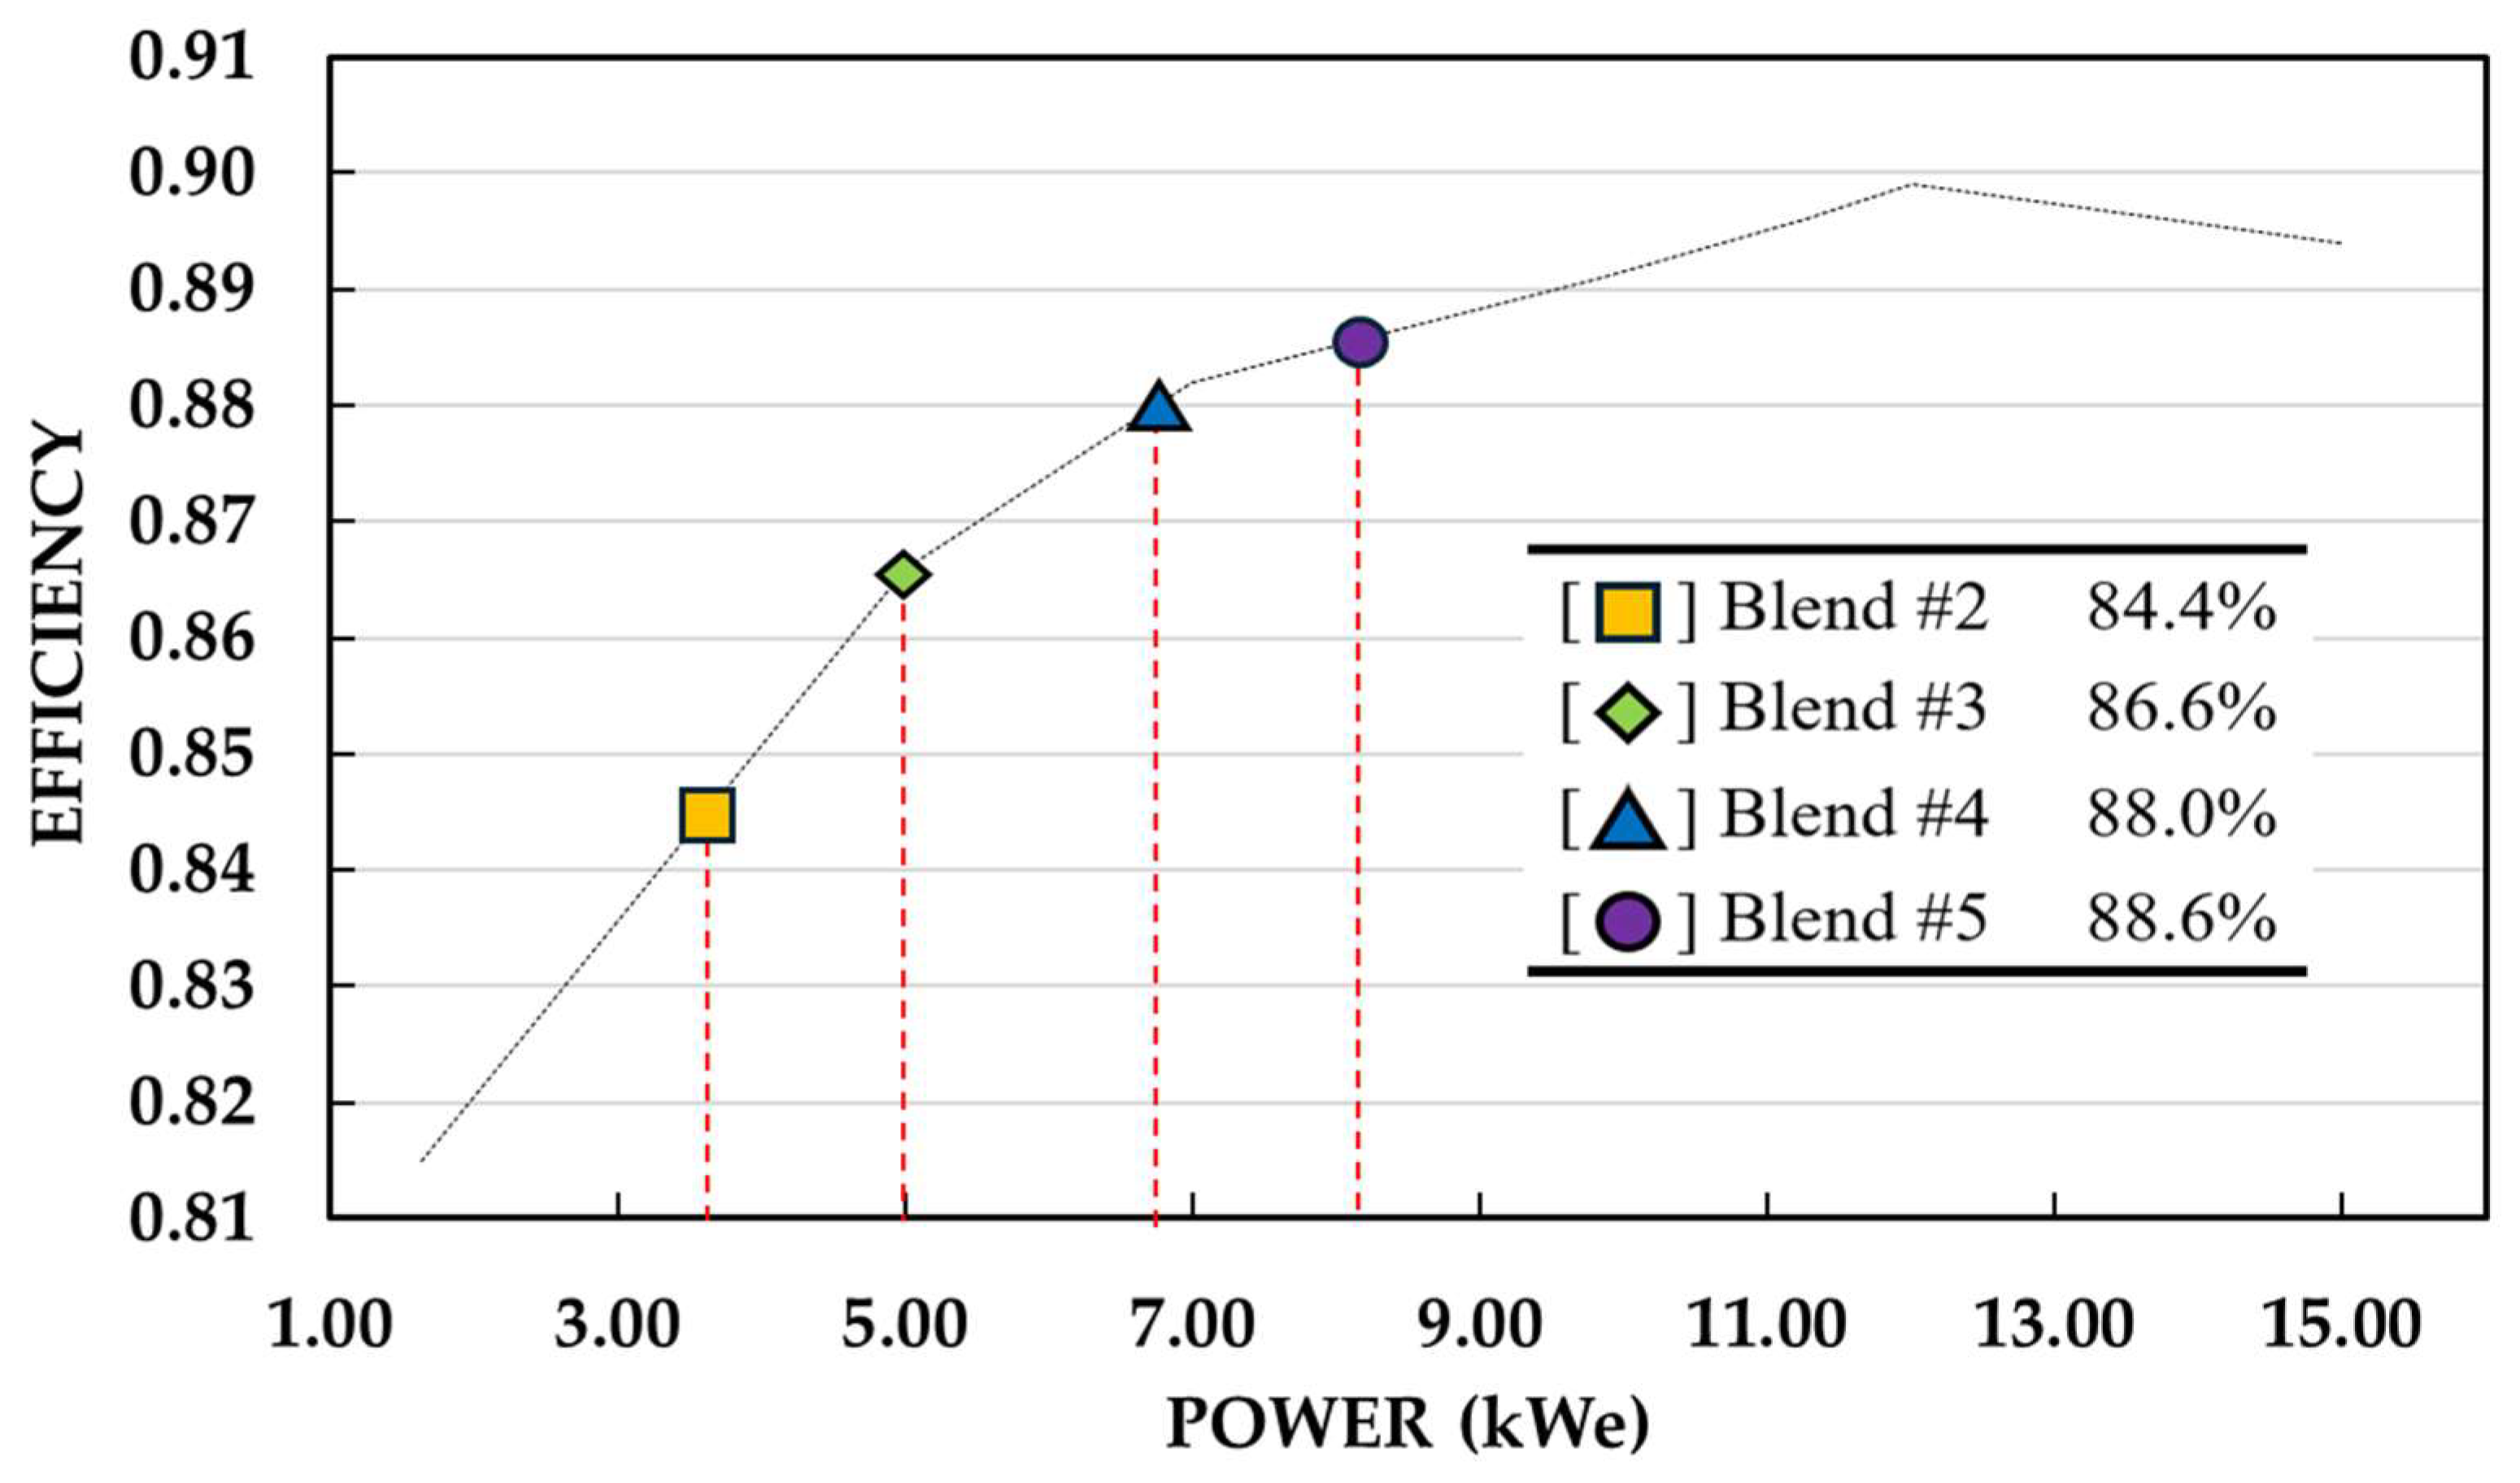
The method of loading the engine is through an alternator and load bank. The alternator efficiency, shown in
Figure 2, was provided by Kohler Power Systems, and varied with changes in power output. For this reason, the generator efficiency used in the BTE calculations had to change depending on the fuel blend. A load bank and alternator were used to apply torque to the engine through the alternator at the expected power output for each blend and an energy logger (Fluke-1732/B) was used to measure and average the electrical power output.
Emissions samples were collected via an exhaust sample port and directed through a heated sample line into a control room equipped with the necessary instrumentation for exhaust gas analysis. A detailed description of the emissions analyzer used in this testing is referenced in King [
26]. The five software programs utilized during testing were LabVIEW (2020 SP1) for managing supercharger speed and fuel delivery, PG+ (v43.11) for controlling the ECU and logging engine sensor data, Microsoft 365 (16.0.16529.20182) for data analysis, Engineering Equation Solver (EES) for uncertainty propagation, and Python Spyder (6.0.0) for averaging the raw data. All programs and codes used are available, except for PG+, which is proprietary software developed by Woodward and is not readily accessible.
Figure 3 shows all the components used in the facility.
The testing methods were based on the fuel composition as shown in
Table 3. The "Legacy fuel composition" refers to a fuel blend used in previous studies at CSU, based on an earlier SOFC model developed by the Colorado School of Mines. The "New fuel compositions" category includes all the anode gas blends anticipated for use with the engine, based on the current SOFC model [
27]. The fuel blends target LHV (
LHVf) shown in
Table 3 were calculated utilizing the following equations:
where
Xi,
Yi,
MWi, and
LHVi are the mole fractions, mass fractions, molar weights, and LHV of the constituents, respectively, while
MWf is the molar weight of the fuel blend. Using these
LHVf values it is possible to calculate the expected power for each fuel composition using the following equation solved for
We:
where the BTE target was assumed to be 35% [
28],
ηGEN is the corresponding alternator efficiency for each blend, and the target fuel mass flow rate
mf is shown in
Table 3 under “Flow rate [g/s]”. With the model data and calculated
LHVf, a consistent testing methodology was produced to test the engine at all the expected operational conditions and optimize for best performance. It is also important to note that the
LHVf chosen for all BTE calculations was calculated from the real LHV measured from the mass flow controllers. The
LHVf and flow rates
mf shown in
Table 3 were target values. This was considered during the uncertainty propagation calculations.
For this research, the steam was replaced with CO2 since both gases served the same purpose of diluting the fuel. Prior research conducted at CSU showed the engine’s performance metrics when steam was dropped out and a small volume of water was utilized as part of the fuel blend [29-31]. Therefore, for ease of testing, CO2 was used instead of steam and N2 was neglected because of its small amount.
To develop a consistent testing methodology, engine conditions were chosen as a baseline. The specifications shown in
Table 2 were based on engine geometry and previous testing done with the same engine platform [
28], but the equivalence ratio (φ) was chosen based on the data shown in
Figure 4. This data was acquired in 2022 for the same spec engine running on Blend 1 as shown in
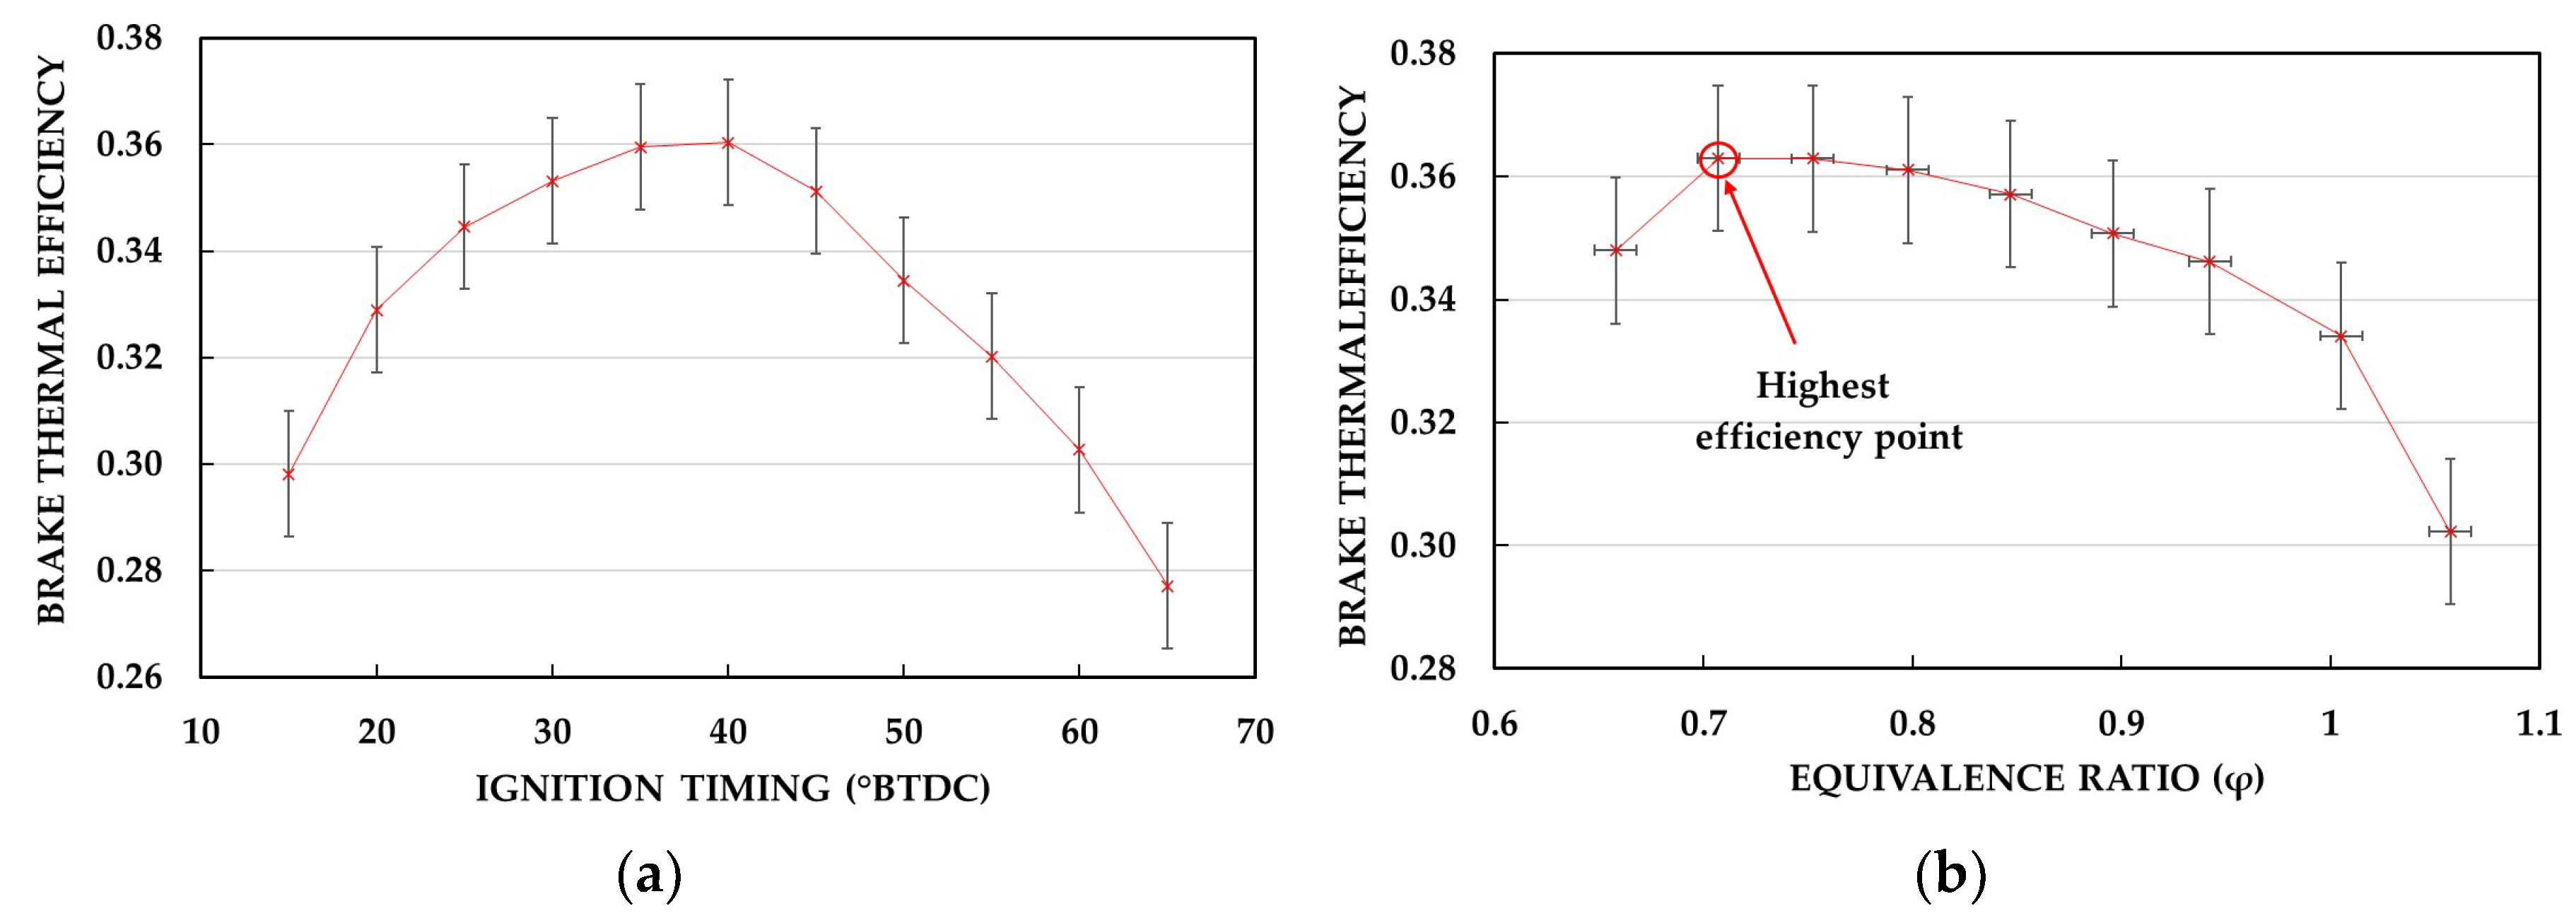
Table 3. As previously stated, this fuel is based on older SOFC anode gas compositions and has a higher LHV and load target than the blends that will be optimized in this research. During the test campaign on Blend 1, an ignition and equivalence ratio sweep were done to find the optimal points for each parameter. The highest efficiency calculated was obtained with an φ = 0.70 showing a BTE of 36.3%, while the ignition timing sweep showed a maximum BTE of 36.0% with φ = 0.75, both at 40° BTDC and 10kW of load. Based on this previous research, the chosen equivalence ratio for the new tests was 0.75 because of three main factors: efficiency stability, supercharger requirements, and fuel LHV. With a φ = 0.70 the engine may have hit its maximum BTE, but as seen in
Figure 4b, there was a substantial drop off in efficiency when going from φ = 0.70 to 0.65. To avoid this efficiency boundary, a φ = 0.75 was selected because it has a similar efficiency but has less risk of deviation in case of unexpected operational changes. Additionally, running at lower equivalence ratio would require the supercharger to run at higher speeds, increasing the parasitic loads and reducing overall system efficiency. Moreover, the new fuel blends have a lower LHV than the legacy fuel blend. Having a lower LHV could change the mixing requirements of the fuel blends, requiring more fuel to be mixed with air for combustion [
32]. These factors made an φ = 0.75 more suitable for the engine to sustain high efficiency over a bigger range of conditions. Lastly, the difference between BTEs was < 1%, which is within the uncertainty of the measurement. The torque measurement from this legacy testing was measured with a dynamometer, so the BTE was calculated using the following equation:
where
τBRAKE is the engine torque in N*m and
N is engine speed in RPM.
The testing program evaluated for Blends 2-5 in
Table 3 began with an ignition timing sweep from 30° BTDC to 60° BTDC for each blend while holding power constant. Ignition timing was increased in increments of 5°, having a total of seven test points for each fuel. For validation purposes, a timing light was used to ensure that the values stated by the ECU software were accurate to the real timing. To ensure that all test points were recorded at the same condition, engine speed and equivalence ratio were held constant at 1600 rpm and 0.75 respectively. If the engine speed did not meet 1600 rpm at any of the ignition timings, the supercharger speed was changed to reach steady engine speed. The power applied via the load bank stayed constant during the test to observe the effects of ignition timing on the mass flow rate of the fuel. Lastly, the data was analyzed to determine the optimal ignition timing that yielded the highest efficiency for each fuel blend. The results were then compared to those in
Figure 4 to assess the impact of the fuel's LHV and load.
In addition, boost was swept by varying the supercharger speed for a fixed fuel flow and power level. The goal was to find the range at which the supercharger could be run to maintain steady state. Environmental conditions, such as ambient air temperature, could change during operation, directly affecting engine performance. Establishing the operational range of the supercharger for each blend would ensure that the engine performs at steady state, regardless of environmental changes. More importantly, the boost sweep determined the lowest air pressure required to operate the engine at each blend which reduces the supercharger’s electricity consumption and increases the overall hybrid system efficiency. After finishing both ignition and boost sweeps, emissions data were measured with the optimized timings and supercharger speeds using a California Analytical Instruments Five-gas analyzer as seen in
Figure 5. To perform the emission analysis, a slipstream of gas was removed from the exhaust piping and delivered to the five-gas analyzer for continuous emissions monitoring. Finally, an engine speed sweep was conducted to confirm that the fuel composition changes did not affect the optimal speed found in previous studies [
20]. Blend 4 was chosen as the fuel composition to test during the speed sweep since the LHV between the new compositions were similar and this fuel would be the one most available during system operation. The speed range selected for the tests was from 1400 rpm to 1800 rpm. During testing, the load was held constant at its expected power output to see the effects that speed would have on efficiency. However, ignition timing and boost were changed to achieve steady state operation. The results of the engine test program were the operational conditions for the engine to achieve maximum power output and are shown in the following section.
The uncertainties of the instruments used during testing were applied to determine the uncertainty of each calculated parameter. The uncertainty calculation was performed by following the uncertainty propagation analysis as described in NIST Technical Note 1297 [
33] where the uncertainty of a calculated quantity can be determined with the following equation:
For the ignition timing sweep, both the mass flow controllers and the energy logger data sheets were considered. The mass flow controllers had an uncertainty of ±0.002 for full-scale measurements and ±0.005 for mass flow readings, while the energy logger had a 1.2% uncertainty for power readings. In the boost sweep, the current clamp used to calculate power consumption had an uncertainty of ±3.0% of the reading plus 10 digits as stated on the data sheet. Lastly, the five-gas analyzer data sheet had an uncertainty of 1% of full scale measurement for all constituents. These uncertainties were factored into all calculations to assess error propagation [
34].
3. Results and Discussion
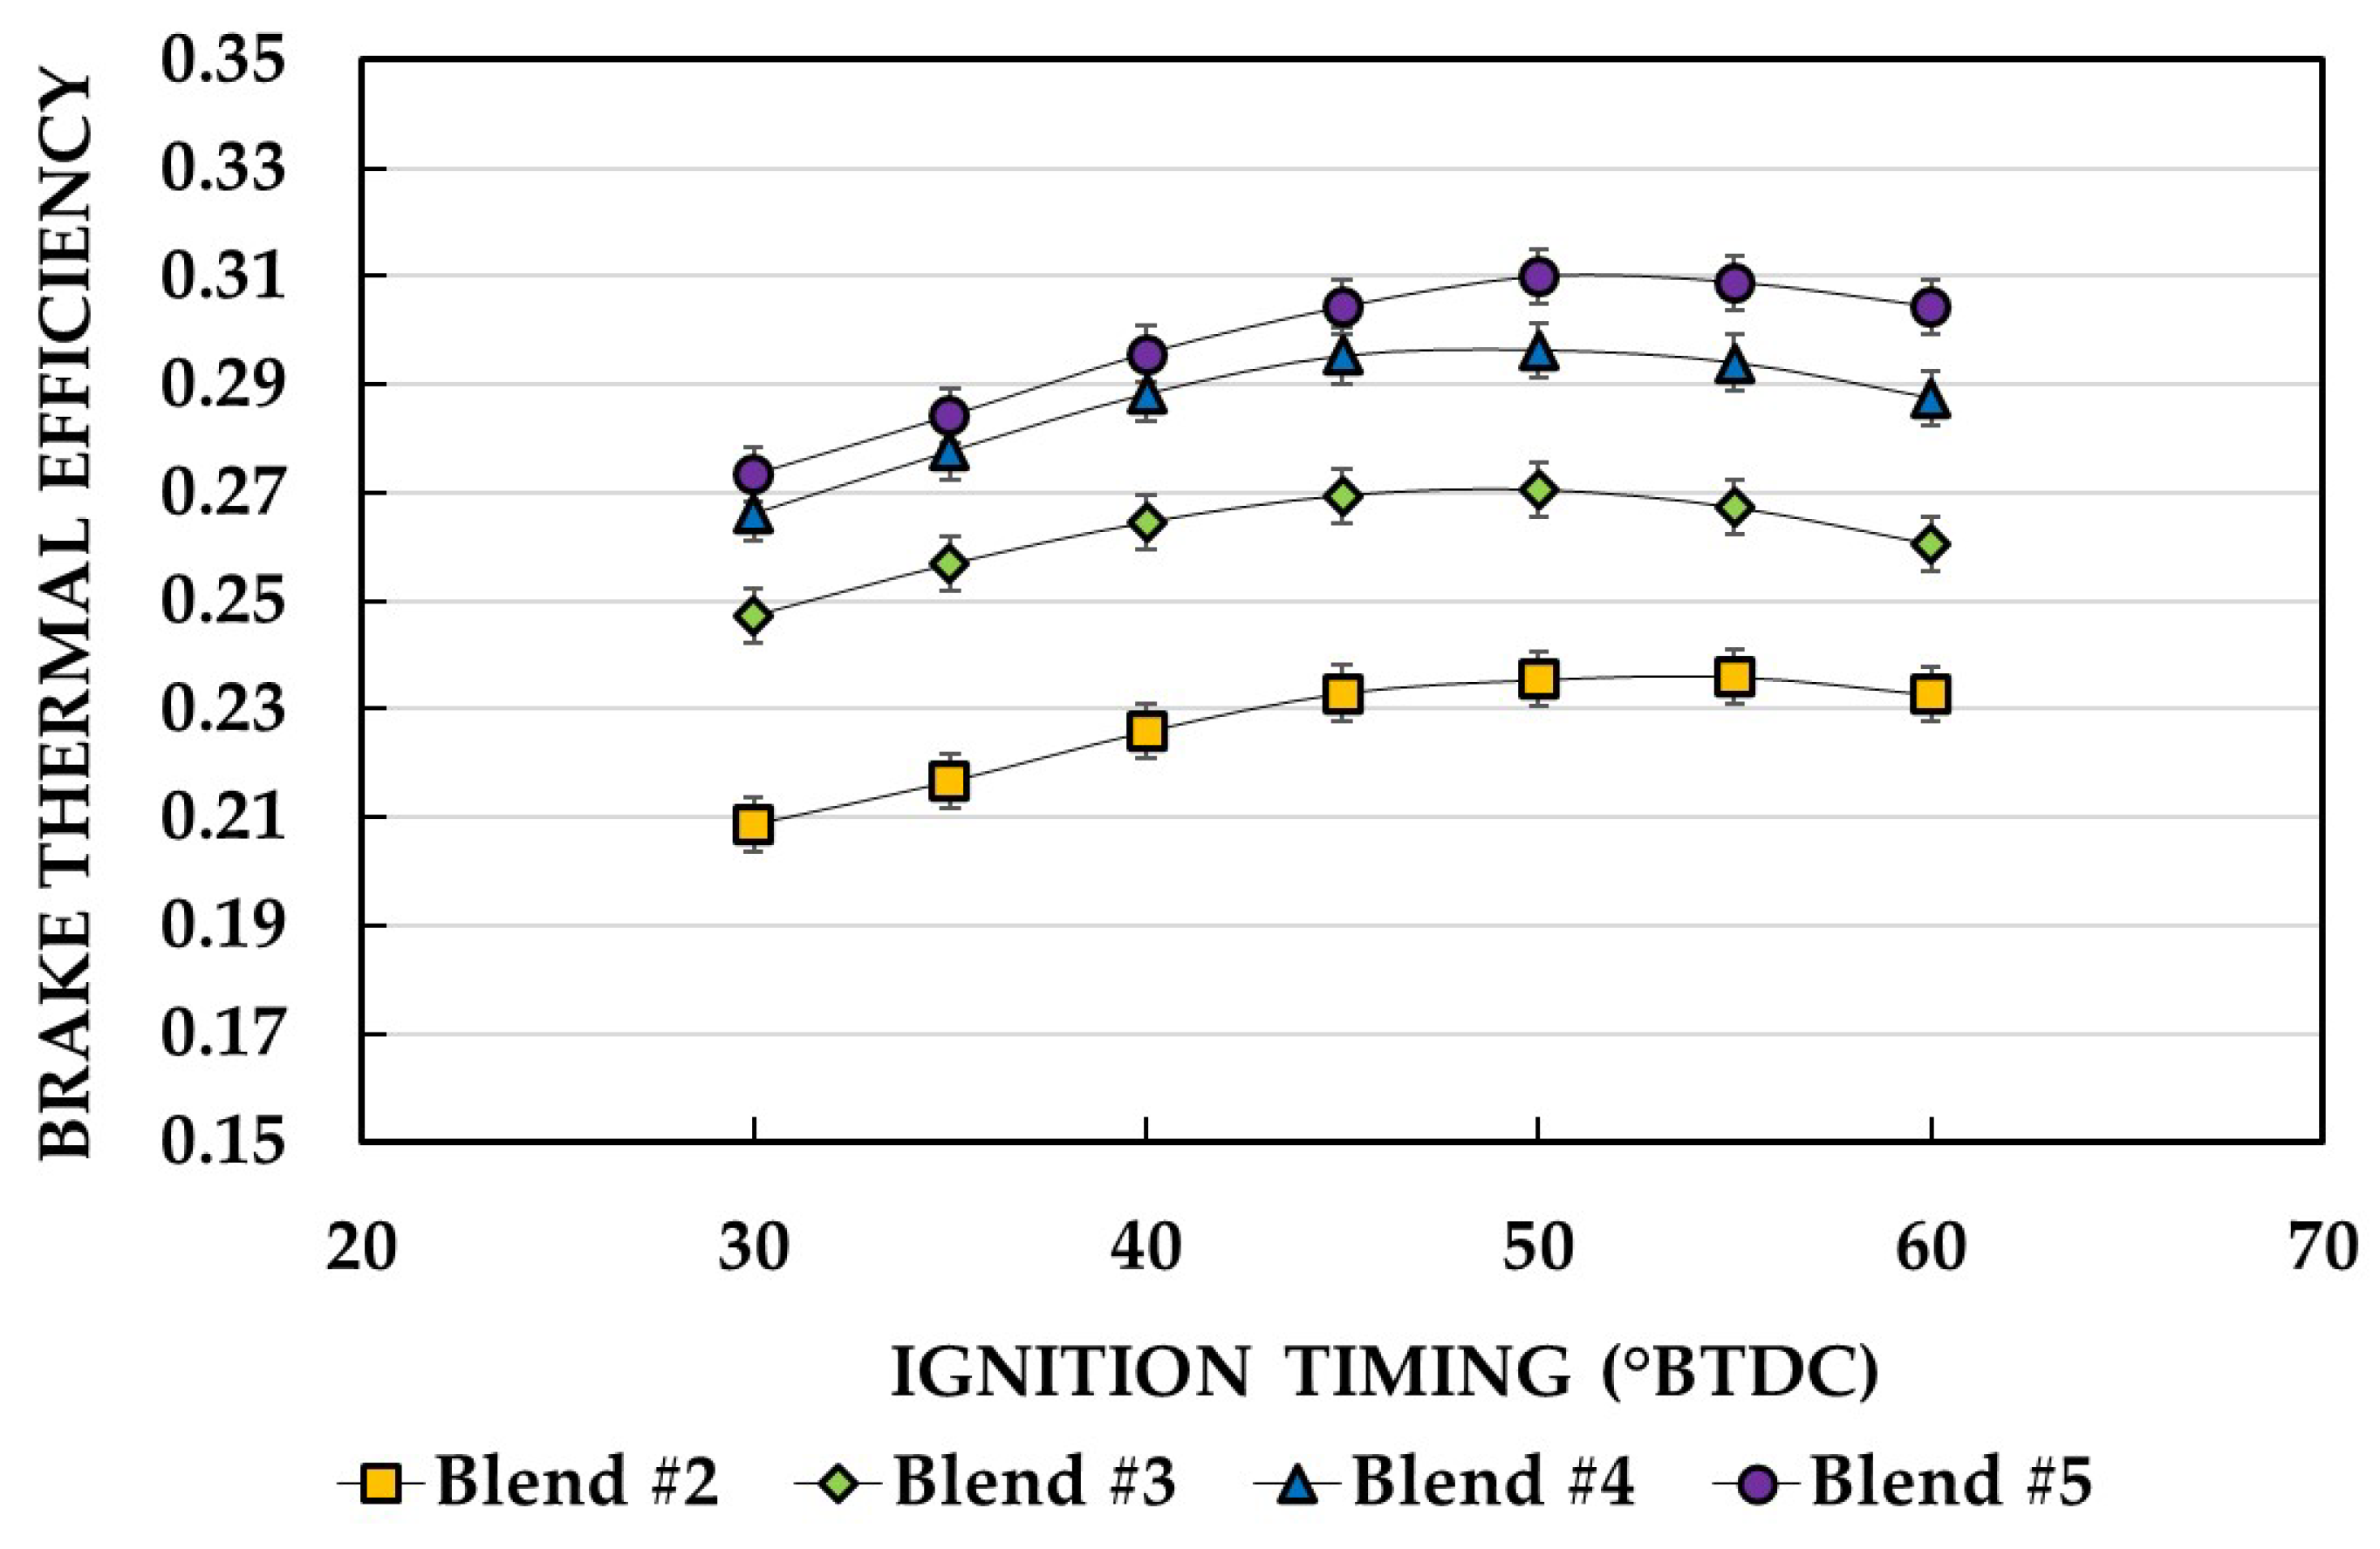
The initial results to be discussed are from the ignition timing sweep, as illustrated in
Figure 6. The data showed an increase in BTE when going from the lowest to the highest load blend. The maximum efficiency recorded for each blend was 23.6% for Blend 2 at 55° BTDC at 3.29kW, 27.1% for Blend 3 at 5.01kW, 29.6% for Blend 4 at 6.81kW, and 31.0% for Blend 5 at 8.17kW, all at a timing of 50° BTDC. The increase in efficiency was anticipated because the power production for the blends was increasing so the parasitic loads of the engine were a lower fraction of the total power produced at higher output powers. It is worth mentioning that during the ignition timing sweep, although the supercharged air passed through an air-coupled heat exchanger, the initial intake air temperature increased. The temperature for Blends 2 to 4 began at approximately 30°C and increased to 34°C, while for Blend 5, the intake temperature started at 34°C and reached 37°C. These increases in temperature were primarily caused by an increased ambient temperature throughout the test day. For Blends 2 to 4, the ambient air temperature increased from 26°C to 29°C, while Blend 5 started at 32°C and ended at 39°C. This could have affected the BTE since a lower air temperature would have benefited engine performance [
35]. The data from Blends 2 - 5 show a decrease in efficiency as compared with the legacy blend. This could have been because the LHV of Blend 1 was 13% higher than the highest LHV among the new blends, along with a higher load. Dropping the LHV at the same equivalence ratio and boost would directly affect the power being produced. To increase power production a higher boost would be required, but this would increase parasitic loads. In contrast, having a higher LHV would increase the thermal energy produced by combustion, generating more power. Additionally, the reduced load contributed to the decrease in BTE compared to the legacy blend. The results from the new blends are still deemed satisfactory, as a 4% reduction in the engine's maximum efficiency corresponds to only a 1% decrease in the overall system's efficiency, making it a minimal change. All the blends achieved a maximum BTE at 50° BTDC, except Blend 2 which was at 55° BTDC. The advanced timing could be due to the low hydrogen and high CO
2 content in the blend, which makes the fuel more dilute and less reactive. Regardless, it was still recommended to use 50° for all blends since the difference in BTE between 50° to 55° was < 1%. This would simplify engine controls by keeping the ignition timing the same at every SOFC fuel utilization. A similar explanation to the one for Blend 2 can be applied when comparing the optimized timings to those used during Blend 1 testing. The higher hydrogen concentration in Blend 1, relative to the new blends, may have contributed to the 10° difference in spark timing.
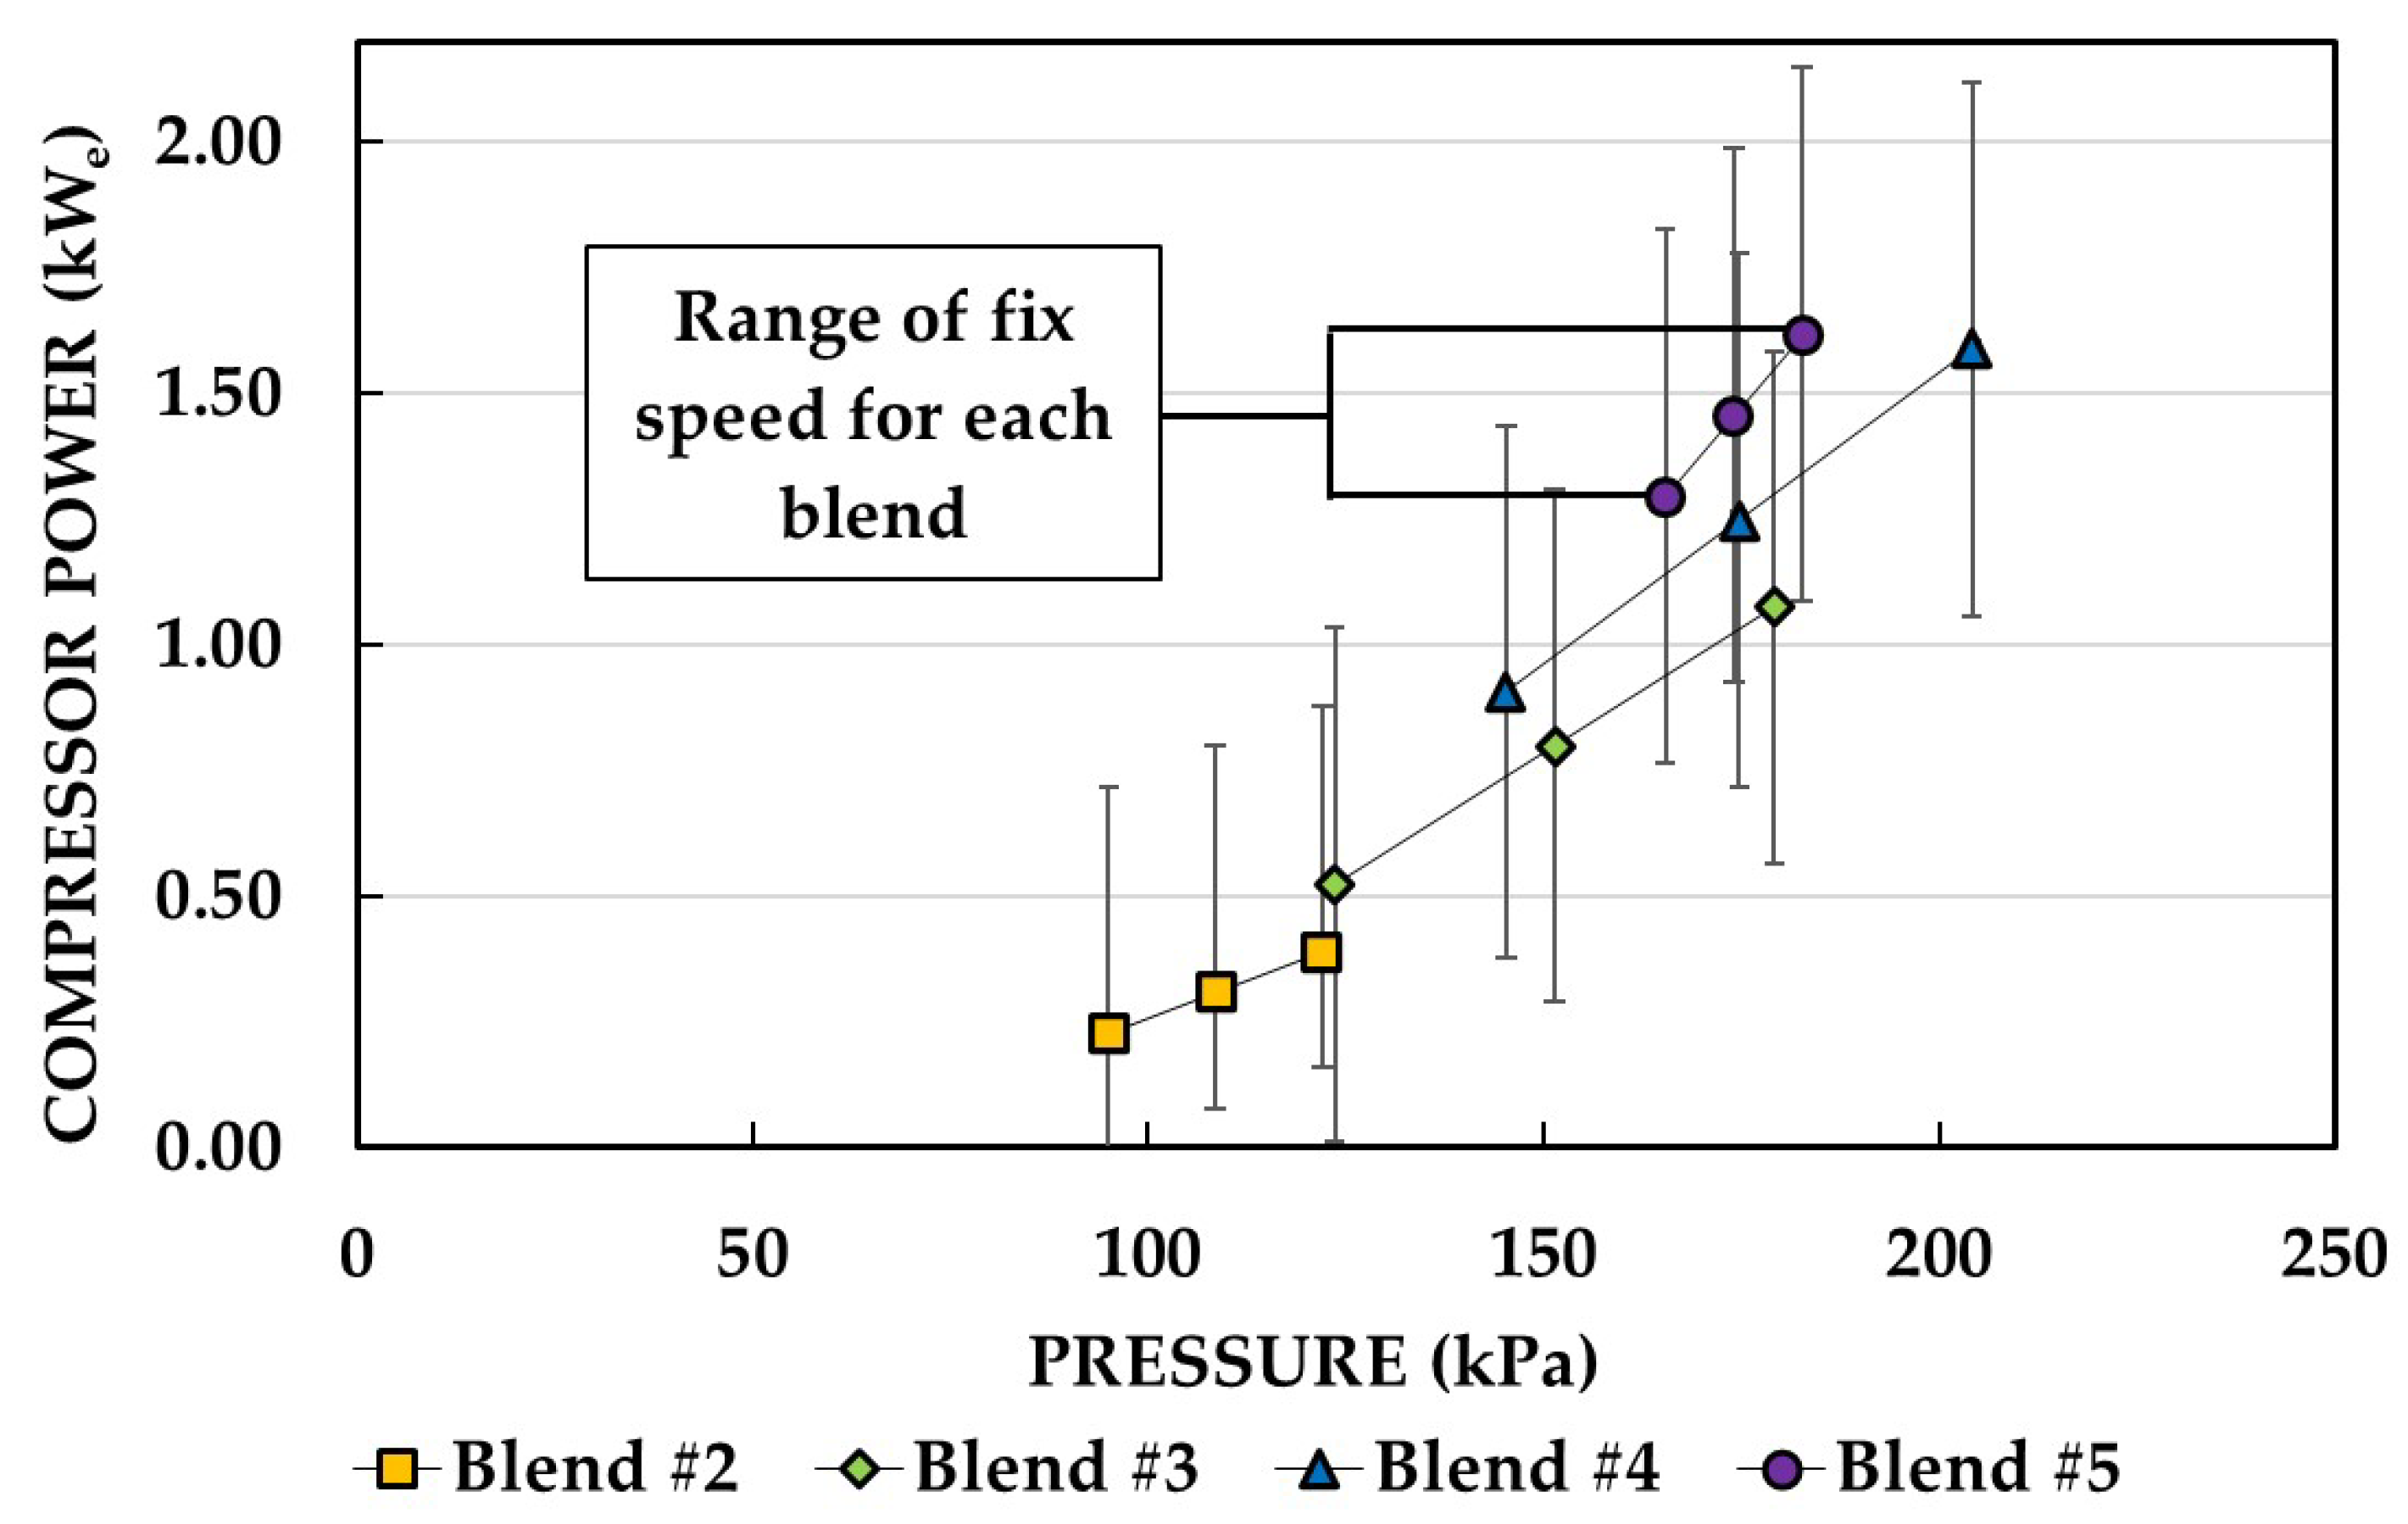
The boost sweep followed a similar procedure to the ignition timing tests. During the boost sweep, all other parameters except the supercharger speed were held constant and the ignition timings were set to the values discovered during the timing sweep.
Figure 7 shows the boost range for each blend in which steady state conditions could be met with the throttle controlling engine speed. The upper limit was defined as the maximum boost the engine could receive while still holding constant speed. In this scenario, the throttle was fully closed, and any further increases in boost pressure would result in an increase in engine speed. In contrast, the lower limit was the minimum boost required for the engine to reach the target speed. In this case, the throttle was fully open and any decrease in boost would result in a decrease in engine speed. This lower limit was the most optimal because it lowered the power consumption from the supercharger and slightly increased efficiency. The BTE was calculated for the lowest boost value and the results indicated a 1% efficiency reduction for Blend 2, while Blends 3-5 showed an average of 1% increase in efficiency compared to the ignition timing sweep. The less restrictive throttle position may have improved fuel distribution to the engine, enhancing combustion efficiency. This could also explain why, in nearly all cases where the inlet manifold pressure and boosted pressure were the same, the engine achieved the highest BTE. In addition, the reduction in BTE for Blend 2 could have been influenced by environmental conditions. While testing conditions were nearly identical on both test days, ambient air temperature differed. This is why it's important to highlight that inlet manifold and ambient air temperatures changed significantly during the boost sweep. During testing with Blends 2 and 3, the intake temperature started at 41°C and rose to 42°C, while the ambient temperature increased from 34°C to 36°C. For Blends 4 and 5, the intake temperature began at 38°C and reached 41°C, with the ambient temperature changing from 31°C to 32°C. As previously mentioned, the difference in intake temperature compared to the ignition timing sweep could have affected the newly calculated BTE. Nonetheless, testing showed that efficiencies could be increased with optimal boost pressure, reaching as high as 31.4%, even in less than favorable temperature conditions. This could have meant that if temperatures had been constant during both tests, an additional estimate of 1% higher BTE could have been achieved. Also, the lower limit boost would benefit the overall system efficiency by reducing the power being consumed by the supercharger.
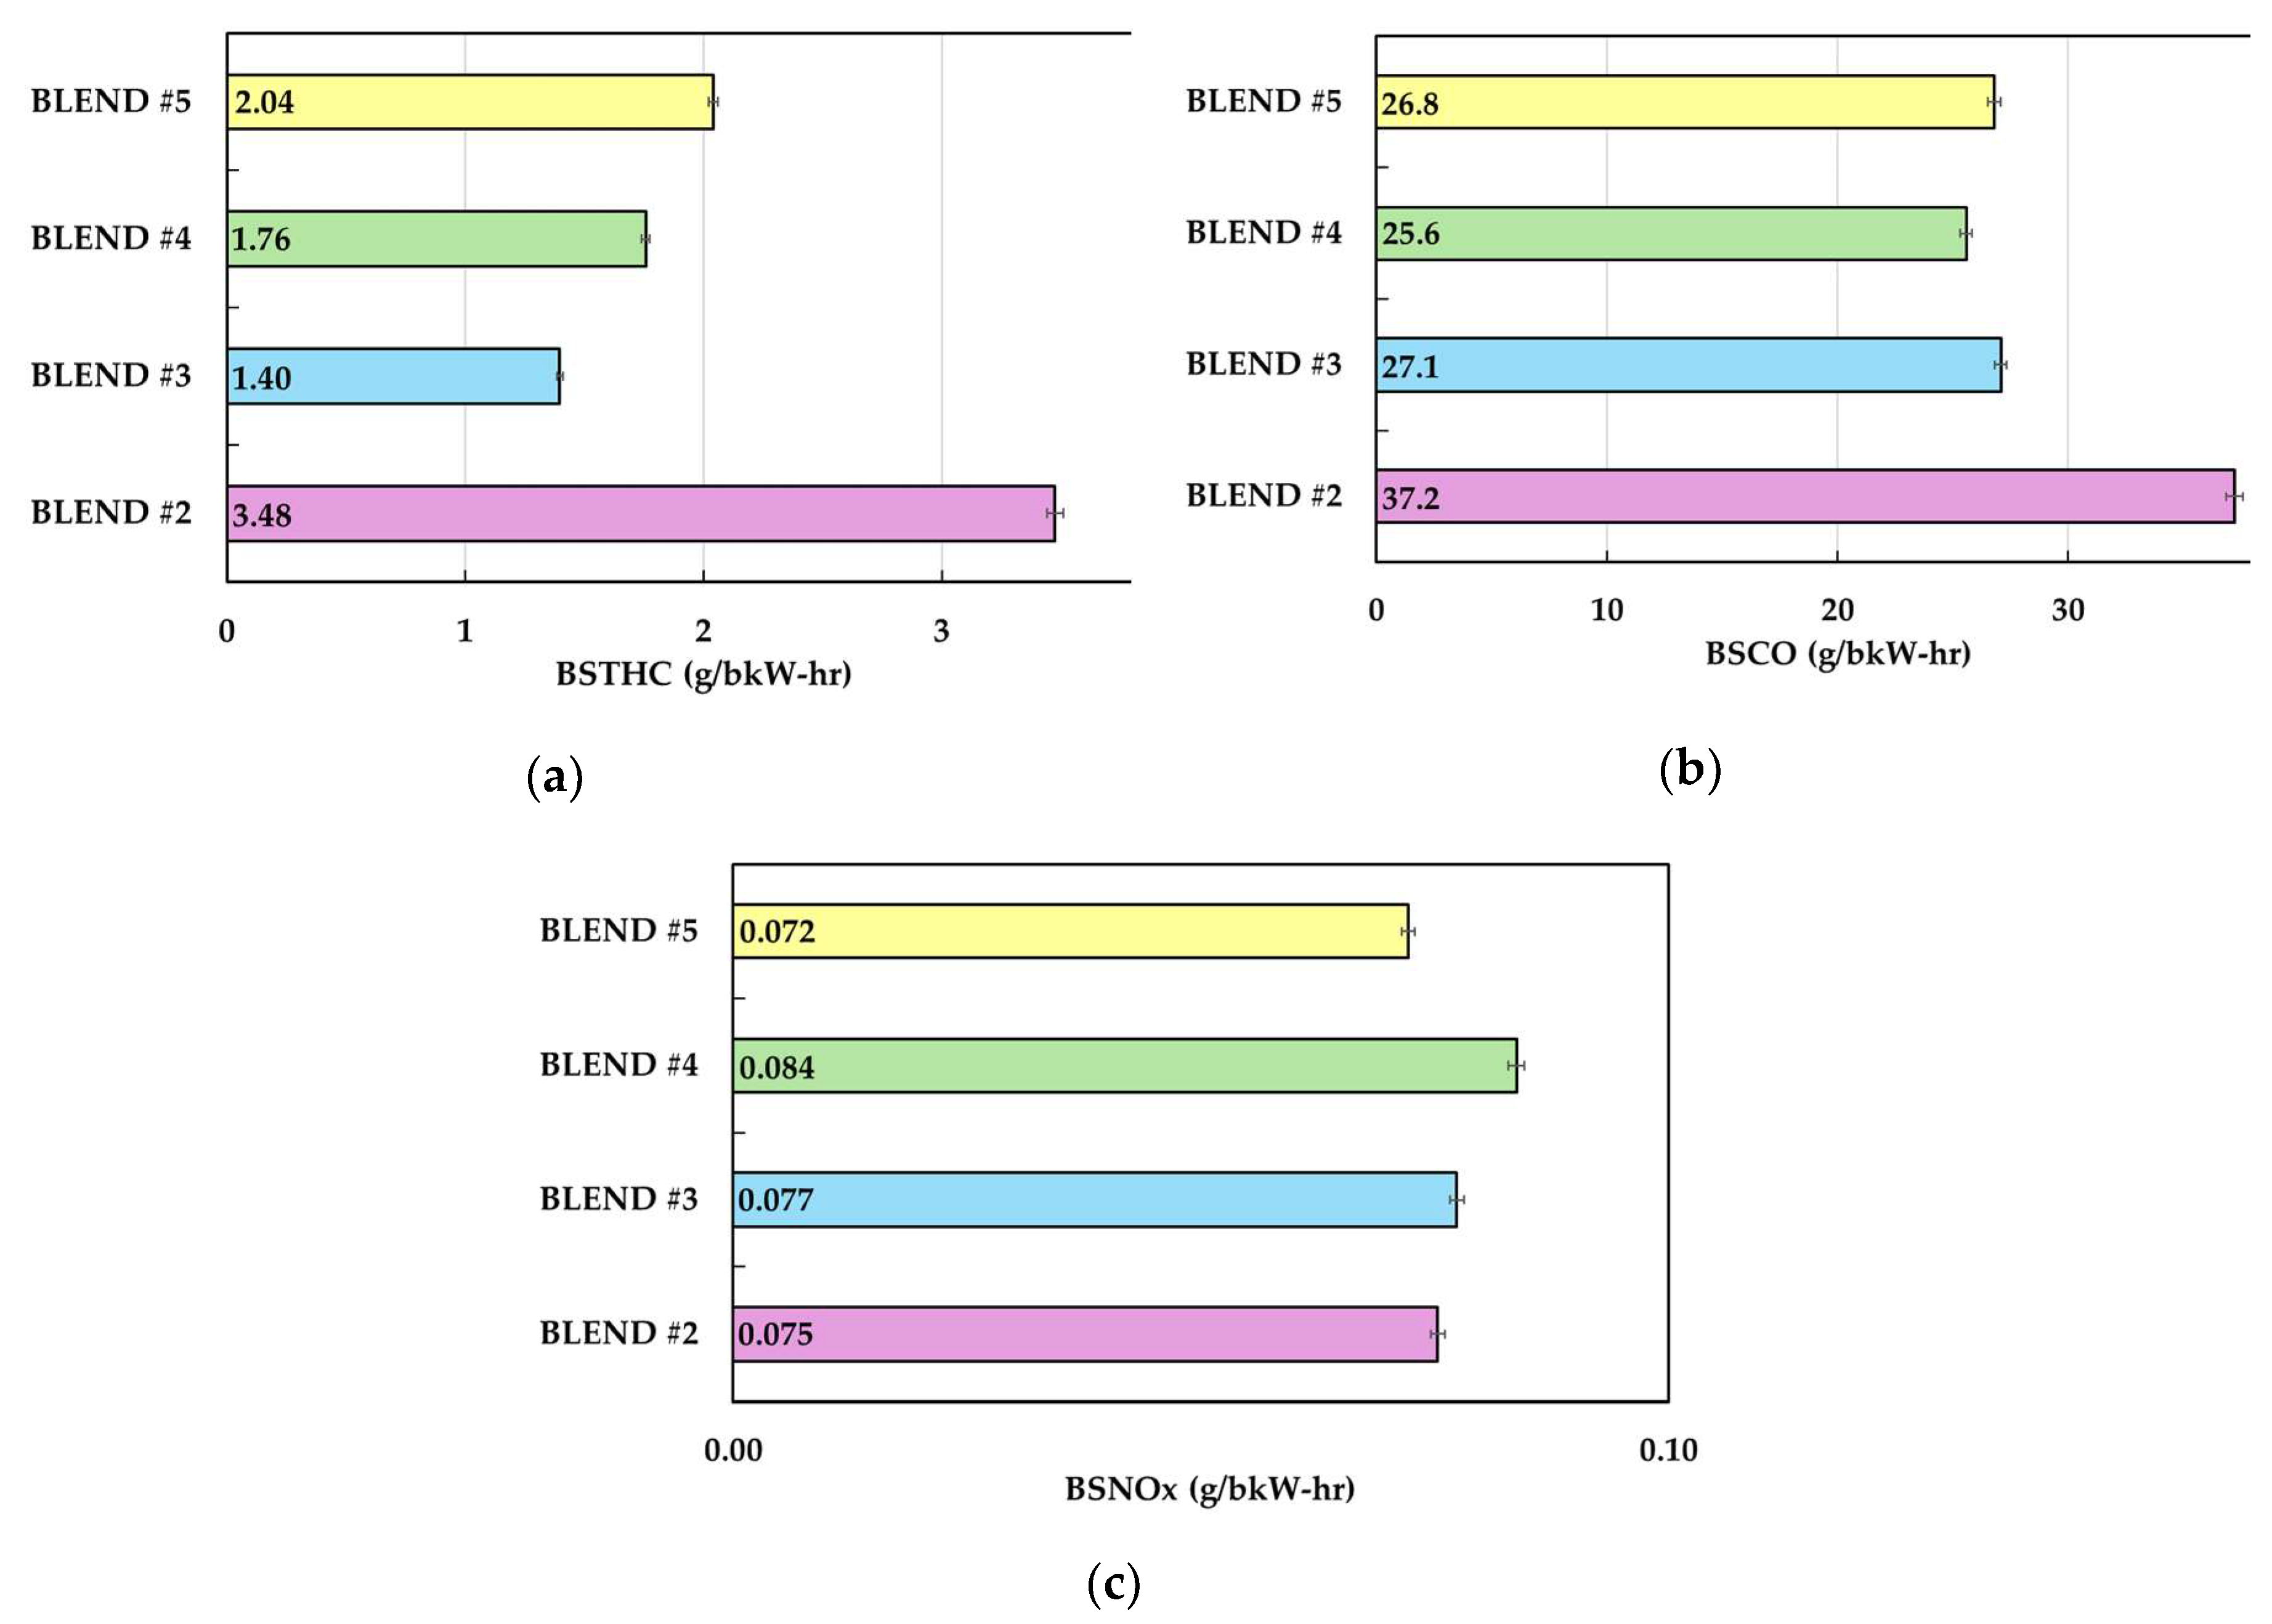
The next phase of testing was the emissions. As mentioned in the testing methodology section, a Five-gas analyzer was used. All samples were taken by using the optimized timings and boost conditions from the previous tests. For estimation purposes, an ideal lean combustion reaction assuming a theoretical hydrocarbon equivalent to the fuel blends was solved for all the gas blends to determine if the exhaust constituents were close to the ones during perfect combustion. Moreover, the necessary data to calculate BTE was also recorded and analyzed to ensure that the engine performance was the same as previous tests.
Figure 8 shows the emissions results as brake specific emissions, a standardized industry technique to normalize the emissions based on engine power. The three metrics which were analyzed were brake specific total hydrocarbons (BSTHC), brake specific carbon monoxide (BSCO), and brake specific nitrogen oxides (BSNO
x). Blend 2 exhibited the highest BSTHC at 3.48 g/bkW-hr. In comparison, the other blends displayed a gradual increase in BSTHC, but their emissions remained lower than those of Blend 2. This may have been due to Blend 2 having the highest CH
4 content out of all blends or by low combustion efficiency. As seen in
Figure 8, Blend 2 also showed the highest BSCO with 37.2 g/bkW-hr. A lower BSCO indicates higher combustion efficiencies, which is another possible explanation of why the BSTHC was much higher for Blend 2 compared to the other blends [
20]. This low combustion efficiency could have been caused by Blend 2 being the most dilute out of all the fuel compositions. For Blends 3 - 5, the BSCO was similar across the different fuel compositions which indicates consistent combustion efficiency. The increase in BSTHC for these blends may be due to the methane content in each blend. As shown in Table 4, Blend 2 has the highest methane content, followed by Blend 5, Blend 4, and finally Blend 3. This pattern aligns perfectly with the BSTHC results from the emission measurements. The BSNO
x results showed values close to zero which is likely caused by the lean fuel mixture and cold combustion. Typical engine exhaust temperatures can reach up to 850°C, whereas this engine peaked at approximately 372°C while delivering its maximum power output. As a standalone engine, emissions did not meet the legal requirements of 0.20 g/bkW-hr for BSTHC and BSNO
x, and 0.80 g/bkW-hr for BSCO as mandated by the South Coast Air Quality Management District [
36]. However, when accounting for the total system power output at 100% load (80kW), the legal requirements for new engines are met, except for the BSCO. Therefore, a catalytic oxidizer at a minimum 63% CO oxidation is required to meet the BSCO legal emissions limits.
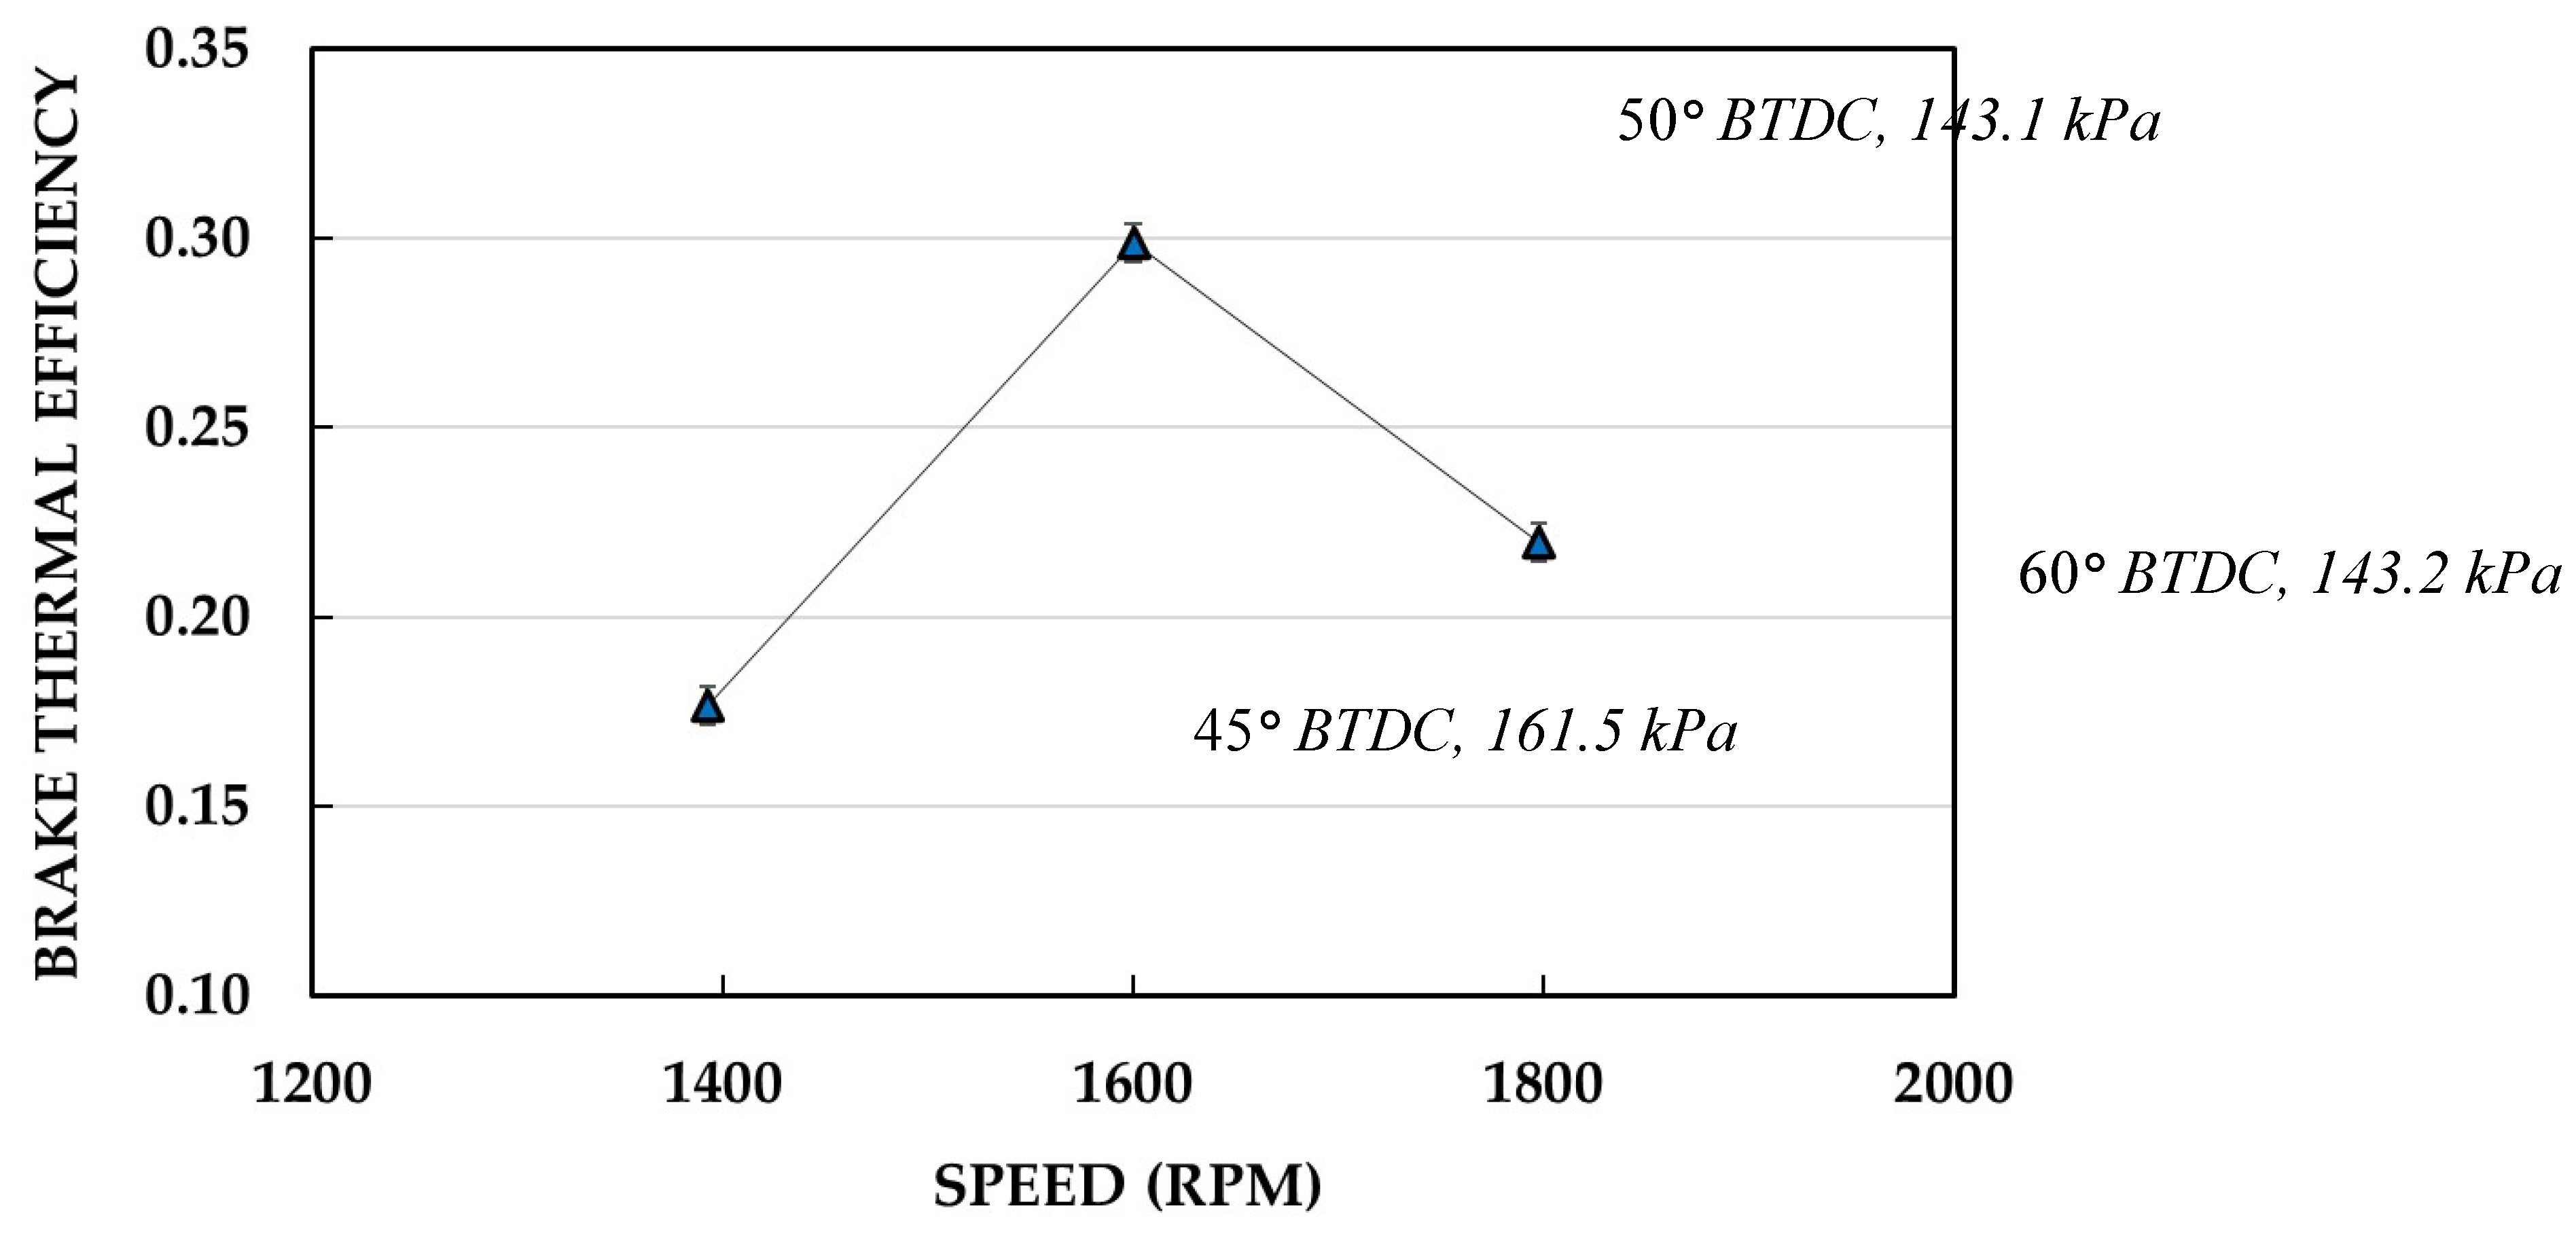
Figure 9 illustrates the results from the speed sweep, the last test within the scope of this research. The engine was operated at 1400 RPM, 1600 RPM, and 1800 RPM and the results indicate the highest efficiency (calculated with equation 5) occurring at 1600 RPM of approximately 29.9%. The reduction in efficiency for 1400 rpm could have been by increase frictional and pumping losses, while 1800 rpm showed a reduction because of the advance timing changing the cylinder dynamics off its design point. Therefore, it is reasonable to conclude that the reduction in the fuel’s LHV and load compared to Blend 1 did not affect the optimal engine speed.
By compiling all the experimental data, operational conditions were established to propose an engine control scheme. It was determined that simplifying engine controls is best achieved by maintaining ignition timing at 50° BTDC during all stages of operation. Additionally, to maximize BTE, the throttle should be set to fully open, and the supercharger used to control boost pressure to achieve the pressures recorded in
Figure 7. This adjustment not only enhances engine BTE but also reduces power consumption. By adjusting the supercharger setpoint, the engine power could be increased during transient fuel compositions ensuring maximum efficiency at all stages of operation.
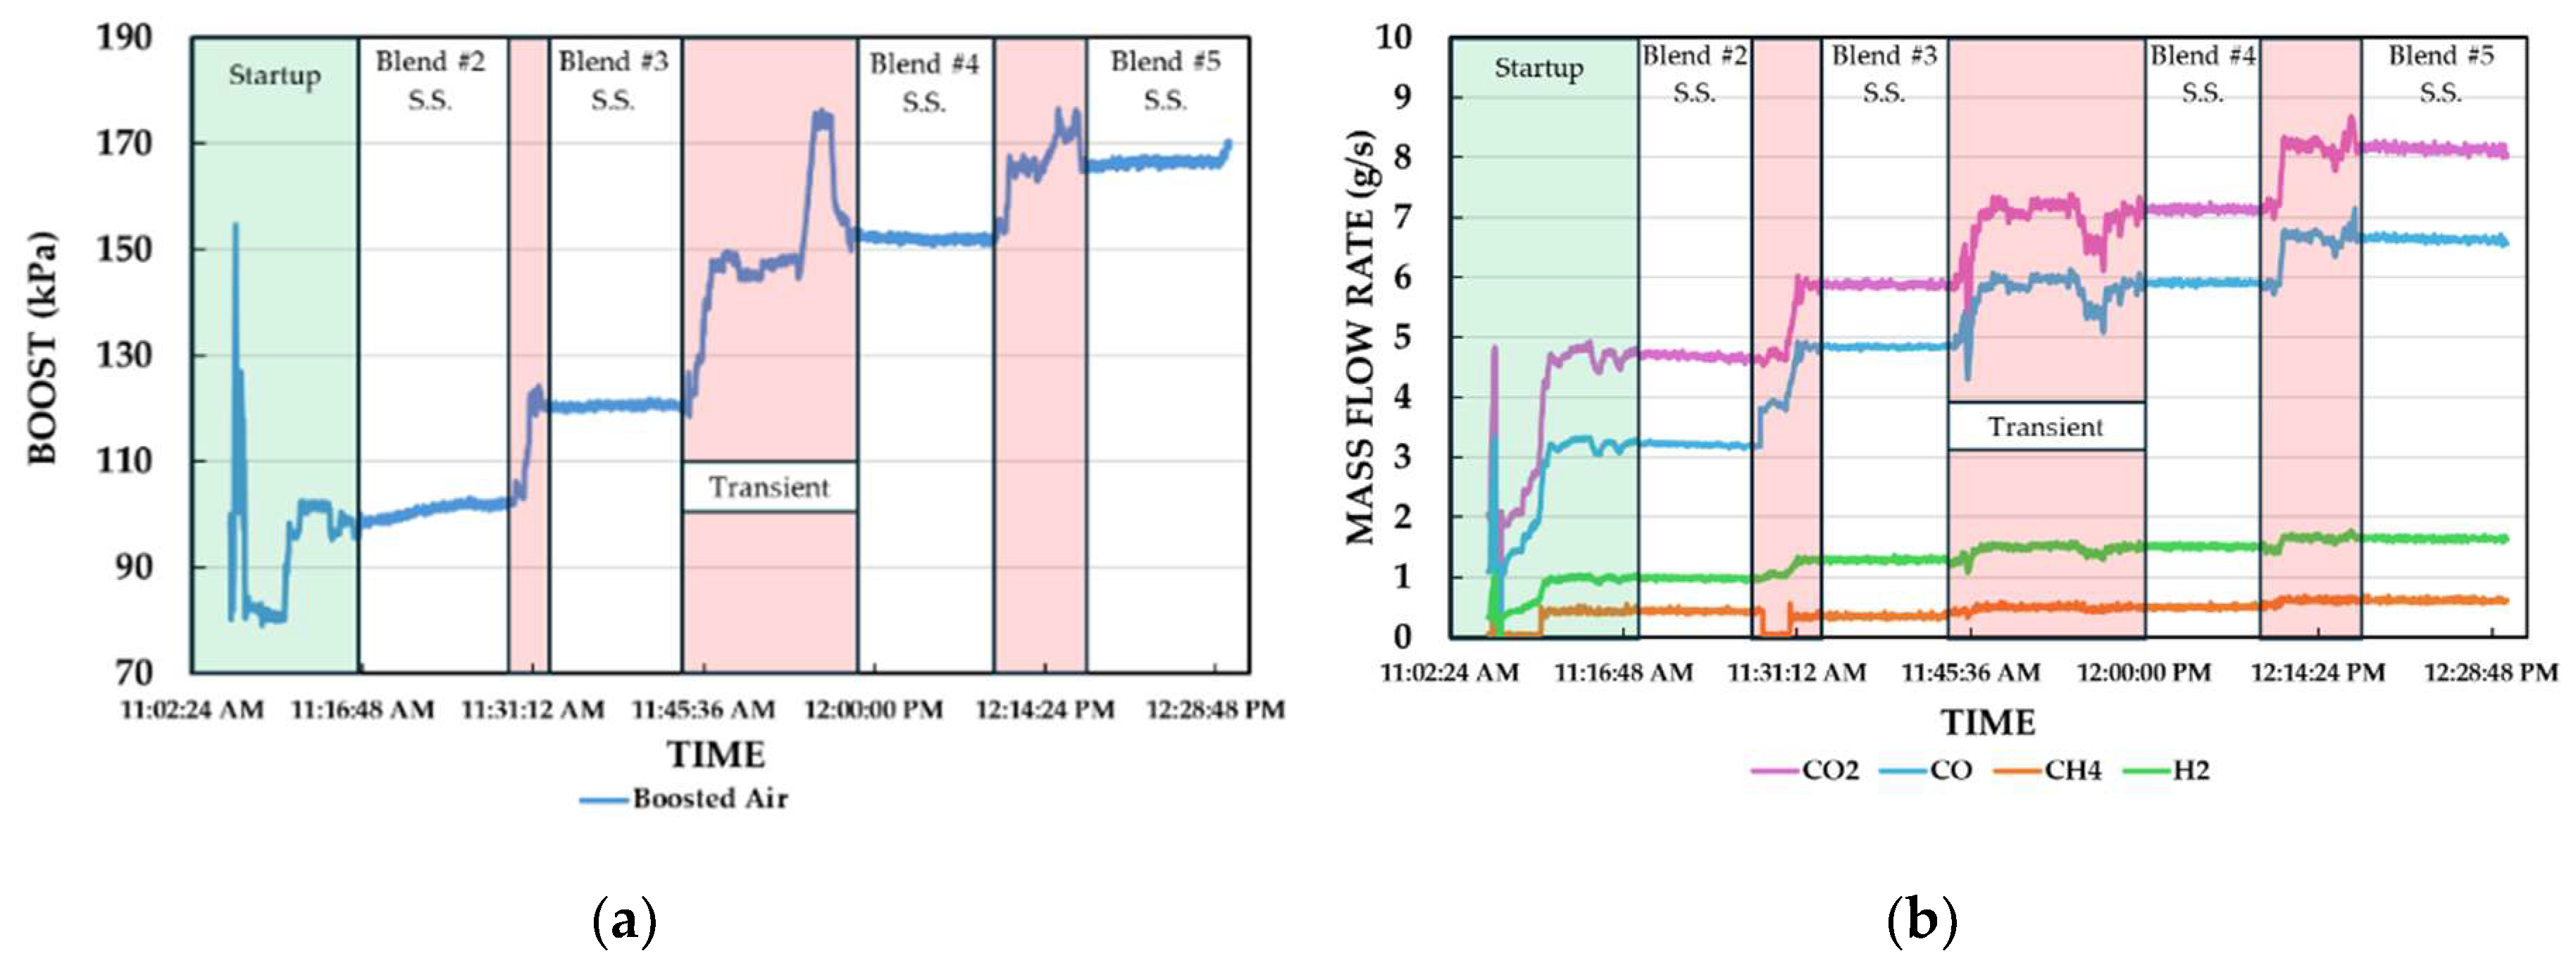
Figure 10 illustrates the boost and mass flow behavior while the engine was transitioned between blends. Boost pressure was manually controlled by gradually increasing the supercharger speed to ensure proper operation of the zero-pressure regulator and prevent fuel starvation. The data indicated that the engine could be transitioned manually between load points within 4 to 15 minutes depending on the blend. Based on current SOFC-ICE hybrid modeling, it is expected to take 1 hour to ramp from Blend 2 to 4, so the data shown in
Figure 10 should be acceptable for operation. During the transition between Blend 3 and Blend 4, there was a boost pressure peak without a corresponding increase in fuel mass flow. This anomaly could be due to a malfunction in the mass flow controllers, an error in the LabView code, or the boost pressure overpowering fuel flow. Despite this, the data suggests the engine could be effectively controlled via the supercharger. In the future, a PID controller could be used to adjust the boost setpoint during changing load conditions by tracking power output and inlet manifold pressure.
Author Contributions
Conceptualization, V.A.R.F. and D.B.O.; methodology, V.A.R.F. S.G., and D.B.O.; software, V.A.R.F.; validation, V.A.R.F., S.G., D.B.O.; formal analysis, V.A.R.F., Z.S.; investigation, V.A.R.F., Z.S., S.G., D.B.O., B.W., T.B. and R.B.; resources, V.A.R.F., S.G., D.B.O., B.W. ; data curation, V.A.R.F, Z.S.; writing—original draft preparation, V.A.R.F.; writing—review and editing, S.G., D.B.O., B.W., and T.B.; visualization, V.A.R.F., S.G., T.B., B.W.; supervision, S.G.; project administration, R.B.; funding acquisition, R.B. All authors have read and agreed to the published version of the manuscript.
Figure 1.
Engine controls scheme and available sensors.
Figure 1.
Engine controls scheme and available sensors.
Figure 2.
Calibrated alternator performance data provided by Kohler Power Systems.
Figure 2.
Calibrated alternator performance data provided by Kohler Power Systems.
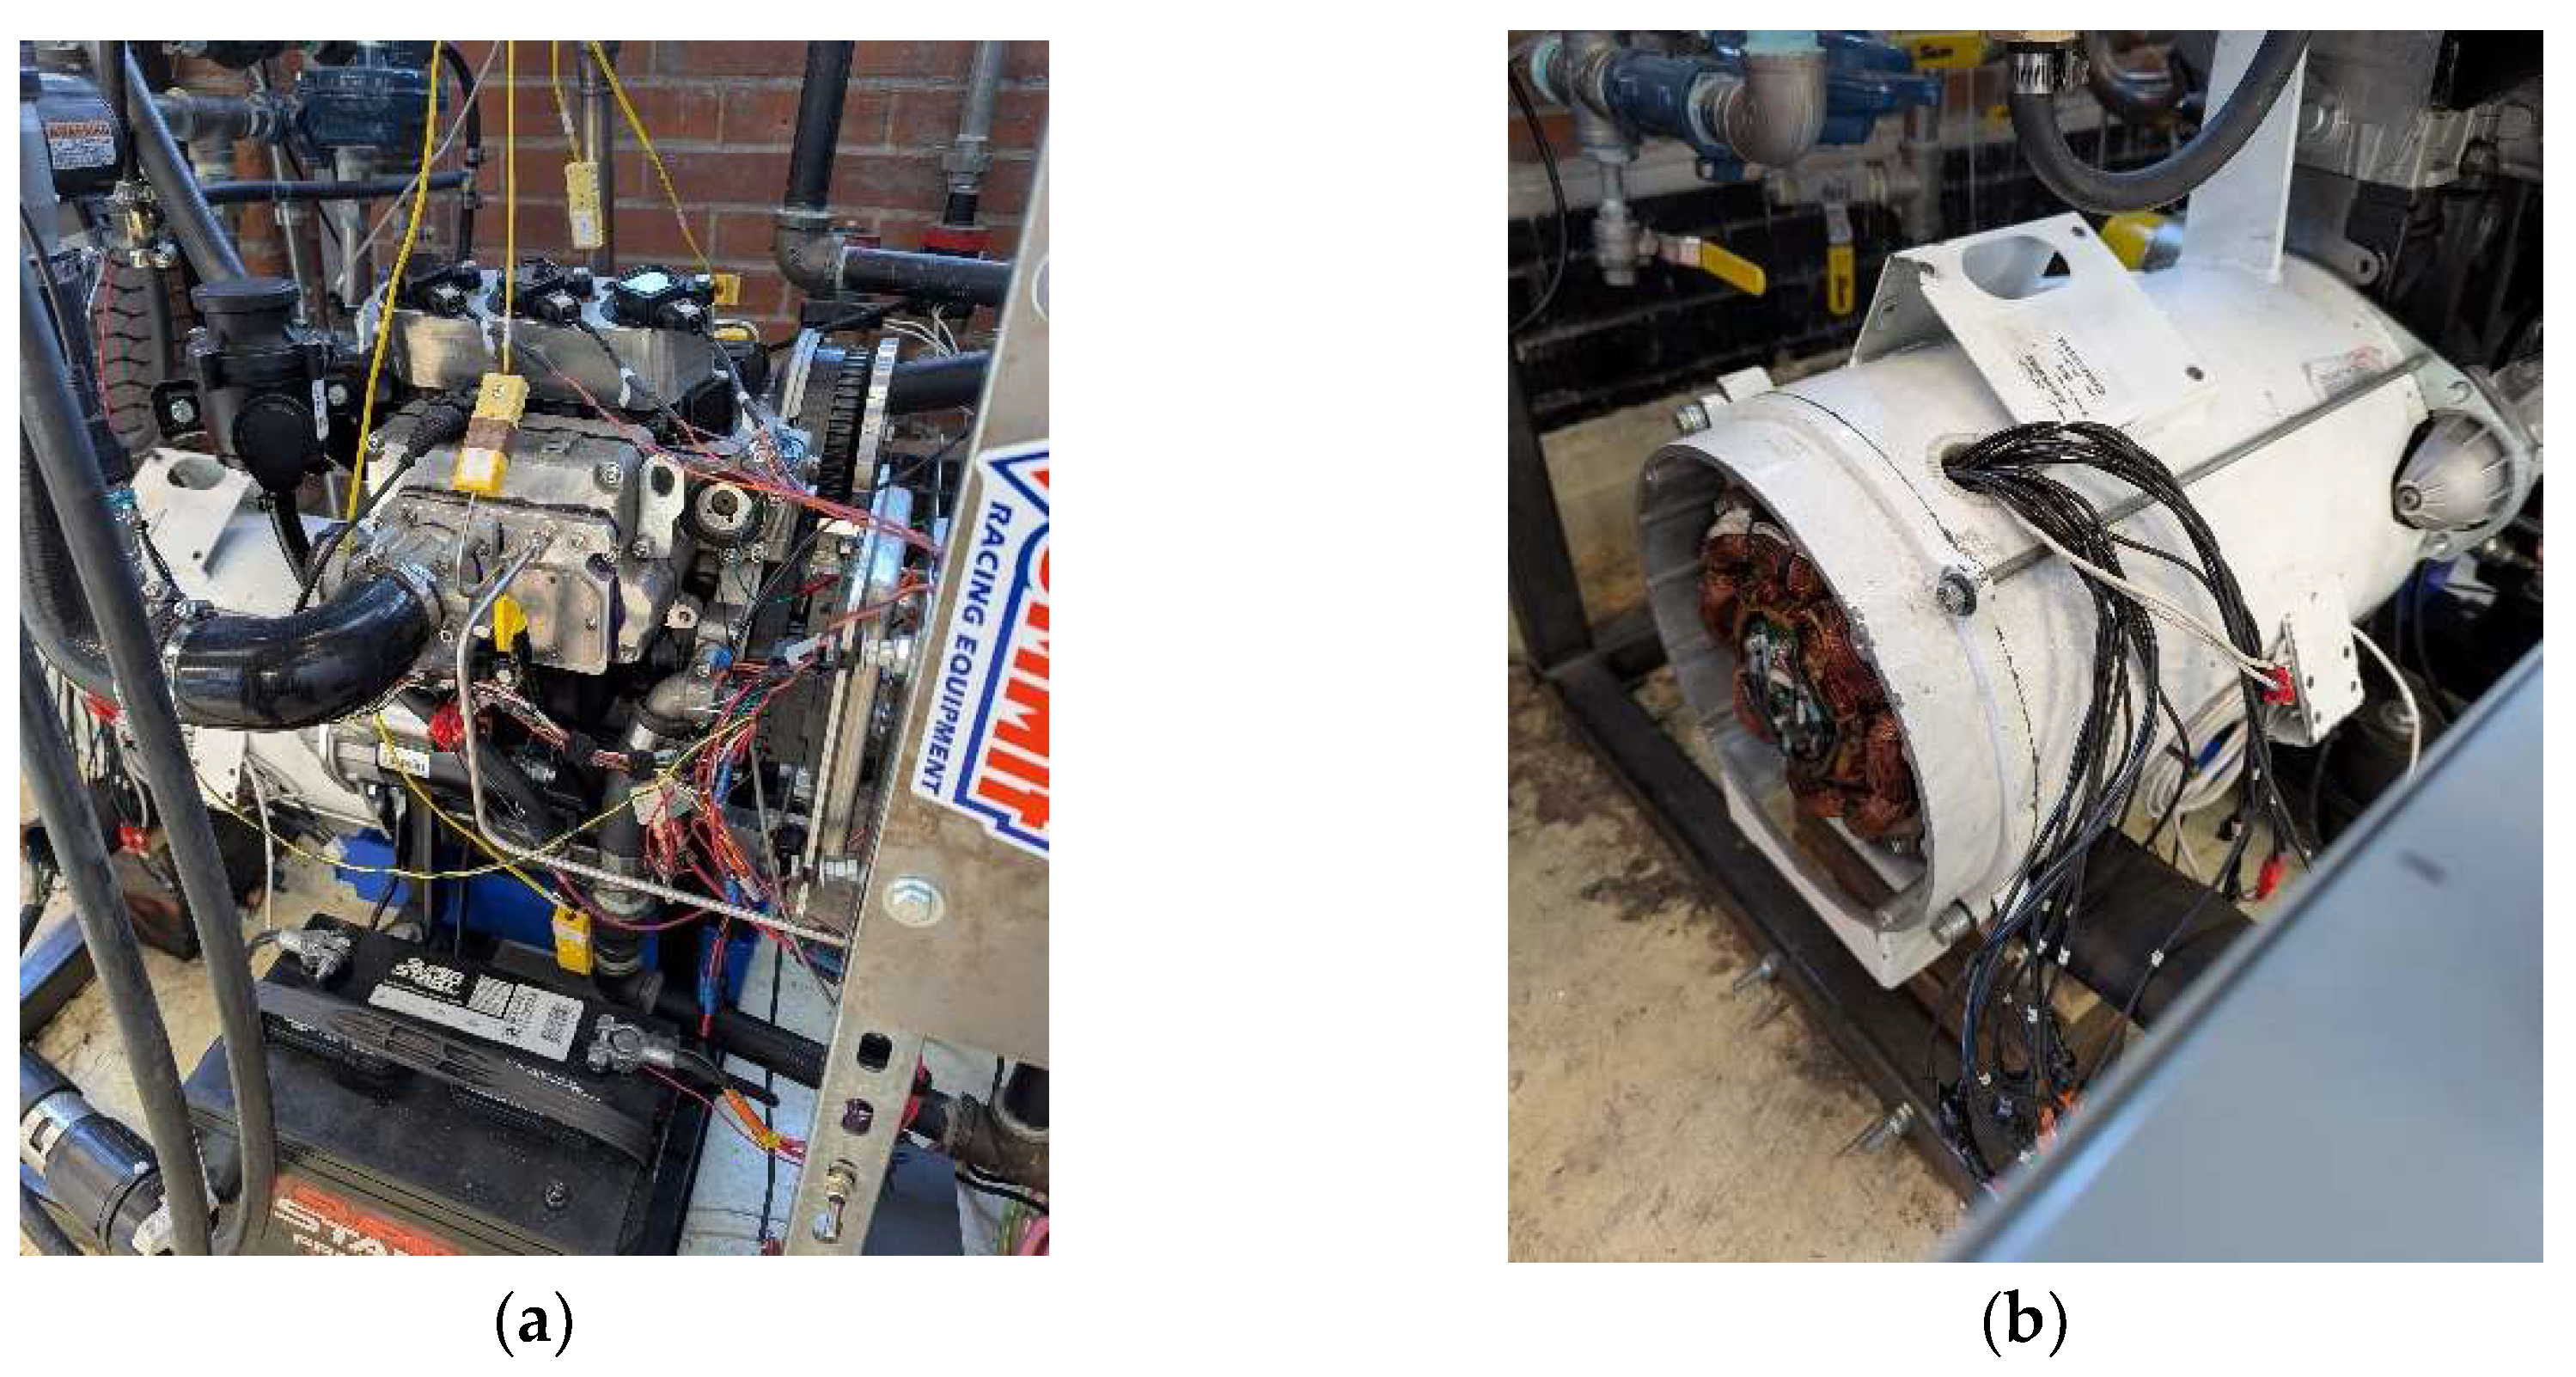
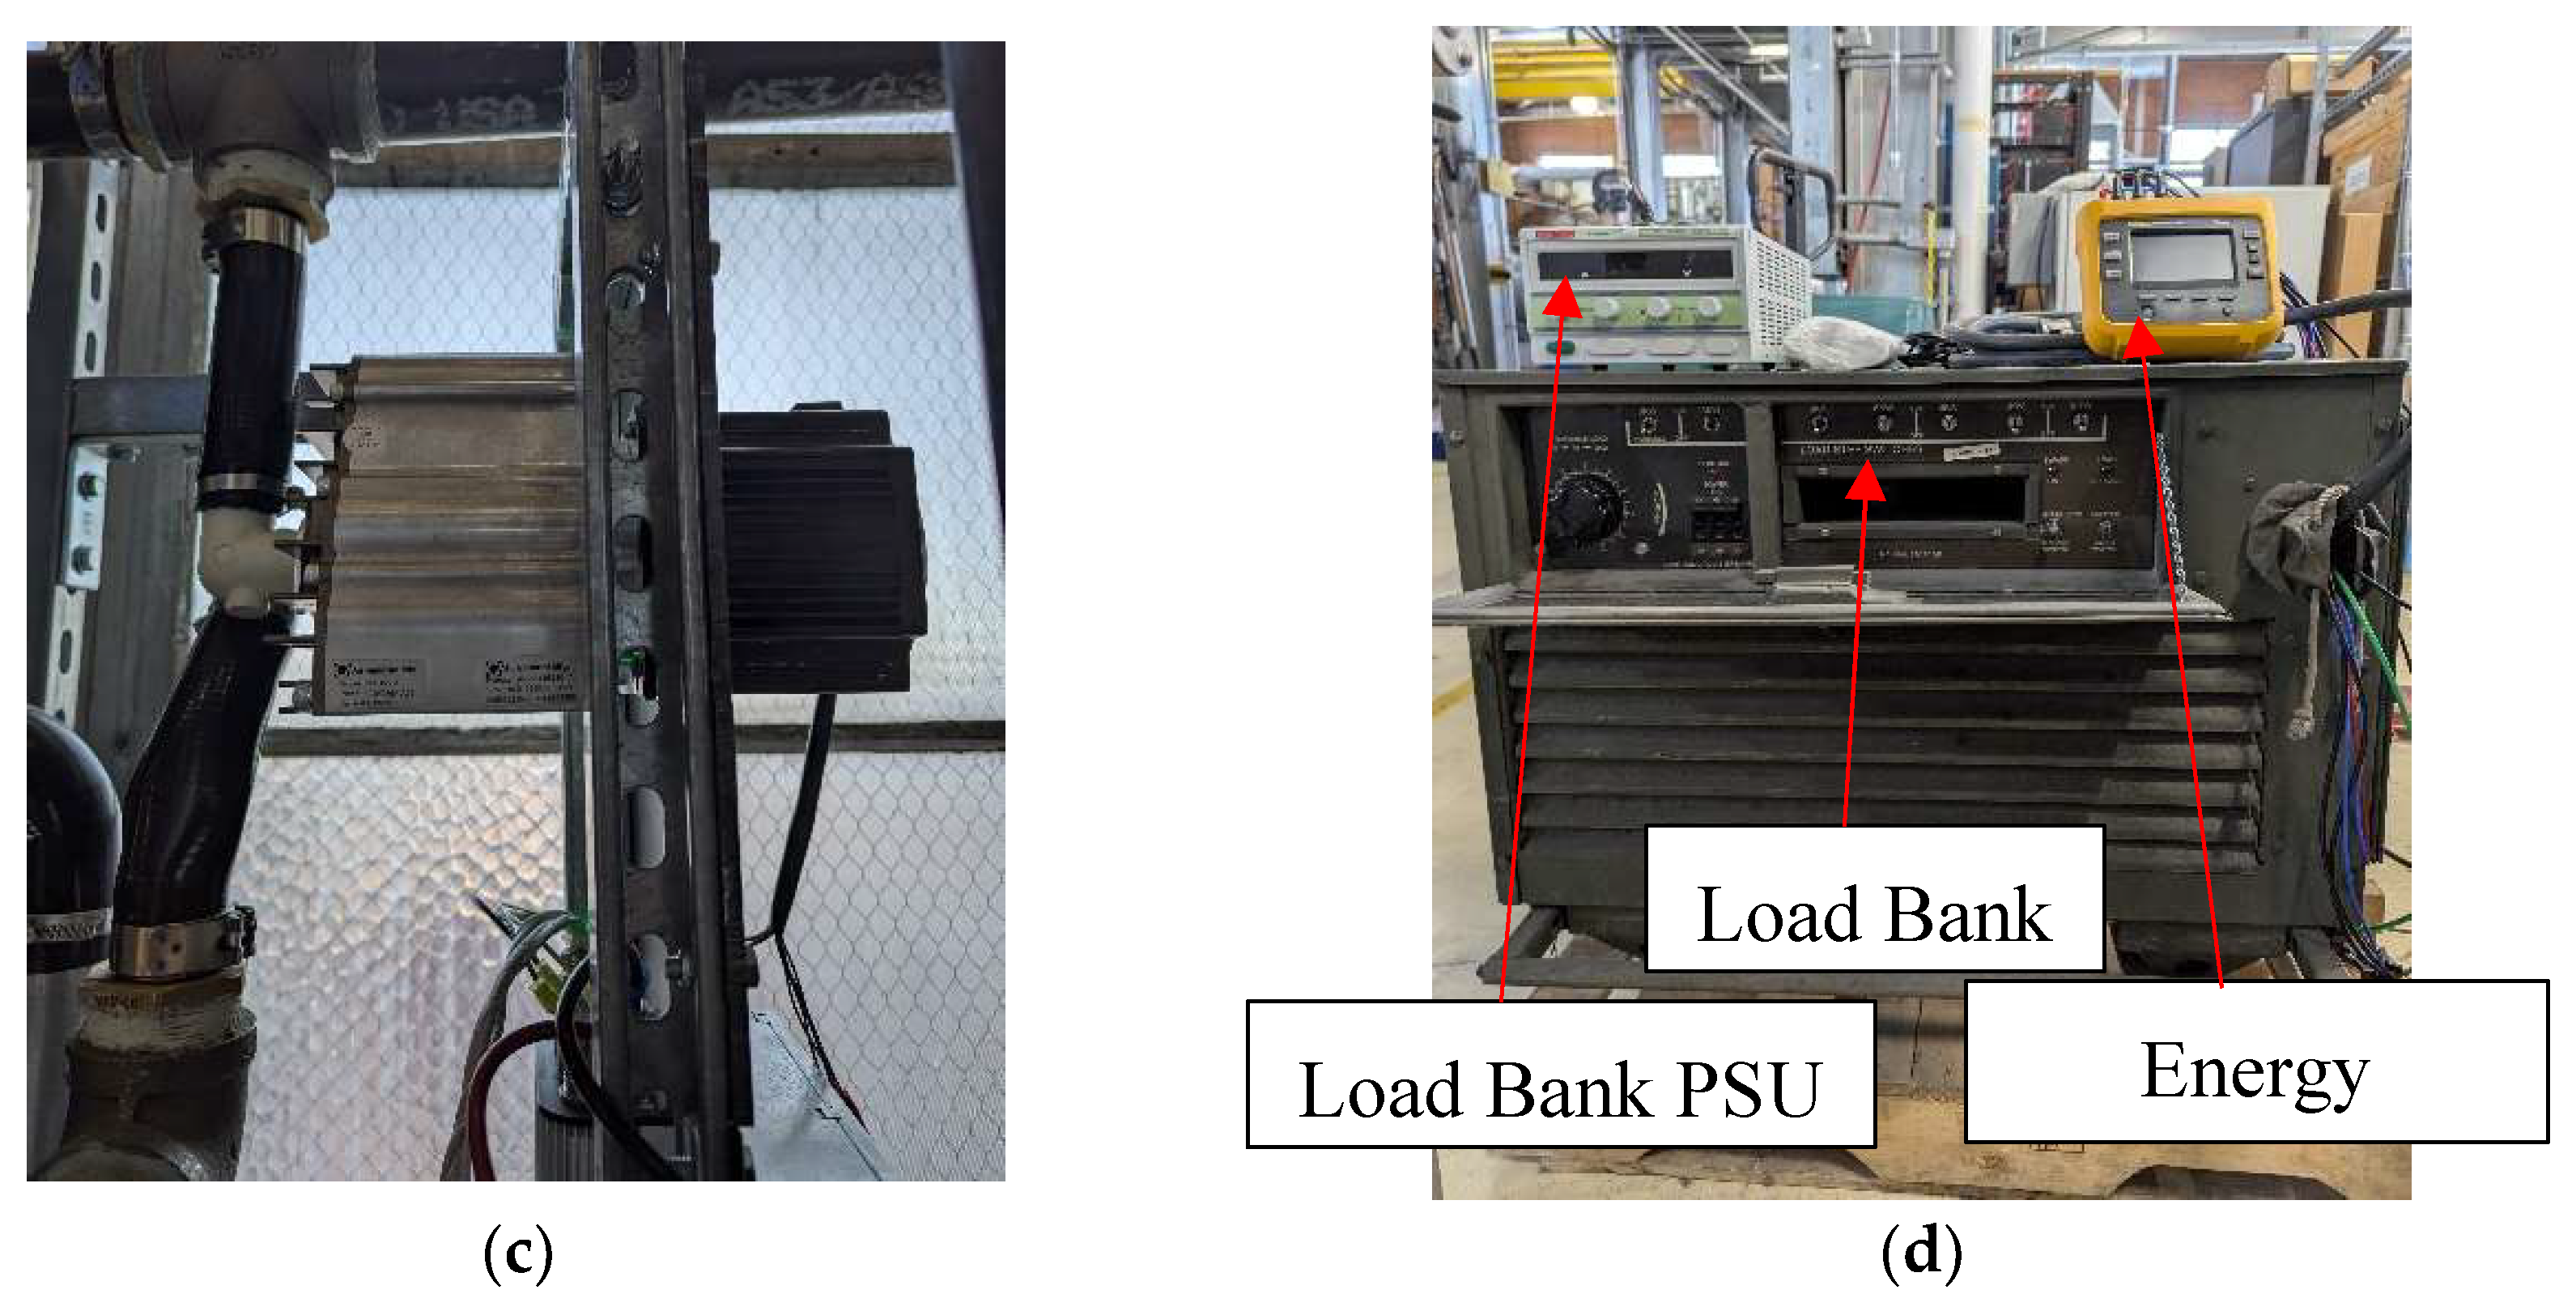
Figure 3.
Test facility components and instrumentation. (a) Kohler engine (b) alternator; (c) supercharger; (d) load bank, load bank power supply (PSU) and Energy Logger.
Figure 3.
Test facility components and instrumentation. (a) Kohler engine (b) alternator; (c) supercharger; (d) load bank, load bank power supply (PSU) and Energy Logger.
Figure 4.
(
a) Blend #1 ignition timing sweep to determine the best crank angle degree (CAD) of spark to achieve maximum BTE. Testing showed a maximum BTE of 36.0% at these conditions: 40° BTDC, 0.75Phi, 150kPa, 10kW load. (
b) Blend #1 equivalence ratio sweep to determine best air-fuel ratio to achieve maximum BTE. Testing showed a maximum BTE of 36.3% at these conditions: 40° BTDC, 0.70Phi, 158kPa, 10kW load [
28].
Figure 5.
(a) California Analytical Instruments Five-gas analyzer, (b) LSU 4.9 Lambda Sensor, Exhaust Sample Port and KQXL-116G-12 K Type Thermocouples.
Figure 5.
(a) California Analytical Instruments Five-gas analyzer, (b) LSU 4.9 Lambda Sensor, Exhaust Sample Port and KQXL-116G-12 K Type Thermocouples.
Figure 6.
Ignition timing sweep to determine the best CAD of spark to achieve maximum BTE at the following steady state conditions: 1600rpm, 0.75phi. Maximum BTE was achieved at these spark timings, not including supercharger losses: Blend #2: 23.6% at 55° BTDC with 3.29kW power output, Blend #3: 27.1% at 50° BTDC with 5.01kW power output, Blend #4: 29.6% at 50° BTDC with 6.81kW power output, Blend #5: 31.0% at 50° BTDC with 8.17kW power output.
Figure 7.
Boost sweep to determine the range of operation at which steady state conditions are met (1600rpm, 0.75phi). Results showed a maximum BTE of 31.4%. It was found that lower limit conditions are the most beneficial for engine performance, with an average increase of 1% BTE, and most power savings.
Figure 8.
Brake specific emissions for all fuel blends tested using Five-gas analyzer. A catalytic converter is required to meet the South Coast Air Quality Management District emission regulation.
Figure 8.
Brake specific emissions for all fuel blends tested using Five-gas analyzer. A catalytic converter is required to meet the South Coast Air Quality Management District emission regulation.
Figure 9.
Speed sweep for Blend #4 to determine the optimal engine speed to achieve maximum BTE. Testing showed that 1600 rpm was the optimal speed for the highest efficiency of 29.9%.
Figure 9.
Speed sweep for Blend #4 to determine the optimal engine speed to achieve maximum BTE. Testing showed that 1600 rpm was the optimal speed for the highest efficiency of 29.9%.
Figure 10.
(a) Boost response during fuel blend transitions. (b) Mass flow response during fuel blend transitions.
Figure 10.
(a) Boost response during fuel blend transitions. (b) Mass flow response during fuel blend transitions.
Table 1.
Ceres SteelCell 1kW
e-class stack physical dimensions [
23].
Table 1.
Ceres SteelCell 1kW
e-class stack physical dimensions [
23].
| Specification |
Value |
| Weight |
11 kg |
| Volume |
5 liters |
| Width |
190 mm |
| Depth |
140 mm |
| Height |
180 mm |
Table 2.
Specification of a SI modified diesel engine. (aTDC: after top dead center).
Table 2.
Specification of a SI modified diesel engine. (aTDC: after top dead center).
| Kohler KDW993T |
| Bore |
73.7 mm |
| Stroke |
77.6 mm |
| Displacement |
993 cc |
| Connecting rod length |
0.1265 m |
| Compression ratio |
17:1 |
| Intake valve timing |
Open: -378° aTDC / Close: -134° aTDC |
| Exhaust valve opening |
Open: -594° aTDC / Close: -342° aTDC |
| Intake gas flow |
Variable |
| Exhaust gas flow |
Variable |
| Engine speed |
1600 rpm |
Table 3.
System model outputs for anode tail gas fuel compositions at different SOFC utilizations.
Table 3.
System model outputs for anode tail gas fuel compositions at different SOFC utilizations.
| SOFC Fuel Utilization |
Flow rate [g/s] |
LHVf
[kJ/kg]
|
Composition [mol %] |
We
[kW]
|
SOFC-ICE |
| CO |
CO2 |
CH4 |
H2 |
H2O |
N2 |
Power [kW] |
| Legacy Fuel Composition |
|
Blend #1
(100% Load) |
7.93 |
4047 |
9.3 |
53.8 |
0.76 |
33.6 |
2.5 |
0.3 |
~ 10 |
80 |
| New Fuel Compositions |
|
Blend #2
(50 % load) |
3.60 |
3328 |
6.7 |
60.3 |
1.6 |
28.5 |
2.4 |
0.3 |
3.56 |
40 |
Blend #3
(75 % load) |
4.98 |
3382 |
7.9 |
58.9 |
1.0 |
29.3 |
2.5 |
0.3 |
5.01 |
60 |
| Blend #4 (100 % load) |
6.80 |
3356 |
8.0 |
59.3 |
1.2 |
28.5 |
2.5 |
0.3 |
6.79 |
80 |
| Blend #5 (125 % load) |
8.47 |
3267 |
8.0 |
60.1 |
1.3 |
27.6 |
2.6 |
0.3 |
8.23 |
100 |