
Submitted:
23 January 2025
Posted:
23 January 2025
You are already at the latest version
Abstract
Wood waste holds surprisingly diverse potential. From trimmings and offcuts to shavings and sawdust, each form can be repurposed in various ways. While converting wood waste into energy pellets through combustion is common, its applications extend far beyond fuel. Particleboard panels offer an environmentally friendly solution by repurposing wood waste rather than incinerating it. To promote sustainability and align with carbon neutrality goals, replacing traditional fossil-based binders with bio-based alternatives is essential. Sawdust/polyglycerol citrate composites were produced, leveraging the abundant availability of glycerin from the biodiesel industry. Sawdust/polyester composites with 25% (by weight) sawdust and a glycerin/citric acid ratio of 0.5 (molar ratio ≈1) were prepared by curing the polymer in an oven at 170 °C for 8 hours. Water (in a water/glycerin ratio ranging from 0 to 2.5) was added to improve the mixability of the sawdust-prepolymer mixture, promoting densification of the composite after curing. Without sawdust, the polymer cure was slower, indicating that the -OH groups of the cellulosic components in sawdust participate in esterification reactions, as evidenced by the fact that citric acid alone acts as a wood binder. These composites were extensively characterized through various physicochemical methods, including ATR-FTIR, TG-DTA in the oxidative atmosphere. Tensile tests demonstrated that the composites possess properties similar to hardwood, while thermal conductivity tests (0.07-0.10 W/(K.m)) indicated that the lightweight panels could be used as thermal and acoustic insulation in construction. The results demonstrate that polyglycerol citrate is an effective biobinder for producing particleboard panels, as it enables the valorization of sawdust from wood processing and glycerin from the biodiesel industry.

Keywords:
biocomposites
; wood binders
; wood waste
; sawdust
; polyglycerol citrate
; wood panels
Introduction
The Circular economy demands the valorization of all waste by incorporating it into materials for current use. The Portuguese forest and traditional wood processing industry generate several tons of residual biomass, much of it in the form of small particles known as sawdust or wood shavings. Traditionally, sawdust is used to generate energy through burning or to produce wood particle boards using binders derived from petroleum products. Substituting fossil-origin binders with biobinders would be beneficial for the sustainability of the sawdust valorization process. The research effort in this field is relevant because the particle board market has shown notable importance in global trade, ranking as the 318th most traded product worldwide in 2022, with a total trade value of USD 12.9 billion. This strong performance highlights the market’s essential role in the construction and furniture industries, where demand is fueled by the need for cost-effective and sustainable materials. The market is projected to grow at an annual rate of 3.5% from 2023 to 2033, reaching an estimated value of USD 32.6 billion by 2033 (Figure 1)[1] .
In petrochemical-based wood adhesives, formaldehyde is a common component in the most widely used types: urea-formaldehyde, melamine-formaldehyde, melamine-urea-formaldehyde, phenol-formaldehyde, phenol-resorcinol-formaldehyde, and one-component polyurethane adhesives [2]. Wood is a natural composite material composed of approximately 60-65% carbohydrate fibers, primarily 2/3 cellulose and 1/3 hemicellulose. These fibers are bound together by 25-30% lignin, a branched phenolic polymer that provides structural integrity. The remaining 10% consists of various compounds, including oleoresins, tannins, starches, and inorganic salts [3].
Cellulose contributes to the toughness and strength of wood, while lignin provides hardness and rigidity. Hemicelluloses are believed to play a key role in linking the lignin and cellulose components [4]. Cellulose monomeric sugar units contain -OH groups which can undergo esterification with carboxylic acids [5] (Figure 2).
Umemura et al. demonstrated the formation of bonds between carboxylic groups from citric acid and hydroxyl groups (-OH) present in Acacia bark components, as evidenced by FTIR spectroscopy. The researchers observed an intense band centered at 1734 cm⁻¹, attributed to esters, which were identified as the primary contributors to adhesive properties [6]. Since citric acid contains three carboxylic groups, it can simultaneously interact with other binding molecules and wood components. Its combinations with glycerin (Figure 3), sorbitol, and glucose have been reported in the literature, resulting in wood panels with varying characteristics.
Glycerin reacts with citric acid, even in the absence of a catalyst, to form polyglycerol citrate esters (PGC) and water (Figure 4). Due to the multiple -COOH groups in citric acid, the resulting PGC can further interact with the -OH groups of lignocellulosic components in wood. Additionally, the authors note that condensation reactions may occur between the unreacted -OH groups of glycerin and lignocellulosic groups. These reactions are reported to be slow and require temperatures above 100 °C to facilitate the evaporation of the water produced [8]. Other organic acids containing only two carboxylic groups, such as maleic acid and suberinic acid, can also be used as wood binders [9]
Given the high functionalization of both citric acid and glycerol molecules (CA: three-COOH and one-OH; Glyc: three -OH groups), their reactions offer multiple possibilities, leading to the formation of diverse polymer chains. By employing genetic algorithms, the researchers demonstrated that ester formation between the -OH group and the -COOH of two CA molecules is more favorable than the reaction between the -COOH of CA and a secondary -OH group of Glyc [10]. Polyglycerol citrate (PGC) is recognized in the literature as a renewable polymer capable of replacing conventional wood preservatives that often contain harmful chemicals. As a wood preservative, PGC provides waterproofing properties and enhances dimensional stability. When combined with appropriate additives, it can also function as a fire retardant when combined with suitable additives [11]. PGC is widely regarded as an eco-friendly wood treatment [12] and can additionally serve as a biobinder for wood applications [7]).
To contribute to knowledge on valorizing by-products from the wood processing industry (sawdust) and the biodiesel industry (glycerine), the following sections present results on the preparation and characterization of sawdust/PCG composites.
Experimental
The composite materials were produced using sawdust sourced from a local wood-cutting company, mainly consisting of pine wood. Before use, the sawdust was dried and pre-sieved with a 1 mm sieve. The fraction of sawdust used underwent granulometric classification by sieving using sieves with openings smaller than 1 mm. The separation was achieved using a high-frequency mechanical vibrator. The prepolymer mixture was prepared using an equal mass of glycerine to sawdust, with citric acid added at twice the mass of the glycerine. These components were combined in a beaker, along with water (in an amount equal to half the mass of glycerine) to aid in the incorporation of the sawdust. The citric acid was dissolved by heating the glycerine-water mixture on an electric plate at 60°C for 10 minutes. Finally, the sawdust was gradually added to the pre-polymer in small portions to ensure a uniform distribution of the polymer throughout the mixture. The sawdust/prepolymer mixture is placed in a rectangular mold (160 mL) and compacted. The sawdust/prepolymer was then cured in an oven with air circulation at 150 °C for 8h. The curing time and temperature were optimized by considering both the composite's color and the tackiness of its surface. A sticky surface indicated incomplete curing, whereas a darker shade of the composite signified excessive curing time and/or temperature. The polymer alone was also cured in analogous conditions to be used as standard. The temperature ranges and curing times were chosen based on relevant literature. In a kinetic study of the polymerization of PGC with a Cit/Glyc ratio of 1, Halpern et al. [13] reported a 90% cure rate at 130°C after 12 hours. Under the same conditions but at 110°C, only 60% of the polymer was cured. Additionally, the same researchers, using TG-DTA analysis, demonstrated that PGC formulations with Cit/Glyc ratios greater than 1 exhibited more favorable curing kinetics. FTIR analysis was employed to assess the completion of esterification in the prepared composites, with the band centered at 1720 cm⁻¹ serving as a reference for the formation of ester groups. According to the literature, this band corresponds to the aliphatic C=O group of polyester. In contrast, the bands centered at 1692 cm⁻¹ and 1746 cm⁻¹ are associated with the C=O groups of unesterified citric acid [14]. The IR spectra were obtained using ATR-FTIR on a PerkinElmer Spectrum Two spectrometer equipped with a diamond crystal ATR accessory. Spectra were recorded in the range of 4000 cm⁻¹ to 600 cm⁻¹ with a resolution of 4 cm⁻¹, averaging 4 scans per measurement. The reflection signals were corrected using the Kubelka-Munk function [15] to enhance the signal-to-noise ratio.
After demolding, the composite samples were cut into parallelepiped shapes using an electric saw to prepare them for density measurement. The dimensions of each sample were recorded with a caliper, and the samples were weighed on an analytical balance. To ensure accuracy, at least three specimens were measured for each composite type, with the average of these measurements taken as the composite's final density.
To test the thermal insulation properties of the composite, its thermal conductivity was measured using the ISOMET 2114 instrument, a commercially available tool that utilizes transient impulse methods. This dynamic measurement approach shortens the thermal conductivity testing time to about 10–15 minutes [16].The method is based on analyzing the material’s temperature response to heat flow impulses, with the heat generated by an electric resistor in direct contact with the sample’s surface [17].The measurement accuracy is 5% of the reading. In this test, considering the dimensions of the probe used to measure thermal conductivity, the composites had a thickness of approximately 2.5 cm. This thickness was selected to ensure that, when the probe was inserted, it would not be too thin, which could compromise the test results.
The hygroscopicity of the prepared composites was assessed through a water adsorption test performed at room temperature (around 25 °C). For each test, the specimens were wrapped in a thin, water-saturated sponge and enclosed in aluminum foil to prevent evaporation of the surrounding environment. Before beginning the test, the specimens were weighed using an analytical balance. The specimens were then periodically reweighed until their mass stabilized, indicating that adsorption equilibrium had been reached. The tests were conducted on three samples: the wood/PGC composite prepared with a Glyc/CA ratio of 0.5, PGC without wood, and the composite pre-treated with a commercial water-based varnish to reduce water absorption.
To analyze the porosity of the composite material, three different samples were selected, each with distinct weight ratios Glyc/water ratios: 1:1 (specimen 1), 1:2 (specimen 2), and 1:2.5 (specimen 1). For each sample, five regions from the surface were examined to ensure the results were as representative as possible. A microscope and DinoCapture software were used to capture images of composite surfaces.
The captured images were processed using ImageJ software for porosity analysis. Each image was separated into red, green, and blue color channels. The channel with the best contrast and clarity was chosen, while avoiding those that were too dark or grainy, which could affect the accuracy of the analysis. The “Threshold” tool in ImageJ was then used to highlight porous areas. By adjusting the threshold, the pores were marked in red, and the image was converted to a binary format, where the pores appeared as white regions.
Next, the “Analyze Particles” function in ImageJ was used to measure porosity. A size range filter was applied to exclude any noise from areas that were too small, ensuring only actual pores were considered. The resulting porosity percentage, expressed as the area fraction, was recorded and exported to an Excel spreadsheet. The area fraction values from all analyzed images were averaged to determine the overall porosity for each sample.
This systematic approach ensured a reliable and accurate measurement of the composite material's porosity.
To mechanically characterize the composites, tensile tests were conducted. This destructive test measures the force required to fracture a specimen and the elongation before breaking [18]. The specimen is subjected to a uniaxial pulling force, causing deformation. Typically, specimens have flat or round cross-sections [19]. Tensile testing provides tensile strength, yield strength, and ductility data [18]. The output is a force-elongation record, which can be converted into a stress-strain curve, where stress is the load divided by the cross-sectional area, and strain is the deformation divided by the initial length [19]. Due to the lack of a consistent wood fiber orientation pattern in the composite, standard polymer matrix composite testing methods were not fully applicable. Therefore, specimens were cut from rectangular samples. To address surface irregularities, specimen faces were flattened using a milling machine, resulting in parallelepiped-shaped specimens. Most fractures occurred in the central regions, where stress distribution was uniform. In some cases, fractures near the grips suggested biaxial stresses, making those results less reliable. Tensile tests were performed on an Instron® 5566 universal testing machine with a 500 N load cell. Specimens were carefully aligned, and tests were conducted at a speed of 1 mm/min using Bluehill® 2 software for data acquisition and processing. For each composite, tensile tests were performed on five specimens, using 10 × 2 × 1 cm parallelepiped samples, with each test replicated four times. The data from the linear region of the tensile tests, representing elastic behavior, was used to calculate the Young's modulus for each tested specimen.
Results and Discussion
Sawdust particles larger than 1 mm were discarded, while the remaining material was further sieved to determine the average particle diameter. Table 1 presents data showing an almost uniform distribution of particles within the 125-710 µm size range. All particle size fractions were utilized to prepare the composite, with an average particle size of 452 µm. After the curing period, the initially viscous and sticky mixture of sawdust, citric acid, glycerine, and water transformed into a dry, hard, non-sticky material with a deeper color. Upon cutting with a blade saw, the specimens revealed a spongy morphology (Figure 5). The observed vacuoles resulted from the evaporation of the water formed by the esterification reactions.
Microscopic observation of the specimens highlighted the fact that the composites have rough surfaces with macroporosity (Figure 6 a)). The porosity was evaluated by microscopic analysis as described in the experimental section. The uncut surface was photographed (Figure 6 a)) and the surface pores evaluated using the computed shadows images in Figure 6 b)). The surface porosity of the 3 specimens analyzed (Figure 7) was 6% for the 2nd and 3rd specimens, while the 1st specimen had 7% pores. The results indicate that the water used during the raw material mixing process has no impact on the composite's morphology after curing.
The technique used does not allow for inferring the porosity of the composite bulk. However, considering that water forms during the esterification reaction and becomes a gas at the curing temperature, a macroporous morphology can be anticipated, as observed in the specimens prepared for density determination.
To evaluate the formation of polyglycerol citrate within the composites, the materials were characterized using ATR-FTIR. The FTIR characterization of PGC, the standalone biopolymer, is well-documented in the literature, with the primary bands and their corresponding assignments summarized in Table 2. For comparative analysis, spectra of the raw materials—glycerin, citric acid, and sawdust—were also recorded and plotted. The spectrum of the material prepared with sawdust and citric acid, without glycerin, was also plotted to demonstrate the esterification of the -OH groups of the lignocellulosic components with citric acid. The spectra in Figure 8 show the presence of reflectance bands within the wavenumber range characteristic of esters. The sawdust/PGC spectra in Figure 9 shows that the 3 bands characteristic of the -COOH groups of citric acid (1754, 1714 and 1684 cm-1) have been replaced by a broad band in the 1750-1720 cm-1 range characteristic of ester groups (-COOR) [12]. This ester band is observed in all the composites analyzed; however, only the composite prepared without glycerine shows a slight shift of this band to lower wavenumbers. This shift may indicate that not all -COOH groups in the citric acid have formed ester bonds with the lignocellulosic components in the sawdust. The composites prepared with PGC exhibit a more intense band corresponding to -OH groups (at 3400 cm⁻¹) compared to PGC alone, suggesting a high level of hygroscopicity, as reported in the literature. Despite hygroscopic nature of PGC/wood composites, treating wood with PGC is reported in the literature as an effective method for reducing both its moisture absorption and its susceptibility to fungal attack and decay [20].
Increasing the amount of glycerin in the preparation of the composites reduces the intensity of the shoulder observed in the 1650–1600 cm⁻¹ range, associated with the -C=O vibration of unesterified citric acid. In the composite without glycerin, this shoulder is pronounced, indicating that a portion of the citric acid remains unesterified. This observation is further corroborated by thermogravimetric analysis, as detailed in the following text.
The thermal degradation behavior of PGC, as assessed by thermogravimetry (Figure 10), reveals a primary degradation process with a maximum degradation rate occurring at 330 °C, which corresponds to the thermal degradation of the polymer chains [14]. This temperature is significantly higher than the thermal degradation temperatures of citric acid and glycerin, which are 200 °C and 290 °C [22], respectively. The low-temperature processes mentioned by Giroto et al. [14], associated with unreacted monomers, are absent, indicating that polymerization occurred extensively even without the presence of a catalyst. The thermal degradation profile of sawdust (Figure 10) aligns with data reported in the literature for lignocellulosic materials, exhibiting two main processes attributed to hemicellulose and cellulose. The composites exhibit two distinct thermal degradation processes (Figure 10). The first process, occurring at a lower temperature within the range of hemicellulose degradation, becomes more pronounced with increasing glycerine content in the composite. This behavior suggests it is associated with PGC bound to the -OH groups of hemicellulose. The second process occurs at a slightly higher temperature than the degradation of isolated PGC but within the range of cellulose degradation, indicating it corresponds to the degradation of cellulose-bound PGC species. The characterized composites did not exhibit any degradation processes associated with isolated monomers or PGC not bound to sawdust.
In the absence of glycerine, the composite continues to display two distinct thermal degradation processes. The more intense process occurs at relatively low temperatures (peaking at 200 °C), which is attributed to the degradation of unbound citric acid. The less intense process occurs at higher temperatures, within the same range as the degradation of isolated PGC. This process is associated with citric acid species esterified with the -OH groups of lignocellulosic components. These esterified species are less thermally stable than their glycerine-bound counterparts.
The average density of the composites prepared with PGC ranged from 472 to 621 kg/m³, showing a trend of increasing density as the Glyc/CA ratio increased (Figure 11). The composite prepared without glycerine exhibited a significantly lower density, but its exact value could not be measured. This was due to the specimens' irregular edges, as the composite crumbled easily during cutting. The density of the composites produced with varying glycerine contents falls within the range typically specified for standard medium-density wood panels, commercially known as MDF (550–800 kg/m3)1. Lower density (<340kg/m3) panels have been reported by Segovia et al. [22] using analogous biobinder (<20% wt.) and wood fibers instead sawdust. The comparatively limited quantity of biobinder used by the researchers appears to account for the lower density of the panels they produced compared to those in this study, which utilized more than 50% binder by mass.
The maximum stress supported by the composites in tensile tests (data shown in Figure 11) was relatively low compared to conventional wood panels, which typically exhibit values around 8 Mpa [23] For Glyc/CA ratios below 0.5, the tensile strength increased with composite density. According to the literature, the tensile strength of sawdust/binder composites is influenced by the type of binder, the sawdust-to-binder ratio, and the manufacturing conditions. Due to the variability in preparation methods and raw materials, direct comparisons between the mechanical behavior observed in this study and previously published data are not feasible. However, data from reference X suggest that the binder, which formed a foam structure, is a significant factor contributing to the low tensile strength values observed in the prepared composites.
The Young's modulus calculated for the linear region of the tensile tests indicates elasticities below 0.6 GPa (Figure 12), characteristic of flexible, foam materials (Figure 13). These values align with the observation that PGC, cured under the specified conditions, forms foamy structures, even when combined with sawdust. The elasticity of the composites depends on the glycerine content used during their preparation. Notably, the composite prepared with a Glyc/CA ratio of 0.5 exhibits greater elasticity, likely because this approximately equimolar stoichiometry promotes the formation of hyperbranched polymeric chains [24].
The thermal conductivity (kk) of the composite with the best mechanical properties (Glyc/CA = 0.5) was measured using the ISOMET 2114 equipment, as described in the experimental section. The results yielded kk values in the range of 0.07–0.1 W/(m·K). These values are comparable to those reported for hardwood panels [26] commonly used as insulation, demonstrating that the sawdust/PGC composites possess suitable characteristics for thermal insulation in civil construction. Moreover, the kk values obtained in this study are more favorable than those reported by Mussa and Salih [27] for wood-plastic composites (PP and HDPE), which ranged from 0.15 to 0.5 W/(m·K). Their findings also highlighted a slight decrease in kk values with increasing wood content. The spongy morphology of PGC is a key factor contributing to its excellent thermal insulating performance. Here's an improved version of your text with enhanced readability and clarity: The thermal conductivity of the sawdust/PGC composite is comparable to the values reported by Zhang et al. [28] for composites made using pre-carbonized sawdust and geopolymers as inorganic binders. These composites, with a thermal conductivity of k = 0.087 W/(m.K) demonstrated excellent fire resistance. This is attributed to the inorganic nature of the binder and the pre-carbonization of the sawdust, which together enhance their thermal stability.
For potential large-scale applications, such as thermal insulation, the prepared composites must demonstrate stability when exposed to atmospheric conditions. To evaluate this, water adsorption tests were performed on the Glyc/CA=0.5 composite. The results, presented in Figure 14, reveal that the composite and the polymer exhibit similar behavior, showing significant water adsorption. This suggests that the polymer effectively protects the sawdust when incorporated into the composite. These findings align with literature reports, which recommend impregnating wood logs with PGC to enhance their resistance to environmental degradation [12,29]. To reduce water absorption by the composite, a commercial water-based varnish was applied as a waterproofing treatment. The water absorption curve for the modified composite, shown in Figure 14, indicates that while the varnish partially reduced water absorption, it was not fully effective. This limited efficiency is attributed to the composite's surface irregularities, which hindered the formation of a uniform and effective varnish layer.
Conclusions
This study successfully demonstrated the feasibility of producing wood-based composites using sawdust and a renewable bio-based binder derived from citric acid and glycerol (polyglycerol citrate - PGC). The composites exhibited a porous morphology, resulting from the evaporation of water during the curing process. FTIR analysis confirmed the formation of ester bonds between the -COOH groups of citric acid and the -OH groups of both glycerol and lignocellulosic components in sawdust. The thermal stability of the composites was significantly higher than that of the individual components, indicating strong interactions between the binder and the sawdust. The composites exhibited relatively low densities, falling within the range of medium-density fiberboards (MDF), and demonstrated promising thermal insulation properties, with thermal conductivity values comparable to those of hardwood panels. While the tensile strength of the current formulations was relatively low, further optimization of the sawdust-to-binder ratio could significantly enhance the mechanical properties of the composites. The hygroscopicity of the composites was comparable to that of the PGC binder itself, indicating that the binder effectively protects the sawdust from moisture absorption. However, surface treatment with a water-based varnish was only partially effective in reducing water uptake, suggesting the need for more effective surface treatments to improve the long-term durability of the composites. Overall, this research demonstrates the potential of sawdust-PGC composites as sustainable alternatives to traditional wood-based panels. Further research should focus on optimizing the formulation and processing parameters to enhance their mechanical properties and durability while maintaining their desirable thermal insulation and environmental benefits.
CRediT authorship contribution statement
Leonor Martins: Writing – original draft, Investigation Relógio Ribeiro: Conceptualization, resources, supervision, Bruna Rijo: Writing – review & editing. M. Francisco Costa Pereira: Resources, Data curation, Ana Paula Soares Dias: Writing – review & editing, Writing – original draft, Resources, Funding acquisition, Conceptualization.
Acknowledgments
This work was partially supported through FCT strategic funding of CERENA (UIDB/04028/2020).
Declaration of competing interest
The authors declare that they have no known competing financial interests or personal relationships that could have appeared to influence the work reported in this paper.
| 1 | European Committee for Standardization. EN 316: Wood Fibreboards - Definition, Classification and Symbols. B, 2009 |
References
- Particle Board Market Size, Share, Growth | CAGR of 3.5% Available online:. Available online: https://marketresearch.biz/report/particle-board-market/ (accessed on 14 November 2024).
- Pizzi, A.; Papadopoulos, A.N.; Policardi, F. Wood Composites and Their Polymer Binders. Polym. 2020, Vol. 12, Page 1115 2020, 12, 1115. [Google Scholar] [CrossRef]
- Mai, C.; Zhang, K. Wood Chemistry. Springer Handbooks 2023, 179–279. [Google Scholar] [CrossRef]
- Fu, Z.; Lu, Y.; Wu, G.; Bai, L.; Barker-Rothschild, D.; Lyu, J.; Liu, S.; Rojas, O.J. Wood Elasticity and Compressible Wood-Based Materials: Functional Design and Applications. Prog. Mater. Sci. 2025, 147, 101354. [Google Scholar] [CrossRef]
- Liu, S.; Zhang, Q.; Gou, S.; Zhang, L.; Wang, Z. Esterification of Cellulose Using Carboxylic Acid-Based Deep Eutectic Solvents to Produce High-Yield Cellulose Nanofibers. Carbohydr. Polym. 2021, 251, 117018. [Google Scholar] [CrossRef] [PubMed]
- Umemura, K.; Ueda, T.; Munawar, S.S.; Kawai, S. Application of Citric Acid as Natural Adhesive for Wood. J. Appl. Polym. Sci. 2012, 123, 1991–1996. [Google Scholar] [CrossRef]
- Lee, S.H.; Tahir, P.M.; Lum, W.C.; Tan, L.P.; Bawon, P.; Park, B.D.; Al Edrus, S.S.A.O.; Abdullah, U.H. A Review on Citric Acid as Green Modifying Agent and Binder for Wood. Polym. 2020, Vol. 12, Page 1692 2020, 12, 1692. [Google Scholar] [CrossRef]
- Kudahettige-Nilsson, R.L.; Ullsten, H.; Henriksson, G. Plastic Composites Made from Glycerol, Citric Acid, and Forest Components. BioResources 2019, 13, 6600–6612. [Google Scholar] [CrossRef]
- Hussin, M.H.; Abd Latif, N.H.; Hamidon, T.S.; Idris, N.N.; Hashim, R.; Appaturi, J.N.; Brosse, N.; Ziegler-Devin, I.; Chrusiel, L.; Fatriasari, W.; et al. Latest Advancements in High-Performance Bio-Based Wood Adhesives: A Critical Review. J. Mater. Res. Technol. 2022, 21, 3909–3946. [Google Scholar] [CrossRef]
- Wrzecionek, M.; Matyszczak, G.; Bandzerewicz, A.; Ruśkowski, P.; Gadomska-Gajadhur, A. Kinetics of Polycondensation of Citric Acid with Glycerol Based on a Genetic Algorithm. Org. Process Res. Dev. 2021, 25, 271–281. [Google Scholar] [CrossRef]
- Taib, M.N.A.M.; Antov, P.; Savov, V.; Fatriasari, W.; Madyaratri, E.W.; Wirawan, R.; Osvaldová, L.M.; Hua, L.S.; Ghani, M.A.A.; Edrus, S.S.A.O. Al; et al. Current Progress of Biopolymer-Based Flame Retardant. Polym. Degrad. Stab. 2022, 205, 110153. [Google Scholar] [CrossRef]
- Essoua, G.G.E.; Blanchet, P.; Landry, V.; Beauregard, R. Pine Wood Treated with a Citric Acid and Glycerol Mixture: Biomaterial Performance Improved by a Bio-Byproduct. BioResources 2016, 11, 3049–3072. [Google Scholar] [CrossRef]
- Halpern, J.M.; Urbanski, R.; Weinstock, A.K.; Iwig, D.F.; Mathers, R.T.; Von Recum, H.A. A Biodegradable Thermoset Polymer Made by Esterification of Citric Acid and Glycerol. J. Biomed. Mater. Res. - Part A 2014, 102, 1467–1477. [Google Scholar] [CrossRef] [PubMed]
- Giroto, A.S.; Valle, S.F.; Borges, R.; Colnago, L.A.; Ribeiro, T.S.; Jablonowski, N.D.; Ribeiro, C.; Mattoso, L.H.C. Revealing the Structure Formation on Polyglycerol Citrate Polymers—An Environmentally Friendly Polyester as a Seed-Coating Material. Polymers (Basel). 2023, 15, 4303. [Google Scholar] [CrossRef]
- Paula Soares Dias, A.; Saraiva, N.; Rijo, B.; Francisco Costa Pereira, M.; Santos, L.F.; Galhano, R.; Paulo, I.; Paula, A.; Dias, S.; Saraiva, N.; et al. Sugar Derived Hydrochar Catalysts for Enhanced Biodiesel Production via Esterification. Fuel 2024, 374, 132459. [Google Scholar] [CrossRef]
- Chen, H.; Ginzburg, V. V.; Yang, J.; Yang, Y.; Liu, W.; Huang, Y.; Du, L.; Chen, B. Thermal Conductivity of Polymer-Based Composites: Fundamentals and Applications. Prog. Polym. Sci. 2016, 59, 41–85. [Google Scholar] [CrossRef]
- Pavlík, Z.; Vejmelková, E.; Fiala, L.; Černý, R. Effect of Moisture on Thermal Conductivity of Lime-Based Composites. Int. J. Thermophys. 2009, 30, 1999–2014. [Google Scholar] [CrossRef]
- Saba, N.; Jawaid, M.; Sultan, M.T.H. An Overview of Mechanical and Physical Testing of Composite Materials. Mech. Phys. Test. Biocomposites, Fibre-Reinforced Compos. Hybrid Compos. 2019, 1–12. [Google Scholar] [CrossRef]
- Chawla, N.; Allison, J.E. Fatigue of Particle Reinforced Materials. Encycl. Mater. Sci. Technol. 2001, 2967–2971. [Google Scholar] [CrossRef]
- Wei, L.; McDonald, A.G.; Freitag, C.; Morrell, J.J. Effects of Wood Fiber Esterification on Properties, Weatherability and Biodurability of Wood Plastic Composites. Polym. Degrad. Stab. 2013, 98, 1348–1361. [Google Scholar] [CrossRef]
- Chamorro, A.F.; Lerma, T.A.; Palencia, M. CTAB Surfactant Promotes Rapid, Efficient, and Simultaneous Removal of Cationic and Anionic Dyes through Adsorption on Glycerol/Citrate Polyester. Water (Switzerland) 2024, 16, 1860. [Google Scholar] [CrossRef]
- Segovia, F.; Blanchet, P.; Auclair, N.; Essoua, G.G.E. Thermo-Mechanical Properties of a Wood Fiber Insulation Board Using a Bio-Based Adhesive as a Binder. Build. 2020, Vol. 10, Page 152 2020, 10, 152. [Google Scholar] [CrossRef]
- Ates, S.; Kara, H.R.; Olgun, C.; Ozkan, O.E.; Ri Olgun, C.˘; Osman, &; Ozkan, Effects of Heat Treatment on Some Properties of MDF (Medium-Density Fiberboard). 2015. [CrossRef]
- Zahlan, H.; Saeed, W.S.; Alrasheed, R.; Alandes, N.M.; Aouak, T. Synthesis of Poly (Citric Acid-Co-Glycerol) and Its Application as an Inhibitor of CaCO3 Deposition. Mater. 2019, Vol. 12, Page 3800 2019, 12, 3800. [Google Scholar] [CrossRef] [PubMed]
- Young’s Modulus - Density Available online:. Available online: http://www-materials.eng.cam.ac.uk/mpsite/interactive_charts/stiffness-density/NS6Chart.html (accessed on 13 January 2025).
- Olarescu, C.M.; Campean, M.; Coşereanu, C. THERMAL CONDUCTIVITY OF SOLID WOOD PANELS MADE FROM HEAT-TREATED SPRUCE AND LIME WOOD STRIPS. 2015; 11. [Google Scholar]
- Mussa, H.M.; Salih, M. Építôanyag Építôanyag Journal of Silicate Based and Composite Materials. [CrossRef]
- Zhang, M.; Wang, D.; Li, T.; Jiang, J.; Bai, H.; Wang, S.; Wang, Y.; Dong, W. Multifunctional Flame-Retardant, Thermal Insulation, and Antimicrobial Wood-Based Composites. 2023. [Google Scholar] [CrossRef]
- Geraud, G.; Essoua, E.; Blanchet, P.; Landry, V.; Beauregard, R. Wood Treatment. BioResources 2016, 11, 3049–3072. [Google Scholar]
Figure 1.
Worldwide particle board market (Billions of USD) by raw materials from 2023 to 2033 (adapted from) [1].
Figure 1.
Worldwide particle board market (Billions of USD) by raw materials from 2023 to 2033 (adapted from) [1].
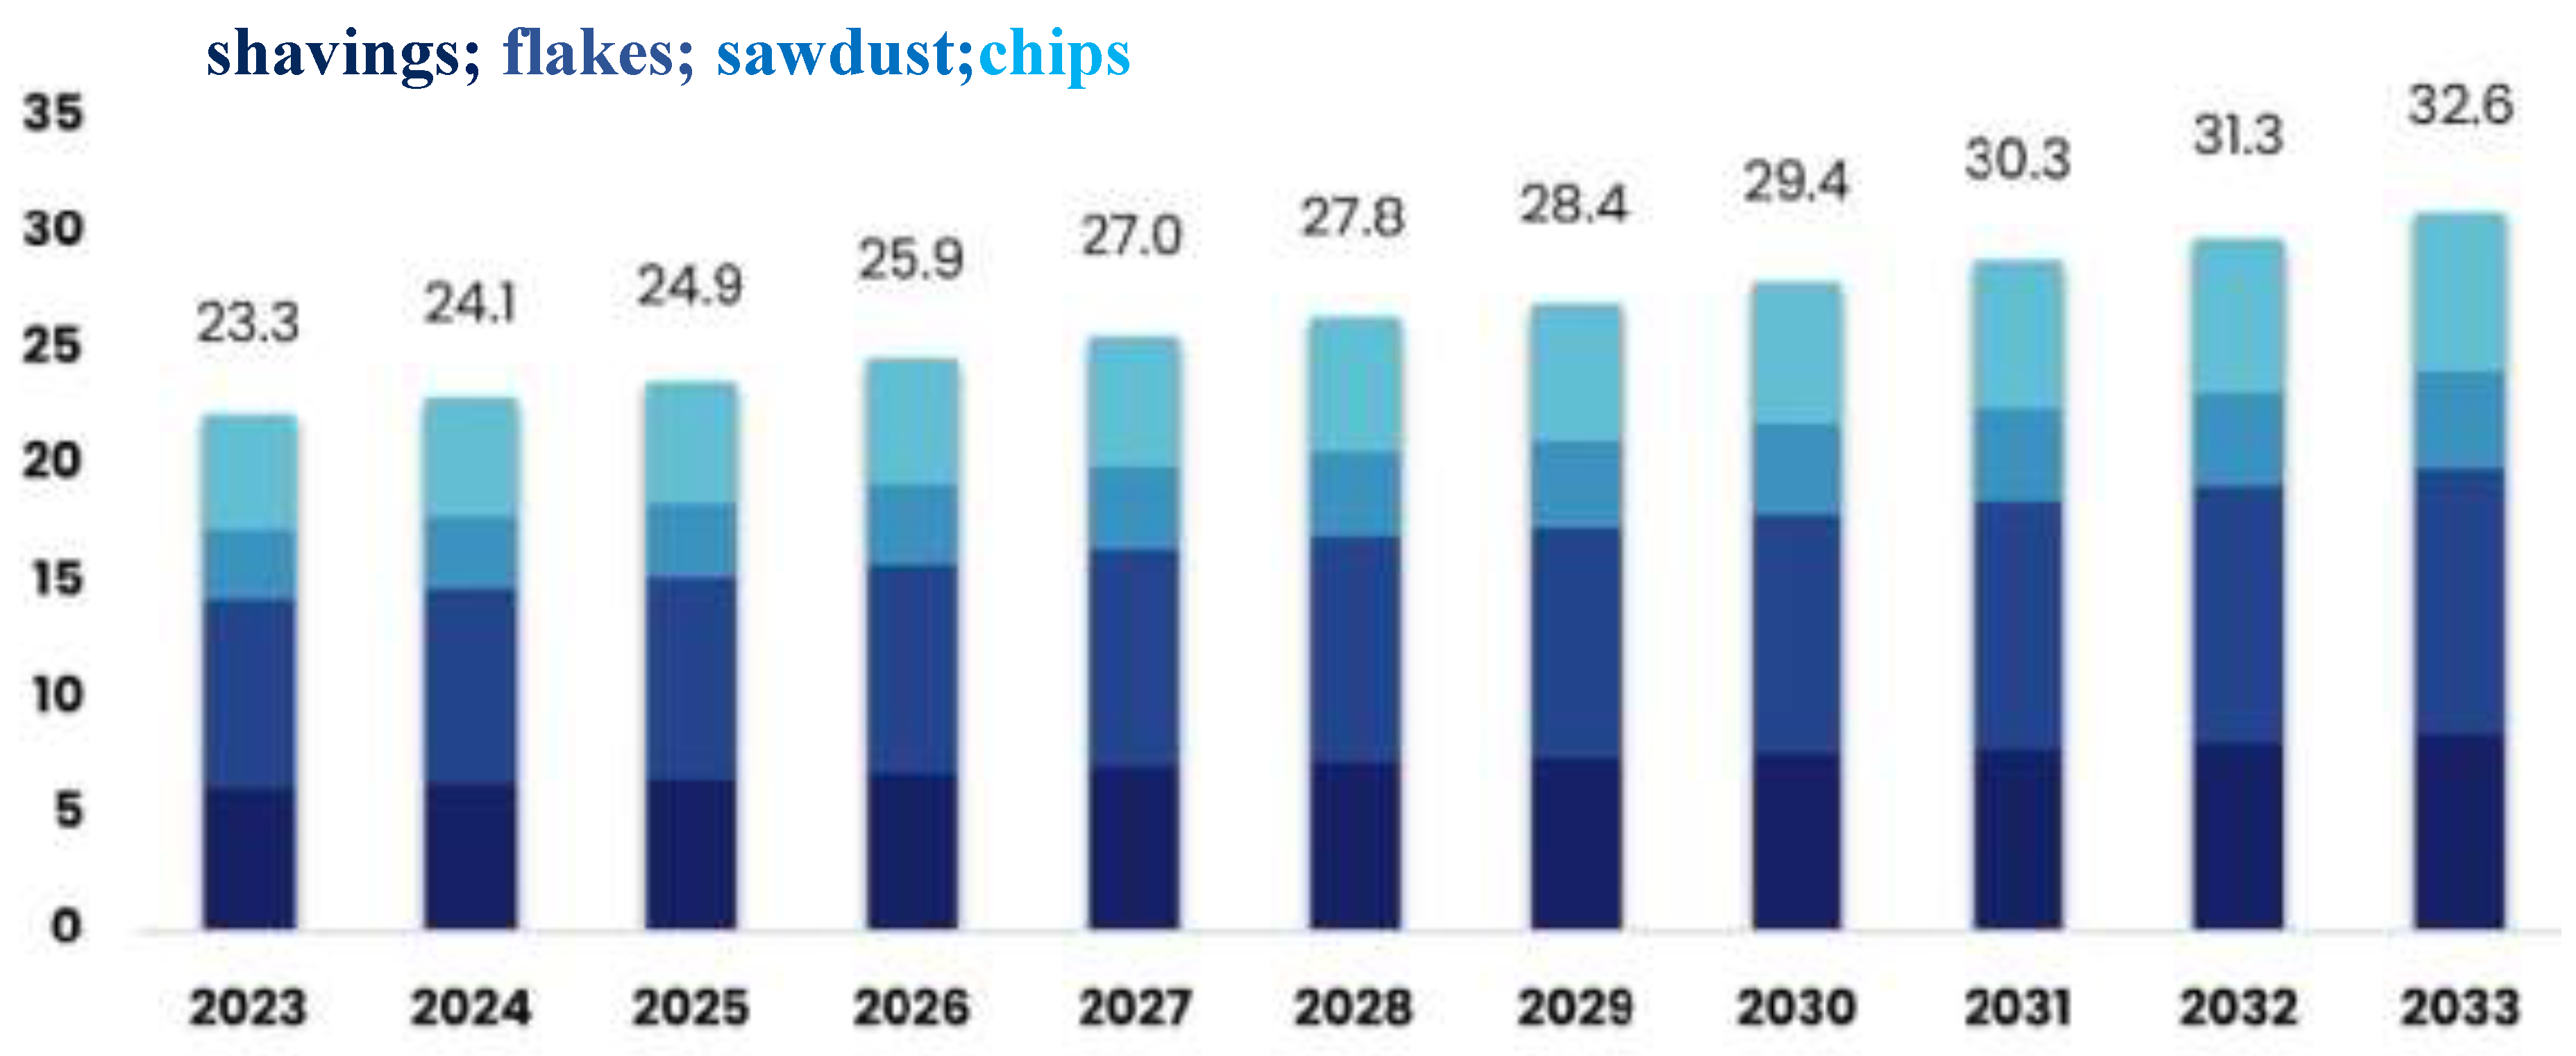
Figure 2.
Cellulose esterification by citric acid (adapted from [5]).
Figure 2.
Cellulose esterification by citric acid (adapted from [5]).
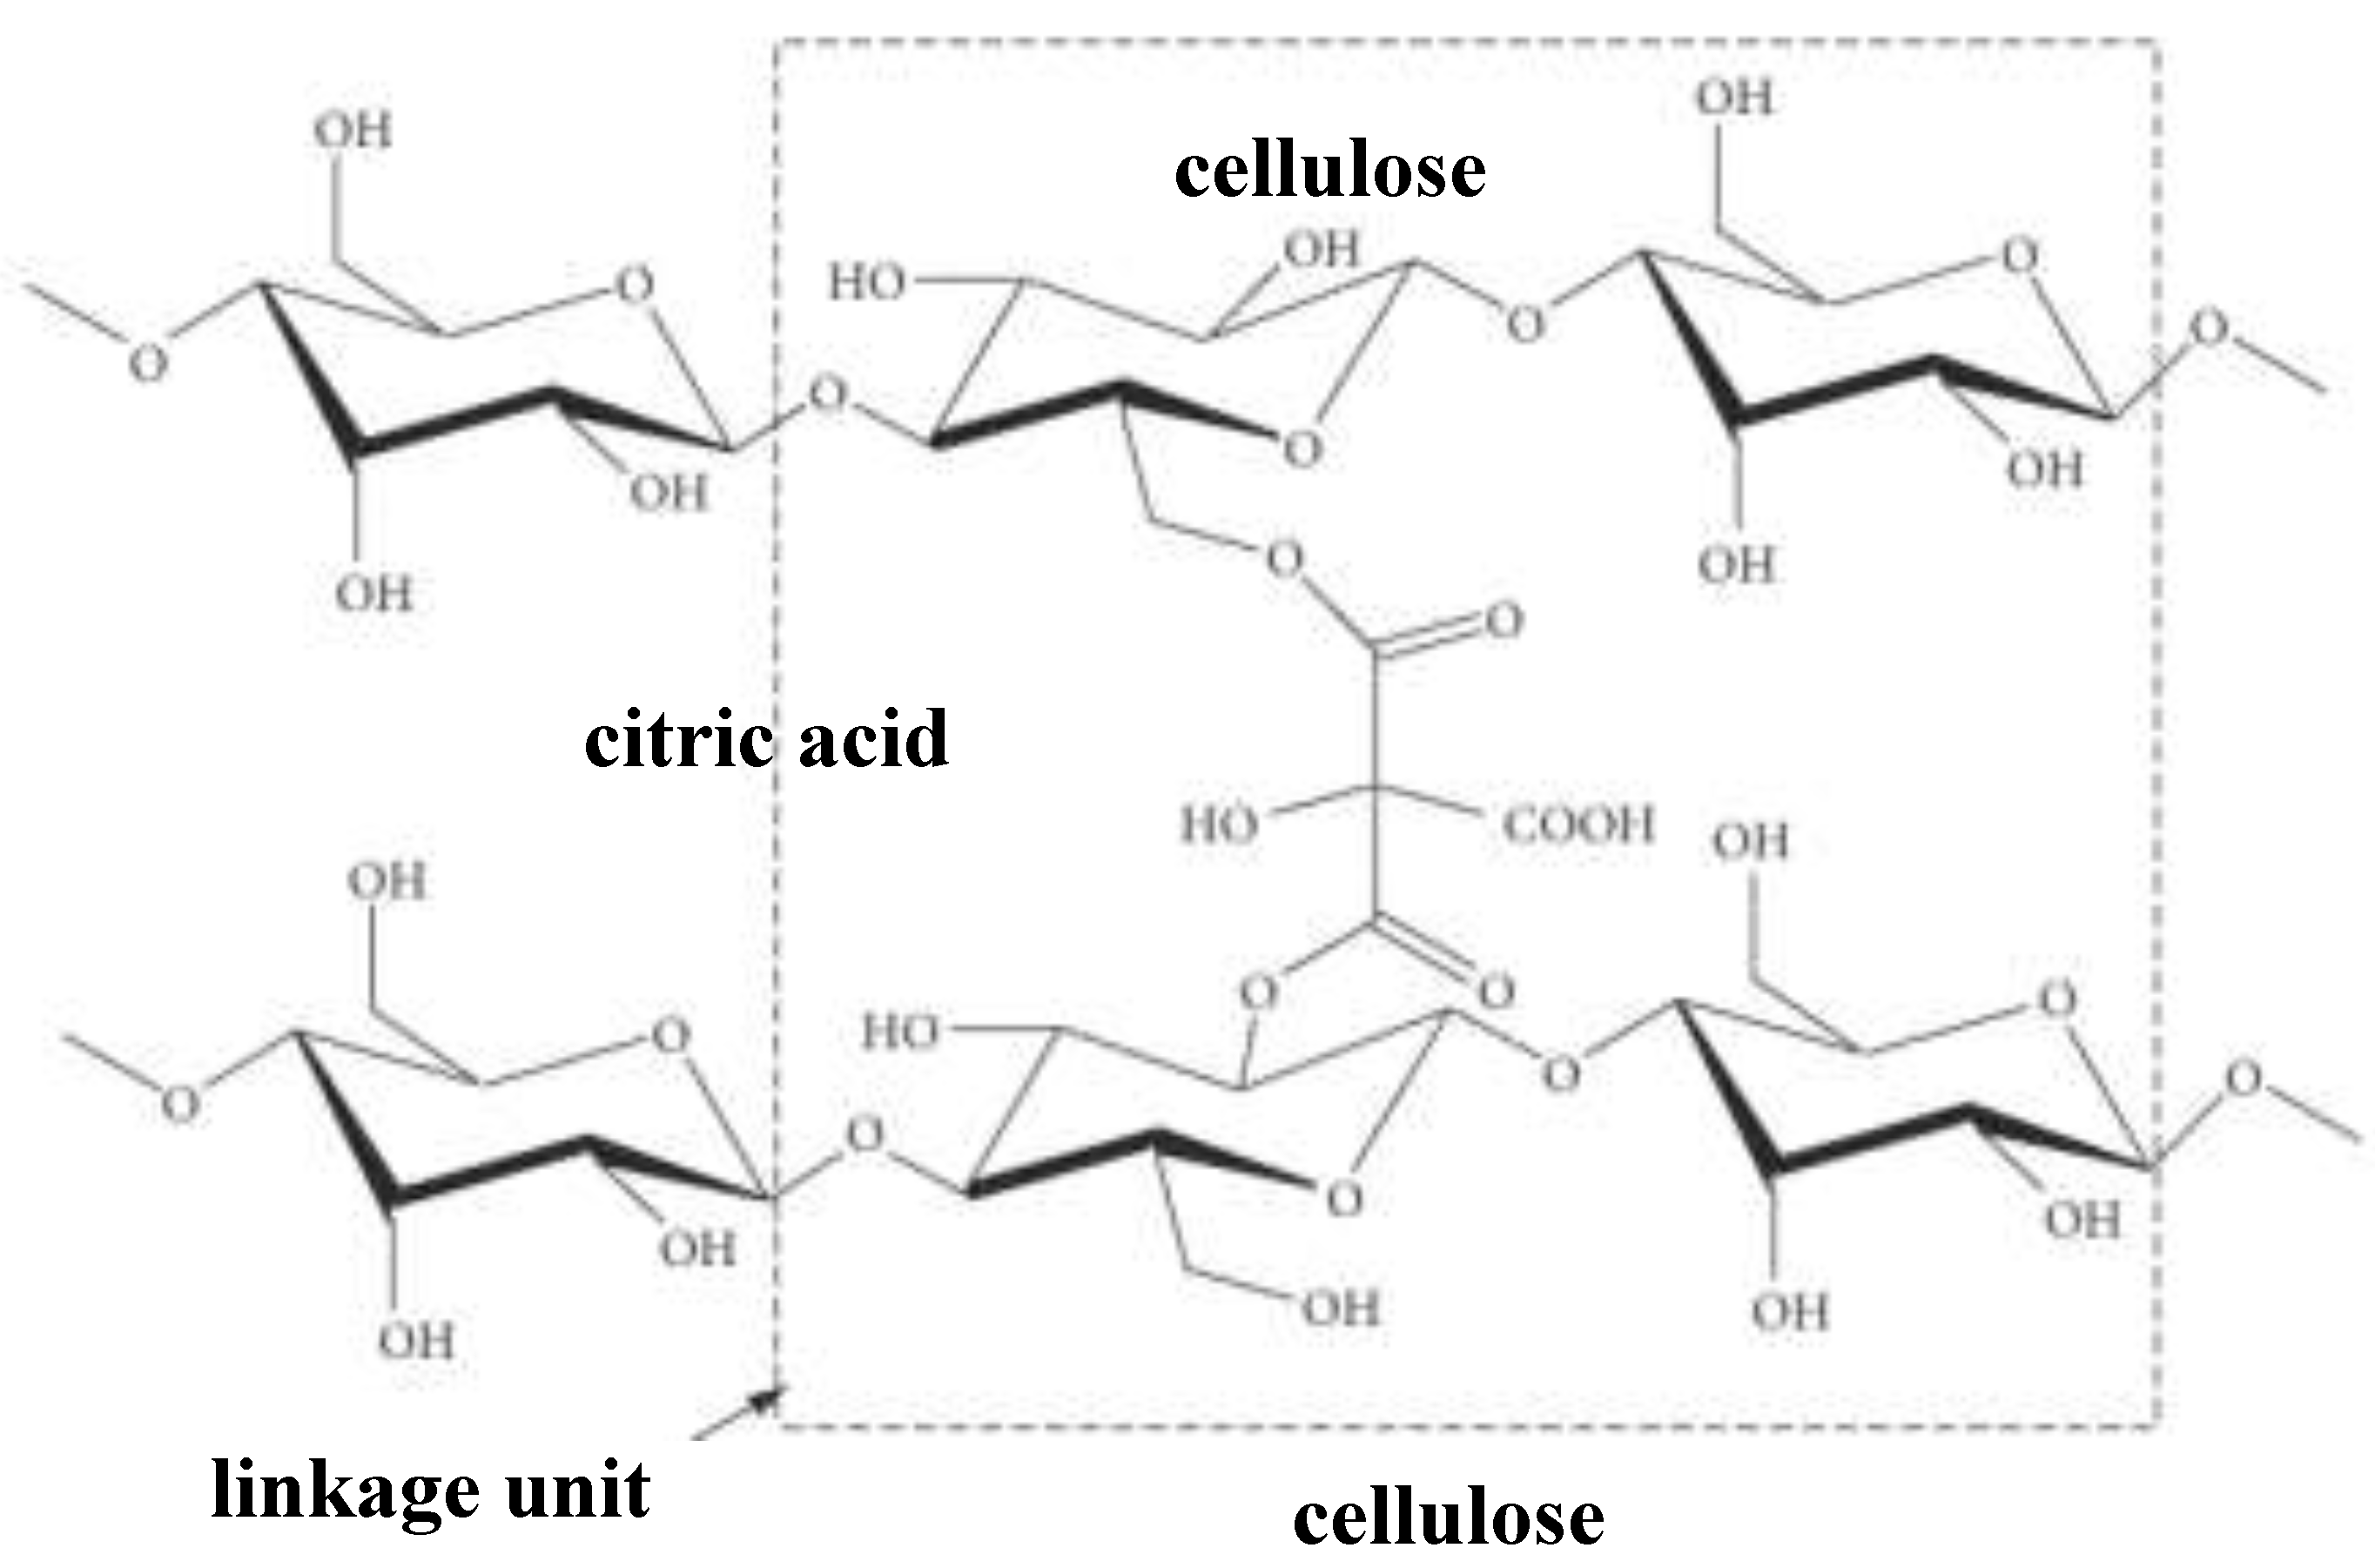
Figure 3.
– Different citric acid binding agents and composite wood products (adapted from [7]).
Figure 3.
– Different citric acid binding agents and composite wood products (adapted from [7]).
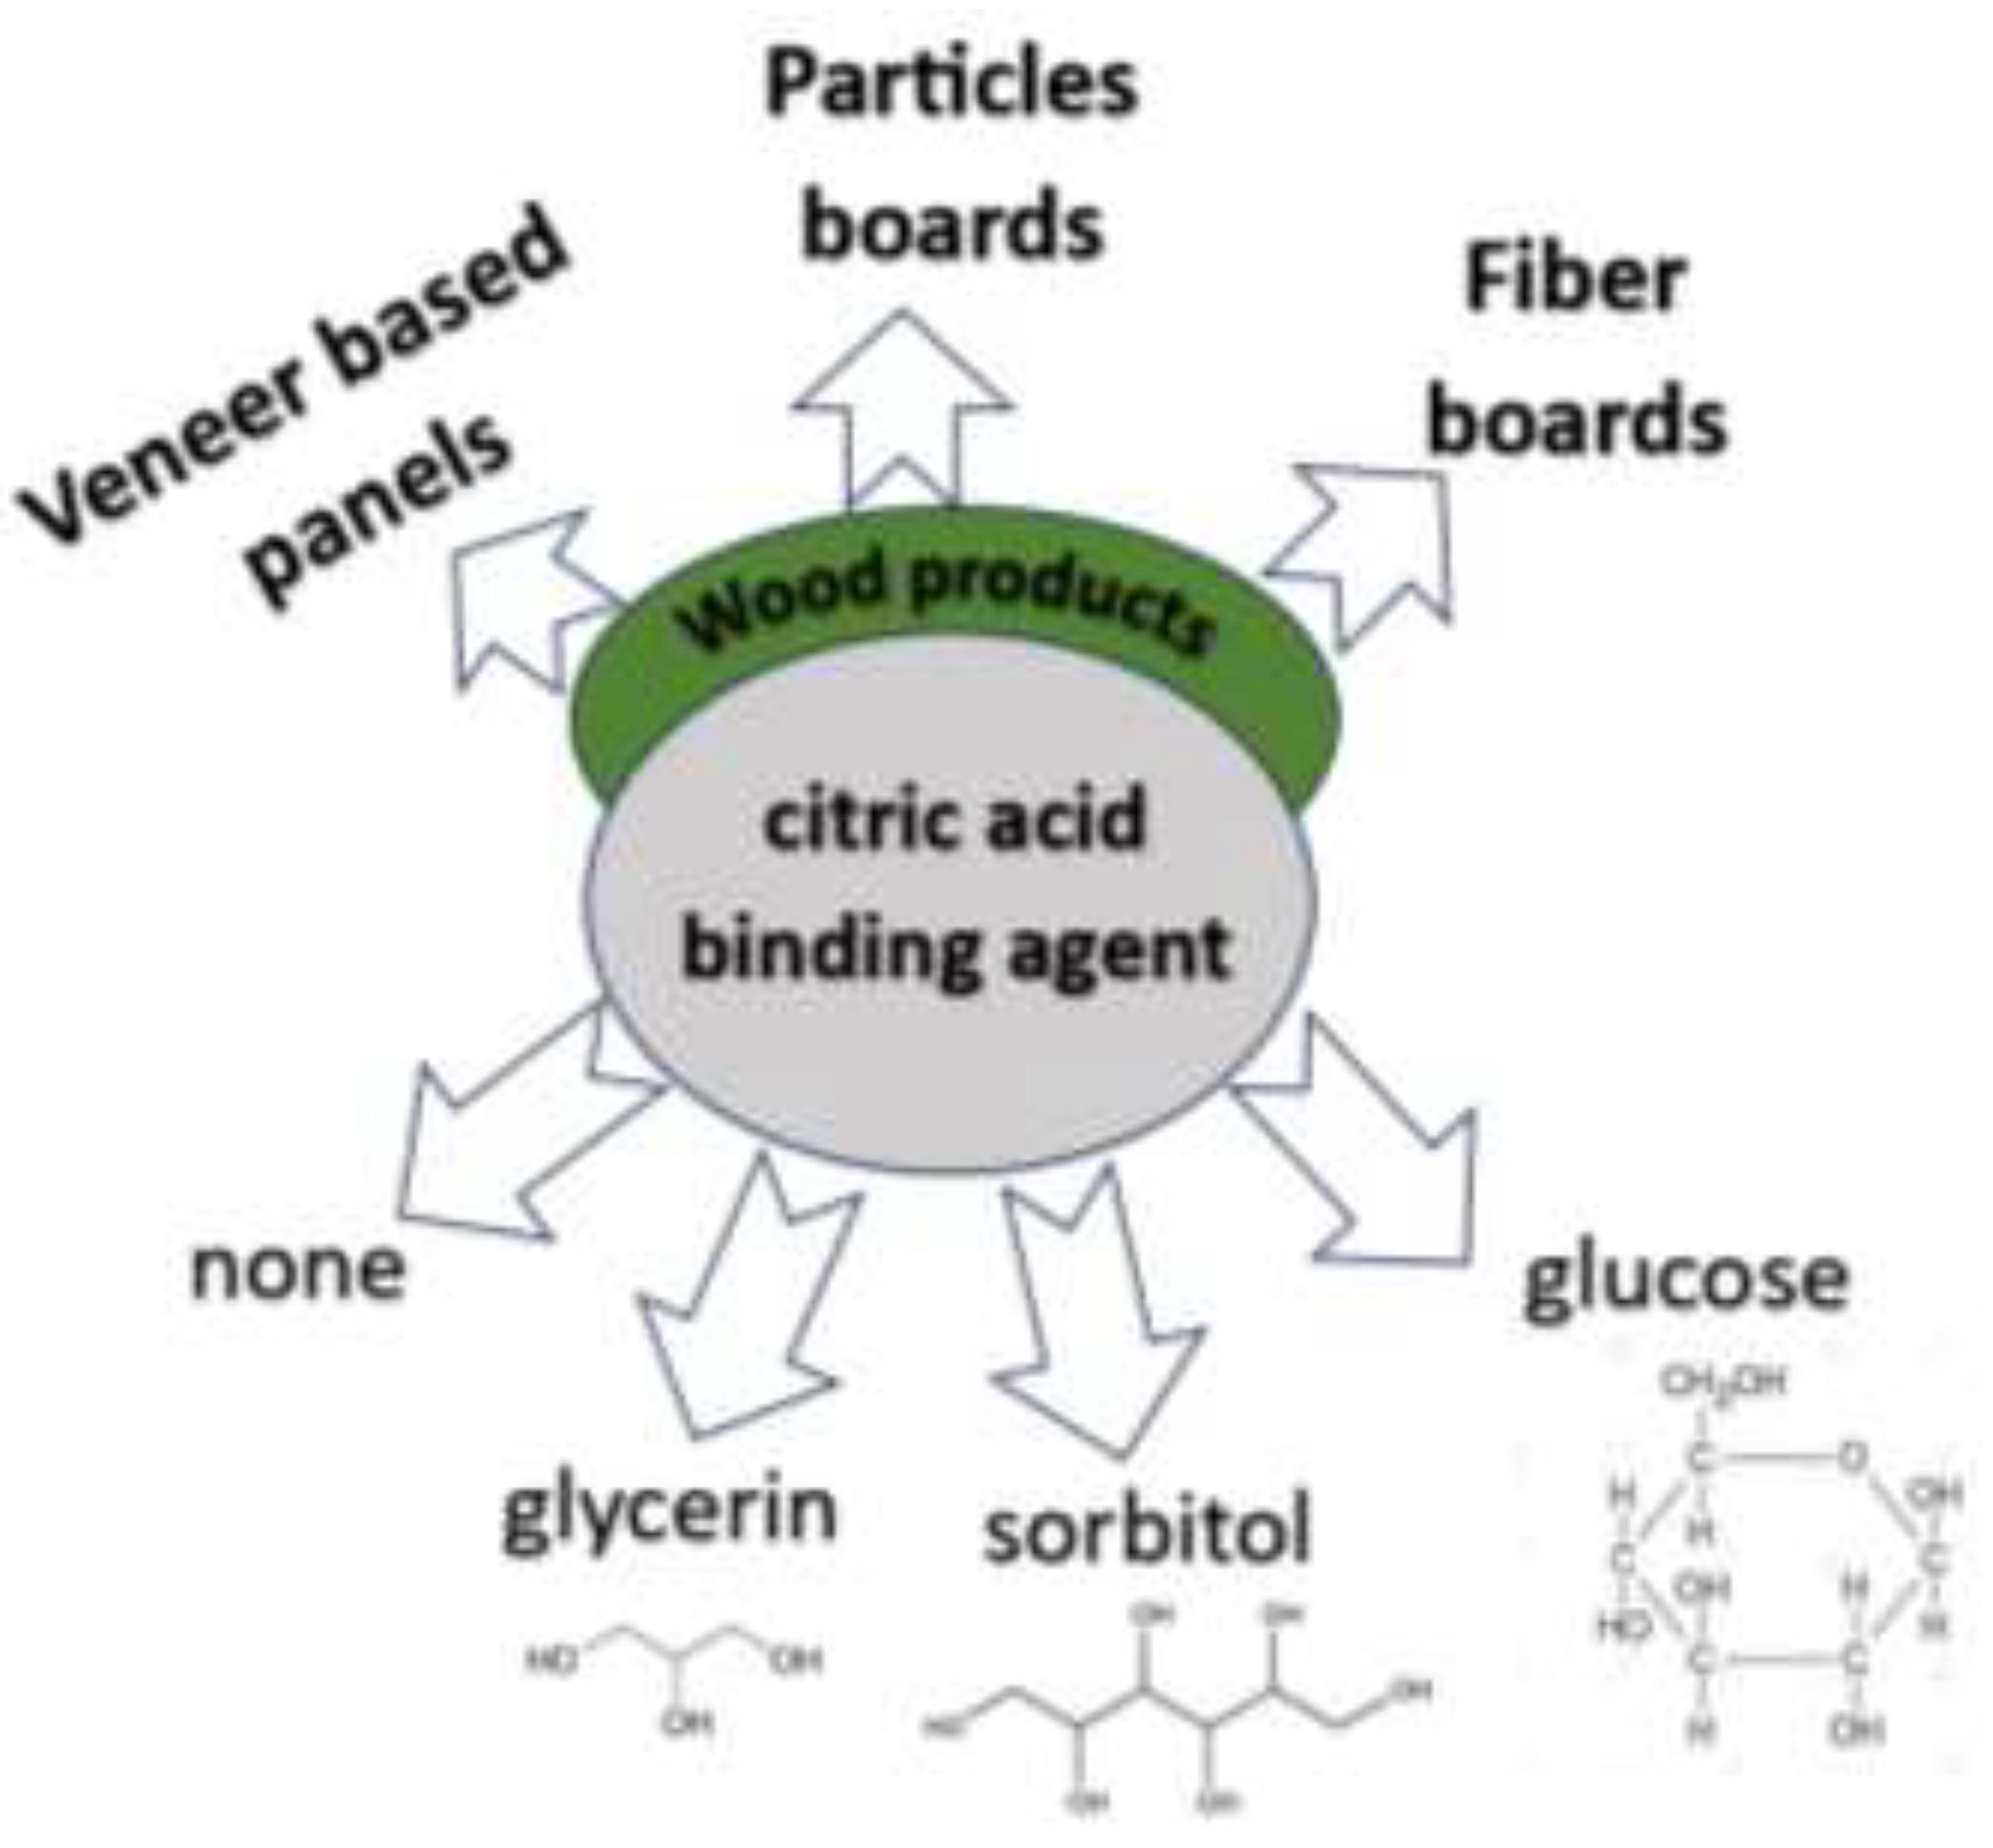
Figure 4.
Polymerization reaction between glycerin and citric acid, followed by the binding of poly(glycerin-citrate) (PGC) to natural polymers (P) containing hydroxyl groups (adapted from[8]).
Figure 4.
Polymerization reaction between glycerin and citric acid, followed by the binding of poly(glycerin-citrate) (PGC) to natural polymers (P) containing hydroxyl groups (adapted from[8]).
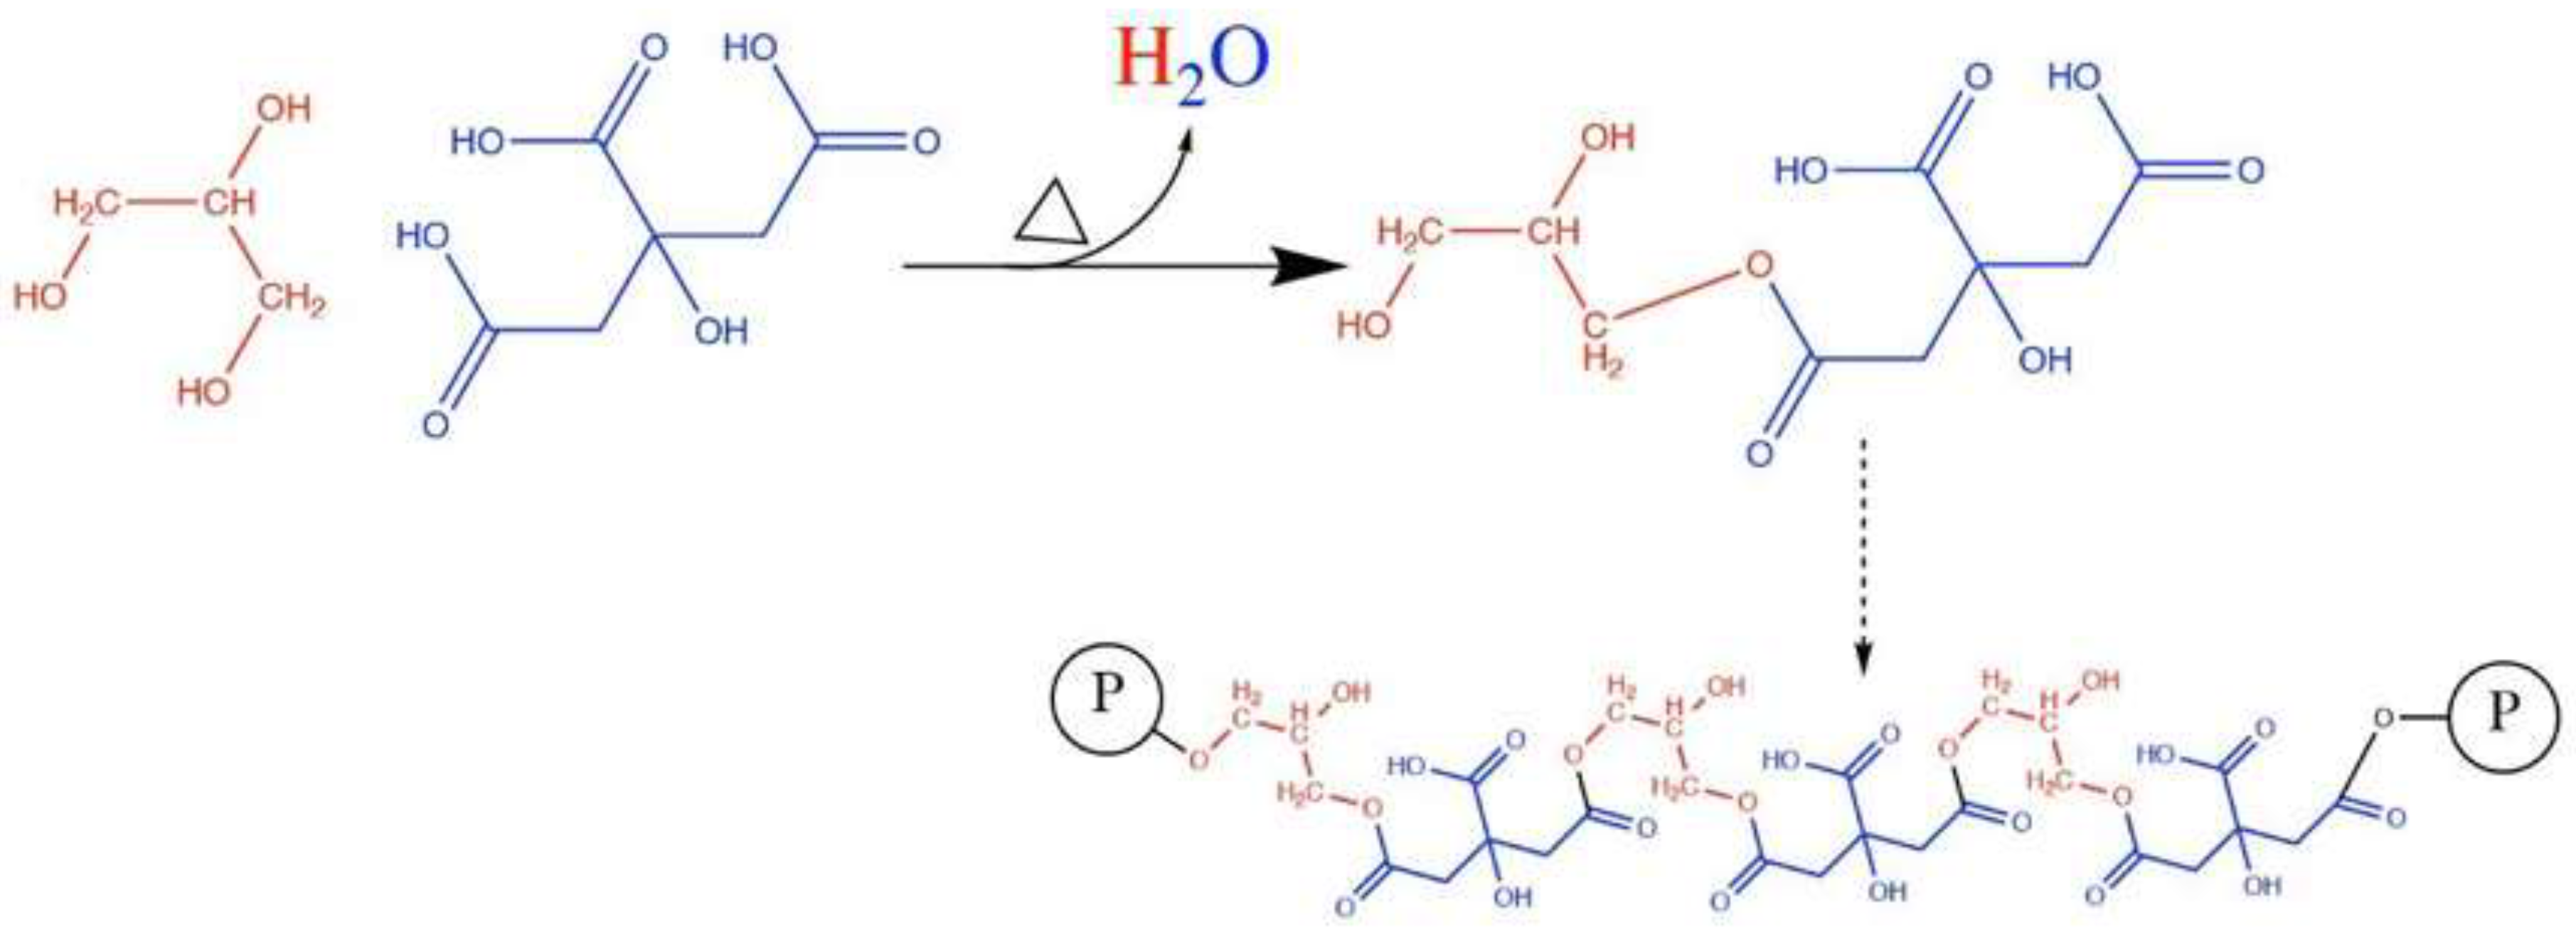
Figure 5.
Composite cured at 170 °C for 8 hours, demolded and cut on a band saw.
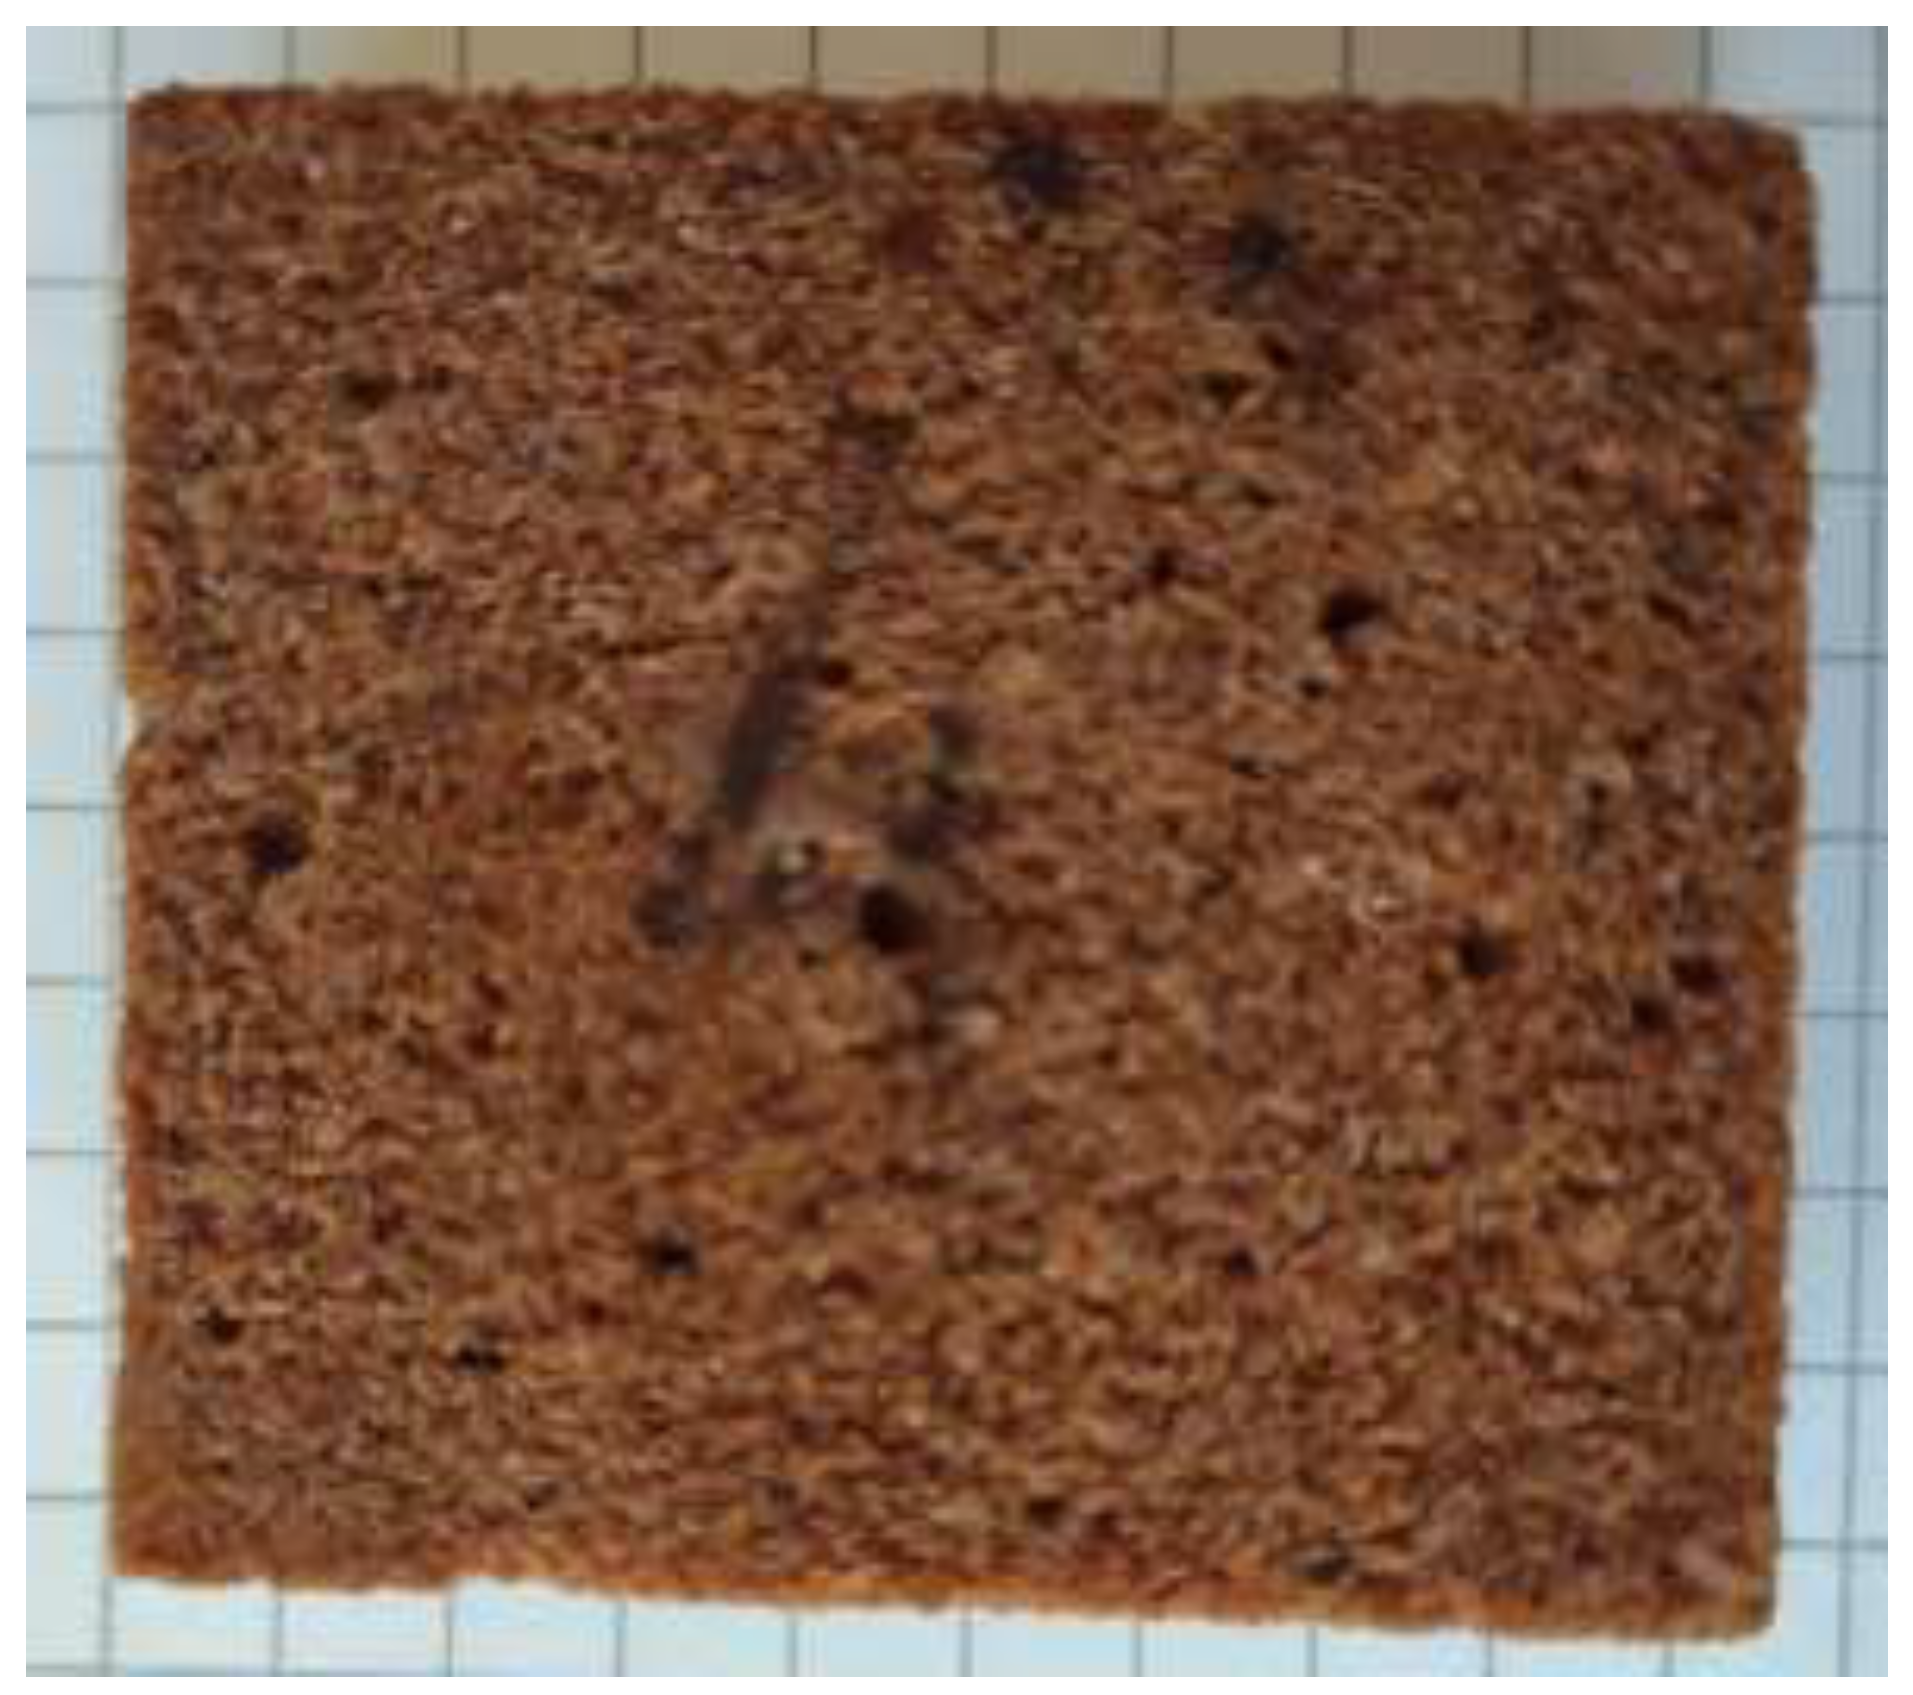
Figure 6.
Microscope image (scale 0.5 mm) and processed image using DinoCapture software. Red areas correspond to porous (composite with the optimal composition: Glyc/SD=1; CA/Glyc=2; water/SD=2.5).
Figure 6.
Microscope image (scale 0.5 mm) and processed image using DinoCapture software. Red areas correspond to porous (composite with the optimal composition: Glyc/SD=1; CA/Glyc=2; water/SD=2.5).
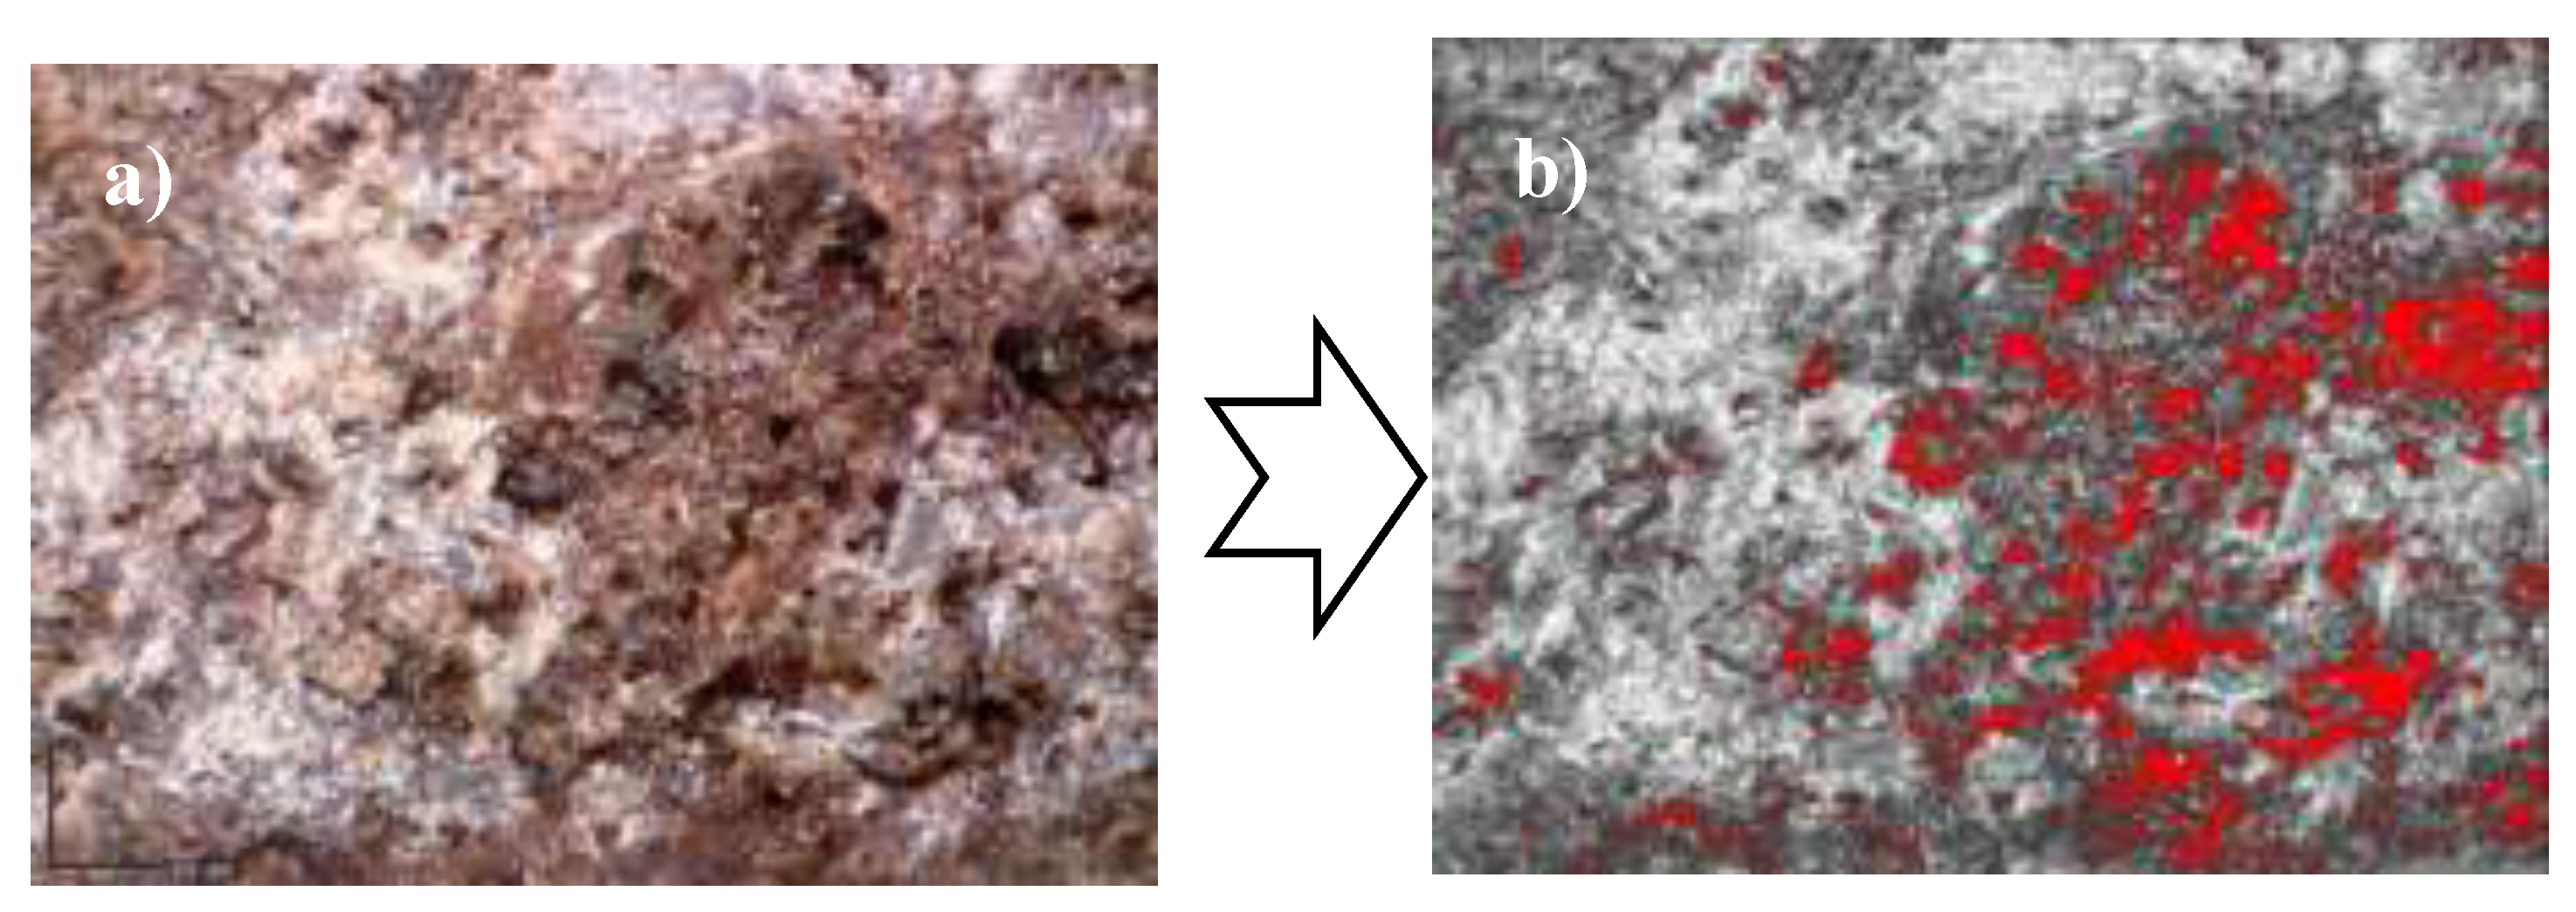
Figure 7.
Surface voids (red areas) of three different specimens of the composite in Figure 6 using five different areas, from (a) to (e), for each specimen.(Glyc/water ratios: 1:1 (specimen 1), 1:2 (specimen 2), and 1:2.5 (specimen 1).).
Figure 7.
Surface voids (red areas) of three different specimens of the composite in Figure 6 using five different areas, from (a) to (e), for each specimen.(Glyc/water ratios: 1:1 (specimen 1), 1:2 (specimen 2), and 1:2.5 (specimen 1).).
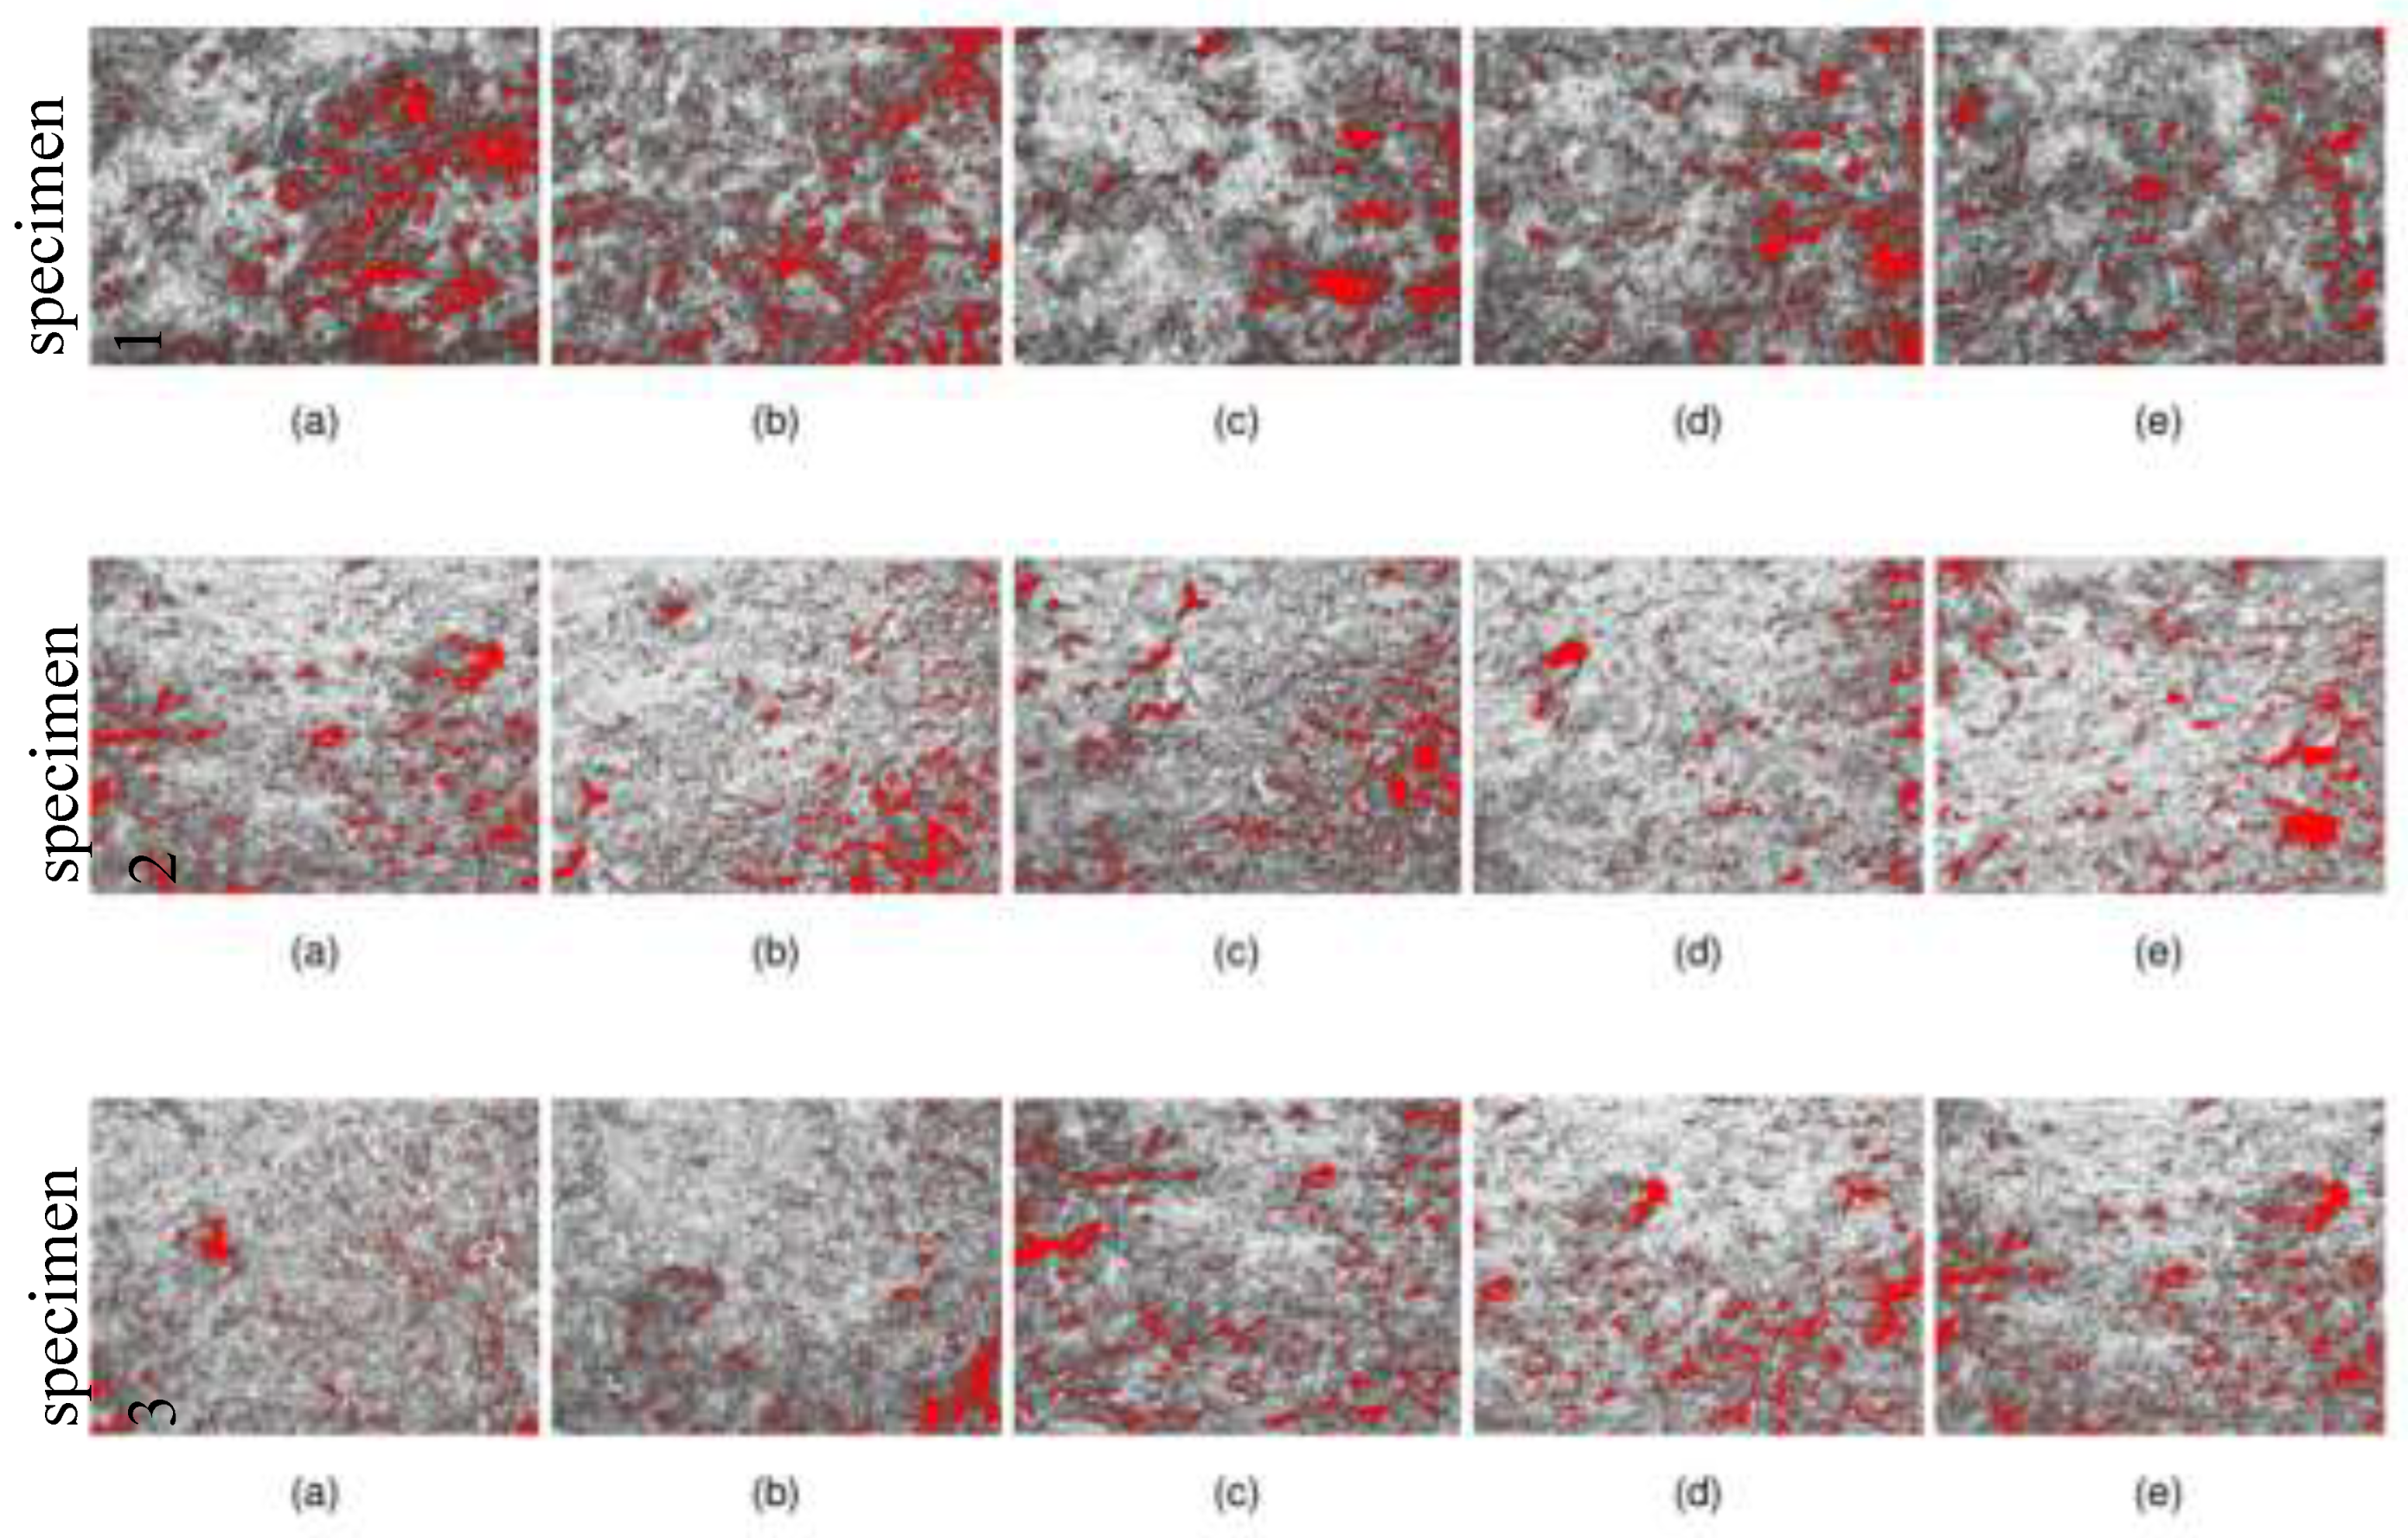
Figure 8.
ATR-FTIR spectra of raw materials.
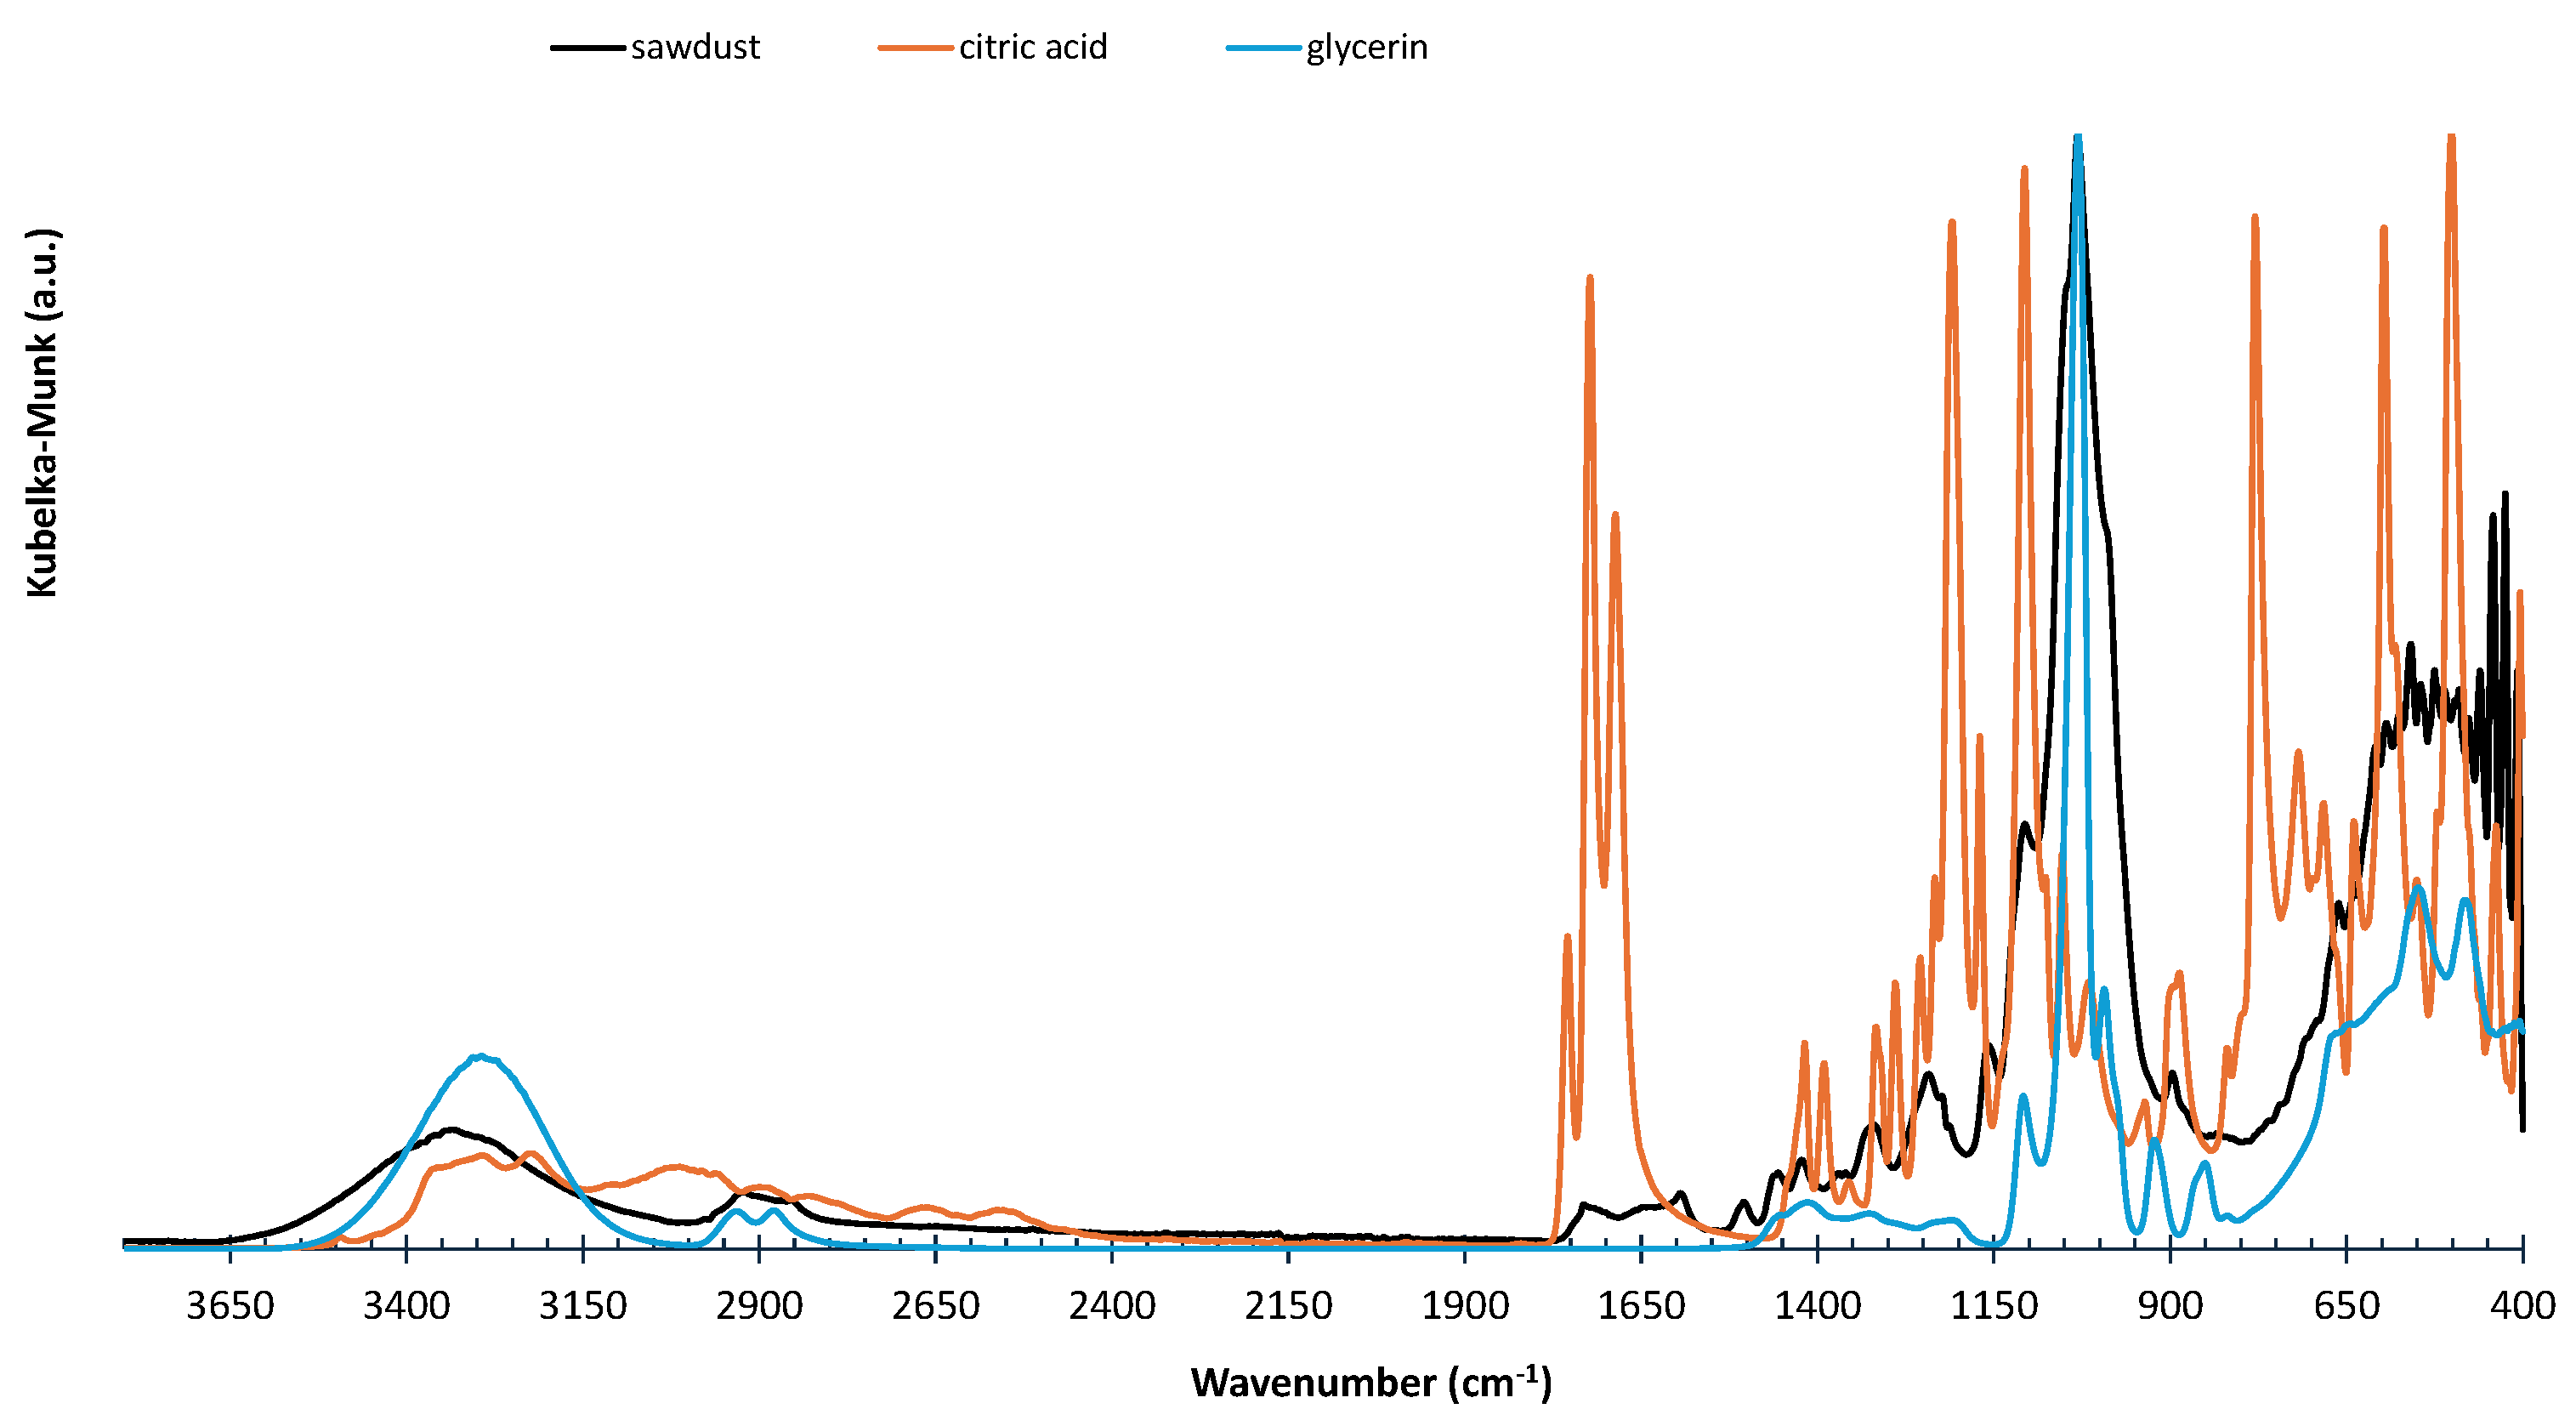
Figure 9.
– FTIR spectra of composites prepared with different Glyc/CA weight ratio (CA/SD=2, weight ratio).
Figure 9.
– FTIR spectra of composites prepared with different Glyc/CA weight ratio (CA/SD=2, weight ratio).
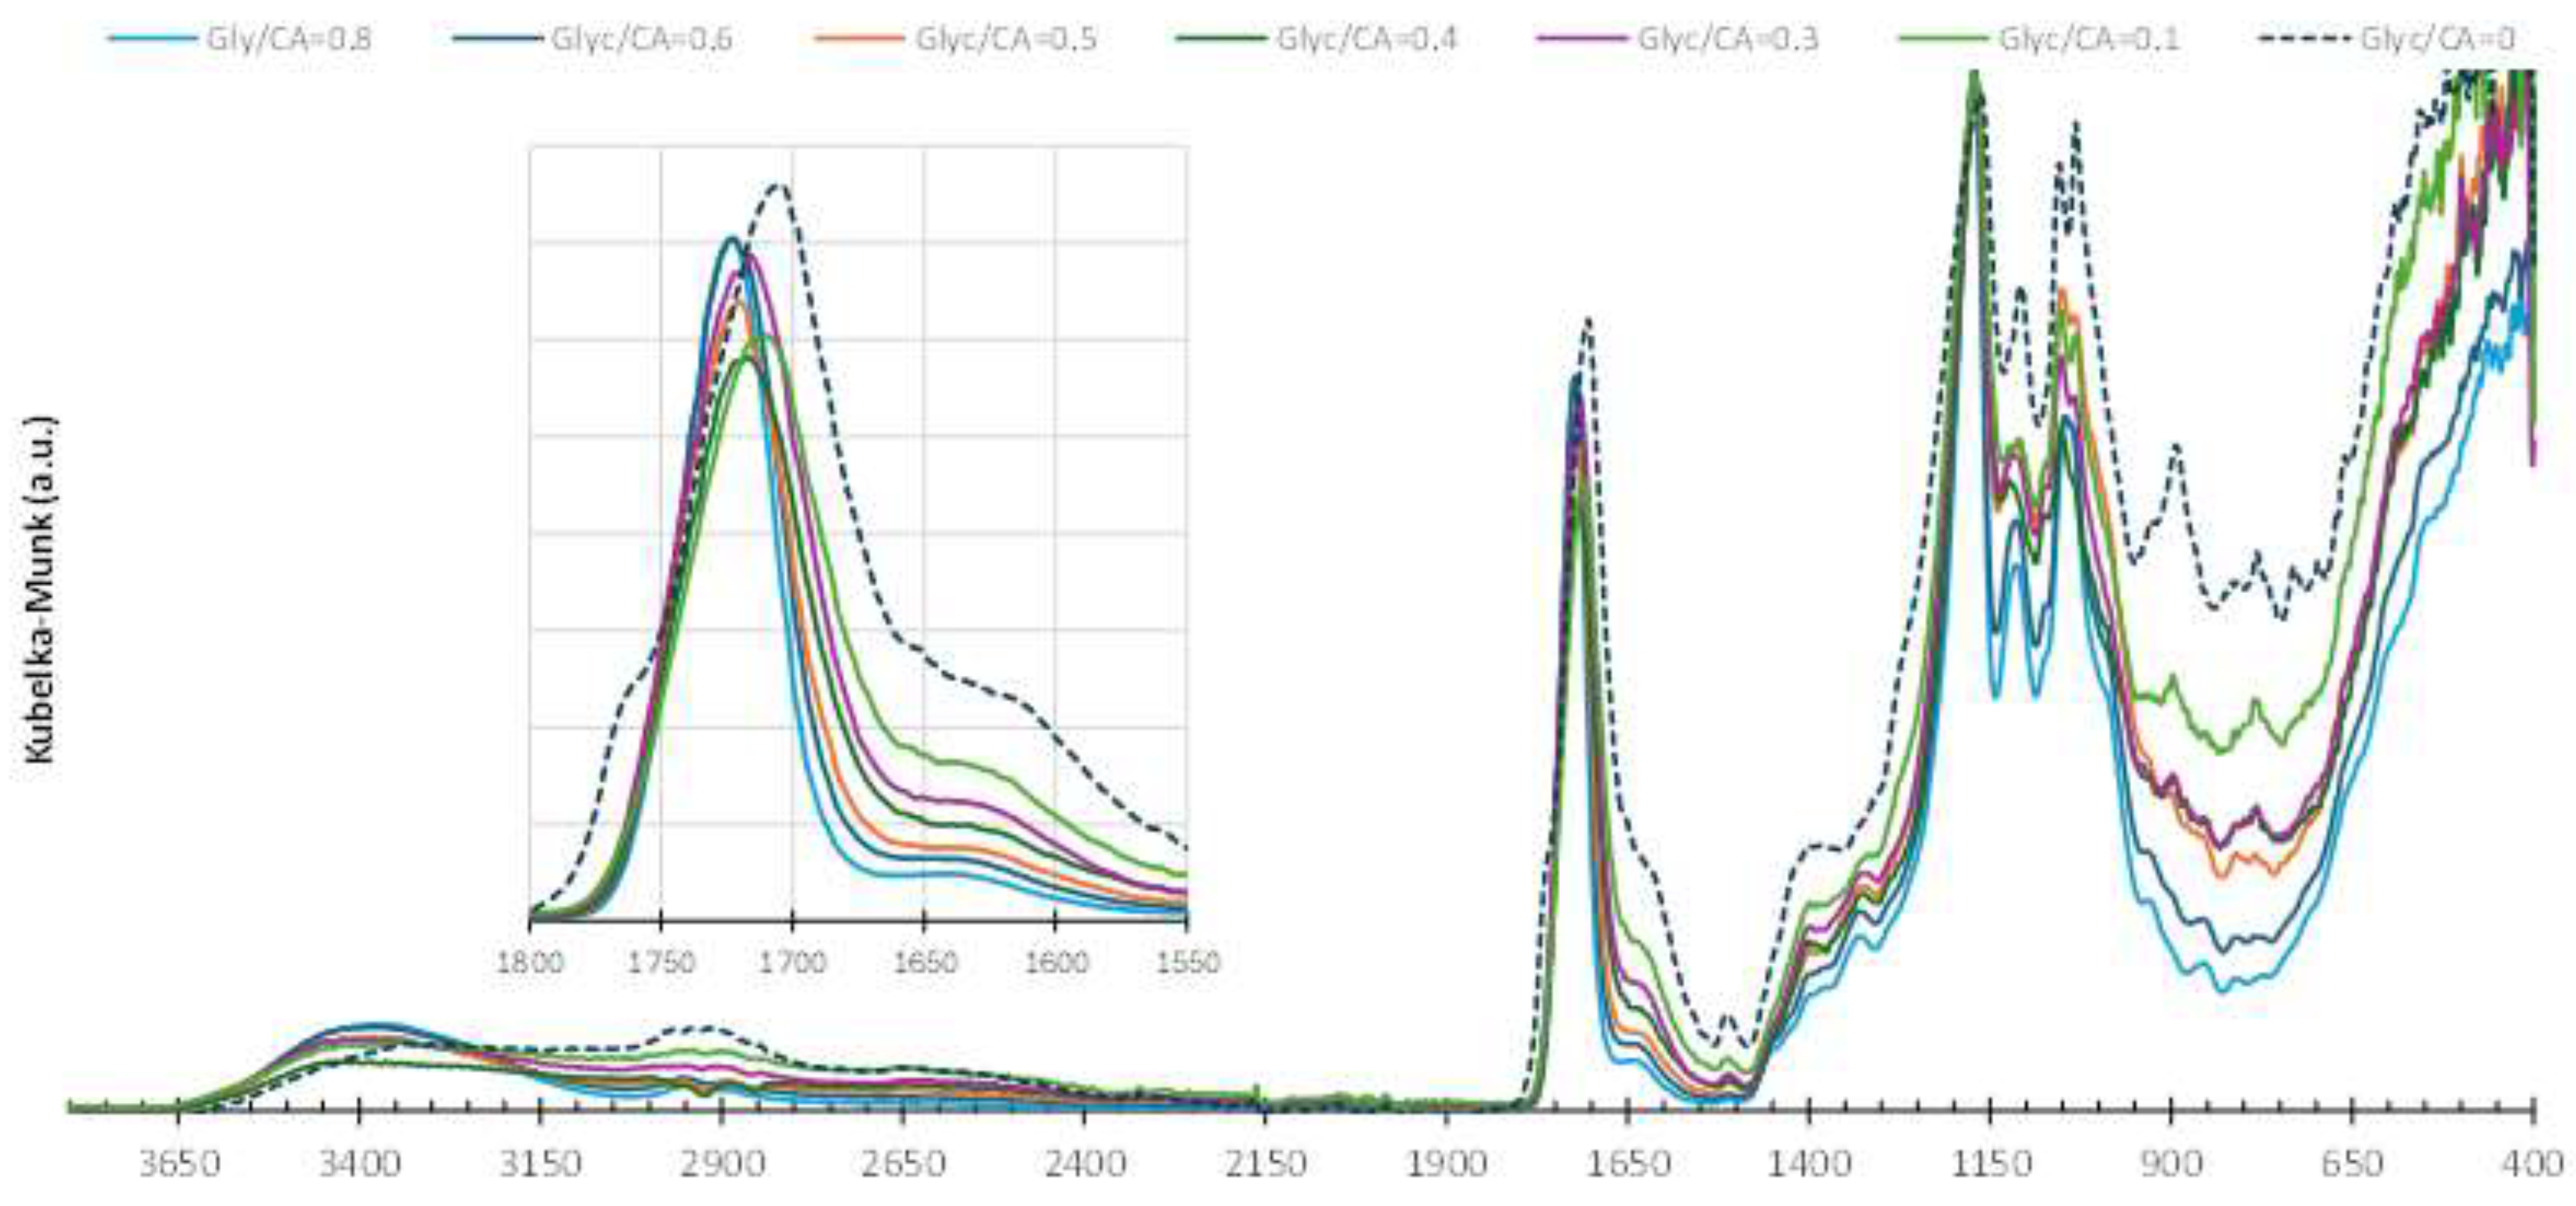
Figure 10.
– Thermograms (DTG curves), under airflow and 25 °C/min, of PGC (Cit=2Glyc) and PGC/sawdust composites with different Glyc contents. Sawdust was used as reference.
Figure 10.
– Thermograms (DTG curves), under airflow and 25 °C/min, of PGC (Cit=2Glyc) and PGC/sawdust composites with different Glyc contents. Sawdust was used as reference.
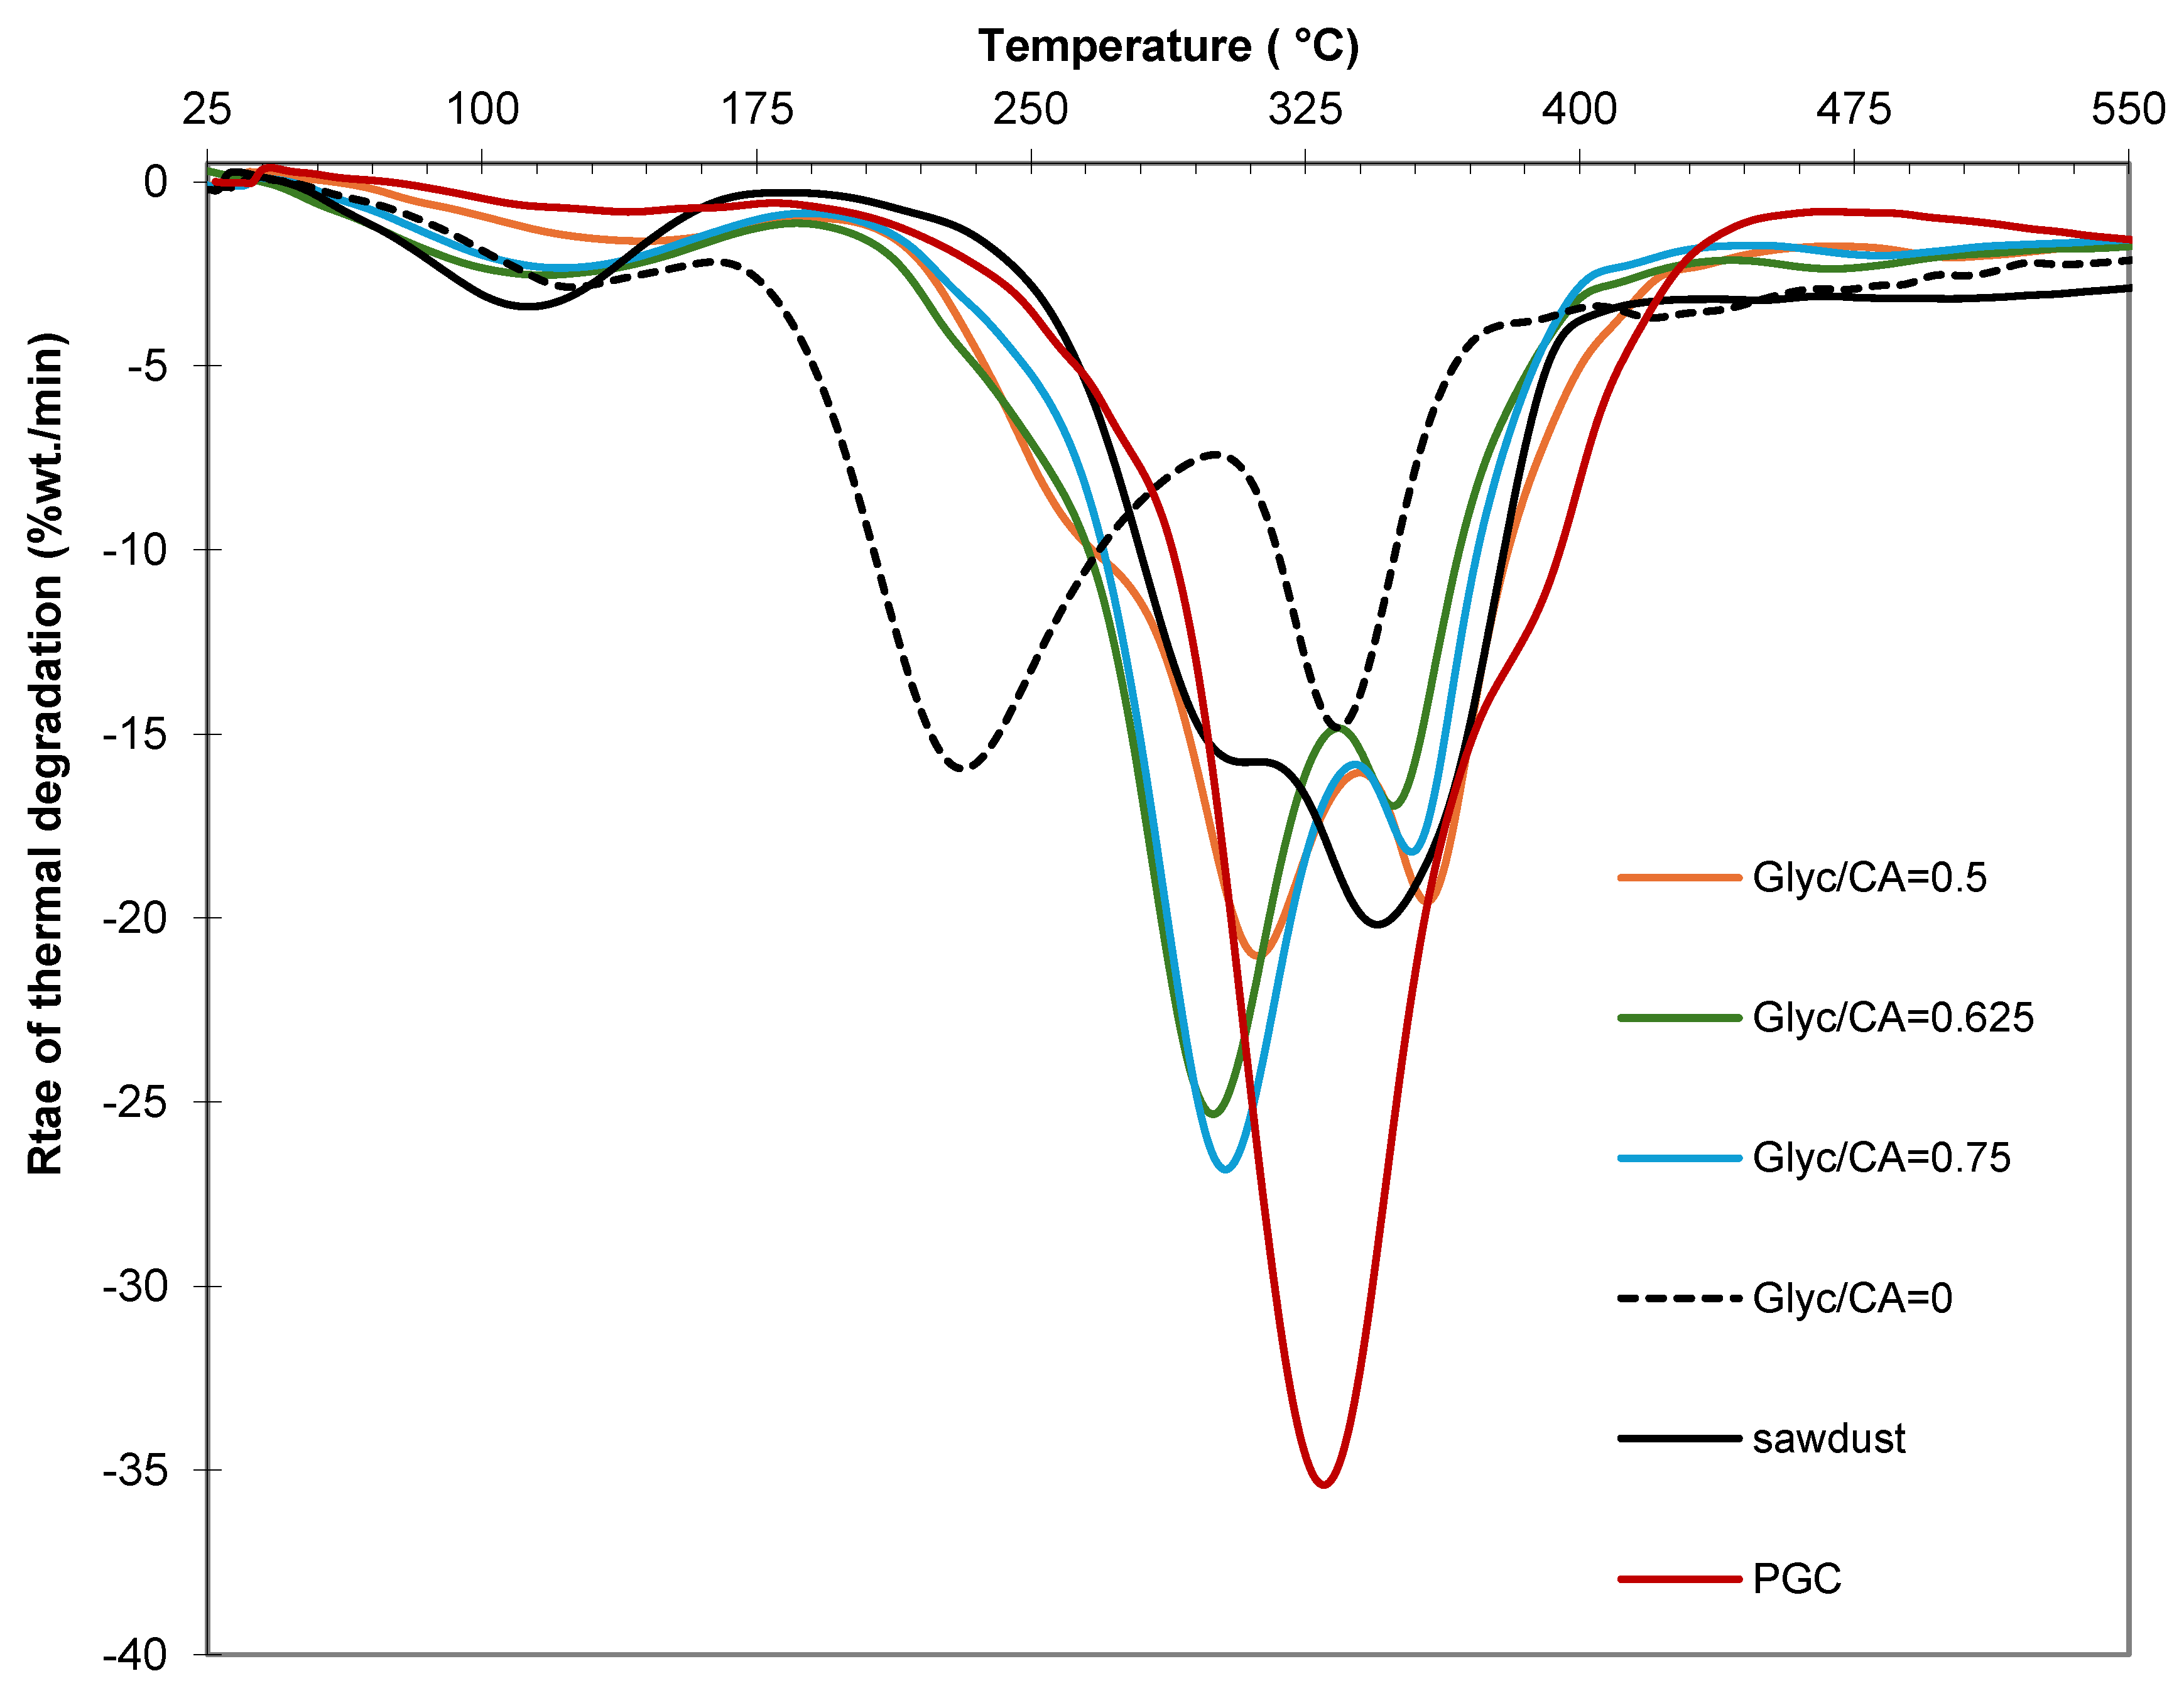
Figure 11.
– Density and maximum strength of the prepared composites versus Glyc/CA weight ratio (CA/SD=2, weight ratio).
Figure 11.
– Density and maximum strength of the prepared composites versus Glyc/CA weight ratio (CA/SD=2, weight ratio).
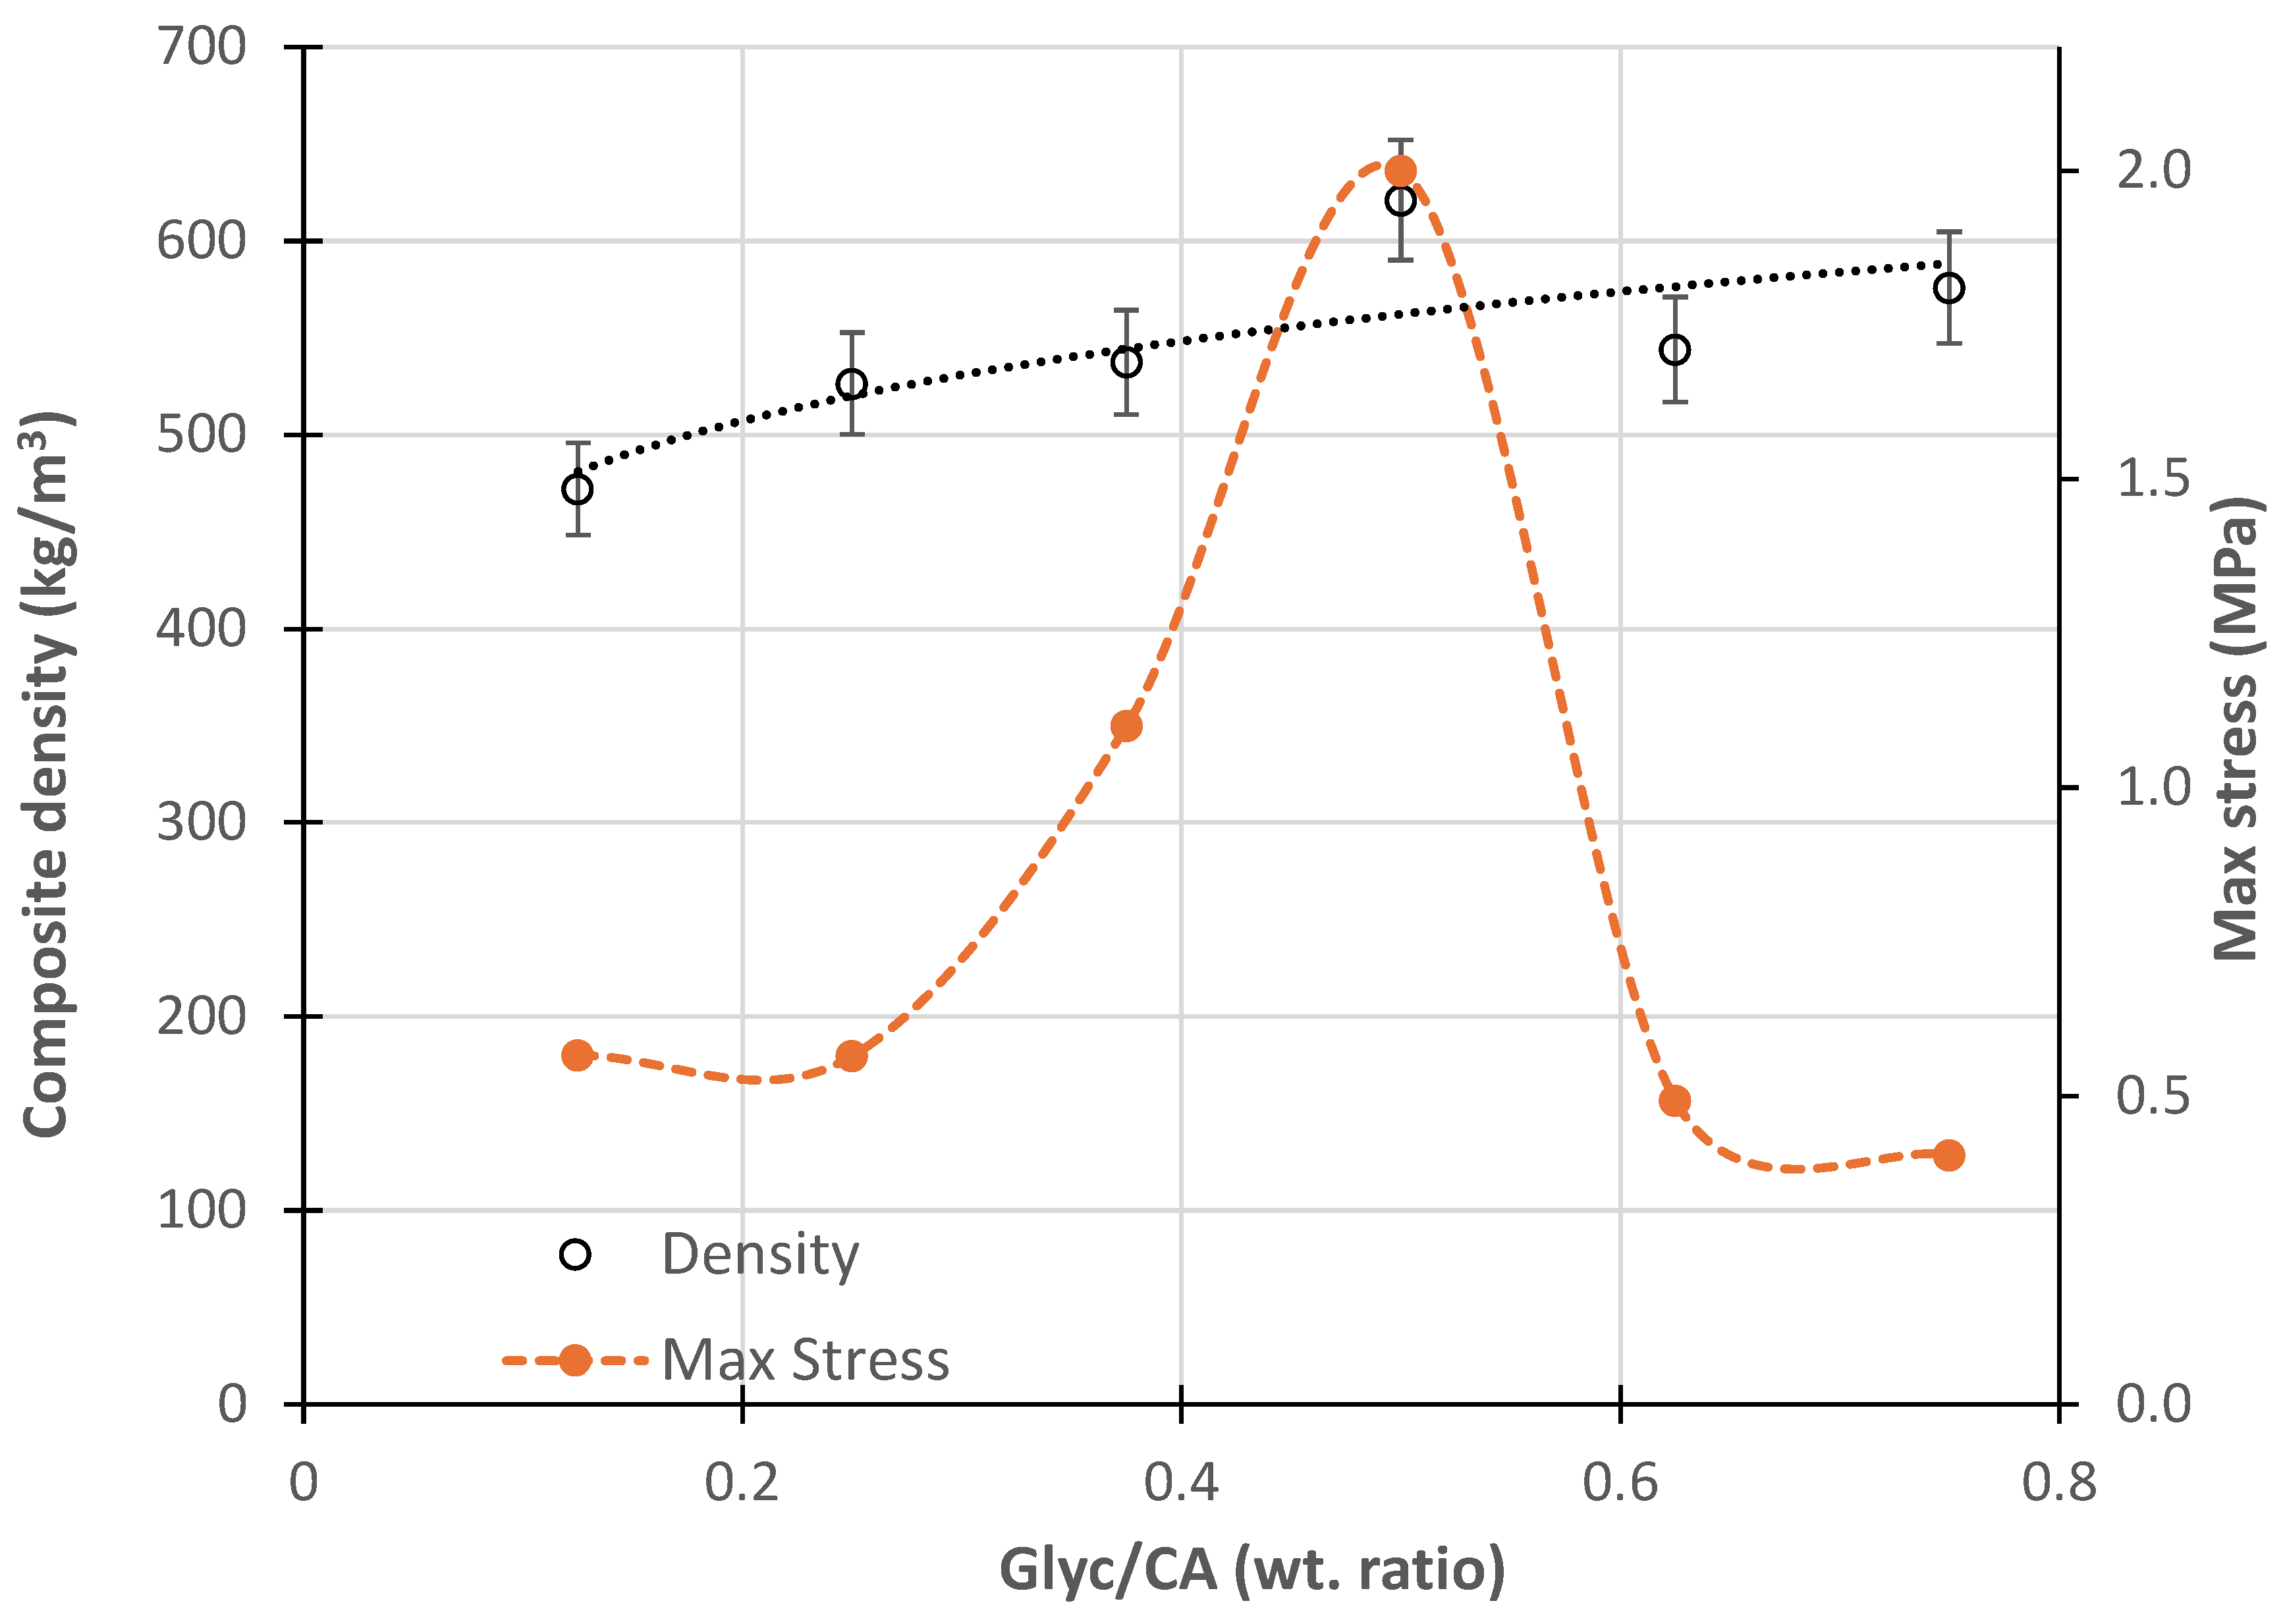
Figure 12.
– Young modulus of composites with different glycerin contents computed from the linear region of tensile tests.
Figure 12.
– Young modulus of composites with different glycerin contents computed from the linear region of tensile tests.
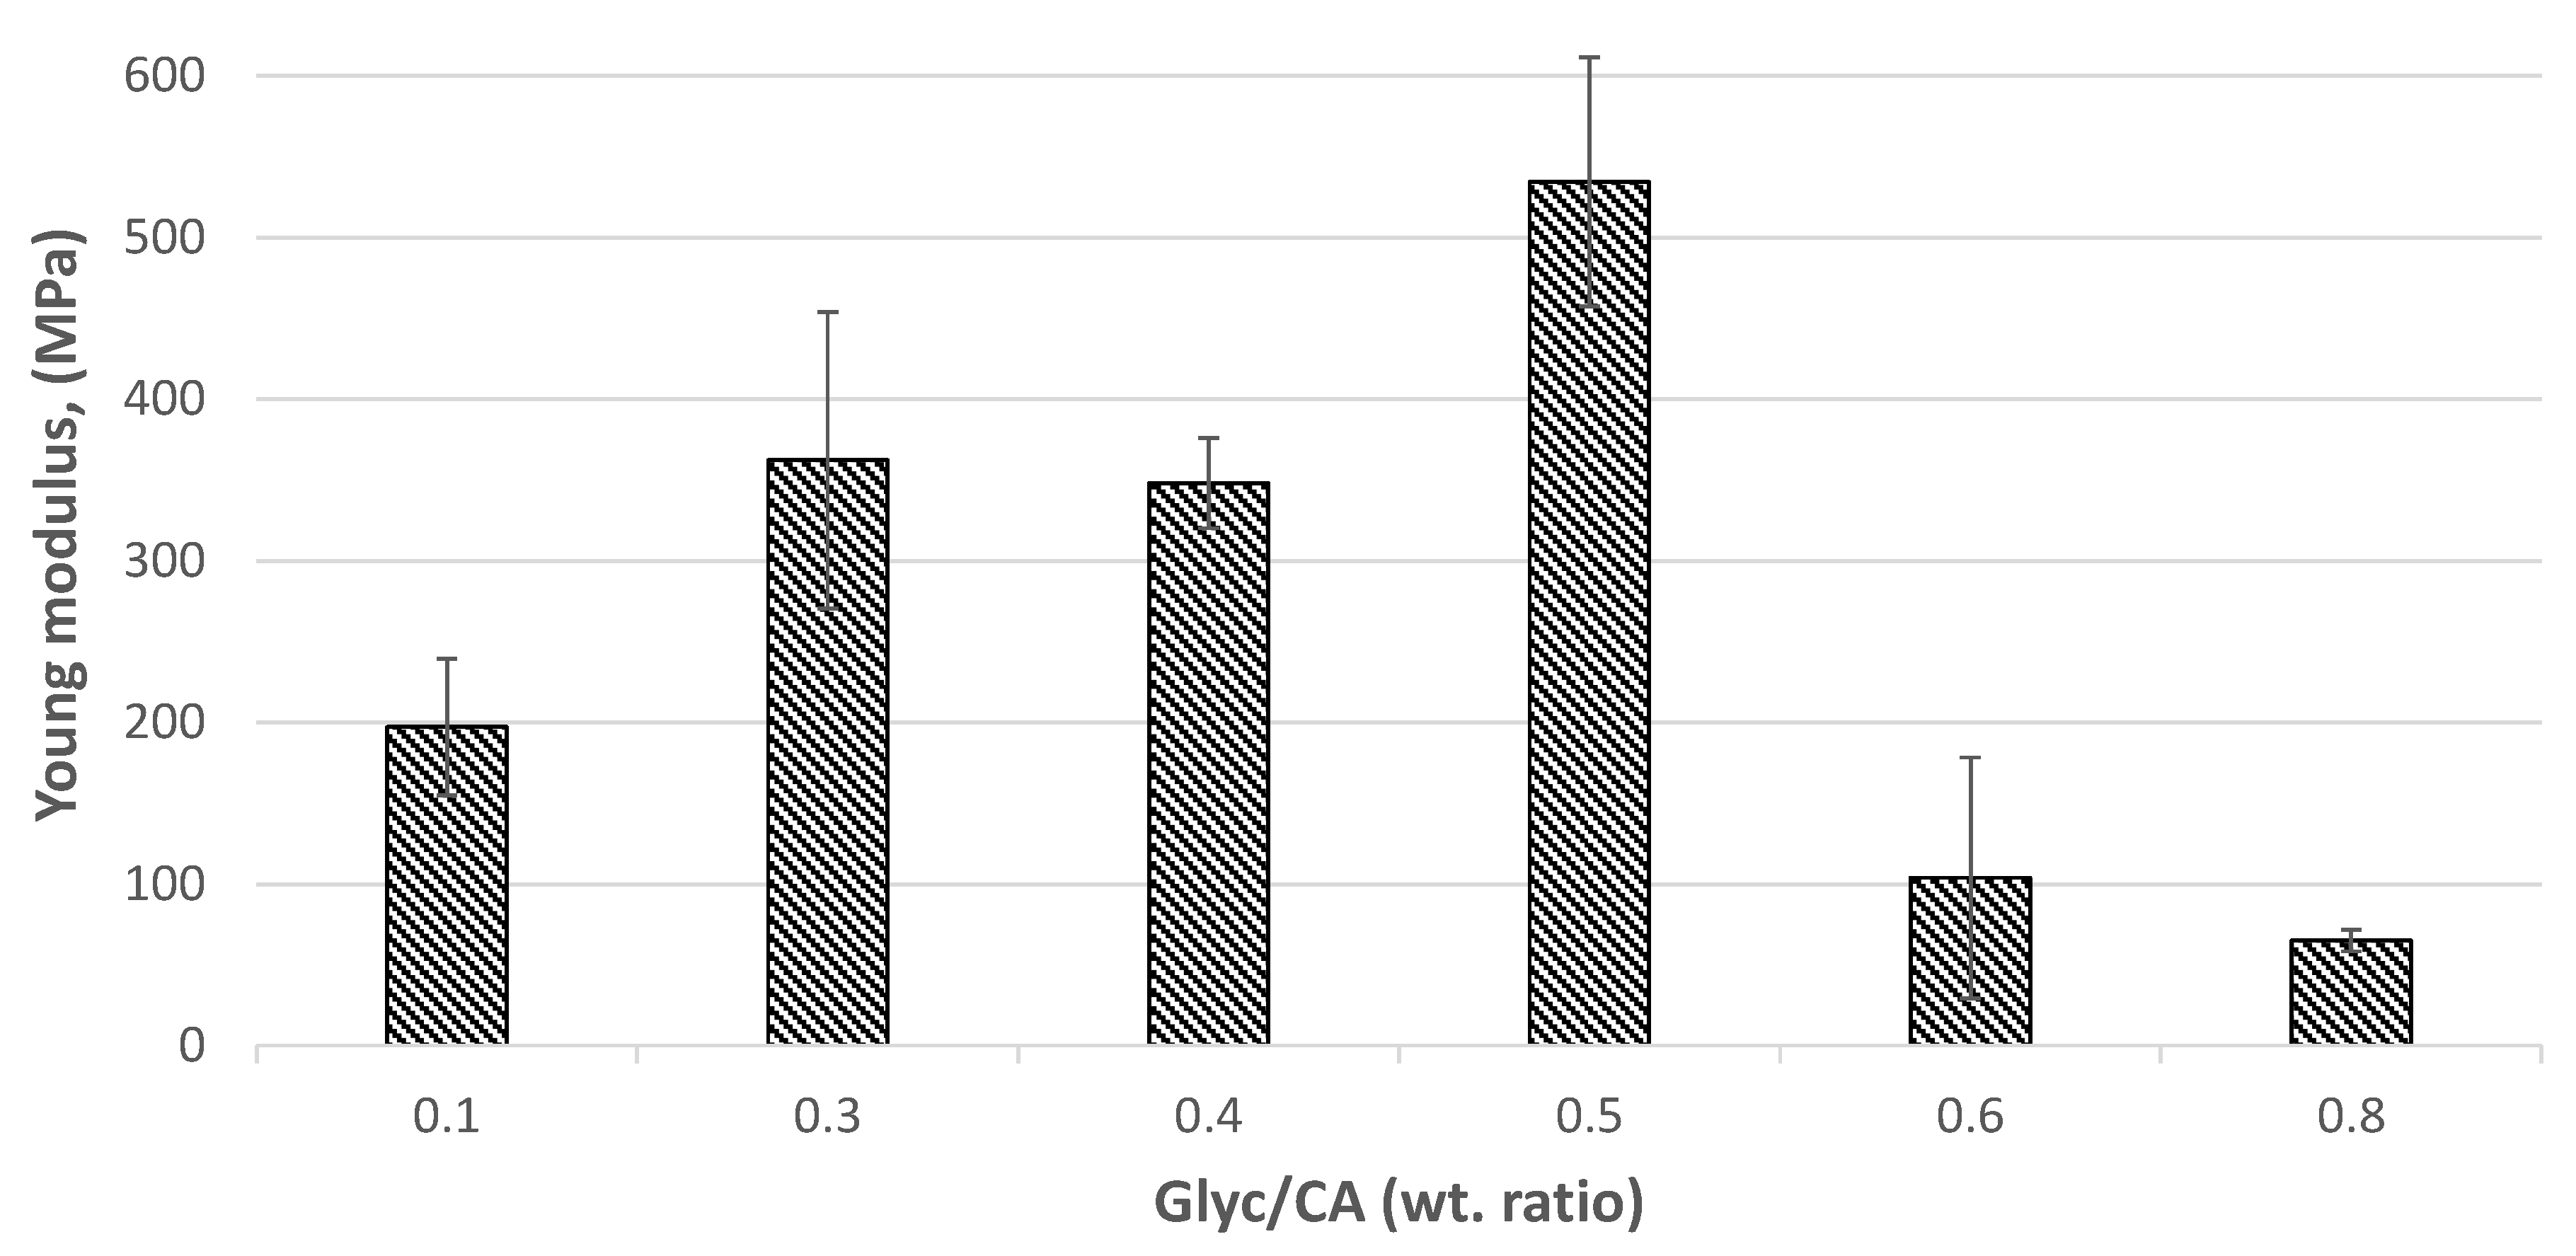
Figure 13.
– Young Modulus versus density of various materials (reprinted from [25]).
Figure 13.
– Young Modulus versus density of various materials (reprinted from [25]).
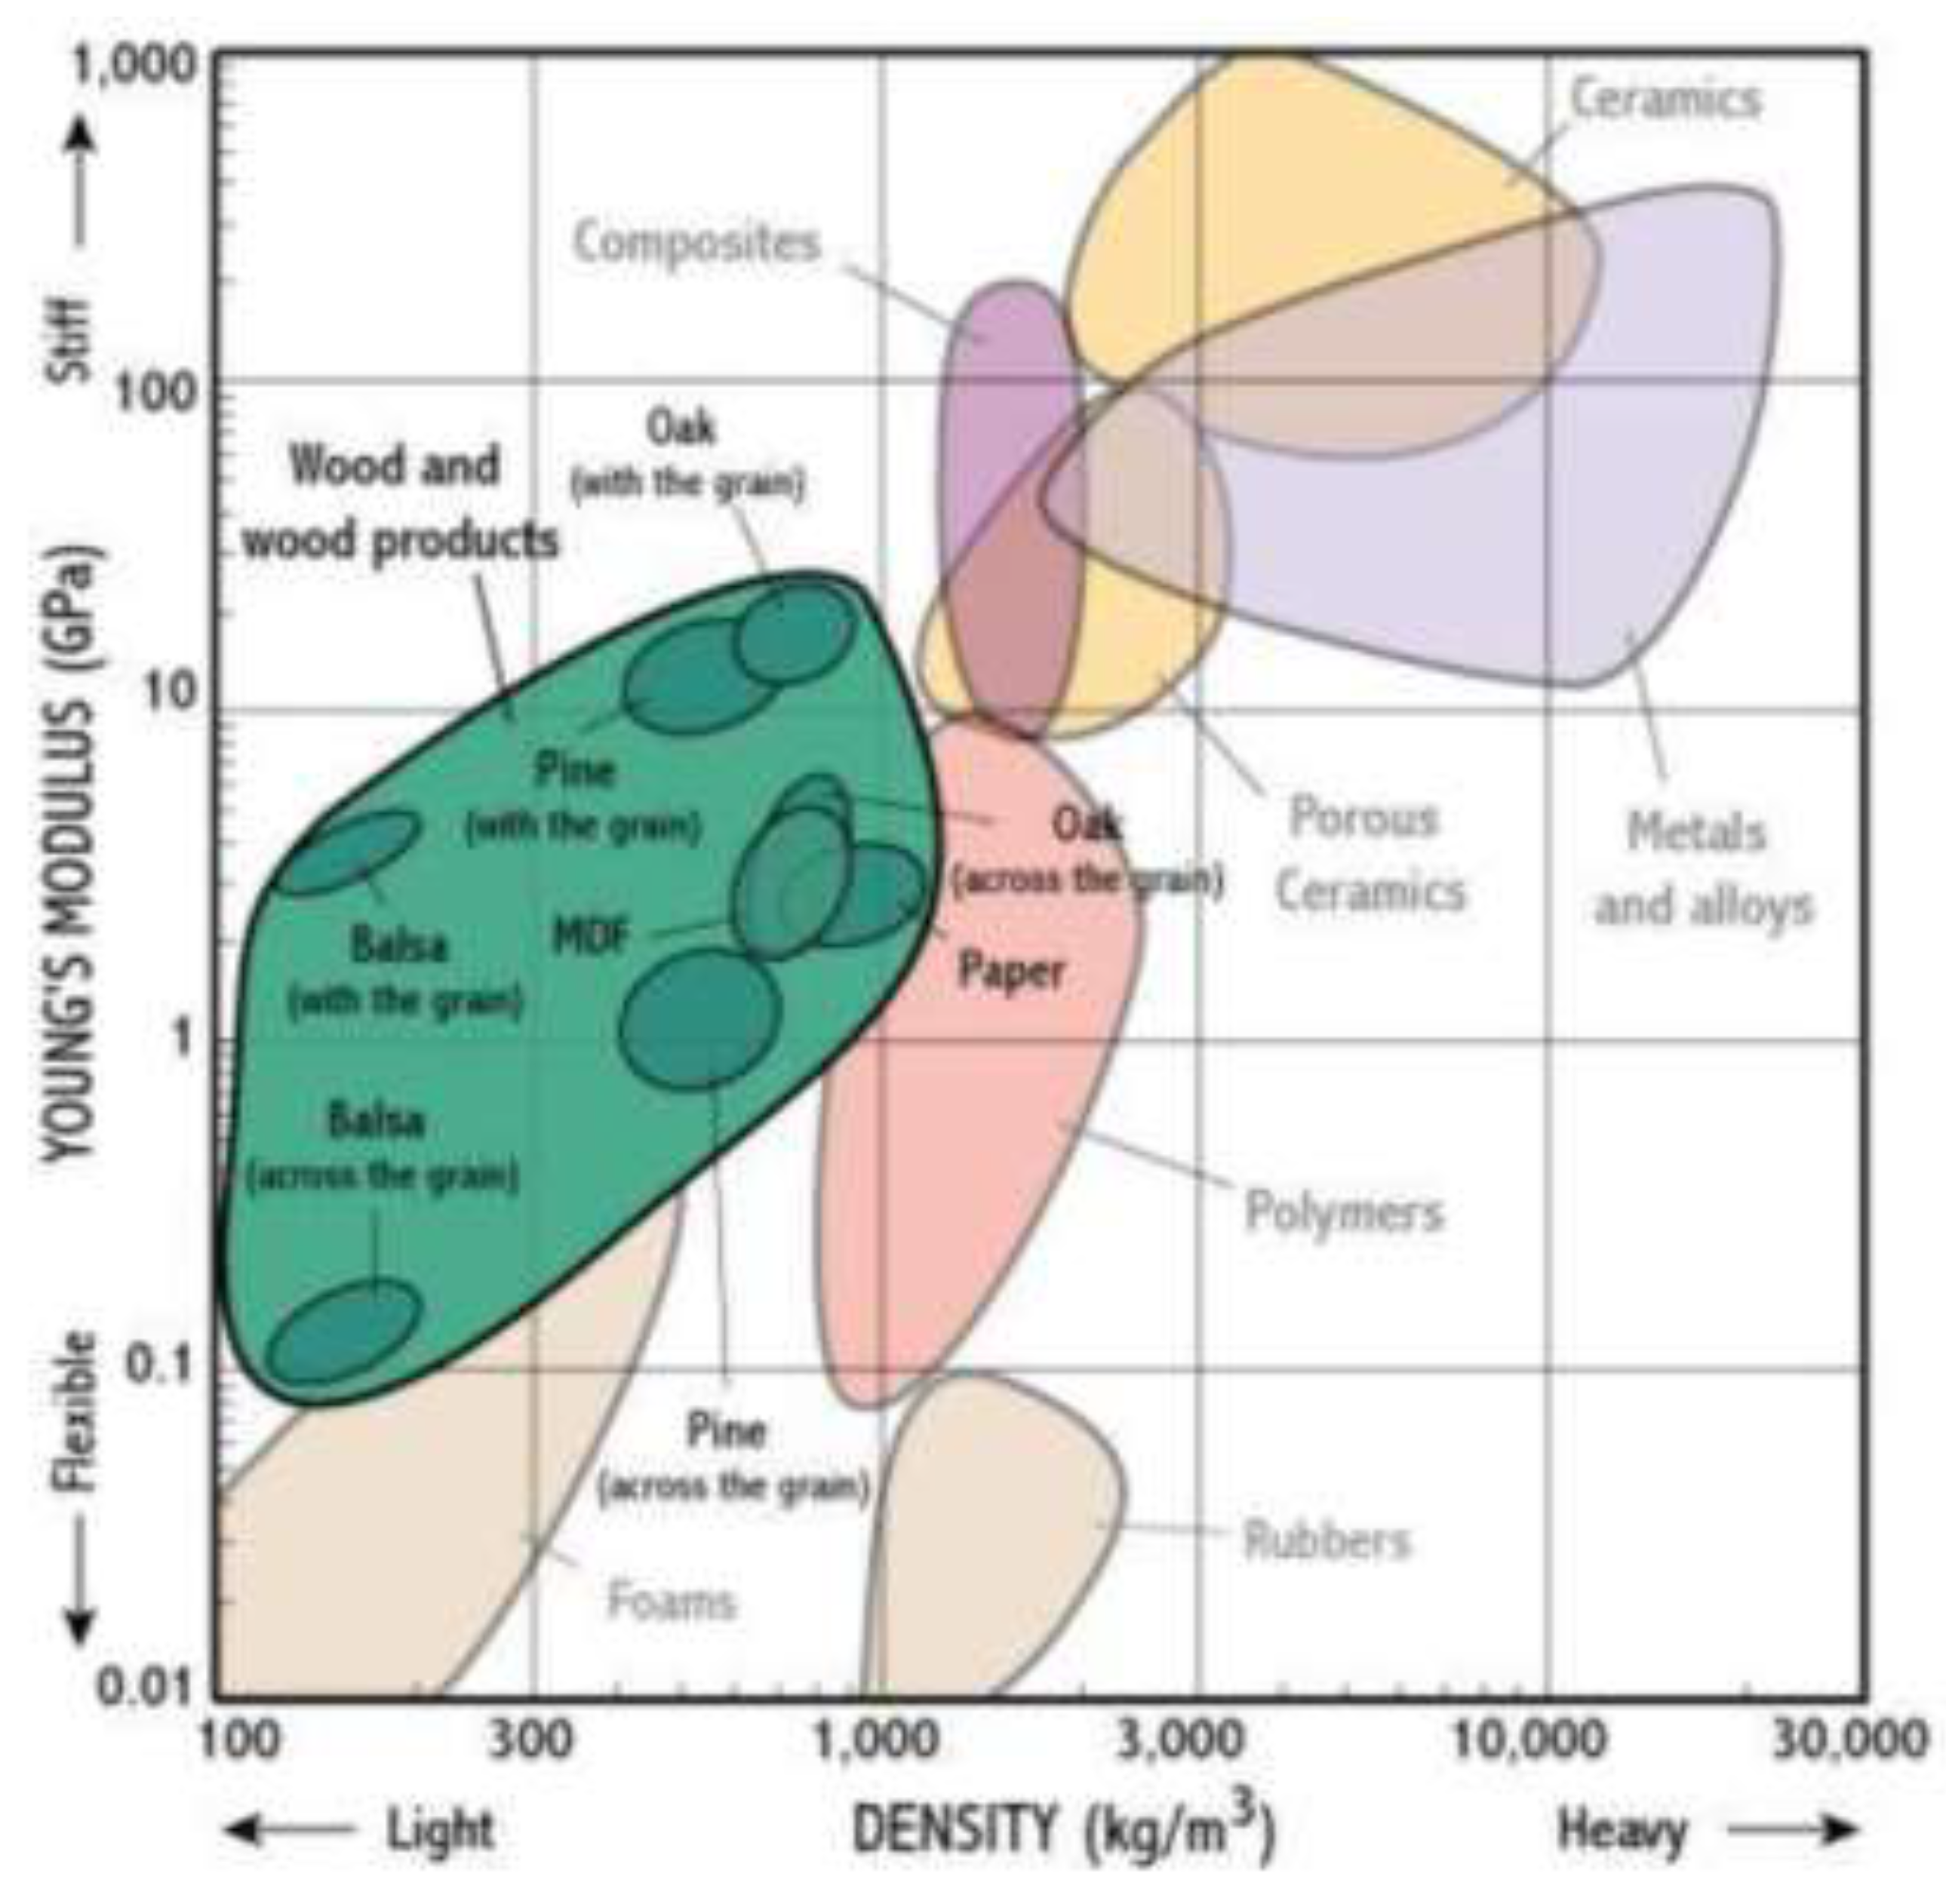
Figure 14.
– Water adsorption test of PGC, wood/PGC composite, and wood/PGC composite covered by water base varnish.
Figure 14.
– Water adsorption test of PGC, wood/PGC composite, and wood/PGC composite covered by water base varnish.
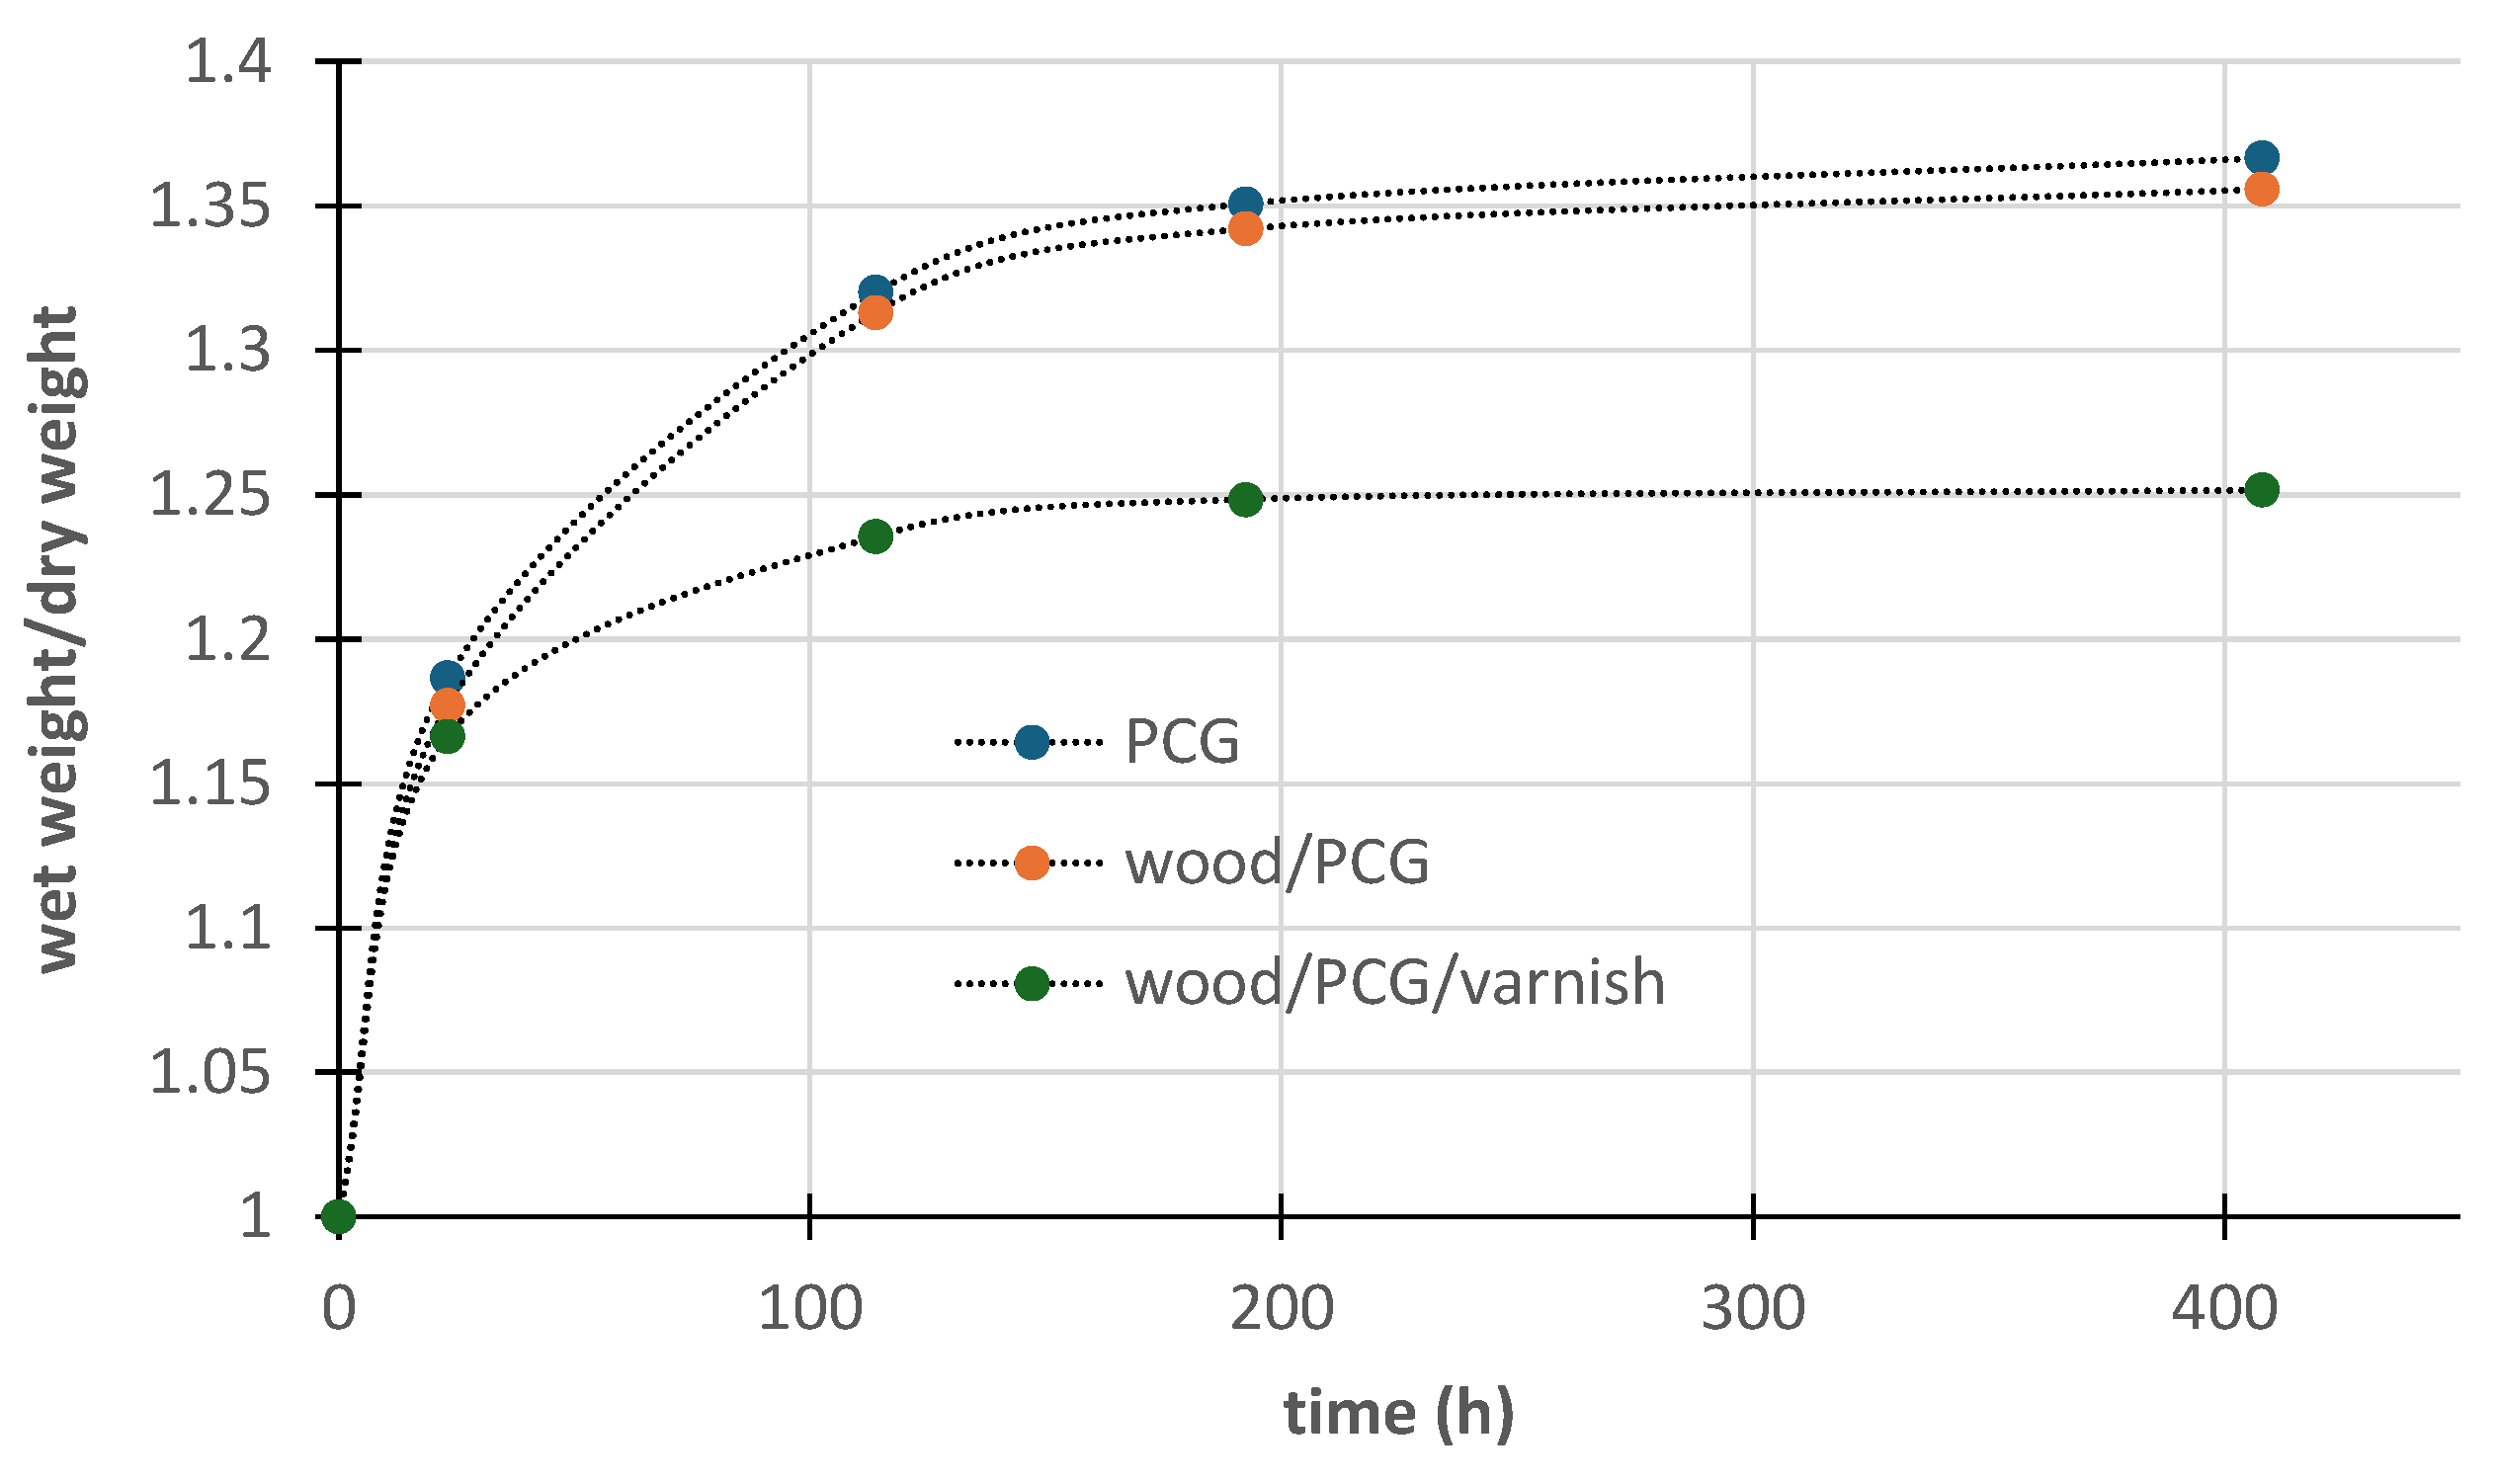

Table 1.
– Sawdust granulometric analysis by sieving.
| sieve (mm) | average particle diameter (mm) | %wt.(%) |
|---|---|---|
| 710 | 855 | 18.8 |
| 500 | 605 | 19.1 |
| 355 | 427.5 | 19.9 |
| 250 | 302.5 | 16.5 |
| 125 | 187.5 | 18.9 |
| 63 | 94 | 4.6 |
| 0 | 31.5 | 2.1 |
Table 2.
PGC FTIR bands assignments (adapted from[21] ).
Table 2.
PGC FTIR bands assignments (adapted from[21] ).
| Spectral range (cm-1) | Assignment |
|---|---|
| 3460 | -OH |
| 2949 | -CH and -CH2 |
| 1726 | -C=O |
| 1626; 1700 | -COOH from CA |
| 1156 | O-C-O |
Disclaimer/Publisher’s Note: The statements, opinions and data contained in all publications are solely those of the individual author(s) and contributor(s) and not of MDPI and/or the editor(s). MDPI and/or the editor(s) disclaim responsibility for any injury to people or property resulting from any ideas, methods, instructions or products referred to in the content. |
© 2025 by the authors. Licensee MDPI, Basel, Switzerland. This article is an open access article distributed under the terms and conditions of the Creative Commons Attribution (CC BY) license (http://creativecommons.org/licenses/by/4.0/).
Copyright: This open access article is published under a Creative Commons CC BY 4.0 license, which permit the free download, distribution, and reuse, provided that the author and preprint are cited in any reuse.


