
Submitted:
19 January 2025
Posted:
21 January 2025
You are already at the latest version
Abstract
Background/Objectives: Oral anticoagulants (OACs) are commonly used for stroke prevention in patients with atrial fibrillation (AF), but their impact on long-term outcomes following acute ischemic stroke (AIS) remains uncertain. This study evaluated whether prior anticoagulation influences functional outcomes and mortality in AIS patients.
Methods: A total of 914 patients admitted to the Department of Neurology, University of Pécs, following an AIS from January 2023 to September 2024, were retrospectively reviewed. Patients were categorized into an anticoagulated group (OAC use, n=153) and a non-anticoagulated group (Non-OAC use, n=761). Caliper-matched propensity score matching (PSM) was performed to balance confounding factors, including age, sex, history of hypertension or diabetes mellitus, stroke severity at 72 hours (assessed by National Institutes of Health Stroke Scale [NIHSS] score) and pre-stroke disability (based on pre-morbidity modified Rankin Scale [pre-mRS] score). Analyses were conducted on two key outcomes: 90-day mRS (modified Rankin Scale) scores and mortality.
Results: After matching, 276 patients were analyzed for functional outcomes and 306 for mortality. Anticoagulated patients were 2.26 times more likely to have an unfavorable functional outcome (90-day mRS >2) compared to non-anticoagulated patients (p=0.043). No significant difference in mortality (mRS = 6) was observed between the groups (p=0.307). Advanced age and higher 72h-NIHSS scores were significant predictors of poor functional outcomes, regardless of anticoagulation status.
Conclusions: Prior anticoagulation in AIS patients was associated with an unfavorable functional outcome without reducing mortality. While OACs remain essential for stroke prevention in AF patients, these findings suggest that the benefit of stroke prevention must be weighed against the risk of increased long-term disability following AIS.
Keywords:
acute ischemic stroke
; oral anticoagulants
; 90-day mRS
; mortality
; propensity score matching
1. Introduction
Stroke remains a leading cause of mortality and disability worldwide [1]. Survivors often face impairments that severely diminish their quality of life, necessitating ongoing rehabilitation and long-term care [2]. For patients with atrial fibrillation (AF), oral anticoagulants (OACs) have emerged as the treatment of choice for stroke prevention, effectively reducing the risk of thromboembolic events, including ischemic strokes [3].
Understanding the influence of OACs on functional recovery and survival following AIS is critical for optimizing patient management. The decision to initiate or maintain anticoagulation is inherently complex, weighing the benefit of OACs in reducing thromboembolic recurrence with the heightened risk of hemorrhagic complications. Too often, treatment decisions are driven by clinical concerns without considering their impact on long-term functional outcomes and overall quality of life.
This study aims to address this gap by evaluating the effect of prior anticoagulation on both functional recovery and mortality following AIS, providing insights that could guide clinical decision-making and individualized patient care.
2. Materials and Methods
2.1. Study Design and Patient Population
We conducted a retrospective cohort study using data from the TINL (Transzlációs Idegtudományi Nemzeti Laboratórium) STROKE-registry, a prospective database of stroke patients admitted to the Department of Neurology, University of Pécs, between January 2023 and September 2024. Out of 1,138 patients initially assessed, 224 were excluded based on predefined criteria: acute hemorrhagic stroke (AHS) (n=66), transient ischemic attack (TIA) (n=152), or duplicate records (n=6). The final cohort comprised 914 patients, categorized into an anticoagulated group (OAC use, n=153) and a non-anticoagulated group (Non-OAC use, n=761).
2.2. Data Collection and Measurements
Demographic and clinical information, including age, sex, medical history (e.g., hypertension, diabetes, smoking and alcohol status), stroke severity (National Institutes of Health Scale [NIHSS] score at admission and after 72 hours), and pre-stroke disability (pre-morbidity modified Rankin Scale [pre-mRS] score), was collected from the registry. Functional outcomes were assessed at 90 days using the modified Rankin Scale (mRS), with outcomes classified as favorable (mRS score 0-2) or unfavorable (mRS score >2). Mortality was defined as an mRS score of 6.
2.3. Caliper-Matched Propensity Score Matching
Caliper-matched propensity score matching (PSM) was employed to create balanced groups of anticoagulated and non-anticoagulated patients, ensuring comparability in terms of baseline clinical characteristics such as age, sex, history of hypertension, diabetes mellitus, 72h-NIHSS, and pre-mRS. Two separate analyses were performed: one for 90-day mRS involving 276 matched patients and another for mortality involving 306 matched patients. A flowchart summarizing patient inclusion and exclusion criteria is provided in Figure 1.
2.4. Statistical Analyses
Data analysis was conducted using Python (version 3.13.0). First, baseline characteristics were summarized for the entire cohort using descriptive statistics. Continuous variables were presented as medians with interquartile ranges (IQR), and categorical variables as counts and percentages. To examine baseline differences between groups, we employed the Mann-Whitney U test for non-normally distributed continuous variables, and the χ2 test or Fisher’s exact test for categorical variables.
Next, we assessed functional outcomes and mortality rates in the two groups. To identify significant predictors of 90-day mRS and mortality, multilinear logistic regression was performed on the unmatched dataset. This model included all relevant covariates to determine which factors were independently associated with outcomes.
Following this initial analysis, we conducted caliper-matched propensity score matching with a caliper width of 0.2 standard deviations of the logit-transformed propensity score. This approach was selected based on prior literature to achieve a balance between reducing bias and maintaining sufficient sample size. After matching, balance diagnostics were evaluated using standardized mean differences (SMD), variance ratios (VR), and Kolmogorov-Smirnov statistics, ensuring that covariates were well-balanced between groups.
Post-matching, logistic regression analysis was repeated to assess predictors of 90-day mRS and mortality in the matched cohorts. The regression models included all covariates used in the propensity score calculation to account for any residual confounding. Interaction terms were tested to explore potential effect modification, and continuous predictors were evaluated for linearity; non-linear terms were added if they improved model fit. Model performance was assessed using a range of metrics. Model fit was examined using log-likelihood and pseudo-R-squared values. Discrimination was evaluated through the area under the curve (AUC), along with measures such as accuracy, sensitivity, specificity, precision, and F1 score. Calibration was determined using the Brier score.
To assess the robustness of the findings, bootstrapping was performed. A total of 1,000 bootstrap iterations were used, resampling matched pairs with replacement. The resulting 95% confidence intervals (CI) for regression coefficients provided an additional layer of confidence in the stability of observed associations.
All statistical tests were two-tailed, with p-values below 0.05 considered statistically significant. Odds ratios (OR) with 95% confidence intervals were reported to quantify the strength of associations between clinical characteristics and outcomes.
2.5. Ethics Approval
The study was conducted in accordance with the Declaration of Helsinki and approved by the Scientific and Research Ethics Committee of the Medical Research Council of the University of Pécs (RRF-2.3.1-21-2022-00011). Informed consent was obtained from all participants or their legal representatives for all diagnostic and therapeutic procedures prior to inclusion in the study.
3. Results
3.1. Whole Cohort Pre-Propensity Score Matching
Baseline Characteristics
Anticoagulated patients were older (with a median age of 78 years [IQR 44-95] compared to 71 years [IQR 30-96] for non-anticoagulated patients (p<0.001)). They were less likely to smoke (p<0.001), but more likely to consume alcohol (p=0.012). A significantly higher proportion of anticoagulated patients had a history of hypertension (p<0.001), while the prevalence of diabetes mellitus was higher but did not reach statistical significance (p=0.075).
In terms of functional independence, non-anticoagulated patients were more likely to be functionally independent upon admission, with 70.3% of patients having a pre-mRS score of 0 compared to 58.8% of anticoagulated patients (p=0.006). Additionally, non-anticoagulated patients experienced less severe strokes compared to anticoagulated patients, having lower NIHSS scores at admission (p=0.026).
When examining treatment differences, non-anticoagulated patients were significantly more likely to receive intravenous thrombolysis (IVT) (27.9% vs. 5.9%, p<0.001), while anticoagulated patients were more likely to receive standard care (SC) (67.3% vs. 45.9%, p<0.001). For detailed comparisons, refer to Table 1.
Imaging and Stroke Characteristics
A significantly higher proportion of patients in the OAC group experienced cardioembolic strokes compared to the non-anticoagulated group (72.6% vs. 26.9%, p<0.001). Conversely, large artery atherosclerosis was more frequently identified as the underlying cause of stroke among non-anticoagulated patients (25.9% vs. 11.1%, p<0.001). For detailed comparisons, refer to Table 2.
Functional Results and Safety Outcome
In terms of functional outcomes, anticoagulated patients were significantly less likely to achieve a favorable outcome at 90 days post-stroke compared to non-anticoagulated patients (34.1% vs. 52.2%, p=0.018), while the mortality rate was notably higher among anticoagulated patients (26.8% vs. 12.4%, p<0.001). For detailed comparisons, refer to Table 3 and Figure 2.
In the initial multilinear logistic regression analysis before caliper-matched PSM, several factors were identified as significant predictors of a favorable outcome, including age (p<0.001), diabetes mellitus (p=0.003), 72h-NIHSS score (p<0.001), and pre-mRS score (p<0.001). For mortality outcomes, significant predictors included anticoagulation status (p=0.002), age (p<0.001), 72h-NIHSS score (p<0.001), and pre-mRS score (p<0.001).
3.2. 90-Day mRS Cohort Post-Propensity Score Matching
Evaluation of Matching Quality
The SMD improved substantially after matching, demonstrating enhanced covariate balance across groups (Figure 3).
Additional validation using the VR and Kolmogorov-Smirnov test further confirmed these improvements, indicating effective matching between the treated and control groups (Table 4)
Although hypertension exhibited a slight imbalance in variance after matching (VR=1.56), this difference was not statistically significant as indicated by the Kolmogorov-Smirnov test (p=1.0), suggesting that the distribution between groups remained comparable post-matching.
Logistic Regression Analysis
The model demonstrated a strong fit, as indicated by a log-likelihood of -82.981 and a pseudo-R-squared value of 0.5486, suggesting that 54.86% of the variability in the 90-day mRS could be explained by the independent variables included in the model. Furthermore, the log-likelihood ratio (LLR) p-value of 5.064 x 10-40 underscores the model's statistical significance, supporting the contribution of the selected predictors in explaining a substantial proportion of the outcome variance. The model showed excellent discriminatory performance with an AUC of 0.94, reflecting a strong ability to distinguish between patients with favorable and unfavorable outcomes (Figure 4). The model also achieved a high accuracy of 0.84, sensitivity of 0.85, specificity of 0.83, precision of 0.89, and an F1 score of 0.87, with a Brier score of 0.0949, indicating reliable calibration.
The baseline probability of achieving a favorable functional outcome was notably low, as reflected by the intercept coefficient of -6.9852 (95% CI: -10.81 to -3.16, p<0.001).
After Caliper-matched propensity score matching, logistic regression analysis showed that anticoagulated patients were 2.26 times more likely to have a 90-day mRS score >2 compared to non-anticoagulated patients (average treatment effect [ATE] = 0.816, p=0.043).
While older age approached significance (p=0.087), the odds of a poor functional outcome increased by approximately 4% with each additional year. Diabetes mellitus (p=0.043), higher 72h-NIHSS and pre-mRS scores (p<0.001) were significantly associated with unfavorable outcomes. In contrast, sex (p=0.184) and hypertension (p=0.815) did not significantly affect recovery.
During bootstrapping analysis, anticoagulation status, 72h-NIHSS score, and pre-mRS score consistently demonstrated strong associations with poor outcomes, underscoring their stability as key predictors of unfavorable outcome. The results are summarized in Table 5.
3.3. Mortality Cohort Post-Propensity Score Matching
Evaluation of Matching Quality
Figure 5 illustrates the SMD after propensity score matching, highlighting the balance achieved between the matched groups.
The VR and Kolmogorov-Smirnov tests results further confirmed this improvement, highlighting effective matching between treated and control groups.
Despite a slightly elevated variance ratio for hypertension (VR=2.17), the Kolmogorov-Smirnov test indicated no statistically significant difference between groups after matching (p=0.999). This suggests that the distribution of hypertension was adequately balanced post-matching.
Logistic Regression Analysis
The model demonstrated a good fit, as indicated by a log-likelihood value of -98.145 and a pseudo-R-squared of 0.4202, suggesting that 42.02% of the variability in the 90-day mRS can be explained by the independent variables included. The LLR p-value of 1.711 x 10⁻²⁷ confirms the statistical significance of the model, indicating that the predictors successfully explain a significant portion of the variance in functional outcomes. The model demonstrated an AUC of 0.91, indicating excellent discrimination (Figure 6), and achieved an accuracy of 0.85, precision of 0.75, sensitivity (recall) of 0.57, and an F1 score of 0.65, with a Brier score of 0.1032, reflecting reliable calibration.
Additionally, the baseline probability of achieving a favorable functional outcome was low, as reflected by the intercept coefficient of -11.2061 (95% CI: -28.14 to -7.90).
In the mortality analysis, no significant difference was found between the anticoagulated and non-anticoagulated groups. However, older age emerged as a significant predictor of increased mortality, with each additional year of age raising the risk of death by 12% (p<0.001). Stroke severity at 72 hours was also a critical factor, increasing the odds of mortality by 21% for every 1.21-point increase in the 72h-NIHSS score (p<0.001). Other variables, such as anticoagulation status (p=0.307), hypertension (p=0.921), diabetes mellitus (p=0.203), and pre-mRS score (p=0.557), showed no significant association with mortality. Interestingly, females had a 51% lower risk of death compared to males, although this result approached but did not reach statistical significance (p=0.065). The results are summarized in Table 7.
4. Discussion
The results of our study demonstrate that being anticoagulated at the time of stroke is independently associated with a 90-day mRS >2. However, anticoagulation status did not significantly influence mortality, suggesting that its primary impact may be on functional recovery rather than survival.
Our findings align with those of Krieger et al., who found that pre-admission use of antithrombotic agents was linked to 90 days-mRS scores of 3-6 following mechanical thrombectomy (MT) [4]. Similarly, D’Anna et al. [5] and Küpper et al. [6] reported less favorable outcomes at 90 days for patients on anticoagulation therapy. A meta-analysis by Seiffge et al. further reinforced that while OACs reduce the risk of recurrent ischemic events, they do not significantly reduce all-cause mortality [7].
However, in contrast to our findings, a study comparing OACs combined with dual antiplatelet treatment (DAPT) vs. DAPT alone following MT and carotid stenting found no difference in functional recovery but reported a higher late mortality rate in the DAPT group, even after adjusting for age and mRS score at hospital-discharge [8].
The association between AF and poorer stroke outcomes is well-documented [9]. Patients with AF are significantly less likely to achieve favorable functional outcomes, and they have increased mortality rates, irrespective of choice of recanalization therapy [10,11].
A recent study evaluating outcomes 2.5 years after AIS treated with IVT found better long-term outcomes linked to less frequent anticoagulation therapy prior to admission, younger age and lower NIHSS score post-IVT [12].
4.2. Significant Predictors: Age, Stroke Severity and Sex
Older age and higher NIHSS scores at 72 hours were both associated with significantly poorer functional recovery and increased mortality risk in our cohort, which is consistent with the current literature [13].
Interestingly, we also observed that females had a significantly lower risk of mortality compared to males. This aligns with findings by Appelros et al. [14], who proposed that the observed sex difference in stroke outcomes might be attributed to factors such as better adherence to treatment, more consistent engagement with rehabilitation programs, and differences in healthcare-seeking behavior.
4.2. Potential Mechanisms and Future Directions
The association between anticoagulation and poor functional recovery after AIS is likely multifactorial. While hemorrhagic transformation and larger infarct volumes are commonly linked to poorer outcomes [15,16,17,18,19], our study did not find significant differences in intracranial hemorrhage rates between anticoagulated and non-anticoagulated patients. This suggests other mechanisms may be at play. It is possible that subtle or microscopic hemorrhagic transformations occurred but were undetected with routinely used standard imaging techniques. Future studies should incorporate advanced imaging modalities, such as magnetic resonance imaging (MRI) susceptibility-weighted imaging (SWI) or diffusion-weighted imaging (DWI), to better understand whether subclinical hemorrhagic events or microvascular injuries are more prevalent in anticoagulated patients. Reduced vascular integrity in anticoagulated patients [20] could also impair collateral flow and limit penumbral salvage, contributing to worse recovery. This is supported by the trend of better collateral status in non-anticoagulated patients, with 87.3% vs. 80.4% having a multiphase computed tomography angiography (mCTA) score of 4-5 (p=0.069).
Although our analysis found that stroke subtype (cardioembolic vs. non-cardioembolic) did not significantly impact 90-day mRS or mortality, it is possible that multiple factors are interacting. For example, the interplay between compromised vascular integrity and stroke subtype may still contribute to the poorer functional recovery observed in anticoagulated patients.
In addition, despite propensity score matching, other complications, such as infections or metabolic disturbances, might be more frequent in anticoagulated patients and adversely affect recovery. Variability in anticoagulation level may also play a role, by increasing thrombotic risk in under-anticoagulated patients or bleeding risk in over-anticoagulated ones. Future studies should examine whether maintaining optimal anticoagulation levels can improve recovery.
Finally, the 90-day observation period may not have been sufficient to capture the full trajectory of functional recovery. Extending follow-up to 6 months or 1 year may reveal different recovery patterns, particularly for anticoagulated patients who may experience delayed but eventual recovery. Future research should also expand the scope of assessment tools used, incorporating measures that evaluate cognitive deficits and quality of life beyond the 90-day mRS score to provide a more comprehensive view of recovery outcomes.
4.3. Limitations
Our study has several limitations that should be considered when interpreting the results. First and foremost, the observational design inherently restricts our ability to establish causal relationships. While propensity score matching was employed to balance measured confounders, the possibility of residual confounding from unmeasured variables cannot be entirely ruled out.
Additionally, the relatively small sample size of the matched cohorts limits the generalizability of our findings. Although we achieved a good balance between groups, the restricted number of patients may reduce the power to detect smaller effect sizes or to perform robust subgroup analyses. This issue is further compounded by the inherent trade-offs in propensity score matching, where achieving balance often comes at the cost of a reduced sample size.
Another limitation is the reliance on retrospective data. While efforts were made to ensure data accuracy and consistency, the use of existing records can introduce errors, affecting the reliability of the variables used in our analyses and, consequently, the robustness of our conclusions.
Lastly, our study was conducted at a single institution, which may limit the external validity of the findings. Differences in patient populations, healthcare systems, and treatment standards at other centers could lead to variations in outcomes that our analysis cannot capture. Future studies involving larger, multicenter cohorts with prospective data collection would help confirm and extend these findings and potentially uncover factors that were not accounted for in this investigation.
5. Conclusions
While anticoagulation remains crucial for preventing thromboembolic events in AIS patients, clinicians must carefully balance the benefits against potential impacts on long-term functional recovery. A personalized approach that considers patient-specific factors such as age and stroke severity is essential to optimize treatment outcomes.
Future research should investigate the underlying mechanisms contributing to poor outcomes in anticoagulated patients, through advanced imaging, biomarker assessments, and longer follow-up periods to fully capture recovery trajectories. Additionally, assessing cognitive outcomes and quality of life, beyond traditional functional scales like mRS, will be crucial in improving long-term outcomes for AIS survivors.
Author Contributions
Conceptualization, J.S. and B.C.; methodology, J.S. and L.S.; validation, Z.N.K. and E.B.; formal analysis, J.S.; data curation, J.S.; writing—original draft preparation, J.S. and B.C.; writing—review and editing, Z.N.K. and E.B.; visualization, J.S.; supervision, L.S.; project administration, L.S. All authors have read and agreed to the published version of the manuscript.
Funding
This research received no external funding.
Institutional Review Board Statement
This study was conducted in accordance with the Declaration of Helsinki and approved by the Scientific and Research Ethics Committee of the Medical Research Council of the University of Pécs (RRF-2.3.1-21-2022-00011, 01/09/22) and re-approved by the Scientific and Research Ethics Committee of the Medical Research Council of Hungary (BM/22444-1/2024, 01/09/24).
Informed Consent Statement
Informed consent was obtained from all subjects involved in the study.
Data Availability Statement
The original contributions presented in the study are included in the article and further inquiries can be directed to the corresponding author.
Conflicts of Interest
The authors declare no conflicts of interest.
Abbreviations
| OACs | oral anticoagulants |
| AF | atrial fibrillation |
| AIS | acute ischemic stroke |
| PSM | propensity score matching |
| NIHSS | National Institutes of Health Scale |
| pre-mRS | pre-morbidity modified Rankin Scale |
| mRS | modified Rankin Scale |
| TINL | Transzlációs Idegtudományi Nemzeti Laboratórium |
| AHS | acute hemorrhagic stroke |
| TIA | transient ischemic attack |
| IQR | interquartile range |
| SMD | standardized mean difference |
| VR | variance ratio |
| AUC | area under the curve |
| CI | confidence interval |
| OR | odds ratio |
| IVT | intravenous thrombolysis |
| SC | standard care |
| LLR | log-likelihood ratio |
| ATE | average treatment effect |
| MT | mechanical thrombectomy |
| DAPT | dual antiplatelet therapy |
| MRI | magnetic resonance imaging |
| SWI | susceptibility-weighted imaging |
| DWI | diffusion-weighted imaging |
| mCTA | multiphase computed tomography angiography |
References
- Martin, S.S.; Aday, A.W.; Almarzooq, Z.I.; Anderson, C.A.M.; Arora, P.; Avery, C.L.; Baker-Smith, C.M.; Barone Gibbs, B.; Beaton, A.Z.; Boehme, A.K.; et al. 2024 Heart Disease and Stroke Statistics: A Report of US and Global Data From the American Heart Association. Circulation 2024, 149. [Google Scholar] [CrossRef] [PubMed]
- Gorelick, P.B. The Global Burden of Stroke: Persistent and Disabling. Lancet Neurol 2019, 18, 417–418. [Google Scholar] [CrossRef]
- Joglar, J.A.; Chung, M.K.; Armbruster, A.L.; Benjamin, E.J.; Chyou, J.Y.; Cronin, E.M.; Deswal, A.; Eckhardt, L.L.; Goldberger, Z.D.; Gopinathannair, R.; et al. 2023 ACC/AHA/ACCP/HRS Guideline for the Diagnosis and Management of Atrial Fibrillation: A Report of the American College of Cardiology/American Heart Association Joint Committee on Clinical Practice Guidelines. Circulation 2024, 149. [Google Scholar] [CrossRef] [PubMed]
- Krieger, P.; Melmed, K.R.; Torres, J.; Zhao, A.; Croll, L.; Irvine, H.; Lord, A.; Ishida, K.; Frontera, J.; Lewis, A. Pre-Admission Antithrombotic Use Is Associated with 3-Month MRS Score after Thrombectomy for Acute Ischemic Stroke. J Thromb Thrombolysis 2022, 54, 350–359. [Google Scholar] [CrossRef] [PubMed]
- D’Anna, L.; Romoli, M.; Foschi, M.; Abu-Rumeileh, S.; Dolkar, T.; Vittay, O.; Dixon, L.; Bentley, P.; Brown, Z.; Hall, C.; et al. Outcomes of Mechanical Thrombectomy in Orally Anticoagulated Patients with Anterior Circulation Large Vessel Occlusion: A Propensity-Matched Analysis of the Imperial College Thrombectomy Registry. J Neurol 2023, 270, 5827–5834. [Google Scholar] [CrossRef] [PubMed]
- Küpper, C.; Feil, K.; Wollenweber, F.A.; Tiedt, S.; Herzberg, M.; Dorn, F.; Liebig, T.; Dieterich, M.; Kellert, L. Endovascular Stroke Treatment in Orally Anticoagulated Patients: An Analysis from the German Stroke Registry-Endovascular Treatment. J Neurol 2021, 268, 1762–1769. [Google Scholar] [CrossRef] [PubMed]
- Seiffge, D.J.; De Marchis, G.M.; Koga, M.; Paciaroni, M.; Wilson, D.; Cappellari, M.; Macha, M.K.; Tsivgoulis, G.; Ambler, G.; Arihiro, S.; et al. Ischemic Stroke despite Oral Anticoagulant Therapy in Patients with Atrial Fibrillation. Ann Neurol 2020, 87, 677–687. [Google Scholar] [CrossRef] [PubMed]
- Weller, J.M.; Dorn, F.; Meissner, J.N.; Stösser, S.; Beckonert, N.M.; Nordsiek, J.; Kindler, C.; Riegler, C.; Keil, F.; Petzold, G.C.; et al. Antithrombotic Treatment and Outcome after Endovascular Treatment and Acute Carotid Artery Stenting in Stroke Patients with Atrial Fibrillation. Neurol Res Pract 2022, 4, 42. [Google Scholar] [CrossRef]
- Henninger, N.; Goddeau, R.P.; Karmarkar, A.; Helenius, J.; McManus, D.D. Atrial Fibrillation Is Associated With a Worse 90-Day Outcome Than Other Cardioembolic Stroke Subtypes. Stroke 2016, 47, 1486–1492. [Google Scholar] [CrossRef] [PubMed]
- Hu, Y.; Ji, C. Efficacy and Safety of Thrombolysis for Acute Ischemic Stroke with Atrial Fibrillation: A Meta-Analysis. BMC Neurol 2021, 21, 66. [Google Scholar] [CrossRef] [PubMed]
- Lasek-Bal, A.; Żak, A.; Binek, Ł.; Student, S.; Tomalski, W.; Krzan, A.; Puz, P.; Uchwat, U. The Relevance of Atrial Fibrillation to the Safety and Efficacy of Mechanical Thrombectomy in Stroke Patients. Pol Arch Intern Med 2021. [CrossRef]
- Schäbitz, M.; Möller, L.; Friedrich, A.; Klein, N.; Kitsiou, A.; Greeve, I.; Gerstner, A.; Wulff, L.; Schäbitz, W.-R.; Timmermann, L.; et al. Long-Term Functional Outcome and Quality of Life 2.5 Years after Thrombolysis in Acute Ischemic Stroke. Neurol Res Pract 2023, 5, 62. [Google Scholar] [CrossRef]
- O’Donnell, M.J.; Chin, S.L.; Rangarajan, S.; Xavier, D.; Liu, L.; Zhang, H.; Rao-Melacini, P.; Zhang, X.; Pais, P.; Agapay, S.; et al. Global and Regional Effects of Potentially Modifiable Risk Factors Associated with Acute Stroke in 32 Countries (INTERSTROKE): A Case-Control Study. The Lancet 2016, 388, 761–775. [Google Scholar] [CrossRef] [PubMed]
- Appelros, P.; Stegmayr, B.; Terént, A. A Review on Sex Differences in Stroke Treatment and Outcome. Acta Neurol Scand 2009, 121, 359–369. [Google Scholar] [CrossRef]
- Paciaroni, M.; Agnelli, G.; Corea, F.; Ageno, W.; Alberti, A.; Lanari, A.; Caso, V.; Micheli, S.; Bertolani, L.; Venti, M.; et al. Early Hemorrhagic Transformation of Brain Infarction: Rate, Predictive Factors, and Influence on Clinical Outcome. Stroke 2008, 39, 2249–2256. [Google Scholar] [CrossRef] [PubMed]
- Wen, L.; Zhang, S.; Wan, K.; Zhang, H.; Zhang, X. Risk Factors of Haemorrhagic Transformation for Acute Ischaemic Stroke in Chinese Patients Receiving Intravenous Thrombolysis. Medicine 2020, 99, e18995. [Google Scholar] [CrossRef] [PubMed]
- Ocek, L.; Guner, D.; Uludag, I.F.; Tiftikcioglu, B.I.; Zorlu, Y. Risk Factors for Hemorrhagic Transformation in Patients with Acute Middle Cerebral Artery Infarction. Noro Psikiyatr Ars 2015, 52, 342–345. [Google Scholar] [CrossRef] [PubMed]
- Tu, H.T.H.; Campbell, B.C. V.; Christensen, S.; Desmond, P.M.; De Silva, D.A.; Parsons, M.W.; Churilov, L.; Lansberg, M.G.; Mlynash, M.; Olivot, J.-M.; et al. Worse Stroke Outcome in Atrial Fibrillation Is Explained by More Severe Hypoperfusion, Infarct Growth, and Hemorrhagic Transformation. International Journal of Stroke 2015, 10, 534–540. [Google Scholar] [CrossRef] [PubMed]
- Kim, Y.D.; Hong, H.J.; Cha, M.J.; Nam, C.M.; Nam, H.S.; Heo, J.H. Determinants of Infarction Patterns in Cardioembolic Stroke. Eur Neurol 2011, 66, 145–150. [Google Scholar] [CrossRef]
- Hariri, E.H.; Kassis, N.; Badwan, O.Z.; Al Hammoud, M.M.; Layoun, H.; Bansal, A.; Farwati, M.; Harb, S.C.; Jaber, W.; Kapadia, S.R. Impact of Oral Anticoagulation on Progression and Long-Term Outcomes of Mild or Moderate Aortic Stenosis. J Am Coll Cardiol 2022, 80, 181–183. [Google Scholar] [CrossRef] [PubMed]
Figure 1.
Flowchart of the study. Abbreviations: AHS = acute hemorrhagic stroke, TIA = transient ischemic attack, mRS = modified Rankin Scale, OAC = oral anticoagulant, HT = hypertension, DM = diabetes mellitus, NIHSS = National Institutes of Health Stroke Scale, pre-mRS = pre-morbidity modified Rankin Scale.
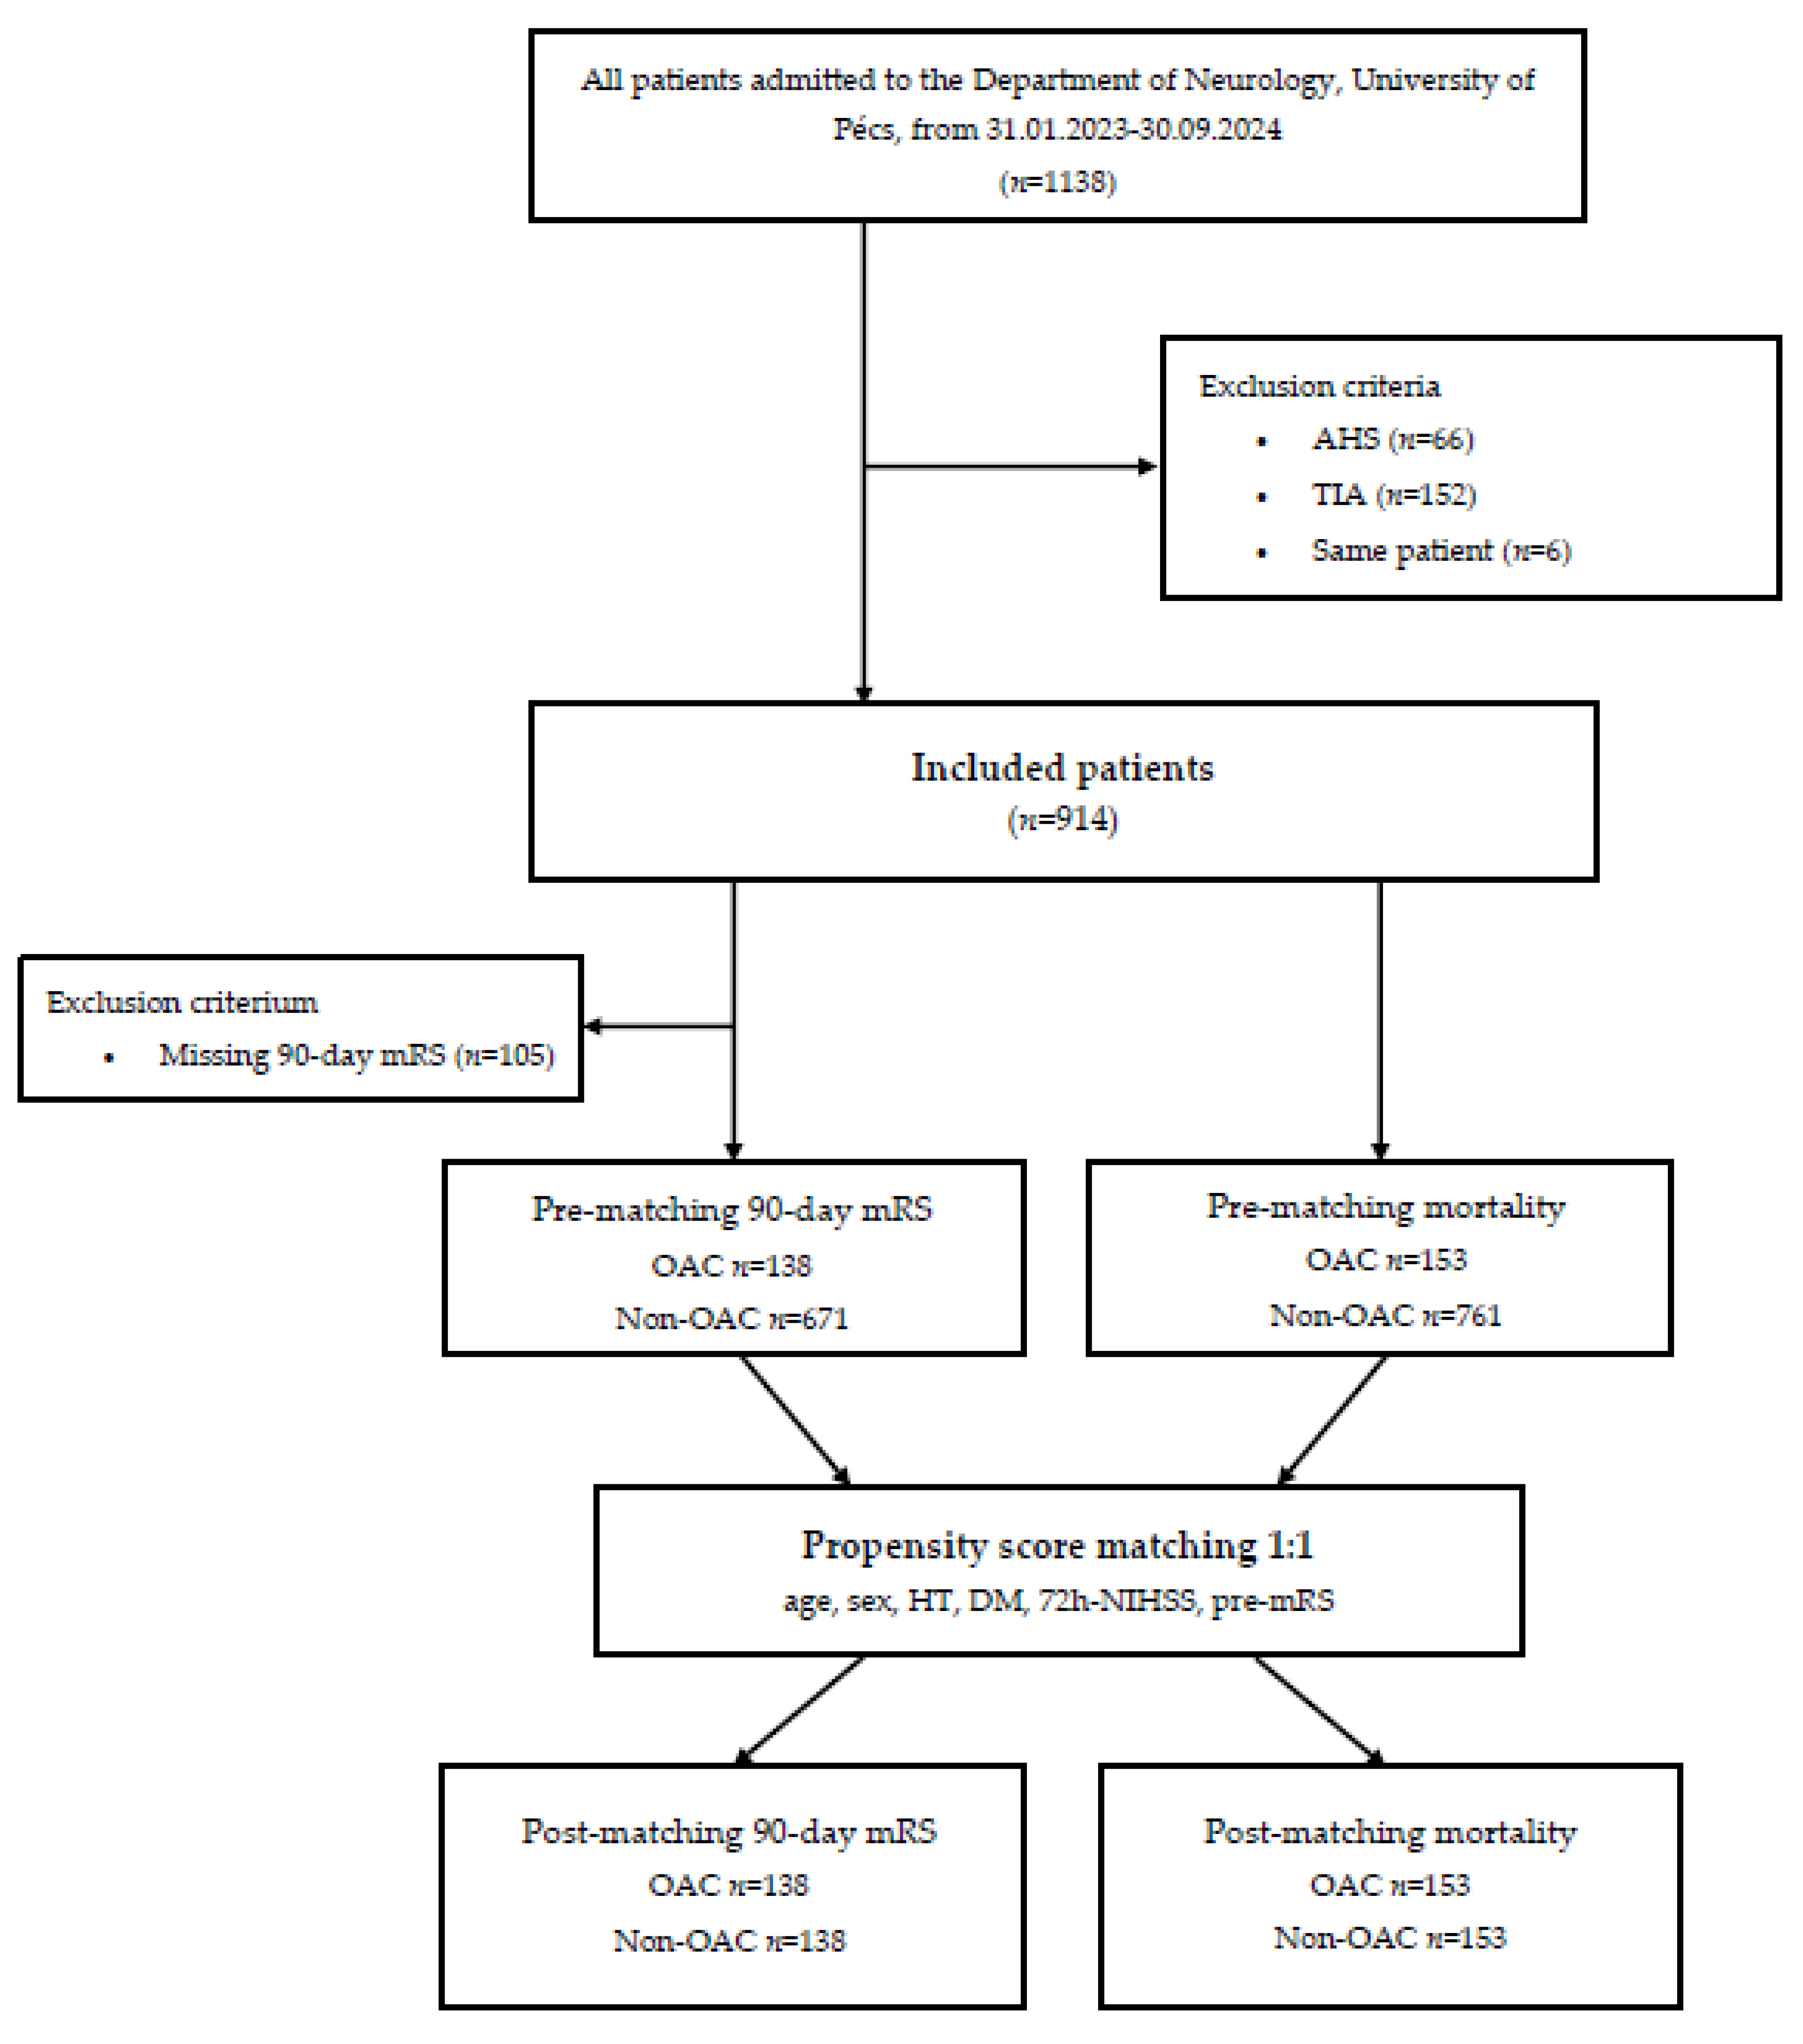
Figure 2.
Distribution of 90-day mRS of 671 Non-OAC and 138 OAC patients. Abbreviations: mRS = modified Rankin Scale, Non-OAC = no oral anticoagulant, OAC = oral anticoagulant.
Figure 2.
Distribution of 90-day mRS of 671 Non-OAC and 138 OAC patients. Abbreviations: mRS = modified Rankin Scale, Non-OAC = no oral anticoagulant, OAC = oral anticoagulant.
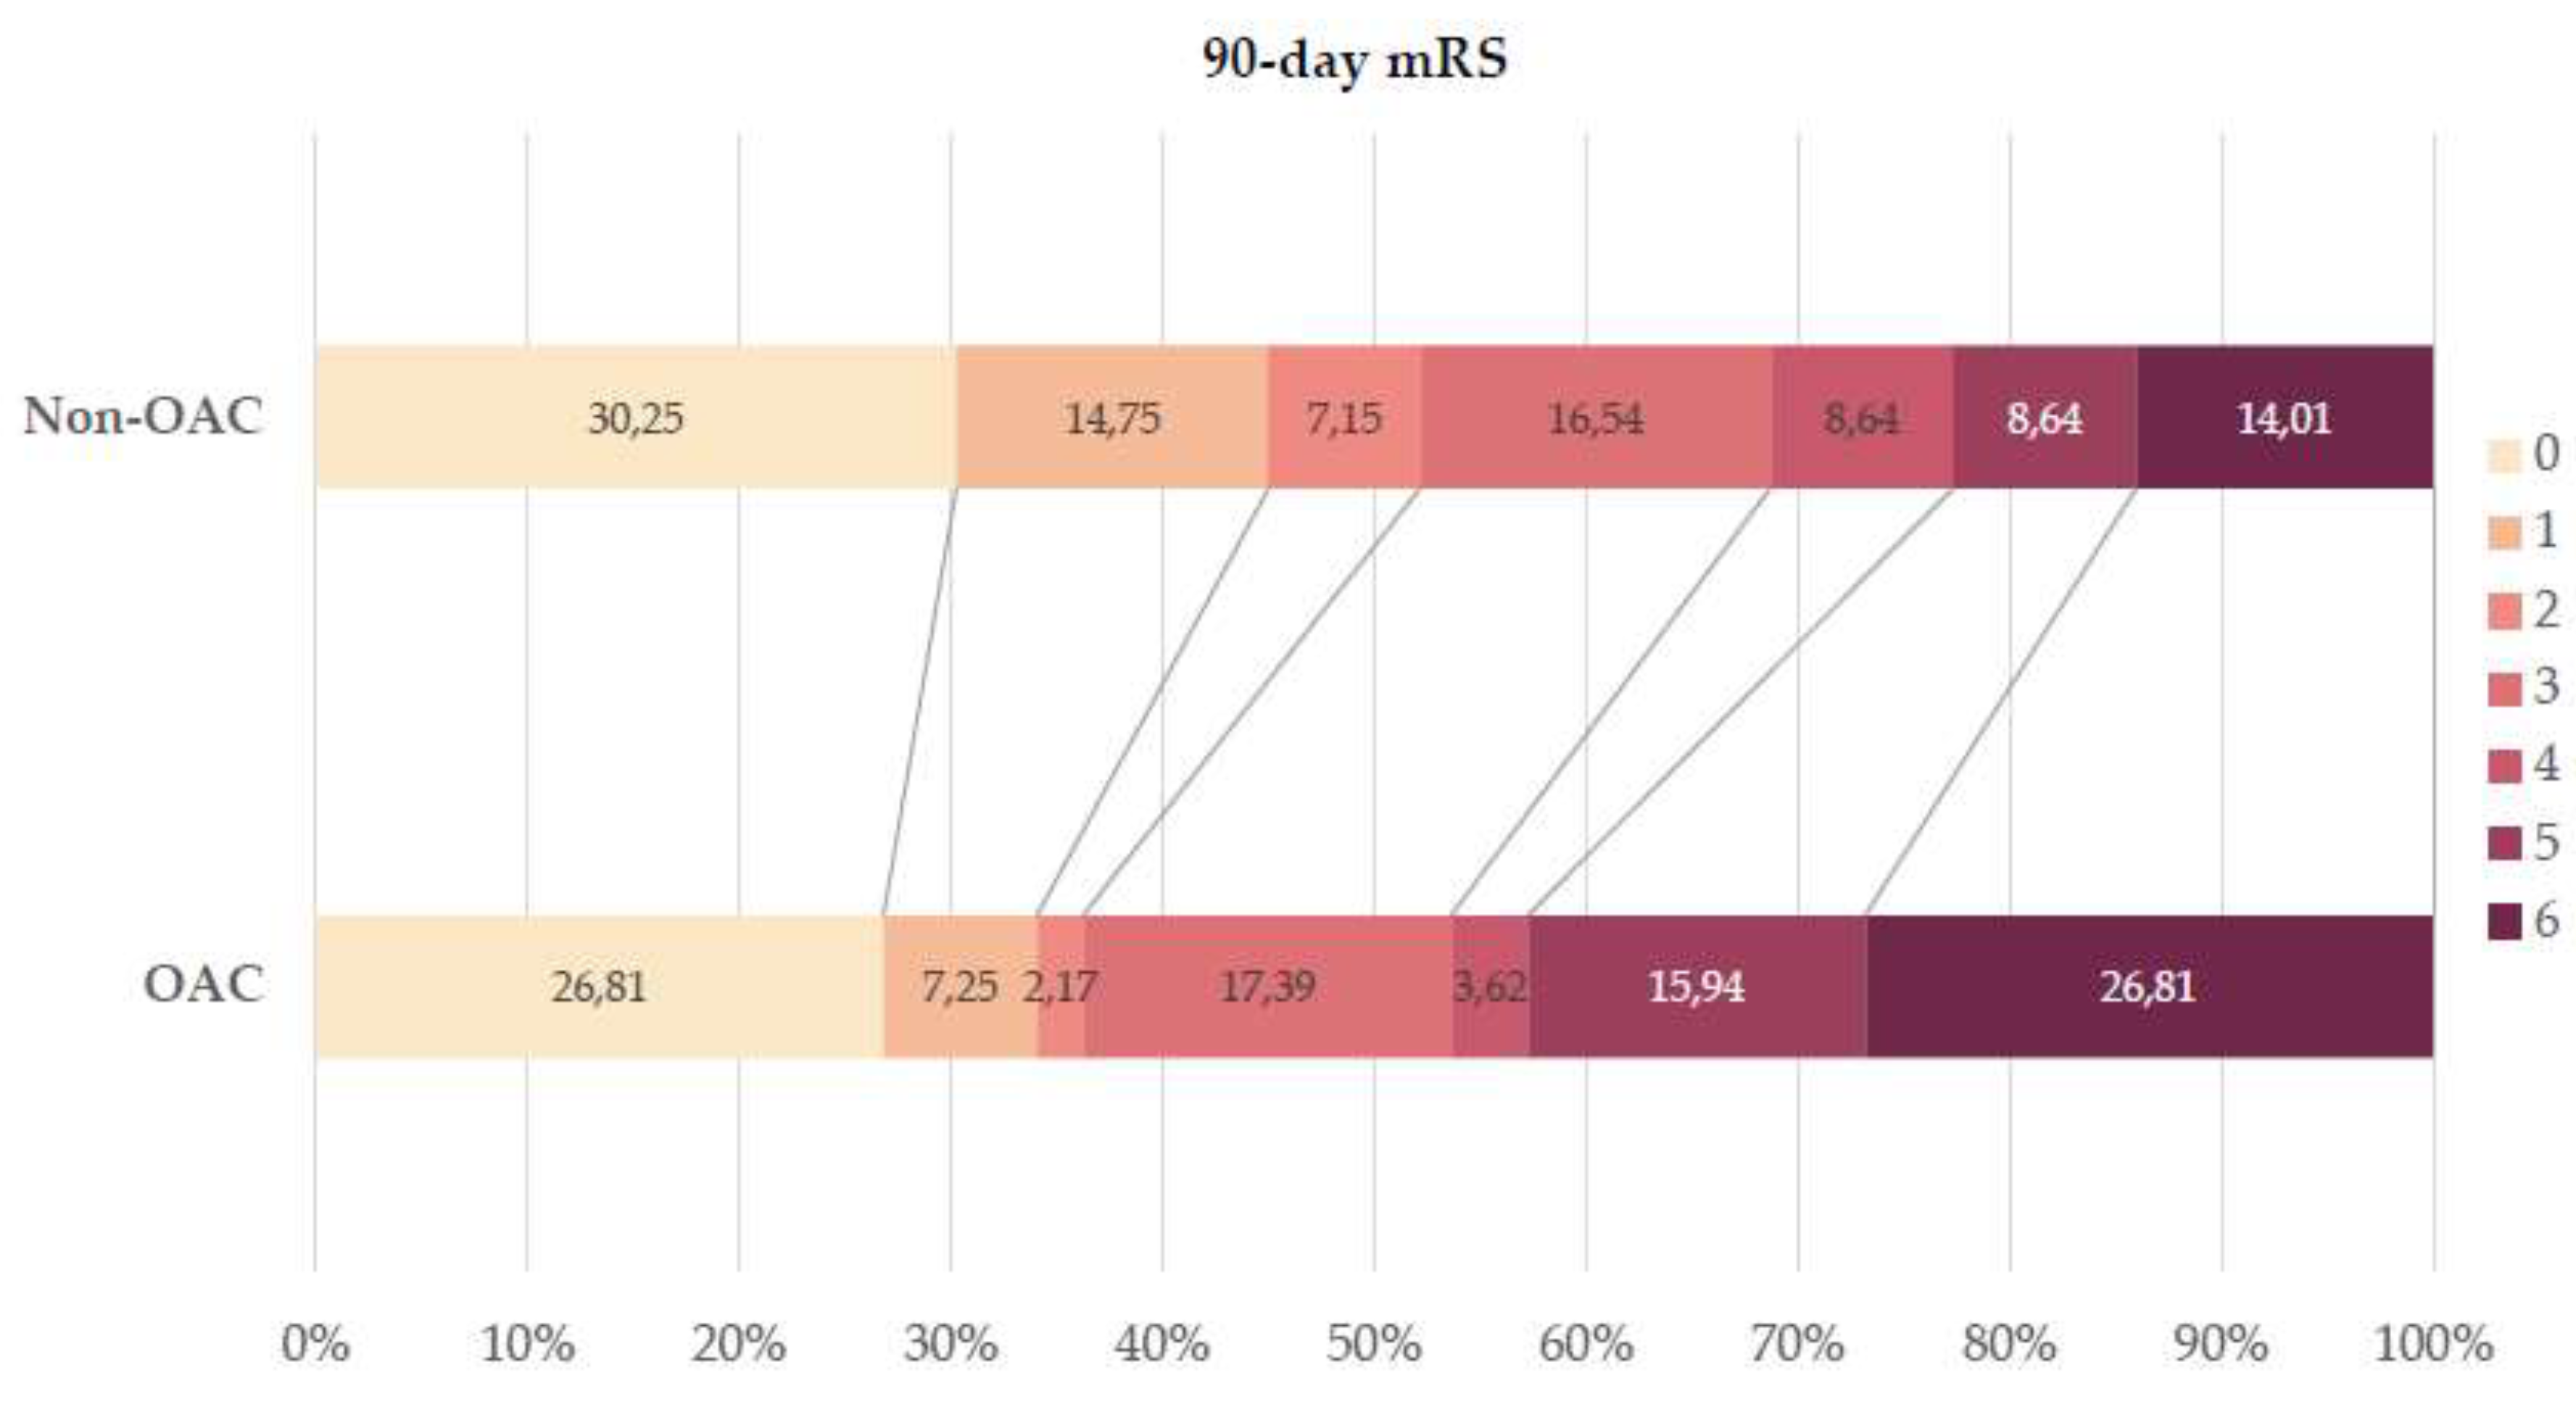
Figure 3.
Standardized mean difference of matched covariates for 90-day mRS analysis. Abbreviations: mRS = modified Rankin Scale, HT = hypertension, DM = diabetes mellitus, NIHSS = National Institutes of Health Stroke Scale, pre-mRS = pre-morbidity modified Rankin Scale.
Figure 3.
Standardized mean difference of matched covariates for 90-day mRS analysis. Abbreviations: mRS = modified Rankin Scale, HT = hypertension, DM = diabetes mellitus, NIHSS = National Institutes of Health Stroke Scale, pre-mRS = pre-morbidity modified Rankin Scale.
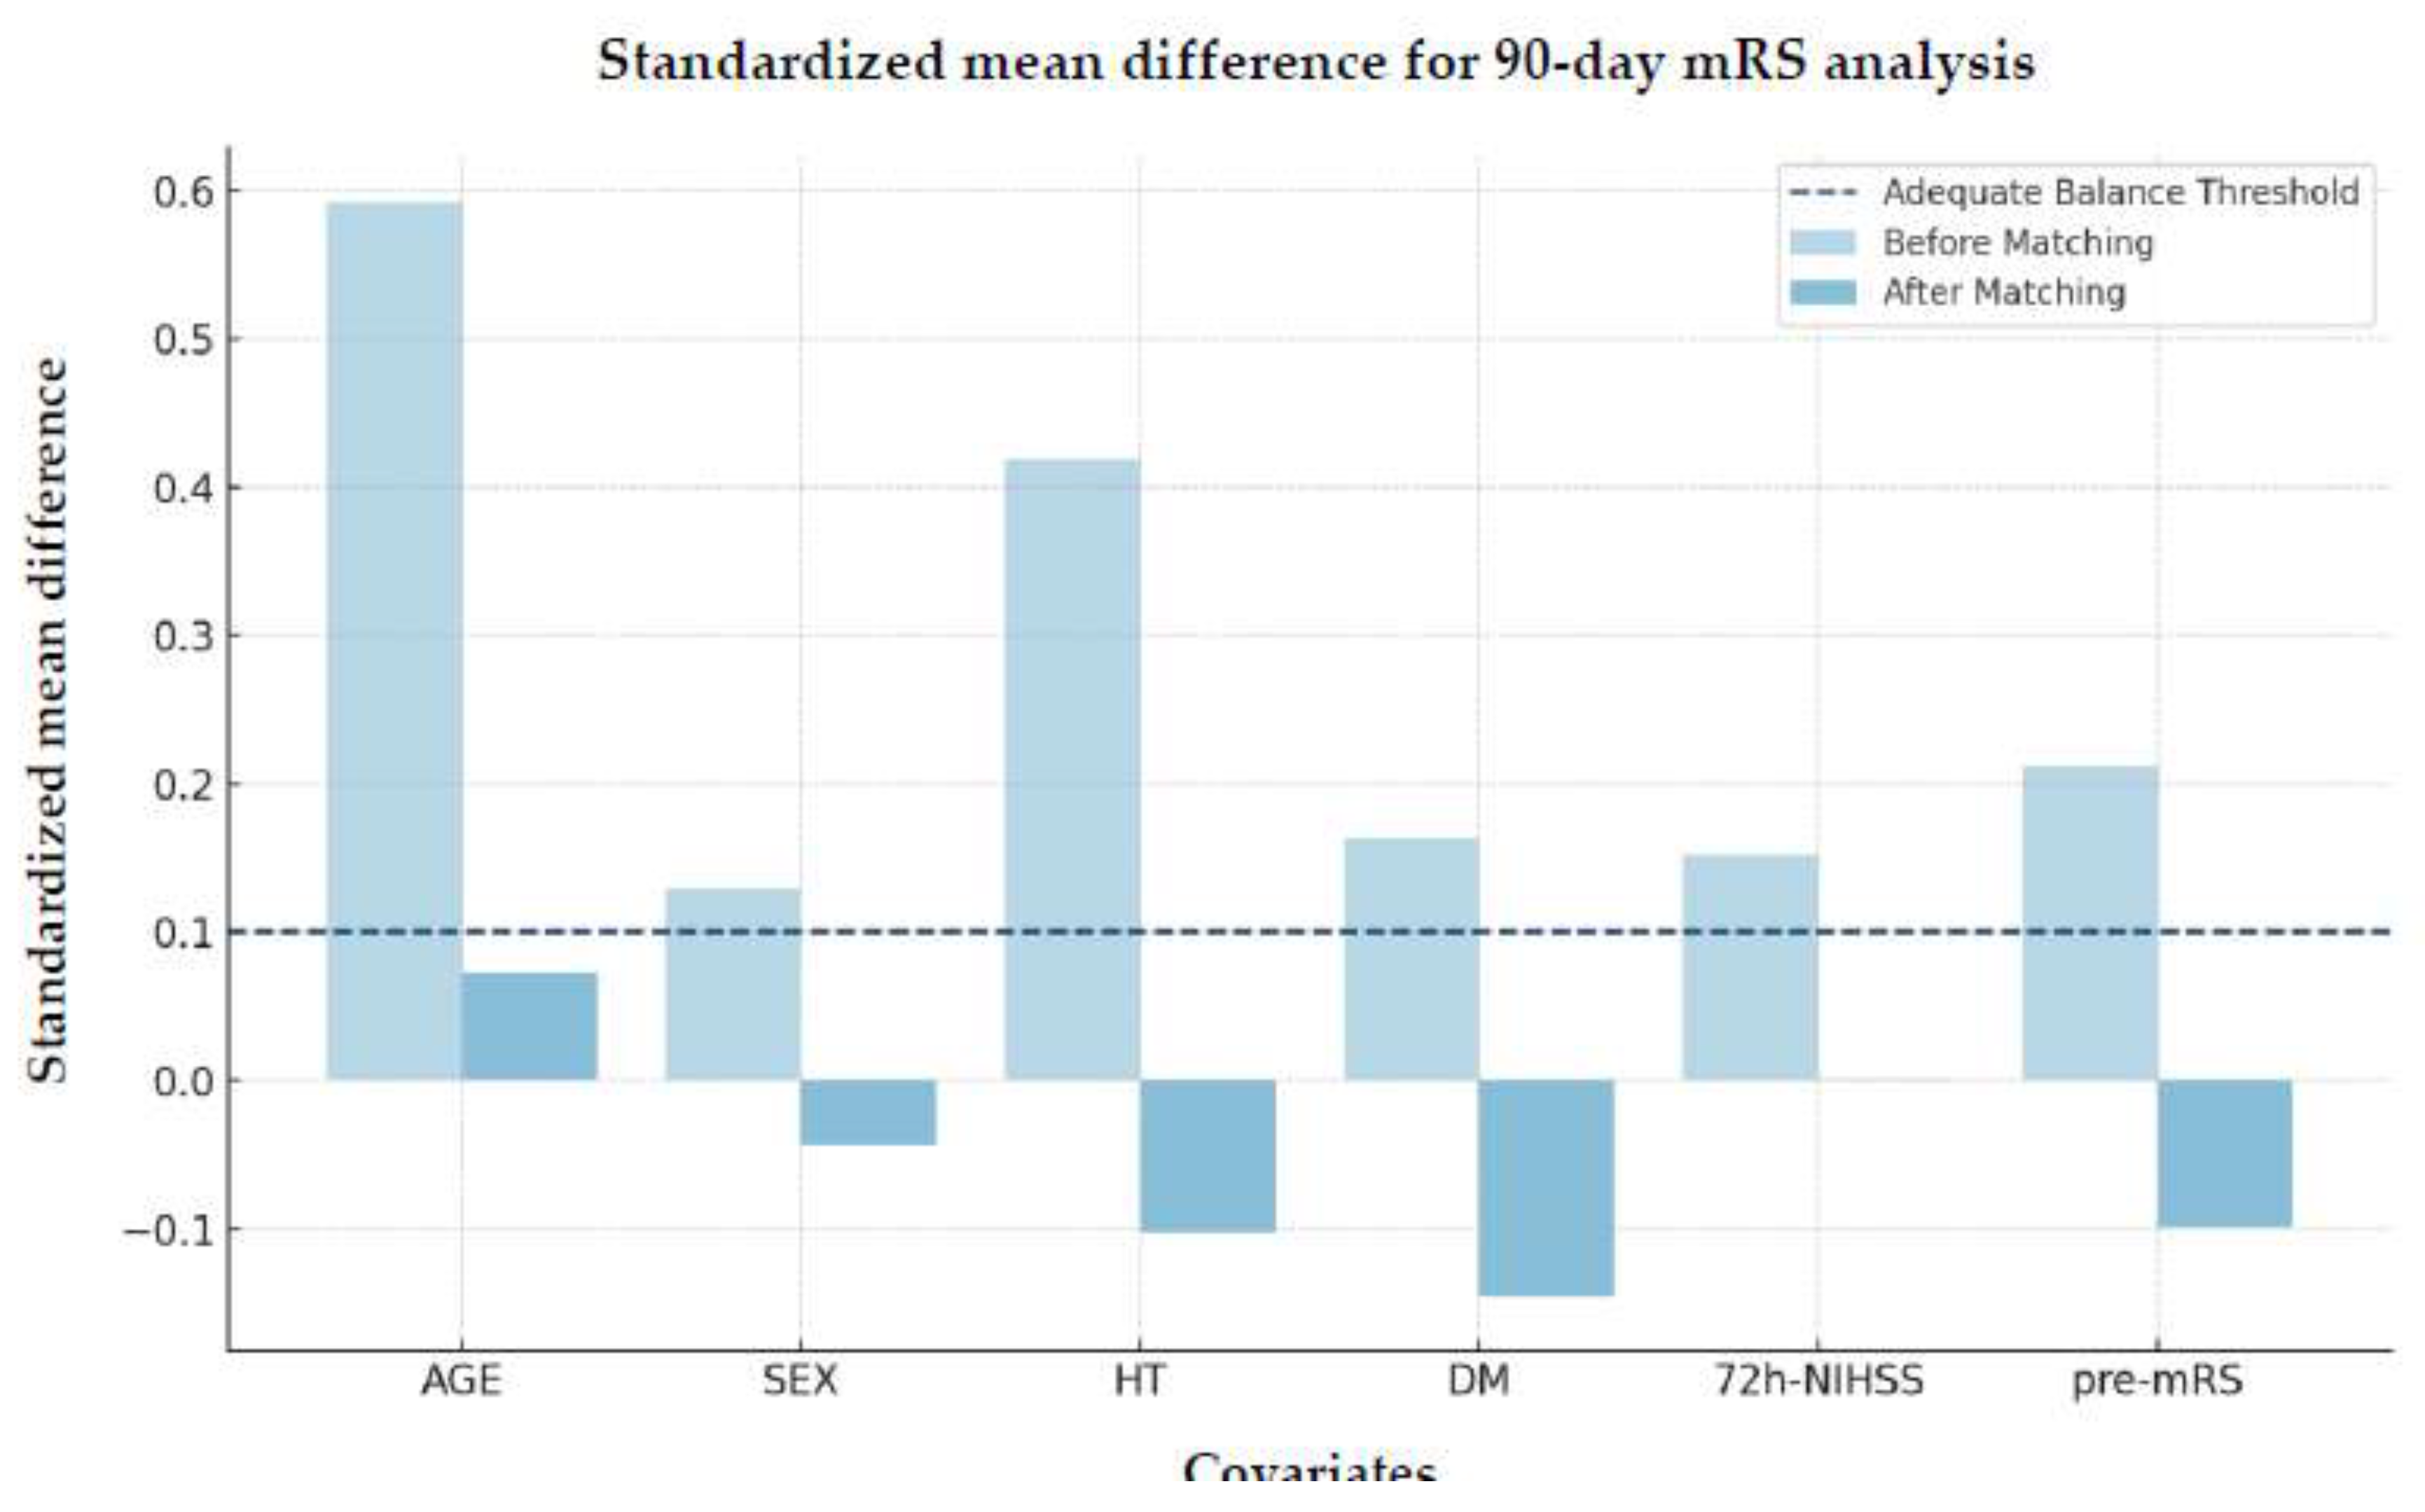
Figure 4.
Receiver Operating Characteristic (ROC) Curve for 90-day mRS analysis. Abbreviations: mRS = modified Rankin Scale, AUC = area under the curve.
Figure 4.
Receiver Operating Characteristic (ROC) Curve for 90-day mRS analysis. Abbreviations: mRS = modified Rankin Scale, AUC = area under the curve.
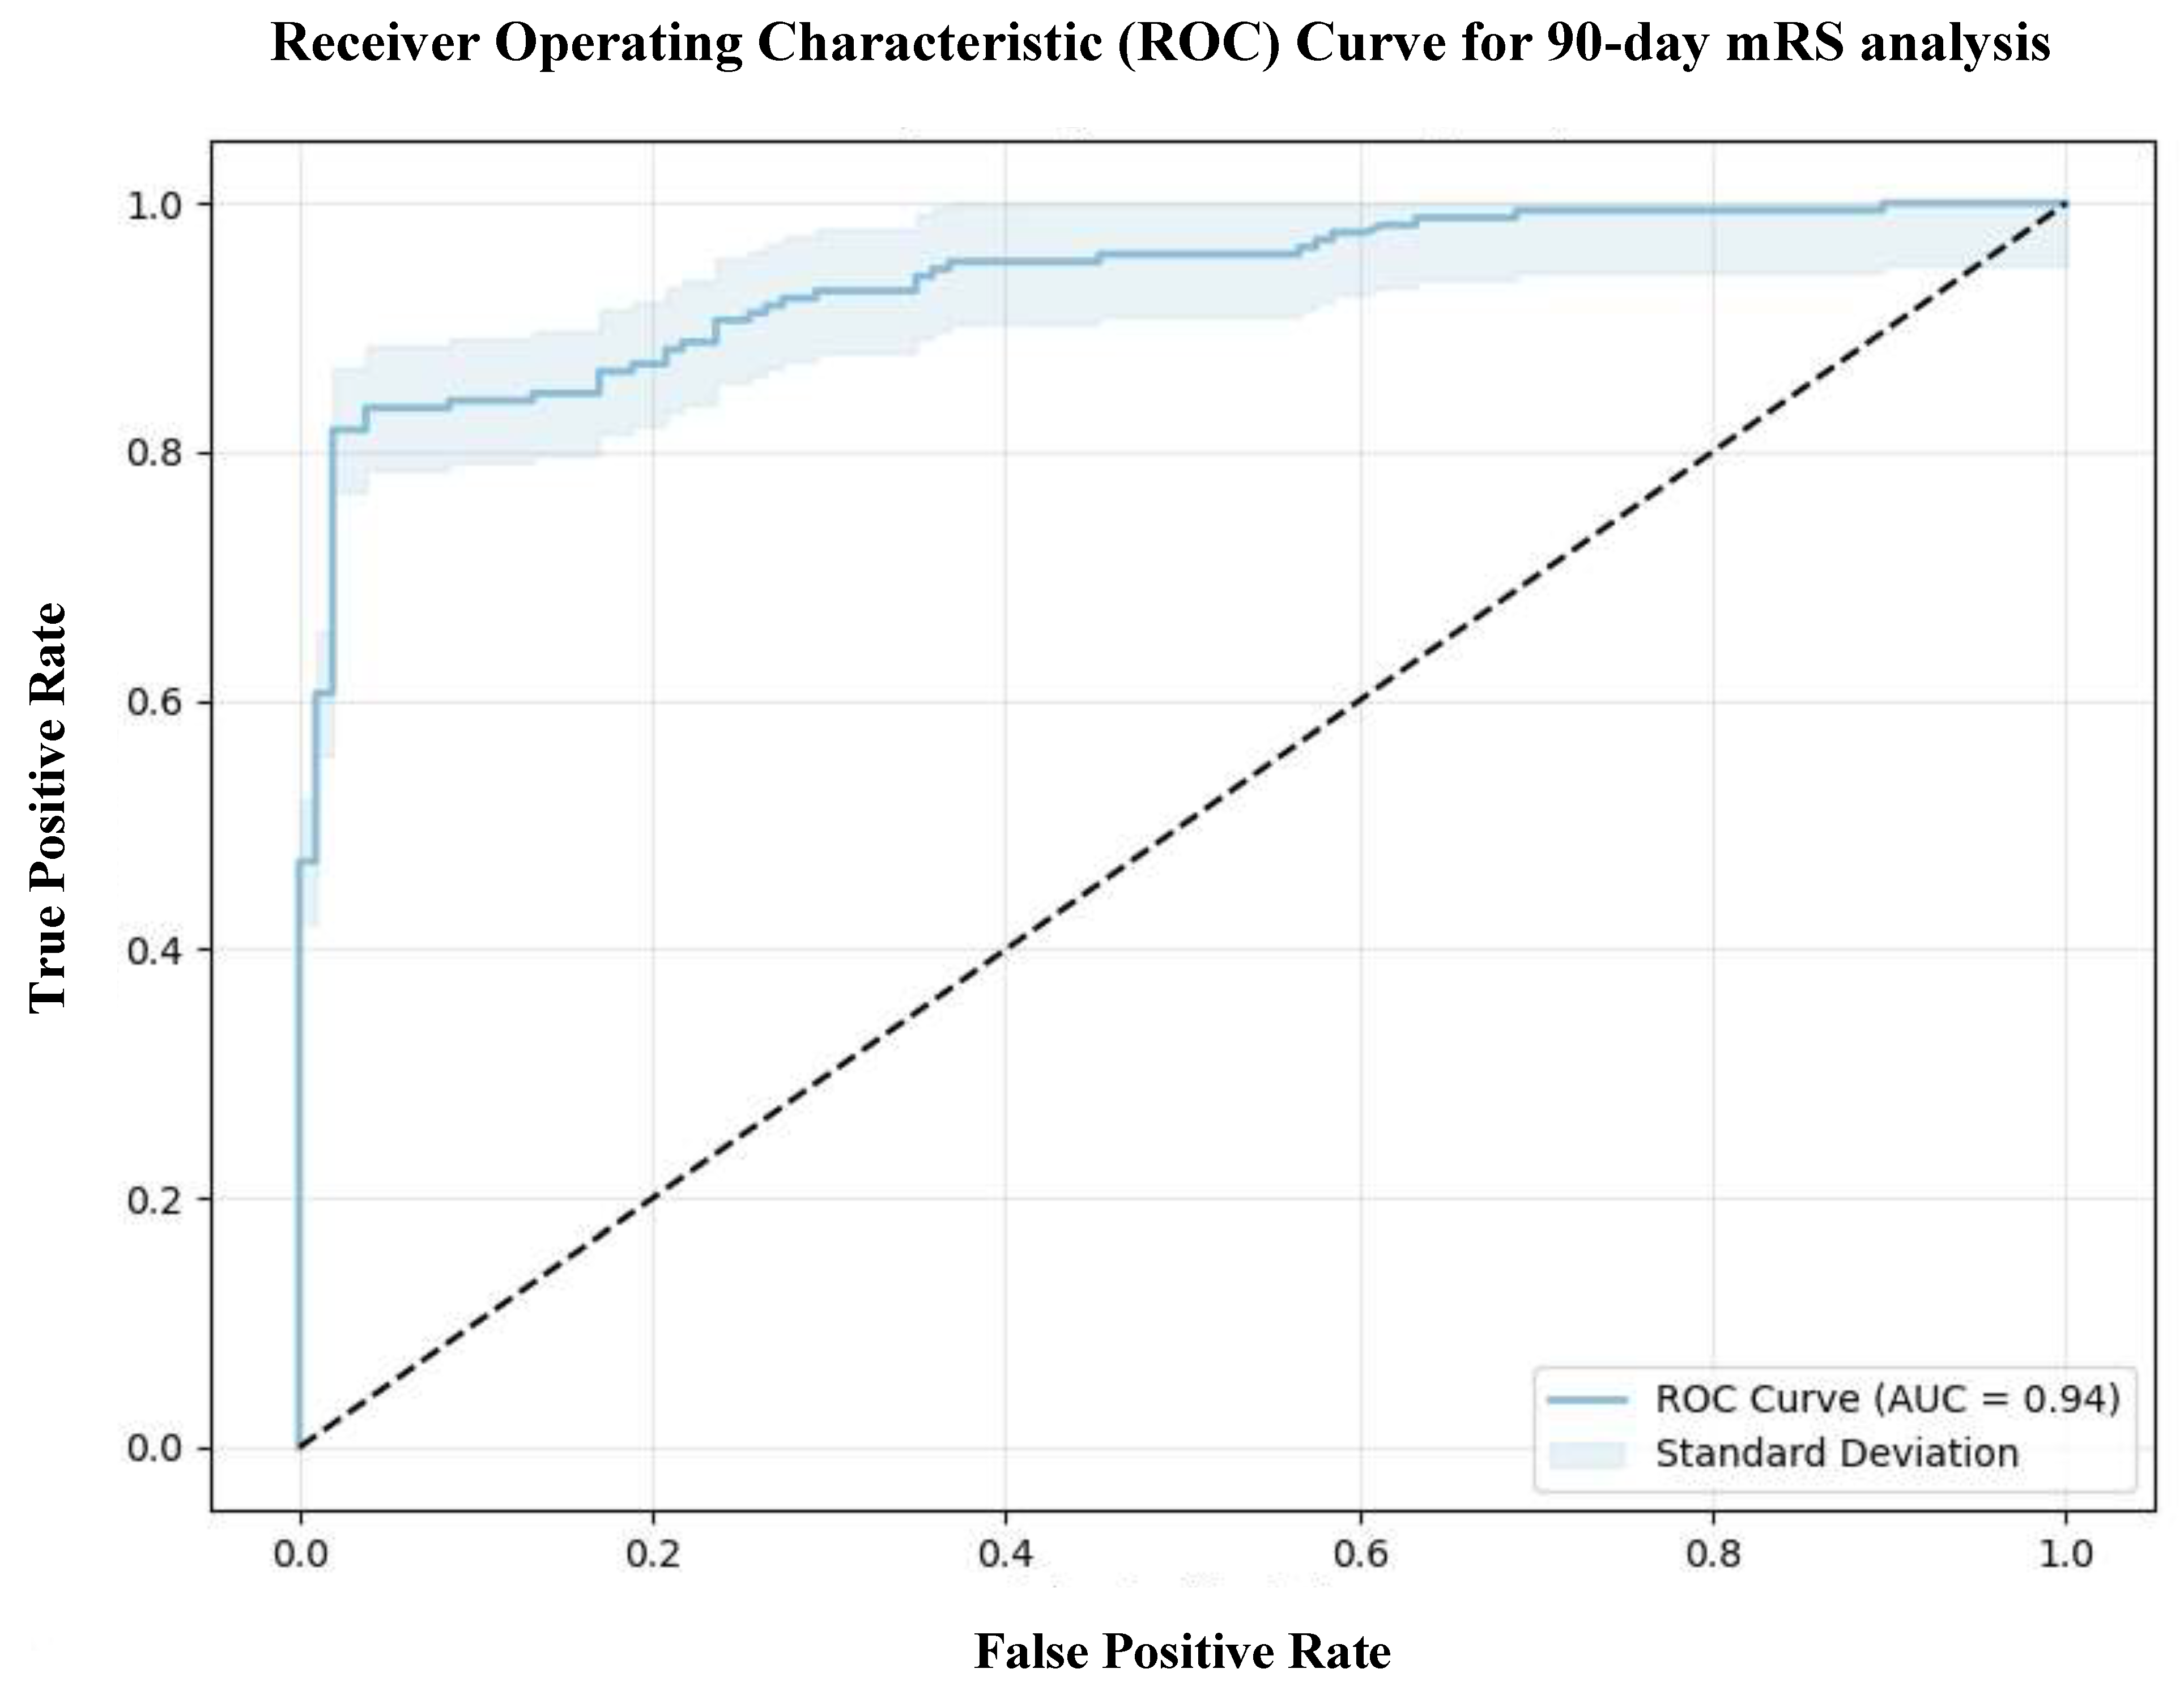
Figure 5.
Standardized mean difference of matched covariates for mortality analysis. Abbreviations: mRS = modified Rankin Scale, HT = hypertension, DM = diabetes mellitus, NIHSS = National Institutes of Health Stroke Scale, pre-mRS = pre-morbidity modified Rankin Scale.
Figure 5.
Standardized mean difference of matched covariates for mortality analysis. Abbreviations: mRS = modified Rankin Scale, HT = hypertension, DM = diabetes mellitus, NIHSS = National Institutes of Health Stroke Scale, pre-mRS = pre-morbidity modified Rankin Scale.
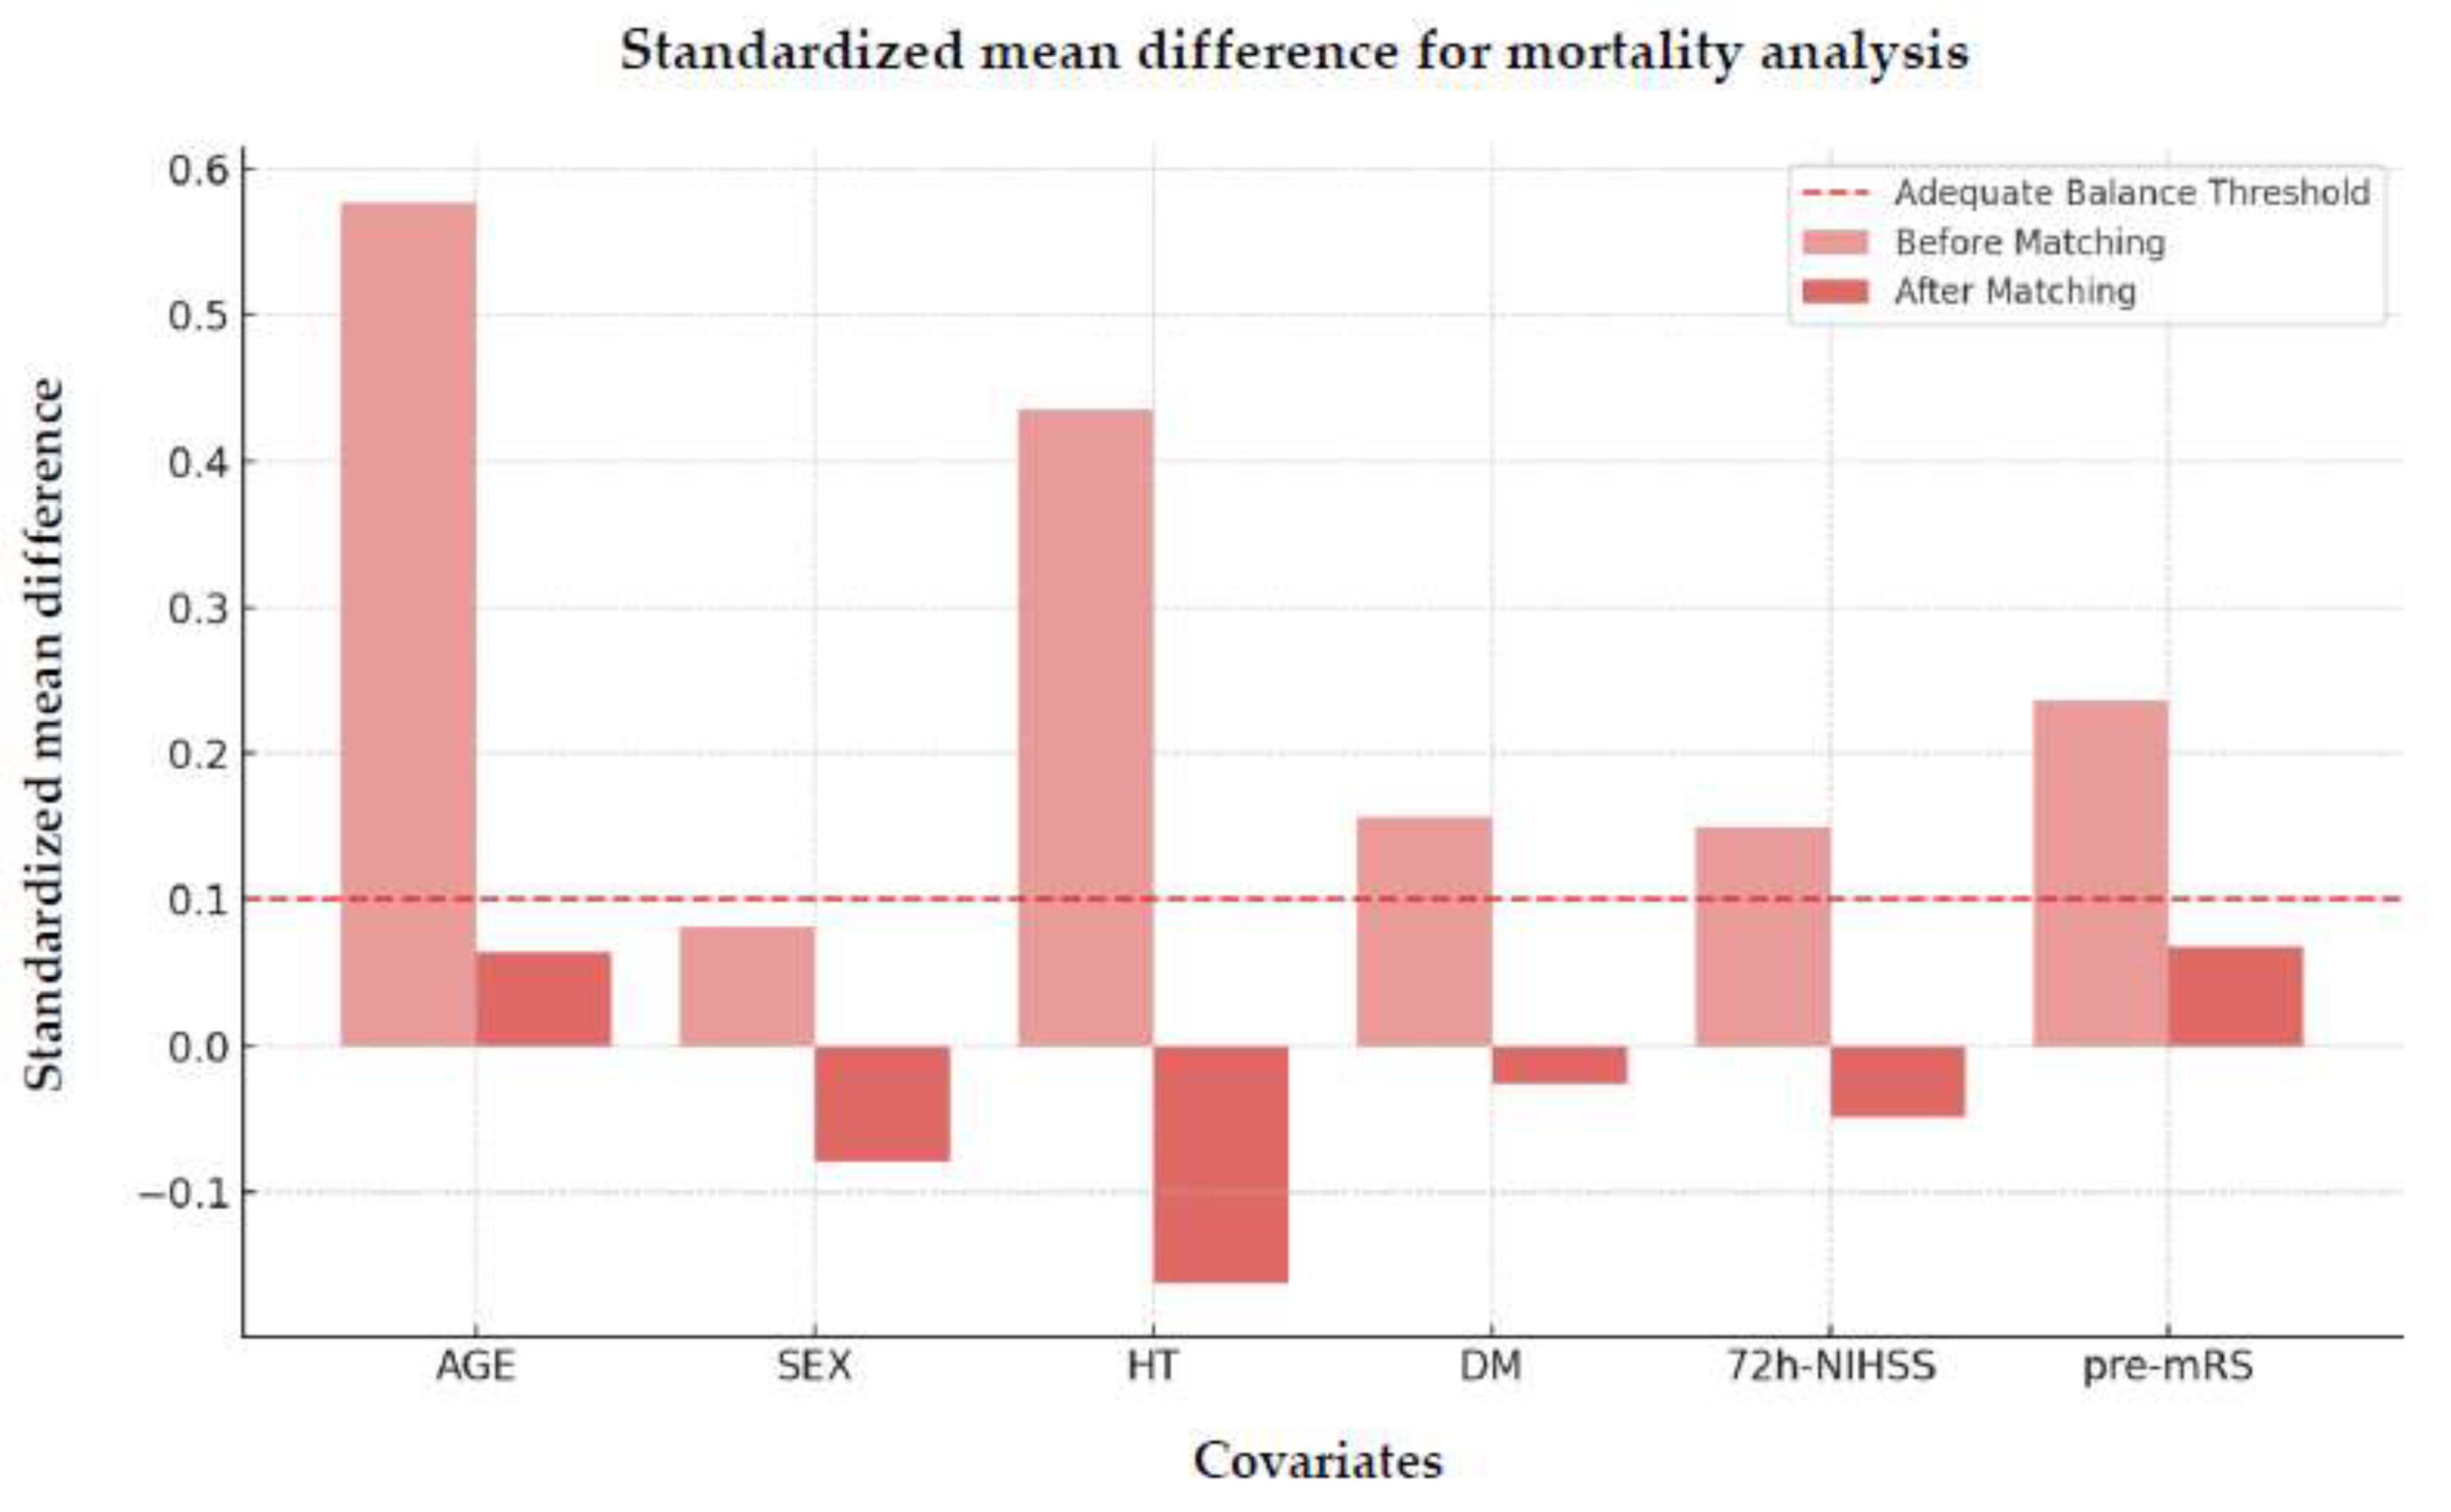
Figure 6.
Receiver Operating Characteristic (ROC) Curve for mortality analysis. Abbreviations: AUC = area under the curve.
Figure 6.
Receiver Operating Characteristic (ROC) Curve for mortality analysis. Abbreviations: AUC = area under the curve.


Table 1.
Demographic and clinical characteristics of 914 patients stratified for no prior OAC use vs. prior OAC use.
Table 1.
Demographic and clinical characteristics of 914 patients stratified for no prior OAC use vs. prior OAC use.
| Non-OAC use (n=761) | OAC use (n=153) | p-Value/OR [95% CI] | |
|---|---|---|---|
| Demographic characteristics | |||
| Age, years, median (IQR) | 71 (30-96) | 78 (44-95) | p<0.001 |
| Sex, male, n (%) | 377 (49.5%) | 70 (45.8%) | OR = 1.16 [0.82-1.65], p=0.393 |
| Medical history, n (%) | |||
| Current smoking | 243 (31.9%) | 20 (13.1%) | OR = 3.12 [1.90-5.11], p<0.001 |
| Alcohol | 234 (30.8%) | 63 (41.2%) | OR = 0.63 [0.44-0.91], p=0.012 |
| Hypertension | 606 (79.6%) | 144 (94.1%) | OR = 0.24 [0.12-0.49], p<0.001 |
| Diabetes mellitus | 256 (33.6%) | 63 (41.2%) | OR = 0.72 [0.51-1.03], p=0.075 |
| pre-mRS score, median (IQR) | 0 (0-5) | 0 (0-5) | p=0.004 |
| pre-mRS score, n (%) | |||
| 0 1 2 >2 |
535 (70.3%) 104 (13.7%) 34 (4.5%) 88 (11.6%) |
90 (58.8%) 21 (13.7%) 17 (11.1%) 25 (16.3%) |
OR = 1.66 [1.16-2.37], p=0.006 OR = 1.00 [0.60-1.65], p=0.985 OR = 0.37 [0.20-0.69], p=0.002 OR = 0.67 [0.41-1.09], p=0.103 |
| Recanalization therapy, n (%) | |||
| IVT MT IVT + MT SC |
212 (27.9%) 137 (18.0%) 63 (8.3%) 349 (45.9%) |
9 (5.9%) 34 (22.2%) 7 (4.6%) 103 (67.3%) |
OR = 6.18 [3.10-12.3], p<0.001 OR = 0.77 [0.50-1.17], p=0.223 OR = 1.89 [0.85-4.20], p=0.122 OR = 0.41 [0.29-0.59], p<0.001 |
| NIHSS score at admission, median (IQR) | 5 (0-40) | 5 (0-39) | p=0.026 |
Abbreviations: Non-OAC = no oral anticoagulant, OAC = oral anticoagulant, OR = (common) odds ratio, IQR = interquartile range, LVO = large vessel occlusion, pre-mRS = pre-morbidity modified Rankin Scale, IVT = intravenous thrombolysis, MT = mechanical thrombectomy, SC = standard care, NIHSS = National Institutes of Health Stroke Scale.
Table 2.
Imaging and stroke characteristics of 914 patients stratified for no prior OAC use vs. prior OAC use.
Table 2.
Imaging and stroke characteristics of 914 patients stratified for no prior OAC use vs. prior OAC use.
| Non-OAC use (n=761) | OAC use (n=153) | p-Value/OR [95% CI] | |
|---|---|---|---|
| mASPECTS, median (IQR) | 10 (1-10), n=610 | 10 (1-10), n=119 | p=0.011 |
| mASPECTS, n (%) | |||
| 1 2 3 4 5 6 7 8 9 10 |
2 (0.3%) 6 (1.0%) 6 (1.0%) 3 (0.5%) 11 (1.8%) 15 (2.5%) 22 (3.6%) 45 (7.4%) 93 (15.3%) 405 (66.4%) |
2 (1.7%) 3 (2.5%) 1 (0.8%) 0 (0.0%) 6 (5.0%) 3 (2.5%) 10 (8.4%) 10 (8.4%) 12 (10.1%) 72 (60.5%) |
OR = 0.19 [0.03-1.38], p=0.101 OR = 0.38 [0.09-1.56], p=0.180 OR = 1.17 [0.14-9.83], p=0.884 p=0.573 OR = 0.35 [0.13-0.95], p=0.040 OR = 0.97 [0.28-3.42], p=0.968 OR = 0.41 [0.19-0.89], p=0.023 OR = 0.87 [0.42-1.78], p=0.698 OR = 1.60 [0.85-3.03], p=0.146 OR = 1.29 [0.86-1.93], p=0.217 |
| mCTA collateral score, n (%) | n=503 | n=102 | |
| 4-5 2-3 0-1 |
439 (87.3%) 54 (10.7%) 10 (2.0%) |
82 (80.4%) 16 (15.7%) 4 (3.9%) |
OR = 1.67 [0.96-2.91], p=0.069 OR = 0.65 [0.35-1.18], p=0.157 OR = 0.50 [0.15-1.62], p=0.245 |
| TOAST classification, n (%) | |||
| Cardioembolic stroke | 205 (26.9%) | 111 (72.6%) | OR = 0.14 [0.09-0.21], p<0.001 |
| Large artery atherosclerosis | 197 (25.9%) | 17 (11.1%) | OR = 2.79 [1.65-4.75], p<0.001 |
| Occlusion site, n (%) | 284 (37.3%) | 61 (39.9%) | OR = 0.90 [0.63-1.28], p=0.584 |
| MCA (M1/2/3) ICA (ACI) Tandem (ACI, ACM) ACA/PCA BA/VA |
180 (63.4%) 34 (12.0%) 16 (5.6%) 23 (8.1%) 31 (10.9%) |
38 (62.3%) 10 (16.4%) 3 (4.9%) 4 (6.6%) 6 (9.8%) |
OR = 1.05 [0.59-1.85], p=0.884 OR = 0.69 [0.32-1.49], p=0.396 OR = 1.15 [0.33-4.09], p=1 OR = 1.26 [0.42-3.77], p=0.799 OR = 1.12 [0.45-2.82], p=1 |
| Time metrics (min), median (IQR) | |||
| Onset-admission Door-needle-time Door-puncture-time |
307 54 132.5 |
290 45 125 |
p=0.597 p=0.097 p=0.108 |
Abbreviations: Non-OAC = no oral anticoagulant, OAC = oral anticoagulant, OR = (common) odds ratio, mASPECTS = manual Alberta Stroke Program Early CT Score, IQR = interquartile range, mCTA = multiphase computed tomography angiography, TOAST = Trial of Org 10172 in Acute Stroke Treatment, MCA = middle cerebral artery, ICA = internal carotic artery, ACA = anterior cerebral artery, PCA = posterior cerebral artery, BA = basal artery, VA = vertebral artery
Table 3.
Functional results and safety outcome of 914 patients stratified for no prior OAC use vs. prior OAC use.
Table 3.
Functional results and safety outcome of 914 patients stratified for no prior OAC use vs. prior OAC use.
| Non-OAC use (n=761) | OAC use (n=153) | p-Value/OR [95% CI] | |
|---|---|---|---|
| Functional results | |||
| 90-day mRS score, median (IQR) | 2 (0-6) n=671 | 3 (0-6) n=138 | p<0.001 |
| 90-day mRS score 0-2, n (%) | 350 (52.2%) | 47 (34.1%) | OR = 1.53 [1.07-2.19], p=0.018 |
| IVT MT IVT + MT SC |
125 (18.6%) 41 (6.1%) 29 (4.3%) 155 (23.1%) |
4 (8.5%) 5 (10.6%) 1 (2.1%) 37 (78.7%) |
OR = 4.20 [1.48-11.9], p=0.003 OR = 1.10 [0.41-2.93], p=1 OR = 3.89 [0.52-29.3], p=0.231 OR = 0.56 [0.35-0.90], p=0.017 |
| 90-day mRS score >2, n (%) | 321 (47.8%) | 91 (65.9%) | OR = 0.73 [0.54-0.98], p=0.036 |
| Mortality at 90 days, n (%) | 94 (12.4%) | 41 (26.8%) | OR = 0.46 [0.31-0.69], p<0.001 |
| 72h NIHSS score, median (IQR) | 2 (0-42) | 3 (0-39) | p=0.083 |
| NIHSS ≤1, n (%) | 285 (37.5%) | 52 (34.0%) | OR = 1.10 [0.78-1.55], p=0.606 |
| IVT MT IVT + MT SC |
110 (38.6%) 28 (9.8%) 19 (6.7%) 128 (44.9%) |
5 (9.6%) 6 (11.5%) 1 (1.9%) 40 (76.9%) |
OR = 4.01 [1.56-10.3], p=0.002 OR = 0.85 [0.34-2.16], p=0.804 OR = 3.47 [0.45-26.5], p=0.331 OR = 0.58 [0.37-0.93], p=0.027 |
| ΔNIHSS ≥4, n (%) | 199 (26.1%) | 44 (28.8%) | OR = 0.91 [0.63-1.32], p=0.631 |
| IVT MT IVT + MT SC |
59 (29.7%) 53 (26.6%) 24 (12.1%) 63 (31.7%) |
3 (6.8%) 16 (36.4%) 3 (6.8%) 22 (50.0%) |
OR = 4.35 [1.30-14.5], p=0.009 OR = 0.73 [0.38-1.40], p=0.387 OR = 1.77 [0.51-6.13], p=0.591 OR = 0.63 [0.35-1.14], p=0.156 |
| Safety outcome | |||
| ICH, n (%) sICH aICH HI PH HI and PH SAH |
34 (4.5%) 5 (14.7%) 29 (85.3%) 15 (44.1%) 15 (44.1%) 1 (2.9%) 3 (8.8%) |
8 (5.2%) 2 (25.0%) 6 (75.0%) 4 (50.0%) 3 (37.5%) 0 (0.0%) 1 (12.5%) |
OR = 0.85 [0.39-1.88], p=0.674 OR = 0.59 [0.10-3.60], p=0.620 OR = 1.14 [0.35-3.66], p=1 OR = 0.88 [0.23-3.39], p=1 OR = 1.18 [0.27-5.06], p=1 p=1 OR = 0.71 [0.06-7.71], p=1 |
Abbreviations: Non-OAC = no oral anticoagulant, OAC = oral anticoagulant, OR = (common) odds ratio, mRS = modified Rankin Scale, NIHSS = National Institutes of Health Stroke Scale, IQR = interquartile range, IVT = intravenous thrombolysis, MT = mechanical thrombectomy, SC = standard care, ICH = intracranial hemorrhage, sICH = symptomatic intracranial hemorrhage, aICH = asymptomatic intracranial hemorrhage, HI = hemorrhagic infarction, PH = parenchymal hemorrhage, SAH = subarachnoid hemorrhage
Table 4.
Variance Ratio and Kolmogorov-Smirnov test results.
| Variance Ratio | ||
|---|---|---|
| Before Matching | After Matching | |
| Age | 0.836 | 1.072 |
| Sex | 0.989 | 1.014 |
| HT | 0.351 | 1.564 |
| DM | 1.091 | 0.975 |
| 72h-NIHSS score | 1.155 | 0.827 |
| pre-mRS score | 1.264 | 0.783 |
| Kolmogorov-Smirnov test | ||
| Before Matching | After Matching | |
| p-Value | p-Value | |
| Age | p<0.001 | p=0.775 |
| Sex | p=0.700 | p=1 |
| HT | p=0.025 | p=1 |
| DM | p=0.439 | p=0.864 |
| 72h-NIHSS score | p=0.152 | p=0.676 |
| pre-mRS score | p=0.147 | p=0.932 |
Abbreviations: HT = hypertension, DM = diabetes mellitus, NIHSS = National Institutes of Health Stroke Scale, pre-mRS = pre-morbidity modified Rankin Scale
Table 5.
Logistic regression and bootstrapping analysis for mRS 0-2 of the 90-day mRS cohort (n=276).
Table 5.
Logistic regression and bootstrapping analysis for mRS 0-2 of the 90-day mRS cohort (n=276).
| Coefficient | Standard Error | p-Value | 95% CI lower | 95% CI upper | Bootstrap CI (2.5%) | Bootstrap CI (97.5%) | |
|---|---|---|---|---|---|---|---|
| Constant OAC use Sex Age HT DM 72h-NIHSS score pre-mRS score |
-6.9852 0.8157 0.5665 0.0386 0.2386 0.8217 0.5696 1.1331 |
1.949 0.404 0.427 0.023 1.020 0.406 0.094 0.230 |
p<0.001 p=0.043 p=0.184 p=0.087 p=0.815 p=0.043 p<0.001 p<0.001 |
-10.806 0.025 0.270 -0.006 -1.760 0.027 0.386 0.683 |
-3.164 1.607 1.403 0.083 2.237 1.617 0.754 1.584 |
-12.761 0.108 -0.403 -0.013 -1.537 0.015 0.439 0.774 |
-3.710 1.747 1.629 0.107 2.352 1.763 0.897 1.716 |
Abbreviations: CI = confidence interval, OAC = oral anticoagulant, HT = hypertension, DM = diabetes mellitus, NIHSS = National Institutes of Health Stroke Scale, pre-mRS = pre-morbidity modified Rankin Scale.
Table 6.
Variance Ratio and Kolmogorov-Smirnov test results.
| Variance Ratio | ||
|---|---|---|
| Before Matching | After Matching | |
| Age | 0.816 | 1.052 |
| Sex | 0.998 | 1.020 |
| HT | 0.345 | 2.174 |
| DM | 1.091 | 0.991 |
| 72h-NIHSS score | 1.181 | 0.704 |
| pre-mRS score | 1.289 | 0.895 |
| Kolmogorov-Smirnov test | ||
| Before Matching | After Matching | |
| p-Value | p-Value | |
| Age | p<0.001 | p=0.901 |
| Sex | p=0.975 | p=0.999 |
| HT | p=0.010 | p=0.999 |
| DM | p=0.441 | p=1 |
| 72h-NIHSS score | p=0.125 | p=0.985 |
| pre-mRS score | p=0.073 | p=0.736 |
Abbreviations: HT = hypertension, DM = diabetes mellitus, NIHSS = National Institutes of Health Stroke Scale, pre-mRS = pre-morbidity modified Rankin Scale
Table 7.
Logistic regression and bootstrapping analysis for mRS = 6 of the mortality cohort (n=306).
Table 7.
Logistic regression and bootstrapping analysis for mRS = 6 of the mortality cohort (n=306).
| Coefficient | Standard Error | p-Value | 95% CI lower |
95% CI upper |
Bootstrap CI (2.5%) | Bootstrap CI (97.5%) | |
|---|---|---|---|---|---|---|---|
| Constant OAC use Sex Age HT DM 72h-NIHSS score pre-mRS score |
-11.2061 0.3812 -0.7150 0.1140 0.1066 0.5031 0.1937 0.0786 |
2.250 0.373 0.387 0.026 1.079 0.396 0.029 0.134 |
p<0.001 p=0.307 p=0.065 p<0.001 p=0.921 p=0.203 p<0.001 p=0.557 |
-15.615 -0.350 -1.473 0.064 -2.007 -0.272 0.136 -0.184 |
-6.797 1.113 0.043 0.164 2.221 1.279 0.251 0.341 |
-28.148 -0.393 -1.648 0.072 -1.706 -0.324 0.152 -0.233 |
-7.902 1.227 -0.001 0.194 15.508 1.376 0.273 0.380 |
Abbreviations: CI = confidence interval, OAC = oral anticoagulant, HT = hypertension, DM = diabetes mellitus, NIHSS = National Institutes of Health Stroke Scale, pre-mRS = pre-morbidity modified Rankin Scale.
Disclaimer/Publisher’s Note: The statements, opinions and data contained in all publications are solely those of the individual author(s) and contributor(s) and not of MDPI and/or the editor(s). MDPI and/or the editor(s) disclaim responsibility for any injury to people or property resulting from any ideas, methods, instructions or products referred to in the content. |
© 2025 by the authors. Licensee MDPI, Basel, Switzerland. This article is an open access article distributed under the terms and conditions of the Creative Commons Attribution (CC BY) license (http://creativecommons.org/licenses/by/4.0/).
Copyright: This open access article is published under a Creative Commons CC BY 4.0 license, which permit the free download, distribution, and reuse, provided that the author and preprint are cited in any reuse.


