
Submitted:
10 January 2025
Posted:
13 January 2025
You are already at the latest version
Abstract
Distinguished for its nutritional benefits and high economic value, olive oil has faced issues with adulteration and fraud. As production increases, the need to identify olive oil by specific cultivars and regions has become more pressing. Analyzing chemical data related to the origin and olive cultivars will facilitate advanced quality control and authenticity practices for Albanian olive oil, enhancing its competitiveness as an organic product. While traditional empirical methods have been relied upon to detect olive oil fraud and evaluate quality, this study pioneers a modern approach using machine learning algorithms to differentiate authentic products from counterfeits. Establishing effective mechanisms and best practices to trace product origins and quality indicators will raise awareness about the risks of adulteration to both consumers' health and the broader food industry.
To enhance the precision of origin predictions, the importance of data pre-processing steps—especially the normalization process following the isolation of independent features from the target variable- particularly crucial for distance-based algorithms like kNN that improve accuracy. Furthermore, performance metrics for all algorithms were evaluated, including k-Nearest Neighbors, Logistic Regression, Support Vector Machines, implement hyperparameter tuning techniques, and the best-performing model. Application of supervised machine-learning methods to categorize Albanian olive oils (OO) according to their chemical composition, aiding in identifying their geographical and cultivar origin. Our results indicate an accuracy of 62.5%, constrained by the limitations of the current dataset; however, we intend to expand the dataset in the future.
Keywords:
Olive oil
; Authenticity
; Machine Learning
; kNN
; Logistic Regression
; SVM
; Albania
Introduction
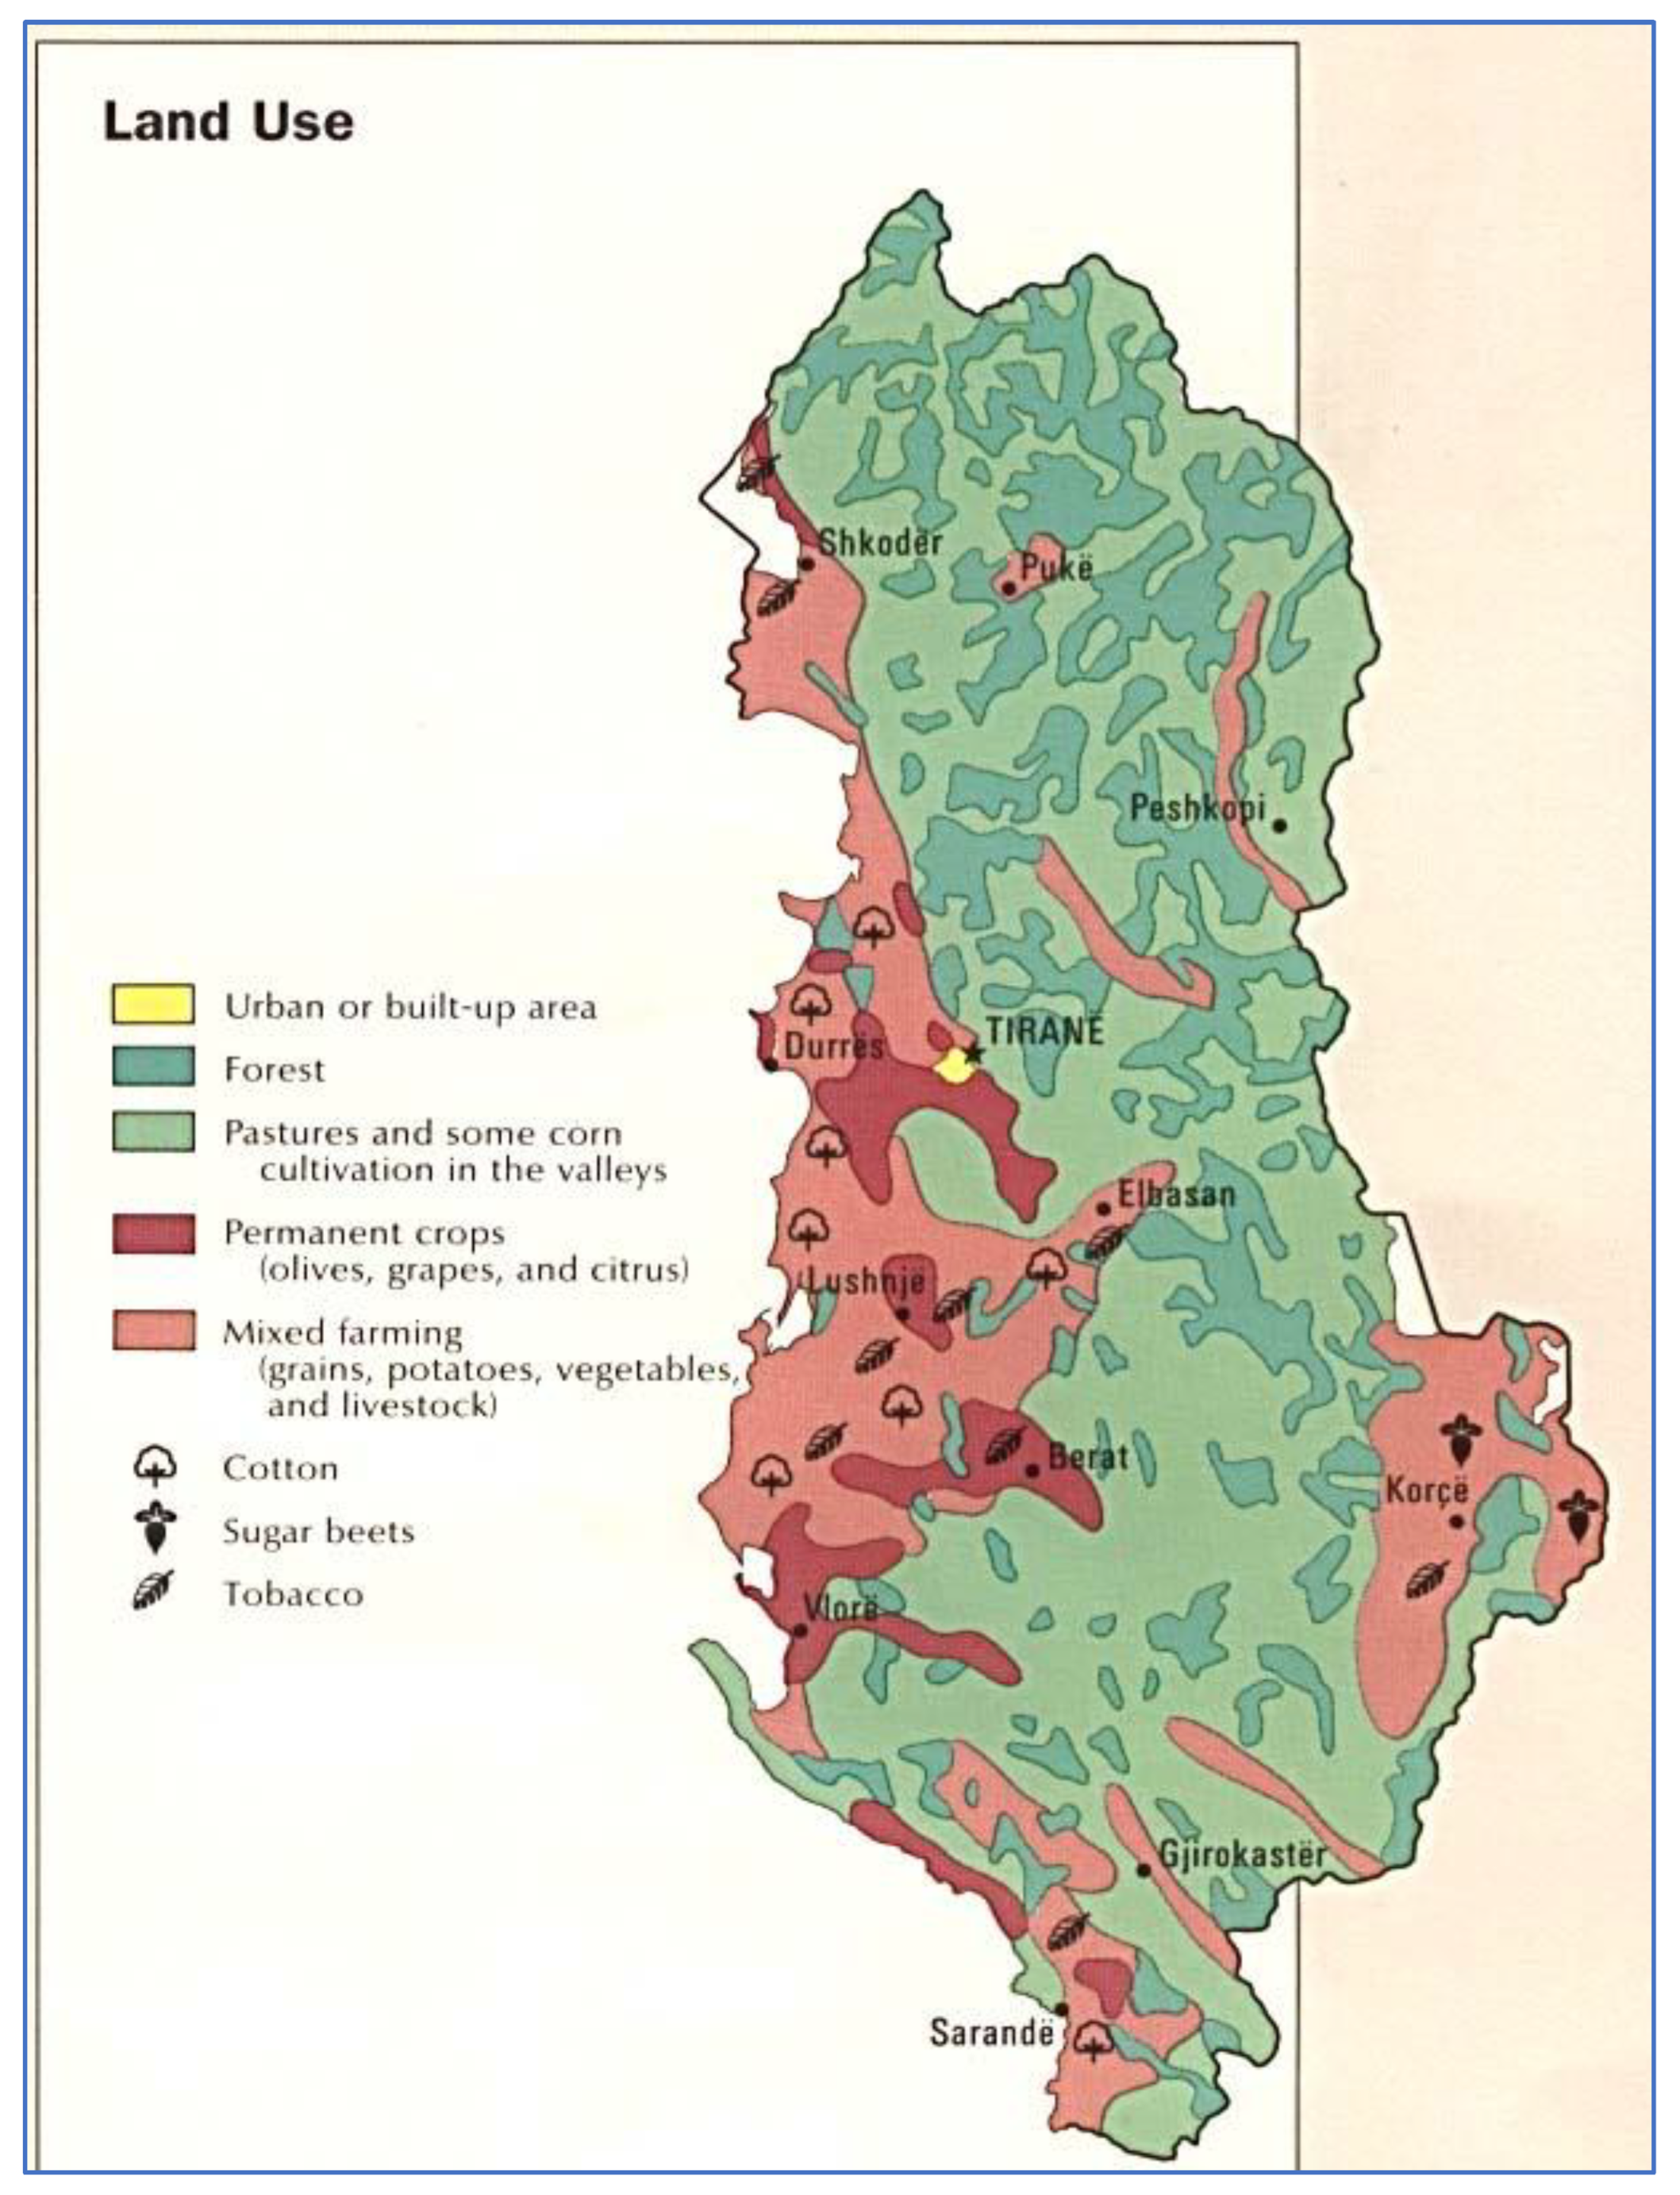
The olive tree (Olea europaea L.) is an evergreen plant native to the Mediterranean region and is an essential crop for its agricultural economies. It is distinguished by its fruits and oil. This plant has spread to other regions of the world, such as Australia and North and South America, due to its valuable products: olive oil and table olives (Topi et al., 2021). The geography of Albania has shaped its climatic characteristics, with the western regions exhibiting a typical Mediterranean climate (Figure 1). The olive tree is found in the western and southern areas, alongside the Adriatic and Ionian Seas, two water bodies of the Mediterranean basin. Genetic studies have revealed the existence of 22 native olive cultivars, along with several introduced foreign olive cultivars (Topi et al., 2021). Genetic studies have found 22 native olive cultivars strictly distributed across six regions - Berat, Elbasan, Kruja, Lezha, Tirana, and Vlora. Among native cultivars, the most distinguished are Kalinjot, Kotruvs, Kokërrmadh Berati, Mixan, Krips, Nisjot, Ulli i zi, and Bardhi Tirana (Bianco di Tirana) (Topi et al., 2012; Topi et al., 2019).
Olive oil is widely renowned as the main contributor to the distinguished Mediterranean Diet, globally recognized for its longevity and low incidence of cardiovascular diseases. Despite not being scientifically identified as a component of longevity among Albanians, olive oil is believed to be the key factor in its health benefits. However, being more expensive than vegetable oils, adulteration with cheaper or lower-quality oils provides significant economic benefits to its sellers. The most common adulterations of olive oil involve mixing it with sunflower, corn, coconut, soybean, and even hazelnut oil (Ordukaya & Karlik, 2017). Other counterfeiting practices include mixing olive oil from different production years and adding pigments for colour improvement—mixing olive oil products with geographical designation with olive oil of unidentified origin.
Virgin olive oil (VOO) is extracted from the olive fruit solely by mechanical or other physical means under conditions that do not lead to alterations in the oil and that have not undergone any treatment other than washing, decantation, centrifugation, and filtration (IOC, 1996). OO is comprised primarily of triacylglycerols (~99%) and minor compounds, which include phenolic compounds as well as other lipids such as hydrocarbons, sterols, aliphatic alcohols, tocopherols, and pigments (Topi et al., 2019). Phenolic compounds belong to different families, such as classes: tyrosol and hydroxytyrosol, both identified as phenylethanoid and their derivatives of 4-hydroxybenzoic, 4-hydroxyphenylacetic, and 4-hydroxycinnamic acids; lignans and flavonoids (Topi et al., 2020).
Olive oil contains palmitic (C16:0), palmitoleic (C16:1), stearic (C18:0), oleic (C18:1), linoleic (C18:2), and linolenic (C18:3) fatty acids. Myristic (C14:0), heptadecanoic, and eicosanoic acids are found in trace amounts (Topi et al., 2012). The fatty acid composition may differ according to cultivars, production zones, latitude, climate, variety, and fruit maturity stages. Greek, Italian, and Spanish OOs are low in linoleic and palmitic acids and have a high percentage of oleic acid. Tunisian OOs are high in linoleic and palmitic acids and lower in oleic acid (Boskou et al., 2006).
The most important native olive cultivar is Kalinjot, contributing to a high level of domestic production. It covers approximately 50% of plantations at the national level, with a denser structure, over 70% of the plantations’ structure, in the southern regions, Vlora and Mallakastra regions (Table 3) (Velo & Topi, 2017). Under the value established by EU legislation for olive oil commodity, the primary fatty acids are Oleic acid (68.03–76.83%), linoleic acid (7.85–14.22%), and palmitic acid (8.54–13.62%). Meanwhile, there is a threshold for the linolenic acid content to be below 1% (Table 3).
Studies suggest that VOO may provide health benefits, including reducing coronary heart disease risk factors, preventing several types of cancers, and modifying immune and inflammatory responses. These benefits mainly originate from the phenolic compounds, which aid in preventing several chronic diseases like atherosclerosis, cancer, chronic inflammation, strokes, and other degenerative diseases (Topi et al., 2020). Characterizing phenolic compounds of Albanian OO from the distinguished native olive cultivars (Kalinjot, Bardhi Tirana, Ulli i Zi, Krips Kruja, and Bardhi Kruja) has been studied (Topi et al., 2020). Secoiridoids were found as most abundant in all the OO despite the cultivar, followed by phenolic alcohols. In this group, 3,4-DHPEA-EDA (Hydroxytyrosol) and p-HPEA-EDA (Tyrosol) stood out as dominant compounds, especially in Kalinjot virgin OO (Topi et al., 2020).
According to the data, global production has reached over 9.4 million tons of olives. About 805 million olive trees, accounting for 98%, are cultivated in the Mediterranean region, producing about 2 million tons of olive oil annually (Ordukaya & Karlik, 2017). The world olive oil market was estimated at $14.64 billion in 2023, with an increase to $18.42 billion in 2030 (Aiello, 2024).
Albania’s five most productive olive areas are Berati, Elbasan, Fieri, Vlora, and Tirana, where 90% of olive production is concentrated. Fieri is the main region for the first three indicators (total number of plants, number of plants in production, and total production). The economic potential resulting from the main olive cultivars is very high by contributing to rural economies and regions with low developing potential, such as Southern and inland hilly regions of the country (Topi et al., 2012).
In addition to quality, a long-standing problem that grips the agri-food sector concerns the traceability of geographical origin. Deceptive practices, such as mislabelling wine and olive oil with false geographical origin or using the wrong grape and olive varieties, can undermine both consumer confidence and the reputation of wine and olive-producing regions, respectively. Unfortunately, an increasing number of low-quality OO often end up on our tables, not being easily identifiable. For this reason, ensuring the authenticity of the olive and its geographical origin is essential for maintaining the industry’s integrity and improving its supply chain by implementing traceability systems.
This study used the Random Forest (RF) and K-nearest neighbors (kNN) algorithms, among others (Sheth et al., 2022).
The contributions of this study are focused on:
- (i)
- evaluation of olive oil modelling using its physicochemical characteristics,
- (ii)
- testing different AI-based classification techniques to determine the highest accuracy,
- (iii)
- identifying the characteristics of an olive oil cultivar based on its geographical origin.
From these results, an AI-driven system was developed and launched, which is easily accessible for individuals and organizations interested in olive oil, to predict the quality and origin of this product based on its physical and chemical properties. These insights highlight the capability of machine learning (ML) algorithms to extract advanced information from unstructured data. In summary, ML enhances the agri-food sector’s ability to make well-informed decisions, improve product quality, adapt to shifting market trends, and ultimately boost both the quality and competitiveness of its offerings.
Based on our research study, we identified two approaches to data that we may need:
We judge that dataset #3, with 572 data objects, is closer to our idea, given that, based on seven input characteristics (characteristics of olive oil fatty acids, e.g., palmitoleic acid, stearic acid, oleic acid, etc.), the algorithm can predict the geographical region of the olive oil, which is represented by the output variable we want to predict (in the cited study, there are nine such regions, e.g., North Apulia, Calabria, South Apulia, etc.). Therefore, our target (output) is also categorical. (Aiello, 2024).
Analogously, for our study, we can use similar input characteristics in the dataset being processed. Each data object (olive oil) will be populated with accurate data regarding its fatty acid properties. The more data we have, the higher the prediction accuracy we expect from Machine Learning algorithms. From a confusion matrix perspective, the correct prediction can usually be interpreted as a TP (True Positive) value, i.e., if the actual data is "Kalinjot" oil and the predicted data is "Kalinjot" oil. Thus, the prediction by the algorithm was performed correctly. When we discuss classification tasks (e.g., classifying the score given to wine based on quality to predict whether the wine is good, normal, or bad), SVM algorithms (96%), RF (92%), and kNN (87%) have provided higher accuracy of test results for a balanced dataset (Zaza et al., 2023).
SVM (Support Vector Machine)
SVM is one of the most advanced and widely used methods in ML. This method divides the samples through an optimal hyperplane, which maximizes the distance between classes (Nattane et al., 2021). In other words, this algorithm aims to find a hyper-plane that can efficiently separate different classes of data points within a multi-dimensional space (Zaza et al., 2023). Thus, SVM represents one of the most popular supervised learning algorithms that enables the maximization of the discriminant boundary.
In our case study, being a "multiclass" classification, we can use one of the methods:
1-vs-rest. So, we use classifiers; for example, one of them is [“Kalinjot”] vs. [“Berat, “Fier” “Saranda”], etc.
1-vs-1. In this case, to generate a classifier, we use the formula , Where N indicates the number of classes we are considering. So, for N=4, we will have six classifiers, e.g., "Kalinjot" vs. "Berat", "Kalinjot" vs. "Fier" etc…
kNN (K-Nearest Neighbours)
The kNN algorithm performs the classification task by predicting a new given object based on the Euclidean distance (the distance between the training point and the test observation).
In Equation (1), represents the counts of dimensions, whereas and denotes the data points.
The equation (1) can also be expressed as follows:
where represents the training dataset and indicates the test observation (Zaza et al., 2023).
The Rationale Behind the Algorithm and Its Adjustment to Our Dataset
Suppose we need to create a new data object, such as an olive oil, for which the user can specify attributes like MUFA and PUFA. In this scenario, the purpose of the algorithm is to determine if the olive oil belongs to one of the following categories (origins): Kalinjot, Berat, Fier, or Saranda mono-cultivar OO.
Step 1. Calculate the distance based on the input characteristics (such as for olive oil: MUFA, PUFA, etc.). Since our dataset includes multiple input characteristics, the extended formula (1) will be beneficial, allowing us to work beyond just two dimensions.
Step 2. Determining the rank. In straightforward terms, the first rank corresponds to the smallest distance identified in the initial step.
Step 3. Identify the "nearest neighbor" by selecting a specific value of k. For instance, when k=1, the top-ranked place will be chosen (let’s say Kalinjot). Conversely, with k=4, we examine the top four ranks. If three out of these four ranks correspond to Kalinjot, it indicates that these three data points are closest to Kalinjot in distance. Consequently, this leads to the prediction that the new data object, which pertains to an olive oil production origin of interest to the user, will likely be classified as a Kalinjot olive oil.
An Olive Oil Origin Predictor - Predicting the Origin of the Cultivar
A Brief Description of Our Dataset
The dataset includes 34 samples from the same cultivar, sourced from various regions of Albania. This study aims to predict the cultivar’s origin, termed as a “classification task” or “multi-class classification” in our context. The key question is: how do the input features affect the output variable?
Key features will include specific fatty acids and other substances that allow us to distinguish the oil’s origin, as each region’s unique conditions, including soil and climate, influence its chemical makeup.
Secondly, the machine learning model plays an essential role, enabling the classifier to learn from these values to uncover hidden patterns and forecast the region.
Figure 2.
Showcasing a part of the Olive Oil dataset, including the first five data objects. The last column, “Origin,” represents the output variable.
Figure 2.
Showcasing a part of the Olive Oil dataset, including the first five data objects. The last column, “Origin,” represents the output variable.


Table 1.
A short description of features.
| Feature | Explanation of the Feature | Value Type |
|---|---|---|
| Saturated Fatty Acids (SFA) | Includes fatty acids like 14:0 (myristic), 16:0 (palmitic), 18:0 (stearic), 20:0 (arachidic), 21:0 (henicosanoic), 22:0 (behenic). | Continuous |
| Monounsaturated Fatty Acids (MUFA) | Fatty acids with one double bond, such as 16:1(n-9), 16:1(n-7), 18:1(n-9)cis, 18:1(n-9)trans, 18:1(n-7), 20:1(n-9). | Continuous |
| Polyunsaturated Fatty Acids (PUFA) | Fatty acids with multiple double bonds, including 18:2(n-6)cis, 18:2(n-6)trans, 18:3(n-3), 20:2(n-6), 20:3(n-3). | Continuous |
| Fatty Acid Ratios | Ratios like (n-6)/(n-3) and 18:1/18:2 reflect the balance between omega-6 and omega-3 fatty acids or specific fatty acids. | Continuous |
| Special Fatty Acid Types | Uncommon or less abundant fatty acids like 17:0 and 17:1(n-7) indicate additional profile variability. | Continuous |
Figure 3.
The research methodology used is based on Suleiman et al. (2022).

Figure 4.
Class distribution after SMOTE. The three classes (Vlora, Berat and Fier) have equal division.
Figure 4.
Class distribution after SMOTE. The three classes (Vlora, Berat and Fier) have equal division.
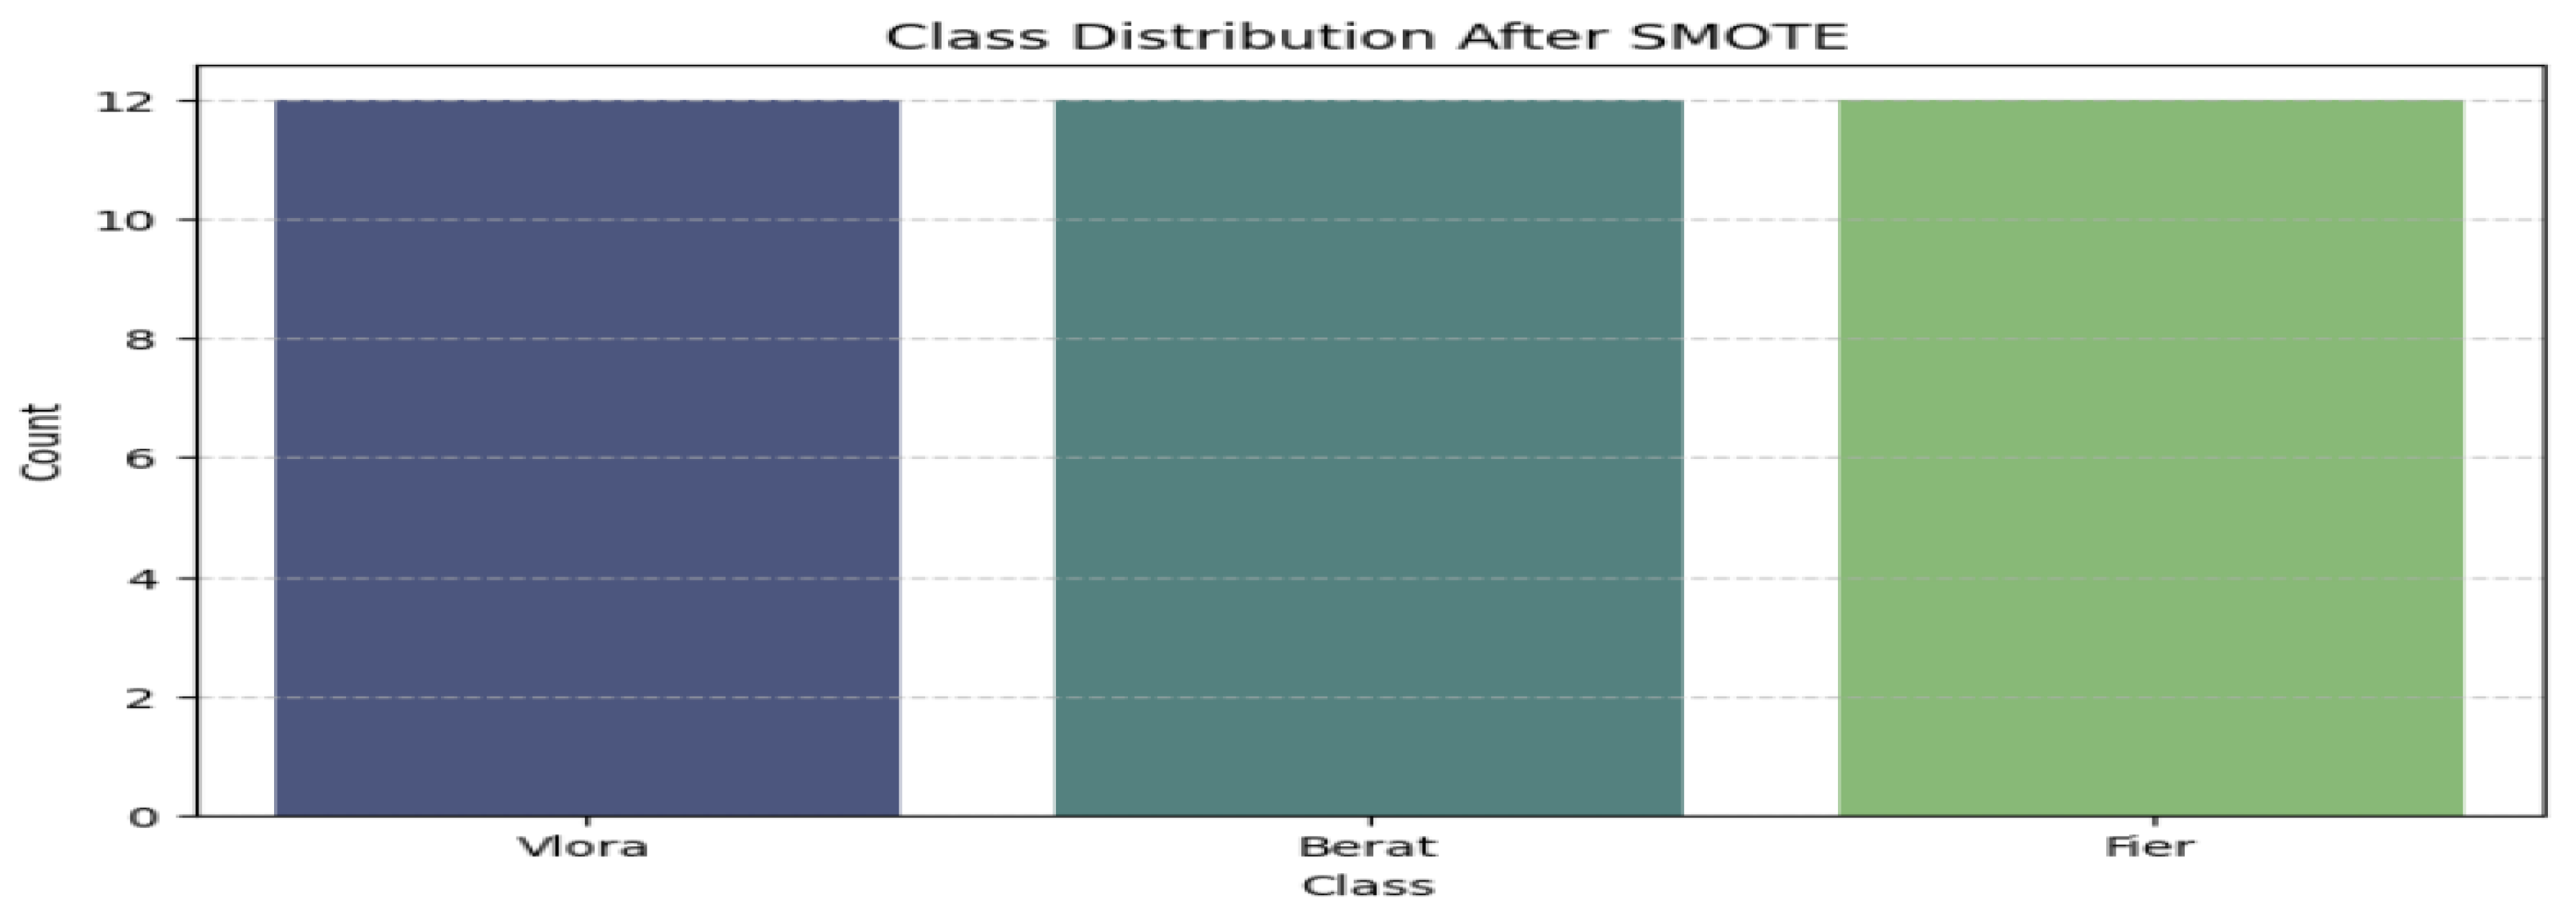
Handling Imbalanced Dataset
Synthetic Minority Oversampling Technique (SMOTE) is viewed as an effective approach for addressing imbalanced data by randomly augmenting the minority class instances. This allows for the duplication of these instances. As noted by (Kothawade, 2021), SMOTE is an over-sampling technique that increases the occurrence of less frequent classes in the training set, generating new samples to alleviate the class imbalance. In essence, minority instances are identified, and a new instance is produced through linear interpolation between them.
Our dataset consists of samples from the same cultivar, sourced from various regions: 12 from Vlora, 12 from Berat, and 10 from Fier. To balance the dataset, we utilized SMOTE to replicate instances of the minority class, “Fier.” After applying SMOTE, we confirmed that the distribution of instances across classes became uniform, resulting in an increase of minority class instances (Fier) from 10 to 12, as illustrated in Figure 4.
Splitting the Olive Oil Dataset into Training and Test Dataset
To include 20% of the data for testing and the remaining 80% to be used for training the model (also shown in Figure 3), we have used the scikit-learn library in Python.
Essentially, we are going to train the model on X_train and Y_train in our training dataset. The prediction will be performed by using X_test (in the unseen samples) and we have to compare predicted results by my models with Y_test.
Feature Selection and Feature Extraction (PCA) After Splitting the Datasets
In the Olive Oil dataset, feature scaling is important as our chosen ML algorithms must calculate distances between data. If we do not perform feature scaling (i.e., the features are not scaled), then the features with a higher value range will dominate when distances are calculated.
Scikit-learn is a Python module that integrates the newest machine-learning algorithm for supervised and unsupervised problems (Kothawade, 2021). We intend to make our data standardized, which means that it will have a =0 and a a =1. The upper and lower values can vary (they don’t need to be in range from 0 to 1).
We use the following formula for standardization so to calculate the standard score of a sample x:
where is each value, is the mean of the training samples and is the standard deviation of the training samples.
Figure 5.
Statistical data (mean and standard deviation) for the 24 features post-standardization are presented. This shows that min-max values might differ from those in normalization, necessitating scaling from 0 to 1.
Figure 5.
Statistical data (mean and standard deviation) for the 24 features post-standardization are presented. This shows that min-max values might differ from those in normalization, necessitating scaling from 0 to 1.
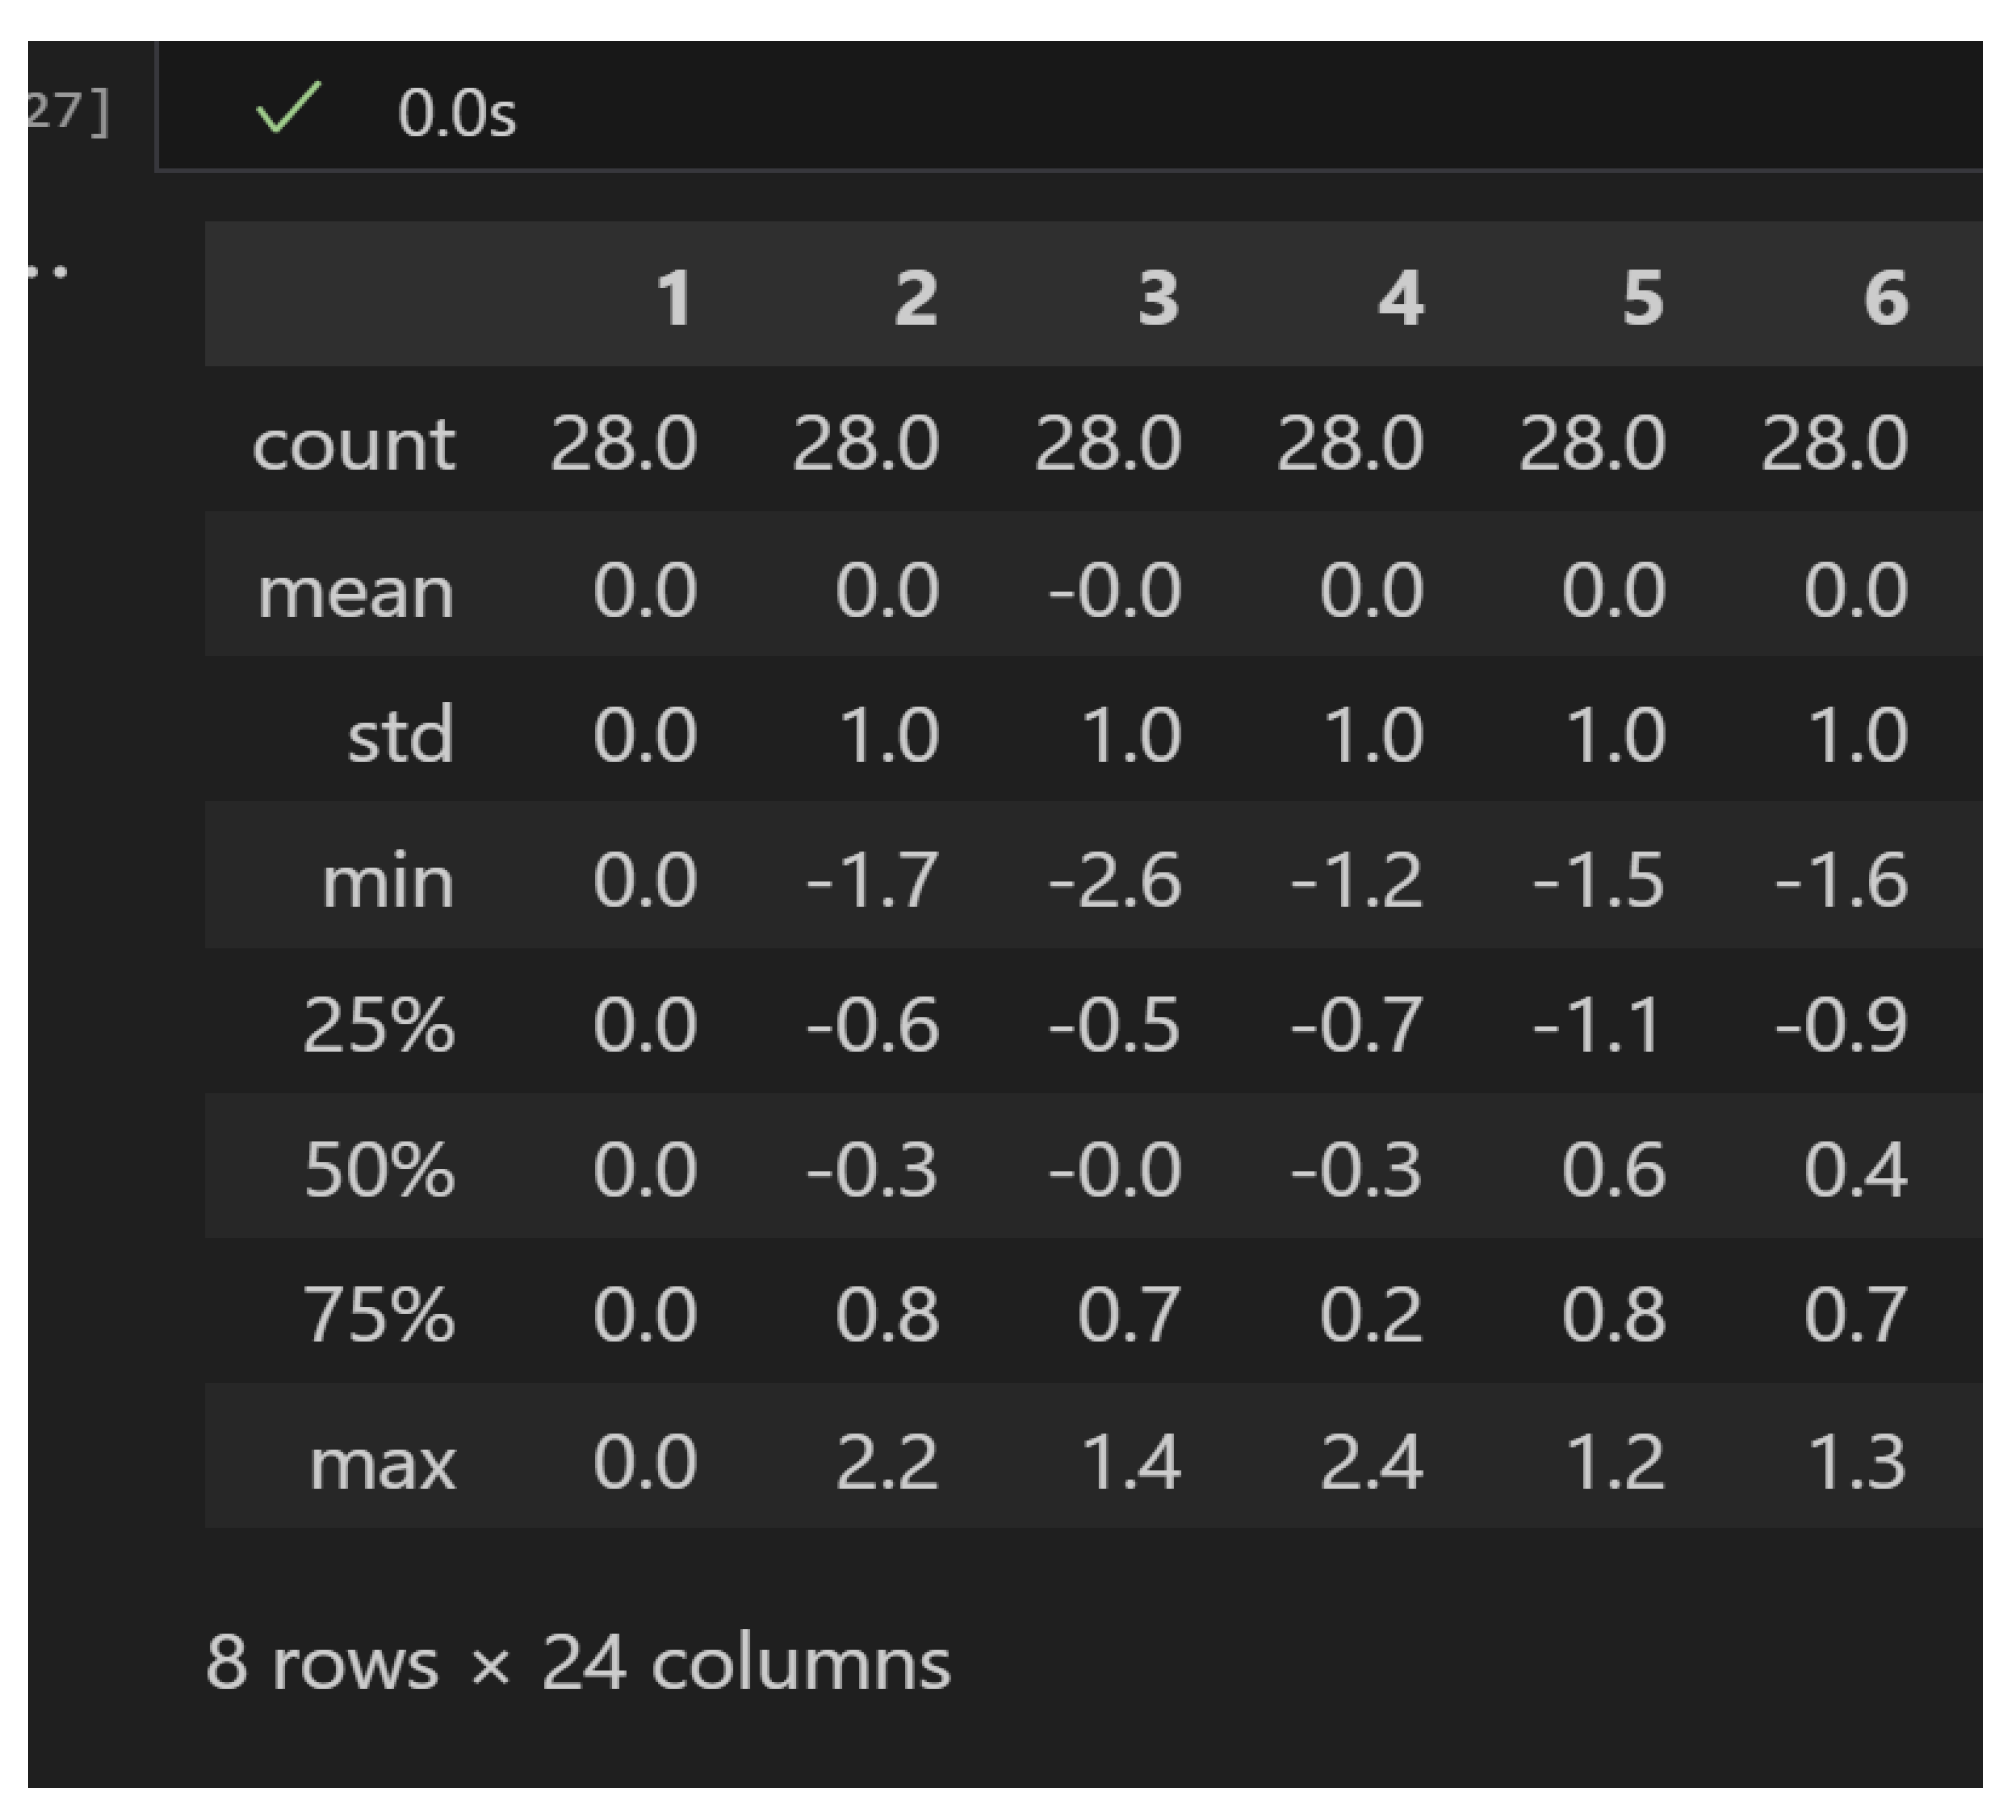
Conversely, Principal Component Analysis (PCA) serves as a dimensionality reduction method that lowers the number of input features while preserving as much information from the original dataset as possible. PCA converts the 24 original features into a smaller number of principal components, each representing a significant portion of the dataset’s variance (Da Costa et al., 2021).
For instance, rather than utilizing all 24 features, PCA can condense them into a few components that accurately summarize the same information. This technique reduces computational requirements during model training and enhances resource efficiency while maintaining the dataset’s essential characteristics. By integrating feature scaling with PCA, the dataset is effectively positioned for optimal machine learning analysis.
Feature Importance Using Random Forest
Figure 6 demonstrates the importance of different features for predicting the origin of olive oil cultivars with a Random Forest classification model. The dataset includes samples from the same cultivar, collected from various regions in Albania like Vlora, Berat, and Fier (resulting in three target classes, though more could be added later). This analysis aims to classify the cultivar by its origin, employing chemical characteristics such as the 18:1/18:2 ratio, PUFA, MUFA, SFA, and other fatty acid profiles as input features.
Figure 6.
The feature importance of “Random Forest” according to the Olive Oil dataset.
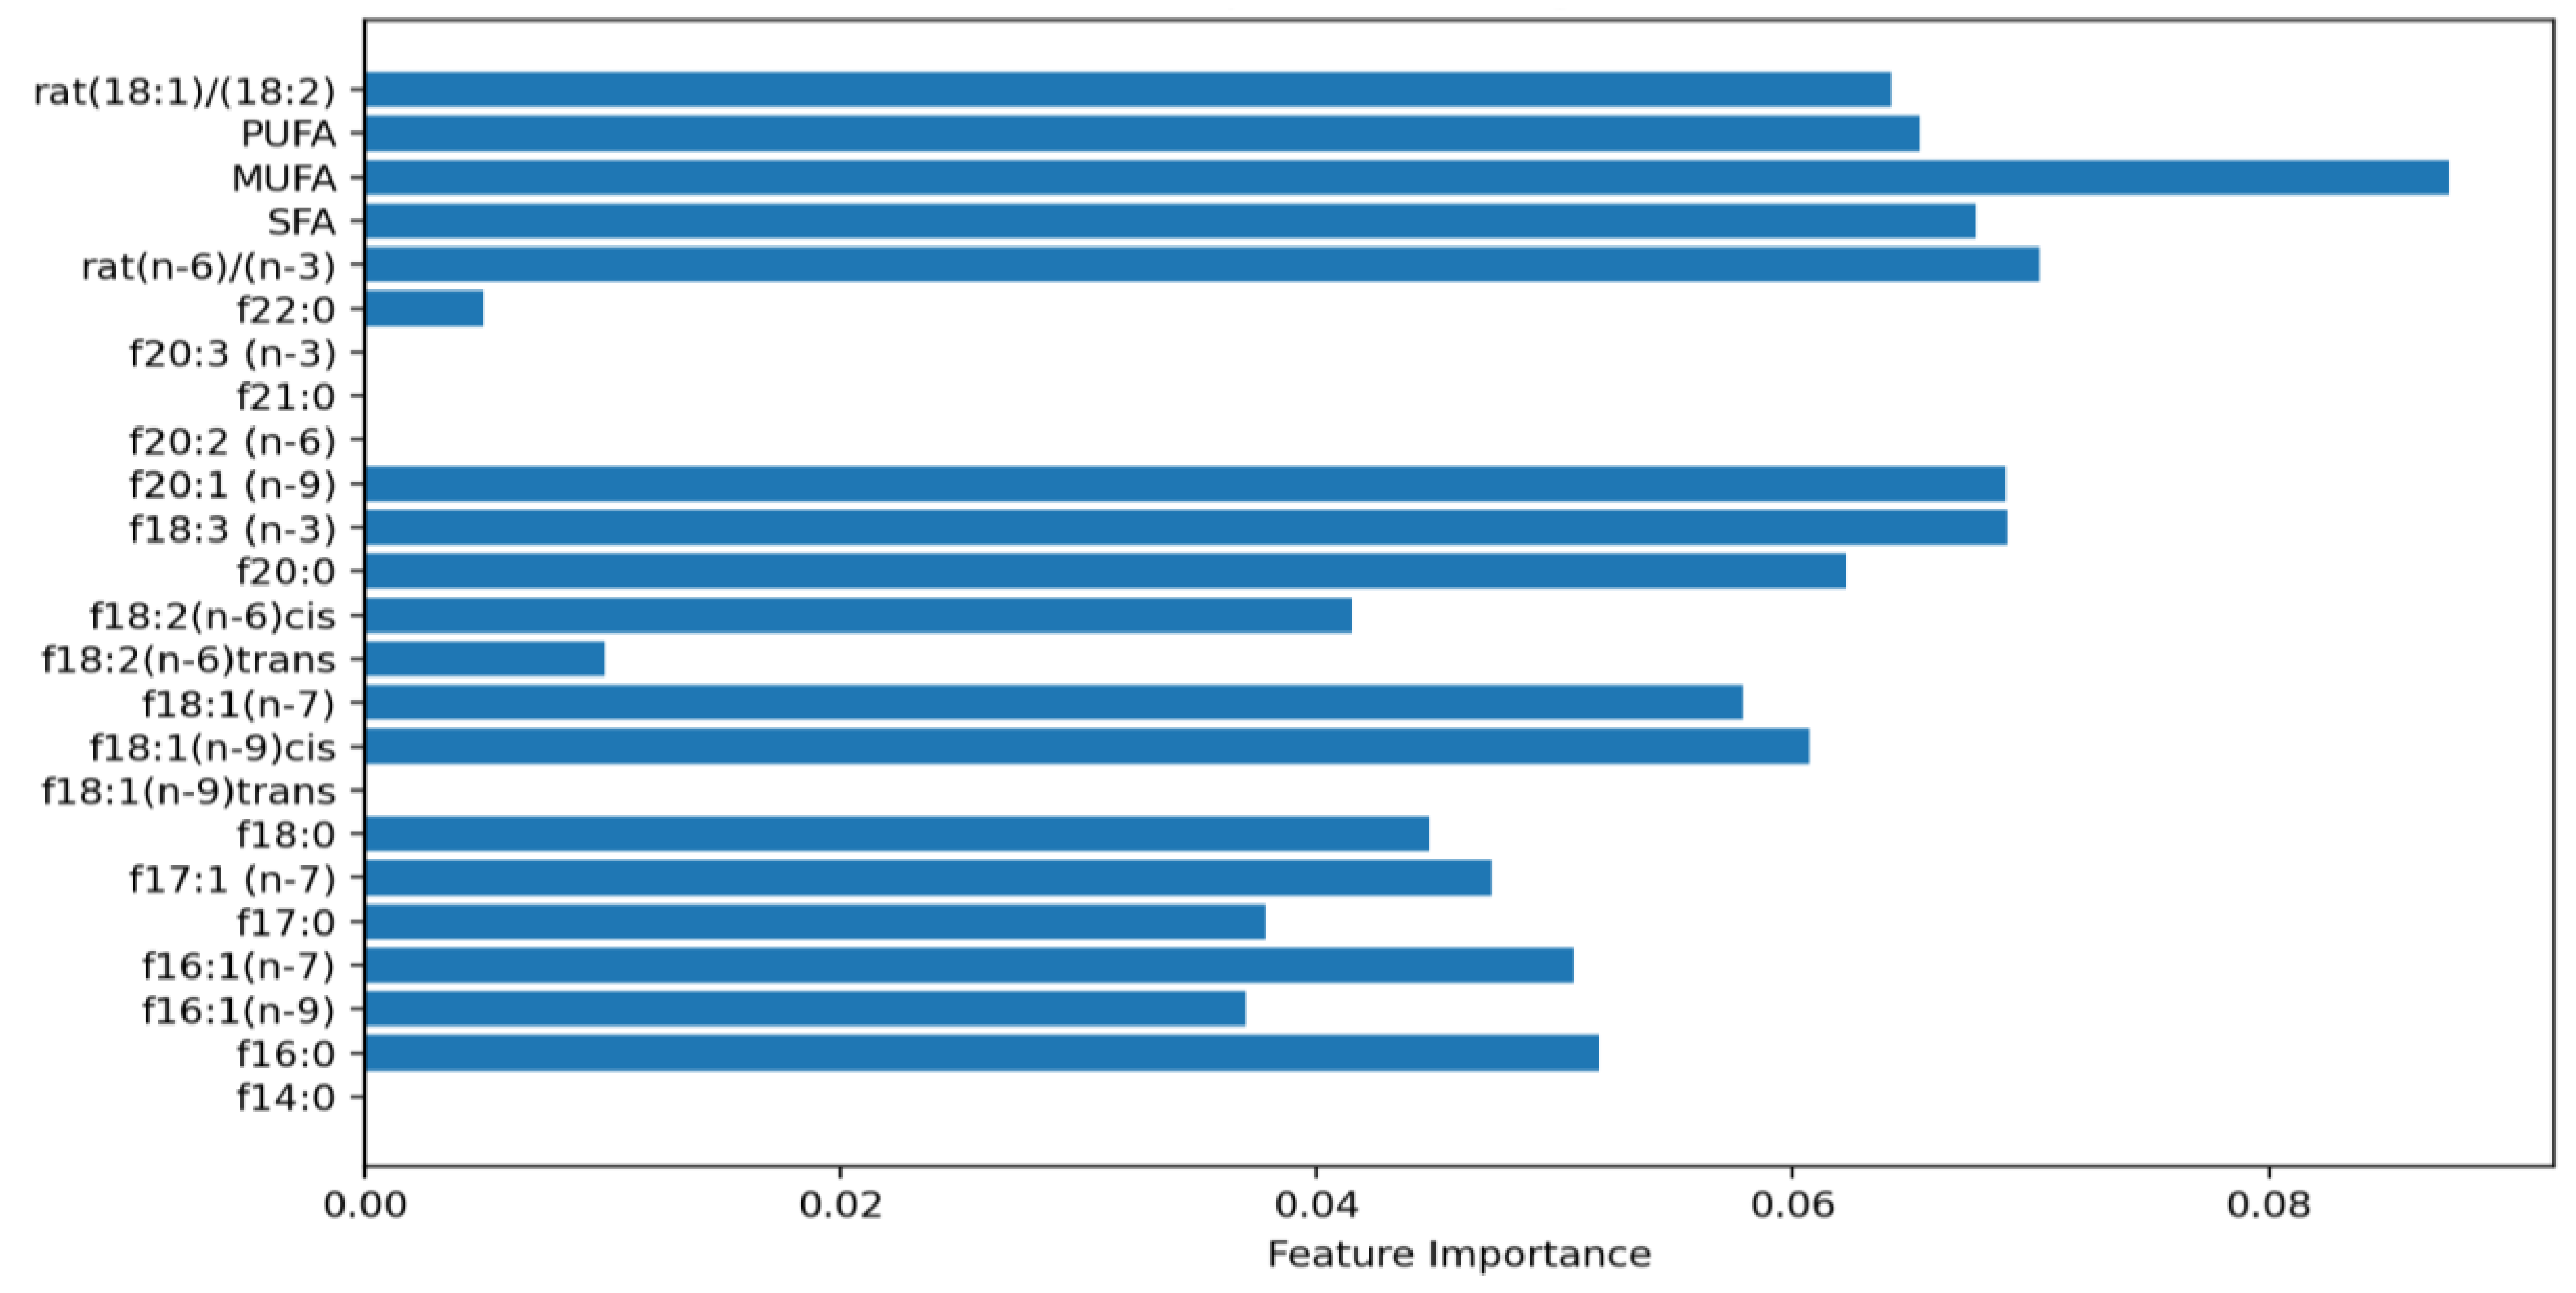
Among these features, the ratio of 18:1/18:2 emerges as one of the most critical in distinguishing between the origins of olive oil samples. MUFA has a very important influence in the origin (our target variable). This indicates that the balance between these fatty acids is highly specific to each region’s environmental and geographical factors. PUFA and SFA also hold substantial importance, reflecting the broader composition of fatty acids that vary with the cultivar’s growing conditions and processing techniques.
On the other hand, features such as f14:0 and certain trans-fatty acids exhibit lower importance scores, implying that they contribute minimally to differentiating between regional origins. While they may play a role in the overall chemical profile, their influence on the classification outcome is limited compared to the more dominant features.
The importance scores are derived from the Gini impurity metric, which assesses the role of each feature in reducing uncertainty during classification. Features with higher importance scores appear more frequently in decision-making nodes within the model, which is pivotal in achieving accurate predictions of the olive oil’s origin. This underscores the significance of leveraging well-selected chemical markers to achieve robust classification outcomes.
In conclusion, the feature importance analysis highlights the key chemical indicators that facilitate the reliable classification of mono-cultivar Albanian OO based on their regional origin.
Evaluation Metrics
To check if the predictions are correct or incorrect, there are four ways:
- True Positive: Number of samples that are predicted to be positive that are truly positive.
- False Positive: Number of samples predicted to be positive and truly negative.
- False Negative: Number of samples that are predicted to be negative that are truly positive.
- True Negative: Number of samples predicted to be negative and truly negative.
Moreover, several metrics are helpful to assess a model’s ability to classify the OO into their respective origin correctly. According to Niyogisubizo and coauthors (2024), several classification metrics are used to evaluate the results, such as:
Accuracy: indicates the number of correctly classified instances over the total number.
After performing SMOTE, our target class is well balanced, so accuracy will be a good metric that measures how often the classifier predicts correctly.
Precision: expressed by the proportion of positive instances predicted, which are predicted as positive.
Recall: calculated as the proportion of current positive instances that are exactly predicted as positive.
F1 score: calculated as the balanced mean of recall and precision.
Results and Discussions
| Model: Logistic Regression | ||||
| Accuracy: 62.50 % | ||||
| Classification Report: | ||||
| Precision | Recall | F1-score | Support | |
| 0.583 | 0.625 | 0.6 | ||
| Berat | 0.33 | 0.50 | 0.40 | 2 |
| Fier | 1.00 | 1.00 | 1.00 | 4 |
| Vlora | 0.00 | 0.00 | 0.00 | 2 |
| Model: Support Vector Classifier | ||||
| Accuracy: 62.50 % | ||||
| Classification Report: | ||||
| Precision | Recall | F1-score | Support | |
| 0.6 | 0.625 | 0.571 | ||
| Berat | 0.00 | 0.00 | 0.00 | 2 |
| Fier | 1.00 | 0.75 | 0.86 | 4 |
| Vlora | 0.40 | 1.00 | 0.57 | 2 |
| Model: kNN | ||||
| Accuracy: 50.00 % | ||||
| Classification Report: | ||||
| Precision | Recall | F1-score | Support | |
| 0.5 | 0.5 | 0.467 | ||
| Berat | 0.00 | 0.00 | 0.00 | 2 |
| Fier | 0.50 | 0.75 | 0.60 | 4 |
| Vlora | 1.00 | 0.50 | 0.67 | 2 |
| Model: Decision Tree | ||||
| Accuracy: 50.00 % | ||||
| Classification Report: | ||||
| Precision | Recall | F1-score | Support | |
| 0.458 | 0.5 | 0.475 | ||
| Berat | 0.33 | 0.50 | 0.40 | 2 |
| Fier | 0.75 | 0.75 | 0.75 | 4 |
| Vlora | 0.00 | 0.00 | 0.00 | 2 |
| Model: Random Forest | ||||
| Accuracy: 50.00 % | ||||
| Classification Report: | ||||
| Precision | Recall | F1-score | Support | |
| 0.625 | 0.625 | 0.625 | ||
| Berat | 0.00 | 0.00 | 0.00 | 2 |
| Fier | 0.75 | 0.75 | 0.75 | 4 |
| Vlora | 0.33 | 0.50 | 0.40 | 2 |
| Note: The last column in each of the following tables (named “support”) provides us the number of samples in each class. | ||||
Evaluation Metrics Analysis
The evaluation metrics provide critical insights into the strengths and weaknesses of each machine learning model in predicting the origin of Albanian mono-cultivar OO. Logistic Regression and SVC demonstrated moderate overall performance, achieving 62.50% accuracy. Despite these models showing balanced precision and recall for specific classes, they struggled with correctly identifying samples from Vlora, evidenced by low precision and recall values for this class. While conceptually simple, the k-Nearest Neighbours (kNN) algorithm underperformed with an accuracy of 50%. However, after hyperparameter tuning these classifiers, kNN performed better (as explained later).
Similarly, the Decision Tree model exhibited overfitting tendencies, resulting in an overall accuracy of 50% and inconsistent predictions across regions. Random Forest, a more robust ensemble method, showed slight improvements for specific classes but failed to generalize effectively, also yielding 50% accuracy. Gradient Boosting provided a more nuanced balance in classifying oils. Yet, its overall accuracy remained constrained by challenges in capturing the underlying data distribution, particularly for samples from Berat and Vlora. These findings underline the limitations of standard classifiers in tackling regionally diverse and imbalanced datasets.
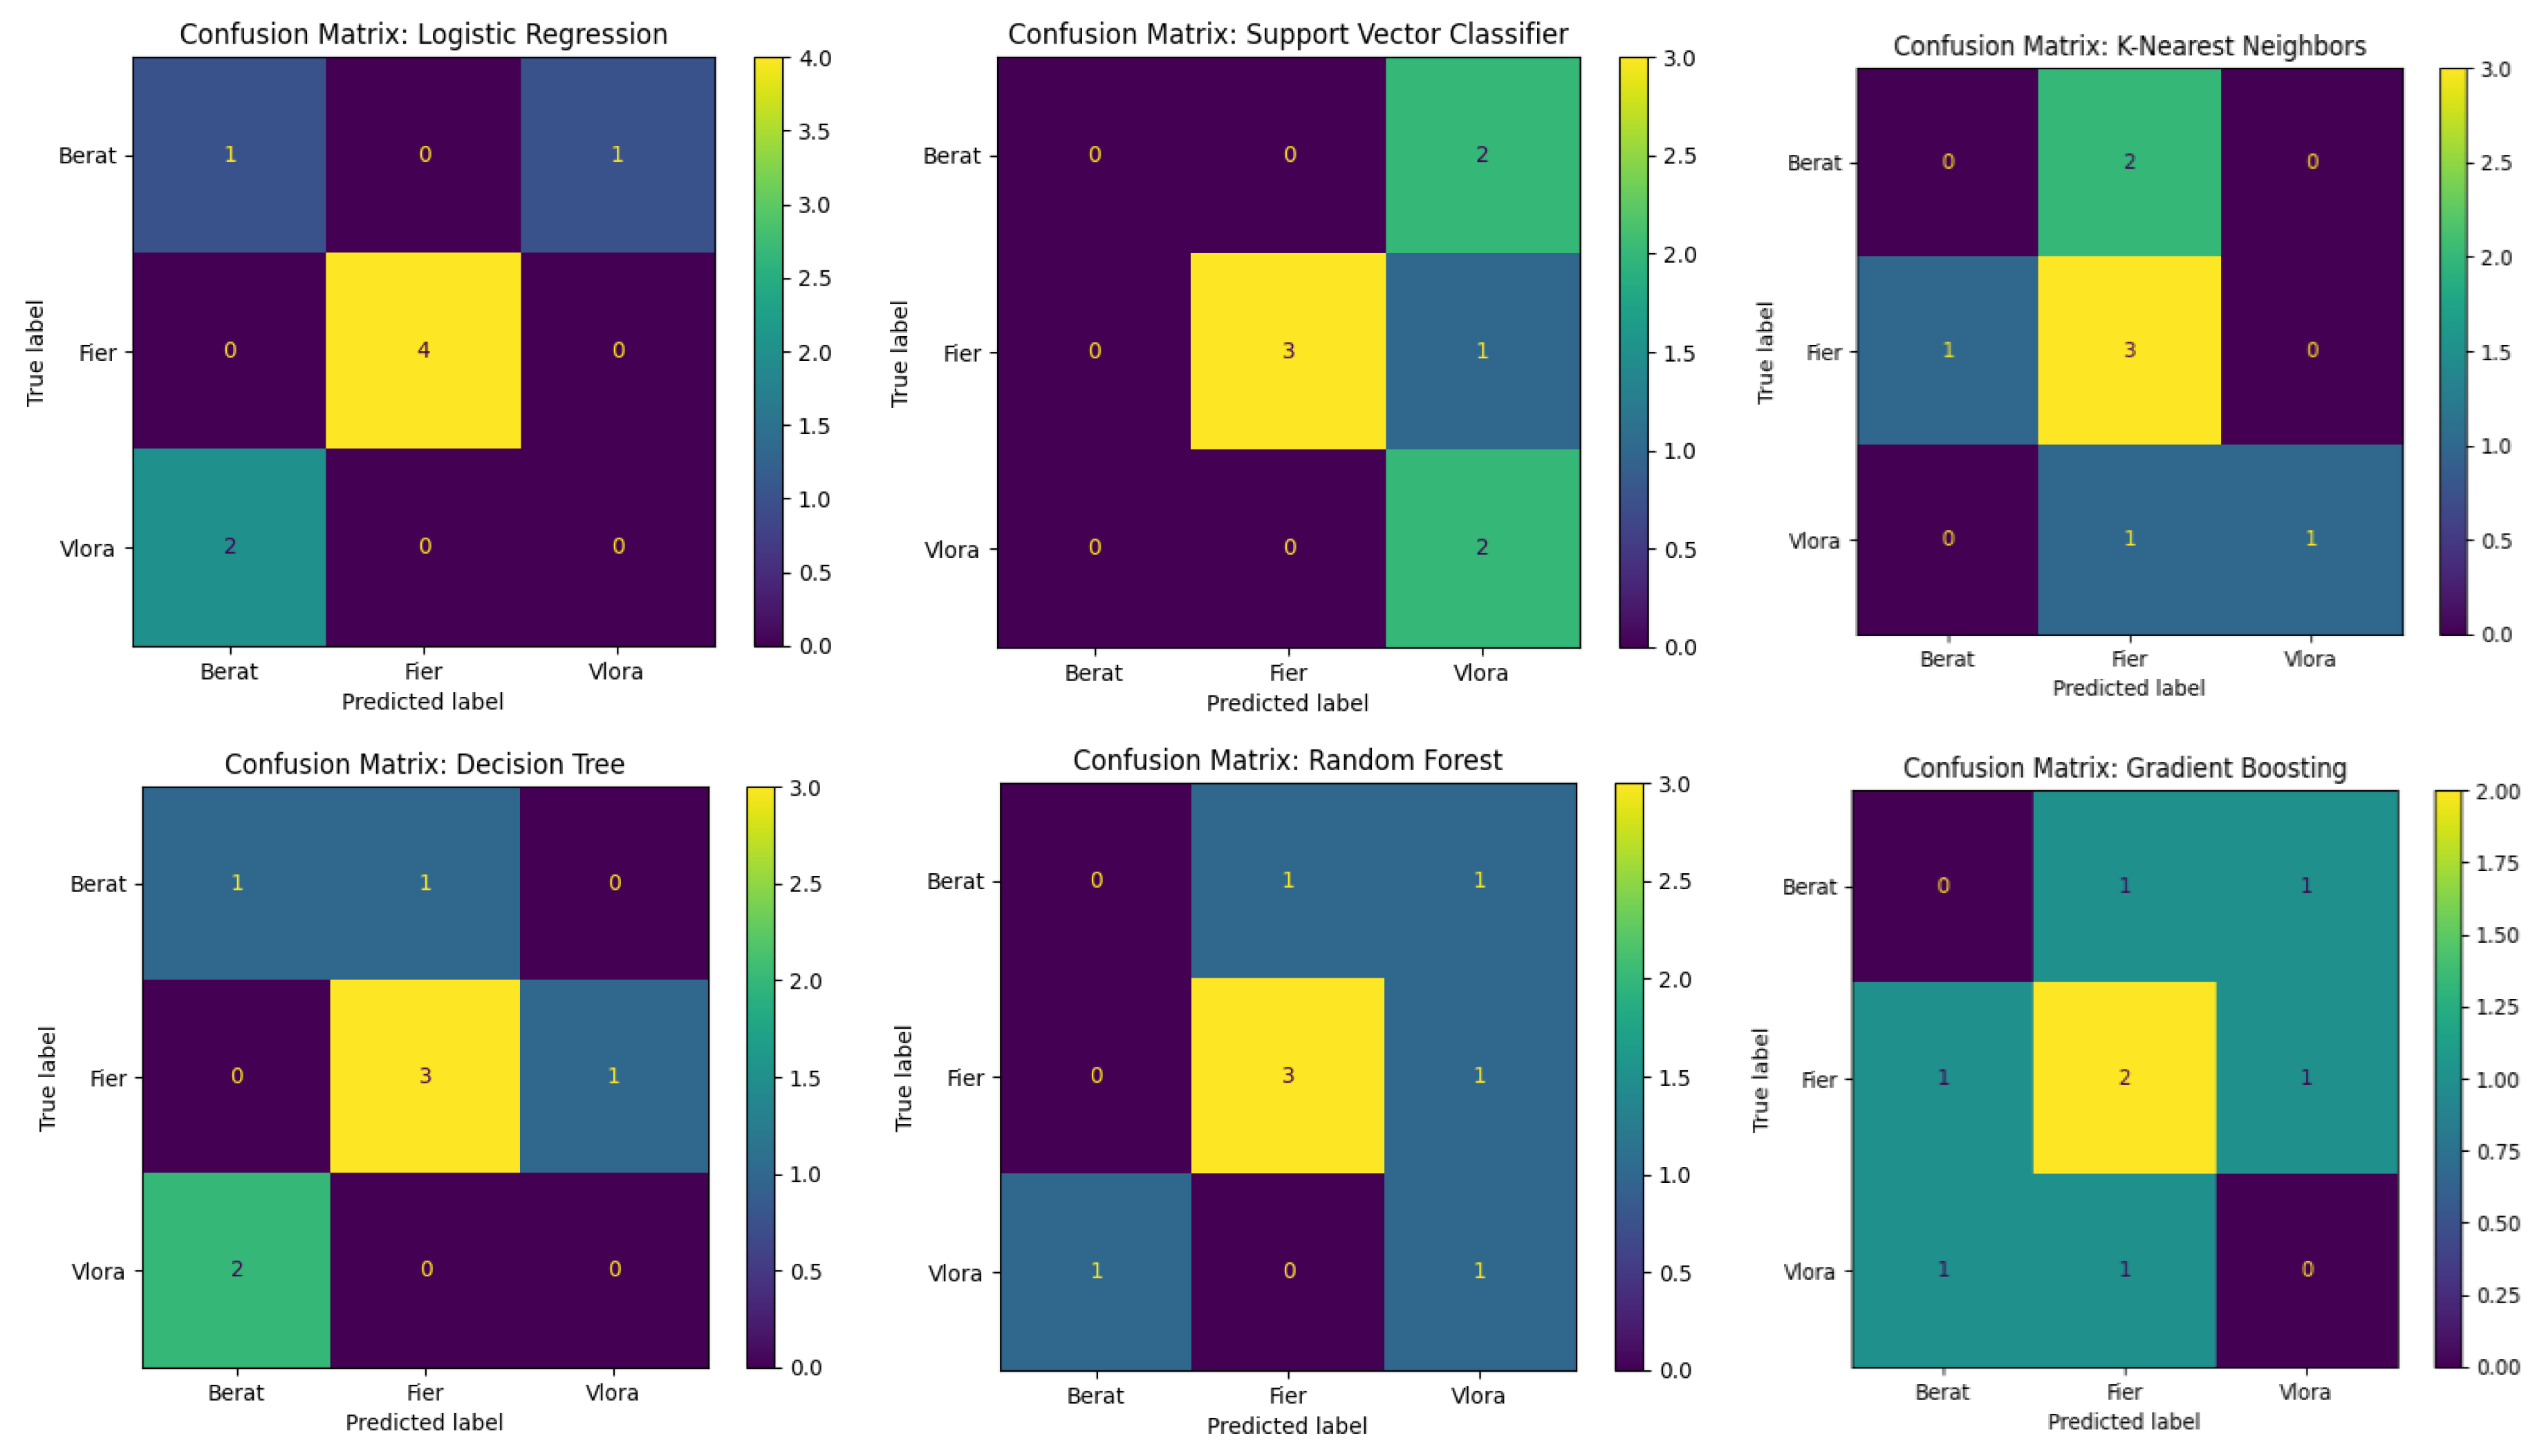
Confusion Matrix Analysis
The confusion matrices revealed key patterns in the misclassification tendencies of the models, shedding light on the regional separability of the olive oil samples. Across most models, samples originating from Fier were consistently classified with higher accuracy, suggesting more distinct feature patterns for this region. Conversely, samples from Berat and Vlora were frequently misclassified, indicating overlapping characteristics between these classes. For example, Logistic Regression and SVC exhibited significant confusion in differentiating Vlora samples, often misclassifying them as belonging to Fier. Gradient Boosting showed marginal improvement in class distribution but struggled with borderline cases between Berat and Fier. Despite its ensemble nature, Random Forest demonstrated similar biases as individual Decision Trees, particularly under classifying Vlora samples.
Since our dataset is relatively small, consisting of only 34 instances, the observed trends reflect both the dataset’s complexity and the limitations of training on such a small sample size. This highlights the importance of adopting advanced pre-processing techniques besides feature scaling, for example, dimensionality reduction or augmentation strategies, to improve class separability and enhance model performance. To achieve greater predictive reliability, future work should explore more sophisticated algorithms and consider collecting a larger, more representative dataset to capture the full variability of the features.
Figure 7.
Visualization of confusion matrices created using the ConfusionMatrixDisplay class from the sklearn—metrics library.
Figure 7.
Visualization of confusion matrices created using the ConfusionMatrixDisplay class from the sklearn—metrics library.
Hyperparameter Tuning for K-Nearest Neighbors’ Classifier
In our analysis, we systematically tuned the hyperparameters of various models to optimize their performance. Specifically, for Logistic Regression, we adjusted parameters such as the regularization strength; for Support Vector Machines (SVM), we optimized the penalty parameter C; for Decision Trees, we refined criteria like maximum depth and minimum samples per split; and for Random Forests, we explored the number of estimators and maximum features. After conducting a comprehensive evaluation of these models post-tuning, we observed that the k-Nearest Neighbours (kNN) algorithm, with its hyperparameters optimized (e.g., the number of neighbors), performed better than the other models.
The main goal is to find the K-nearest neighbors to a given data point. In this case, the metric used is Euclidean distance, which is the distance between two points in the hyperplane. This metric, along with Manhattan distance are special cases of Minkowski distance24:
When the power parameter for the Minkowski metric (p) is set to 2, we get the formula for the Euclidean distance, which we are considering in the code.
According to the documentation of scikit learn25, the value of the other main hyperparameter of kNN (k, number of neighbors) is set to 5 by default. This value does not guarantee the highest accuracy; thus, some experiments with k values up to 28 (also shown in Figure 8) highlight that the optimal value of k is equal to 4, which gives an accuracy of 62,5%.
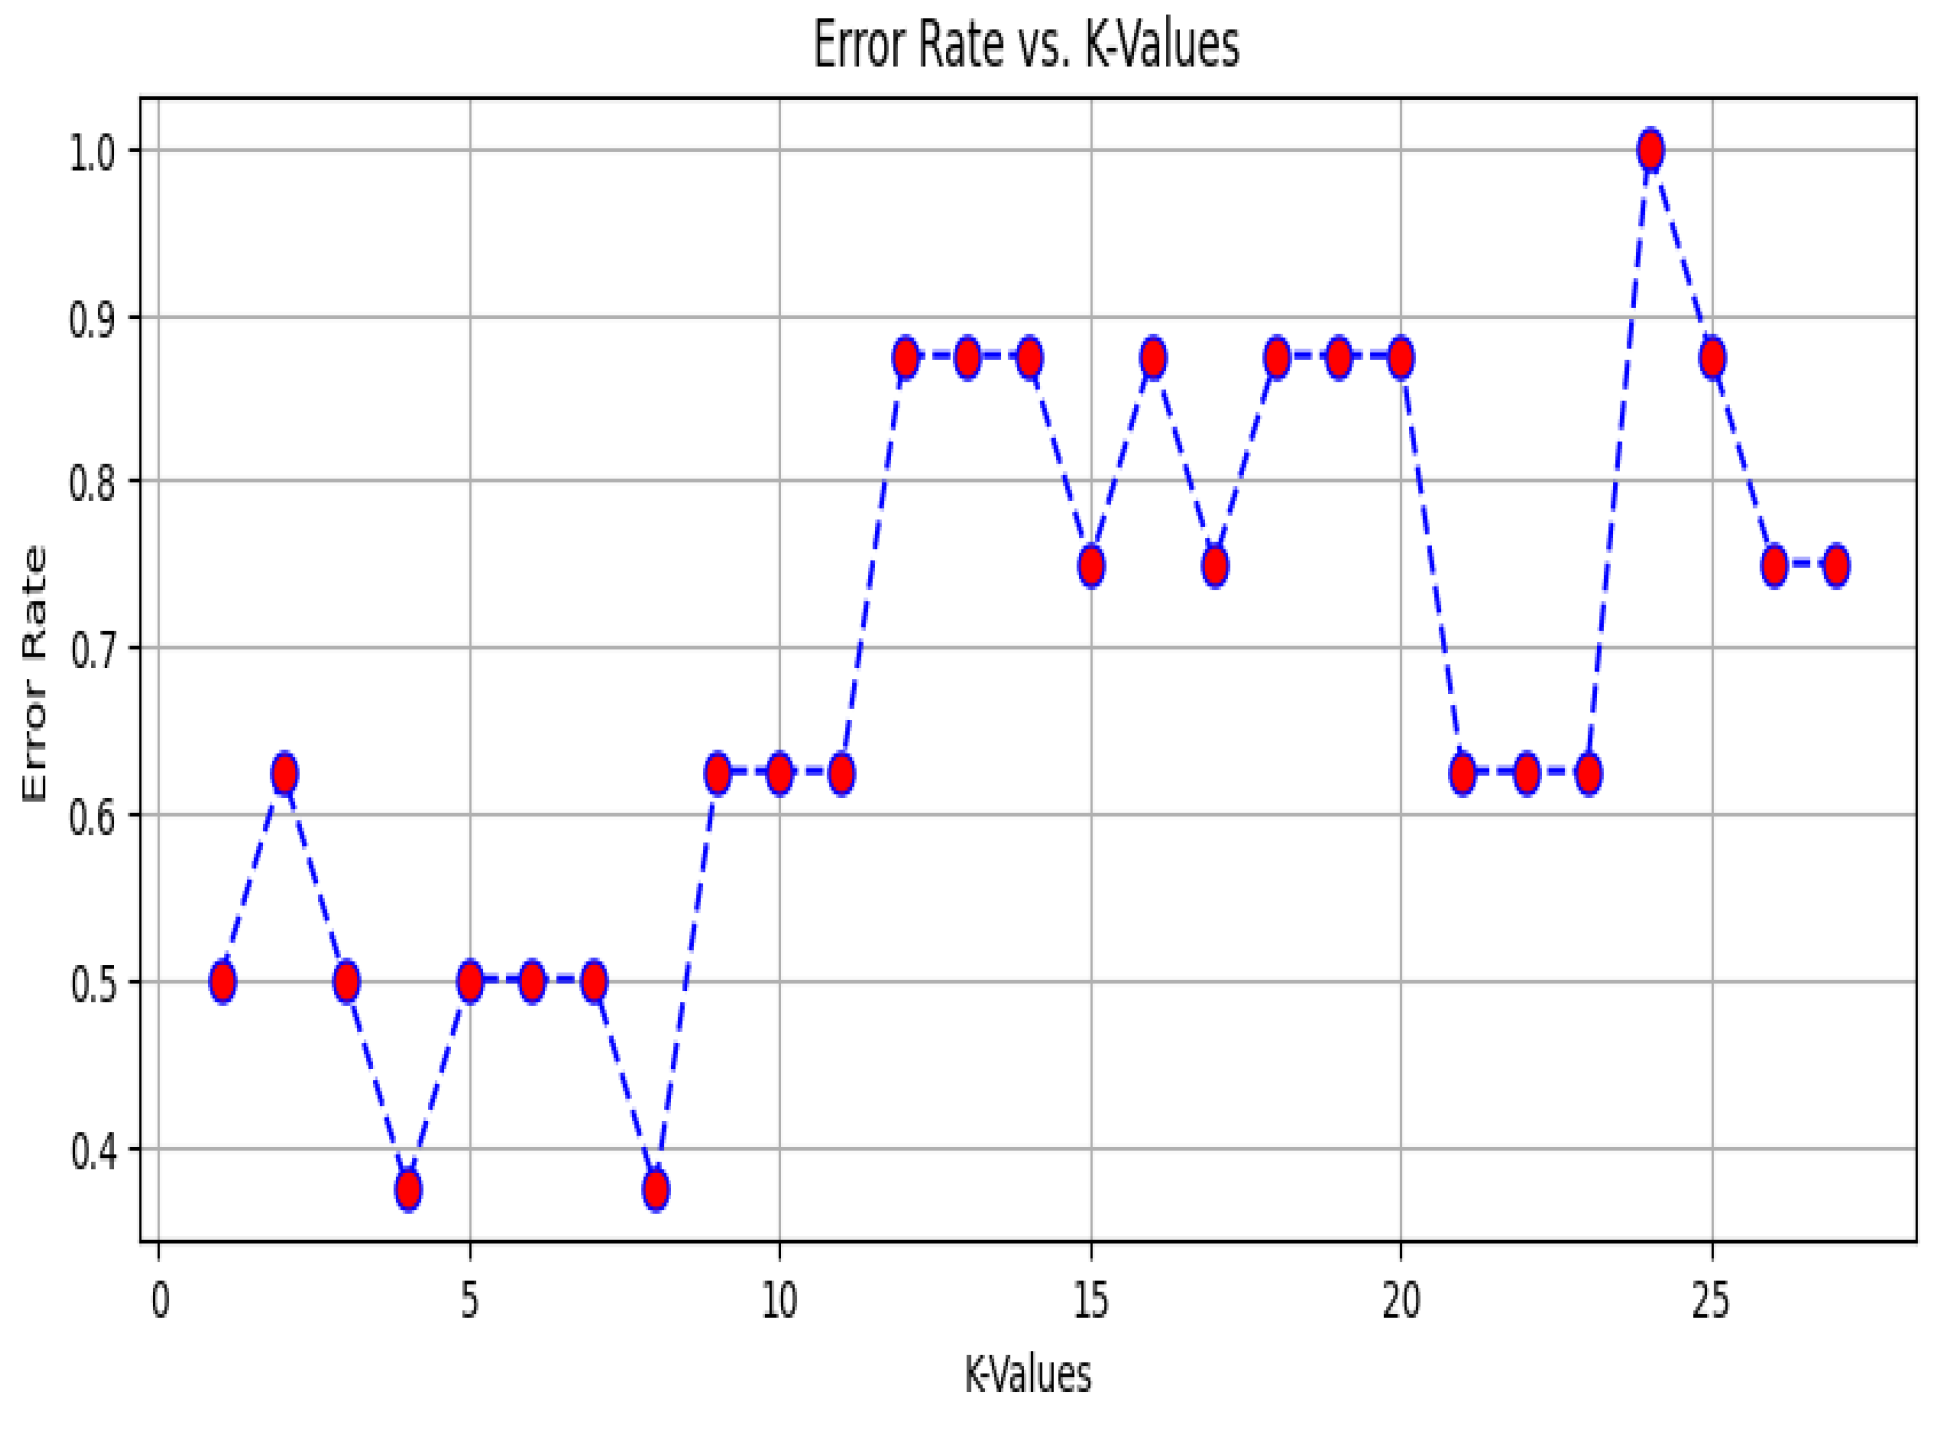
Another way to find the optimal value of k is to use a graph that describes the error rate for each of our k values in the specified range in Figure 9. From the graph, we have chosen the value of k = 4 because the lowest point (error) represents the best or most optimal value of k (Figure 9).
| Value of k | 1 | 2 | 3 | 4 | 5 | 6 | 7 | 8 | 9 | 10 | 11 | 12 | 13 | 14 | 15 | |
| Accuracy | 0.5 | 0.375 | 0.5 | 0.625 | 0.5 | 0.5 | 0.5 | 0.625 | 0.375 | 0.375 | 0.375 | 0.125 | 0.125 | 0.125 | 0.25 | |
Figure 8.
A number of nearest neighbors and their corresponding accuracy.
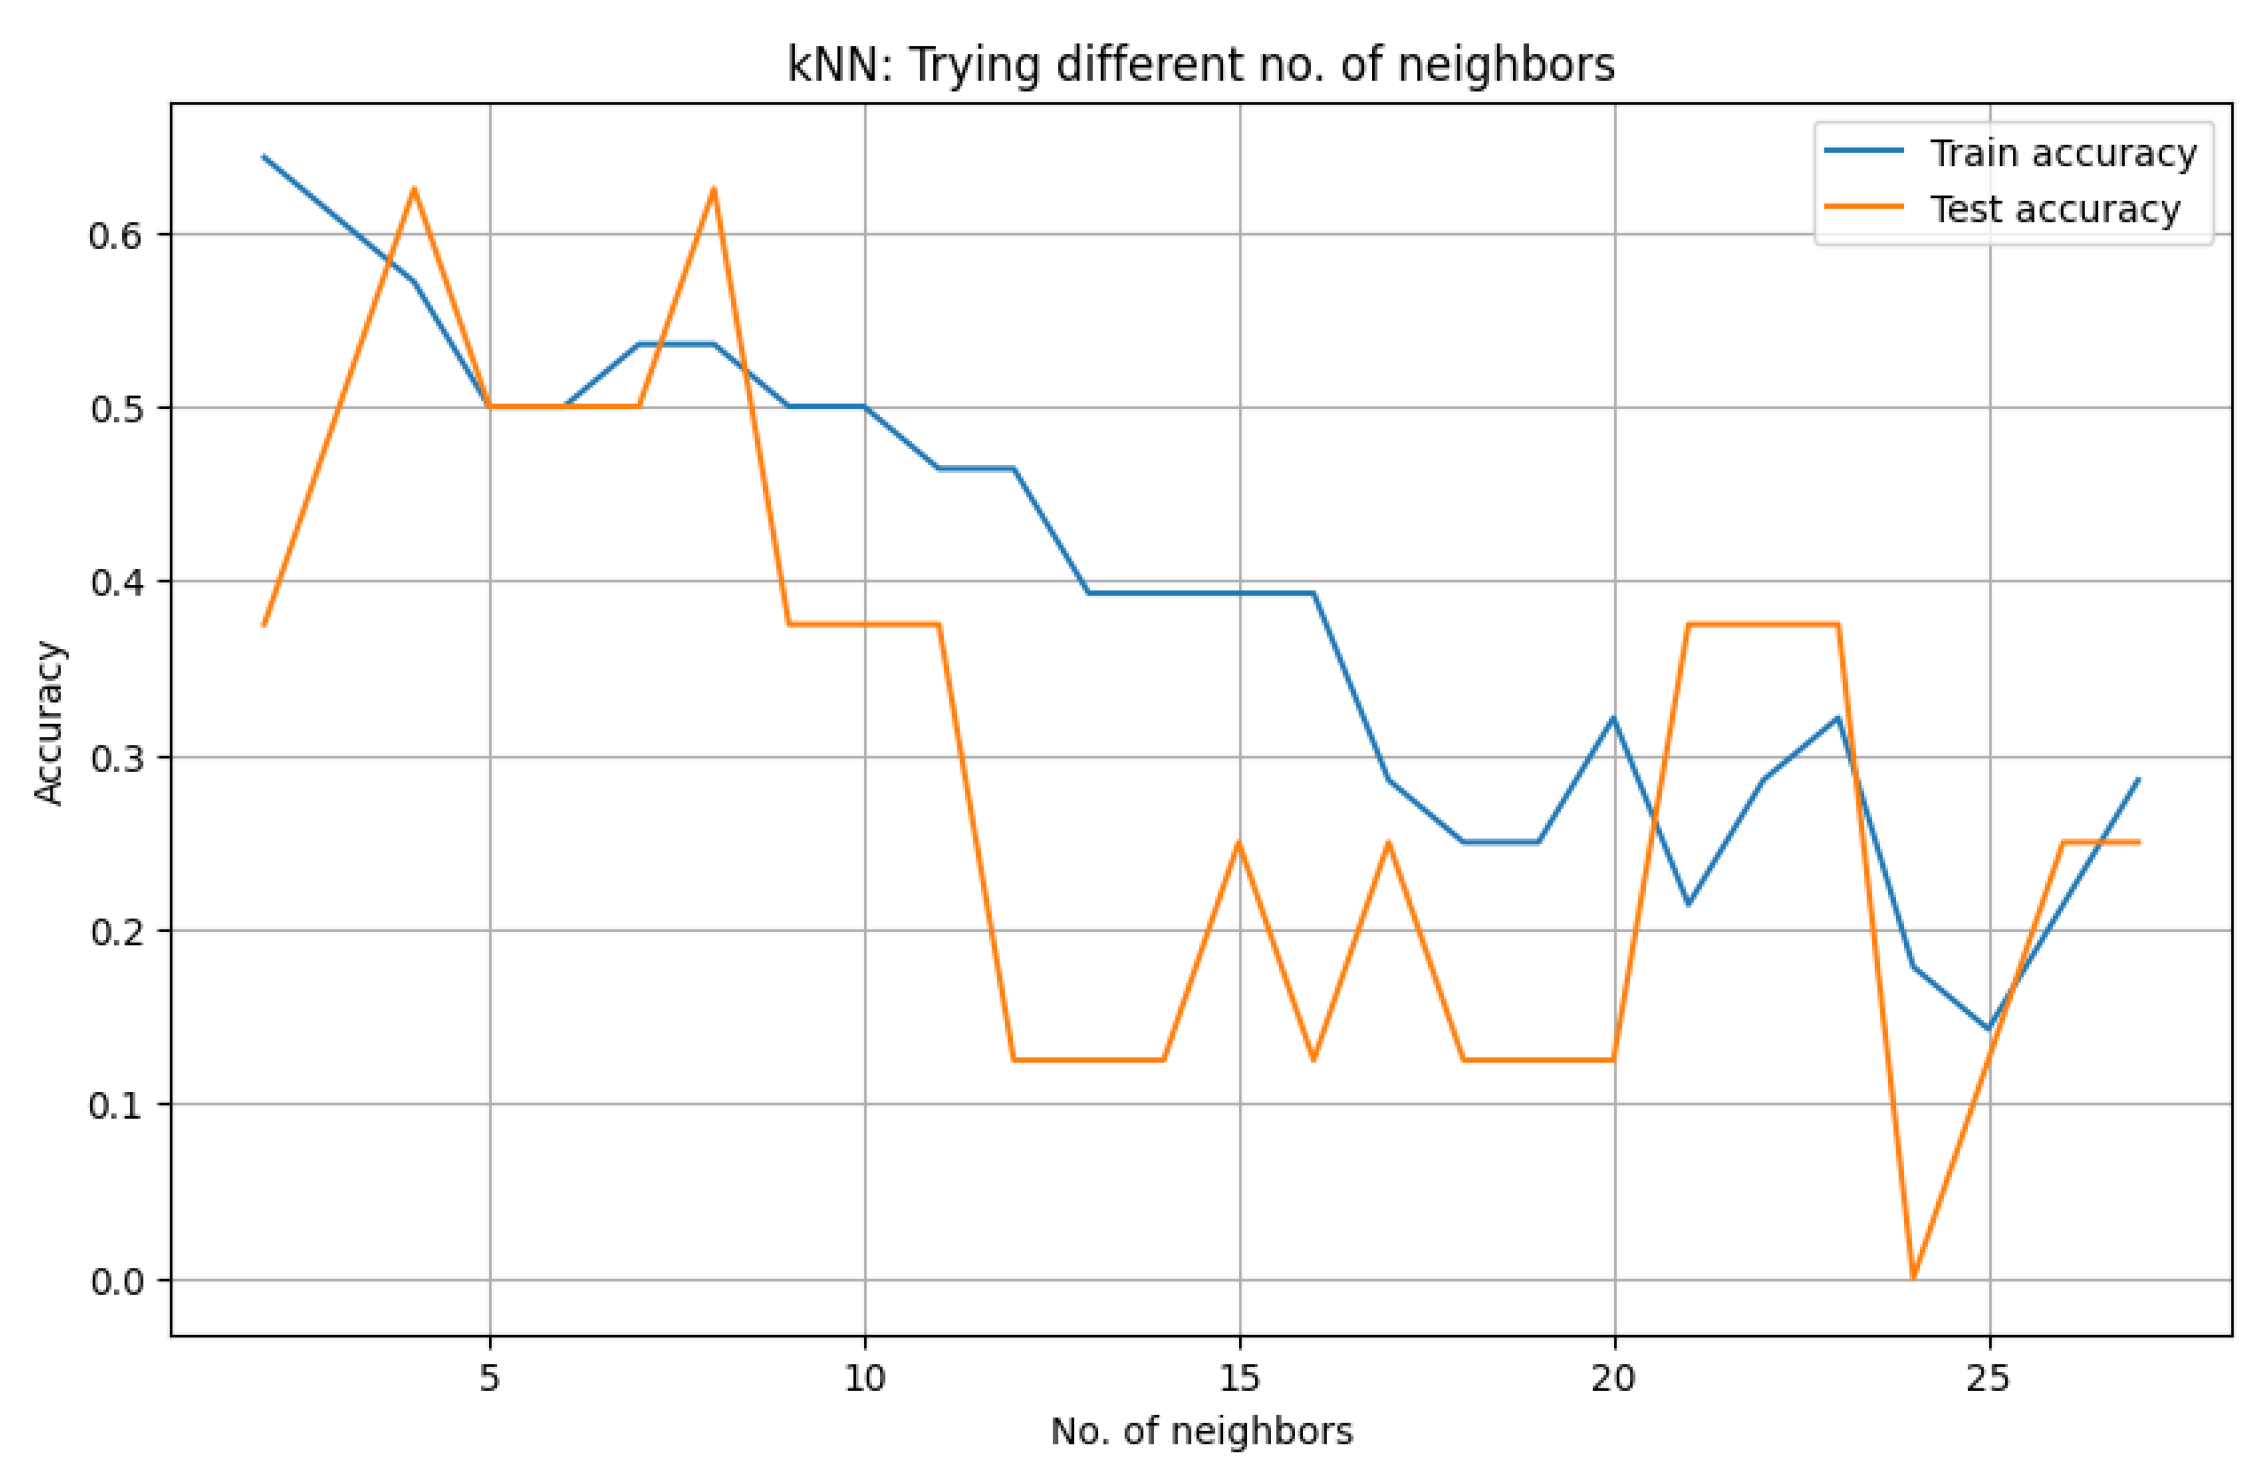
Figure 9.
Number of nearest neighbors and the corresponding error rate.
Hyperparameter Search
The process of Grid Search involves the creation of a grid of hyperparameters and searching for the combination that produces the highest validation score. In the case of the kNN classifier, we used it to optimize the neighbors’ parameter, which controls how many neighbors influence the classification decision. For example, we defined a parameter grid (param_grid = {‘n_neighbors’: np. range (2, 30, 1)}) to test neighbor values between 2 and 29. Using 5-fold cross-validation (KFold(n_splits=5)), the data was split into training and validation sets to evaluate each candidate value. The process ensured that the model was assessed on unseen data during each iteration, reducing the risk of overfitting (that usually happens for low values of k).
After evaluating all combinations, GridSearchCV identified the optimal number of neighbors, which was then used to train the final kNN model on the full training dataset. This approach led to a significant improvement in accuracy, thus improving the model performance.
The main reasons we proceeded with Grid Search rather than Randomized Search are that we are dealing with a relatively small number of hyperparameters and training a simple model, although it consumes considerable computational resources. In the future, we might train too many models, and the number of hyperparameters and their values will increase.
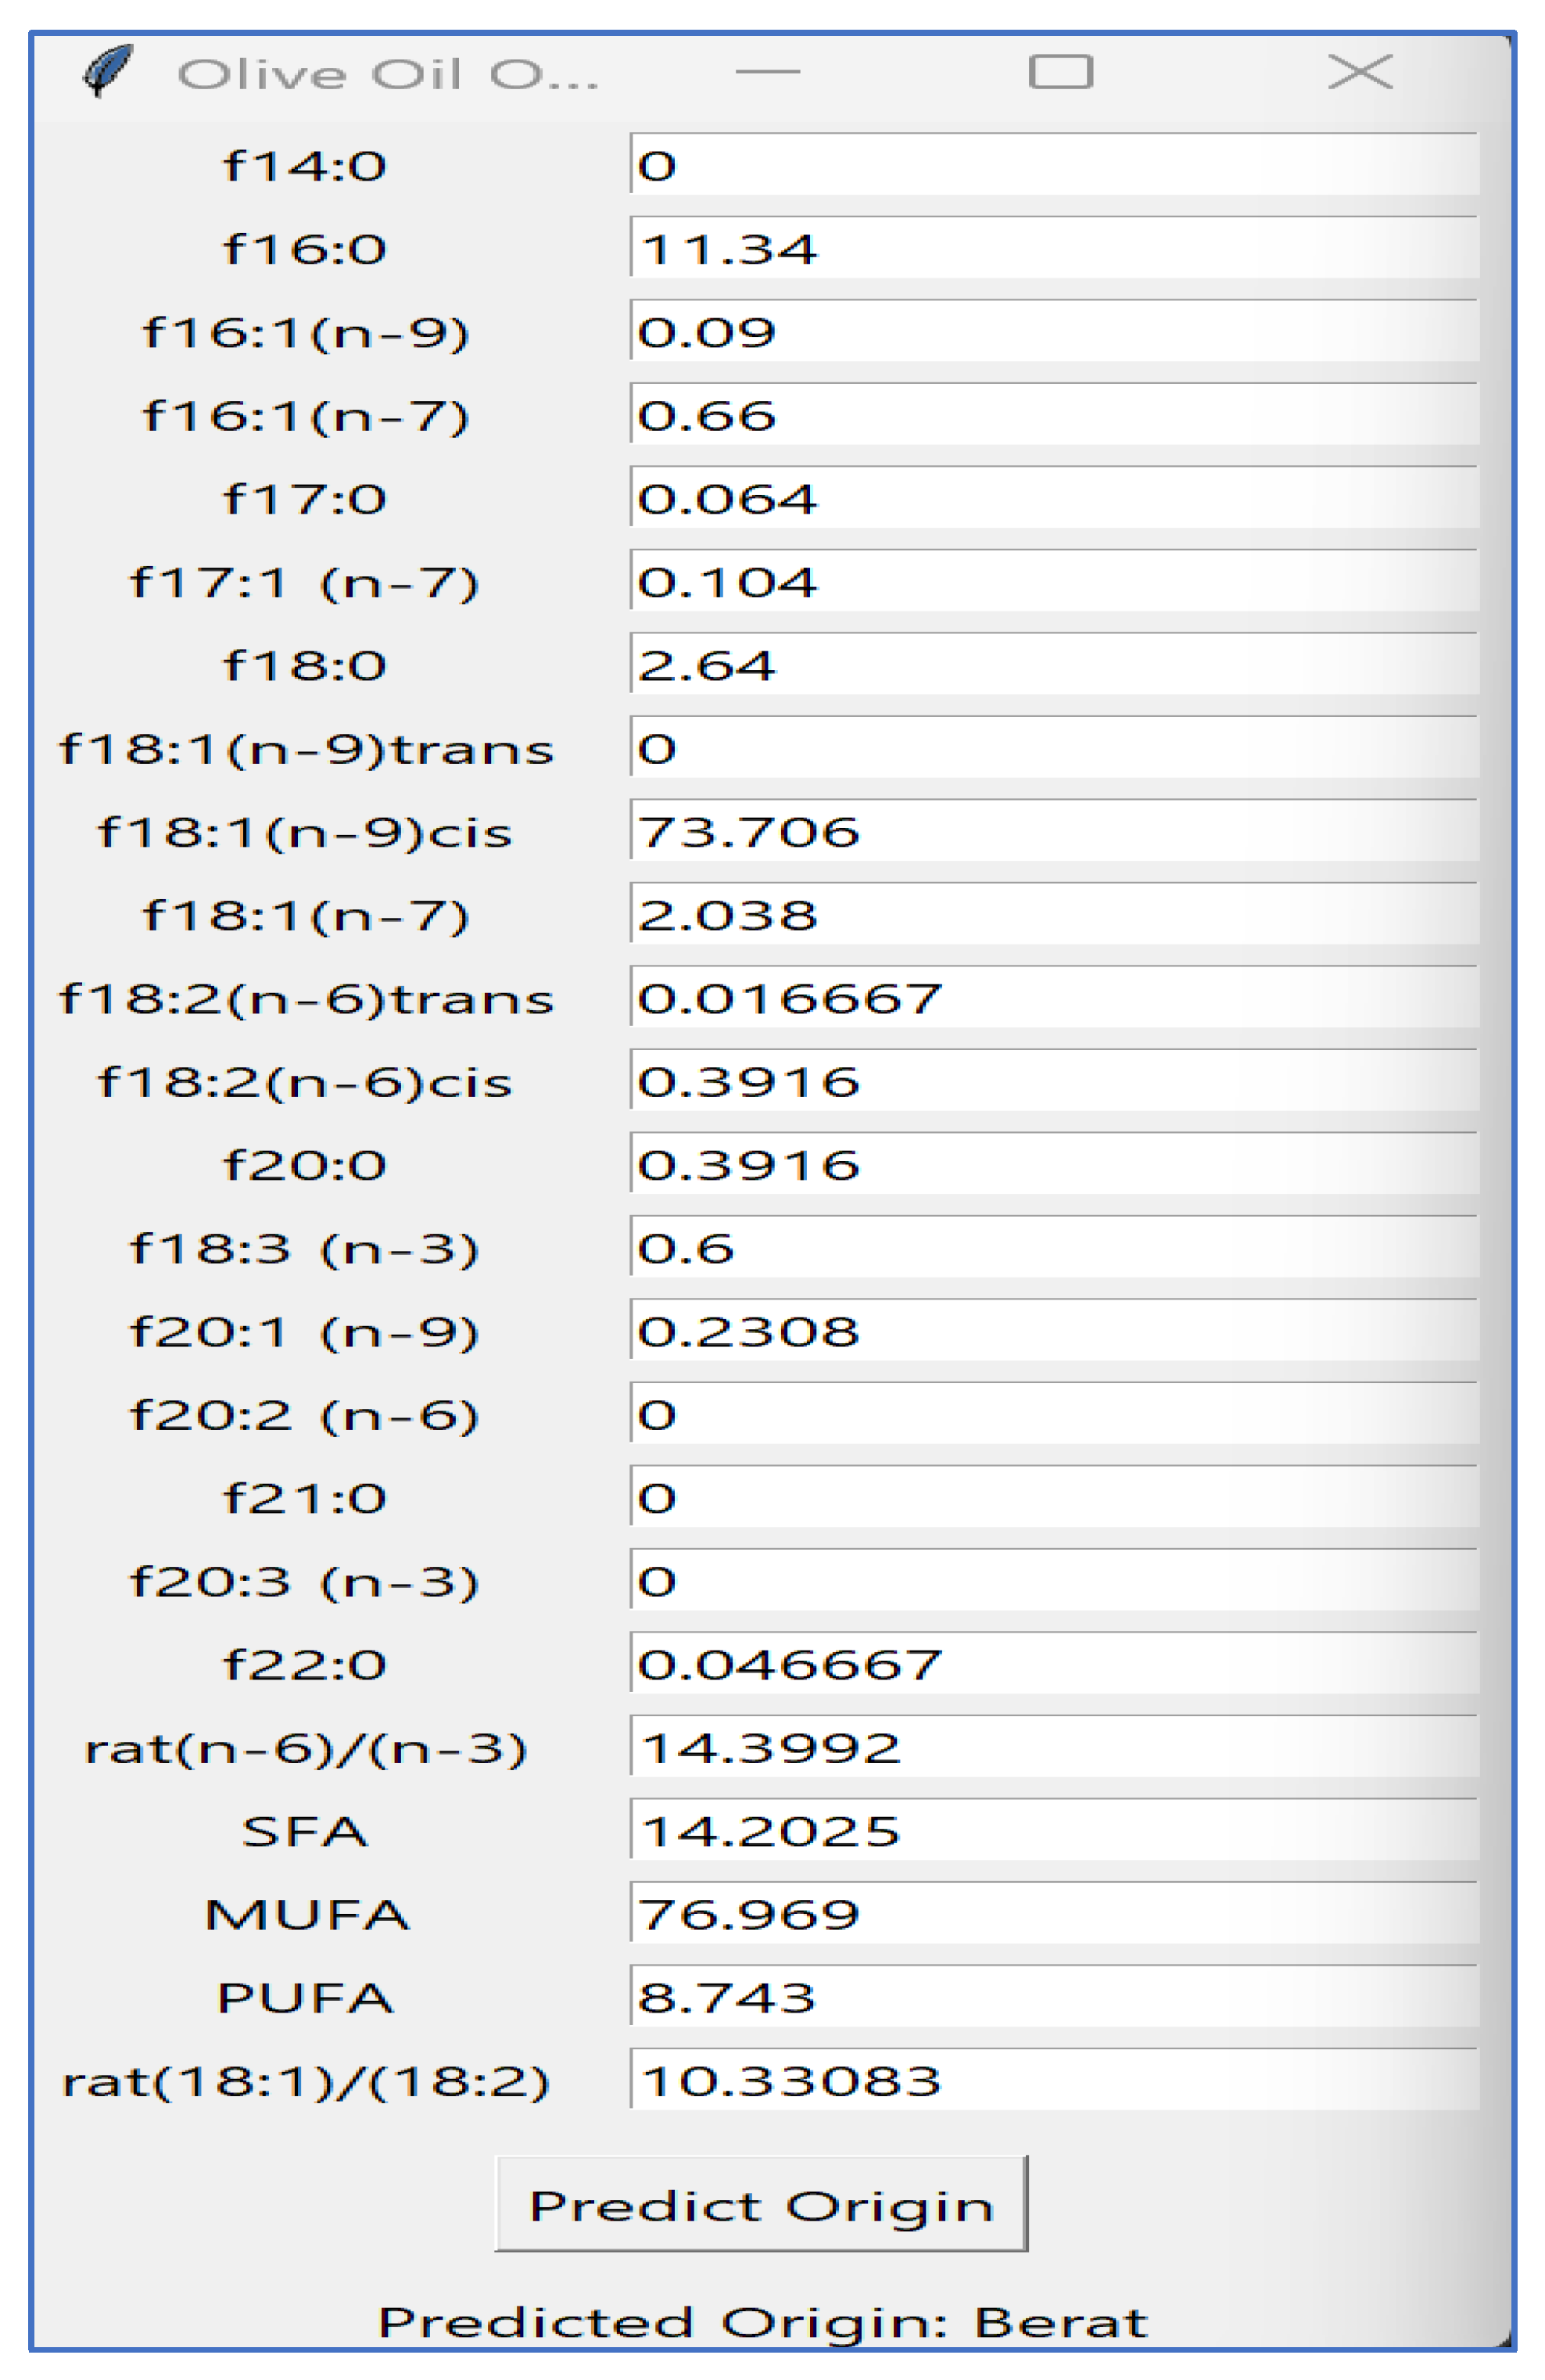
GUI of Olive Oil Origin Predictor
The Olive Oil Origin Predictor’s graphical user interface (GUI) is designed to classify the origin of mono-cultivar Albanian olive oil samples based on their chemical composition. It provides input fields for entering various fatty acid concentrations and oil composition parameters.
The user enters the values, and by clicking the "Predict Origin" button, the application employs a pre-trained machine learning model and a scaler to prepare the inputs and determine the origin of the olive oil sample. The predicted region appears below the button in real time. The interface is designed to be straightforward and user-friendly, dynamically updating the prediction while maintaining responsiveness through computations that run in a separate thread.
Figure 10.
Implementing the GUI.
Future Dataset Expansion
The dataset utilized in this research is currently small, consisting of limited samples from the Berat, Fier, and Vlora regions. However, as the study progresses, we anticipate a significant increase in the dataset size. This expansion will result from gathering more samples, potentially covering additional regions, and incorporating seasonal variations. The RF algorithm is particularly suited for this type of expansion as it can scale effectively and manage large datasets without sacrificing performance. Furthermore, as the dataset grows, the model’s capacity to generalize and provide precise predictions will be enhanced, leading to improved accuracy and reliability in determining the origin of OO.
Conclusion
Transforming the input characteristics of olive oil—discussed in the development phase—into predictions about its geographical origin enables us to verify the product’s authenticity and reduce the risk of adulteration. This is essential for fostering consumer trust and enhancing food safety standards. Additionally, pinpointing the origin of the olive oil, whether it comes from a particular region in Albania or another location, promotes labeling transparency and helps prevent consumer deception regarding the quality standards linked to certain origins.
The research findings indicate that the machine learning algorithms used, such as Logistic Regression, kNN, and SVM, have shown high accuracy in identifying the origins of olive oil, as reflected in robust performance metrics like accuracy, precision, and recall. This leads to improved “True Positive” rates in correctly identifying origin classes. By utilizing these precise classifications, the model can bolster quality control practices and aid in the effective traceability of Albanian mono-cultivar OOs. Ultimately, this study seeks to assist the olive oil industry in ensuring product authenticity, refining quality assurance measures, and safeguarding consumers against fraud.
References
- Aiello, G. 2024. An Artificial Intelligence-based tool to predict “unhealthy” wine and olive oil. Journal of Agriculture and Food Research 16: 101179. [Google Scholar] [CrossRef]
- Aminu, S., A.E. Eviwiekpaefe, Y. Abdulhadi, U. Garba, and Y. Zainab. 2022. Evaluation of Some Selected Breast Cancer Classification Algorithms in Nigeria. Journal of Biochemistry, Microbiology and Biotechnology 10: 29–34. [Google Scholar] [CrossRef]
- Boskou, D., G. Blekas, and M. Tsimidou. 2006. Olive Oil Composition. In Olive Oil Chemistry and Technology 2nd Edition (Ed. Dimitrios Boskou). AOCS Press, Champaign, Illinois, USA: pp. 41–72. [Google Scholar]
- Clarin, J.A. 2022. Comparison of the Performance of Several Regression Algorithms in Predicting the Quality of White Wine in WEKA. International Journal of Emerging Technology and Advanced Engineering 12, 7: 20–26. [Google Scholar] [CrossRef] [PubMed]
- Da Costa, N.L., L.A. Valentin, I.A. Castro, and R.M. Barbosa. 2021. Predictive modeling for wine authenticity using a machine learning approach. Artificial Intelligence in Agriculture 5: 157–162. [Google Scholar] [CrossRef]
- Kothawade, R. D. 2021. Wine Quality Prediction Model Using Machine Learning Techniques. Available online: https://www.diva-portal.org/smash/get/diva2:1574730/FULLTEXT01.pdf.
- International Olive Council (IOC). 1996. World Olive Encyclopaedia. International Olive Oil Council: Madrid, Spain: p. 488. ISBN 9788401618819. [Google Scholar]
- Nanou, E., N. Pliatsika, and S. Couris. 2023. Rapid Authentication and Detection of Olive Oil Adulteration Using Laser-Induced Breakdown Spectroscopy. Molecules 28, 24: 7960. [Google Scholar] [CrossRef]
- Niyogisubizo, J., J. de D.. Ninteretse, E. Nziyumva, M. Nshimiyimana, E. Murwanashyaka, and E. Habiyakare. 2024. Towards Predicting the Quality of Red Wine Using Novel Machine Learning Methods for Classification, Data Visualization and Analysis. Artificial Intelligence and Applications, 1–12. [Google Scholar] [CrossRef]
- Ordukaya, E., and B. Karlik. 2017. Quality Control of Olive Oils Using Machine Learning and Electronic Nose. Journal of Food Quality 9272404: 7. [Google Scholar] [CrossRef]
- Patkar, G. S., and D. Balaganesh. 2021. Smart Agri Wine: An Artificial Intelligence Approach to Predict Wine Quality. Journal of Computer Science 17, 11: 1099–1103. [Google Scholar] [CrossRef]
- Ranaweera, R.K., G. Osmond, A.M. Gilmore, D.L. Capone, S.E.P. Bastian, and D.W. Jeffery. 2021. Authenticating the geographical origin of wine using fluorescence spectroscopy and machine learning. IVES Conference Series, Infovine. [Google Scholar]
- Sheth, V., U. Tripathi, and A. Sharma. 2022. A Comparative Analysis of Machine Learning Algorithms for Classification Purpose. Procedia Computer Science 215: 422–431. [Google Scholar] [CrossRef]
- Topi, D., A. Amanpour, H. Kelebek, and S. Selli. 2019. Screening of aroma profiles in Albanian cvs. Kalinjot and Bardhi Tirana olive oils using purge and trap extraction technique. RISG Rivista Italiana Sostanze Grasse 96, 2: 101–108. [Google Scholar]
- Topi, D., G. Guclu, H. Kelebek, and S. Selli. 2020. Comparative elucidation of phenolic compounds in Albanian olive oils using LC-DAD-ESI-MS/MS. Journal of Liquid Chromatography & Related Technologies 43, 5–6: 203–212. [Google Scholar] [CrossRef]
- Topi, D., G. Guclu, H. Kelebek, and S. Selli. 2021. Edited by M. Akram. Olive Oil Production in Albania, Chemical Characterization, and Authenticity. In Olive Oil-New Perspectives and Applications. IntechOpen. Rijeka, Croatia. [Google Scholar] [CrossRef]
- Topi, D., A. Topi, G. Guclu, S. Selli, T. Uzlasir, and H. Kelebek. 2024. Targeted analysis for the detection of phenolics and authentication of Albanian wines using LC-DAD/ESI–MS/MS combined with chemometric tools. Heliyon 10: 11. [Google Scholar] [CrossRef] [PubMed]
- Topi, D., F. Thomaj, and E. Halimi. 2012. Virgin Olive Oil Production from The Major Olive Varieties in Albania. Agriculture and Forestry 58, 2: 87–95. [Google Scholar]
- University of Texas-UTEXAS. 1990. Map of Land Use in Albania. Available online: http://www.lib.utexas.edu/maps/atlas_east_europe/albania-landuse.jpg.
- Vega-Márquez, B., I. Nepomuceno-Chamorro, N. Jurado-Campos, and C. Rubio-Escudero. 2020. Deep Learning Techniques to Improve the Performance of Olive Oil Classification. Frontiers in Chemistry 7: 929. [Google Scholar] [CrossRef] [PubMed]
- Velo, S., and D. Topi. 2015. Study of Kalinjoti Extra Virgin Olive Oils, Fatty Acids Profiles and trans-Isomers. Journal of Hygienic Engineering and Design 12: 129–133. [Google Scholar]
- Velo, S., and D. Topi. 2017. Characterization of Kalinjot and Nisioti Monocultivar Virgin Olive Oils produced in Albania. Asian Journal of Chemistry 29, 6: 1347–1350. [Google Scholar] [CrossRef]
- Yakar, Y., and K. Karada. 2022. Identifying Olive Oil Fraud and Adulteration Using Machine Learning Algorithms. Química Nova 45, 10. [Google Scholar] [CrossRef]
- Zaza, S., M. Atemkeng, and S. Hamlomo. 2024. Edited by F. Tchakounte, M. Atemkeng and R.P. Rajagopalan. Wine Feature Importance and Quality Prediction: A Comparative Study of Machine Learning Algorithms with Unbalanced Data. In Safe, Secure, Ethical, Responsible Technologies and Emerging Applications. SAFER-TEA 2023. Lecture Notes of the Institute for Computer Sciences, Social Informatics and Telecommunications Engineering. Springer, Cham: vol 566. [Google Scholar] [CrossRef]
- Available online: https://www.geeksforgeeks.org/k-nearest-neighbours/.
- Available online: https://scikit-learn.org/1.5/modules/generated/sklearn.neighbors.KNeighborsClassifier.html.
Figure 1.
Annual and permanent crops of Albania (Map of Land Use in Albania, 1990).
Figure 1.
Annual and permanent crops of Albania (Map of Land Use in Albania, 1990).
Disclaimer/Publisher’s Note: The statements, opinions and data contained in all publications are solely those of the individual author(s) and contributor(s) and not of MDPI and/or the editor(s). MDPI and/or the editor(s) disclaim responsibility for any injury to people or property resulting from any ideas, methods, instructions or products referred to in the content. |
© 2025 by the authors. Licensee MDPI, Basel, Switzerland. This article is an open access article distributed under the terms and conditions of the Creative Commons Attribution (CC BY) license (https://creativecommons.org/licenses/by/4.0/).
Copyright: This open access article is published under a Creative Commons CC BY 4.0 license, which permit the free download, distribution, and reuse, provided that the author and preprint are cited in any reuse.


