
Submitted:
08 January 2025
Posted:
11 January 2025
You are already at the latest version
Abstract
Cancer remains a pressing concern both in Iran and globally, profoundly impacting patients’ well-being. Understanding and predicting the Quality of Life (QL) of cancer patients is helpful for effective healthcare. This study forecasted the QL of Iranian women with breast cancer (BC) using Machine Learning (ML) regression models. A robust dataset comprising 1114 post-treatment breast cancer patients from four Iranian hospitals was meticulously collected. Participants completed three questionnaires post-treatment, which provided insights into their QL and hope of life (HL). Rigorous data preprocessing, feature selection, model fitting, parameter optimization, and evaluation were performed. Results revealed a significant positive correlation between hope and QL. Various factors, including general health status, physical well-being, functionality, pain, sleep, self-efficacy, economic circumstances, disease symptoms, and hope for life, exerted substantial influence on the QL of Iranian patients. Notably, boosting models, notably gradient boosting machines and XGBoost, exhibited superior predictive performance (GBM= 86.61%, XGBoost= 85.41%). These findings have profound implications for informing health policies and interventions aimed at enhancing the QL of cancer patients. Significantly, this research represents the first attempt to predict QL in Iranian patients, marking a significant contribution to the field.
Clinical trial registration numbers: IR.NIMAD.REC.1397.322 and date of registration: Friday 22 June 2018.
Keywords:
Breast cancer
; Machine learning
; Quality of Life
; Regression Analysis
; Hope life
1. Introduction
Cancer has become a crucial topic in public health, threatening the world, and breast cancer is one of the most prevalent types of cancer among women [1]. Today, with advancements in prevention, diagnosis, and treatment methods, survival rates for this disease have increased. According to conducted research, the average survival rate for women with breast cancer after 5 years is approximately 90%, and after 10 years, it is approximately 84%. Breast cancer results from the uncontrolled growth of abnormal cells in breast tissue, including ducts (tubes that transfer milk to the nipple) and lobules (glands that produce milk). This cancer is the most common type among Iranian women, constituting nearly one-fourth of all cancers [2]. Recent studies evaluating the incidence of this cancer in Iran report a lower average age of patients compared with other parts of the world. In other words, the peak incidence in Iranian women occurs in the fourth and fifth decades of life, a decade earlier than the global peak incidence [3]. As you know, QL is a multidimensional structure that includes domains such as physical, social, and psychological. It reflects the well-being of individuals and communities, delineating both negative and positive life characteristics [2]. Breast cancer patients have various concerns regarding treatment, family, and financial matters. Although medical professionals provide care, patient concerns are sometimes overlooked in clinical settings [4]. Conversely, the prevalence of depression and anxiety in patients with breast cancer is approximately 30%. The patient’s adaptation to breast cancer treatment significantly impacts their QL. Consequently, appropriate and timely interventions may be crucial in improving patient adaptation and QL [5].
Furthermore, hope, defined as an individual’s belief in the ability to achieve goals, especially in situations where the individual can influence the outcome, plays a significant role. Pain resulting from chemotherapy can impede the adaptation of cancer patients to treatment and affect subsequent outcomes. A qualitative study conducted in 2022 demonstrated that hope is a positive coping strategy for cancer patients, fostering courage and resilience [6]. In this research, the relationship between HL and QL is investigated and the amount of QL is predicted. Shen et al., exploring the relationship between hope and life of quality, proved that income, hope, self-efficacy, and social support are positive predictors of quality of life, whereas cancer stage is a negative predictor. They recommended that support programs and interventions aimed at increasing hope levels, self-efficacy, and social support during the care of this group receive attention [7]. In 2022, Li et al. studied the relationship between HL and QL in women who have undergone breast cancer chemotherapy. Regression analysis revealed that the QL of patients was significantly associated with age, marital status, education level, chemotherapy cycle, and hope. However, researchers believe that further studies are needed to determine whether nurses can influence this aspect of care [6]. Quality of Life is a crucial issue for cancer patients. According to the Savić et al. findings, general, physical, self-efficacy, and hope parameters significantly affect the QL of women with breast cancer in Iran [8]. In 2023, Zhang et al. examined the effectiveness of family-centered positive psychological intervention on resilience, hope, perceived benefits, and QL in breast cancer patients and their caregivers.
The study findings showed that implementing a family-centered positive psychological intervention led to significant improvements in psychological well-being and quality of life for both breast cancer patients and their caregivers [9]
All studies that investigated the relationship between QL and hope are listed in Table 1.
With the emergence of medical databases containing extensive information related to quality of life, it is possible to predict quality of life using machine learning techniques. Machine learning models have been used to assess QL in various cancer fields. For example, early detection and intervention for lymphedema are essential to improve QL in breast cancer survivors. Therefore, Wei et al. presented a predictive model for the early detection of lymphedema associated with breast cancer.
Finally, the output model has been implemented as an open-access, web-based application, which allows users to separately estimate the likelihood of lymphedema in real time [10]
However, a decrease in QL in thyroid cancer patients after thyroidectomy is common, but we can notice the lack of predictive methods to estimate the extent of QL reduction. Because of the studies conducted in 2022, researchers presented a model to predict QL in thyroid cancer patients with relatively high accuracy. They believe that these findings should be clinically employed to optimize healthcare interventions [11]. Appropriate and timely interventions may enhance the adaptability, resilience, and QL of breast cancer patients during the treatment process and post-disease period.
Nutinen et al. conducted a study to investigate the effect of machine learning in a clinical decision support system to improve physical performance in predicting patients’ QL during the treatment process.
They found that the performance of physicians in evaluating patients’ QL increased using machine learning model predictions [12]
As sleep disturbance is a primary symptom of breast cancer and can seriously affect QL during and years after treatment, a study in Japan recommends routine screening. Their predictive model, which uses machine learning, provides important clinical insights for early diagnosis of insomnia and intervention in breast cancer survivors [13]. On the one hand, artificial intelligence data analysis provides the highest predictive score for stress hormones and inflammation in breast cancer survivors. Disease control, health, and QL are important factors associated with the best predictive outcomes [14].
In 2023, Nascimben et al. undertook a significant study focused on Italian patients grappling with breast cancer (BC) and experiencing upper limb unilateral lymphedema (BCRL). BCRL, a condition with multifaceted origins, poses considerable challenges, impacting not only physical capabilities but also overall QL for breast cancer survivors over the medium to long term. Leveraging advanced methodologies, the researchers meticulously analyzed data to stratify the risk of BCRL. They employed unsupervised low-dimensional data embeddings and cutting-edge clustering techniques to discern distinct patient groups and their respective characteristics. Through this rigorous analysis, the researchers were able to identify factors associated with heightened risk within specific clusters, thus shedding light on the nuanced dynamics of BCRL progression. The culmination of these efforts yielded a comprehensive prognostic map, delineating three distinct patient clusters, each characterized by its unique attributes and associated risk factors [15]
Kang et al. used a machine learning algorithm to analyze data collected from patients with breast cancer along different survivorship trajectories to identify patient-centered factors associated with their QL. The study ultimately identified important factors related to QL among breast cancer survivors across various survival trajectories. Based on these results, emotional and physical functions were the most important features before surgery and within 1 year after surgery, respectively. [16]
In 2024, Choe et al. harnessed the power of machine learning (ML) to craft predictive models concerning diminished Quality of Life (QL) among post-treatment cancer survivors in South Korea. As outlined in the findings, the Random Forest (RF) model outshone its counterparts—support vector machine and extreme gradient boosting—alongside three deep learning models in terms of efficacy. Notably, factors such as survivorship concerns encompassing distress, pain, and fatigue emerged as pivotal influencers of compromised QL. This ML-driven framework unveiled in the study exhibits promise in bolstering clinical decision-making processes facilitating the early identification of survivors susceptible to diminished QL [17].
All studies examining the application of machine learning in predicting QL are presented in Table 2.
In this study, we examined the relationship between hope for life and quality of life(QL), factors influencing QL, and the best machine learning model for predicting QL in breast cancer survivors in Iran. This research not only utilizes hope for life in the prediction model but also, for the first time, focuses on predicting the QL of Iranian patients, which is considered a prominent innovation in this field of research.
2. Method
In this article, we aimed to predict QL among breast cancer (BC) survivors in Iranian women and investigate the influential factors. As depicted in Figure 1, firstly, we collect the data and then proceed with data preprocessing and preparation. Subsequently, we develop a comprehensive model that incorporates feature selection, parameter tuning, and model fitting to predict the QL. Finally, we evaluate the model’s performance using metrics such as Mean Squared Error (MSE), Mean Absolute Error (MAE), and R-squared, comparing and contrasting the results.
3.1. Problem Statement Analysis
In contemporary society, QL is vital parameter for assessing the status of communities. Compared with the past, this issue has gained greater importance and is considered an influential sociological criterion. Meanwhile, given that breast cancer is prevalent among women, investigating and predicting the Quality of Life(QL) of women affected by this type of cancer can be a significant step toward improving this aspect of society.
Recent research indicates a strong correlation between breast cancer and individuals’ mental well-being and hope in life. Therefore, in addition to data related to the QL, special attention has been given to collecting information regarding hope life.
This study aimed to utilize regression models to forecast the QL of Iranian breast cancer patients, aiding advancement in associated research and offering valuable insights.
3.2. Data Collection
In this research, the dataset of the National Institute for Medical Research Development (NIMAD) was used. The dataset of the research consists of the information of 1114 breast cancer patients who were collected after treatment through four Iranian specialized hospitals: Imam Hussein, Imam Khomeini, Mahdiyeh, and Khatam al-Anbia. They collected data over one year, and after treatment, patients completed three questionnaires, consisting of EORTC_C30, EORTC_BR23, and the Schneider Hope Scale.
3.3. Ethical Approval and Consent to Participate
This study was approved by the National Institute for Medical Research Development (NIMAD), Iran (reference number: IR.NIMAD.REC.1397.322, registration date: June 22, 2018). All procedures were performed in accordance with relevant guidelines and regulations. Written informed consent was obtained from all participants by NIMAD in accordance with these guidelines.
3.4. Dataset Examination
The European Organization for Research and Treatment of Cancer (EORTC_C30) established the Quality of Life(QL) Study Group in 1980, initiating a unified approach for assessing patients participating in clinical trials in 1986. This questionnaire comprises functional scales, symptom scales, QL scales, and financial impact reported by cancer patients [41].
According to Table 3, using the EORTC-C30 questionnaire, the dimensions applied in this questionnaire can be used to assess QL in cancer patients.
The percentage frequency of questions covering each dimension is specified in Figure 2.
Drawing from the EORTC-30 questionnaire, the findings illustrate that Physical aspects comprised 19% of the responses, whereas social functioning accounted for 11.5%.
“EORTC_BR23”: This scale encompasses specific subscales concerning psychopathology. The questionnaire addresses symptoms and side effects associated with various treatment methods. It includes aspects such as body image, sexual functioning, and future perspectives [41].
Table 4 shows the dimensions used in the questionnaire to assess the QL of breast cancer patients.
Figure 3 shows the percentage frequency of questions related to each dimension.
Incorporating data from the EORTC-BR23 questionnaire, the analysis revealed that General aspects accounted for 26.4% of the responses, whereas symptoms and signs constituted 15.1%.
Using the Schneider Hope Scale, we can measure the level of hope in individuals. This questionnaire evaluates two dimensions of hope: energy for achieving goals in life and personal plans for achieving goals in life. The Scoring method was conducted on the basis of a 5-point Likert scale [42]
Table 5 shows the dimensions used by the questionnaire to assess hope life.
Figure 4 shows the percentage frequency of questions related to each dimension.
Based on the Schneider Hope Scale, the analysis indicated that Anticipation of Future Success accounted for 25% of the responses, while Effort constituted 33.3%.
These extensive and cohesive data was carefully gathered from reputable hospitals in Iran, improving the accuracy and validity of the research findings.
3.5. Data Preprocessing
Data preprocessing is a crucial stage in data analysis and modeling. This stage contributes to the precision and validity of the analysis and modeling results, preventing the impact of unintended data variations.
The data-cleaning stage was performed as follows:
- Removal of Duplicate Data
- Fill Null Data with Median
In the next stage, the dataset was encoded. As you know, when dealing with categorical data, it is necessary to convert them into numerical values; therefore, according to Table 6 and Table 7, the categorical datasets were encoded to the numerical values.
- Feature Scaling
In data preprocessing, we used feature scaling to align the range of variations for all features. This helps standardize the effect of all factors. In this study, we employed the standardization method, which is in Equation 1. After this transformation, the features exhibit a mean and standard deviation of 0 and 1 [43].
- 2.
- Statistical Analysis
Various statistical analysis methods were used to explore the connection between hope and QL in the dataset of this study:
- I.
- General Linear Model (GLM): The GLM explores the impact of various independent variables on a dependent variable. By accounting for other variables, it offers a versatile model [44].
- II.
- Analysis of Variance (ANOVA): ANOVA is a robust method for comparing variations between groups, allowing for statistical comparisons among more than two groups [45].
3.6. Modeling
The process of fitting the model is a crucial and fundamental stage in machine learning and data analysis. During this stage, a machine learning model learns from the training data and strives to make the best possible predictions for the data.
3.6.1. Feature Selection
Feature selection is a crucial stage in the data analysis and machine learning process that significantly impacts the performance of the models. In this stage, essential and meaningful features are chosen from the available variables in the data to create a more accurate and efficient model.
Feature selection involves either eliminating or selecting several variables based on their importance. This selection can be performed using statistical sampling methods or machine learning models, depending on the knowledge acquired in the problem domain. The primary purpose of feature selection is to enhance model performance, decrease data dimensions, and avoid overfitting in models [46].
We decided to use the mutual information approach for feature selection in this study because of its ability to capture the connections effectively between variables. Mutual Information measures the information gained about one variable from observing another. Therefore, the most important features were identified to provide valuable information to the predictive model. Moreover, mutual information is essential in real-world datasets where feature relationships may not be linear or direct. Furthermore, mutual information does not depend on specific data distribution, making it suitable for all datasets with different characteristics.
Moreover, the mutual information approach provides a systematic method for selecting features without requiring complex parameter adjustments or assumptions about data distribution. The mutual information approach identifies and preserves the most informative features while reducing the dataset’s dimensionality. This ultimately leads to improved model performance, enhanced generalization, and greater interpretability of the resulting machine-learning models.
3.6.2. Spilling Dataset
In the healthcare dataset, we allocate 60% of the data as “training data” for the model to learn. Then, we set aside another 20% as “validation data” to evaluate the model. If necessary, we repeated the training phase to enhance the model. The remaining 20% of the data is designated as “test data,” which the model has never seen, Table 8. Therefore, we evaluate it by its error.
3.6.3. Regression Models
Throughout model fitting, the model uncovers information from the training data and recognizes patterns and connections between input features and the desired output. Because of the continuous data and small dataset size, we employed regression models. In additionally, the models are classified into two groups: basic algorithms and advanced algorithms. The basic models encompass Random Forest Regression, k-Nearest Neighbors Regression, Decision Tree Classification, and Regression, whereas the advanced models include Extreme Gradient Boosting, AdaBoost, and Gradient Boosting Machines.
3.6.4. Model Parameter Optimization
When fitting machine learning models, they have parameters that can be adjusted to optimize the model’s performance. Optimizing these parameters is crucial to ensure that the model delivers the best performance [47].
In this study, the grid search method was selected for parameter optimization because of its comprehensiveness and simplicity. The Grid search systematically explores a predefined set of hyperparameters, covering a wide range of possible values for each parameter. This exhaustive search approach ensures that no combination of parameter values is overlooked, thereby increasing the likelihood of finding the optimal configuration for the model.
3.6.5. Model Evaluation
Evaluating machine learning models is crucial to ensure that the selected model performs well on test data and provides accurate predictions. Various evaluation metrics are used for this purpose, allowing comparison between different models.
- i
- Mean Squared Error (MSE) calculates the variance between predicted and actual data values(Equation 2). MSE indicates the accuracy of predictions, and the lower the MSE, the more accurate the model’s predictions [48].
- ii
- Mean Absolute Error (MAE) shows the average absolute disparities between predicted and actual data values, revealing the extent of prediction errors(Equation 3). MAE does not consider the direction of these errors [48].
- iii
- The R-squared (R2) value reflects the model’s ability to explain the variations in the predicted variable (Equation 4). A higher R2 value indicates a more explanatory model [49].
These evaluation metrics play a vital role in assessing the performance of machine learning models and facilitating meaningful comparisons between them.
4. Results and Discussion
4.1. Investigating the Relationship between Hope Life and QL
To investigate the correlation between hope in life and QL, two statistical methods were employed: the General Linear Model (GLM) and Analysis of Variance (ANOVA). The outcomes from both analyses demonstrate a significant and positive relationship between hope in life and QL. Figure 5 illustrates that augmenting hope directly corresponds to an improvement in QL. This relationship is depicted by the equation Y = 5.88X + 47.54.
The findings of this research highlight a clear linear relationship between QL and HL under investigation, indicating a significant mutual influence. These results align closely with prior research, particularly the studies conducted by Shen et al. in 2020 and Li et al. in 2022. Notably, these studies have also identified the overestimation of hope of life parameters as a crucial predictor for QL, further underscoring its importance in understanding the dynamics at play [6,7].
4.2. Influential Parameters
According to our findings, 29 questions have a more pronounced impact on QL. These questions encompass dimensions of the patient’s life concerning general condition, physical well-being, functionality, pain, sleep, self-efficacy, economic conditions, disease symptoms, and hope of life.
As a result, not only have we identified significant factors affecting the QL of Iranian breast cancer survivors, but we have also been able to predict the QL of this group of society by reducing the dimensions of the issue and selecting 29 out of 52 questions in the questionnaires, by asking fewer questions using our machine learning algorithms.
Furthermore, these observations are consistent with those of previous research. Shen et al. similarly demonstrated that income, hope, self-efficacy, and social support are positive predictors of QL, whereas cancer stage is a negative predictor of QL [7]. Li et al. also found a significant relationship between the QL of these women and variables such as age, marital status, education level, chemotherapy cycle, and hope [6].
Because clinical data from patients were not available and only questionnaire information was accessible, other dimensions of the disease, such as the stage of cancer, were not investigated in this study.
4.3. Model Result
Considering that QL, measured by QL questionnaires, and hope life are numerical variables ranging from 0 to 100, the response variable is continuous. In this section, six regression algorithms, including K-Nearest Neighbors Regression (K-NN), Random Forest Regression (RF), Classification and Regression Trees (CART), Extreme Gradient Boosting (XGboost), AdaBoost, and Gradient Boosting Machines (GBM), have been fitted to the dataset, validation results on Table 9. After analyzing the test results from Table 10, it was evident that the poorest performance was seen in the classification and regression trees due to high error rates and the lowest R-squared score. Extreme Gradient Boosting and Gradient Boosting Machines showcased superior performance, achieving accuracy levels above 80% with minimal errors. All the related illustrations are shown on Figure 6, Figure 7, and Figure 8.
In this context, the study in 2022 by Liu et al. closely aligns with the results of this research. They used basic machine learning algorithms to forecast the declining Quality of Life(QL) in individuals with thyroid cancer. They attained accuracies of 89.7% and 83.4% in the training and testing datasets, respectively, using the random forest algorithm.
In machine learning, more extensive datasets lead to more accurate and reliable results. Therefore, due to the limited size of the dataset, the model’s accuracy did not reach higher levels, and the use of deep learning tools was not feasible.
In this study, only six algorithms were analyzed, and the use of deep learning algorithms was restricted due to data volume limitations and study period constraints. In addition, larger datasets recognize that it consistently improves the accuracy and performance of models, indicating the potential for further exploration in this area with a focus on extensive data analysis.
5. Conclusion
In this study, the optimal algorithm for predicting QL in women with breast cancer is Gradient Boosting Machines(GBM). During our research, we highlighted the factors that affect QL in Iranian women with breast cancer. The findings of this study have implications for healthcare systems. Patients completed questionnaires in this study, which could have led to inaccuracies and fatigue, potentially increasing result deviation and model error. Furthermore, clinical patient characteristics play a significant role. Subsequent research could enhance model accuracy by incorporating physical and clinical patient attributes, allowing for the application of deep learning models.
Financial support
NIMAD (National Institute for Medical Research Development)
Data availability
Data used in this analysis was obtained from the National Institute for Medical Research Development (NIMAD), Iran (approval number: IR.NIMAD.REC.1397.322).
References
- A.E. Mohammad Reza Farkhi, Korosh Halakoui Nayini, Ali Akbar Haq Dost, Investigating the costs of cancer in Kerman, Epidemiology of Iran (2012).
- S.Y. Vafaei, Predicting the quality of life of breast cancer patients using machine learning based methods, (2021).
- B. Baradaran, K. B. Baradaran, K. Hajiasgharzadeh, Breast cancer among young women in Iran, International Journal of Women’s Health and Reproduction Sciences 7 (2019) 140. [CrossRef]
- T. Watanabe, S. T. Watanabe, S. Yada, E. Aramaki, H. Yajima, H. Kizaki, S. Hori, Extracting Multiple Worries from Breast Cancer Patient Blogs Using Multilabel Classification with the Natural Language Processing Model Bidirectional Encoder Representations from Transformers: Infodemiology Study of Blogs, JMIR Cancer 8 (2022) 1–9. [CrossRef]
- M. Nuutinen, A.M. M. Nuutinen, A.M. Hiltunen, S. Korhonen, I. Haavisto, P. Poikonen-Saksela, J. Mattson, G. Manikis, H. Kondylakis, P. Simos, K. Mazzocco, R. Pat-Horenczyk, B. Sousa, F. Cardoso, I. Manica, I. Kudel, R.L. Leskelä, Aid of a machine learning algorithm can improve clinician predictions of patient quality of life during breast cancer treatments, Health Technol (Berl) (2023) 229–244. [CrossRef]
- Y. Li, Z. Y. Li, Z. Zhou, N. Ni, J. Li, Z. Luan, X. Peng, Quality of Life and Hope of Women in China Receiving Chemotherapy for Breast Cancer, Clin Nurs Res 31 (2022) 1042–1049. [CrossRef]
- A. Shen, W. A. Shen, W. Qiang, Y. Wang, Y. Chen, Quality of life among breast cancer survivors with triple negative breast cancer--role of hope, self-efficacy and social support, European Journal of Oncology Nursing 46 (2020) 101771. [CrossRef]
- M. Savić, V. M. Savić, V. Kurbalija, M. Ilić, M. Ivanović, D. Jakovetić, A. Valachis, S. Autexier, J. Rust, T. Kosmidis, The Application of Machine Learning Techniques in Prediction of Quality of Life Features for Cancer Patients, Computer Science and Information Systems 29 (2023) 381–404. [CrossRef]
- Y. Zhang, R. Y. Zhang, R. Tang, L. Bi, D. Wang, X. Li, F. Gu, J. Han, M. Shi, Effects of family-centered positive psychological intervention on psychological health and quality of life in patients with breast cancer and their caregivers, Supportive Care in Cancer 31 (2023). [CrossRef]
- X. Wei, Q. X. Wei, Q. Lu, S. Jin, F. Li, Q. Zhao, Y. Cui, S. Jin, Y. Cao, M.R. Fu, Developing and validating a prediction model for lymphedema detection in breast cancer survivors, European Journal of Oncology Nursing 54 (2021) 102023. [CrossRef]
- Y.H. Liu, J. Y.H. Liu, J. Jin, Y.J. Liu, Machine learning–based random forest for predicting decreased quality of life in thyroid cancer patients after thyroidectomy, Supportive Care in Cancer 30 (2022) 2507–2513. [CrossRef]
- M. Nuutinen, S. M. Nuutinen, S. Korhonen, A.-M. Hiltunen, I. Haavisto, P. Poikonen-Saksela, J. Mattson, H. Kondylakis, K. Mazzocco, R. Pat-Horenczyk, B. Sousa, R.-L. Leskelä, Impact of Machine Learning Assistance on the Quality of Life Prediction for Breast Cancer Patients, (2022) 344–352. [CrossRef]
- T. Ueno, D. T. Ueno, D. Ichikawa, Y. Shimizu, T. Narisawa, K. Tsuji, E. Ochi, N. Sakurai, H. Iwata, Y.J. Matsuoka, Comorbid insomnia among breast cancer survivors and its prediction using machine learning: A nationwide study in Japan, Jpn J Clin Oncol 52 (2022) 39–46. [CrossRef]
- A. Crumpei-Tanasă, I. A. Crumpei-Tanasă, I. Crumpei, A machine learning approach to predict stress hormones and inflammatory markers using illness perception and quality of life in breast cancer patients, Current Oncology 28 (2021) 3150–3171. [CrossRef]
- M. Nascimben, L. M. Nascimben, L. Lippi, A. de Sire, M. Invernizzi, L. Rimondini, Algorithm-Based Risk Identification in Patients with Breast Cancer-Related Lymphedema: A Cross-Sectional Study, Cancers (Basel) 15 (2023). [CrossRef]
- D. Kang, H. D. Kang, H. Kim, J. Cho, Z. Kim, M. Chung, J.E. Lee, S.J. Nam, S.W. Kim, J. Yu, B.J. Chae, J.M. Ryu, S.K. Lee, Prediction Model for Postoperative Quality of Life Among Breast Cancer Survivors Along the Survivorship Trajectory From Pretreatment to 5 Years: Machine Learning-Based Analysis, JMIR Public Health Surveill 9 (2023). [CrossRef]
- Y.H. Choe, S. Y.H. Choe, S. Lee, Y. Lim, S.H. Kim, Machine learning-derived model for predicting poor post-treatment quality of life in Korean cancer survivors, Support Care Cancer 32 (2024) 143. [CrossRef]
- F. Faroughi, A. F. Faroughi, A. Fathnezhad-Kazemi, P. Sarbakhsh, Factors affecting quality of life in women with breast cancer: a path analysis, BMC Womens Health 23 (2023). [CrossRef]
- J.K. Vallance, C.M. J.K. Vallance, C.M. Friedenreich, Q. Wang, C.E. Matthews, L. Yang, M.L. McNeely, S.N. Culos-Reed, G.J. Bell, A.R. Morielli, J. McNeil, L. Dickau, D. Cook, K.S. Courneya, Associations of device-measured physical activity and sedentary time with quality of life and fatigue in newly diagnosed breast cancer patients: Baseline results from the AMBER cohort study, Cancer (2022). [CrossRef]
- S. Pahlevan Sharif, R.H. S. Pahlevan Sharif, R.H. Lehto, M. Amiri, A.S. Ahadzadeh, H. Sharif Nia, A.A. Haghdoost, F. Khoshnavay Fomani, A.H. Goudarzian, Spirituality and quality of life in women with breast cancer: The role of hope and educational attainment, Palliat Support Care 19 (2021) 55–61. [CrossRef]
- S. Xu, W. S. Xu, W. Thompson, J. Kerr, S. Godbole, D.D. Sears, R. Patterson, L. Natarajan, Modeling interrelationships between health behaviors in overweight breast cancer survivors: Applying Bayesian networks, PLoS One 13 (2018) 1–13. [CrossRef]
- C. Soylu, T. C. Soylu, T. Babacan, A.R. Sever, K. Altundag, Patients’ understanding of treatment goals and disease course and their relationship with optimism, hope, and quality of life: a preliminary study among advanced breast cancer outpatients before receiving palliative treatment, Supportive Care in Cancer 24 (2016) 3481–3488. [CrossRef]
- F.M. Tabrizi, M. F.M. Tabrizi, M. Radfar, Z. Taei, Effects of supportive-expressive discussion groups on loneliness, hope and quality of life in breast cancer survivors: a randomized control trial, Psychooncology 1063 (2016) 1057–1063. [CrossRef]
- W. Duggleby, H. W. Duggleby, H. Doell, D. Cooper, R. Thomas, S. Ghosh, The quality of life of male spouses of women with breast cancer: Hope, self-efficacy, and perceptions of guilt, Cancer Nurs 37 (2014). [CrossRef]
- W. Duggleby, J. W. Duggleby, J. Thomas, K.S. Montford, R. Thomas, C. Nekolaichuk, S. Ghosh, C. Cumming, Transitions o f M a le Partners o f W o m e n W ith Breast C ancer: H o p e, G u ilt, and Q u a lity o f Life, Oncol Nurs Forum 42 (2015) 134–141. http://content.ebscohost.com/ContentServer.asp?T=P&P=AN&K=103769768&S=R&D=rzh&EbscoContent=dGJyMNLe80Sepq84yOvsOLCmr0%2Bep7JSs6q4SK%2BWxWXS&ContentCustomer=dGJyMOzprkiuqLdIuePfgeyx43zx%0A10.1188/15.ONF.134-141.
- M. Aldraimli, S. M. Aldraimli, S. Osman, D. Grishchuck, S. Ingram, R. Lyon, A. Mistry, J. Oliveira, R. Samuel, L.E.A. Shelley, D. Soria, M. V. Dwek, M.E. Aguado-Barrera, D. Azria, J. Chang-Claude, A. Dunning, A. Giraldo, S. Green, S. Gutiérrez-Enríquez, C. Herskind, H. van Hulle, M. Lambrecht, L. Lozza, T. Rancati, V. Reyes, B.S. Rosenstein, D. de Ruysscher, M.C. de Santis, P. Seibold, E. Sperk, R.P. Symonds, H. Stobart, B. Taboada-Valadares, C.J. Talbot, V.J.L. Vakaet, A. Vega, L. Veldeman, M.R. Veldwijk, A. Webb, C. Weltens, C.M. West, T.J. Chaussalet, T. Rattay, Development and Optimization of a Machine-Learning Prediction Model for Acute Desquamation After Breast Radiation Therapy in the Multicenter REQUITE Cohort, Adv Radiat Oncol 7 (2022). [CrossRef]
- H. Feng, H. H. Feng, H. Wang, L. Xu, Y. Ren, Q. Ni, Z. Yang, S. Ma, Q. Deng, X. Chen, B. Xia, Y. Kuang, X. Li, Prediction of radiation-induced acute skin toxicity in breast cancer patients using data encapsulation screening and dose-gradient-based multi-region radiomics technique: A multicenter study, Front Oncol 12 (2022) 1–15. [CrossRef]
- W.C. Liu, M.X. W.C. Liu, M.X. Li, S.N. Wu, W.L. Tong, A.A. Li, B.L. Sun, Z.L. Liu, J.M. Liu, Using Machine Learning Methods to Predict Bone Metastases in Breast Infiltrating Ductal Carcinoma Patients, Front Public Health 10 (2022) 1–13. [CrossRef]
- M. Pinto, N. M. Pinto, N. Marotta, C. Caracò, E. Simeone, A. Ammendolia, A. de Sire, Quality of Life Predictors in Patients With Melanoma: A Machine Learning Approach, Front Oncol 12 (2022) 1–8. [CrossRef]
- A. Pfob, B.J. A. Pfob, B.J. Mehrara, J.A. Nelson, E.G. Wilkins, A.L. Pusic, C. Sidey-Gibbons, Machine learning to predict individual patient-reported outcomes at 2-year follow-up for women undergoing cancer-related mastectomy and breast reconstruction (INSPiRED-001), Breast 60 (2021) 111–122. [CrossRef]
- S. Makrogiannis, K. S. Makrogiannis, K. Zheng, C. Harris, Discriminative Localized Sparse Approximations for Mass Characterization in Mammograms, Front Oncol 11 (2021) 1–14. [CrossRef]
- X. Luo, S. X. Luo, S. Storey, P. Gandhi, Z. Zhang, M. Metzger, K. Huang, Analyzing the symptoms in colorectal and breast cancer patients with or without type 2 diabetes using EHR data, Health Informatics J 27 (2021). [CrossRef]
- R. Etminani-Ghasrodashti, C. R. Etminani-Ghasrodashti, C. Kan, M.A. Qaisrani, O. Mogultay, H. Zhou, Examining the impacts of the built environment on quality of life in cancer patients using machine learning, Sustainability (Switzerland) 13 (2021). [CrossRef]
- M.D. Ganggayah, S.K. M.D. Ganggayah, S.K. Dhillon, T. Islam, F. Kalhor, T.C. Chiang, E.Y. Kalafi, N.A. Taib, An artificial intelligence-enabled pipeline for medical domain: Malaysian breast cancer survivorship cohort as a case study, Diagnostics 11 (2021) 1–15. [CrossRef]
- Z. Yang, D. Z. Yang, D. Olszewski, C. He, G. Pintea, J. Lian, T. Chou, R.C. Chen, B. Shtylla, Machine learning and statistical prediction of patient quality-of-life after prostate radiation therapy, Comput Biol Med 129 (2021) 104127. [CrossRef]
- T. Rattay, P. T. Rattay, P. Seibold, M.E. Aguado-Barrera, M. Altabas, D. Azria, G.C. Barnett, R. Bultijnck, J. Chang-Claude, A. Choudhury, C.E. Coles, A.M. Dunning, R.M. Elliott, M.P. Farcy Jacquet, S. Gutiérrez-Enríquez, K. Johnson, A. Müller, G. Post, T. Rancati, V. Reyes, B.S. Rosenstein, D. De Ruysscher, M.C. de Santis, E. Sperk, H. Stobart, R.P. Symonds, B. Taboada-Valladares, A. Vega, L. Veldeman, A.J. Webb, C.M. West, R. Valdagni, C.J. Talbot, External Validation of a Predictive Model for Acute Skin Radiation Toxicity in the REQUITE Breast Cohort, Front Oncol 10 (2020). [CrossRef]
- S. Lee, J.O. S. Lee, J.O. Deasy, J.H. Oh, A. Di Meglio, A. Dumas, G. Menvielle, C. Charles, S. Boyault, M. Rousseau, C. Besse, E. Thomas, A. Boland, P. Cottu, O. Tredan, C. Levy, A.L. Martin, S. Everhard, P.A. Ganz, A.H. Partridge, S. Michiels, J.F. Deleuze, F. Andre, I. Vaz-Luis, Prediction of breast cancer treatment–induced fatigue by machine learning using genome-wide association data, JNCI Cancer Spectr 4 (2020) 1–9. [CrossRef]
- R. Sipilä, E. R. Sipilä, E. Kalso, J. Lötsch, Machine-learned identification of psychological subgroups with relation to pain interference in patients after breast cancer treatments, Breast 50 (2020) 71–80. [CrossRef]
- S.J. Lou, M.F. S.J. Lou, M.F. Hou, H.T. Chang, C.C. Chiu, H.H. Lee, S.C.J. Yeh, H.Y. Shi, Machine learning algorithms to predict recurrence within 10 years after breast cancer surgery: A prospective cohort study, Cancers (Basel) 12 (2020) 1–15. [CrossRef]
- J. ah Sim, Y.A. J. ah Sim, Y.A. Kim, J.H. Kim, J.M. Lee, M.S. Kim, Y.M. Shim, J.I. Zo, Y.H. Yun, The major effects of health-related quality of life on 5-year survival prediction among lung cancer survivors: applications of machine learning, Sci Rep 10 (2020) 1–12. [CrossRef]
- R. Sánchez, M. R. Sánchez, M. Venegas, J. Otero, O. Sánchez, Adaptación transcultural de dos escalas para medir la calidad de vida en pacientes con cáncer en Colombia: EORTC QLQ-C30 y QLQ-BR23, Revista Colombiana de Cancerología 13 (2009) 205–212. [CrossRef]
- D. Hekmatpou, A. D. Hekmatpou, A. Nasiri, F. Mohaghegh, Investigating the Effect of Self-Care Training on Life Expectancy and Quality of Life in Patients with Gastrointestinal Cancer under Radiotherapy, Asia Pac J Oncol Nurs 6 (2019) 198–205. [CrossRef]
- A.Q. Md, S. A.Q. Md, S. Kulkarni, C.J. Joshua, T. Vaichole, S. Mohan, C. Iwendi, Enhanced Preprocessing Approach Using Ensemble Machine Learning Algorithms for Detecting Liver Disease, Biomedicines 11 (2023). [CrossRef]
- P. Pinti, F. P. Pinti, F. Scholkmann, A. Hamilton, P. Burgess, I. Tachtsidis, Current Status and Issues Regarding Pre-processing of fNIRS Neuroimaging Data: An Investigation of Diverse Signal Filtering Methods Within a General Linear Model Framework, Front Hum Neurosci 12 (2019). [CrossRef]
- D. Lakens, A.R. D. Lakens, A.R. Caldwell, Simulation-Based Power Analysis for Factorial Analysis of Variance Designs, Adv Methods Pract Psychol Sci 4 (2021). [CrossRef]
- L. Sun, T. L. Sun, T. Yin, W. Ding, Y. Qian, J. Xu, Feature Selection With Missing Labels Using Multilabel Fuzzy Neighborhood Rough Sets and Maximum Relevance Minimum Redundancy, IEEE TRANSACTIONS ON FUZZY SYSTEMS 30 (2022). [CrossRef]
- H. Bao, S. H. Bao, S. Wu, Z. Wu, G. Kang, X. Peng, P.J. Withers, A machine-learning fatigue life prediction approach of additively manufactured metals, Eng Fract Mech 242 (2021). [CrossRef]
- D.S.K. Karunasingha, Root mean square error or mean absolute error? Use their ratio as well, Inf Sci (N Y) 585 (2022) 609–629. [CrossRef]
- W. Jianlong, S.H. W. Jianlong, S.H. Jaaman, H.B. Samsudin, R-squared measurement in multifactor pricing model, in: AIP Conf Proc, American Institute of Physics Inc., 2015. [CrossRef]
Figure 1.
Research method flowchart.
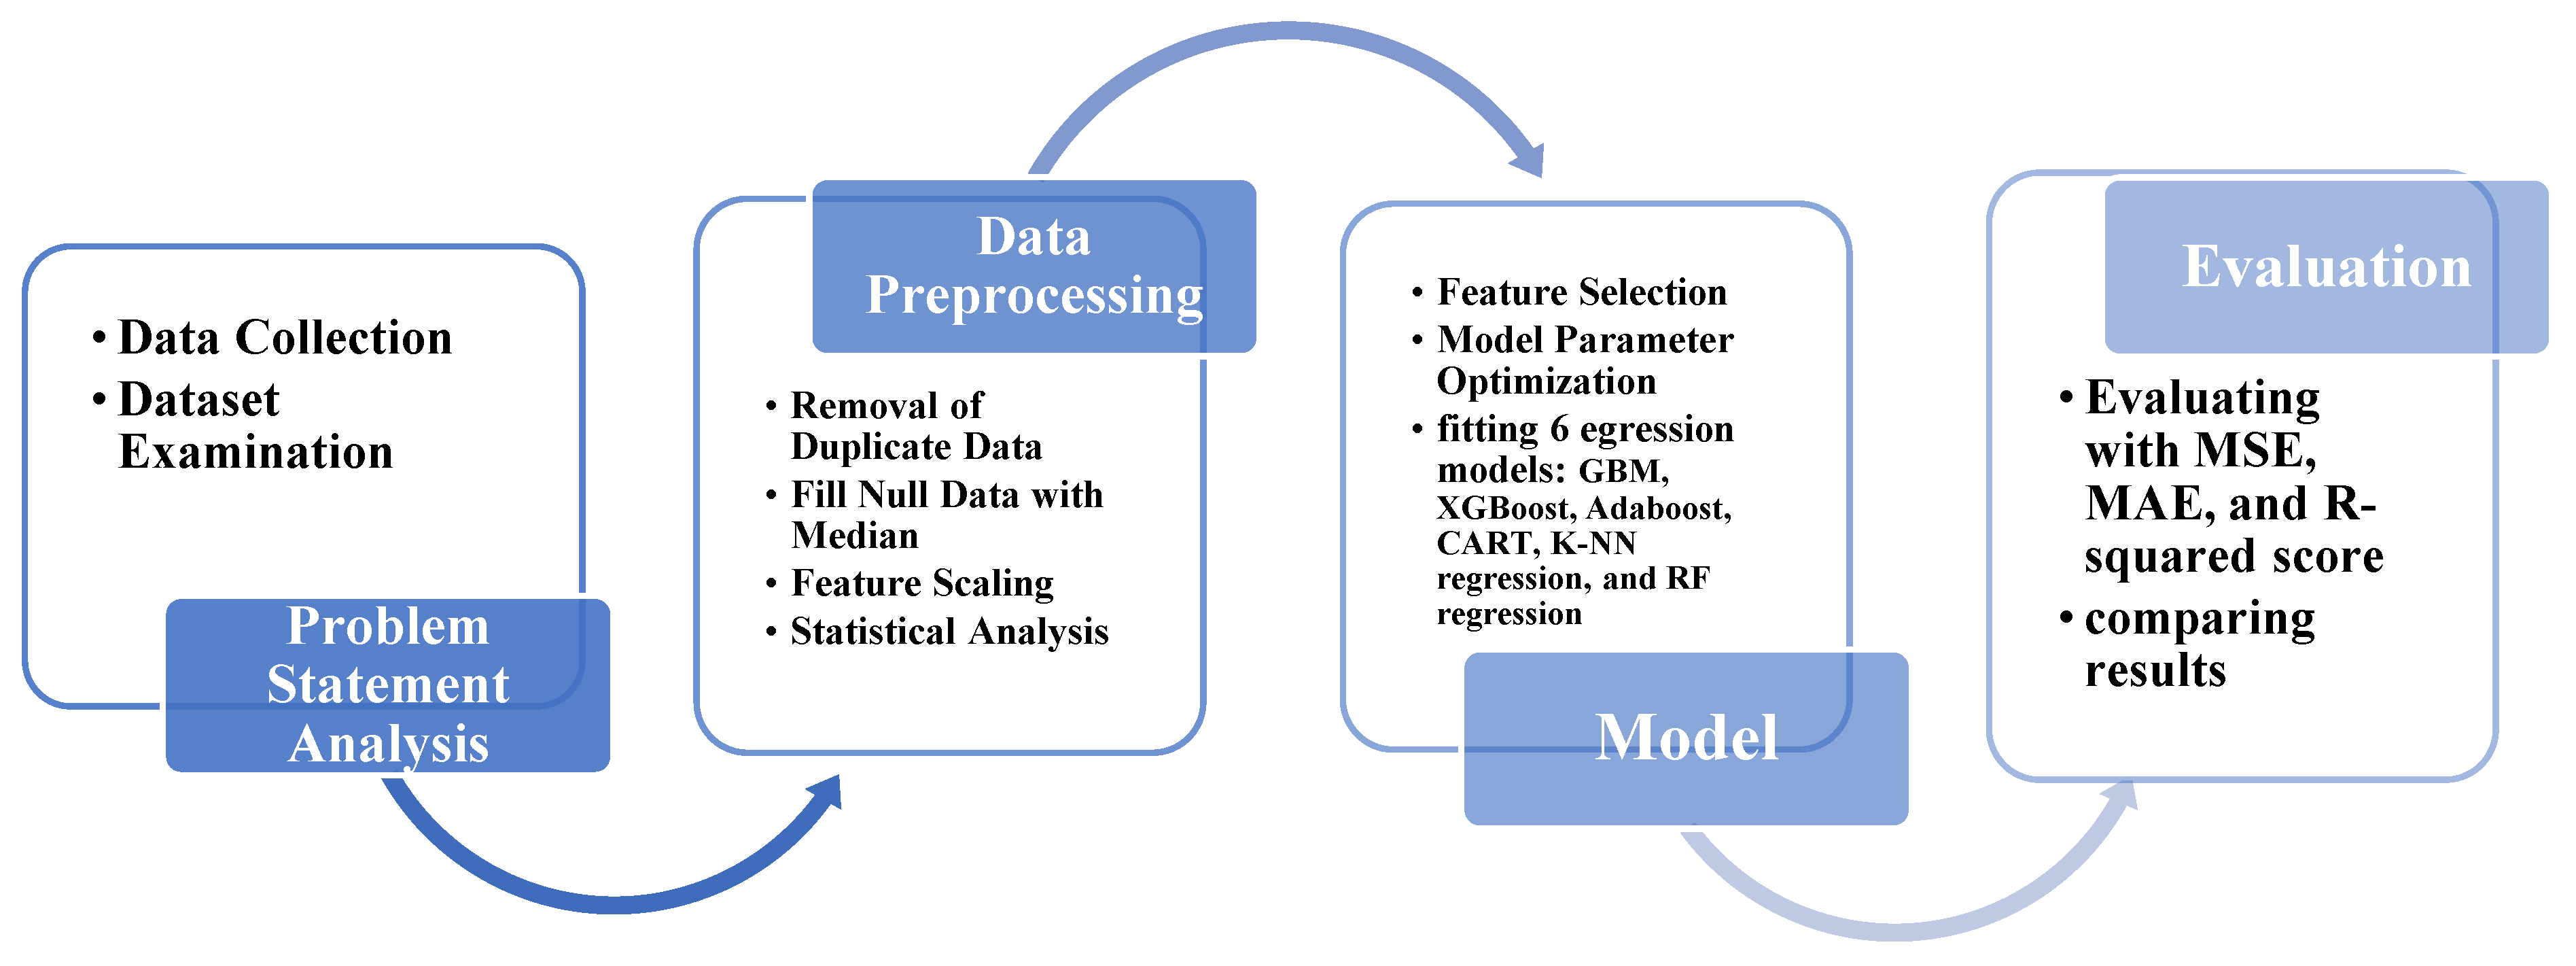
Figure 2.
EORTC-30 Questionnaire.
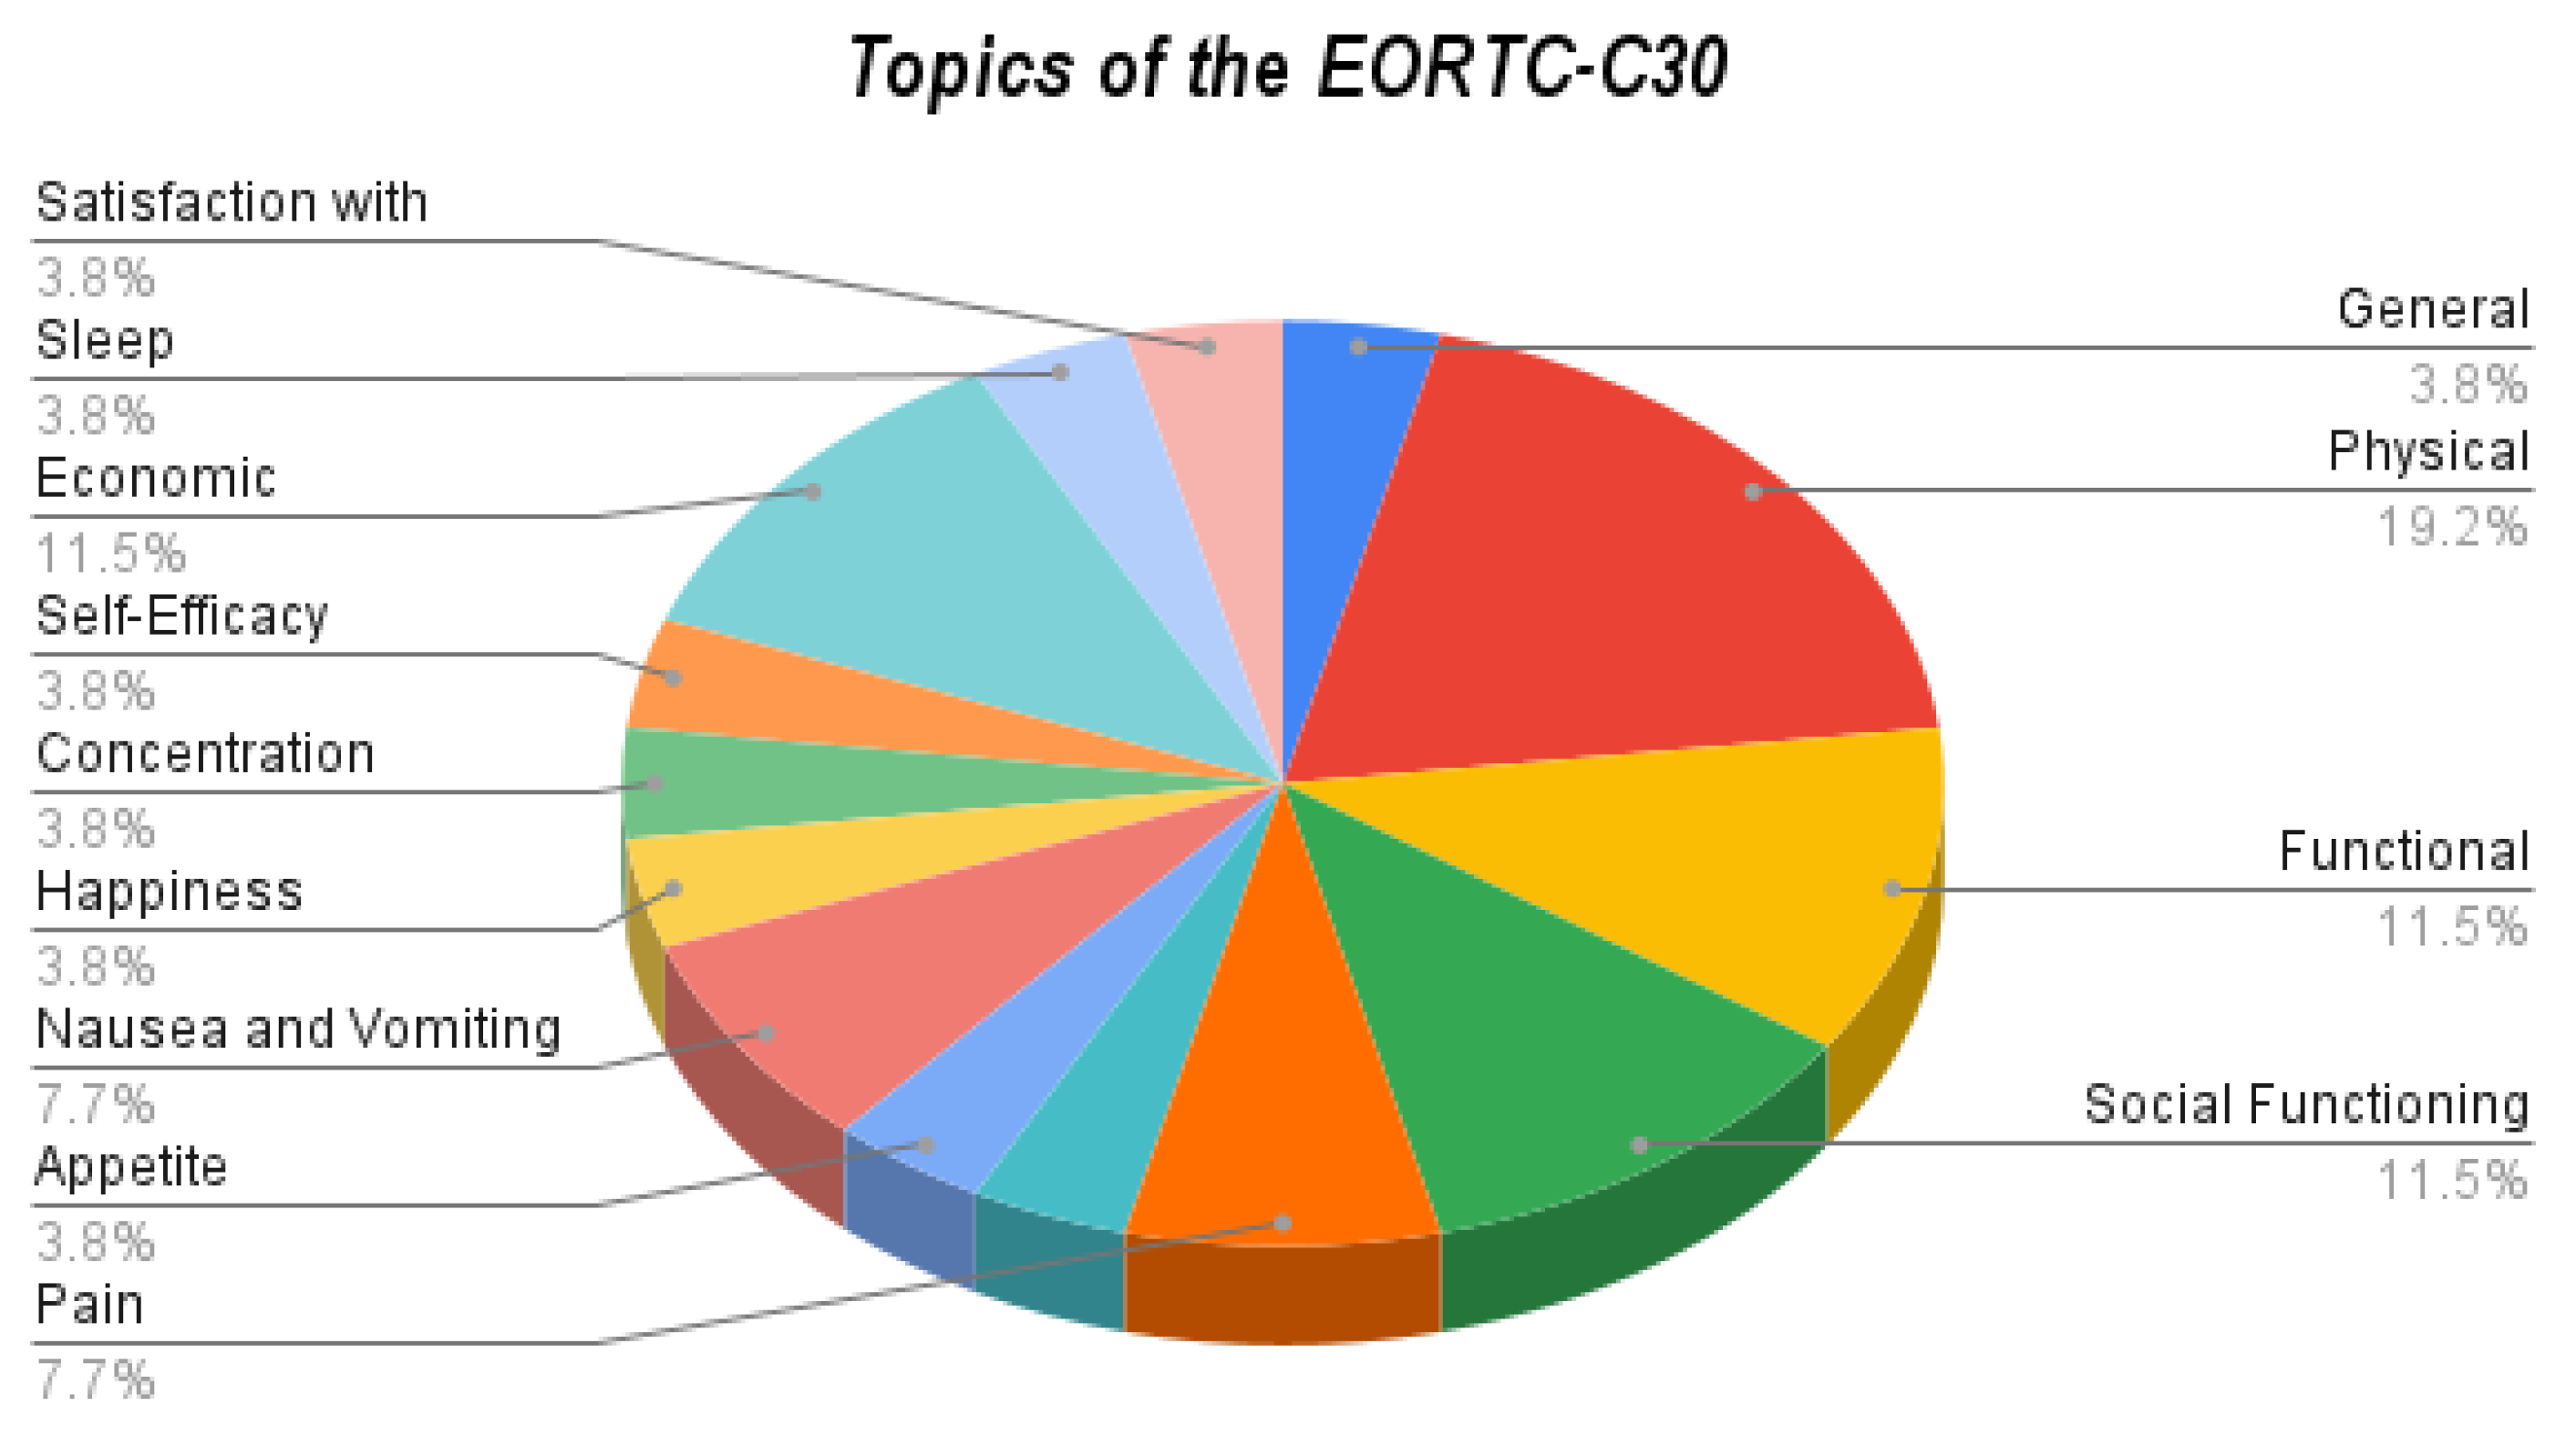
Figure 3.
EORTC-BR23 Questionnaire.
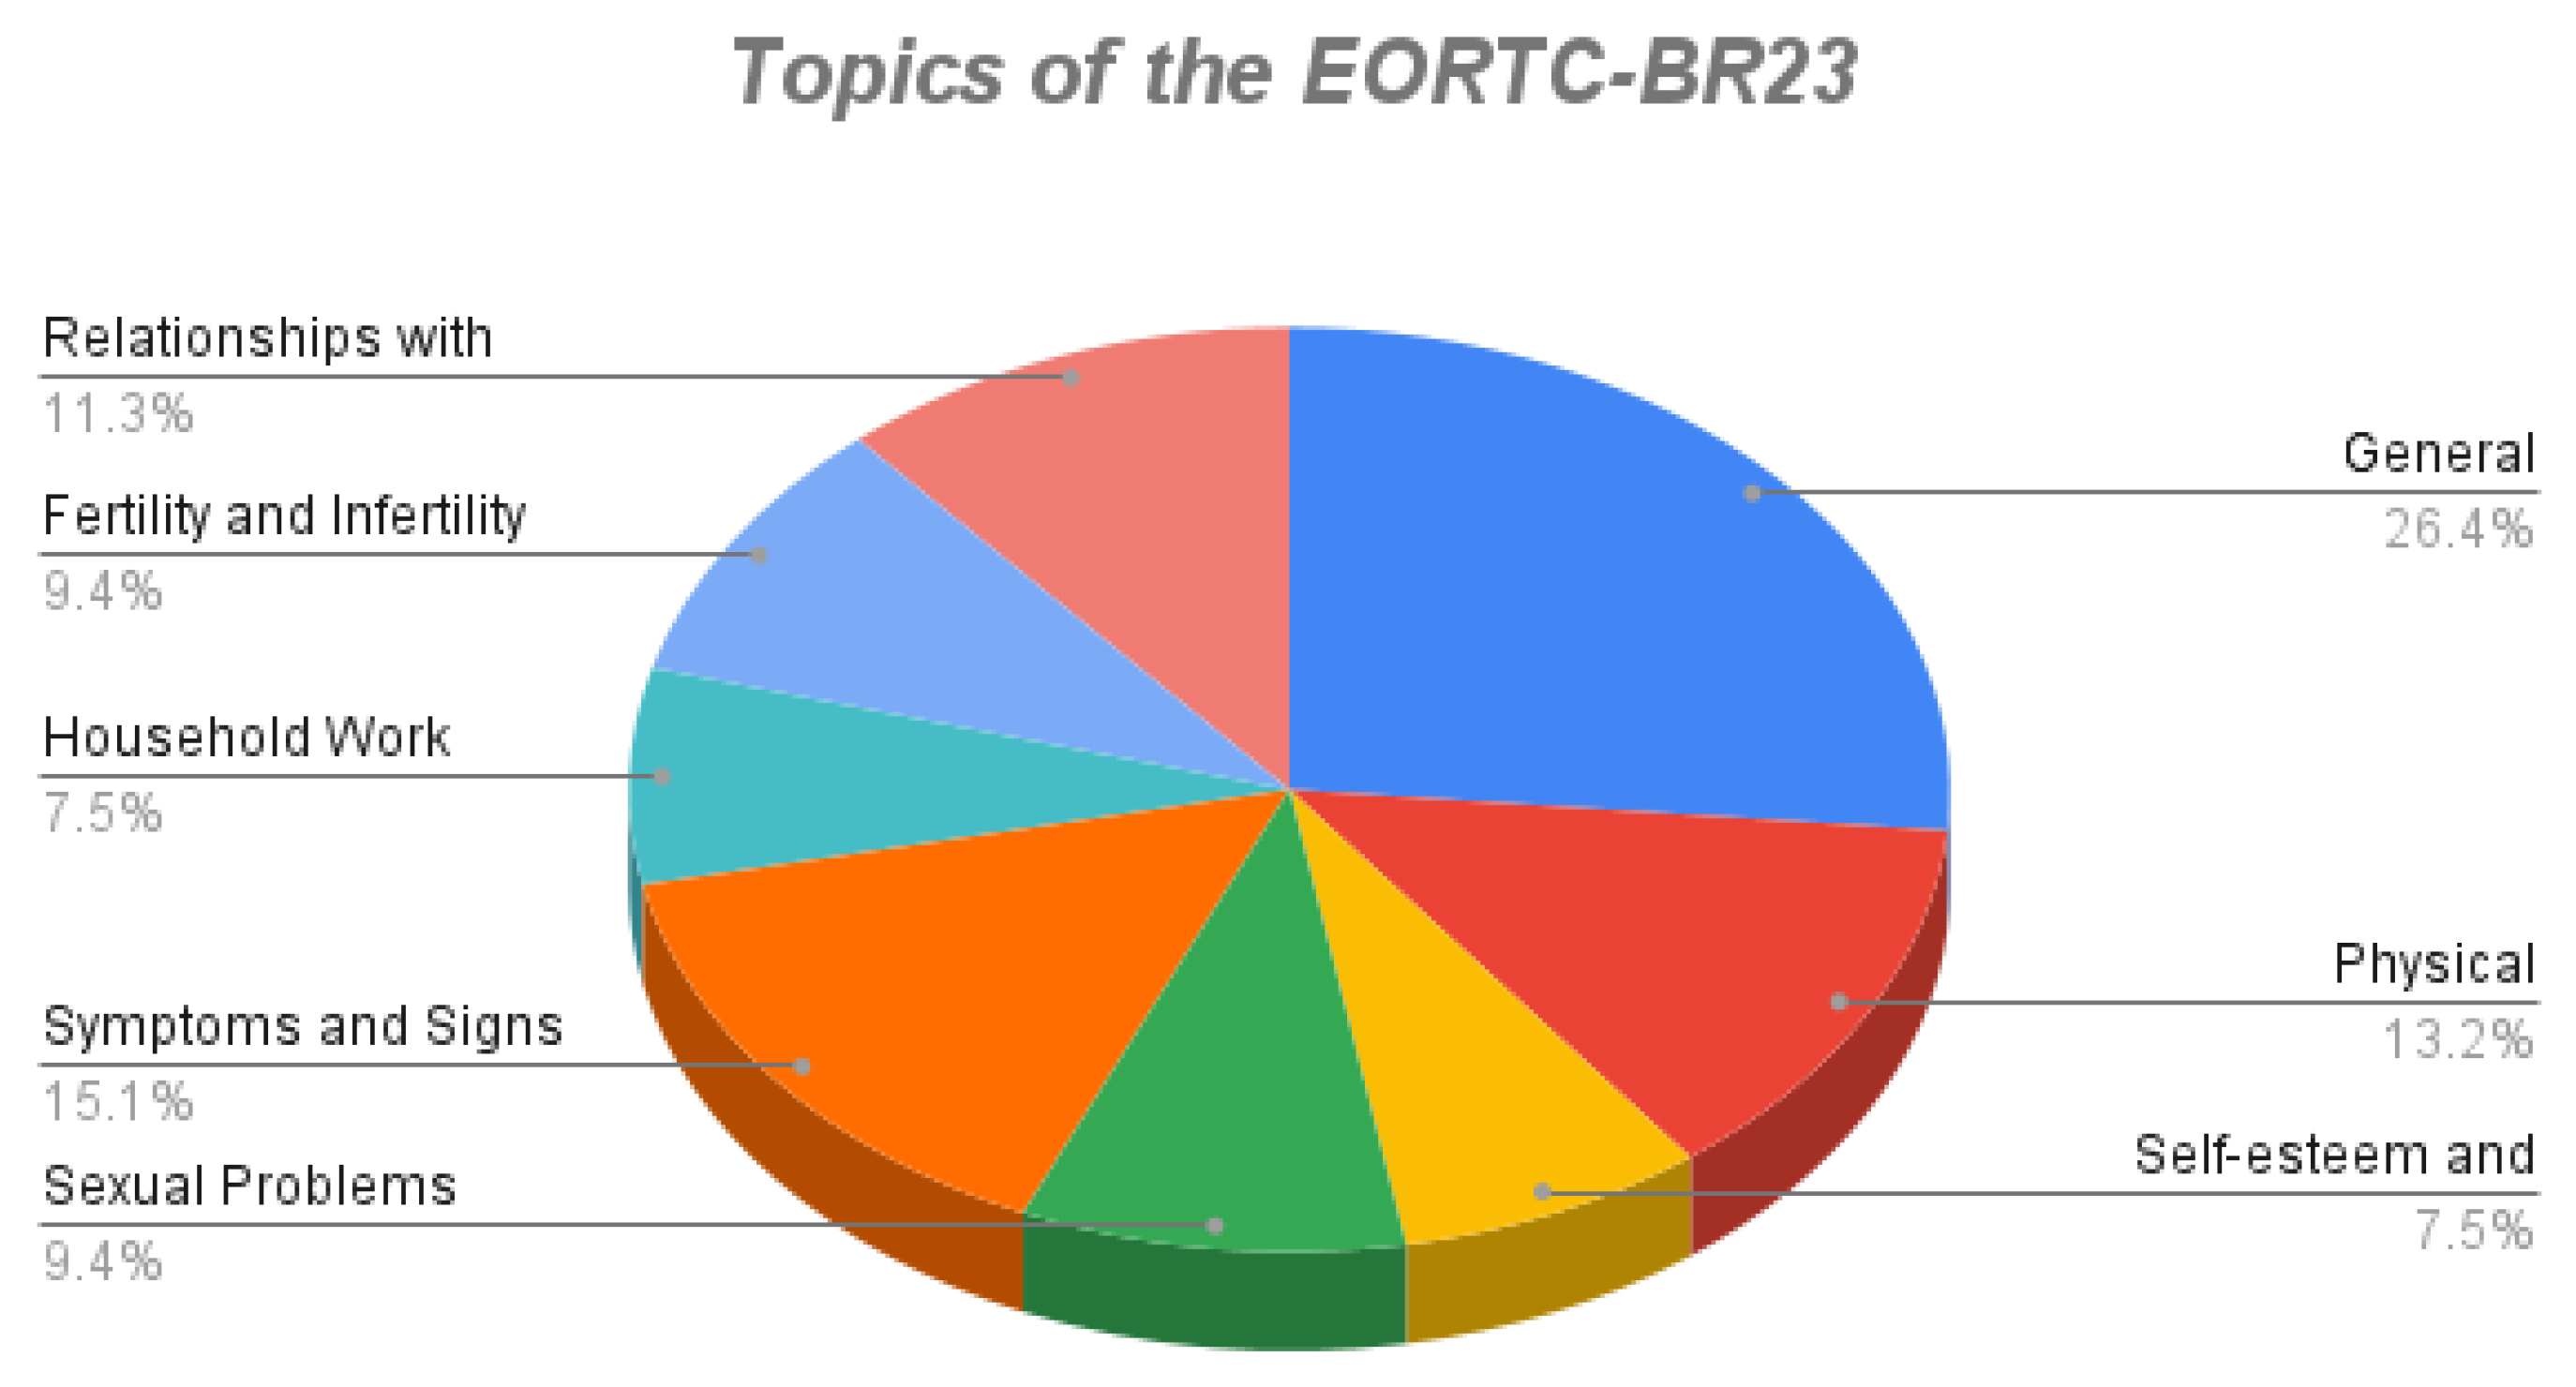
Figure 4.
Schneider’s Hope Scale.
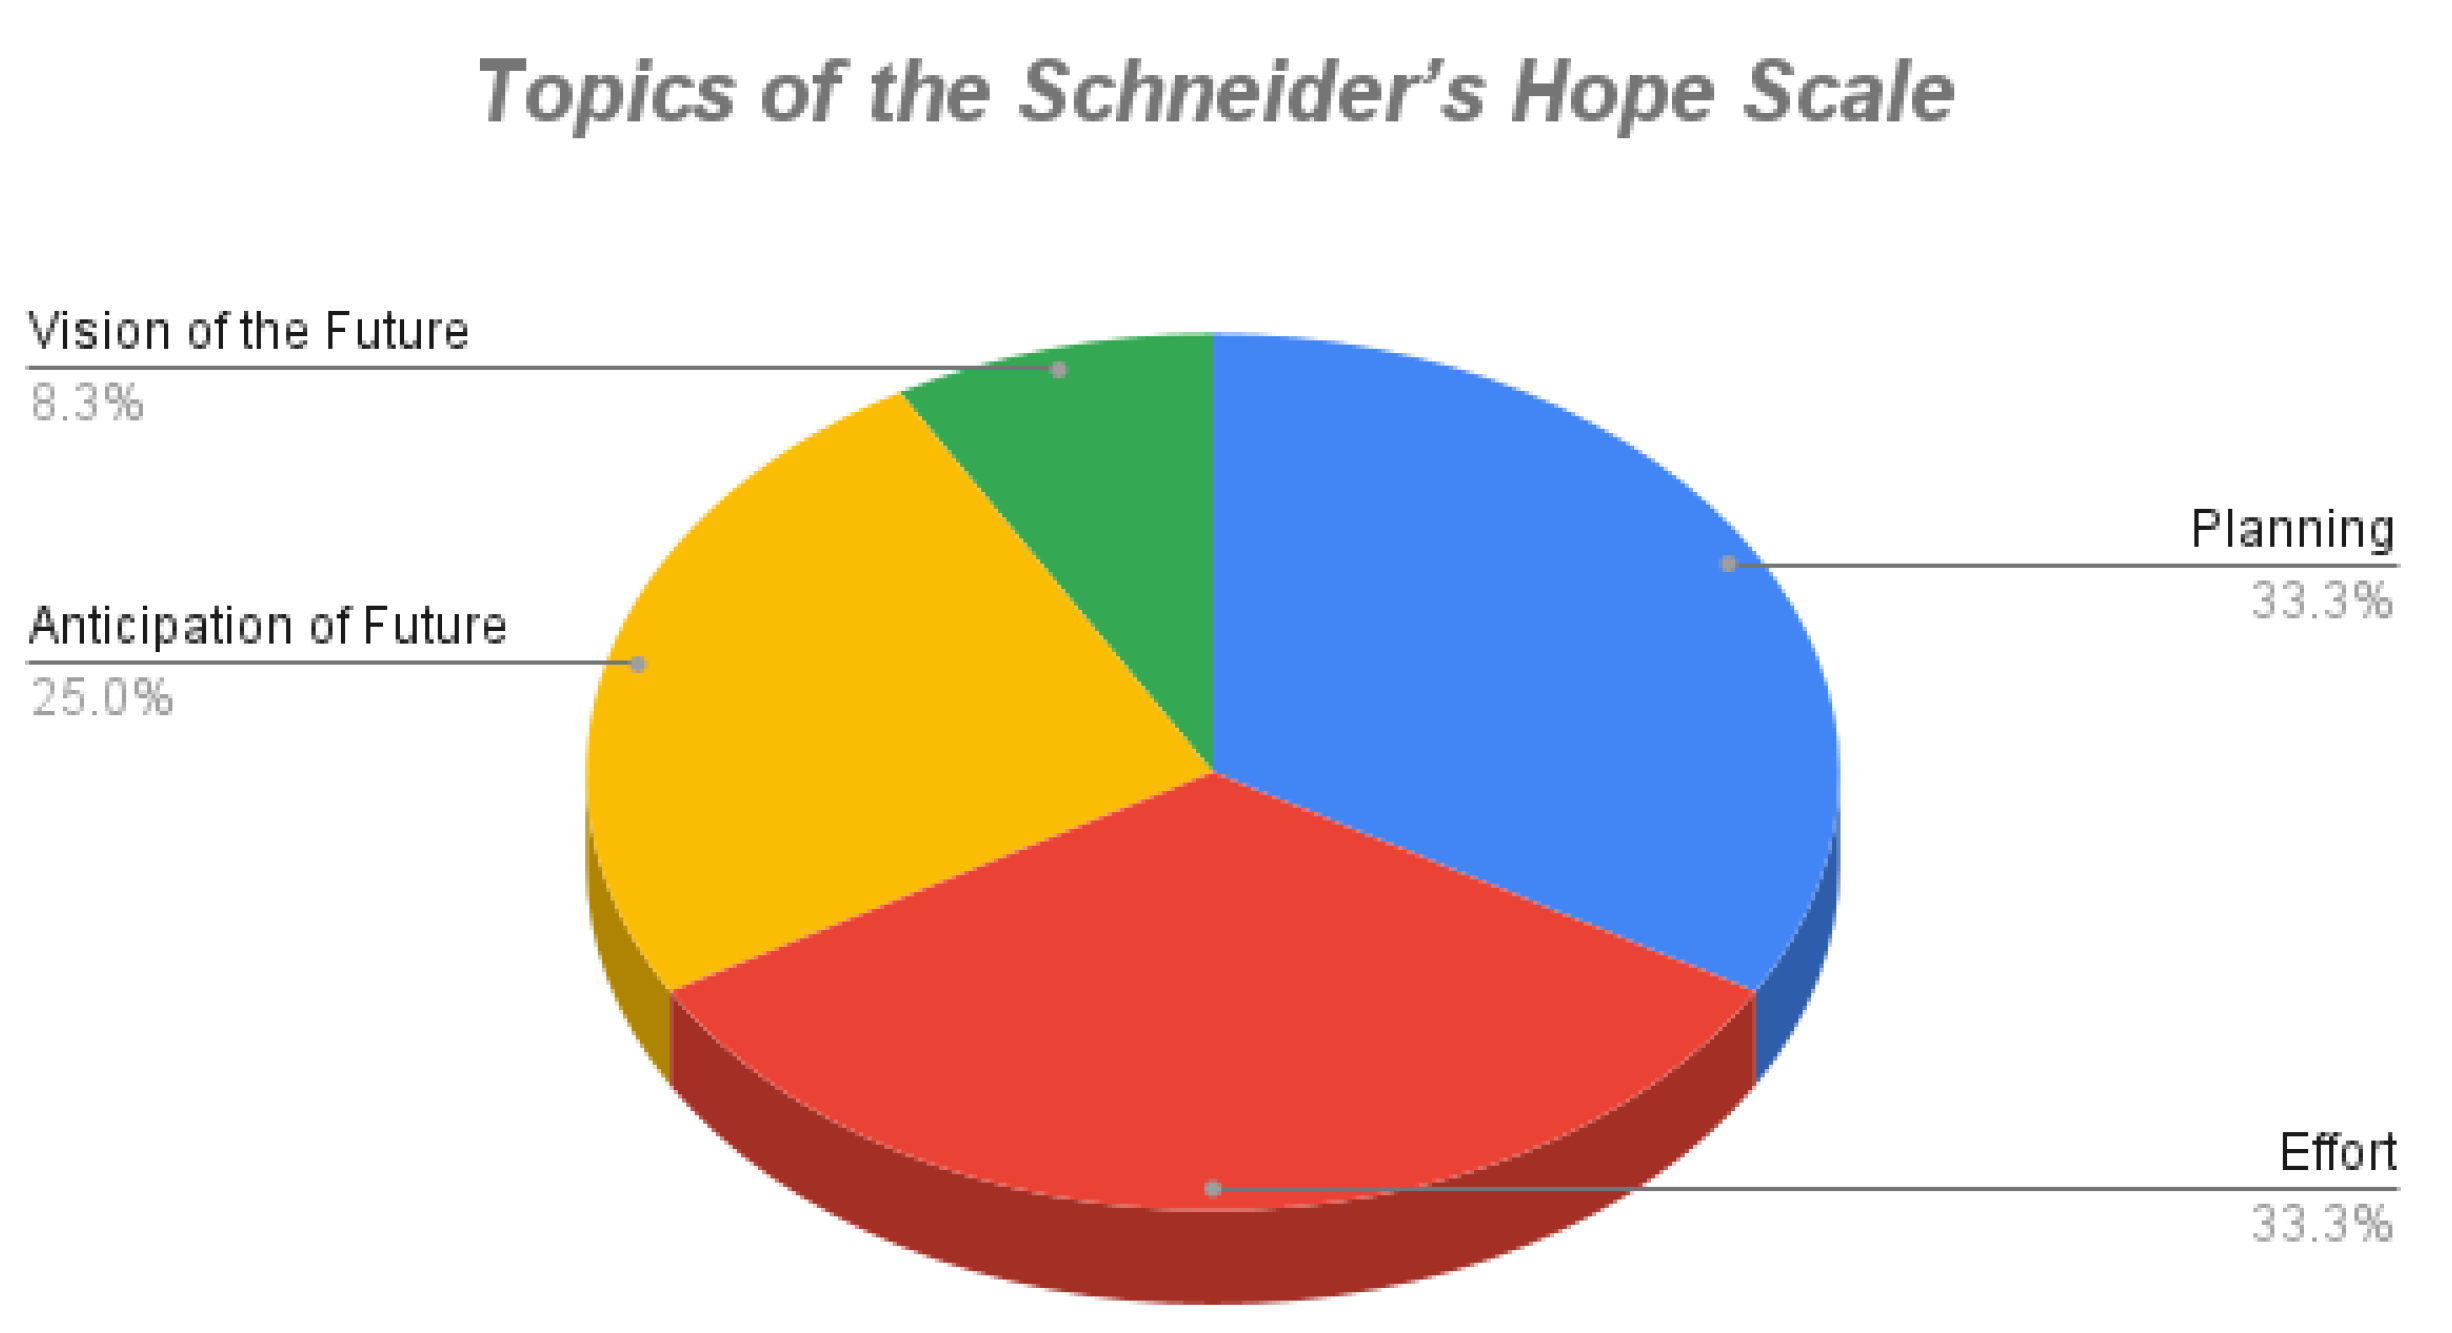
Figure 5.
Scatter plot.
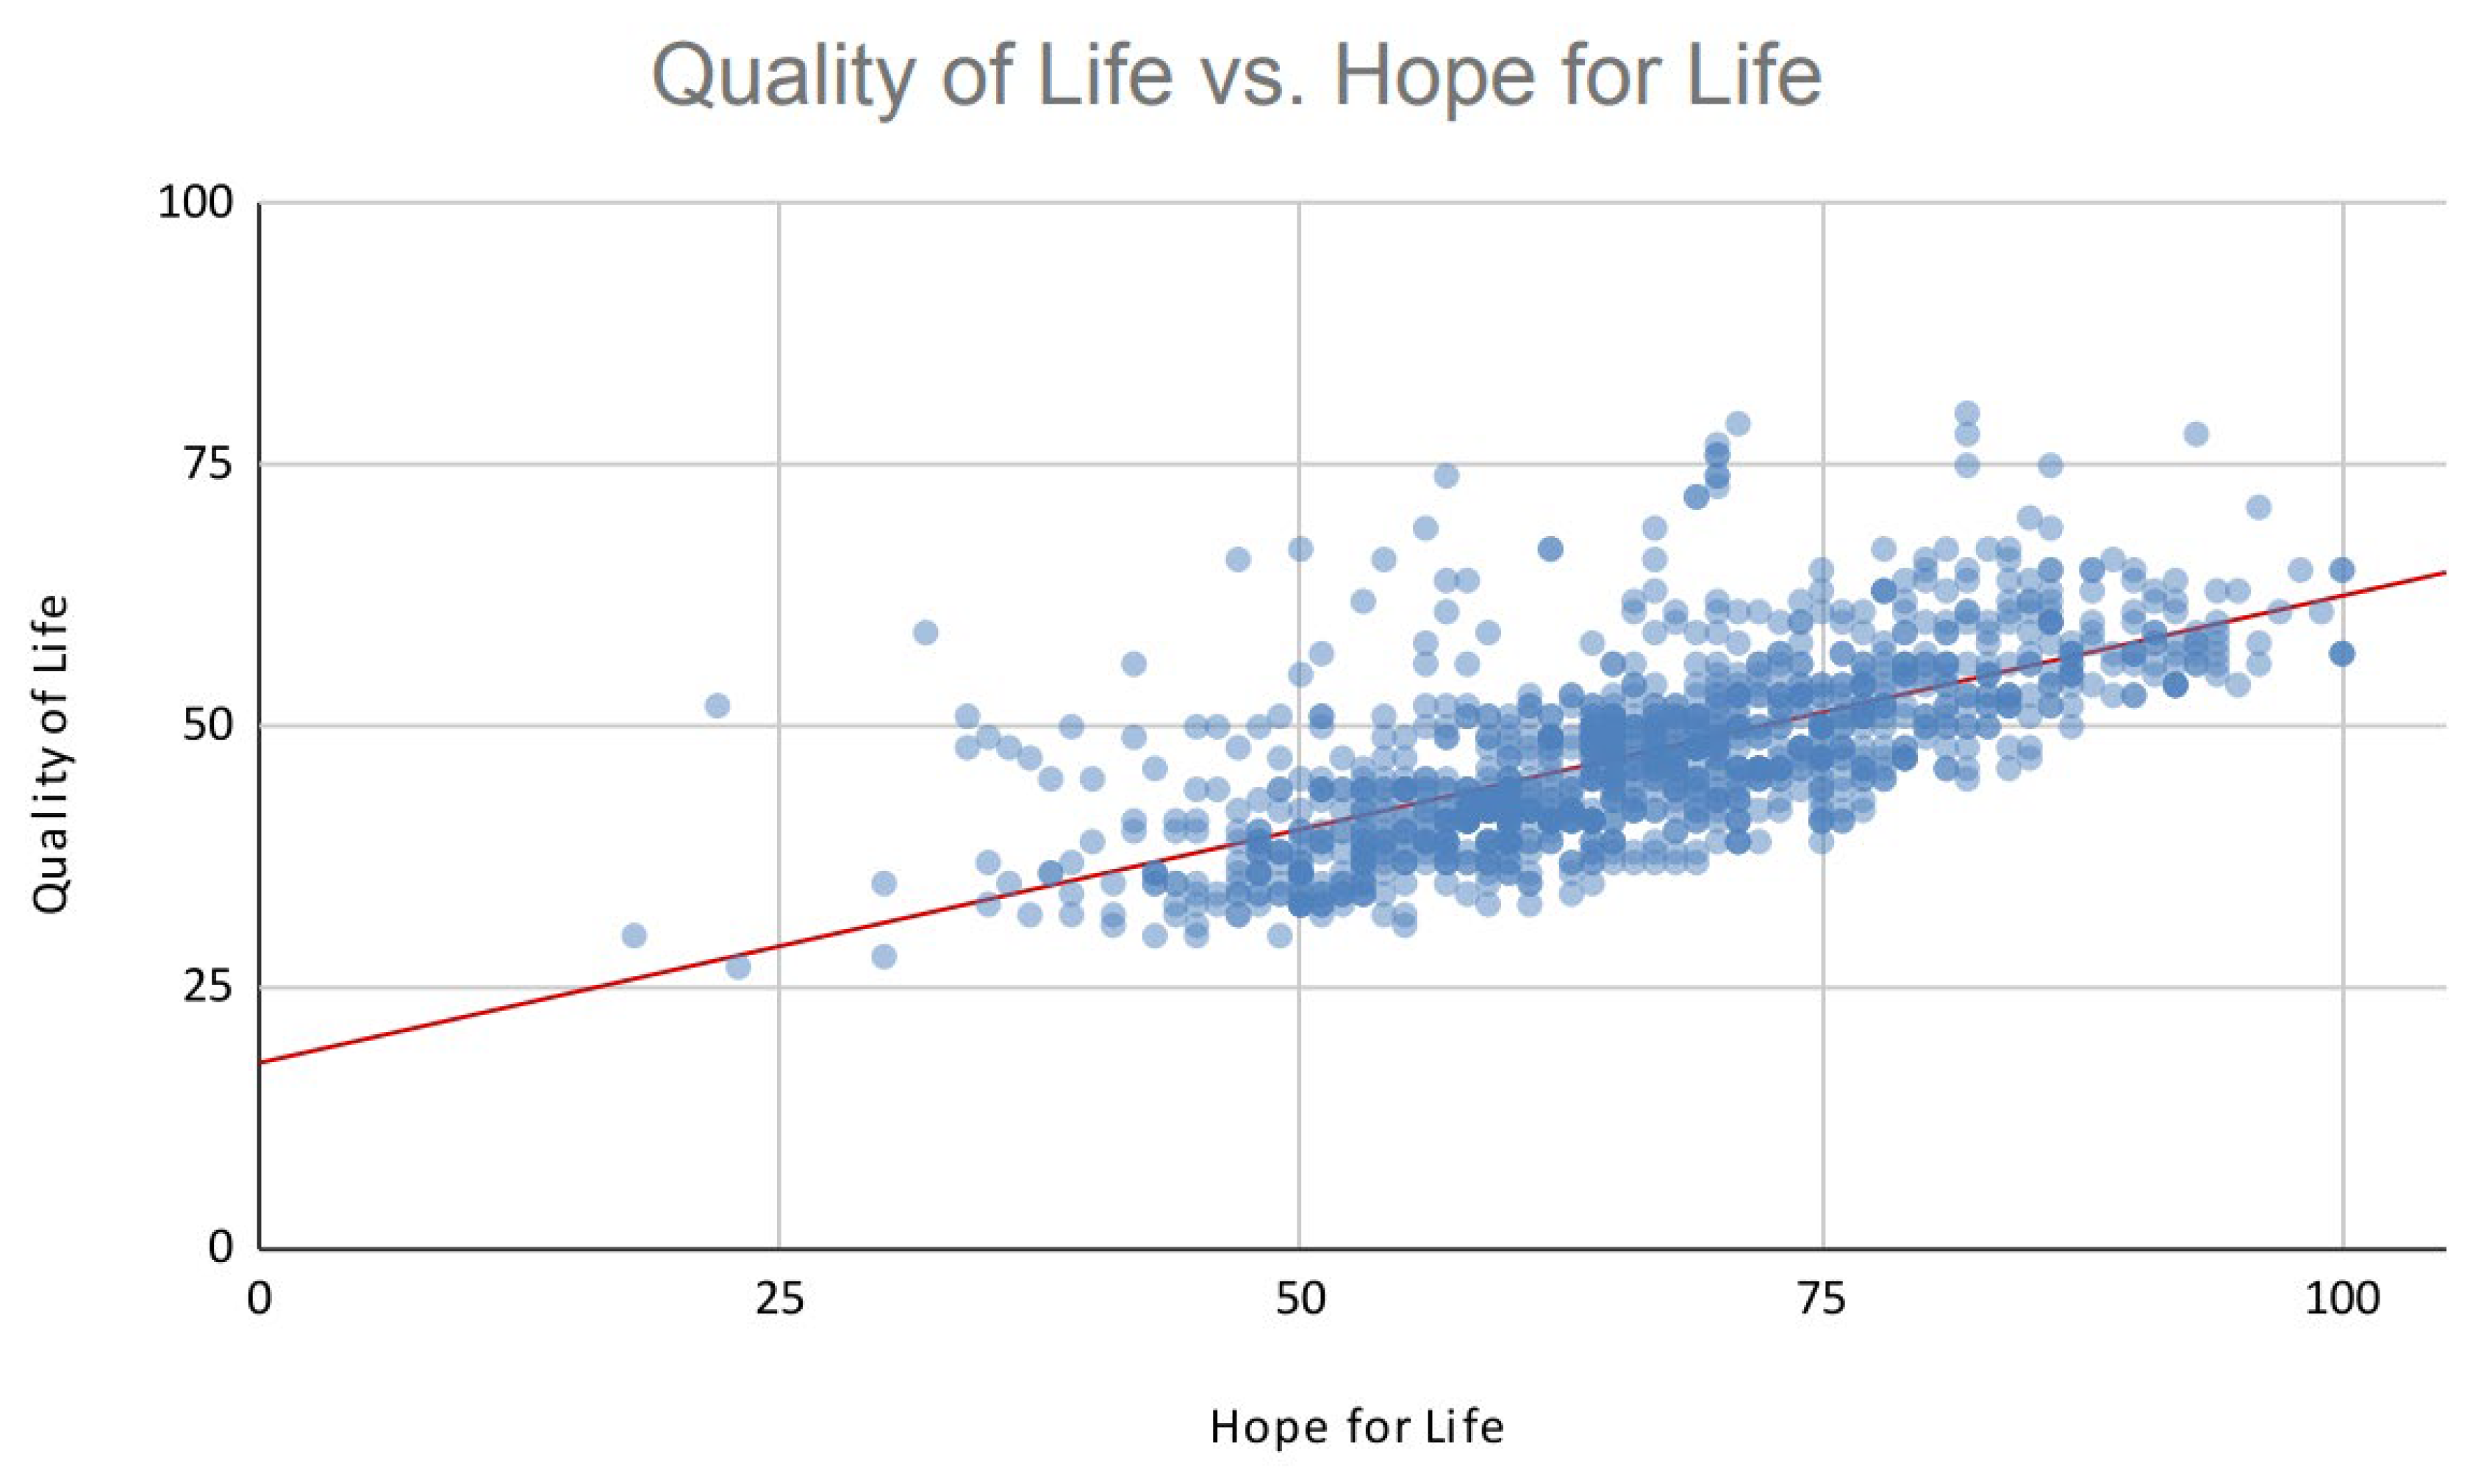
Figure 6.
Compering R-squared scores.
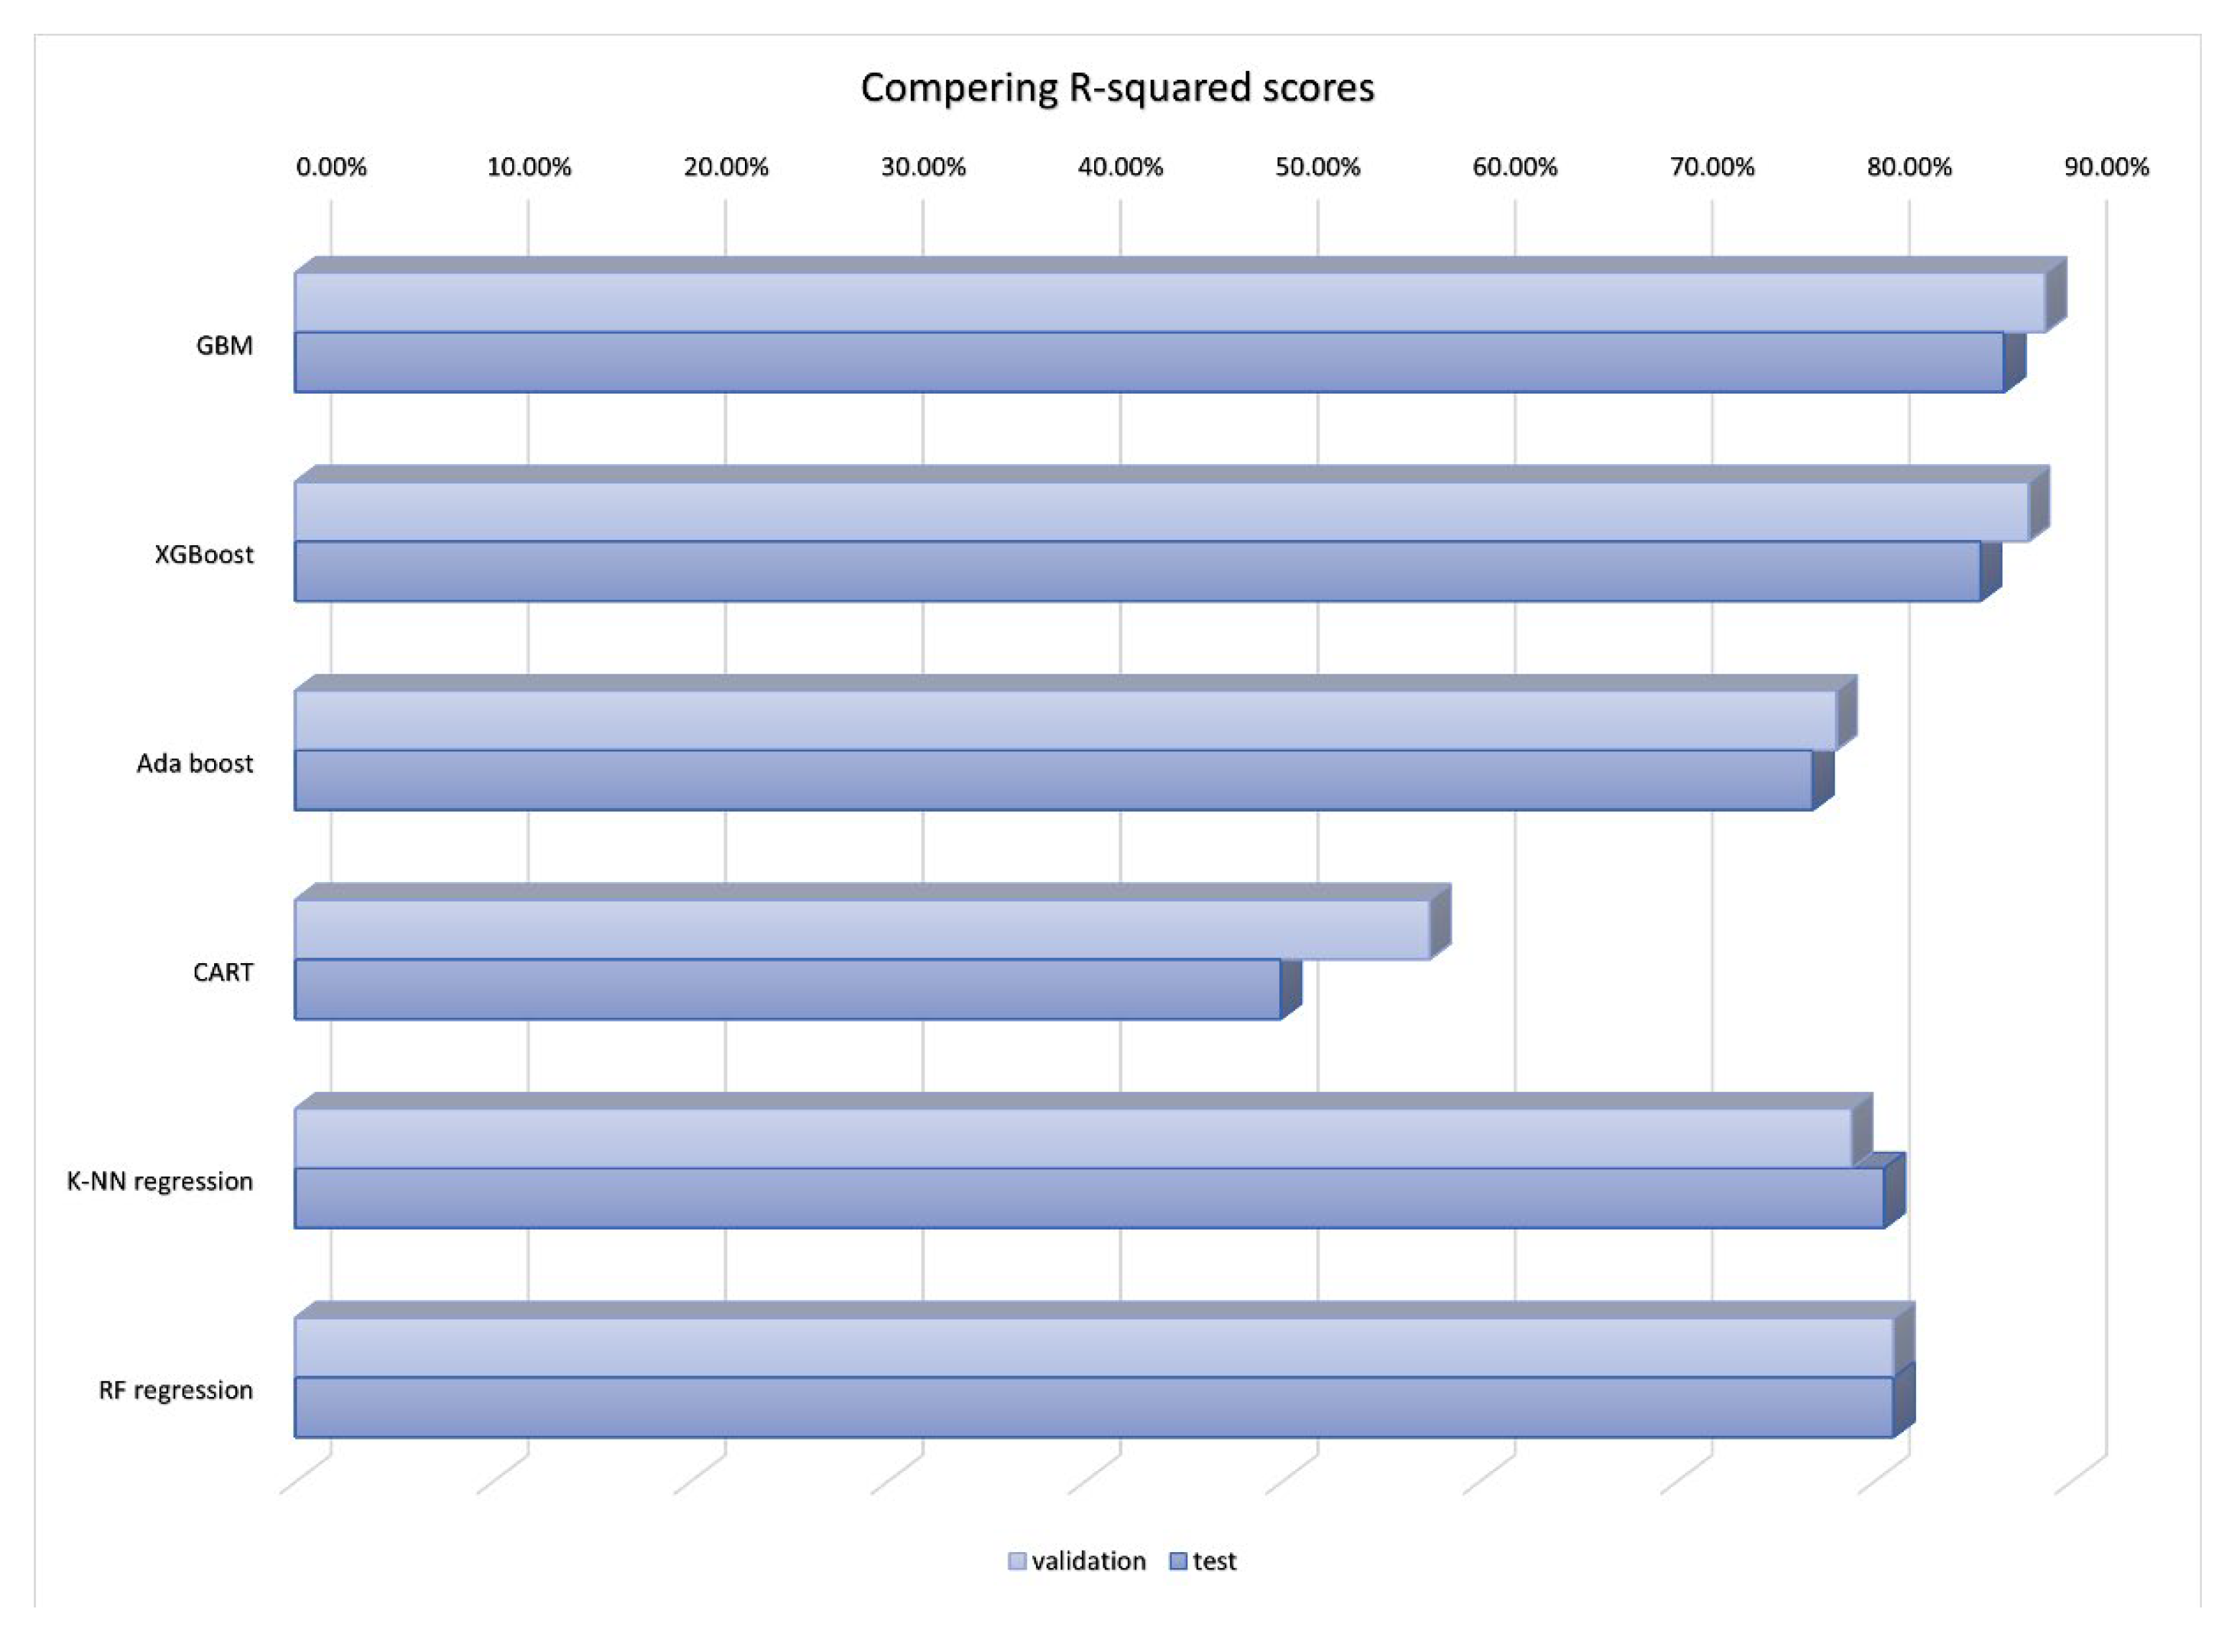
Figure 7.
Compering MSE.
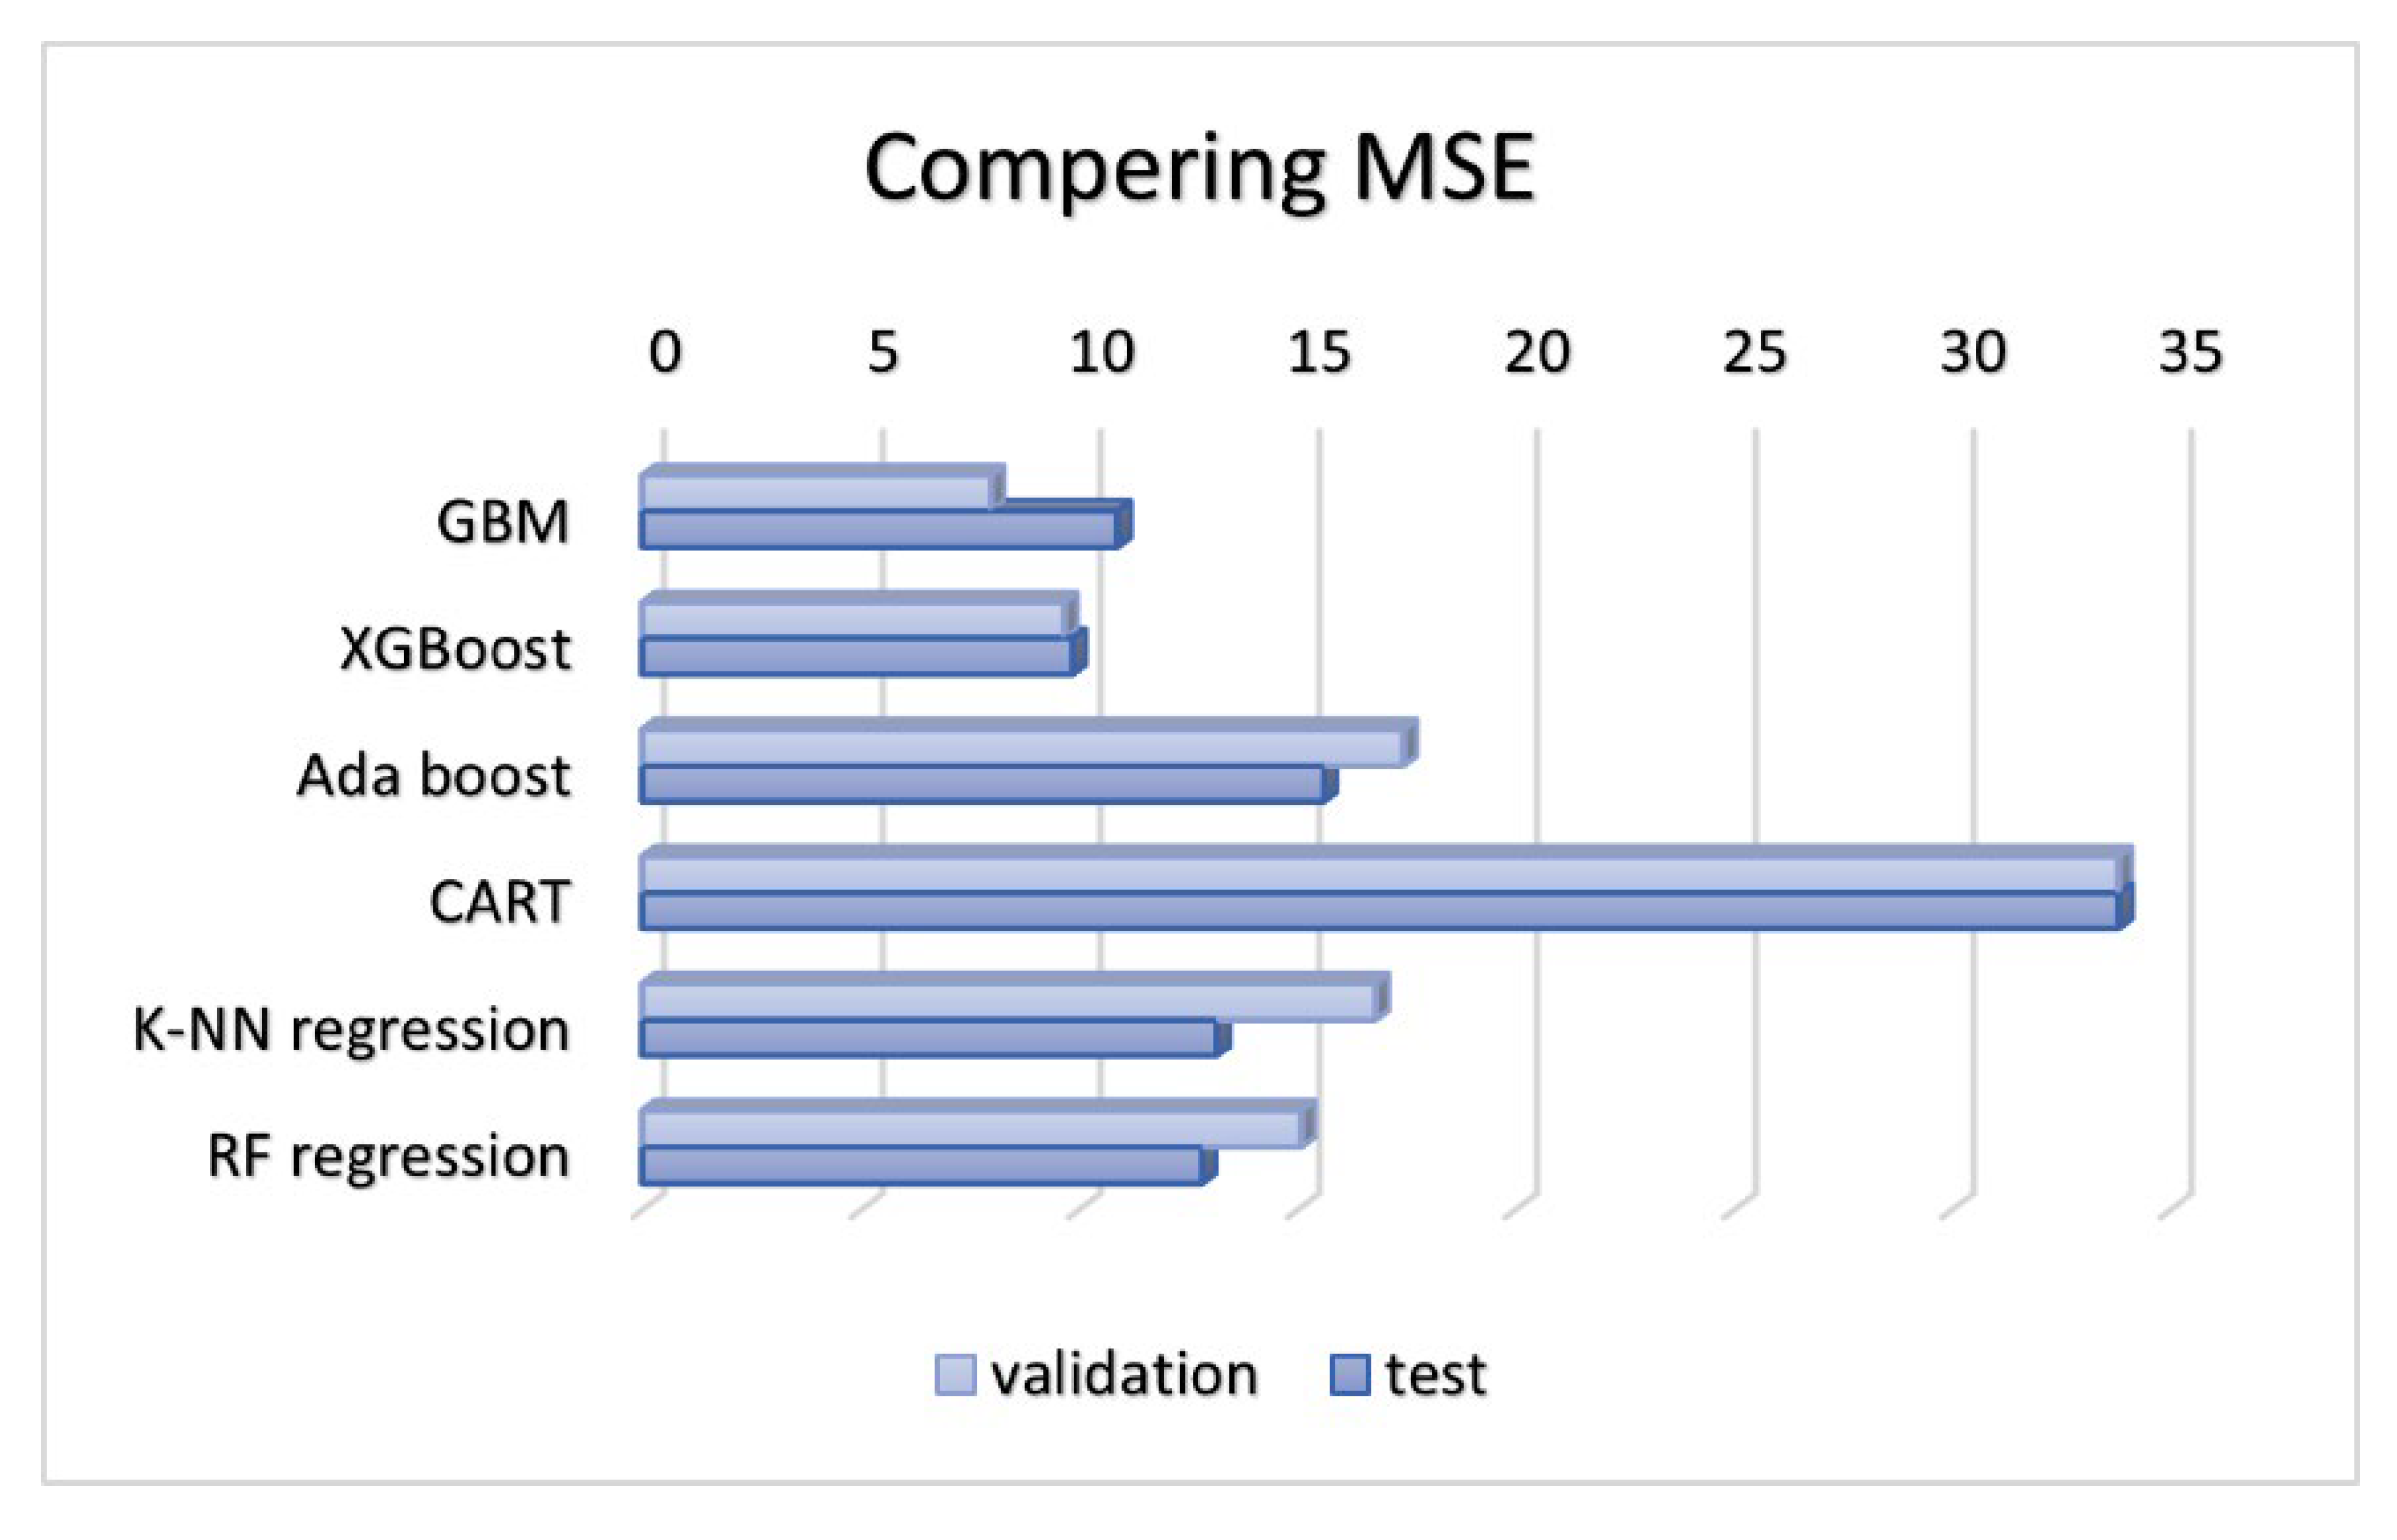
Figure 8.
Compering MAE.
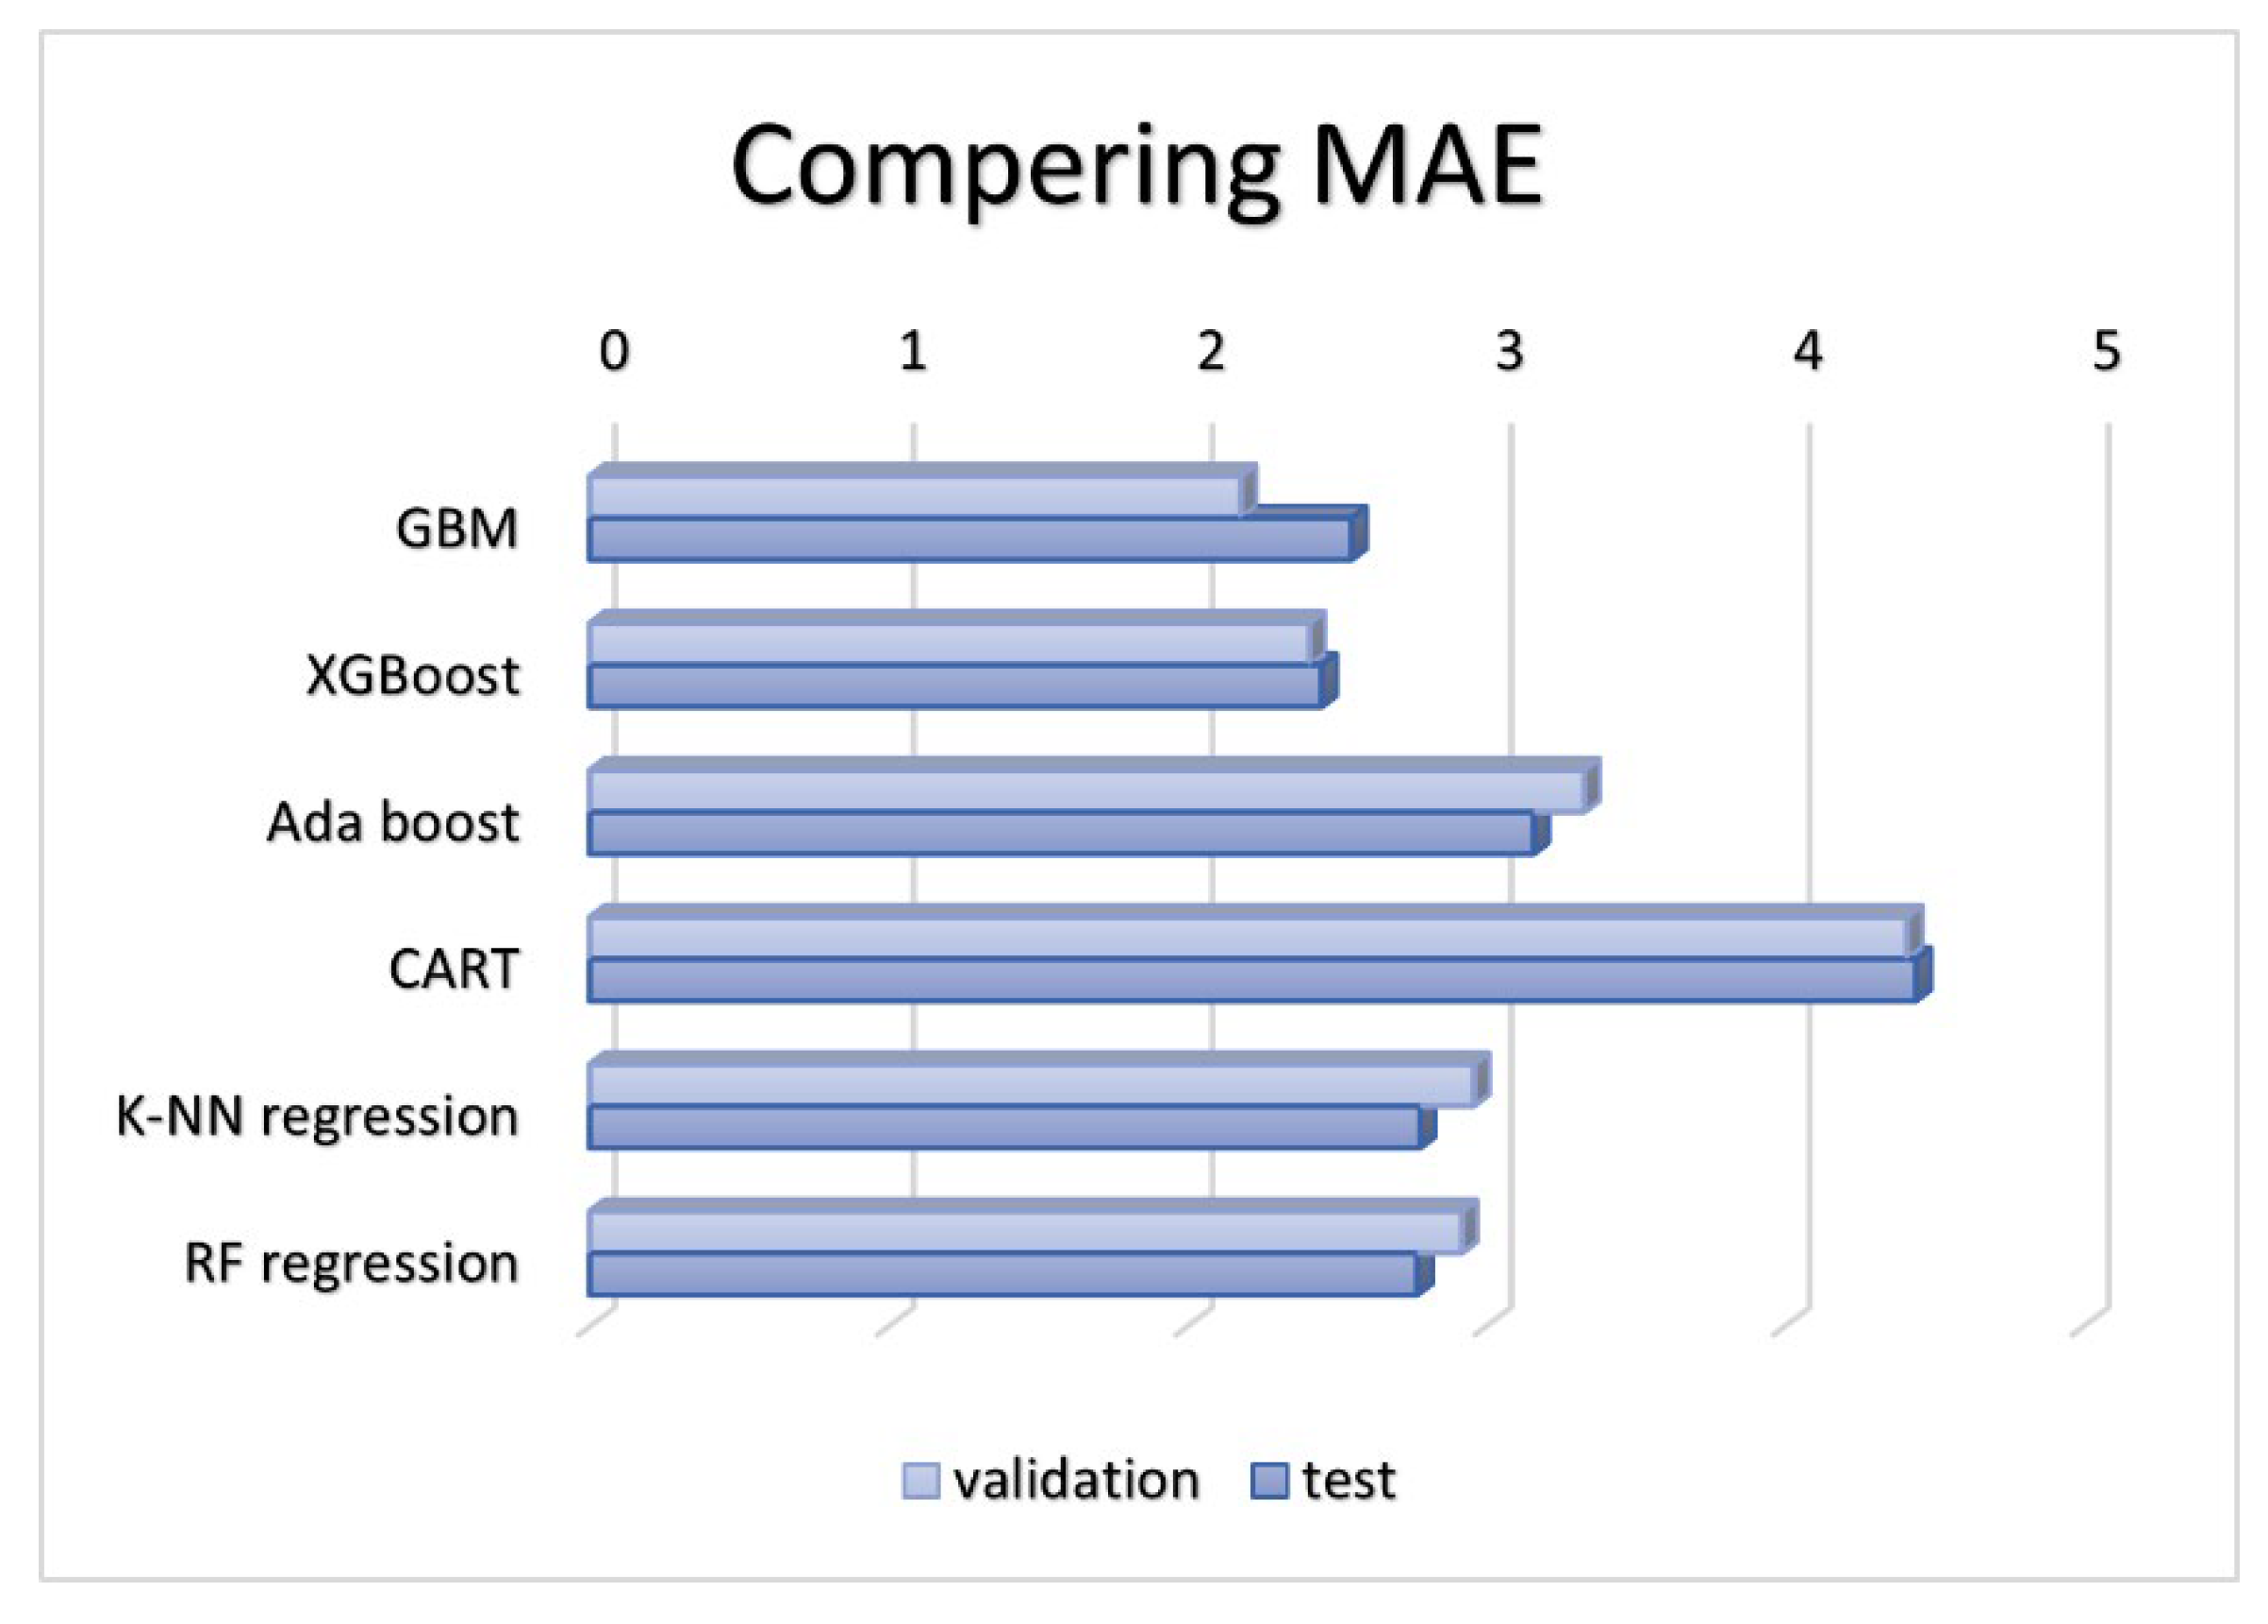

Table 1.
Literature review in Research works on the relationship between QL and Hope life.
| Author | year | Quality of Life (QL) | Hope of Life (HL) | Survey | ||||||||||||||
|---|---|---|---|---|---|---|---|---|---|---|---|---|---|---|---|---|---|---|
| SF-32 | Herth Hope Index (HHI) | FACIT-F | FACT-B | CQOL-C | McGill QL | clinical trial | EORTC QLQ-C30 | EORTC QLQ-C23 | Snyder Hope test | State Hope Scale (SHS) | GHQ-28 | GSES | CGQ | NDRGEI | ||||
| Faroughi et al. [18] | 2023 | ✓ | ✓ | ✓ | ✓ | |||||||||||||
| Zhang et al. [9] | 2023 | ✓ | ✓ | ✓ | ✓ | ✓ | ||||||||||||
| Vallance et al. [19] | 2022 | ✓ | ✓ | ✓ | ||||||||||||||
| Li et al. [6] | 2022 | ✓ | ✓ | ✓ | ✓ | ✓ | ||||||||||||
| Pahlevan Sharif et al. [20] | 2021 | ✓ | ✓ | ✓ | ✓ | |||||||||||||
| Shen et al. [7] | 2020 | ✓ | ✓ | ✓ | ✓ | ✓ | ||||||||||||
| Xu et al. [21] | 2018 | ✓ | ✓ | |||||||||||||||
| Soylu et al. [22] | 2016 | ✓ | ✓ | ✓ | ✓ | ✓ | ||||||||||||
| Tabrizi, Radfar and Taei [23] | 2016 | ✓ | ✓ | ✓ | ✓ | ✓ | ||||||||||||
| Duggleby et al. [24] | 2014 | ✓ | ✓ | ✓ | ✓ | ✓ | ||||||||||||
| Duggleby et al. [25] | 2014 | ✓ | ✓ | ✓ | ✓ | ✓ | ✓ | ✓ | ||||||||||
| Present Article | 2024 | ✓ | ✓ | ✓ | ✓ | ✓ | ||||||||||||
Table 2.
Literature review of research works on the application of ML models in predicting QL.
| Author | Year | Imbalanced Data | Balanced Data | Output type | Hyperparameter optimization | Dimensionality reduction | Machine learning models | |||||||||||||||
|---|---|---|---|---|---|---|---|---|---|---|---|---|---|---|---|---|---|---|---|---|---|---|
| Numerical | Categorical | Grid search | Random Search | Feature selection | Feature extension | K-Nearest Neighbors | Decision Tree (DM) | support vector machine(SVM) | Classification and Regression Tree | Random forest | AdaBoost | XGBoost | Gradient Boosting | Gradient Boosting Decision Tree | Gradient-Boosting Machine(GBM) | Gaussian mixture model (GMM) | Neural Network | Deep Neural Network | ||||
| Choe et al. [17] | 2024 | ✓ | ✓ | ✓ | ✓ | ✓ | ||||||||||||||||
| Kang et al. [16] | 2023 | ✓ | ✓ | ✓ | ✓ | ✓ | ✓ | ✓ | ✓ | |||||||||||||
| Nascimben et al. [15] | 2023 | ✓ | ✓ | ✓ | ✓ | ✓ | ||||||||||||||||
| Nuutinen et al. [5] | 2023 | ✓ | ✓ | ✓ | ||||||||||||||||||
| Savić et al. [8] | 2023 | ✓ | ✓ | ✓ | ✓ | ✓ | ✓ | ✓ | ✓ | |||||||||||||
| Aldraimli et al. [26] | 2022 | ✓ | ✓ | ✓ | ✓ | ✓ | ✓ | ✓ | ||||||||||||||
| Feng et al. [27] | 2022 | ✓ | ✓ | ✓ | ✓ | |||||||||||||||||
| Liu et al. [28] | 2022 | ✓ | ✓ | ✓ | ✓ | ✓ | ✓ | ✓ | ||||||||||||||
| Nuutinen et al. [12] | 2022 | ✓ | ✓ | |||||||||||||||||||
| Pinto et al. [29] | 2022 | ✓ | ✓ | ✓ | ||||||||||||||||||
| Ueno et al. [13] | 2022 | ✓ | ✓ | ✓ | ✓ | |||||||||||||||||
| Liu, Jin and Liu [11] | 2022 | ✓ | ✓ | ✓ | ||||||||||||||||||
| Pfob et al. [30] | 2021 | ✓ | ✓ | ✓ | ✓ | ✓ | ||||||||||||||||
| Makrogiannis, Zheng and Harris [31] | 2021 | ✓ | ||||||||||||||||||||
| Luo et al. [32] | 2021 | ✓ | ||||||||||||||||||||
| Wei et al. [10] | 2021 | ✓ | ✓ | ✓ | ✓ | ✓ | ||||||||||||||||
| Etminani-Ghasrodashti et al. [33] | 2021 | ✓ | ✓ | ✓ | ||||||||||||||||||
| Ganggayah et al. [34] | 2021 | ✓ | ✓ | ✓ | ✓ | |||||||||||||||||
| Crumpei-Tanasă and Crumpei [14] | 2021 | ✓ | ✓ | ✓ | ✓ | ✓ | ✓ | |||||||||||||||
| Yang et al. [35] | 2021 | ✓ | ||||||||||||||||||||
| Rattay et al. [36] | 2020 | ✓ | ✓ | |||||||||||||||||||
| Lee et al. [37] | 2020 | ✓ | ✓ | |||||||||||||||||||
| Sipilä, Kalso and Lötsch [38] | 2020 | ✓ | ✓ | ✓ | ||||||||||||||||||
| Lou et al. [39] | 2020 | ✓ | ✓ | ✓ | ✓ | |||||||||||||||||
| Sim et al. [40] | 2020 | ✓ | ✓ | ✓ | ✓ | ✓ | ✓ | |||||||||||||||
| Vafaei, Noorossana [2] | 2020 | ✓ | ✓ | ✓ | ✓ | ✓ | ✓ | |||||||||||||||
| Present Article | 2024 | ✓ | ✓ | ✓ | ✓ | ✓ | ✓ | ✓ | ✓ | ✓ | ✓ | |||||||||||
Table 3.
Topics of the EORTC-C30.
| 1 | General | 8 | Nausea and Vomiting |
| 2 | Physical | 9 | Happiness |
| 3 | Functional | 10 | Concentration |
| 4 | Social Functioning | 11 | Self-Efficacy |
| 5 | Pain | 12 | Economics |
| 6 | Seizures and Sleep | 13 | Sleep |
| 7 | Appetite | 14 | Satisfaction with the Treatment |
QL questionnaire’s aspects.
Table 4.
Topics of EORTC-BR23.
| 1 | General | 5 | Symptoms and Signs |
| 2 | Physical | 6 | Housework |
| 3 | Self-esteem and Social Relationships | 7 | Fertility and Infertility |
| 4 | Sexual Problems | 8 | Relationships with Doctors and Treatment |
QL questionnaire’s aspects.
Table 5.
Topics of Schneider’s Hope Scale.
| 1 | Planning | 3 | Anticipation of Future Success |
| 2 | Effort | 4 | Vision of the Future |
Schneider’s Hope Scale.
Table 6.
Feature Encoding in the QL Questionnaires.
| Not at all | 0 |
| Low | 1 |
| Very | 2 |
| Very High | 3 |
Feature Encoding.
Table 7.
Feature Encoding Hope Scale Questionnaire.
| Strongly Disagree | 0 |
| Disagree Very Much | 1 |
| Disagree | 2 |
| Disagree Somewhat | 3 |
| Neither Agree nor Disagree | 4 |
| Agree Somewhat | 5 |
| Agree | 6 |
| Strongly Agree | 7 |
Feature Encoding.
Table 8.
Spilling Dataset.
| train | validation | test | |
|---|---|---|---|
| Percentage | 60% | 20% | 20% |
| Number | 68 | 23 | 23 |
Details of the Percentage and amount of Data in each part.
Table 9.
Comparing models.
| GBM | XGBoost | Ada boost | CART | K-NN regression | RF regression | |
|---|---|---|---|---|---|---|
| R-squared score | 88.69% | 87.85% | 78.09% | 57.49% | 78.87% | 81% |
| Mean Squared Error | 7.98 | 9.67 | 17.43 | 33.81 | 16.8 | 15.09 |
| Mean Absolute Error | 2.18 | 2.41 | 3.33 | 4.41 | 2.96 | 2.92 |
Validation data.
Table 10.
Comparing models.
| GBM | XGBoost | Ada boost | CART | K-NN regression | RF regression | |
|---|---|---|---|---|---|---|
| R-squared score | 86.61% | 85.41% | 76.90% | 49.94% | 80.52% | 81% |
| Mean Squared Error | 10.88 | 9.86 | 15.61 | 33.82 | 13.16 | 12.83 |
| Mean Absolute Error | 2.55 | 2.45 | 3.16 | 4.44 | 2.78 | 2.77 |
Test data.
Disclaimer/Publisher’s Note: The statements, opinions and data contained in all publications are solely those of the individual author(s) and contributor(s) and not of MDPI and/or the editor(s). MDPI and/or the editor(s) disclaim responsibility for any injury to people or property resulting from any ideas, methods, instructions or products referred to in the content. |
© 2025 by the authors. Licensee MDPI, Basel, Switzerland. This article is an open access article distributed under the terms and conditions of the Creative Commons Attribution (CC BY) license (http://creativecommons.org/licenses/by/4.0/).
Copyright: This open access article is published under a Creative Commons CC BY 4.0 license, which permit the free download, distribution, and reuse, provided that the author and preprint are cited in any reuse.


