
Submitted:
02 January 2025
Posted:
03 January 2025
You are already at the latest version
Abstract
A new shearing tool was demanded to reduce the iron loss of motor cores by minimization of work hardening damages into the sheared non-oriented electrical steel sheets. The punch edge topology as well as the clearance between the punch and die were controlled to investigate their influence on the sheared surface condition and the work hardening damages of steel sheets. In particular, the hardness mapping was utilized to quantitatively analyze the work-hardened area in the sheared steel sheets and the dissipation plastic work. Among four punch edge topological configurations, the nano-grooved punch in straight along the shearing direction induced the minimum damage into the sheared steel sheets.
Keywords:
shearing
; punching
; work hardening
; non-oriented electrical steel
1. Introduction
Toward the SDGs for the sustainable society, the electric vehicles with highly efficient motors are intensely demanded to save the energy consumption [1]. The energy dissipation by the iron loss induced in the motor core, becomes one of the most essential issues to be solved in engineering. This loss is mainly attributed to the induced work-hardening damage into electrical steel sheets by shearing [2,3,4]. The plastic strains and residual stresses by this work hardening, have a large risk to worsen the magnetic domain structure. This deterioration induces the hysteresis loss as well as the eddy current loss [5]. In particular, the hysteresis loss caused by plastic straining, exaggerate the magnetic anisotropy due to residual stress. Hence, the shearing process must be improved to minimize the affected zone into the non-oriented electrical steel sheets by shearing and to reduce the iron loss.
In the shearing tool design, the clearance between the punch and die plays a role to shearing performance [6,7]. A larger clearance induces a bending moment applied to work material, enhances the work hardening, and, deteriorates its magnetic properties. On the other hand, the smaller clearance is preferable to reduce the work hardening with little degradation of magnetic properties [8,9]. However, the shearing in low clearance often induces a secondary fracture surface and shortens the tool life. The punch edge configuration influences on the shearing process. As stated in [10,11], a mechanically ground edge yielded the burnished surface in shearing; the sheared surface quality deteriorates with its abrasive wearing. However, the work hardening area exaggerated to be three times larger than the work sheet thickness when using the mechanically ground punch edge [2]. When using a carbide punch with the sharpened edge via the argon-ion beam polishing, the work hardening area was much reduced in shearing AISI304 steel sheets [12,13]. As recently reported in [14,15,16,17], the carbide and nitrided punches with periodically nano-grooved edge via short-pulse laser texturing, improved the sheared surface quality with reduction of abrasive and adhesive wears of punch.
In this paper, four types of shearing punches are employed to experimentally analyze the effect of clearance and punch-edge topological configurations to the work hardening damages by shearing the non-oriented steel sheets. Using the specified experimental procedure in common, the die set with three different clearances is utilized. Four punches are prepared for experiments to have different edge configurations; e.g., the mechanically ground edge, an ion-milled edge, and a periodically nano-grooved edge with two groove orientations in 20˚and 90˚ from punch bottom edge. The work hardened areas in the sheared sheets are measured by hardness mapping to quantitatively evaluate the effect of clearance and punch edge configurations to the shearing process. The nano-grooved punches minimize the work hardening damage to work sheets in shearing. In addition, the nano-grooved edge in straight along the shearing direction, or, in the angle of 90˚against its edge, minimized the dissipation plastic work by localization in stress concentration and by control of local shearing.
2. Methods and Materials
2.1. Shearing Process
The screw servo stamping system (Precise Stamping Laboratory, DT-J311; Tokyo, Japan) was utilized to punch out the work materials, as shown in Figure 1(a). The stroke was measured using the laser displacement meter (KEYENCE, SI-F01; Tokyo, Japan) and data acquisition system (KEYENCE, NR-600; Tokyo, Japan). The non-oriented electrical steel sheets with the thickness of 500 μm, were used as a work material. A die set was shown in Figure 1(b). The die and work piece are inserted into a die holder. A punch was inserted into the center hole of a punch guide, and, fastened to the die holder. All punches were made of SKD11 alloy tool steel. The punch diameter was set at 5.000 mm. The die was made of tungsten carbide cobalt, WC (Co). The clearance between the punch and the die was varied by 25 μm, 5 μm, and 2.5 μm, respectively. The loading speed was constant by 5 mm/s. Two shearing experiments were conducted; short-shot at the reduction of thickness of 30% and fully punching out.
2.2. Punch Edge Configurations
Four types of punches were used in this experiment as listed in Figure 2. A normal punch had a mechanically ground edge. Ion-beam treated punch had a sharpened edge by argon ion irradiation. Nano20˚and Nano90˚punches had nano-grooved edges with each width of 300 nm on their side surface in the orientations by 20˚and 90˚, respectively, against their edges.
2.3. Evaluation on Quality of Sheared Electrical Steel Sheets
The area near the right side of sheared hole was observed by SEM (JCM-7000, JEOL; Tokyo, Japan). The fractured surface area ratio was calculated using image processing software (mediBang Paint Pro, Photoshop).
2.4. Mechanical Characterization
The work-hardening zone of sheared electrical steel sheets was determined from the Vickers hardness map after cutting and polishing near the right side of the punched hole. The Vickers hardness tester (HM-100, Mitutoyo; Kawasaki, Japan) was used for measuring hardness. The load was applied by 0.1 N for 10 s. The mapping scheme is shown in Figure 3. The hardness map was measured at three points with the interval of 25 μm on the first zone, at three points with the interval of 50 μm on the second zone, at two points with the interval of 75 μm on the third zone, and at three points with the interval of 100 μm on the forth zone. This hardness map was depicted by ten color-coded levels in each 25 HV.
2.5. Estimate on the Plastic Work
The plastic work () induced into the sheared sheets is estimated using the measured hardness map. is defined by
where is the work density, and is the representative volume of each measuring zone in the hardness mapping. V is a total volume of plastically deformed work materials, excluding the elastically deforming volume. The stress - strain curve of non-oriented electrical steel sheet is modeled by the rigid-plastic model; e.g., , where is the work hardening modulus, and is the yield stress. These and are given by the uniaxial tensile test. Then, the plastic work density is represented by
In case of the hardness mapping in Figure 4, V was discretized into M representative elements, including each measuring point of hardness. Then, the plastic work is calculated by
where rm was a radius of m-th measuring point from the symmetric axis, and and were pitches in the radial and axial directions, respectively, in Figure 4.
3. Experimental Results
3.1. Sheared Surface Observation
The sheared surface conditions by using four punches were evaluated by SEM observation. Figure 5 compares four sheared surface conditions by using four punches when the clearance is fixed by 25 μm (CL25 μm). The fracture surface extends heterogeneously. In case of clearance 5 μm (CL5 μm) in Figure 6, the fractured surface area ratio decreases, and the burnished surface area ratio increases. Less fractured surface areas are detected at clearance 2.5 μm (CL2.5 μm) in Figure 7.
Variation of these fracture and burnished surface area ratios by changing the clearance, was listed in Figure 8 and compared among four punches together with the measured shear droop ratio. At CL25 μm, the fractured surface area ratio exceeds 27 % for every condition. Reducing the clearance down to CL5 μm, the fractured surface area ratio significantly decreases down to 3% in the case of Nano20˚. At CL 2.5 μm, no fractured surface areas are detected when using Nano20˚and Nano90˚punches.
3.2. Work Hardening Zones on the Sheared Surfaces
The work hardening zone is measured by the area with hardness more than 250 HV in the hardness map. Each zone is compared at each clearance for each punch condition in Figure 9. The elastic zone is represented by the green color.
When using a normal punch, larger work hardening zone is detected irrespective of the clearance. To be noticed, the work hardening concentrates at the vicinity of punch edge since the red-colored zone with more hardness than 300 HV is detected at the nearest to edge.
In the case of the ion punch, the work-hardening zone decreases with reducing the clearance. The work hardening zone with more hardness than 375 HV is detected at the vicinity of sheared surface. It is enhanced with decreasing the clearance. This is because of severe plastic flow around the sharpened punch edge.
When using the Nano20˚punch, large work hardening zone fluctuates by itself on the cross-section irrespective of clearance. To be noticed, the highest hardened zone with more hardness than 375 HV, is only detected pointwise at the vicinity of sheared surface.
In the case of the Nano90˚punch, the work hardening area above 250 HV shown in yellow color is concentrated in the vicinity of the hole and minimized when the clearance is less than 5 μm.
As summarized in Figure 10, the fraction of each work hardening zone in the whole cross-sectional area is compared at each clearance and punching condition. When using the normal punch, the yellowed colored zone fraction becomes maximum by 51% at CL2.5 μm. In case of the Nano90˚ punch, the yellowed colored zone fraction becomes minimum by 11% at CL5 μm and CL2.5 μm. This fraction is 35% decrease less than that by the minimum fraction by Ion, 17% at 2.5 μm, and a half of the minimum fraction by Nano20˚, 22% at 25 μm.
Table 1 lists the contribution of elastic zone, medium and high work-hardening zones to the total cross-sectional area. When using Nano90˚punch, the cross sectional area is preserved to be elastic; the medium work-hardening zone is limited by 15%, and the high work hardening zone is suppressed to less than 5%.
3.3. Measurement of Work Hardening Zone for Short-Shot Specimens
A short-shot shearing experiment by 30% of full stroke was performed to describe the transients of work hardening process with comparison to the fully punching-out. Three shots were made with the constant clearance of CL2.5 μm.
When shearing by the Normal punch, the medium work hardening zone fluctuates by itself among three shots. This fluctuation is also seen on the cross-section after fully punching out. This implies that metal flow of work materials is significantly affected by heterogeneous edge profile of normal punch.
In case of the ion punch, the medium work hardening zone is narrowed with smaller fluctuation among three shots after short-shot when compared to the normal punching. This zone of short-shot specimen is reduced after fully punching out. This is because a part of work hardening zone is recovered to be elastic after unloading after fully punching out. To be noticed, the highest work hardening zone is increased after punching out. his implies that the shear strain localizes along the shearing line due to the sharpened edge of ion punch.
In case of the Nano20˚punch, the medium work hardening zone become large at N3 test than that at N1 and N2 in the short-shot specimen. This zone area is much reduced after punching out. This reveals that most of medium work hardening zone recovers to be elastic in unloading after fully punching out. In fact, the highest working hardening zone is commonly seen at the vicinity of sheared surface even after punching out. This proves that the shearing process by Nano20˚punch accompanies with strain concentration in the similar manner to shearing by ion punch.
When using the Nano90˚punch, the medium work hardening zone area is much narrowed without the high work hardening zones even at the vicinity of sheared surface. In addition, no significant fluctuation of work hardening zones is detected after short-shot and fully punching out experiments.
Figure 10 depicts the area fraction of all work hardening zones after short-shot and fully punching out experiments using four punches. The normal punch induces the largest work hardening zones due to its heterogeneous edge profile. In case of the ion punch, the total work hardening zone is reduced by 64.4 % to 43.8% after fully punching out due to its homogeneously sharpened edge. When using the Nano90˚punch, much less work hardening zones are induced to be 20% along the shearing line. These difference of work hardening process among four punches comes from the difference in metal flow pattern during shearing. The plastic work dissipation might well be a measure to describe this punch edge profile effect on the shearing process.
4. Discussion
The tool edge configuration as well as the clearance have influence on the work hardening damages induced into the sheared electrical steel sheets. When using the mechanically ground normal punch, the widest work-hardening volume is detected in Figure 9 and Figure 11 irrespective of the clearance. This is because the work plastic flow around the heterogeneous punch edge enhances the work hardening. Figure 12 also shows the largest variation from experiment to experiment. The heterogeneous punch edge is not reproducible for work hardening formation from experiment to experiment.
When using the ion-sharpened punch, severe work hardening zone volume becomes maximum among four punches in case of 2.5 μm clearance. The fracture surface area ratio also becomes maximum in case of 25 μm clearance. This implies that work plastic flow localizes at the sharpened punch edge results in severest work hardening and induces the onset of fracture. This local work hardening behavior is also observed when using the Nano-20˚punch. However, the work hardening zone volume is much smaller in case of more clearance than 5 μm, severe work hardening zone volume does not increase by decreasing the clearance, and the fracture surface area ratio is always smaller than that using the ion-punch. This reveals that the nano-grooves in the direction of 20˚ controls the local work plastic flow around the sharped edge and reduces the work hardening damage.
When using Nano-90˚punch, the local work hardening zone volume reduces significantly even in case of clearance less than 5 μm; e.g., smaller by 69% than that when using the normal punch, and smaller by 51% than that when using the Nano-20˚punch. This drastic suppression of work hardening damages comes from the nano-groove structure with the groove orientation change from 20˚to 90˚.
When using Nano-20˚punch, the surface of the workpiece must overcome the nano-periodic structure formed by the punch tip during shearing. When using Nano-90˚punch, on the other hand, the surface of the workpiece does not have to overcome the nano-periodic structure. Therefore, a state of local stress concentration continues until shearing is completed, and the work hardening area is considered to be narrow and concentrated.
The plastic dissipation work (W) provides a measure to analyze the tool edge topology effect on the work hardening damage. As listed in Table 2, W reduces monotonously by changing the (normal punch ) → (ion-sharpened punch) → (Nano20˚punch) → (Nano90˚punch). The deviation (ΔW) of W among three strokes in shearing represents the effect of homogeneity in the punch edge configuration to the local plastic flow. The monotonous decrease of ΔW with (normal punch)→(Ion)→(Nano20˚)→(Nano90˚) , proves that local plastic flow is well controlled to suppress the local work hardening by using the sharpened and nano-grooved punch edge.
In comparison to the normal punch, the plastic work (W) is halved when using Nano20˚ and 1/3 when using Nano-90˚. Let us discuss this effect of nano-grooved punch edge configurations to W with comparison to the ion-milled punch. When using this punch, the shear strain exceeds a certain level and induces the ductile separation at its sharp and homogeneous edge. The nano-grooves work to enhance the strain concentration at the nano-grooved edges and to onset the shear-slipping of work materials from edges. The difference of shearing and burnishing behavior between the ion-milled and nano-grooved punches, comes from stress concentration by indentation of nano-grooves to induce the separation of work materials. The plastic work is minimized by using these nano-grooved punches.
The difference of local shearing and burnishing behavior between Nano20˚ and Nano90˚ is considered in next. In case of Nano20˚, the locally sheared work material starts to flow along the skewed orientation by 20˚ on the punch side surface and to separate from the nano-grooves. This work material separation from nano-grooves distributes the shear stresses and induces the broadening of work hardening zones in the radial direction. On the other hand, no work separation occurs from the nano-grooved edge by 90˚ to preserve the shear stress concentration at the nano-grooved edges against the work materials. The dissipation plastic work is minimized by this local control of material flow around the nano-grooved edges.
5. Conclusion
The following conclusions were drawn from an investigation that four types of shearing punches are employed to experimentally analyze the effect of clearance and punch-edge topological configurations to the work hardening damages by shearing the non-oriented steel sheets.
(1) When using a punch which has a mechanically ground edge, larger work hardening zone is detected irrespective of the clearance.
(2) In the case of the Ion-beam treated punch, the work-hardening zone decreases with reducing the clearance. The work hardening zone with more hardness than 375 HV is detected at the vicinity of sheared surface. It is enhanced with decreasing the clearance.
(3) The plastic work is minimized by using nano-grooved punches.
(4) When using the Nano90˚ punch, fractured surface areas, the work hardening zone and the plastic work are minimized.
Author Contributions
Conceptualization, T.A. and T.S.; methodology, T.F. and R.O.; investigation, R.O. and K.I.; resources, R.O., T.S. and T.F.; writing—original draft preparation, R.O. and K.I.; writing—review and editing, T.A., T.F. and T.S.; supervision, T.A. and T.S. All authors have read and agreed to the published version of the manuscript.
Funding
The present study was financially supported in part by the Public Benefit Trust Ame Hisaharu Toyama.
Institutional Review Board Statement
Not applicable.
Informed Consent Statement
Not applicable.
Data Availability Statement
Not applicable.
Acknowledgments
The authors would like to thank for Ohmura S. for his help in experiments.
Conflicts of Interest
The authors declare no conflict of interest.
References
- Enomoto, Y.; Soma, K. Development of the Amorphous Motor Balancing both Resource Saving and Energy Saving. J. Soc. Mech. Eng. 2014, 117-1152, 753–756. [Google Scholar]
- Zaizen, Y.; Omura, T.; Fukumura, M.; Senda, K.; Toda, H. Evaluation of stress distribution due to shearing in non-oriented electrical steel by using synchrotron radiation. AIP Adv. 2016, 6-5, 055926. [Google Scholar] [CrossRef]
- Zaizen, Y.; Omura, T.; Senda, K.; Fukumura, M.; Oda, Y.; Toda, H. Influence of Grain Size of Non-oriented Electrical Steel Sheets on Iron Loss Deterioration by Shearing Process. IEEJ Trans. FM. 2018, 138-11, 576–581. [Google Scholar] [CrossRef]
- Toda, H.; Zaizen, Y.; Namikawa, M.; Shiga, N.; Oda, Y.; Morimoto, S. Iron Loss Deterioration by Shearing Process in Non-Oriented Electrical Steel with Different Thickness and Its Influence on Estimation of Motor Iron Loss. IEEJ J. Ind. Appl. 2013, 3-1, 55–61. [Google Scholar]
- Tani, Y.; Daikoku, A.; Nakano, M.; Arita, H.; Yamaguchi, S.; Toide, Y. Magnetic Power Loss Characteristics of Non-oriented Electrical Steel Sheets under Stress. J. Magn. Soc. Jpn. 2006, 30, 196–200. [Google Scholar] [CrossRef]
- Hirota, K. Precision Blanking with Negative Clearance. J. Jpn. Soc. Technol. Plast. 2014, 55-638, 185–189. [Google Scholar]
- Yoshida, Y. Deformation Behavior of Die and Tools in Shearing. J. Jpn. Soc. Technol. Plast. 2017, 58-681, 903–907. [Google Scholar]
- Yiwei, Z.; Qiusheng, Y.; Jiabin, L.; Wei, X. Effects of shearing processing on the quality and magnetic properties of electric steel sheet. Ain Shams Eng. J. 2024, 15-2, 102395. [Google Scholar]
- Ján, F.; Samuel, D.; Ivan, P.; Peter, K.; František, K.; Ján, S. Correlation between Cutting Clearance, Deformation Texture, and Magnetic Loss Prediction in Non-Oriented Electrical Steels. Materials. 2021, 14-22, 6893. [Google Scholar]
- Weiss, H.A.; Leuning, N.; Steentjes, S.; Hameyer, K.; Andorfer, T.; Jenner, S.; Volk, W. Influence of shear cutting parameters on the electromagnetic properties of non-oriented electrical steel sheets. J. Magn. Magn. Mater 2017, 421-10, 250–259. [Google Scholar] [CrossRef]
- Ján, S.; Ľuboš, K.; Stanislaw, K. FEM Modeling of Shear Cutting of Electrical Steel Sheets under Various Technological Conditions. Acta Mech. Slovaca 2018, 22-4, 24–30. [Google Scholar]
- Fujimoto, K.; Yang, M.; Hotta, M.; Koyama, H.; Nakano, S.; Morikawa, K.; Cairney, J. Fabrication of dies in micro-scale for micro-sheet metal forming. J. Mater. Process. Technol. 2006, 177-1, 639–643. [Google Scholar] [CrossRef]
- Xu, J.; Guo, B.; Shan, D.; Wang, C.; Wang, Z. Surface quality improvements of WC–Co micro-punch finished by ion beam irradiation for micro-punching process of metal foil. Surf. Coat. Technol. 2013, 235-25, 803–810. [Google Scholar] [CrossRef]
- Aizawa, T.; Inohara, T. Pico- and Femtosecond Laser Micromachining for Surface Texturing. In Micromachining, Stanimirović, Z.; Stanimirović, I.; Belgrade, Serbia, 2019; Volume 1.
- Aizawa, T.; Inohara, T.; Wasa, K. Nano-Texturing onto Tool-Surface by the Femtosecond Laser Processing. In Proceedings of the 4th WCMNM, India, 21–23 September 2021. [Google Scholar]
- Aizawa, T.; Yoshino, T.; Suzuki, Y.; Inohara, T. Micro-/Nano-Texturing onto Plasma-Nitrided Tool Surface by Laser Printing for CNC Imprinting and Piercing. Micromachines. 2022, 13-2, 265. [Google Scholar] [CrossRef] [PubMed]
- Aizawa, T.; Inohara, T.; Yoshino, T.; Shiratori, T.; Suzuki, Y. Laser Treatment CVD Diamond Coated Punch for Ultra-Fine Piercing of Metallic Sheets. In Engineerng Applications of Diamond, Mallik, A.; Hasselt, Dutch, 2021; Volume1, 63-84.
Figure 1.
An experimental setup for dry punching of non-oriented electrical steel sheets. (a) A CNC (Computer Numerical Control) stamper, and (b) a die set.
Figure 1.
An experimental setup for dry punching of non-oriented electrical steel sheets. (a) A CNC (Computer Numerical Control) stamper, and (b) a die set.
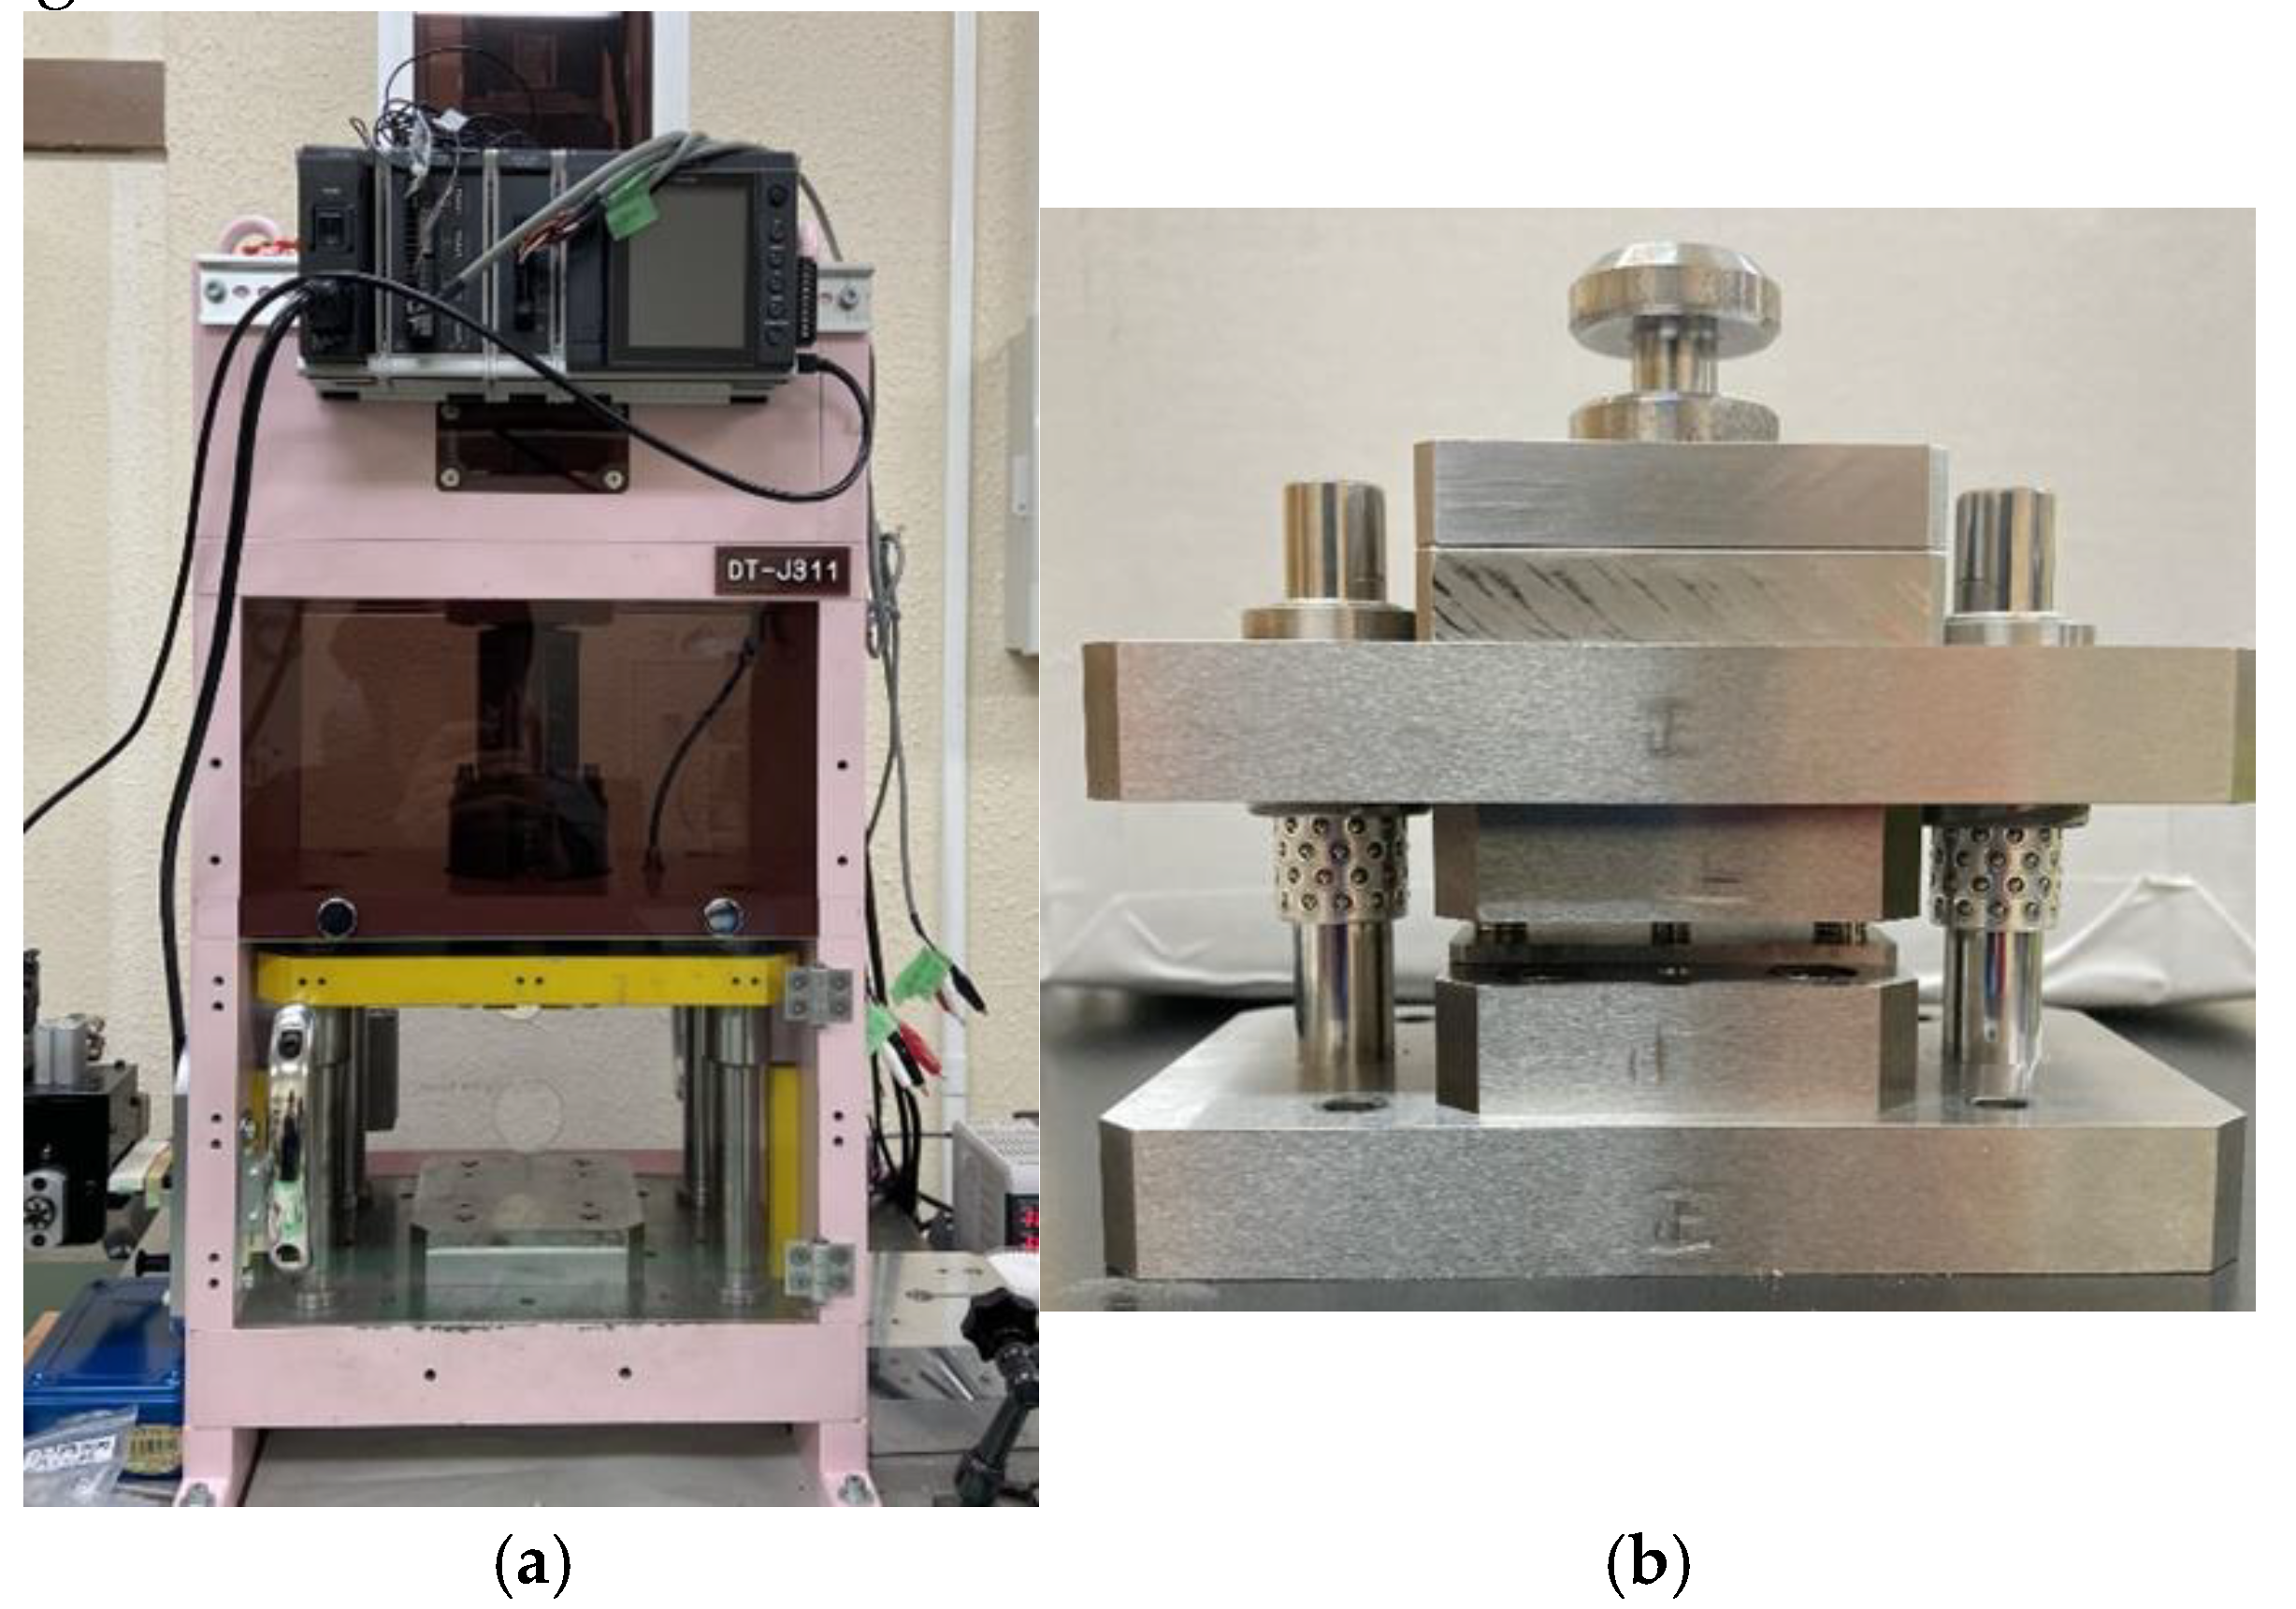
Figure 2.
Four types of shearing punches with different edge configurations. Low magnification SEM images were listed in the upper raw, and high magnification SEM images were listed in the lower raw.
Figure 2.
Four types of shearing punches with different edge configurations. Low magnification SEM images were listed in the upper raw, and high magnification SEM images were listed in the lower raw.
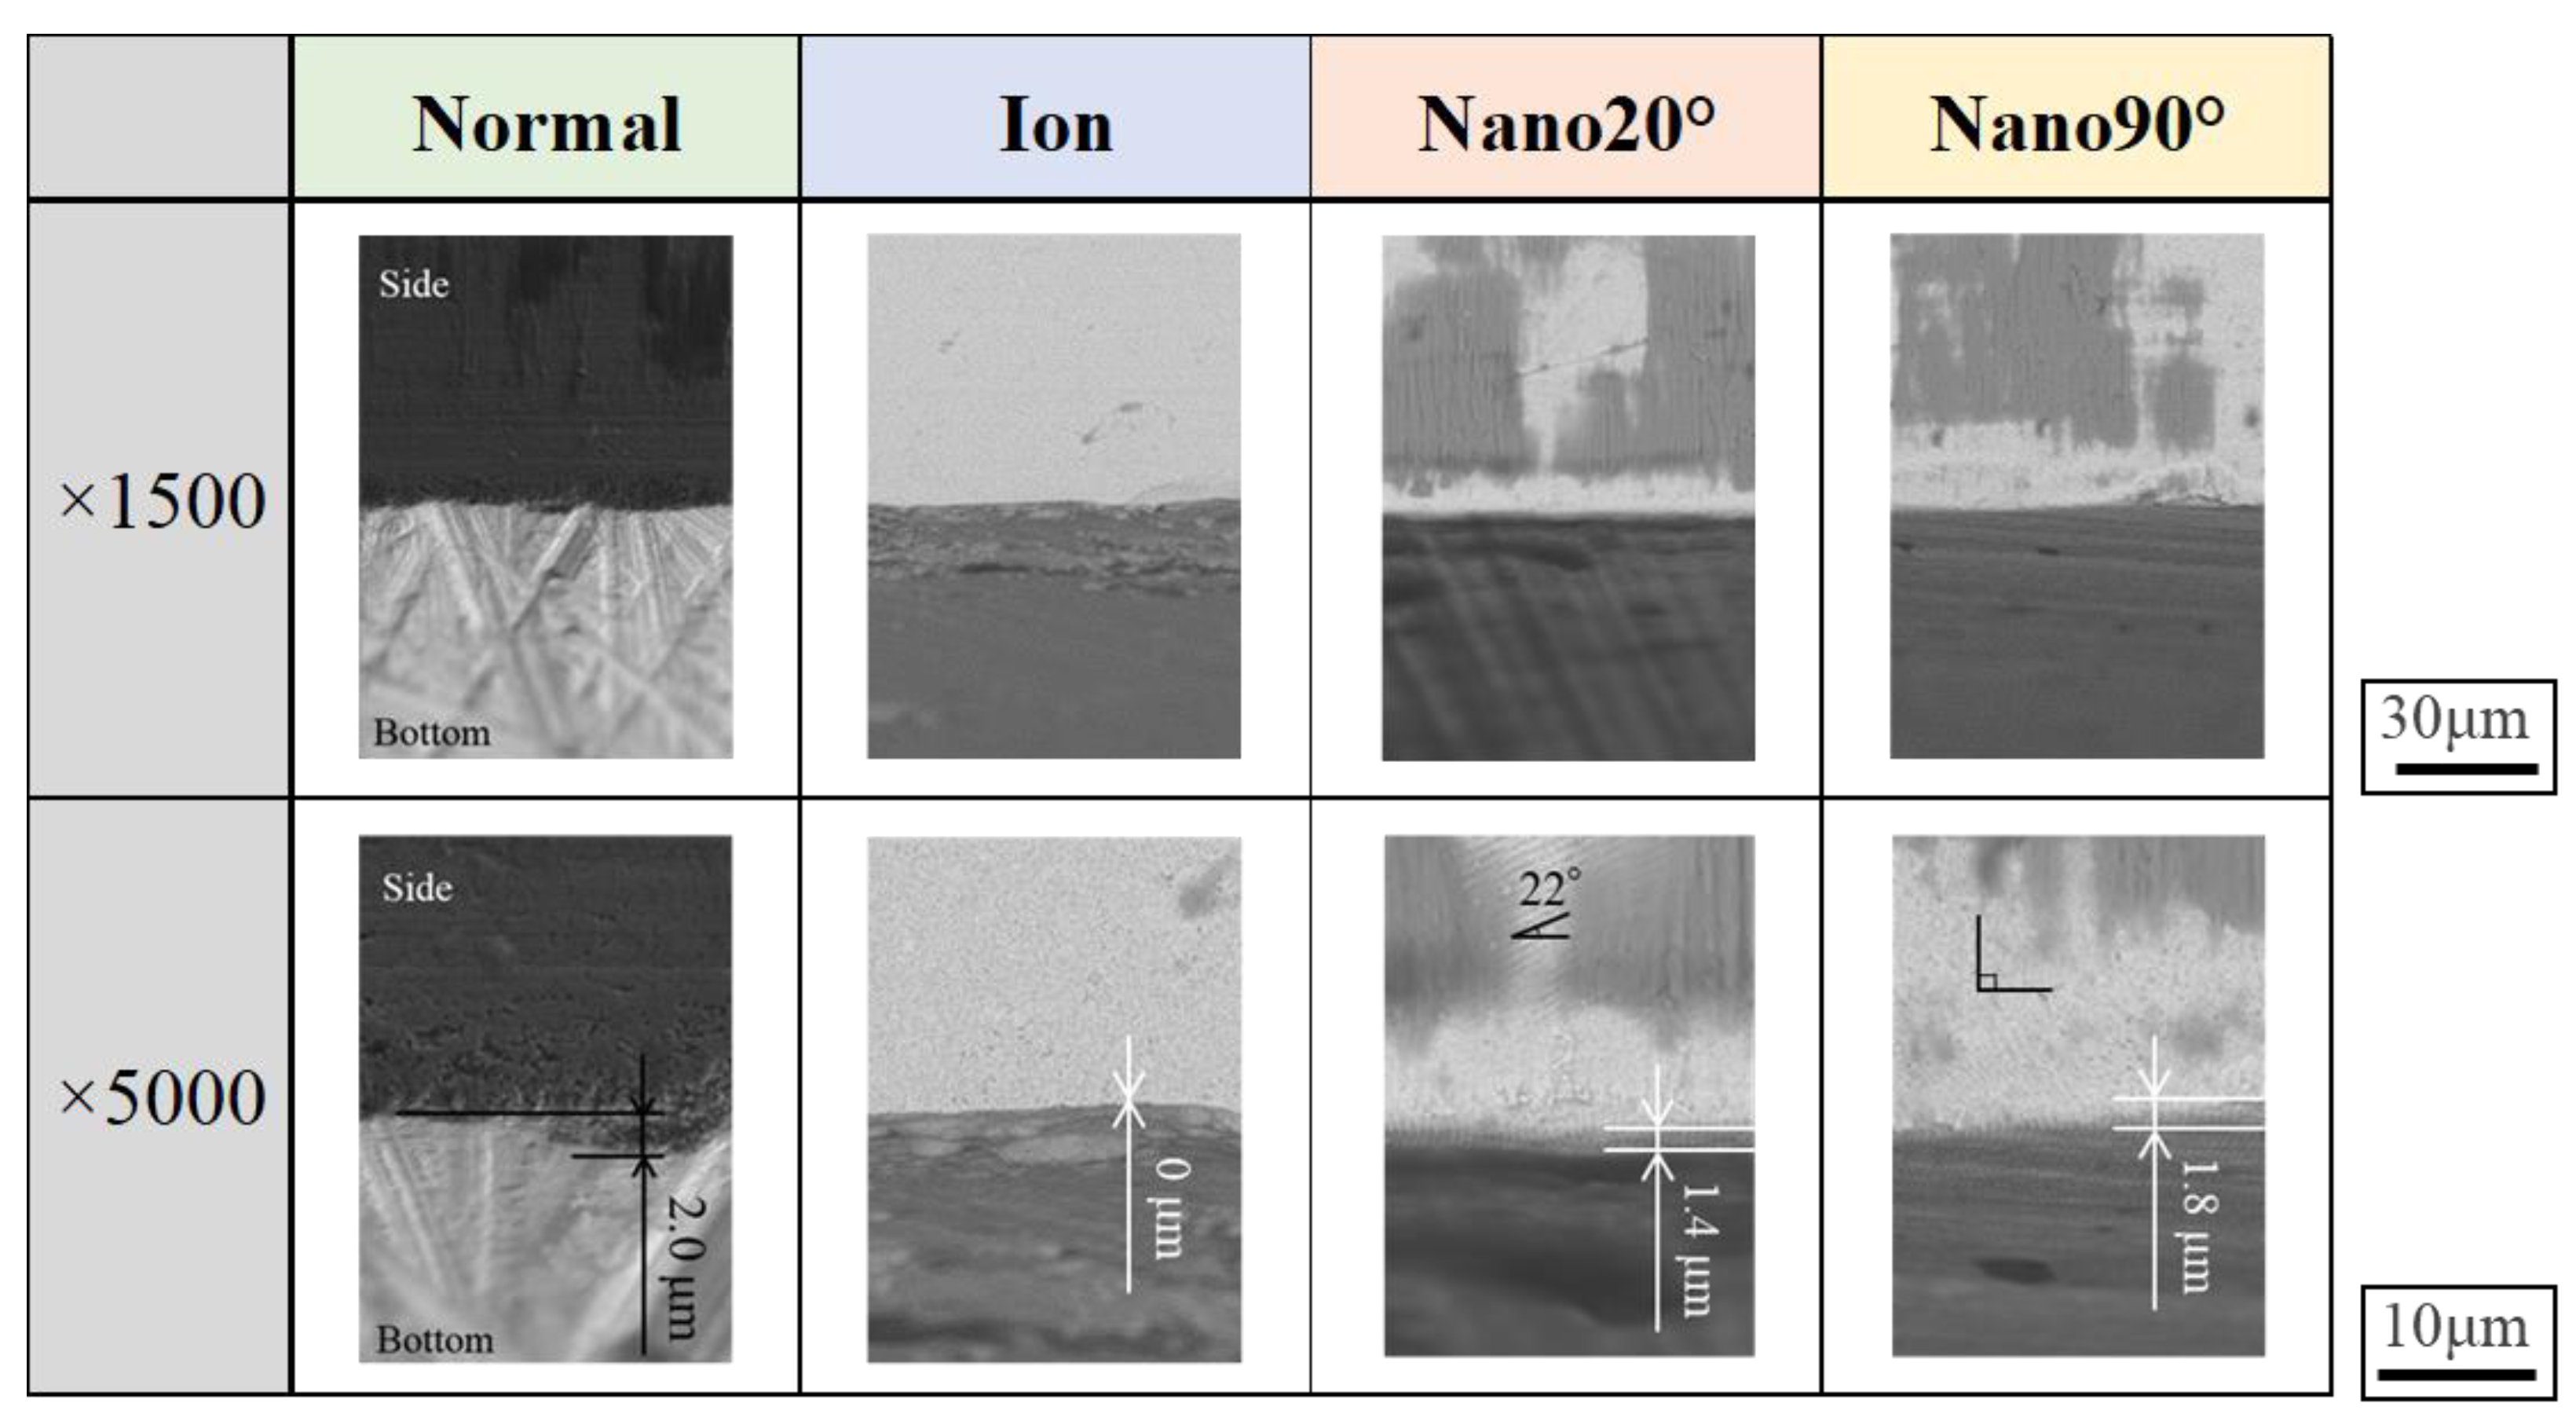
Figure 3.
Hardness mapping to evaluate the affected zone of sheared electrical steel sheets using four types of punches.
Figure 3.
Hardness mapping to evaluate the affected zone of sheared electrical steel sheets using four types of punches.
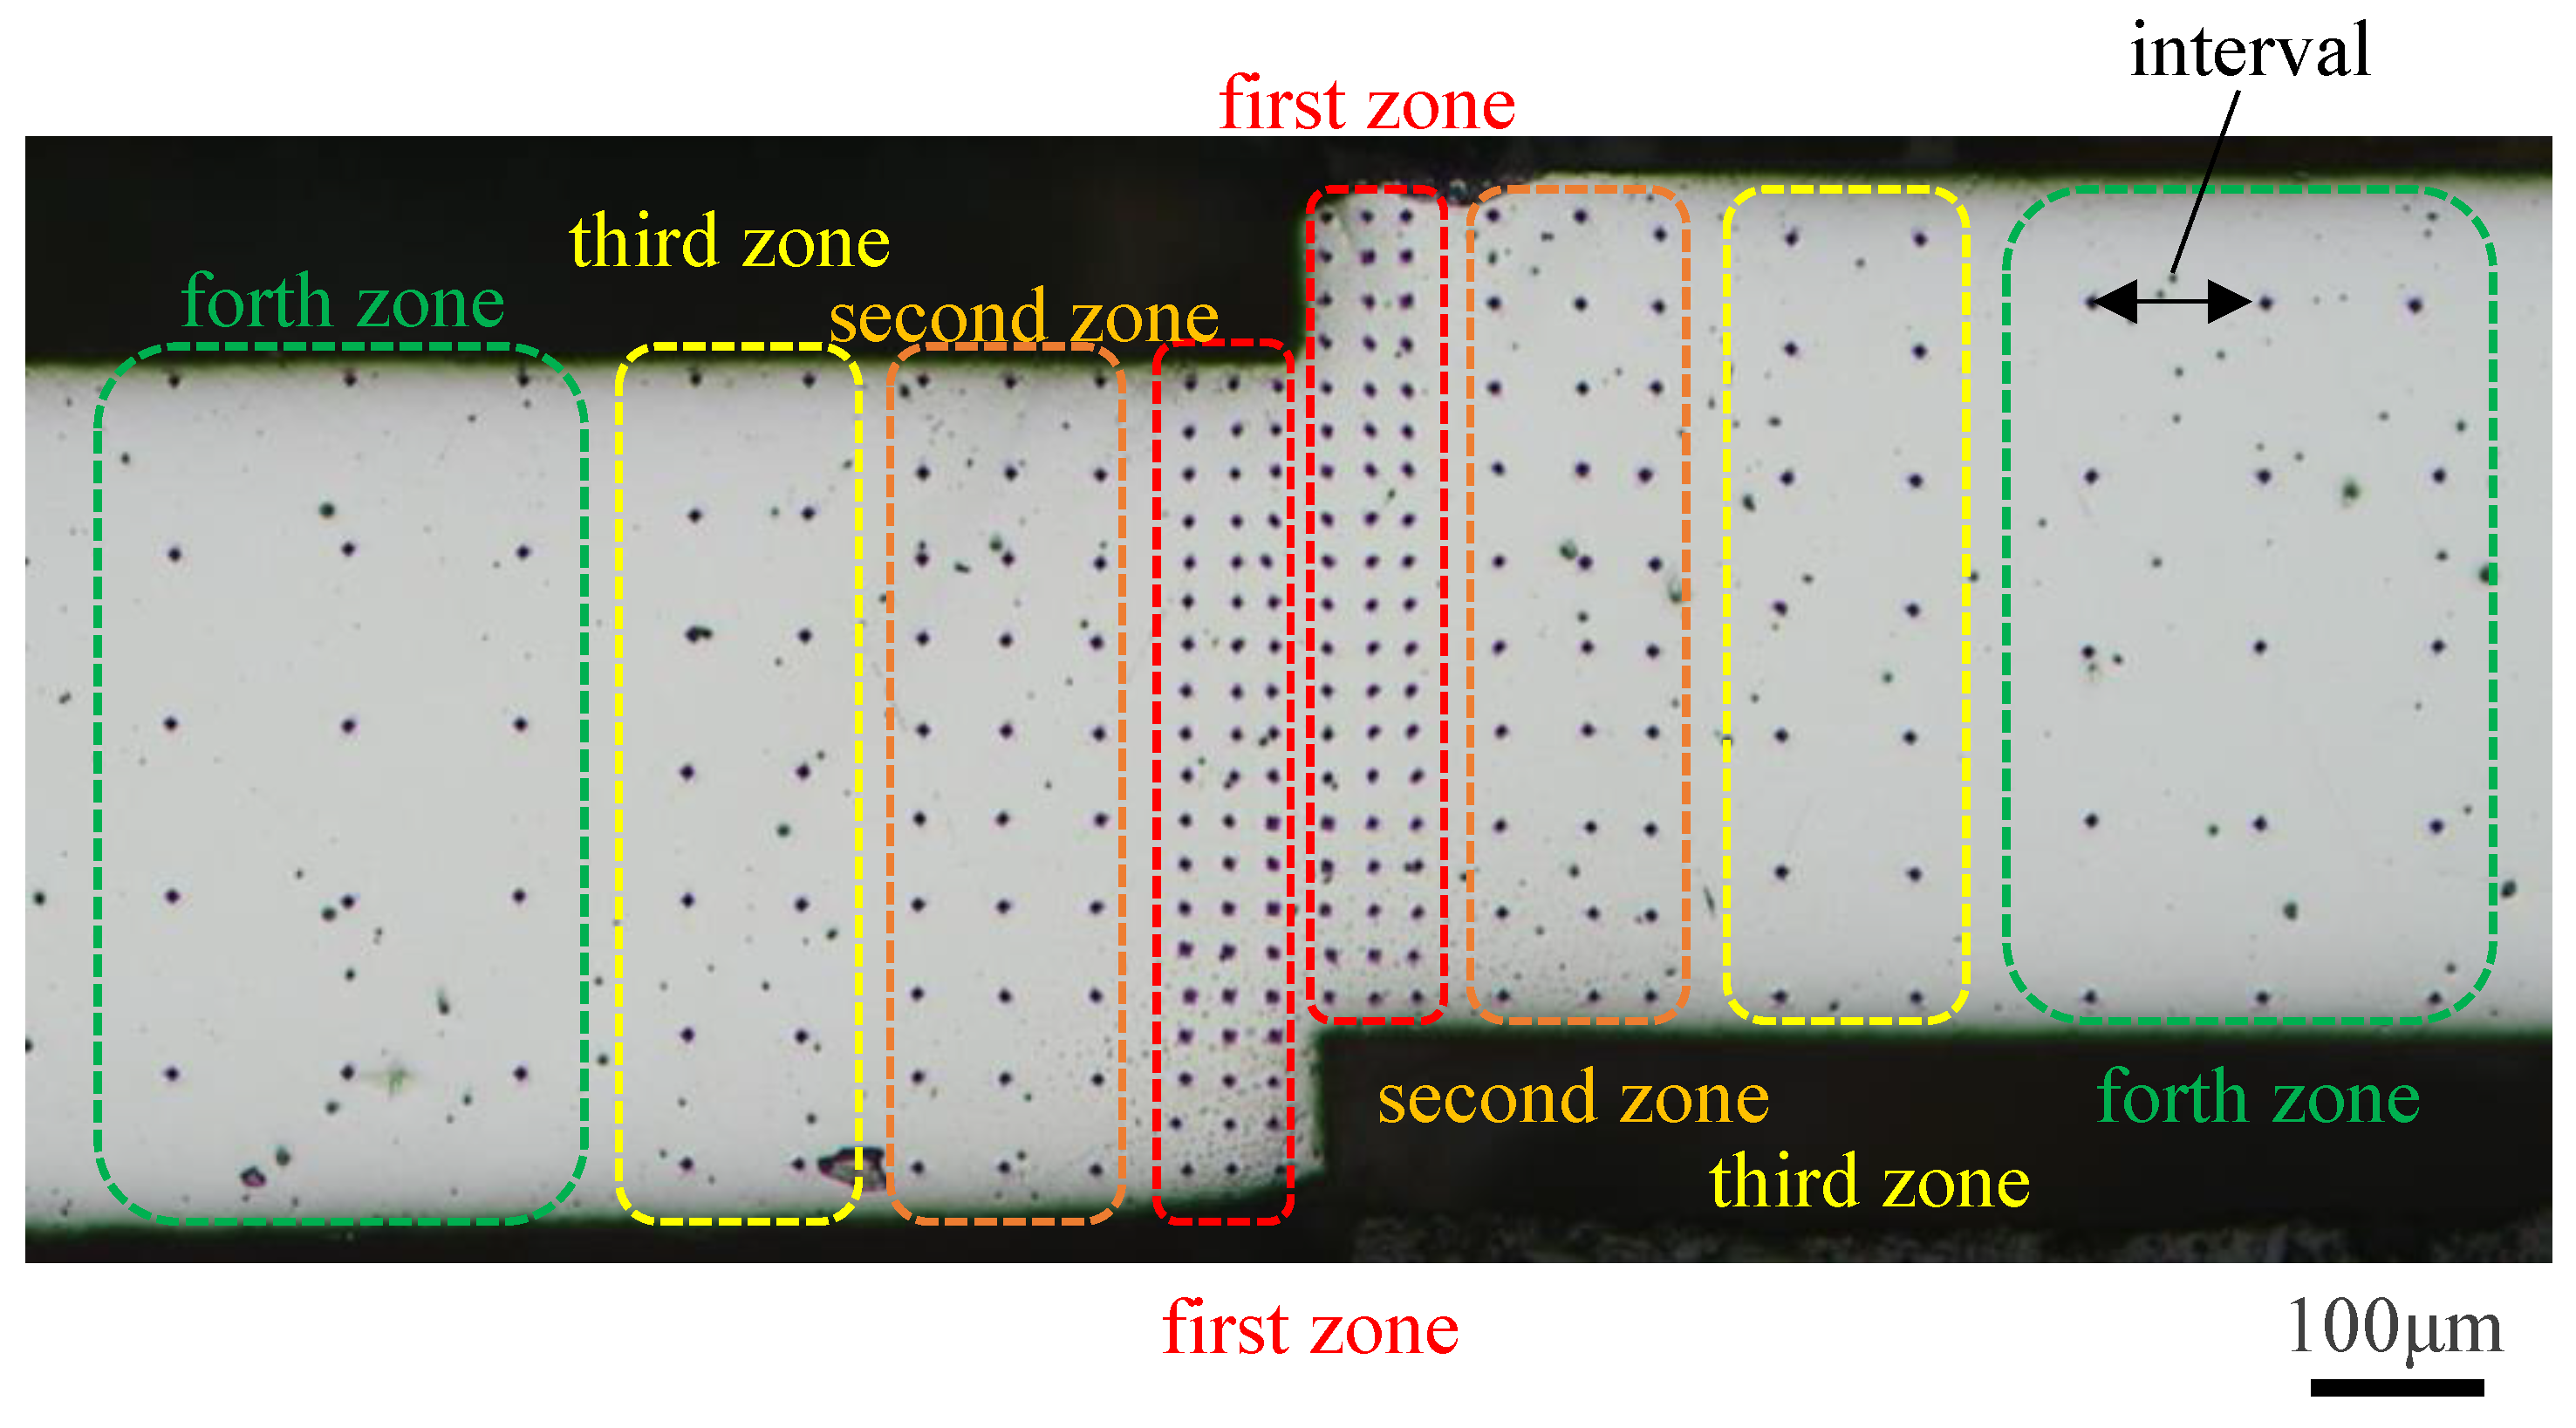
Figure 4.
Discretization of the work-hardening area, induced in the right-hand side of sheared steel sheet. The m-th square element has m-th measuring point of hardness.
Figure 4.
Discretization of the work-hardening area, induced in the right-hand side of sheared steel sheet. The m-th square element has m-th measuring point of hardness.
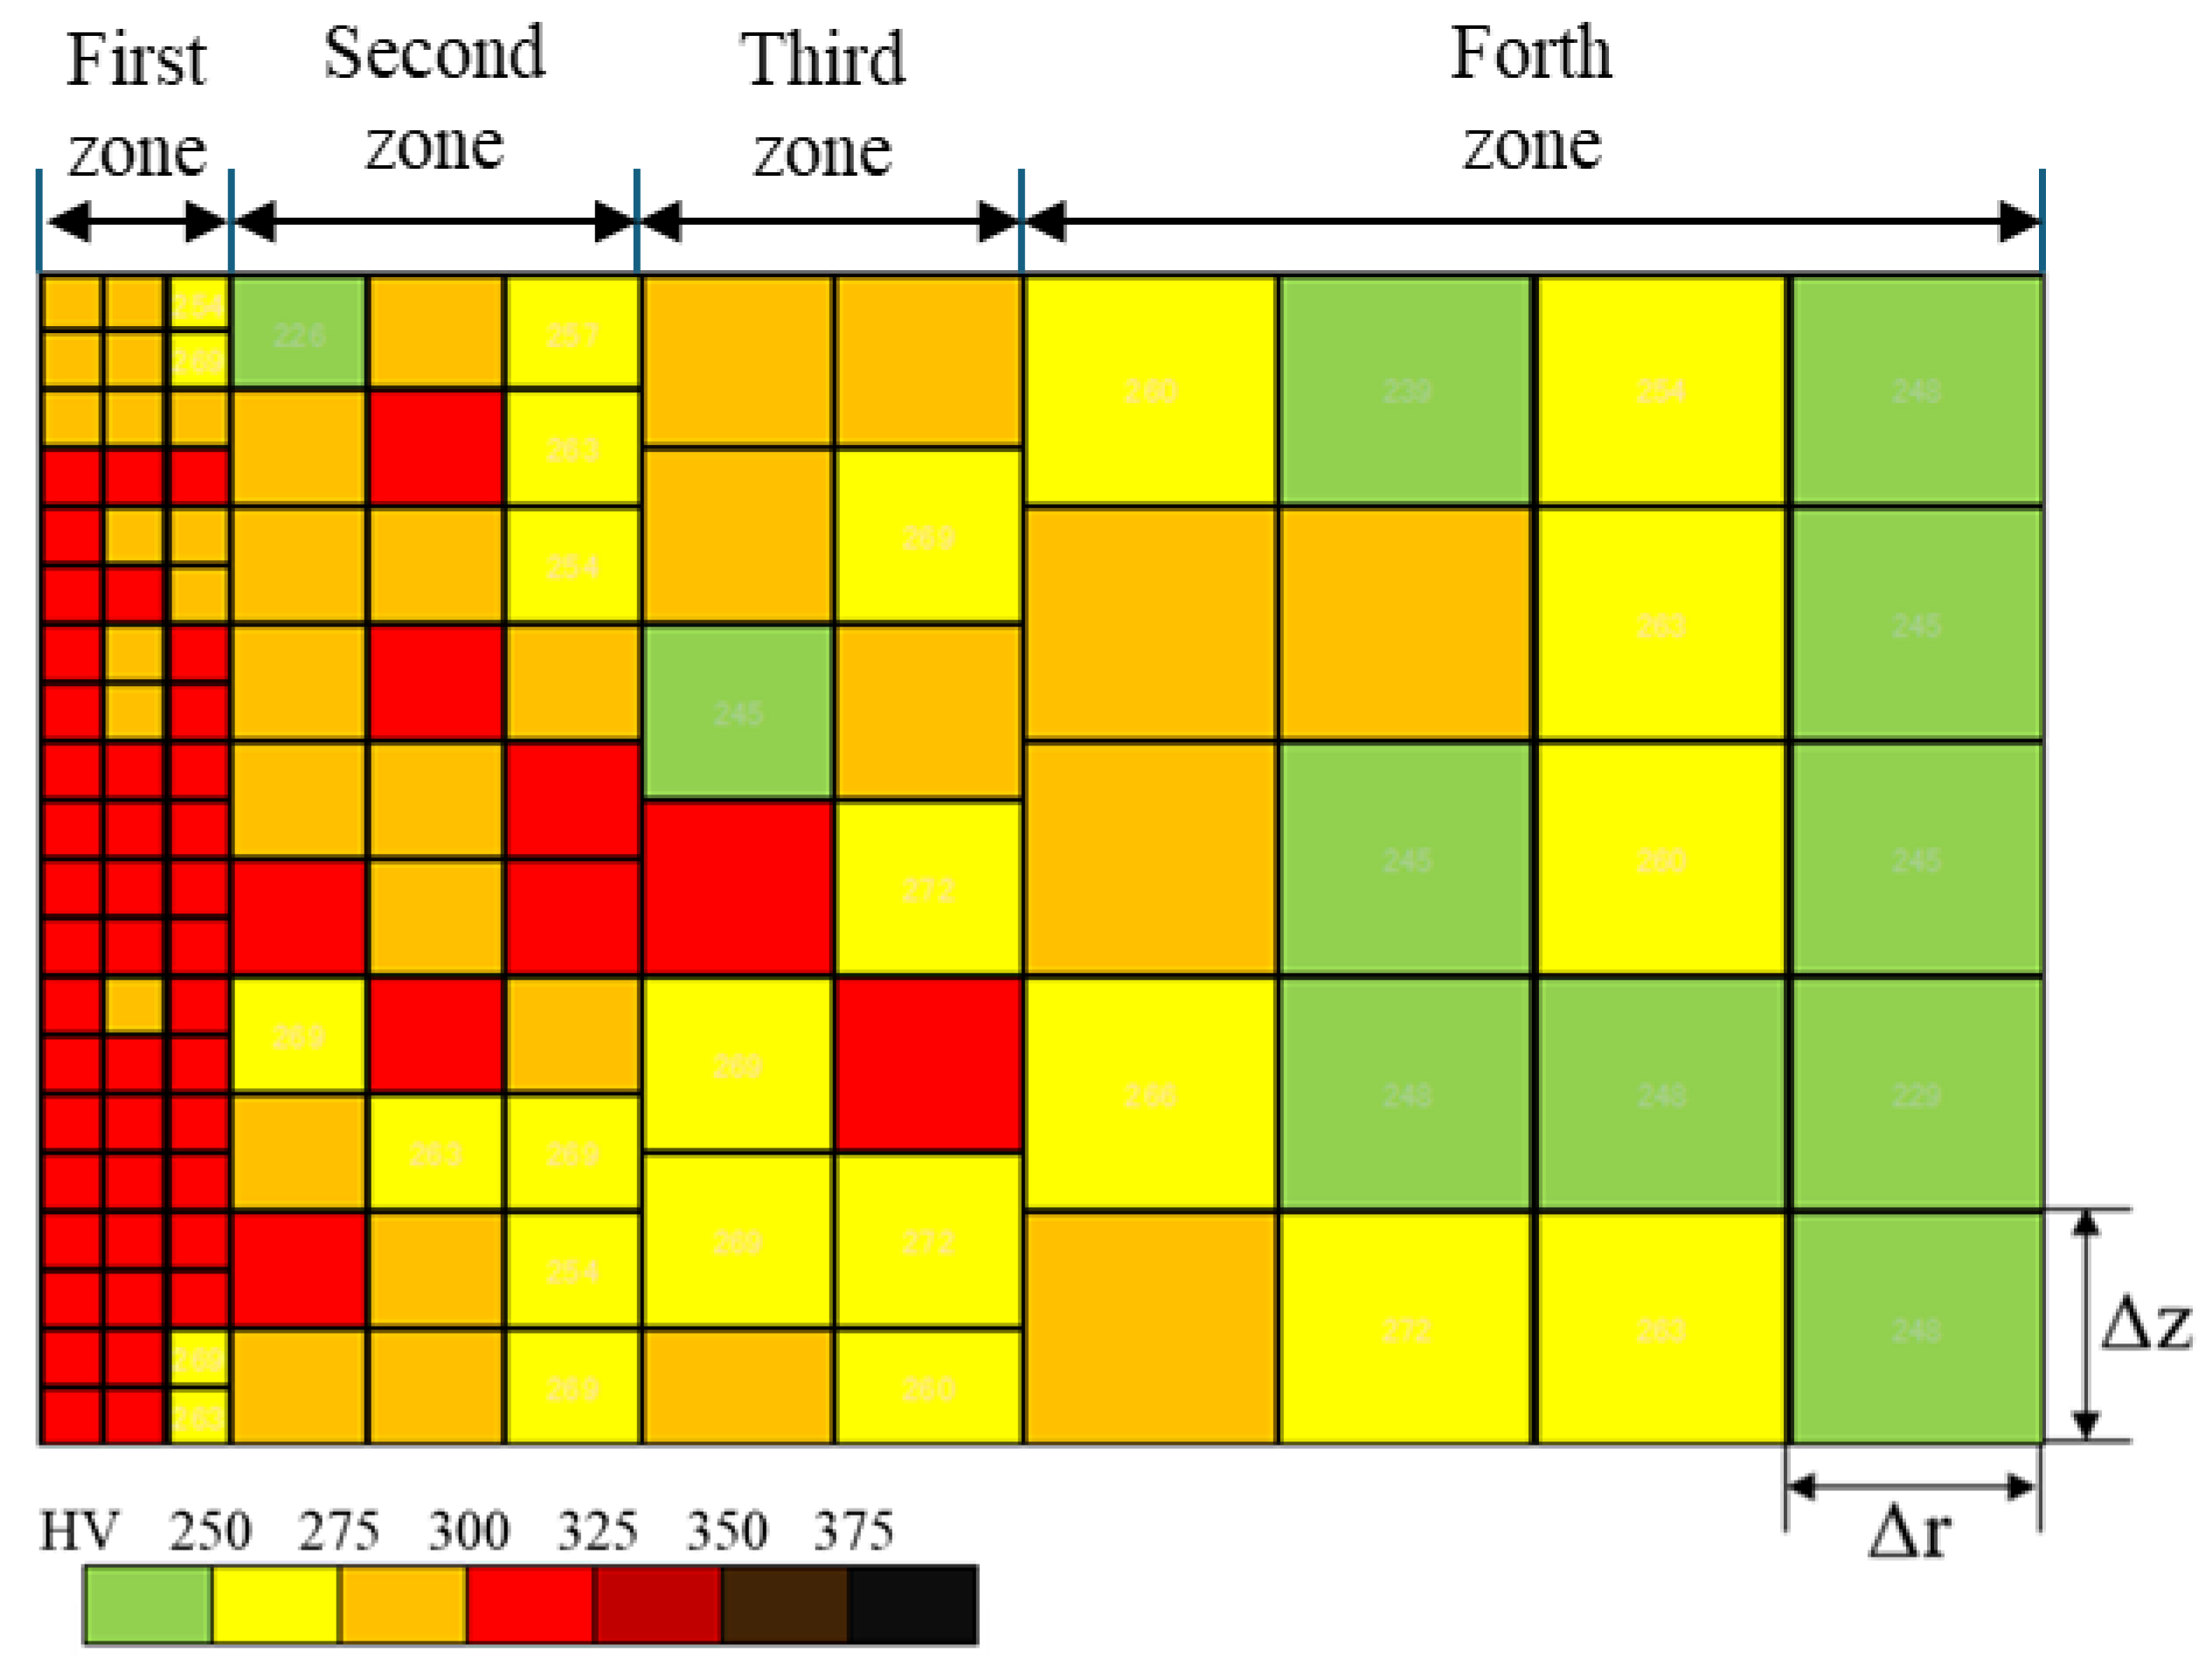
Figure 5.
Comparison of sheared surface conditions among four punches at the clearance of CL25 μm.
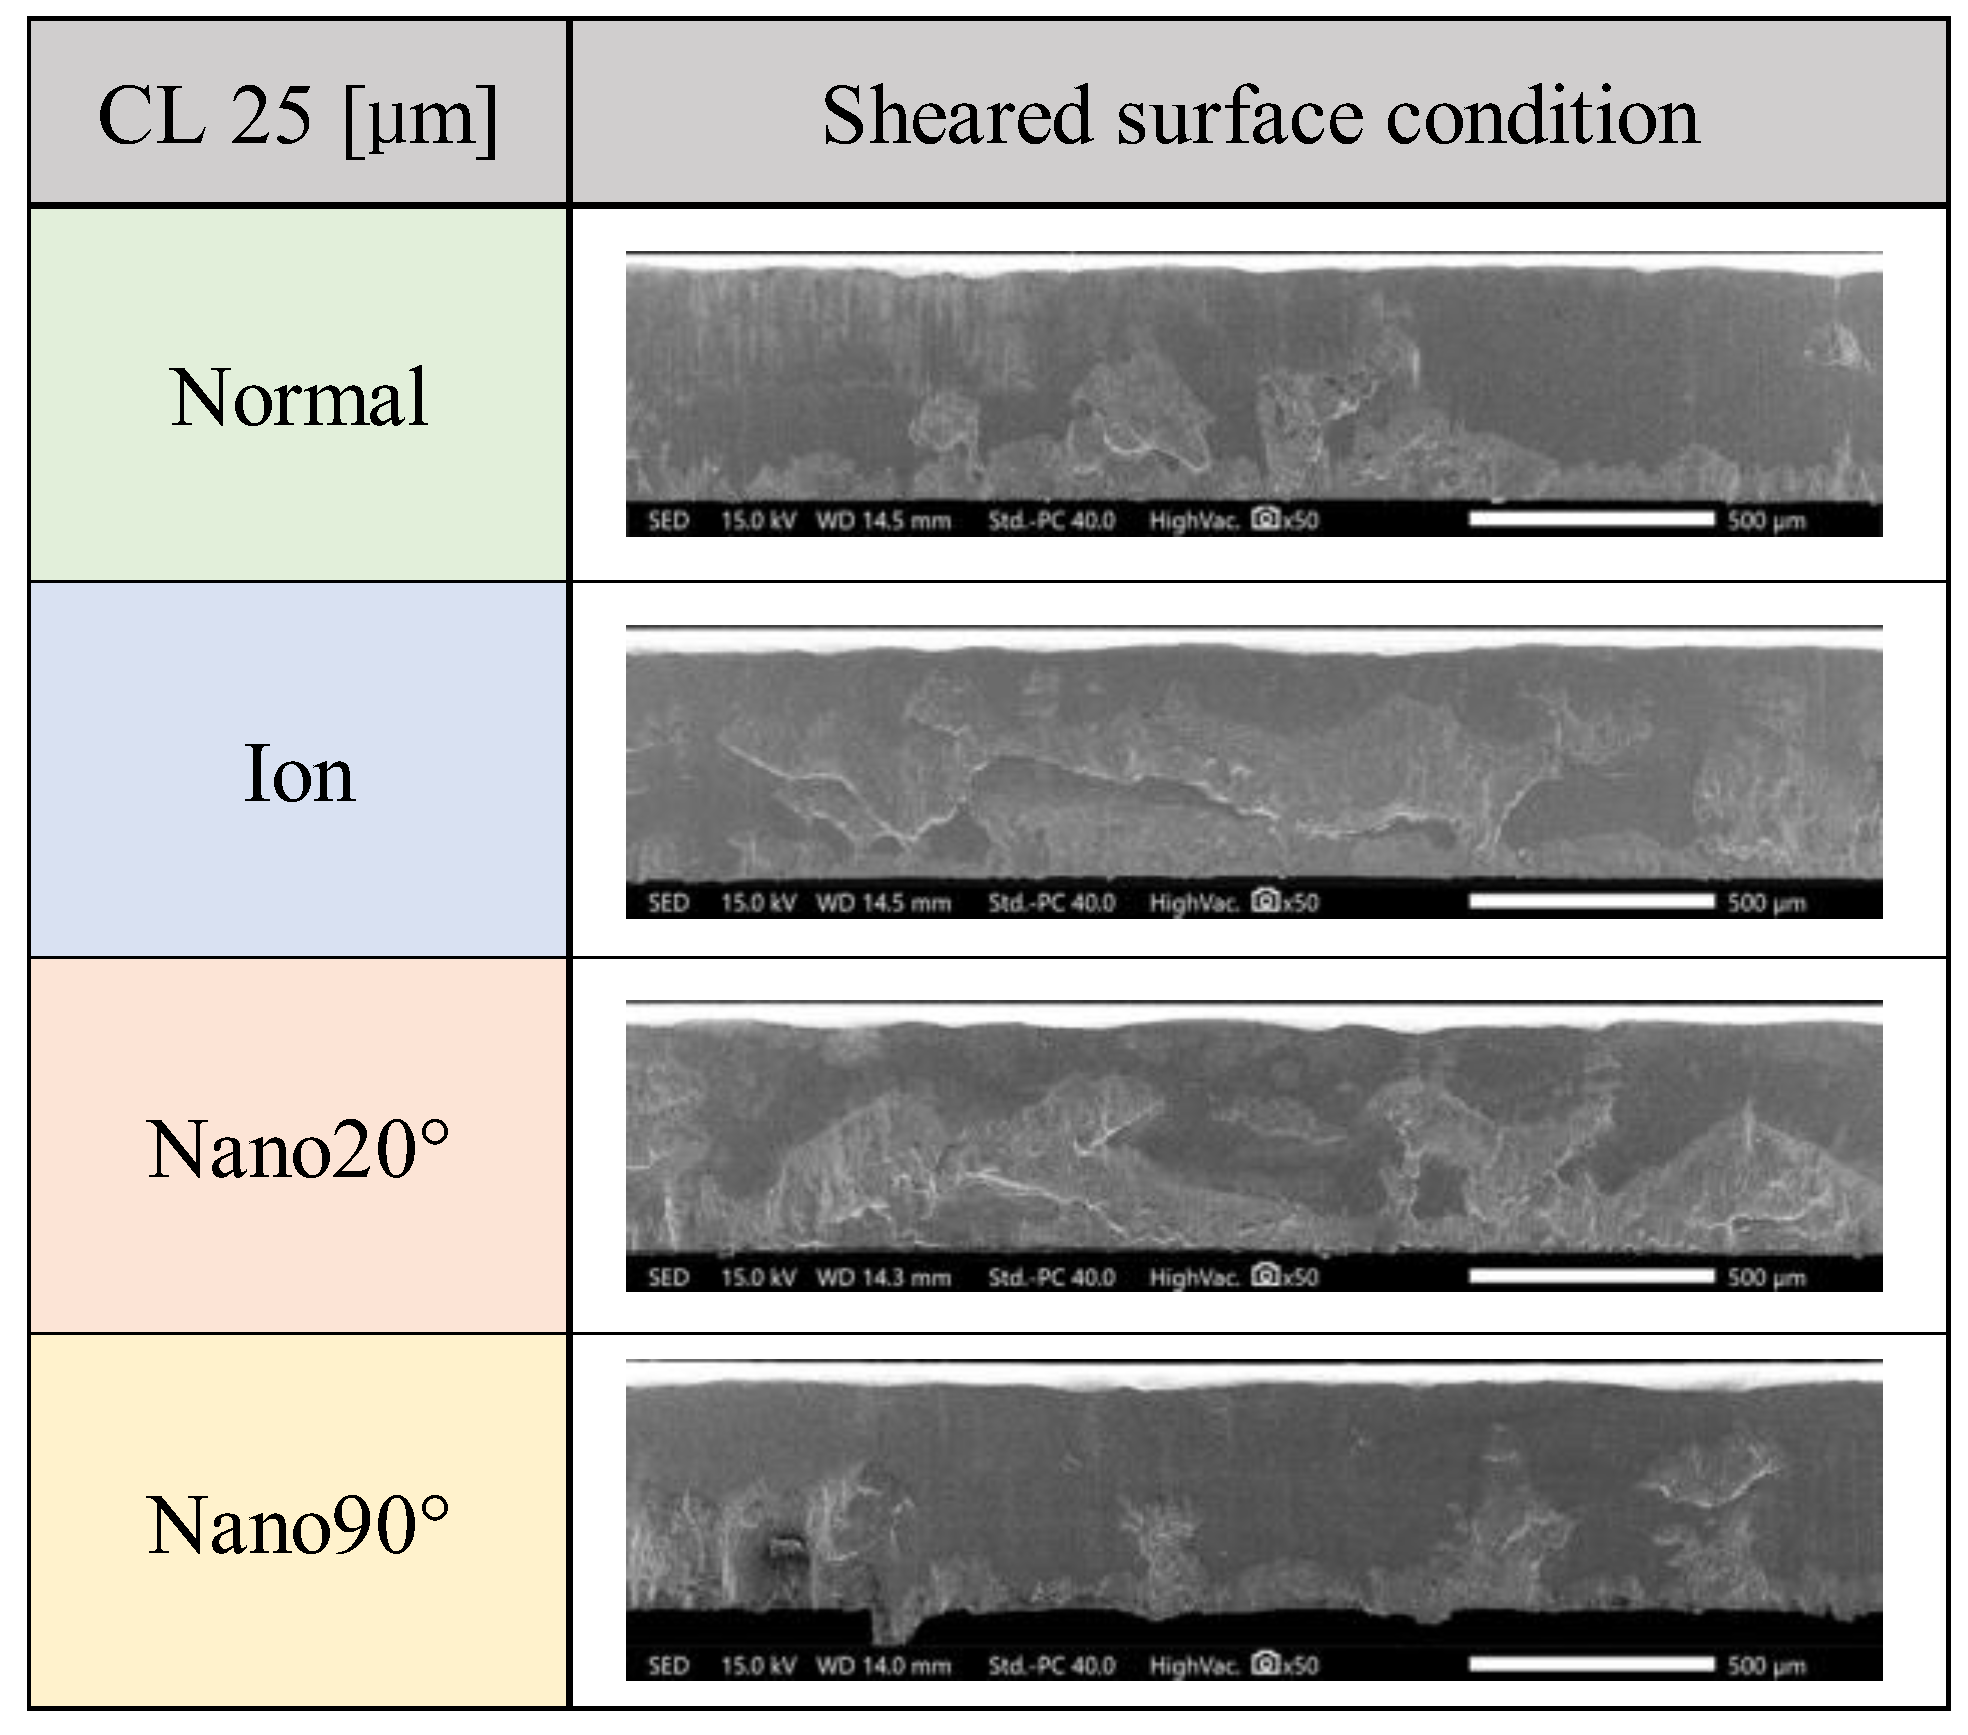
Figure 6.
Comparison of sheared surface conditions among four punches at the clearance of CL5 μm.
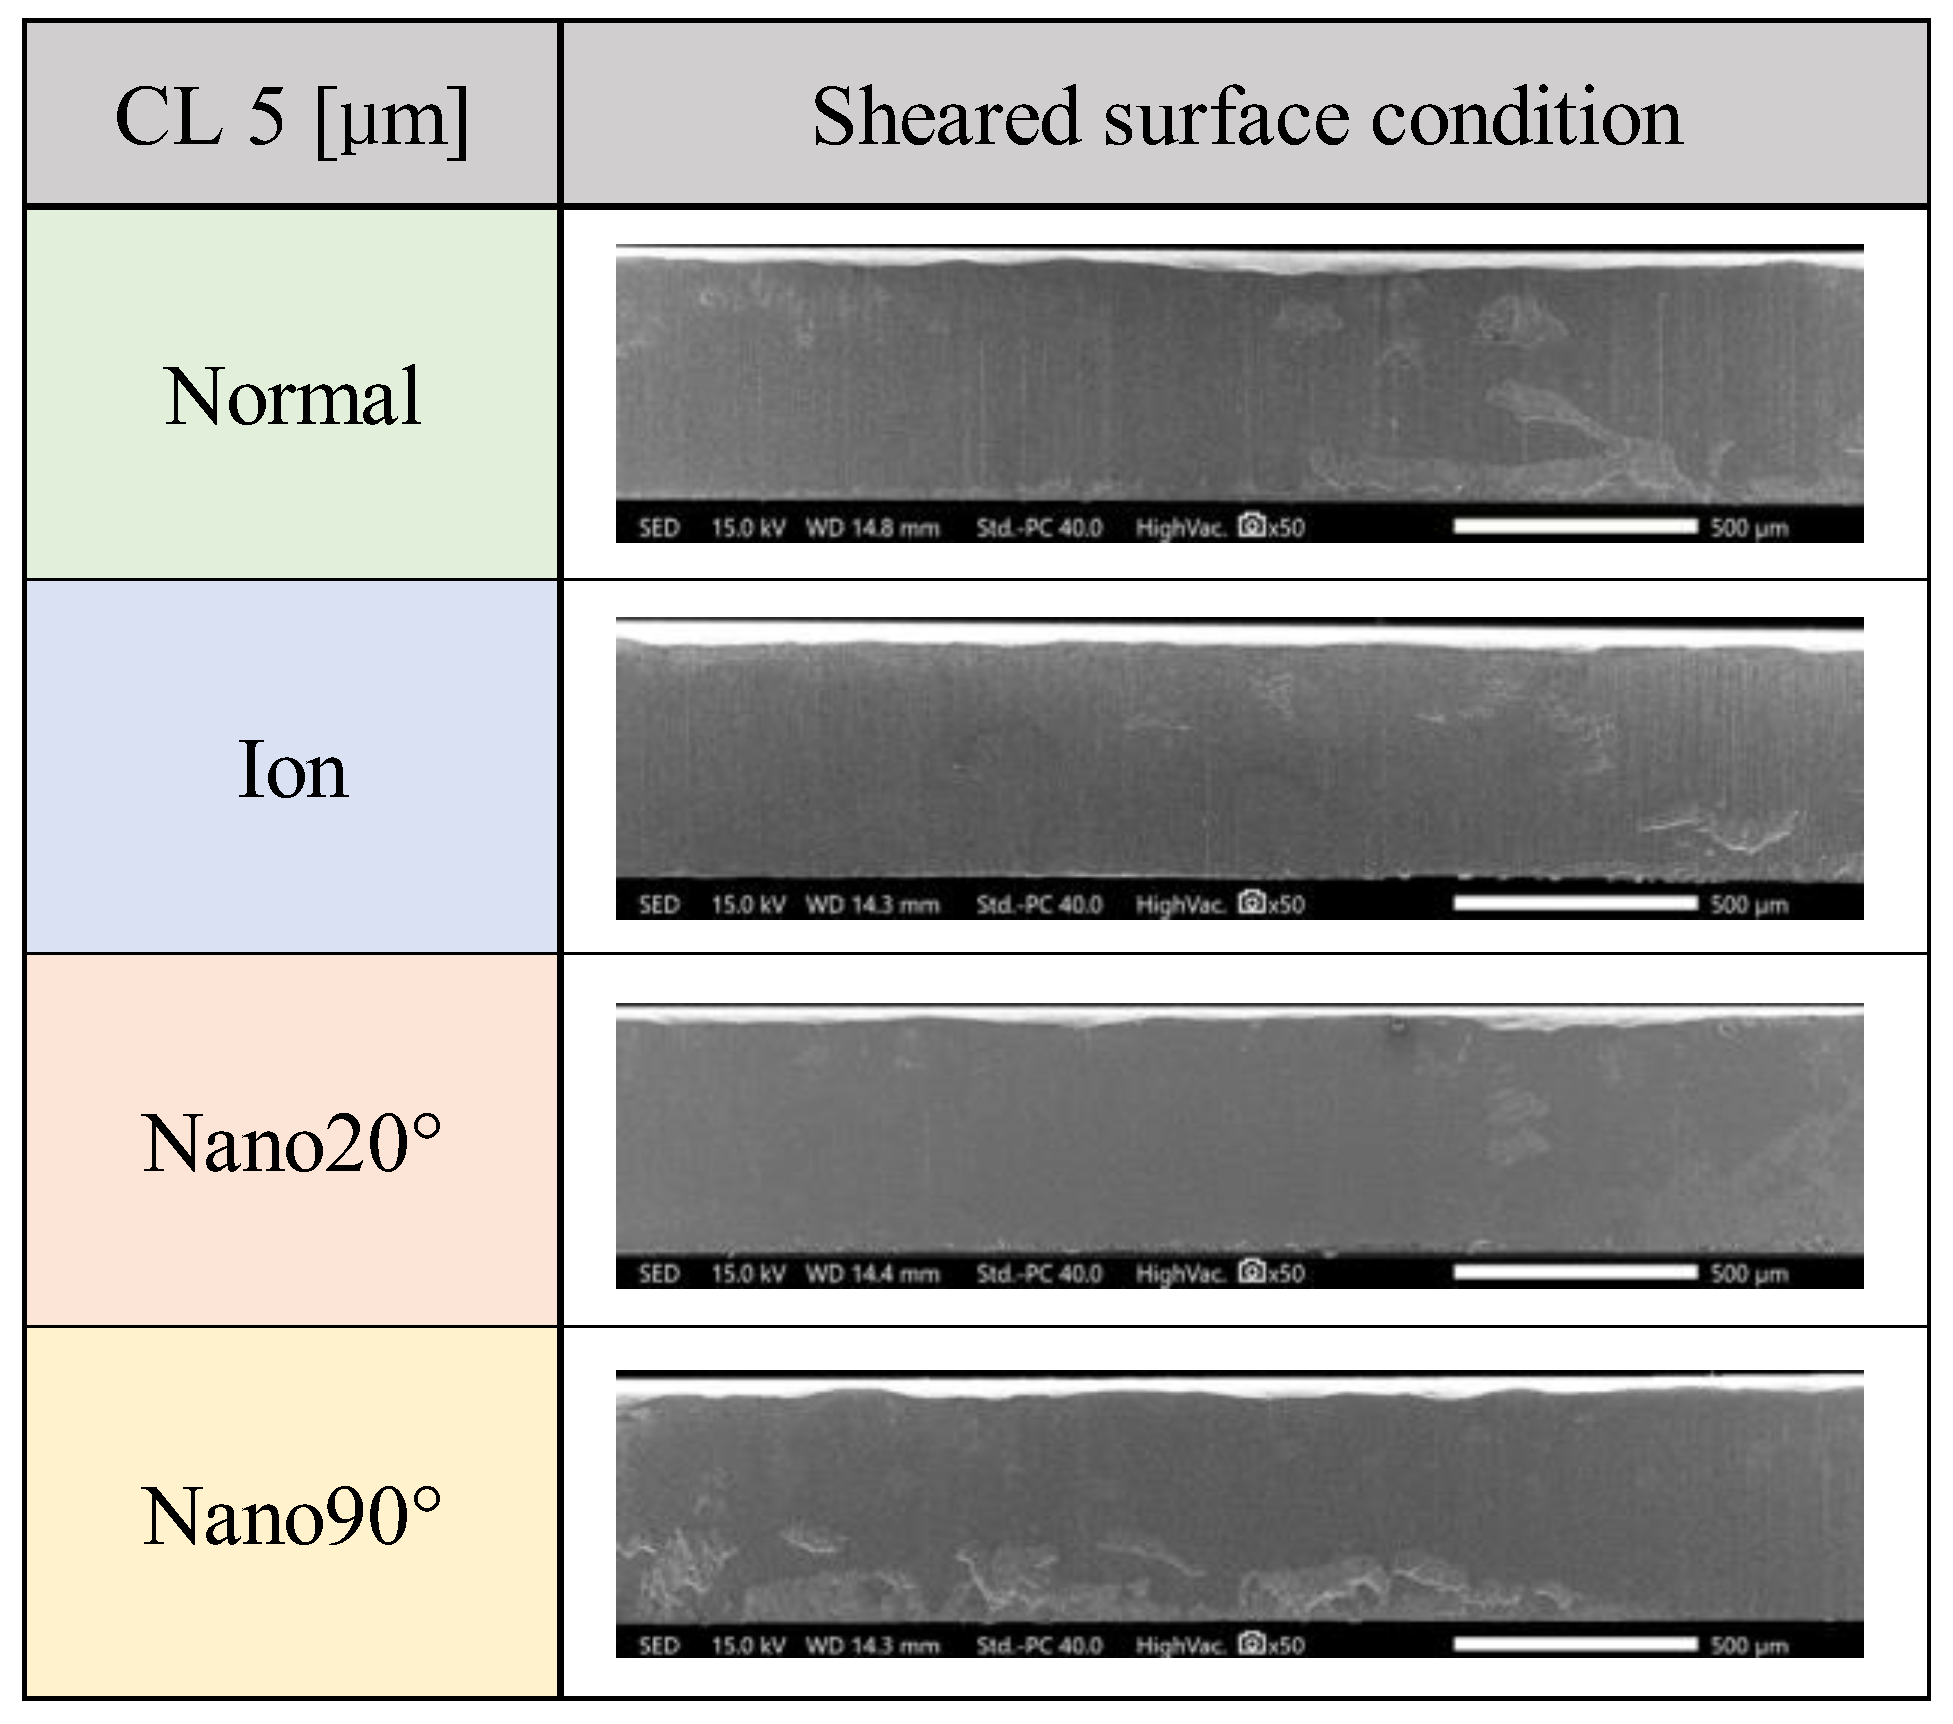
Figure 7.
Comparison of sheared surface conditions among four punches at the clearance of CL2.5 μm.
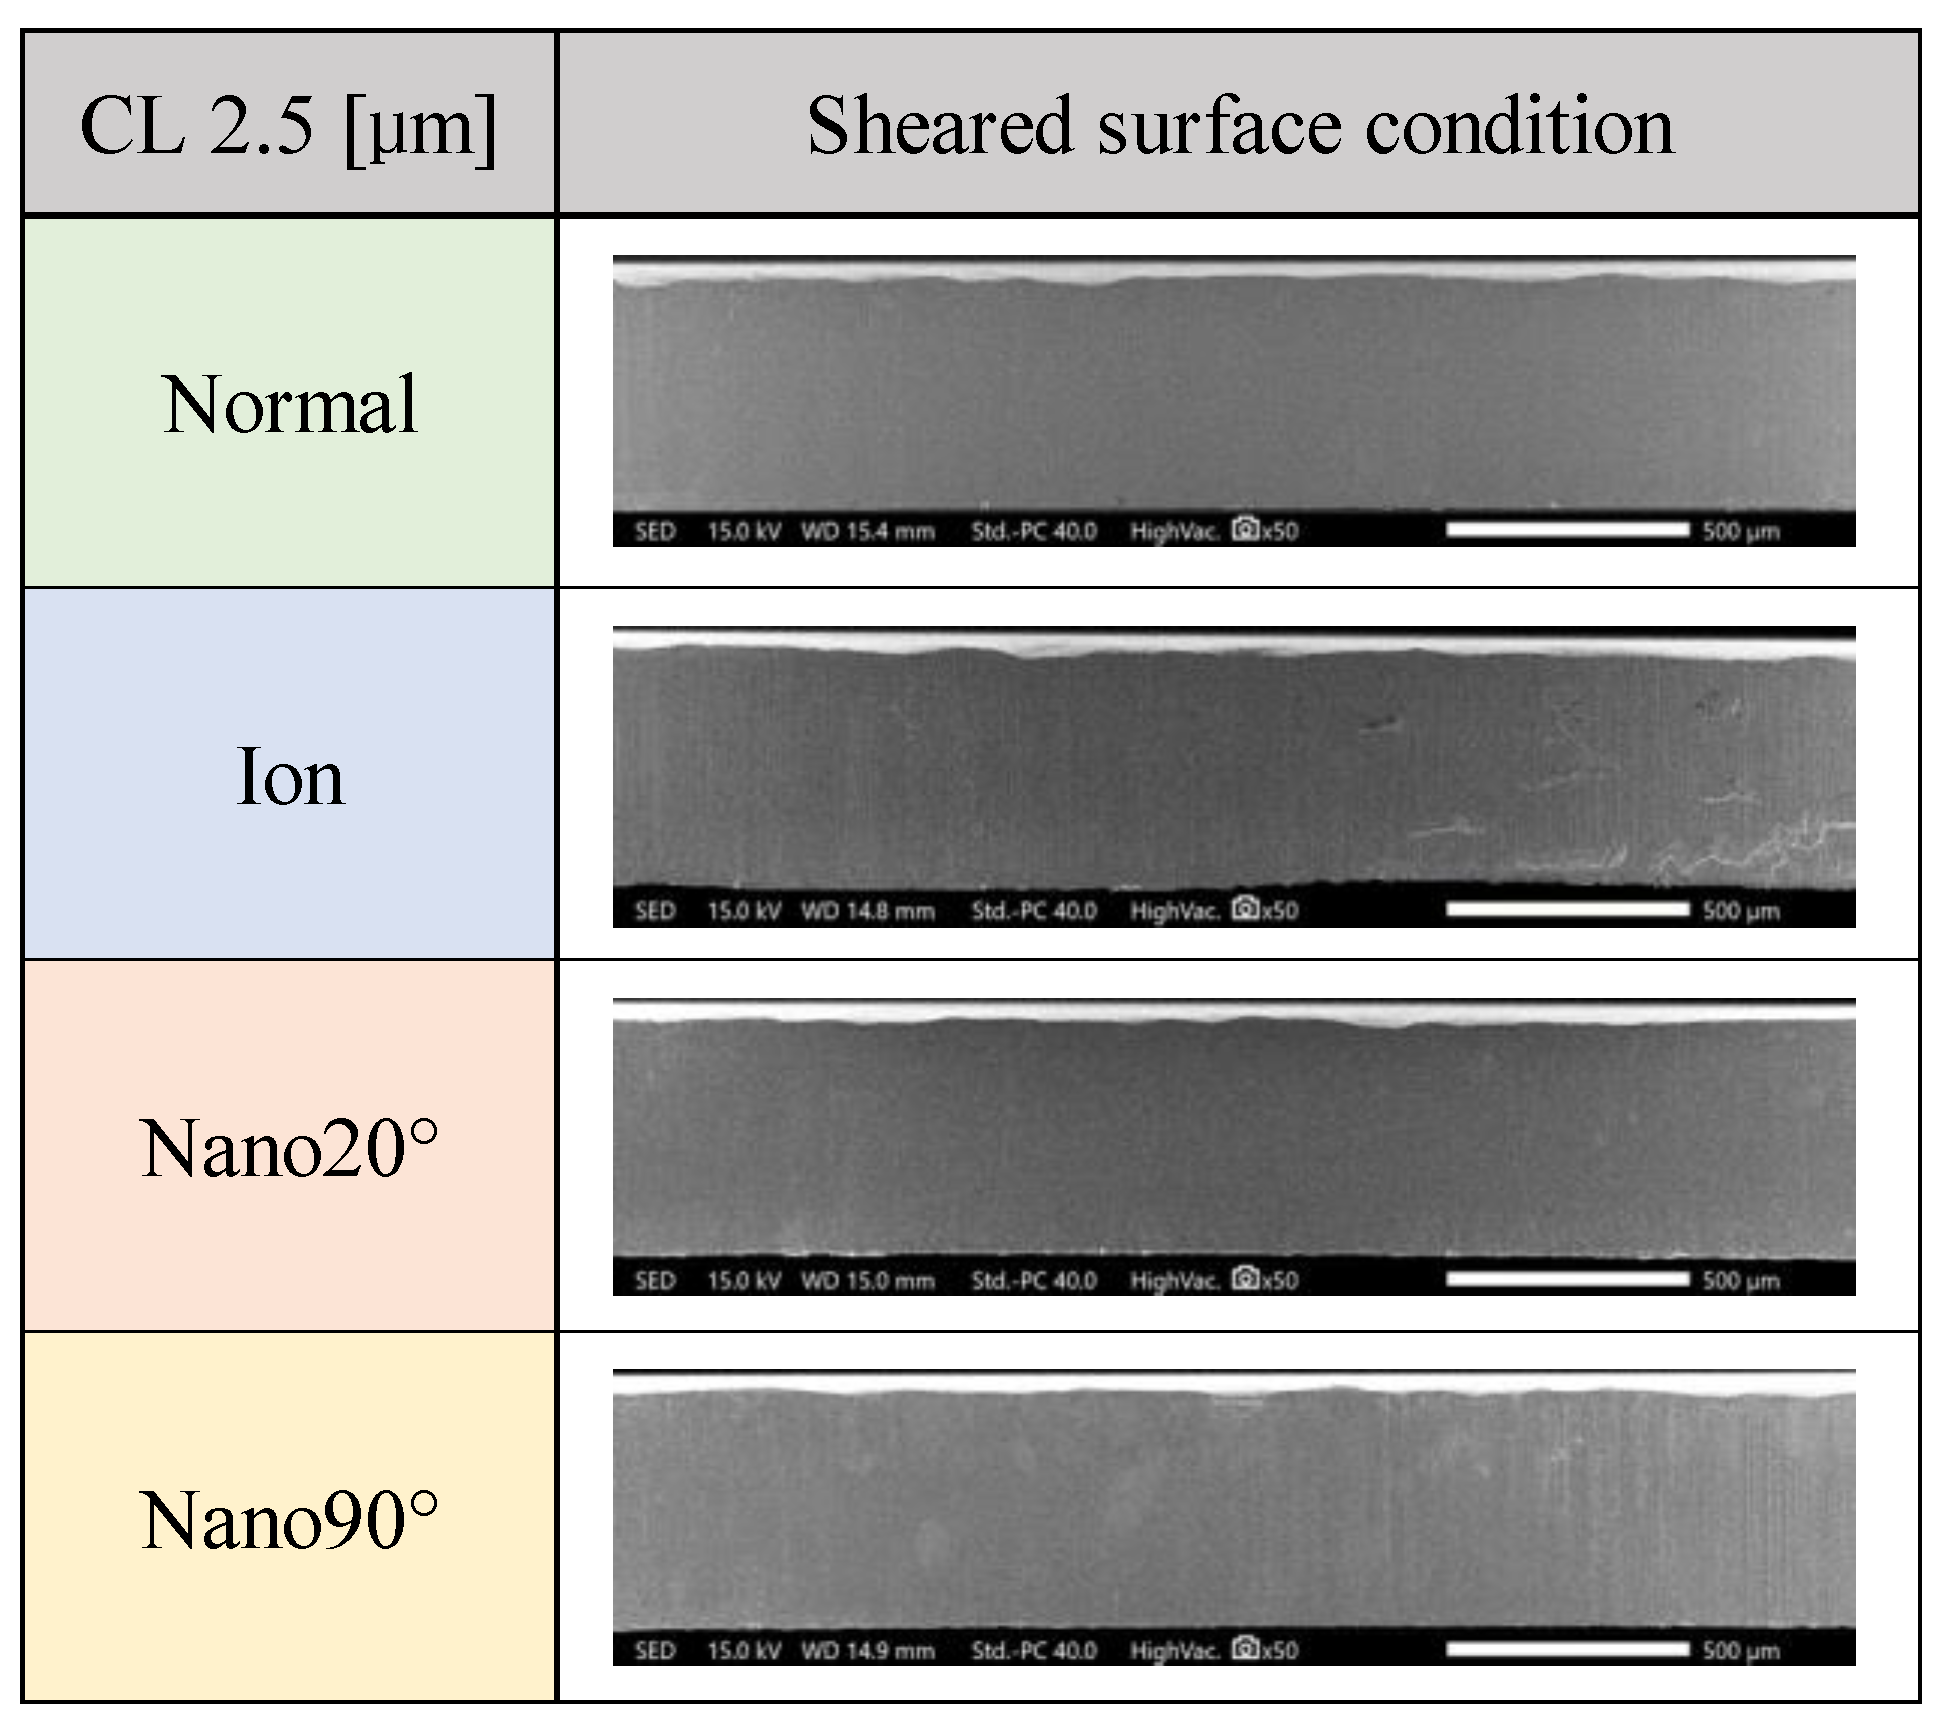
Figure 8.
Comparison of the fractured and burnished surface area ratios with the shear droop ratio among four punches at CL25 μm, CL5 μm and CL2.5 μm.
Figure 8.
Comparison of the fractured and burnished surface area ratios with the shear droop ratio among four punches at CL25 μm, CL5 μm and CL2.5 μm.
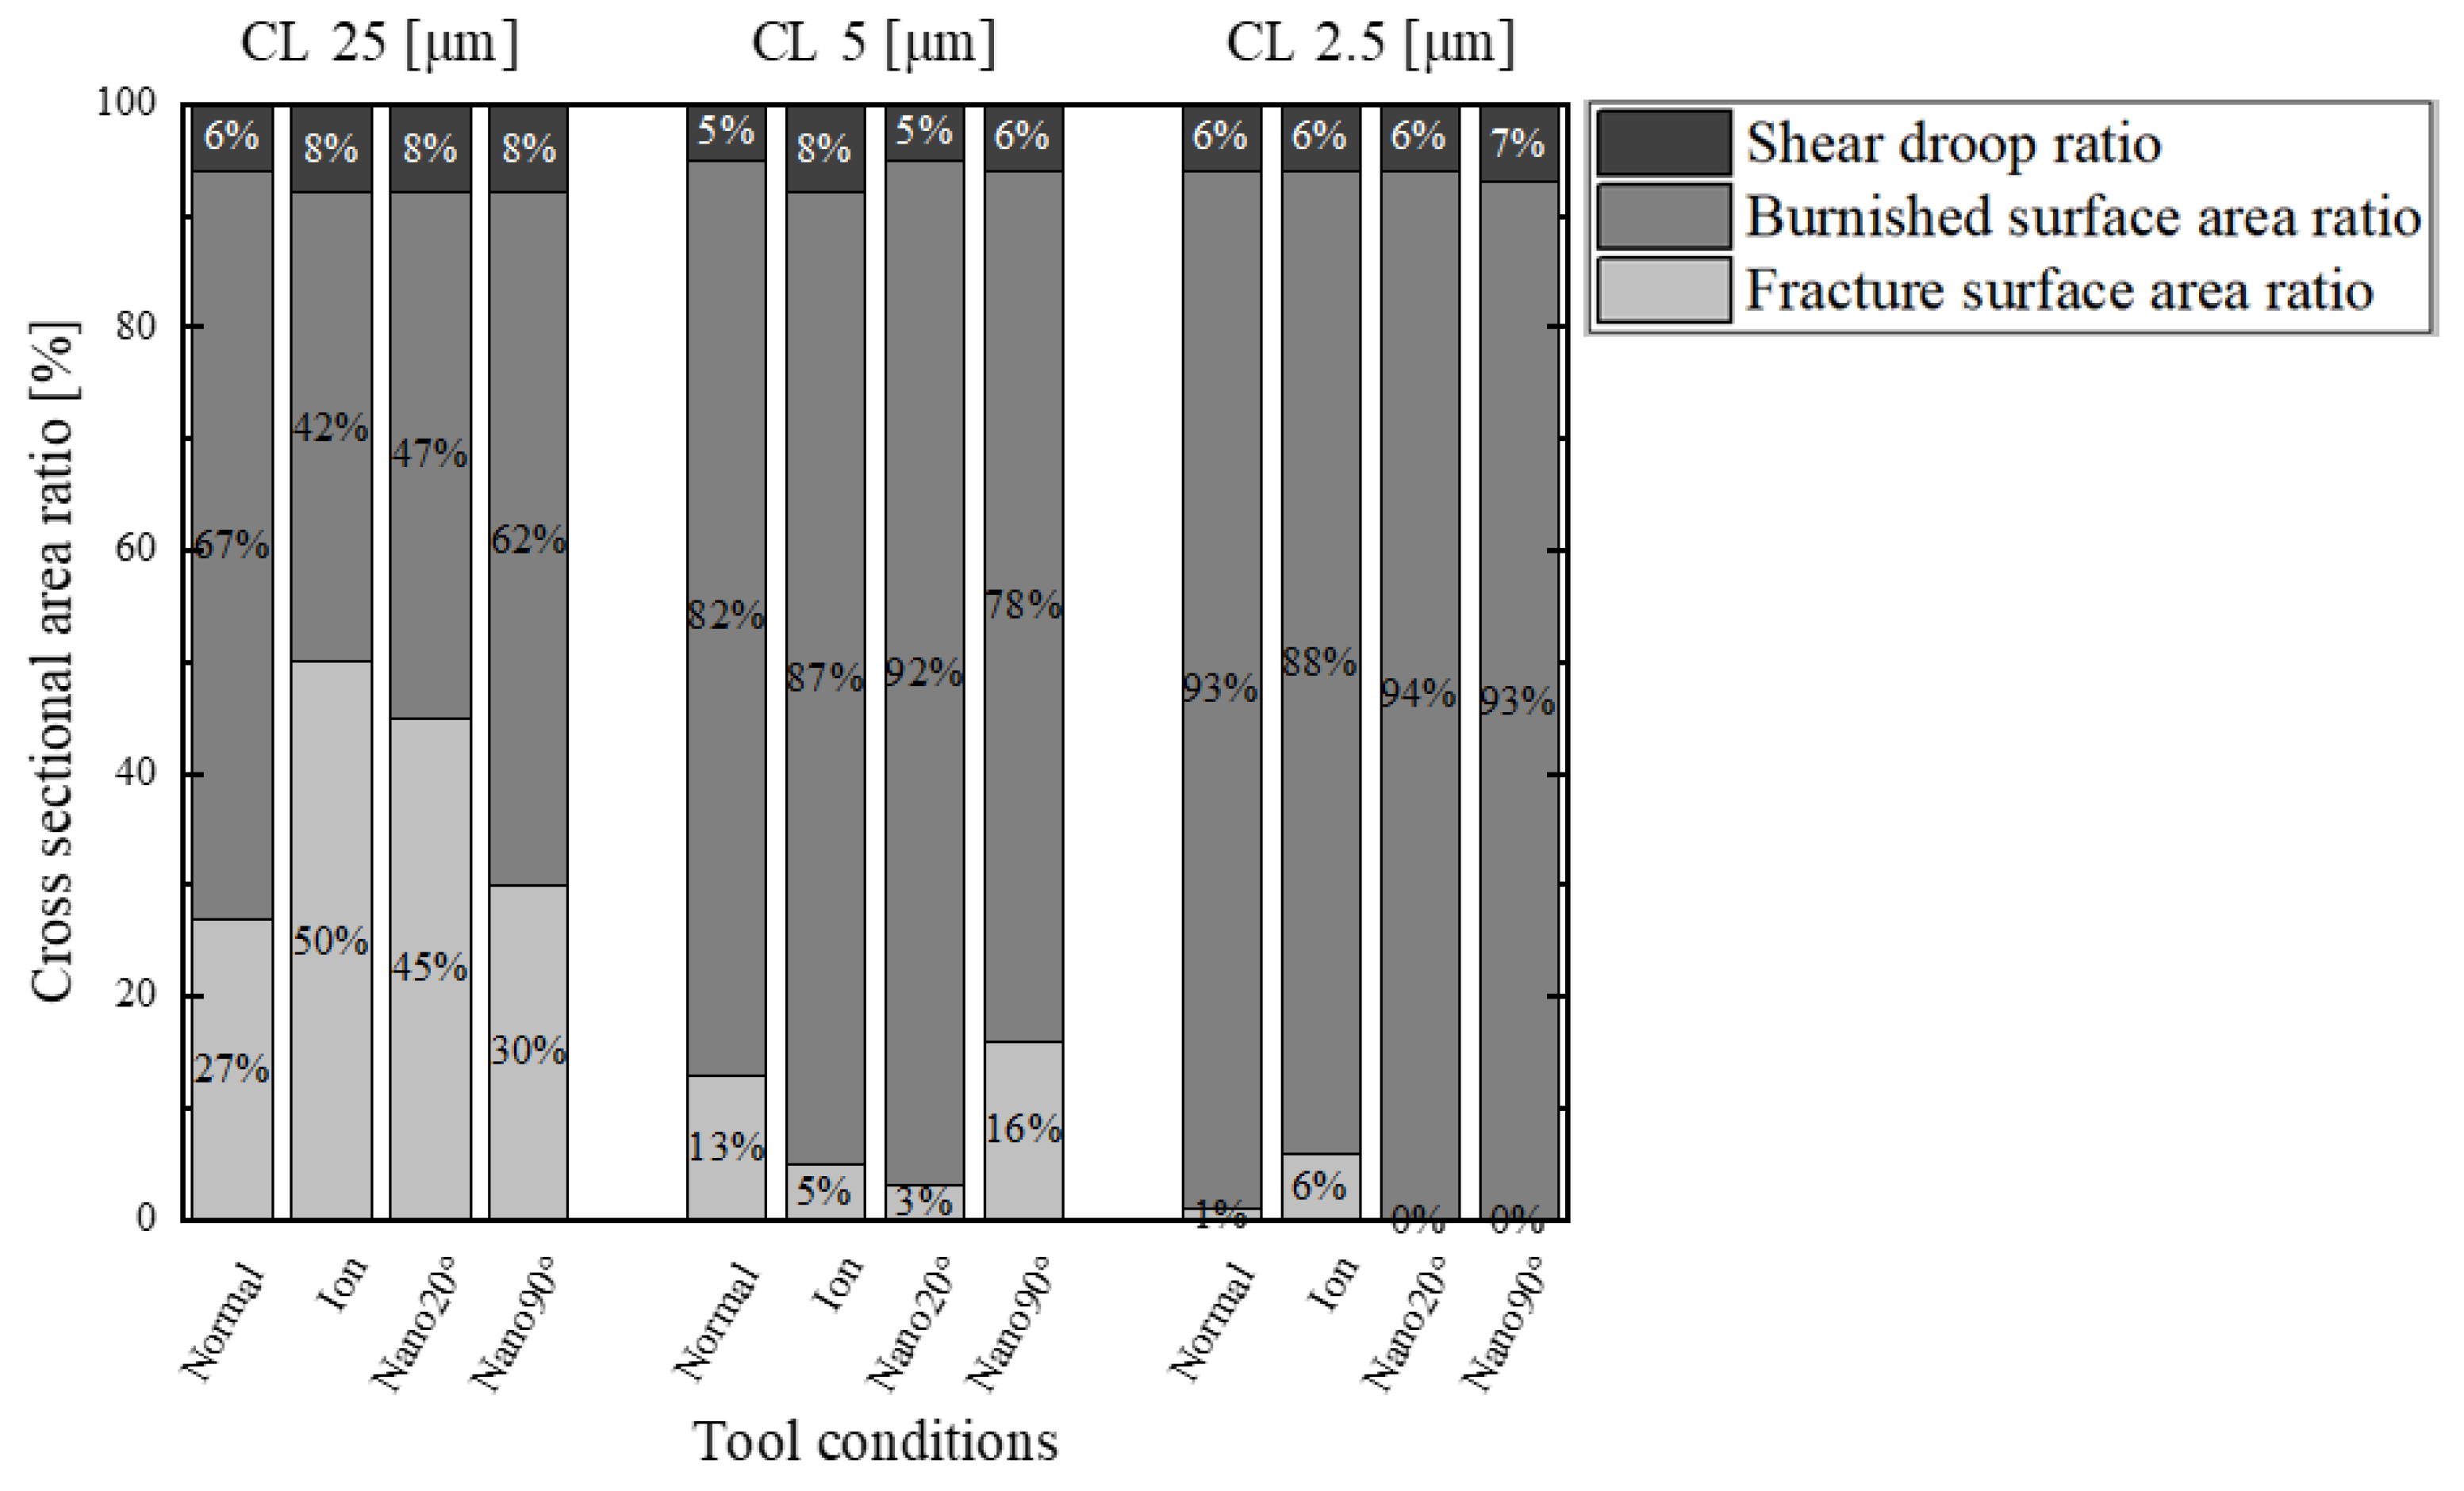
Figure 9.
Comparison of work hardening zones for each clearance of CL25 μm, CL5 μm and CL2.5 μm among four punches.
Figure 9.
Comparison of work hardening zones for each clearance of CL25 μm, CL5 μm and CL2.5 μm among four punches.
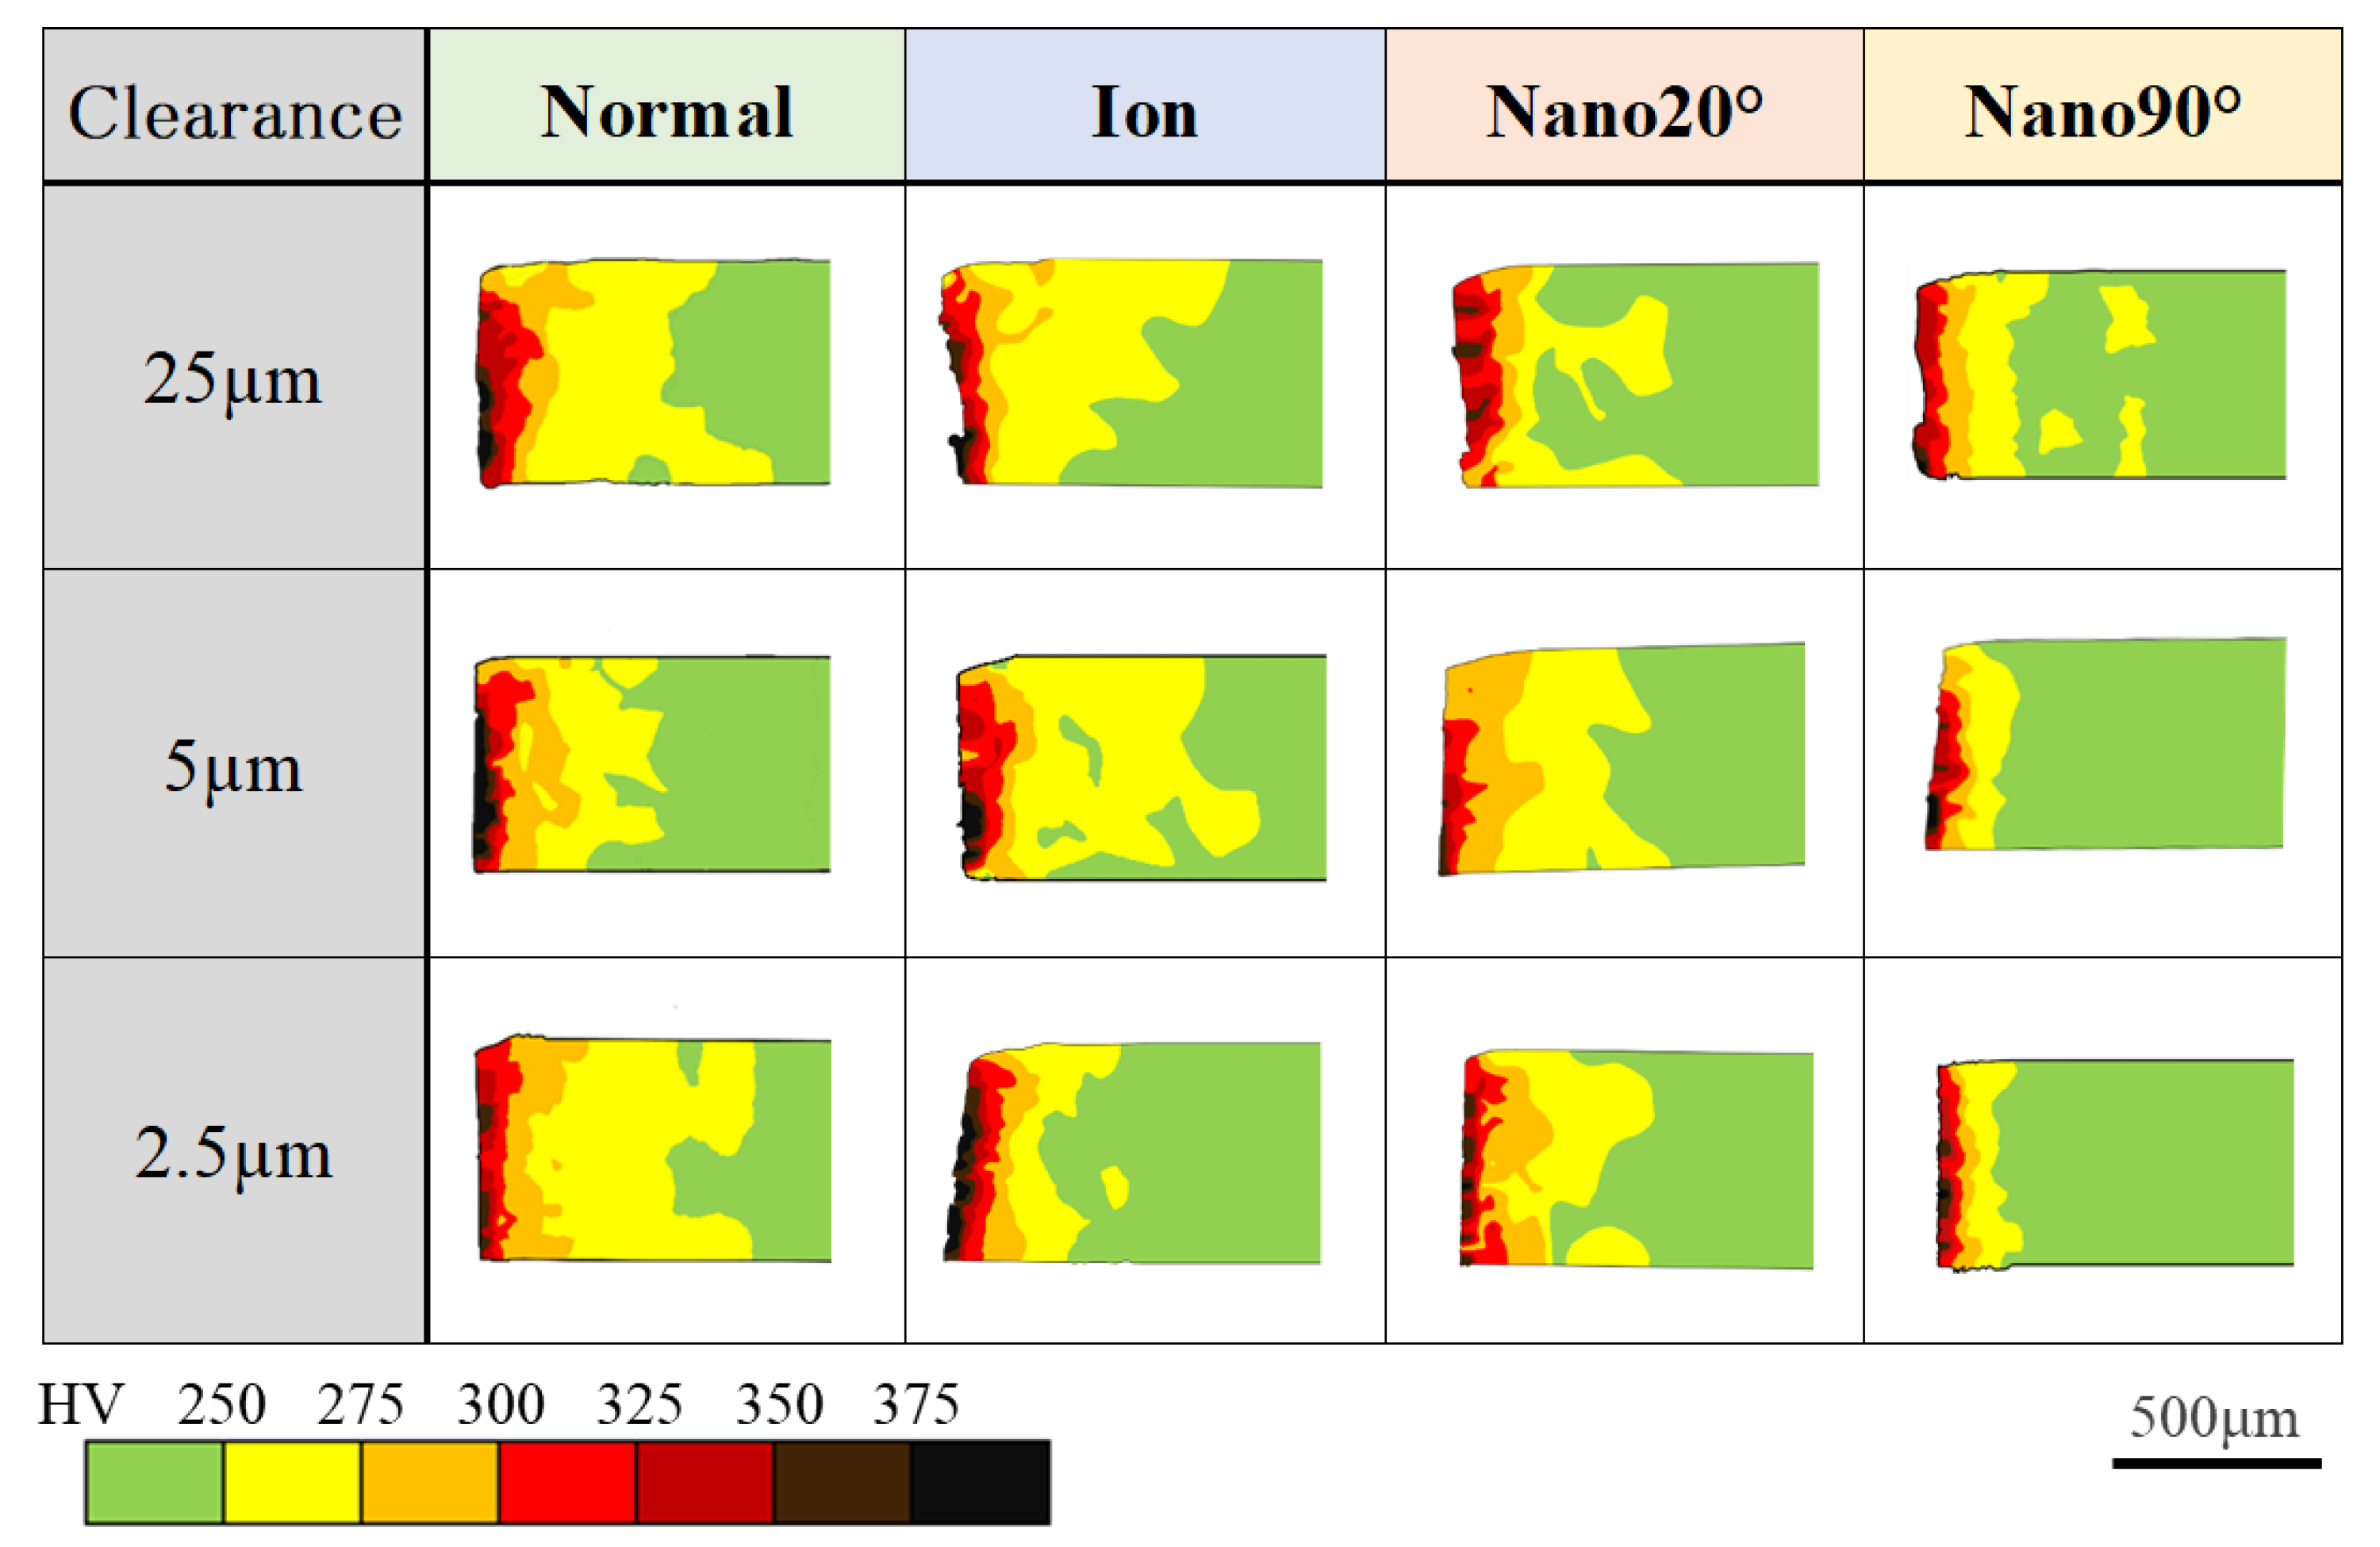
Figure 10.
Contribution of six work hardening zone and elastic zone ratios on the whole cross-sectional area at each clearance among four punching conditions.
Figure 10.
Contribution of six work hardening zone and elastic zone ratios on the whole cross-sectional area at each clearance among four punching conditions.
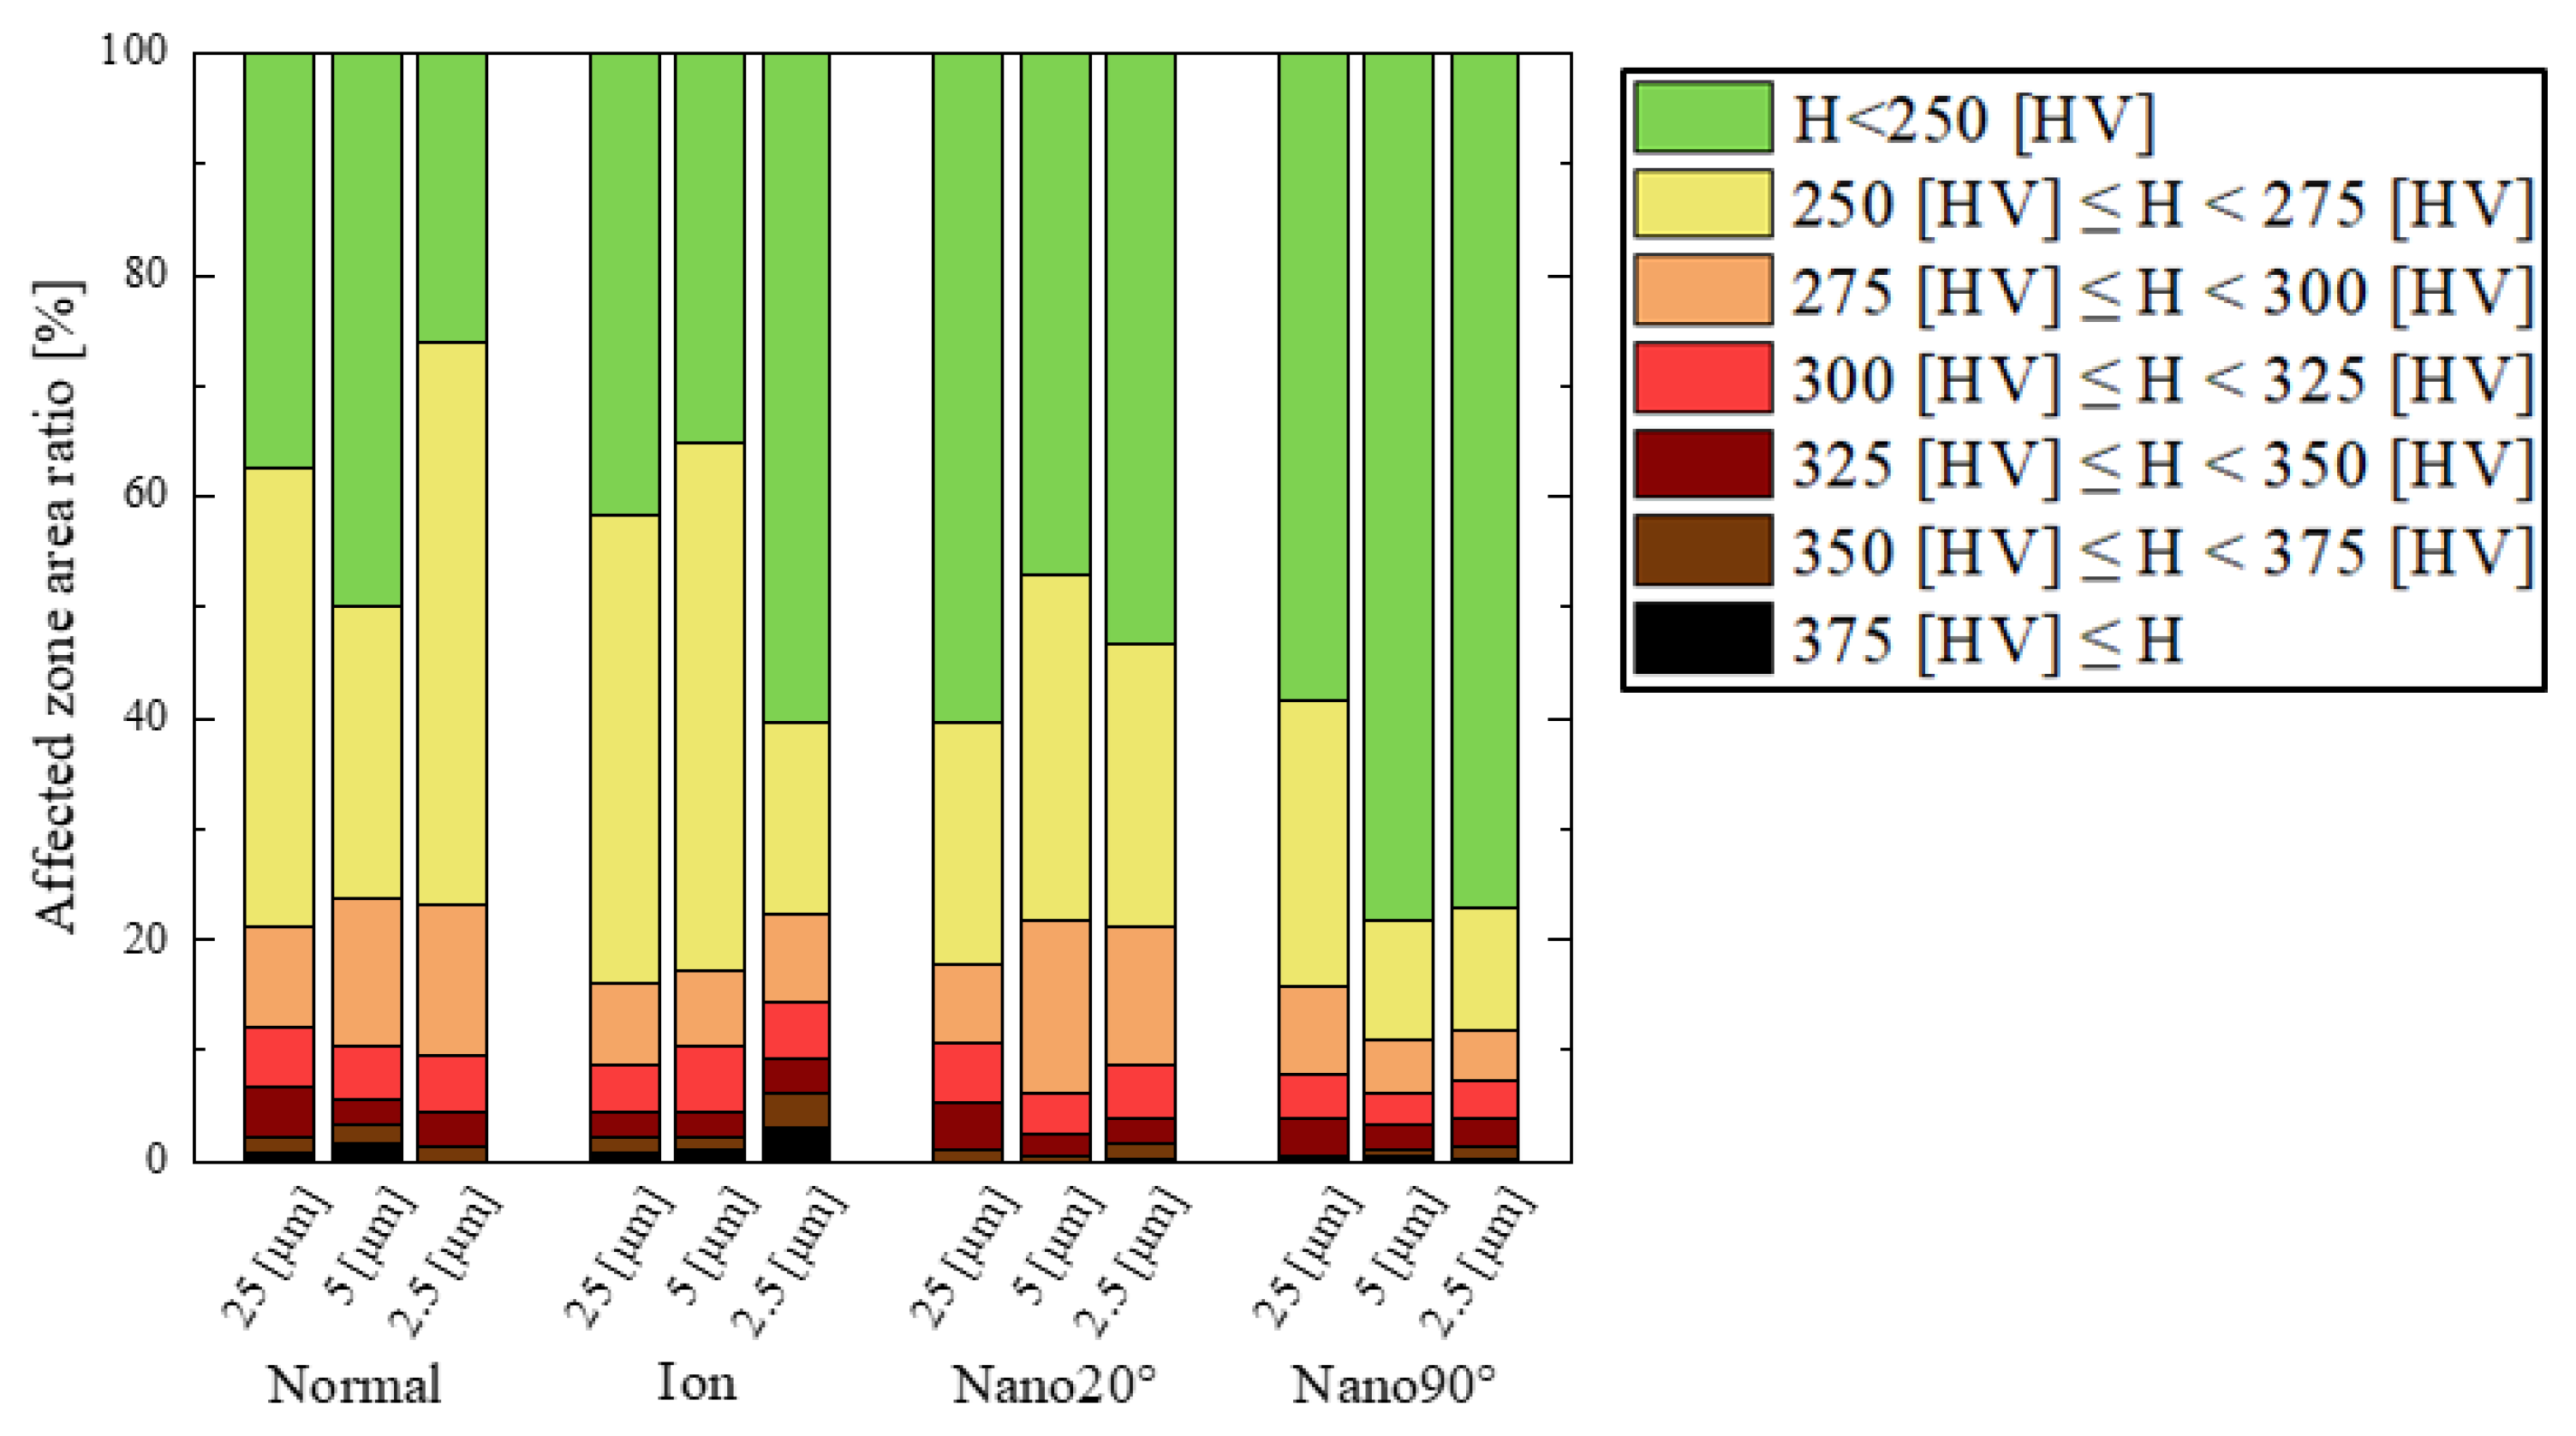
Figure 11.
Transients of the work hardening zone from sheared state by 30% to fully sheared state among four punching conditions. Three shots by N1, N2 and N3 were performed in each shearing experiment.
Figure 11.
Transients of the work hardening zone from sheared state by 30% to fully sheared state among four punching conditions. Three shots by N1, N2 and N3 were performed in each shearing experiment.
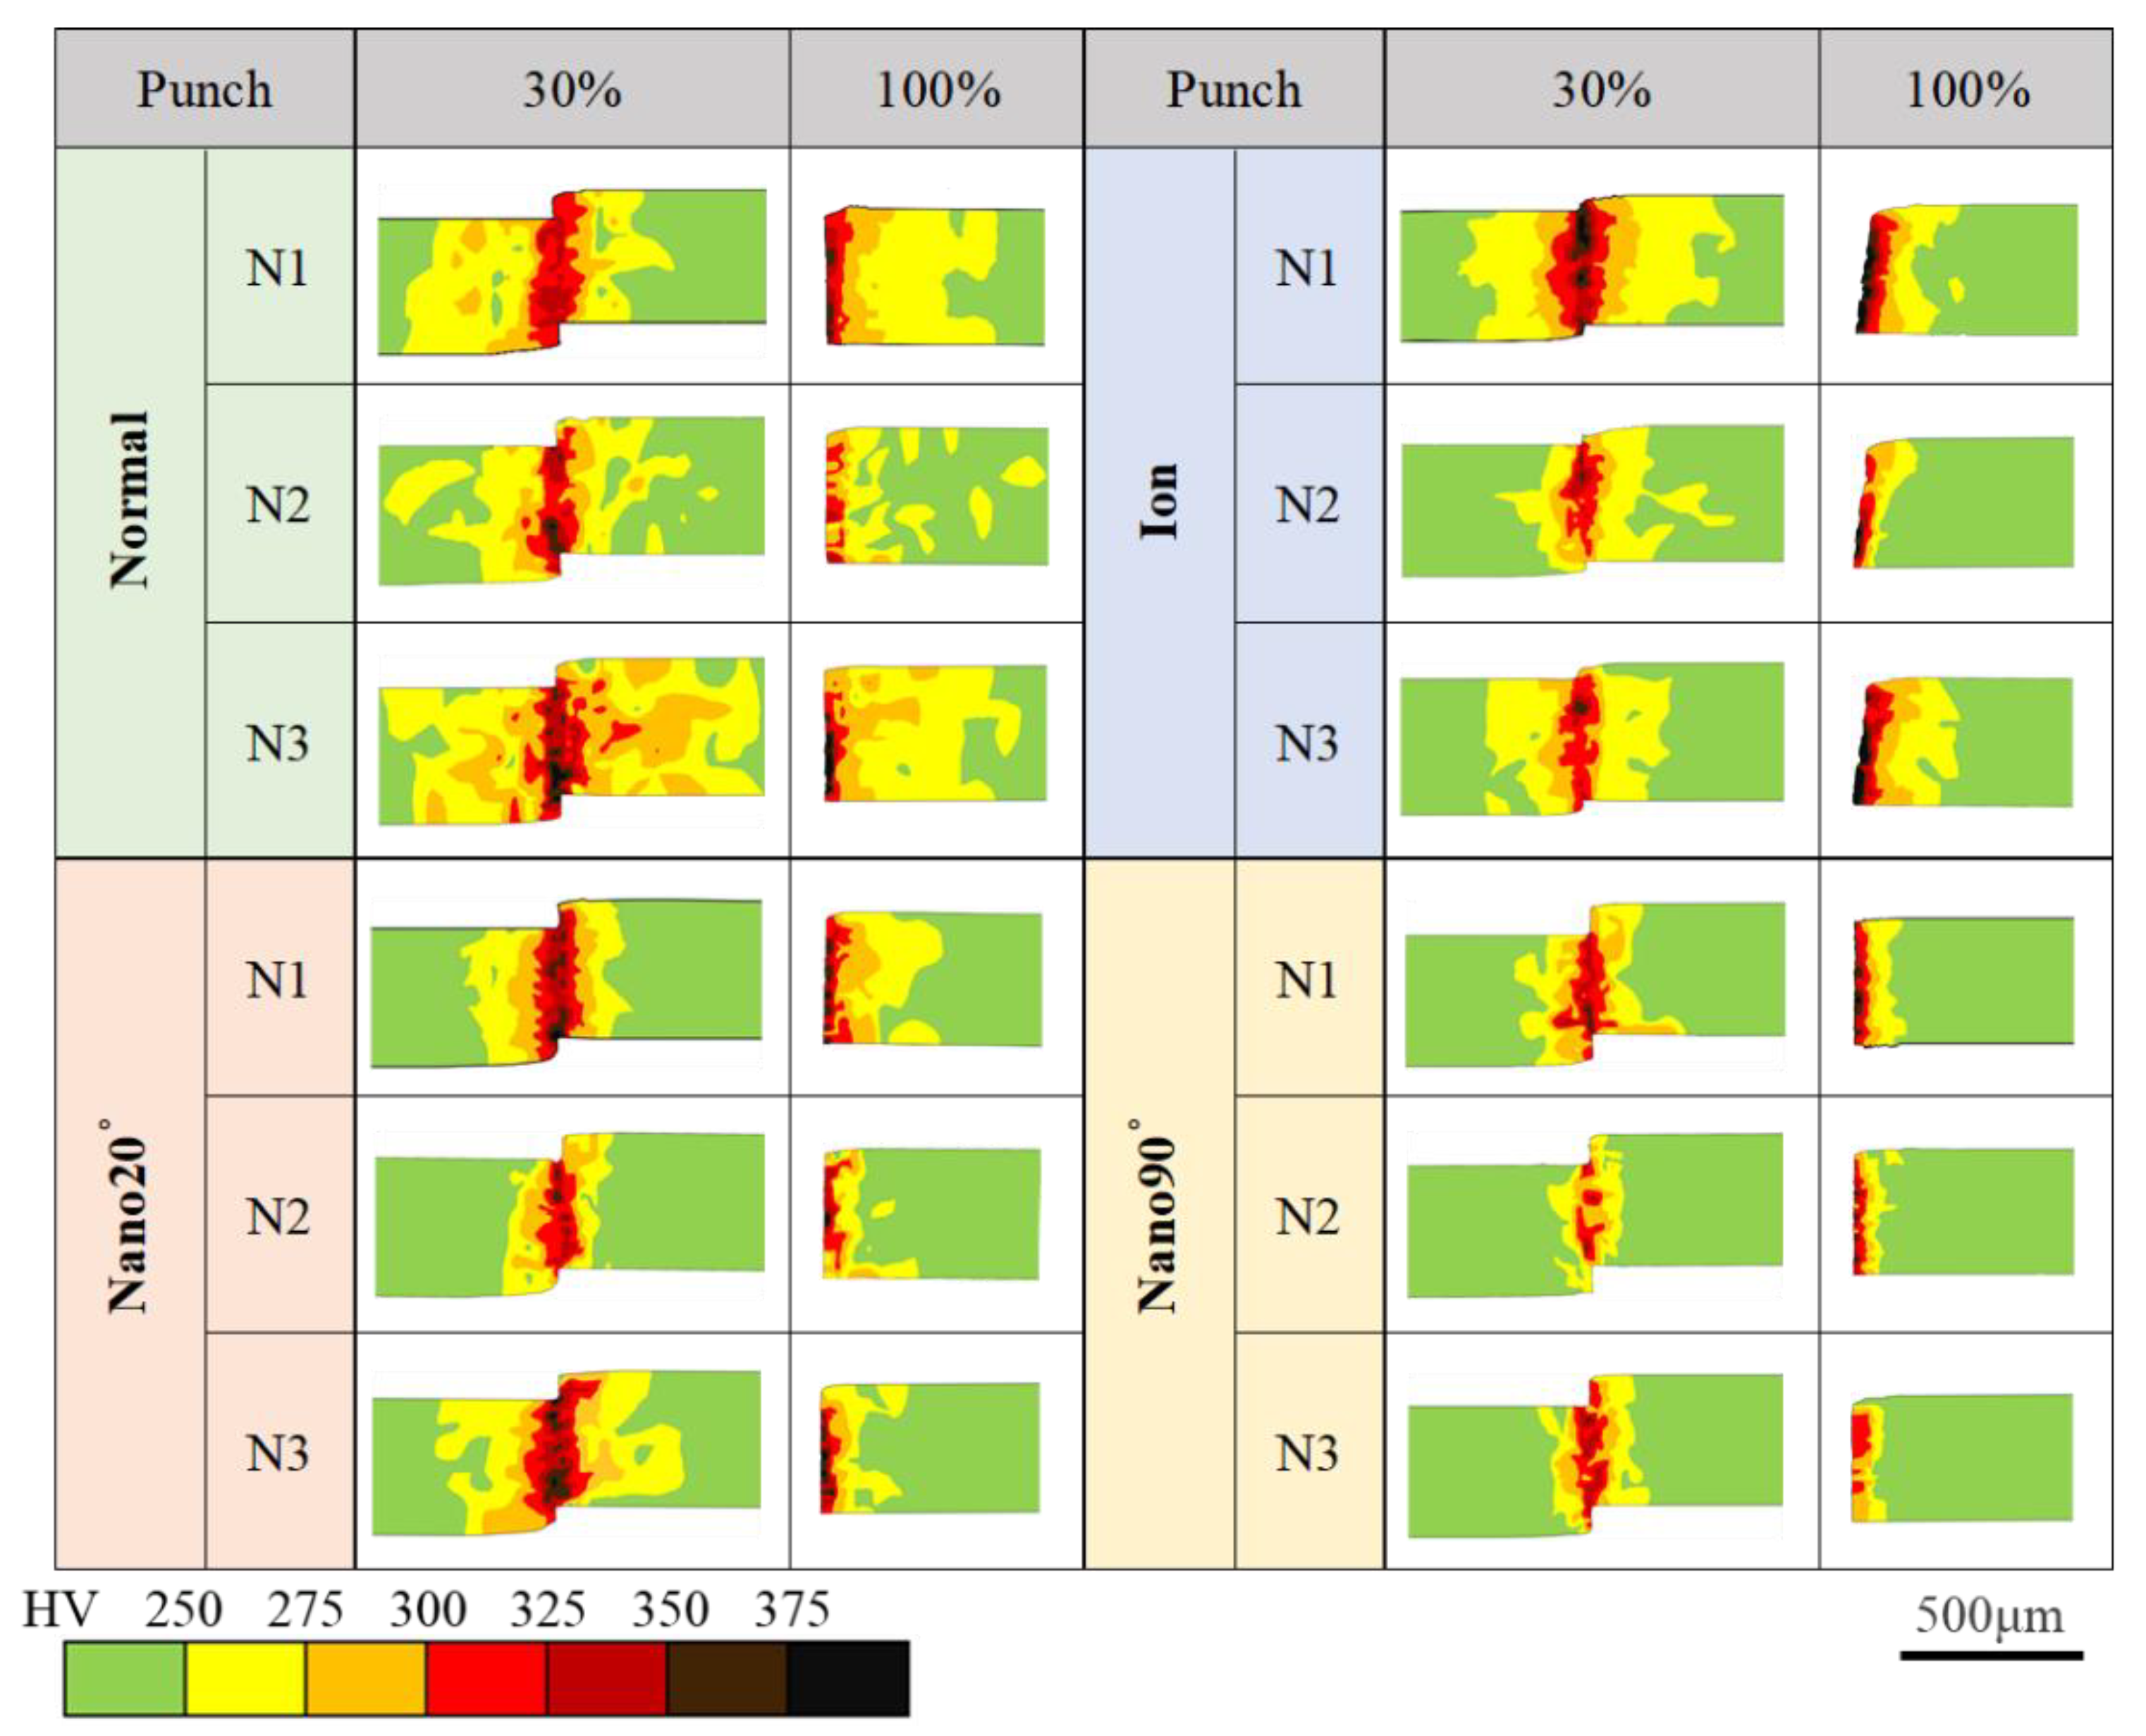
Figure 12.
Effect of tool conditions to the work hardening damage fraction at the short-shot and after fully punching out.
Figure 12.
Effect of tool conditions to the work hardening damage fraction at the short-shot and after fully punching out.
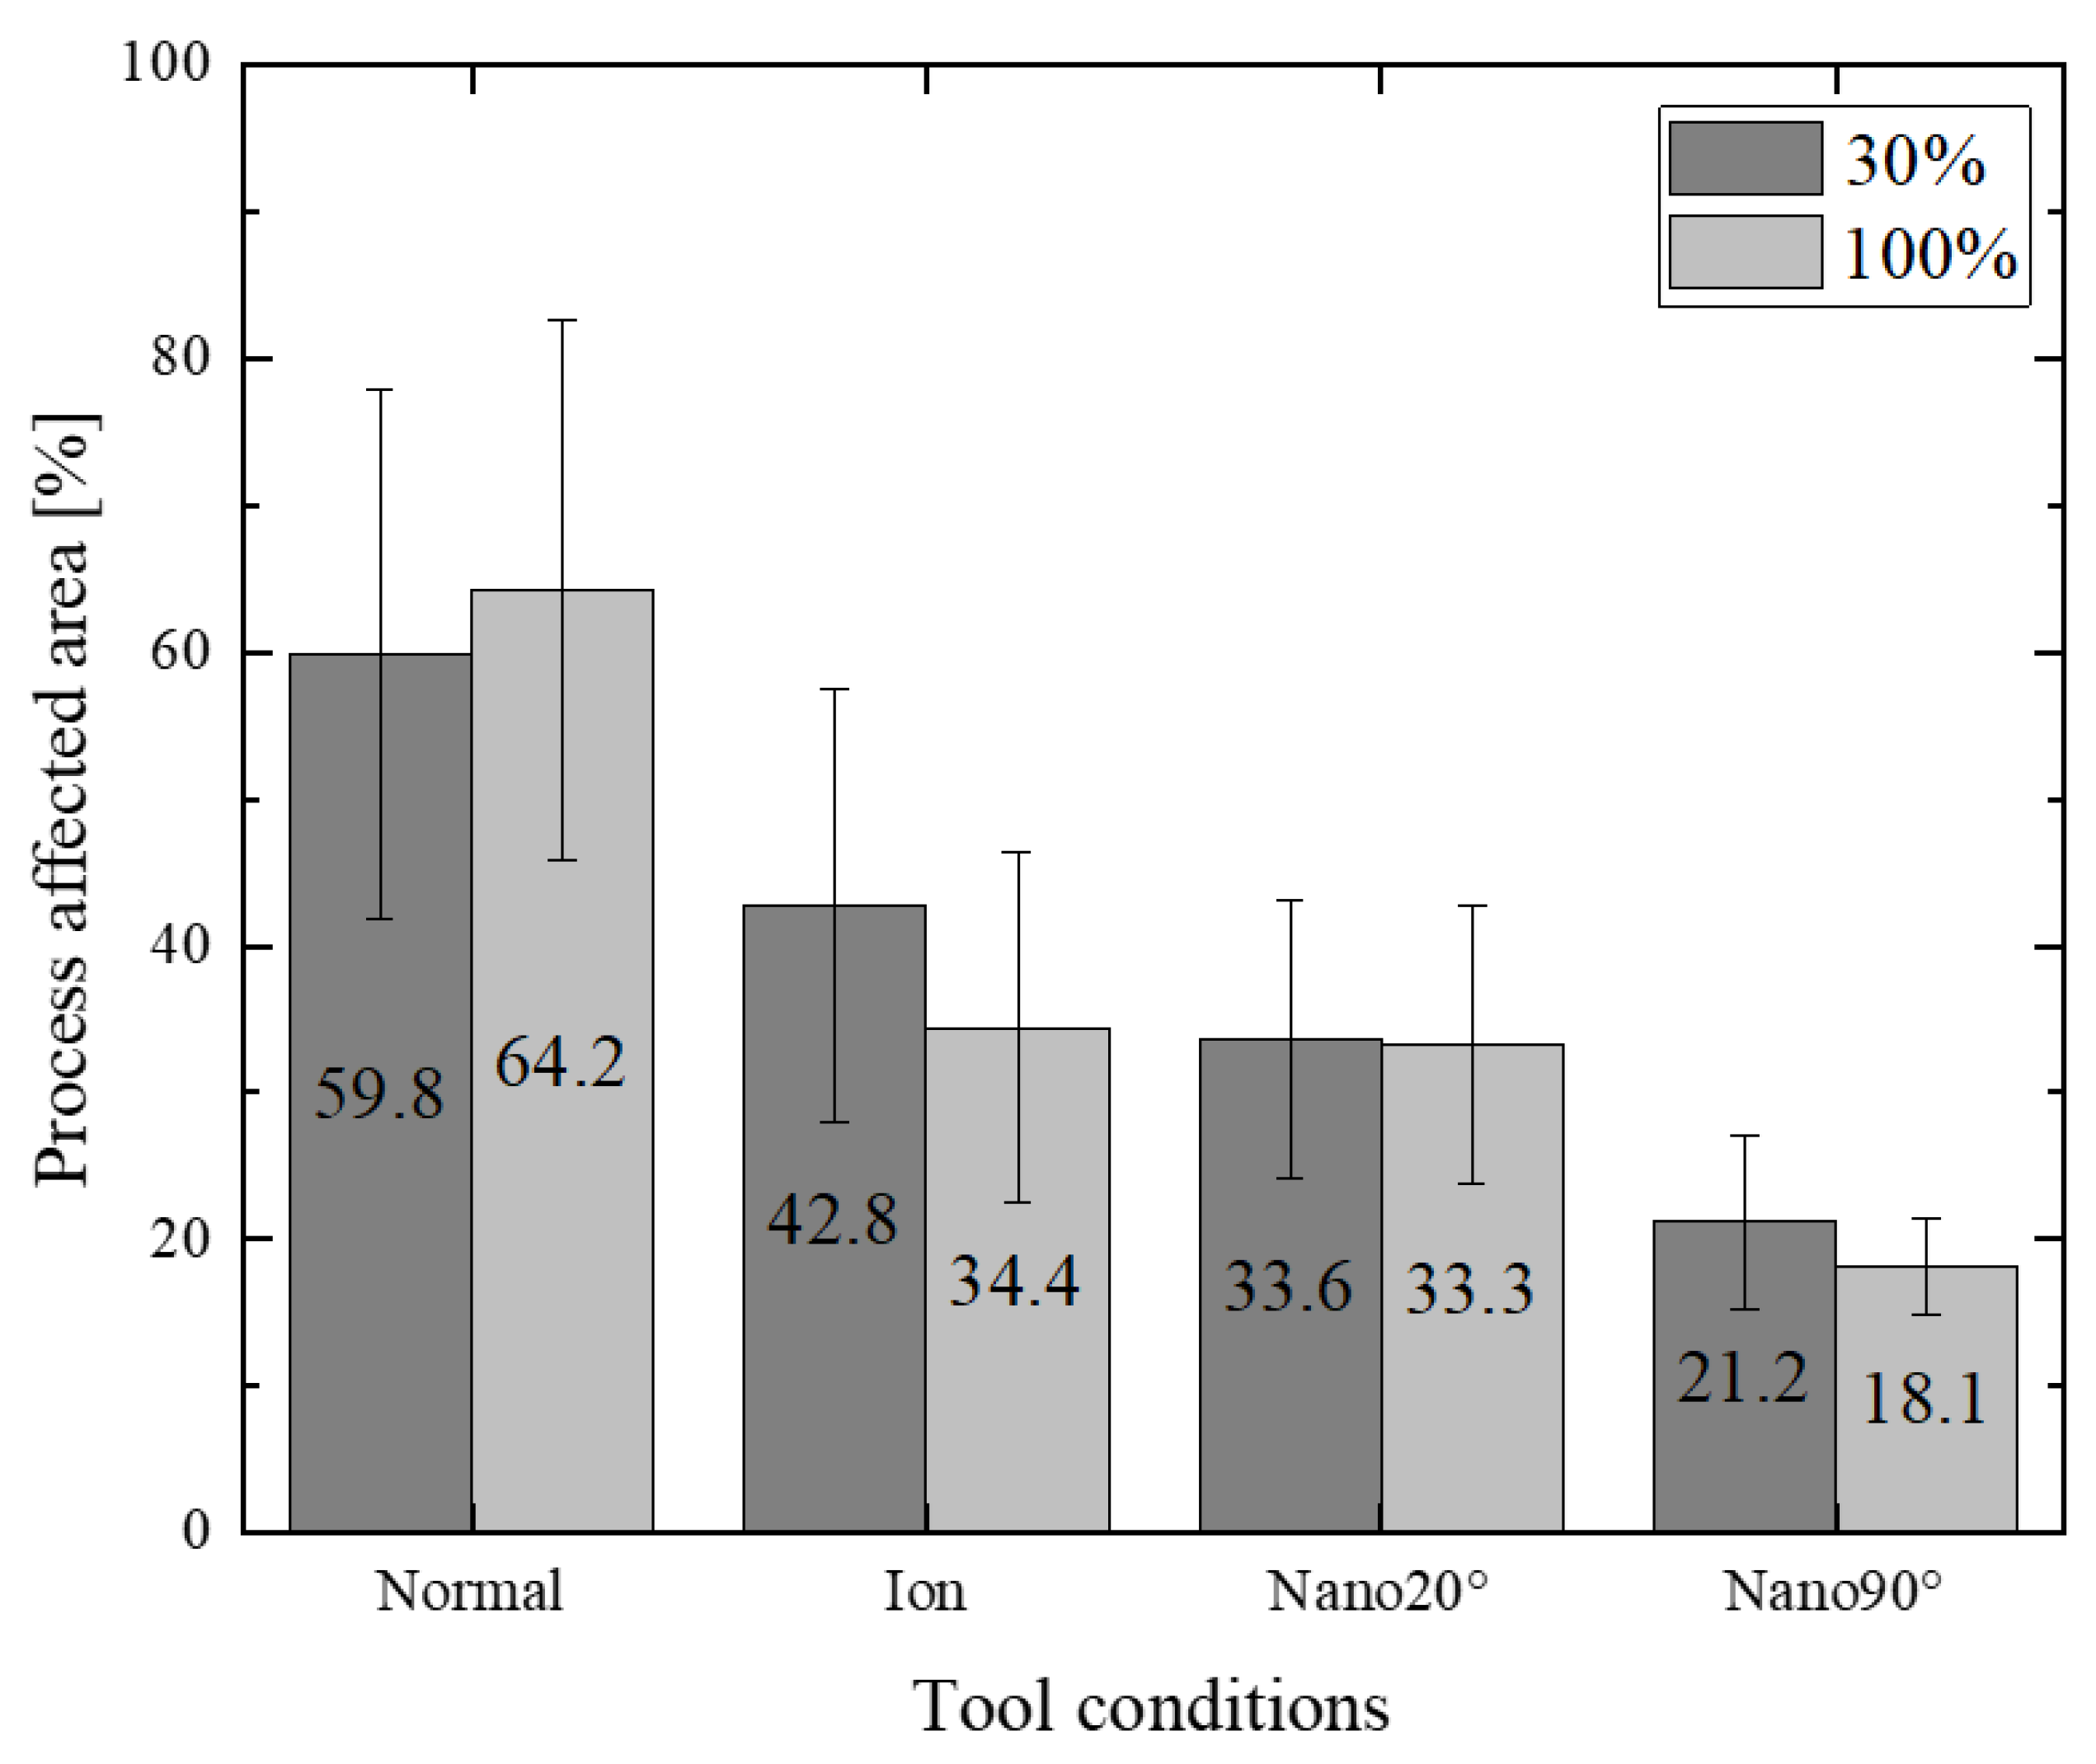

Table 1.
Comparison of the elastic zone (H < 250 HV; green-colored zone in Figure 9), the medium work hardening zone (250 HV < H < 300 HV; yellow and orange colored zones in Figure 9), and the high work hardening zone (300 HV < H < 375 HV and H < 375 HV; red, dark-red, brown and black colored zones in Figure 9) at each clearance and punch.
| Tool Conditions | Clearance | Elastic zone | Medium work hardening zone | High work hardening zone |
|---|---|---|---|---|
| Normal | 25 μm | 37.5 | 50.4 | 12.1 |
| 5 μm | 50.0 | 39.7 | 10.3 | |
| 2.5 μm | 26.1 | 64.3 | 9.6 | |
| Ion | 25 μm | 41.8 | 49.7 | 8.5 |
| 5 μm | 35.2 | 54.5 | 10.3 | |
| 2.5 μm | 60.5 | 25.3 | 14.2 | |
| Nano20˚ | 25 μm | 60.5 | 28.8 | 10.7 |
| 5 μm | 47.1 | 46.9 | 6.0 | |
| 2.5 μm | 53.3 | 38.0 | 8.7 | |
| Nano90˚ | 25 μm | 58.5 | 33.5 | 8.0 |
| 5 μm | 78.3 | 15.5 | 6.2 | |
| 2.5 μm | 77.2 | 15.6 | 7.2 |
Table 2.
Comparison of the plastic dissipation work (W).
| Normal | Ion | Nano20˚ | Nano90˚ | |
|---|---|---|---|---|
| N1 | 0.040 [J] | 0.063 [J] | 0.031 [J] | 0.027 [J] |
| N2 | 0.042 [J] | 0.034 [J] | 0.019 [J] | 0.008 [J] |
| N3 | 0.104 [J] | 0.034 [J] | 0.046 [J] | 0.018 [J] |
| Average | 0.062 [J] | 0.044 [J] | 0.032 [J] | 0.018 [J] |
Disclaimer/Publisher’s Note: The statements, opinions and data contained in all publications are solely those of the individual author(s) and contributor(s) and not of MDPI and/or the editor(s). MDPI and/or the editor(s) disclaim responsibility for any injury to people or property resulting from any ideas, methods, instructions or products referred to in the content. |
© 2025 by the authors. Licensee MDPI, Basel, Switzerland. This article is an open access article distributed under the terms and conditions of the Creative Commons Attribution (CC BY) license (http://creativecommons.org/licenses/by/4.0/).
Copyright: This open access article is published under a Creative Commons CC BY 4.0 license, which permit the free download, distribution, and reuse, provided that the author and preprint are cited in any reuse.


