
Submitted:
02 January 2025
Posted:
07 January 2025
You are already at the latest version
Abstract
Exposure to low-dose environmental pollutant cadmium (Cd) increases the risks of both albuminuria and hypertension by mechanisms which are poorly understood. Here, multiple-regression and mediation analyses were applied to data from 641 Thai subjects of whom 39.8%, 16.5%, 10.8%, and 4.8% had hypertension, albuminuria, diabetes, and chronic kidney disease (CKD), defined as the estimated glomerular filtration rate (eGFR) ≤ 60 mL/min/1.73 m2, respectively. To correct for interindividual differences in urine dilution and surviving nephrons, the excretion rates of Cd (ECd), albumin (Ealb) and β2-microglobulin (Eβ2M) were normalized to creatinine clearance (Ccr) as ECd/Ccr, Ealb/Ccr and Eβ2M/Ccr. Respective risks of having CKD and hypertension rose to 3.52 (95%CI: 1.75, 7.05) and 1.22 (95% CI:1.12, 1.3) per doubling Cd body burden. Respective risk of having albuminuria increased 2.95-fold (p = 0.042), and 4.17-fold (p = 0.020) in subjects who had hypertension plus severe and extremely severe tubular dysfunction, defined according to elevated β2M excretion rates. In multiple regression analysis, Ealb/Ccr increased linearly with both systolic blood pressure (SBP, β = 0.263) and diastolic blood pressure (DBP, β = 0.150), while showing an inverse association with eGFR (β = −0.180). The mediation model analyses inferred that a declining eGFR induced by Cd contributed to 80.6% of SBP increment (p = 0.005), which then fully mediated an elevation of albumin excretion (p < 0.001). The present study provides, for the first time, evidence that causally links Cd-induced eGFR reductions to blood pressure elevations which enhance albumin excretion.

Keywords:
albuminuria
; blood pressure
; β2-microglobulin
; cadmium
; estimated glomerular filtration rate
; mediation analysis
1. Introduction
An approximate of 8-13% of the world’s population is living with chronic kidney disease (CKD) [1,2,3]. In early stages, CKD is asymptomatic, and it is diagnosed when there is a substantial loss of functioning nephrons, evident from a fall of the estimated glomerular filtration rate (eGFR) below 60 mL/min/1.73 m2 (termed low eGFR) [1,2,3]. This CKD diagnostic stage often co-exists with disease comorbidities such as hypertension and proteinuria [2]. Alarmingly, CKD is predicted to become the fifth leading cause of years of life lost by 2040 [4,5].
Albuminuria is designated, when the excretion of albumin (Ealb), typically measured as the albumin-to-creatinine ratio (ACR), rises to levels above 20 and 30 mg/g creatinine in men and women, respectively [1,2,3]. Albuminuria that persists for at least 3 months is also employed as a CKD diagnostic criterion [1,2,3].
Elevated risks of kidney damage [6,7,8], albuminuria [9,10,11], proteinuria [12,13] and CKD [14,15,16,17] have repeatedly been linked to chronic exposure to the metal pollutant cadmium (Cd) in many countries. There is also an increased mortality risk among CKD patients who had an elevated Cd body burden, reflected by Cd excretion rates ≥ 0.60 μg/g creatinine [18].
Cd is a metal contaminant with no nutritional value or physiological role, and it presents worldwide public health concerns because it is highly toxic [19]. For most people, exposure to Cd is unavoidable because it is found in most food types [20,21,22], cigarette smoke and polluted air [23,24,25]. Most acquired Cd accumulates within the kidney tubular cells, where its levels increase through to the age of 50 years but decline thereafter due to its release into the urine as the injured tubular cells die [19,26]. Because most or all excreted Cd emanates from injured or dying tubular cells, excretion of Cd reflects the injury at the present time, not the risk of injury in the future [25,26].
The most frequently reported effects of environmental Cd exposure include kidney tubular cell damage and tubular dysfunction, indicated by an increased excretion of the low-molecular weight protein, β2-microglobulin (β2M) [25]. An increase β2M excretion above 300 µg/g creatinine was used in the toxicological risk assessment of Cd in the human diet [27,28]. Current evidence has implicated the circulating β2M in blood pressure regulation [29], and β2M excretion above 300 µg/g creatinine is indicative of enhanced increased risk of hypertension and severe kidney pathologies, such as rapid kidney functional deterioration and nephron loss for any reason [30,31,32].
The present study has three major objectives. The first is to examine the dose-response relationship between environmental Cd exposure levels, and three adverse outcomes of such exposure, namely CKD, hypertension, and defective tubular function. Excretion of Cd (ECd) and β2M (Eβ2M) were used as indicators of long-term exposure or body burden of Cd and tubular dysfunction, respectively [25]. The second objective is to explore a connection between Ealb and the rising levels of systolic and diastolic blood pressure (SBP and DBP) in Cd-exposed people. The third objective is to address female preponderance effects of environmental Cd exposure on blood pressure. These study objectives are formulated based on current stage of knowledge on the epidemiology of Cd toxicity and the significance of albuminuria as an independent risk factor for hypertension [33], a strong independent risk factor for worse outcomes of cardiovascular disease, incident CKD and its progression to kidney failure, especially among diabetics [34,35,36,37].
2. Materials and Methods
2.1. Participant Selection
We assembled archived data from large Thai population-based cohorts of residents in the Mae Sot District, Tak Province, where environmental Cd contamination was endemic (n = 310), and two low-exposure areas in Bangkok (n = 192) and Nakhon-Si-Thammarat Province (n = 139).
The Institutional Ethical Committees of Chulalongkorn University, Chiang Mai University and the Mae Sot Hospital approved the study protocol for the Mae Sot and Bangkok groups [38]. The Human Research Ethics Committee of Walailak University approved the study protocol for the Nakhon Si Thammarat group [39]. All participants gave informed consent prior to participation.
For all groups, exclusion criteria were pregnancy, breast-feeding, a history of metal work, and a hospital record or physician’s diagnosis of an advanced chronic disease.
For the low-exposure groups, those aged 19 years or older were selected. The health status was ascertained by physician’s examination reports and routine blood and urinary chemistry profiles. For the Mae Sot group, those who had resided at their current addresses for 30 years or longer were selected. The sociodemographic data, educational attainment, occupation, health status, family history of diabetes, and smoking status were obtained by structured interview questionnaires.
The diagnosis of hypertension relied primarily on the assessment made by the presiding physician and the recorded use of anti-hypertensive medication. Of 255 participants with hypertension, 242 (94.9%) were being treated, and 13 hypertensive cases were identified during our visit.
2.2. Assessment of Cadmium Exposure Levels and Its Effects
Samples of urine, whole blood, and plasma were collected from all participants after an overnight fast, and were stored at -80 ºC for later analysis. Plasma samples were assayed for the concentration of creatinine, while urine samples were assayed for the concentrations of creatinine, Cd, β2M and alb, detailed in previously [38,39].
2.3. Normalization of Cadmium, β2M and Albumin Excretion Rates
The excretion of x (Ex) was normalized to creatinine clearance (Ccr) as Ex/Ccr = [Cd]u[cr]p/[cr]u, where x = Cd, β2M or alb, [x]u = urine concentration of x (mass/volume), [cr]p = plasma creatinine concentration (mg/dL), and [cr]u = urine creatinine concentration (mg/dL). Ex/Ccr was expressed as an amount of x excreted per volume of the glomerular filtrate [43]. This Ccr-normalization corrects for urine dilution and the number of functioning nephrons simultaneously, and it is not influenced by muscle mass.
The excretion of x (Ex) was normalized to Ecr as [x]u/[cr]u, where x= Cd, β2M or alb, [x]u = urine concentration of x (mass/volume), and [cr]u = urine creatinine concentration (mg/dL). Ex/Ecr was expressed as an amount of x excreted per g of creatinine. This Ecr-normalization corrects for urine dilution only. This method of normalization of excretion rate is affected by interindividual differences in muscle mass which produces non-differential errors and a clear dose-response relationship of ECd and Ealb cannot be established [44,45].
2.4. Mediation Analysis for Cause-Effect Inference
A simple mediation model with a single mediator (M) and the Sobel test for the statistical significance of an indirect effect of the independent variable X were as described by MacKinnon et al. (1995) and Preacher and Hayes (2004) [46,47,48].
A mediation model with M as a mediator of the effect of the independent variable X on the dependent variable Y, and standardized β coefficients describing the relationships of X, M, and Y are depicted below.
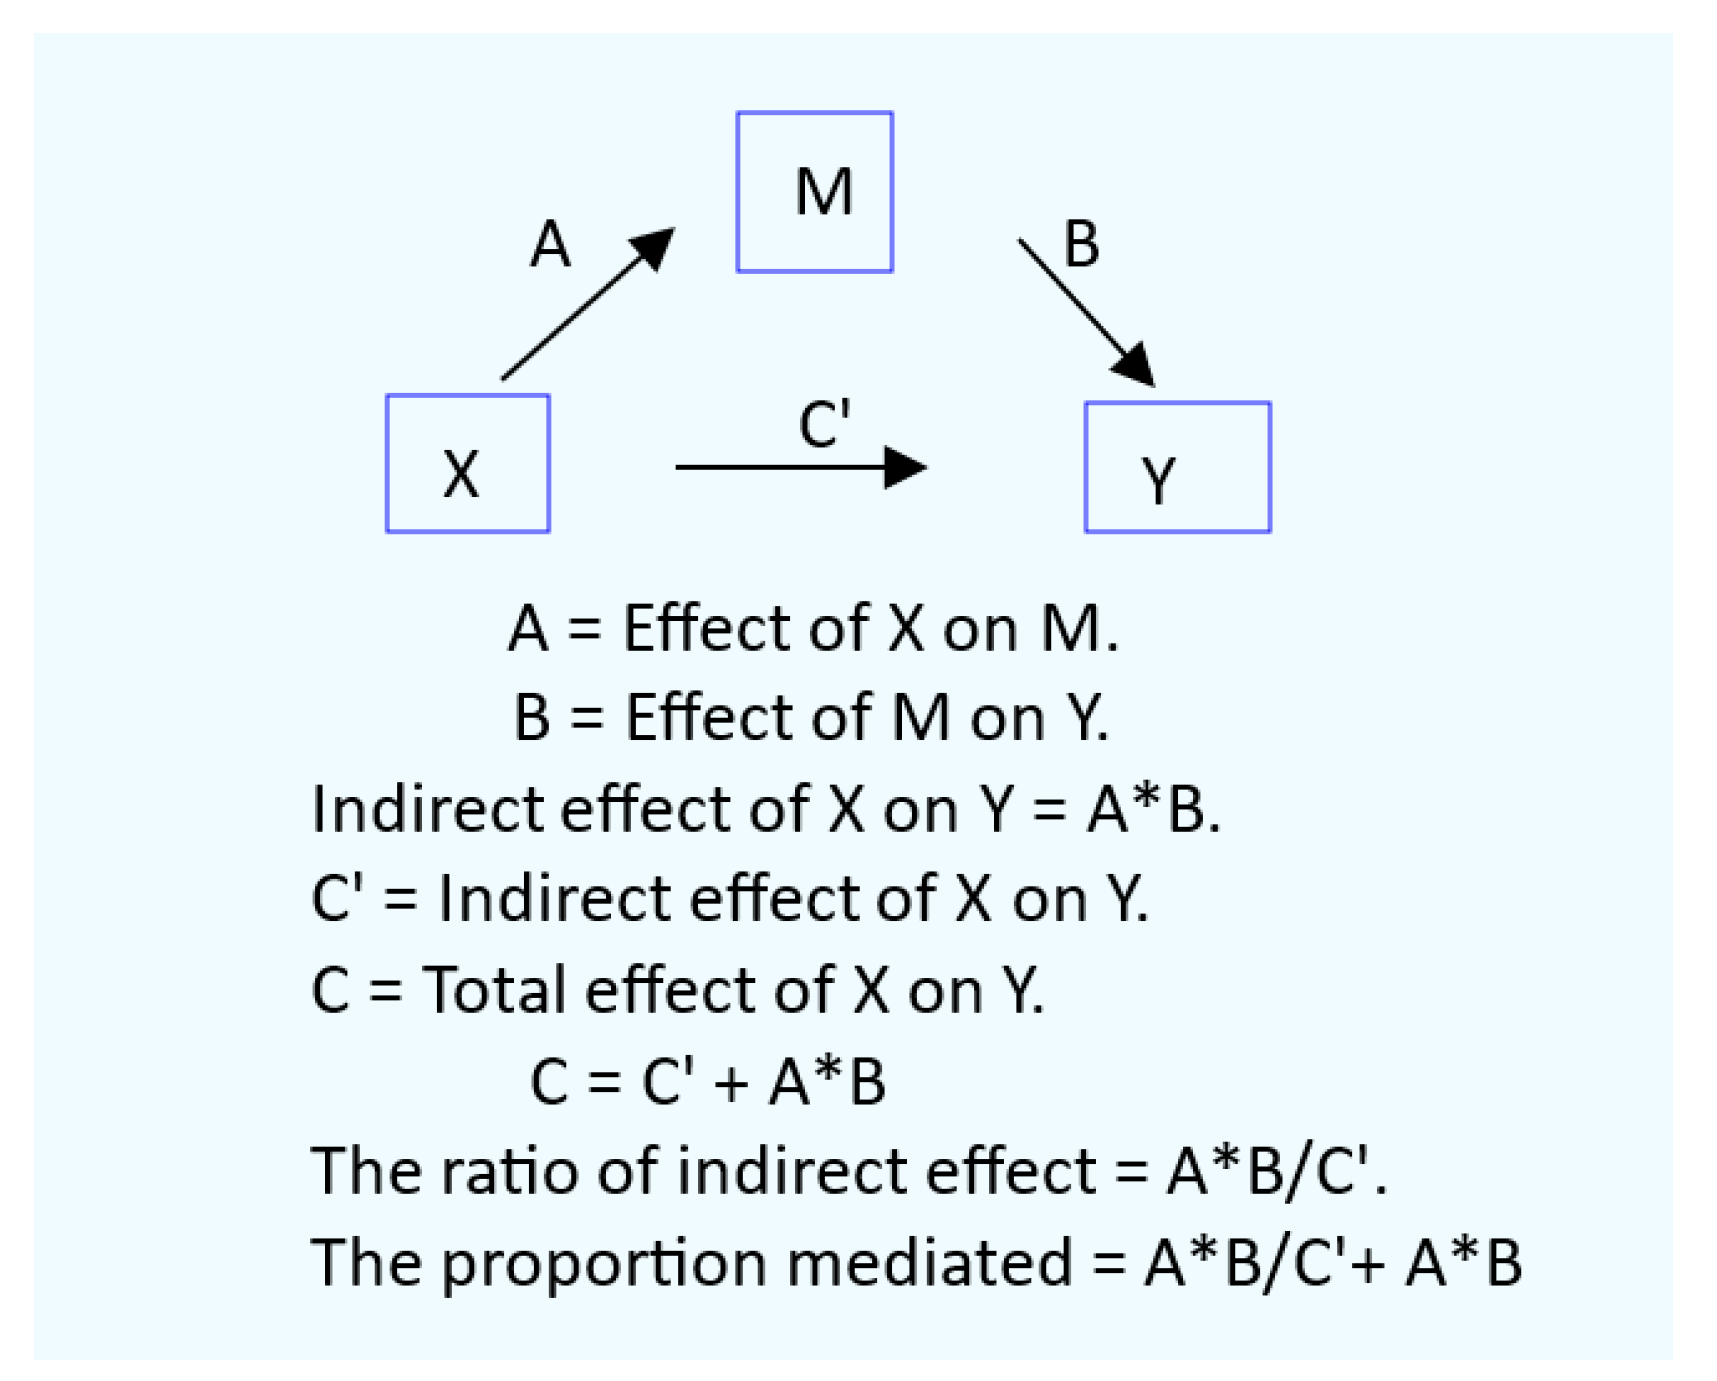
Diagram 1. A mediation model with a single mediator.
2.5. Statistical Analysis.
Data were analyzed using IBM SPSS Statistics 21 (IBM Inc., New York, NY, USA). To assess mean differences across Eβ2M groups, the Kruskal-Wallis Test was used. The Pearson chi-squared test was used to assess differences in percentages and prevalences of smoking, hypertension, low eGFR, diabetes, and albuminuria. The one-sample Kolmogorov–Smirnov test was used to ascertain the conformity to a normal distribution of continuous variables. Logarithmic transformation was applied to ECd, Eβ2M and Ealb, which showed a right-skewed distribution. For eGFR, no data transformation was required because the distribution of eGFR values was left-skewed. Multiple linear regression was conducted to Ealb predictors.
Logistic regression was conducted to evaluate the effects of Cd exposure and other independent variables on the prevalence odds ratio (POR) for CKD, hypertension, tubular dysfunction, and albuminuria. All reported POR values were adjusted for potential confounders.
Univariate analysis with Bonferroni correction in multiple comparisons was used to obtain covariate adjusted mean Ealb/Ccr and eta square (η2). For all tests, p-values ≤ 0.05 were considered to indicate statistical significance.
3. Results
3.1. Cohort Participants
Characteristics of 641 cohort participants can be found in Table 1.
The overall mean age of cohort participants was 47.5 years and the overall mean arithmetic (geometric) mean for Cd excretion rate was 0.024 (0.009) µg/L filtrate, corresponding to 2.98 (1.11) µg/g creatinine. The % of smokers and diabetics were 29 and 10.8, respectively. Hypertension was the most prevalent (39.8%) followed by albuminuria (16.5%), and low eGFR (4.8%).
To explore potential effects of tubular dysfunction, participants were grouped by Eβ2M/Ccr values, and 422, 69, 61 and 61 participants were found to have Eβ2M/Ccr values of 1.0 − 2.9, 3.0 − 9.9 and ≥ 10 µg/L filtrate, respectively. The % hypertension, albuminuria and low eGFR rose across Eβ2M/Ccr groups. In the highest Eβ2M/Ccr group, % hypertension, albuminuria and a low eGFR were 62.3, 38.3 and 37.7 respectively. The corresponding % figures in the lowest Eβ2M/Ccr group were 34.4, 9.4 and 0.7. Mean SBP and mean DBP increased across Eβ2M/Ccr groups.
3.2. Effects of Cadmium on the Risks of Having CKD, Hypertension and Tubular Defect
Table 2 provides results of three logistic regression models for CKD, hypertension, and tubular dysfunction.
The risks of having CKD, hypertension and tubular dysfunction were not affected by gender or smoking, but age, BMI and diabetes did. Age increased the risk of all three outcomes, while a rise in BMI increased the risk of hypertension only. The risks of having CKD and hypertension rose 3.5-fold (p < 0.001) and 1.2-fold (p <0.001), respectively, as the body burden of Cd increased two-fold. Doubling Cd burden had little effect on the risk of having tubular dysfunction, defined as Eβ2M/Ccr rates ≥ 3.0 µg/L filtrate [POR = 1.037 (95%CI: 0.917, 1.173), p = 0.567].
Tubular dysfunction was 17.7-time more prevalent among those with CKD. In comparison, all three outcomes were more prevalent among diabetics, compared with non-diabetics with the same overall Cd body burden.
3.3. Effects of Hypertension on the Prevalence of Albuminuria
Table 3 provides results of logistic regression models for albuminuria prevalence in all subjects and subgroups with or without hypertension.
In an inclusive model, the prevalence of albuminuria was minimally affected by age, Cd body burden, being obese, gender and smoking, while albuminuria was 3.3-time more prevalent in participants with CKD (p = 0.014). Subgroup analysis revealed that hypertension was the key determinant of albuminuria in people with CKD, diabetes, and tubular dysfunction. The prevalence of albuminuria was found to be increased only in those with CKD and hypertension (POR = 4.3, p = 0.040). Similarly, respective prevalences of albuminuria were increased 5.4-fold, 2.9-fold, and 4.2-fold in those with diabetes plus hypertension, severe tubular dysfunction plus hypertension and extremely severe tubular dysfunction plus hypertension.
3.4. Dose-Response Relationship and Quantitative Effect Size
The dose-response relationship of Ealb/Ccr and blood pressure is shown in Figure 1.
A linear dose-response relationship of Ealb/Ccr and ECd/Ccr was found only in the high-Cd burden group, defined as ECd/Ccr ≥ 0.01 µg/L filtrate, while a linear dose- response relationship of Ealb/Ccr and blood pressure measures (SBP and DBP) existed in both low- and high-Cd burden groups. Ealb/Ccr was more closely associated with SBP than DBP in both Cd burden groups.
Results of multiple linear regression analysis of Ealb/Ccr can be found in Table 4.
Age, BMI, eGFR, Cd burden, diabetes, blood pressure, gender, and smoking contributed to 14.7% and 11.3% of the total Ealb/Ccr variation in the inclusive models 1 and 2, respectively.
In the SBP model including all subjects, Ealb/Ccr varied inversely with eGFR (β = −0.180), while varied directly with SBP (β = 0.263) and diabetes (β = 0.179). In the DBP model, Ealb/Ccr was inversely associated with eGFR (β = −0.195), while varied directly with DBP (β = 0.150). and diabetes (β = 0.220). In the DBP model only, Ealb/Ccr showed a positive association with ECd/Ccr (β = 0.122).
In subgroup analysis, Ealb/Ccr was inversely associated with eGFR only in women, β = −0.188 for SBP model and β = −0.201 for DBP model. An association of Ealb/Ccr with DBP was also found in women only (β =0.149).
Ealb/Ccr was associated with SBP and diabetes in in both women and men in the SBP model. Similarly, Ealb/Ccr was associated with diabetes in both women and men in the DBP model.
Figure 2 shows the influences of Cd exposure levels and eGFR levels on albumin excretion among cohort participants.
Ealb/Ccr increased linearly with SBP in all three eGFR subgroups (Figure 2a), but the increase of Ealb/Ccr with DBP was observed only in participants with CKD (Figure 2b). In the univariate analysis for SBP effects with adjustment for covariates (Figure 2c), SBP contributed to 3.3 % of the variation in Ealb/Ccr in those with SBP higher the median SBP value of 130 mmHg. The mean values for Ealb/Ccr in participants with high SBP and CKD were 17.2% and 21.2% higher, compared to those with eGFR 61-90 and ≥ 90 mL/min/1.73m2, respectively (Figure 2c).
In the univariate analysis for DBP effects with adjustment for covariates (Figure 2d), DBP contributed to 3.3 % of the variation in Ealb/Ccr in those with DBP higher than the DBP median value of 80 mmHg. The mean values for Ealb/Ccr in participants with high DBP and CKD were 19.0% and 22.5% higher, compared to those with eGFR 61-90 and ≥ 90 mL/min/1.73m2, respectively (Figure 2d).
Thus, albumin excretion rate was increased in participants with CKD who also had SBP and DBP higher than 130 and 80 mmHg, respectively.
A simple mediation analysis was conducted to assess potential causal relationships of Cd exposure, eGFR and blood pressure levels (Figure 3).
A simple mediation analysis model of eGFR as the mediator suggested that Cd had direct and indirect effects on SBP and DBP (Figure 3a, 3b). However, the Sobel test results indicated that only the indirect effect of Cd on SBP reached a statistically significant level (Figure 3c,3d). Thus, an increase in SBP was in part due to reductions in eGFR, and the proportion of Cd-induced SBP increment mediated by eGFR was 80.6%. Rising DBP among participants was minimally related to Cd-induced eGFR reductions.
Additionally, two simple mediation models with blood pressure measures (SBP/DBP) as of the mediators were analyzed (Figure 4).
There was little evidence for a direct effect of Cd on Ealb/Ccr in SBP (β = 0.041, p = 0.381) and DBP models (β = −0.015, p = 0.745) (Figure 4a,4b). However, Cd had a significant indirect effect on Ealb/Ccr increment, mediated fully through rising SBP and DBP levels (Figure 4c,4d). Thus, SBP and DBP were the full mediators of an elevation of albumin excretion rate induced by Cd.
4. Discussion
The percentage (%) of hypertension among 641 cohort participants was the highest (39.8) followed by albuminuria (16.5), and low eGFR (4.8), while the percentages of smokers and diabetes were 29 and 10.8, respectively. The % of hypertension and diabetes were in ranges with those reported for the representative U.S. population of 39 and 10.3-13 respectively [49,50]. The CKD (a low eGFR criterion) prevalence in this Thai cohort of 4.8% was lower than 6.8% CKD prevalence figure in Taiwanese population [51], but it was nearly half the prevalence of 9.3% found in a large U.S. population database, where 5175 CKD cases were identified from a total 55,677 U.S. citizens, aged 20−85 years [15].
4.1. Low eGFR, Hypertension and Albuminuria: Are They Causally Connected?
In the present study, three outcomes of Cd exposure, low eGFR, hypertension and albuminuria were investigated for dose-response and cause-effect relationships. No previous studies have been undertaken to investigate the connection of these outcomes.
Albuminuria was 3.3-time more prevalent among participants with CKD, and the risks of having CKD and hypertension rose, respectively, 3.5-fold and 1.2-fold, when there was a two-fold increase in the body burden of Cd (Table 1 and Table 2). Hypertension was found to be the key determinant of albuminuria in participants with CKD; the risk of having albuminuria increased only in those with CKD plus hypertension (POR = 4.3) (Table 3).
We employed two simple mediation models to assess potential causal relationships of Cd exposure, eGFR and blood pressure levels. In the model in which eGFR was the mediator (Figure 3), the increase in SBP levels among cohort participant was in part due to reductions in eGFR. The proportion of Cd-induced SBP increment mediated by eGFR decline was 80.6%. Rising DBP among participants was minimally related to Cd-induced eGFR reductions.
In the model in which SBP or DBP was the mediator (Figure 4), an elevation of albumin excretion rate induced by Cd was through rising SBP and DBP. Taken together, it can be concluded that albuminuria in Cd-exposed people is a consequence of Cd-induced GFR fall, which causes SBP and DBP to rise along with the excretion rate of albumin.
4.2. Effects of Cadmium in Women and Men
By multiple regression analysis including all subjects, age, BMI, eGFR, Cd burden, diabetes, blood pressure, gender, and smoking contributed significantly to the variability of Ealb/Ccr among cohort participants (Table 4). In subgroup analysis, however, Ealb/Ccr inversely associated with eGFR in women only (β = −0.188 for SBP model and β = −0.201 for DBP model). An association of Ealb/Ccr with DBP was also found in women only (β =0.149). The reasons for female preponderance effect of Cd on blood pressure and albuminuria were not apparent from the present study. A further research is warranted.
Typically, hypertension is more prevalent in men, compared to age-matched premenopausal women [52,53,54] and the differences of Cd effects in men and women were related to sex hormones. A 28% increase in serum testosterone levels in postmenopausal Japanese women was noted as their urinary Cd levels rose from <2 to ≥ 3 μg/g creatinine [55]. An inverse association between urinary Cd and serum estradiol levels was noted in postmenopausal Japanese and Swedish women [56,57]. In the Swiss Kidney Project on Genes in Hypertension [58], urinary Cd correlated with testosterone excretion in men, while there was a trend for an association in women.
4.3. Implications for Toxicological Risk Assessment of Dietry Cadmium Exposure
Hypertension, albuminuria, and CKD have been found repeatedly in people with a low body burden of Cd. A two-fold increase in risk of hypertension was associated with Cd excretion rate of 0.98 µg/g creatinine and a blood Cd level of 0.61 µg/L [59]. Similarly, an analysis of U.S. population data reported that the risk of having CKD increased 2.1-fold, 3.2-fold and 5.5-fold in people who had blood Cd concentrations of 0.21–0.35, 0.36–0.60, and > 0.60 µg/L, respectively [15].
Furthermore, given the same Cd body burden, the risk of having albuminuria was the highest (POR = 5.4) in diabetics with hypertension, compared to participants with severe tubular dysfunction plus hypertension (POR= 2.9) and participants with extremely severe tubular dysfunction plus hypertension (POR = 4.2) (Table 3). Thus, people with diabetes were highly susceptible to the nephrotoxicity of Cd. Consistent with our observation, a Dutch cross-sectional study, including 231 patients with type 2 diabetes, reported that low Cd exposure increased the risk of diabetic kidney disease [60]. In a six-year median follow-up of these patients, a progressive reduction of eGFR to kidney failure was linked to Cd exposure [61].
In the present study, albuminuria was 3.4-time more prevalent than a low eGFR. This underscores the utility of an elevated albumin excretion of for early CKD detection purposes, given that CKD in its early stage is largely asymptomatic. This makes its early detection difficult and the initiation of early treatment, which can significantly prevent CKD progression, limited. ACR as low as 7 mg/g creatinine was a predictor of incident CKD within 10 years [36]. ACR ≥10 mg/g creatinine may increase mortality from all causes and CVD [37].
A significant increase in albumin excretion rate was found in participants with SBP and DBP within normal ranges (Figure 2). Participants with the lowest eGFR plus SBP ≥130 mmHg excreted albumin at 17.2% and 21.2% higher rates than those who moderate and high eGFR, respectively. Similarly, the lowest eGFR group with DBP ≥80 mmHg excreted albumin 19.0% and 22.5% higher rates than those in the moderate and high eGFR groups.
The extent of albumin excretion could thus serve as a sensitive toxicity endpoint for the toxicological risk assessment of Cd in the human diet. Current dietary CD exposure guidelines, based on a severe tubular dysfunction (Eβ2M/Ccr ≥ 3 µg/L filtrate or β2M excretion rates ≥ 300 µg/g creatinine), are not protective of human health. There is an urgent need to develop new dietary Cd exposure limits.
5. Conclusions
Through the mediation analysis, this study shows, for the first time, that an elevation of albumin excretion rate is caused by an increase in blood pressure, notably SBP, which arises from Cd-induced GFR reductions. A declining eGFR, rising SBP and an elevated albumin excretion can serve as sensitive endpoints suitable for toxicological risk assessment of Cd in the human diet and the derivation of health-protective exposure limit.
Author Contributions
Conceptualization, S.S., D.A.V., and A.B.Đ.; methodology, S.Y., T.K., and P.P.; formal analysis, S.S. and A.B.Đ.; investigation, S.S., S.Y., T.K., and P.P.; resources, D.A.V., S.Y., and A.B.Đ.; data curation, S.S. and S.Y.; writing—original draft preparation, S.S.; writing—review and editing, S.S., D.A.V., and A.B.Đ.; project administration, S.S. and S.Y. All authors have read and agreed to the published version of the manuscript.
Funding
This research received no external funding.
Institutional Review Board Statement
Not applicable.
Informed Consent Statement
Written informed consent was obtained from study subjects.
Data Availability Statement
All data are contained within this article.
Acknowledgments
This work was supported by resources from the Centre for Kidney Disease Research, Translational Research Institute, the Department of Kidney and Transplant Services, Princess Alexandra Hospital, the Department of Toxicology, Faculty of Pharmacy, University of Belgrade, Serbia.
Conflicts of Interest
The authors declare no conflicts of interest.
References
- Murton, M.; Goff-Leggett, D.; Bobrowska, A.; Garcia Sanchez, J.J.; James, G.; Wittbrodt, E.; Nolan, S.; Sörstadius, E.; Pecoits-Filho, R.; Tuttle, K. Burden of Chronic Kidney Disease by KDIGO Categories of Glomerular Filtration Rate and Albuminuria: A Systematic Review. Adv. Ther. 2021, 38, 180–200. [Google Scholar] [CrossRef] [PubMed]
- Evans, M.; Lewis, R.D.; Morgan, A.R.; Whyte, M.B.; Hanif, W.; Bain, S.C.; Davies, S.; Dashora, U.; Yousef, Z.; Patel, D.C.; et al. A Narrative Review of Chronic Kidney Disease in Clinical Practice: Current Challenges and Future Perspectives. Adv. Ther. 2022, 39, 33–43. [Google Scholar] [CrossRef] [PubMed]
- Farrell, D.R.; Vassalotti, J.A. Screening, identifying, and treating chronic kidney disease: Why, who, when, how, and what? BMC Nephrol. 2024, 25, 34. [Google Scholar] [CrossRef] [PubMed]
- Foreman, K.J.; Marquez, N.; Dolgert, A.; Fukutaki, K.; Fullman, N.; McGaughey, M.; Pletcher, M.A.; Smith, A.E.; Tang, K.; Yuan, C.W.; et al. Forecasting life expectancy, years of life lost, and all-cause and cause-specific mortality for 250 causes of death: Reference and alternative scenarios for 2016-40 for 195 countries and territories. Lancet 2018, 392, 2052–2090. [Google Scholar] [CrossRef] [PubMed]
- GBD 2021 Forecasting Collaborators. Burden of disease scenarios for 204 countries and territories, 2022–2050: A forecasting analysis for the Global Burden of Disease Study 2021. Lancet 2024, 403, 2204–2256. [Google Scholar] [CrossRef]
- Wei, Y.; Wang, X.; Sun, Q.; Shi, W.; Zhang, W.; Gao, X.; Li, Y.; Hao, R.; Dong, X.; Chen, C.; et al. Associations of environmental cadmium exposure with kidney damage: Exploring mediating DNA methylation sites in Chinese adults. Environ. Res. 2024, 251(Pt 1) Pt 1, 118667. [Google Scholar] [CrossRef]
- Sakuma, S.; Nogawa, K.; Watanabe, Y.; Sakurai, M.; Nishijo, M.; Ishizaki, M.; Morikawa, Y.; Kido, T.; Nakagawa, H.; Suwazono, Y. Effect of renal tubular damage on non-cancer mortality in the general Japanese population living in cadmium non-polluted areas. J. Appl. Toxicol. 2023, 43, 1849–1858. [Google Scholar] [CrossRef]
- Smereczański, N.M.; Brzóska, M.M. Current levels of environmental exposure to cadmium in industrialized countries as a risk factor for kidney damage in the general population: A comprehensive review of available data. Int. J. Mol. Sci. 2023, 24, 8413. [Google Scholar] [CrossRef]
- Satarug, S.; Vesey, D.A.; Gobe, G.C.; Phelps, K.R. The pathogenesis of albuminuria in cadmium nephropathy. Curr. Res. Toxicol. 2023, 6, 100140. [Google Scholar] [CrossRef]
- Satarug, S.; Vesey, D.A.; Gobe, G.C.; Yimthiang, S.; Buha Đorđević, A. Health Risk in a Geographic Area of Thailand with Endemic Cadmium Contamination: Focus on Albuminuria. Toxics 2023, 11, 68. [Google Scholar] [CrossRef]
- Grau-Perez, M.; Pichler, G.; Galan-Chilet, I.; Briongos-Figuero, L.S.; Rentero-Garrido, P.; Lopez-Izquierdo, R.; Navas-Acien, A.; Weaver, V.; García-Barrera, T.; Gomez-Ariza, J.L.; et al. Urine cadmium levels and albuminuria in a general population from Spain: A gene-environment interaction analysis. Environ. Int. 2017, 106, 27–36. [Google Scholar] [CrossRef] [PubMed]
- Tsai, H.J.; Hung, C.H.; Wang, C.W.; Tu, H.P.; Li, C.H.; Tsai, C.C.; Lin, W.Y.; Chen, S.C.; Kuo, C.H. Associations among Heavy Metals and Proteinuria and Chronic Kidney Disease. Diagnostics (Basel) 2021, 11, 82. [Google Scholar] [CrossRef] [PubMed]
- Jalili, C.; Kazemi, M.; Cheng, H.; Mohammadi, H.; Babaei, A.; Taheri, E.; Moradi, S. Associations between exposure to heavy metals and the risk of chronic kidney disease: a systematic review and meta-analysis. Crit. Rev. Toxicol. 2021, 51, 165–182. [Google Scholar] [CrossRef] [PubMed]
- Doccioli, C.; Sera, F.; Francavilla, A.; Cupisti, A.; Biggeri, A. Association of cadmium environmental exposure with chronic kidney disease: A systematic review and meta-analysis. Sci. Total Environ. 2024, 906, 167165. [Google Scholar] [CrossRef]
- Akinleye, A.; Oremade, O.; Xu, X. Exposure to low levels of heavy metals and chronic kidney disease in the US population: A cross-sectional study. PLoS One 2024, 19, e0288190. [Google Scholar] [CrossRef]
- Satarug, S.; Vesey, D.A.; Nishijo, M.; Ruangyuttikarn, W.; Gobe, G.C.; Phelps, K.R. The Effect of Cadmium on GFR Is Clarified by Normalization of Excretion Rates to Creatinine Clearance. Int. J. Mol. Sci. 2021, 22, 1762. [Google Scholar] [CrossRef]
- Satarug, S.; Đorđević, A.B.; Yimthiang, S.; Vesey, D.A.; Gobe, G.C. The NOAEL Equivalent of Environmental Cadmium Exposure Associated with GFR Reduction and Chronic Kidney Disease. Toxics 2022, 10, 614. [Google Scholar] [CrossRef]
- Zhang, J.; Wang, X.; Ma, Z.; Dang, Y.; Yang, Y.; Cao, S.; Ouyang, C.; Shi, X.; Pan, J.; Hu, X. Associations of urinary and blood cadmium concentrations with all-cause mortality in US adults with chronic kidney disease: A prospective cohort study. Environ. Sci. Pollut. Res. Int. 2023, 30, 61659–61671. [Google Scholar] [CrossRef]
- Satarug, S.; Vesey, D.A.; Gobe, G.C.; Phelps, K.R. Estimation of health risks associated with dietary cadmium exposure. Arch. Toxicol. 2023, 97, 329–358. [Google Scholar] [CrossRef]
- Fechner, C.; Hackethal, C.; Höpfner, T.; Dietrich, J.; Bloch, D.; Lindtner, O.; Sarvan, I. Results of the BfR MEAL Study: In Germany, mercury is mostly contained in fish and seafood while cadmium, lead, and nickel are present in a broad spectrum of foods. Food Chem. X 2022, 14, 100326. [Google Scholar] [CrossRef]
- Watanabe, T.; Kataoka, Y.; Hayashi, K.; Matsuda, R.; Uneyama, C. Dietary exposure of the Japanese general population to elements: Total diet study 2013–2018. Food Saf. 2022, 10, 83–101. [Google Scholar] [CrossRef] [PubMed]
- Pokharel, A.; Wu, F. Dietary exposure to cadmium from six common foods in the United States. Food Chem. Toxicol. 2023, 178, 113873. [Google Scholar] [CrossRef] [PubMed]
- Almerud, P.; Zamaratskaia, G.; Lindroos, A.K.; Bjermo, H.; Andersson, E.M.; Lundh, T.; Ankarberg, E.H.; Lignell, S. Cadmium, total mercury, and lead in blood and associations with diet, sociodemographic factors, and smoking in Swedish adolescents. Environ. Res. 2021, 197, 110991. [Google Scholar] [CrossRef] [PubMed]
- Pappas, R.S.; Fresquez, M.R.; Watson, C.H. Cigarette smoke cadmium breakthrough from traditional filters: Implications for exposure. J. Anal. Toxicol. 2015, 39, 45–51. [Google Scholar] [CrossRef]
- Hill, D.T.; Jandev, V.; Petroni, M.; Atallah-Yunes, N.; Bendinskas, K.; Brann, L.S.; Heffernan, K.; Larsen, D.A.; MacKenzie, J.A.; Palmer, C.D.; et al. Airborne levels of cadmium are correlated with urinary cadmium concentrations among young children living in the New York state city of Syracuse, USA. Environ. Res. 2023, 223, 115450. [Google Scholar] [CrossRef]
- Satarug, S.; Vesey, D.A.; Ruangyuttikarn, W.; Nishijo, M.; Gobe, G.C.; Phelps, K.R. The Source and Pathophysiologic Significance of Excreted Cadmium. Toxics 2019, 7, 55. [Google Scholar] [CrossRef]
- Hayashi, T.; Nogawa, K.; Watanabe, Y.; Kido, T.; Sakurai, M.; Nakagawa, H.; Suwazono, Y. Benchmark Dose of Urinary Cadmium for Assessing Renal Tubular and Glomerular Function in a Cadmium-Polluted Area of Japan. Toxics 2024, 12, 836. [Google Scholar] [CrossRef]
- Satarug, S. : Vesey, D.A.; Đorđević, A.B. The NOAEL equivalent for the cumulative body burden of cadmium: focus on proteinuria as an endpoint. J. Environ. Expo. Assess. 2024, 3, 26. [Google Scholar] [CrossRef]
- Keefe, J.A.; Hwang, S.J.; Huan, T.; Mendelson, M.; Yao, C.; Courchesne, P.; Saleh, M.A.; Madhur, M.S.; Levy, D. Evidence for a causal role of the SH2B3-β2M axis in blood pressure regulation. Hypertension 2019, 73, 497–503. [Google Scholar] [CrossRef]
- Mashima, Y.; Konta, T.; Kudo, K.; Takasaki, S.; Ichikawa, K.; Suzuki, K.; Shibata, Y.; Watanabe, T.; Kato, T.; Kawata, S.; et al. Increases in urinary albumin and beta2-microglobulin are independently associated with blood pressure in the Japanese general population: The Takahata Study. Hypertens. Res. 2011, 34, 831–835. [Google Scholar] [CrossRef]
- Kudo, K.; Konta, T.; Mashima, Y.; Ichikawa, K.; Takasaki, S.; Ikeda, A.; Hoshikawa, M.; Suzuki, K.; Shibata, Y.; Watanabe, T.; et al. The association between renal tubular damage and rapid renal deterioration in the Japanese population: The Takahata study. Clin. Exp. Nephrol. 2011, 15, 235–241. [Google Scholar] [CrossRef] [PubMed]
- Satarug, S.; Vesey, D.A.; Nishijo, M.; Ruangyuttikarn, W.; Gobe, G.C. The inverse association of glomerular function and urinary β2-MG excretion and its implications for cadmium health risk assessment. Environ. Res. 2019, 173, 40–47. [Google Scholar] [CrossRef]
- Ren, F.; Li, M.; Xu, H.; Qin, X.; Teng, Y. Urine albumin-to-creatinine ratio within the normal range and risk of hypertension in the general population: A meta-analysis. J. Clin. Hypertens. (Greenwich) 2021, 23, 1284–1290. [Google Scholar] [CrossRef] [PubMed]
- Romero-González, G.; Rodríguez-Chitiva, N.; Cañameras, C.; Paúl-Martínez, J.; Urrutia-Jou, M.; Troya, M.; Soler-Majoral, J.; Graterol Torres, F.; Sánchez-Bayá, M.; Calabia, J.; et al. Albuminuria, Forgotten No More: Underlining the Emerging Role in CardioRenal Crosstalk. J. Clin. Med. 2024, 13, 777. [Google Scholar] [CrossRef] [PubMed]
- McGill, J.B.; Haller, H.; Roy-Chaudhury, P.; Cherrington, A.; Wada, T.; Wanner, C.; Ji, L.; Rossing, P. Making an impact on kidney disease in people with type 2 diabetes: the importance of screening for albuminuria. BMJ Open Diabetes Res. Care 2022, 10, e002806. [Google Scholar] [CrossRef]
- Okubo, A.; Nakashima, A.; Doi, S.; Doi, T.; Ueno, T.; Maeda, K.; Tamura, R.; Yamane, K.; Masaki, T. High-normal albuminuria is strongly associated with incident chronic kidney disease in a nondiabetic population with normal range of albuminuria and normal kidney function. Clin. Exp. Nephrol. 2020, 24, 435–443. [Google Scholar] [CrossRef]
- Lin, X.; Song, W.; Zhou, Y.; Gao, Y.; Wang, Y.; Wang, Y.; Liu, Y.; Deng, L.; Liao, Y.; Wu, B.; et al. Elevated urine albumin creatinine ratio increases cardiovascular mortality in coronary artery disease patients with or without type 2 diabetes mellitus: a multicenter retrospective study. Cardiovasc. Diabetol. 2023, 22, 203. [Google Scholar] [CrossRef]
- Satarug, S.; Swaddiwudhipong, W.; Ruangyuttikarn, W.; Nishijo, M.; Ruiz, P. Modeling cadmium exposures in low- and high-exposure areas in Thailand. Environ. Health Perspect. 2013, 121, 531–536. [Google Scholar] [CrossRef]
- Yimthiang, S.; Pouyfung, P.; Khamphaya, T.; Kuraeiad, S.; Wongrith, P.; Vesey, D.A.; Gobe, G.C.; Satarug, S. Effects of Environmental Exposure to Cadmium and Lead on the Risks of Diabetes and Kidney Dysfunction. Int. J. Environ. Res. Public Health. 2022, 19, 2259. [Google Scholar] [CrossRef]
- Levey, A.S.; Stevens, L.A.; Scmid, C.H.; Zhang, Y.; Castro, A.F., III; Feldman, H.I.; Kusek, J.W.; Eggers, P.; Van Lente, F.; Greene, T.; et al. A new equation to estimate glomerular filtration rate. Ann. Intern. Med. 2009, 150, 604–612. [Google Scholar] [CrossRef]
- Levey, A.S.; Becker, C.; Inker, L.A. Glomerular filtration rate and albuminuria for detection and staging of acute and chronic kidney disease in adults: a systematic review. JAMA 2015, 313, 837–846. [Google Scholar] [CrossRef]
- White, C.A.; Allen, C.M.; Akbari, A.; Collier, C.P.; Holland, D.C.; Day, A.G.; Knoll, G.A. Comparison of the new and traditional CKD-EPI GFR estimation equations with urinary inulin clearance: A study of equation performance. Clin. Chim. Acta 2019, 488, 189–195. [Google Scholar] [CrossRef] [PubMed]
- Phelps, K.R.; Gosmanova, E.O. A generic method for analysis of plasma concentrations. Clin. Nephrol. 2020, 94, 43–49. [Google Scholar] [CrossRef]
- Grandjean, P.; Budtz-Jørgensen, E. Total imprecision of exposure biomarkers: implications for calculating exposure limits. Am. J. Ind. Med. 2007, 50, 712–719. [Google Scholar] [CrossRef] [PubMed]
- Satarug, S. Is Chronic Kidney Disease Due to Cadmium Exposure Inevitable and Can It Be Reversed? Biomedicines 2024, 12, 718. [Google Scholar] [CrossRef] [PubMed]
- MacKinnon, D.P.; Warsi, G.; Dwyer, J.H. A simulation study of mediated effect measures. Multiv. Behav. Res. 1995, 30, 41–62. [Google Scholar] [CrossRef]
- Preacher, K.J.; Hayes, A.F. SPSS and SAS procedures for estimating indirect effects in simple mediation models. Behav. Res. Meth. Instrum. Comput. 2004, 36, 717–731. [Google Scholar] [CrossRef]
- Preacher, K.J. Advances in mediation analysis: A survey and synthesis of new developments. Annu. Rev. Psychol. 2015, 66, 825–852. [Google Scholar] [CrossRef]
- Shi, P.; Yan, H.; Fan, X.; Xi, S. A benchmark dose analysis for urinary cadmium and type 2 diabetes mellitus. Environ. Pollut. 2021, 273, 116519. [Google Scholar] [CrossRef]
- Lee, J.; Oh, S.; Kang, H.; Kim, S.; Lee, G.; Li, L.; Kim, C.T.; An, J.N.; Oh, Y.K.; Lim, C.S.; et al. Environment-wide association study of CKD. Clin. J. Am. Soc. Nephrol. 2020, 15, 766–775. [Google Scholar]
- Tsai, H.J.; Hung, C.H.; Wang, C.W.; Tu, H.P.; Li, C.H.; Tsai, C.C.; Lin, W.Y.; Chen, S.C.; Kuo, C.H. Associations among heavy metals and proteinuria and chronic kidney disease. Diagnostics 2021, 11, 282. [Google Scholar] [CrossRef] [PubMed]
- Reckelhoff, J.F. Gender differences in the regulation of blood pressure. Hypertension 2001, 37, 1199–1208. [Google Scholar] [CrossRef] [PubMed]
- Reckelhoff, J.F. Mechanisms of sex and gender differences in hypertension. J. Hum. Hypertens. 2023, 37, 596–601. [Google Scholar] [CrossRef] [PubMed]
- Connelly, P.J.; Currie, G.; Delles, C. Sex differences in the prevalence, outcomes and management of hypertension. Curr. Hypertens. Rep. 2022, 24, 185–192. [Google Scholar] [CrossRef]
- Nagata, C.; Nagao, Y.; Shibuya, C.; Kashiki, Y.; Shimizu, H. Urinary cadmium and serum levels of estrogens and androgens in postmenopausal Japanese women. Cancer Epidemiol. Biomarkers Prev. 2005, 14, 705–708. [Google Scholar] [CrossRef]
- Nagata, C.; Konishi, K.; Goto, Y.; Tamura, T.; Wada, K.; Hayashi, M.; Takeda, N.; Yasuda, K. Associations of urinary cadmium with circulating sex hormone levels in pre- and postmenopausal Japanese women. Environ. Res. 2016, 150, 82–87. [Google Scholar] [CrossRef]
- Ali. I.; Engström, A.; Vahter, M.; Skerfving, S.; Lundh, T.; Lidfeldt, J.; Samsioe, G.; Halldin, K.; Åkesson, A. Associations between cadmium exposure and circulating levels of sex hormones in postmenopausal women. Environ. Res. 2014, 134, 265–269. [Google Scholar] [CrossRef]
- Bochud, M.; Jenny-Burri, J.; Pruijm, M.; Ponte, B.; Guessous, I.; Ehret, G.; Petrovic, D.; Dudler, V.; Haldimann, M.; Escher, G.; et al. Urinary Cadmium Excretion Is Associated with Increased Synthesis of Cortico- and Sex Steroids in a Population Study. J. Clin. Endocrinol. Metab. 2018, 103, 748–758. [Google Scholar] [CrossRef]
- Satarug, S.; Vesey, D.A.; Yimthiang, S.; Khamphaya, T.; Pouyfung, P.; Đorđević, A.B. Environmental Cadmium Exposure Induces an Increase in Systolic Blood Pressure by Its Effect on GFR. Stresses 2024, 4, 436–451. [Google Scholar] [CrossRef]
- Hagedoorn, I.J.M.; Gant, C.M.; Huizen, S.V.; Maatman, R.G.H.J.; Navis, G.; Bakker, S.J.L.; Laverman, G.D. Lifestyle-related exposure to cadmium and lead is associated with diabetic kidney disease. J. Clin. Med. 2020, 9, 2432. [Google Scholar] [CrossRef]
- Oosterwijk, M.M.; Hagedoorn, I.J.M.; Maatman, R.G.H.J.; Bakker, S.J.L.; Navis, G.; Laverman, G.D. Cadmium, active smoking and renal function deterioration in patients with type 2 diabetes. Nephrol. Dial. Transplant. 2023, 38, 876–883. [Google Scholar] [CrossRef]
Figure 1.
Dose-response relationship of albumin excretion rate, cadmium excretion rate and blood pressure. Scatterplots relate log[(Ealb/Ccr) × 104) to Log[(ECd/Ccr) × 105] in women and men who had low- (a) and high-Cd burden (b). Scatterplots relate log[(Ealb/Ccr) × 104) to systolic blood pressure (c) and diastolic blood pressure (d) in women and men with low- or high-Cd burdens. Coefficients of determination (R2) and p-values and numbers of subjects are provided. The low-, and high-Cd burdens were defined as ECd/Ccr < 0.01 and ≥ 0.01 µg/L filtrate, respectively.
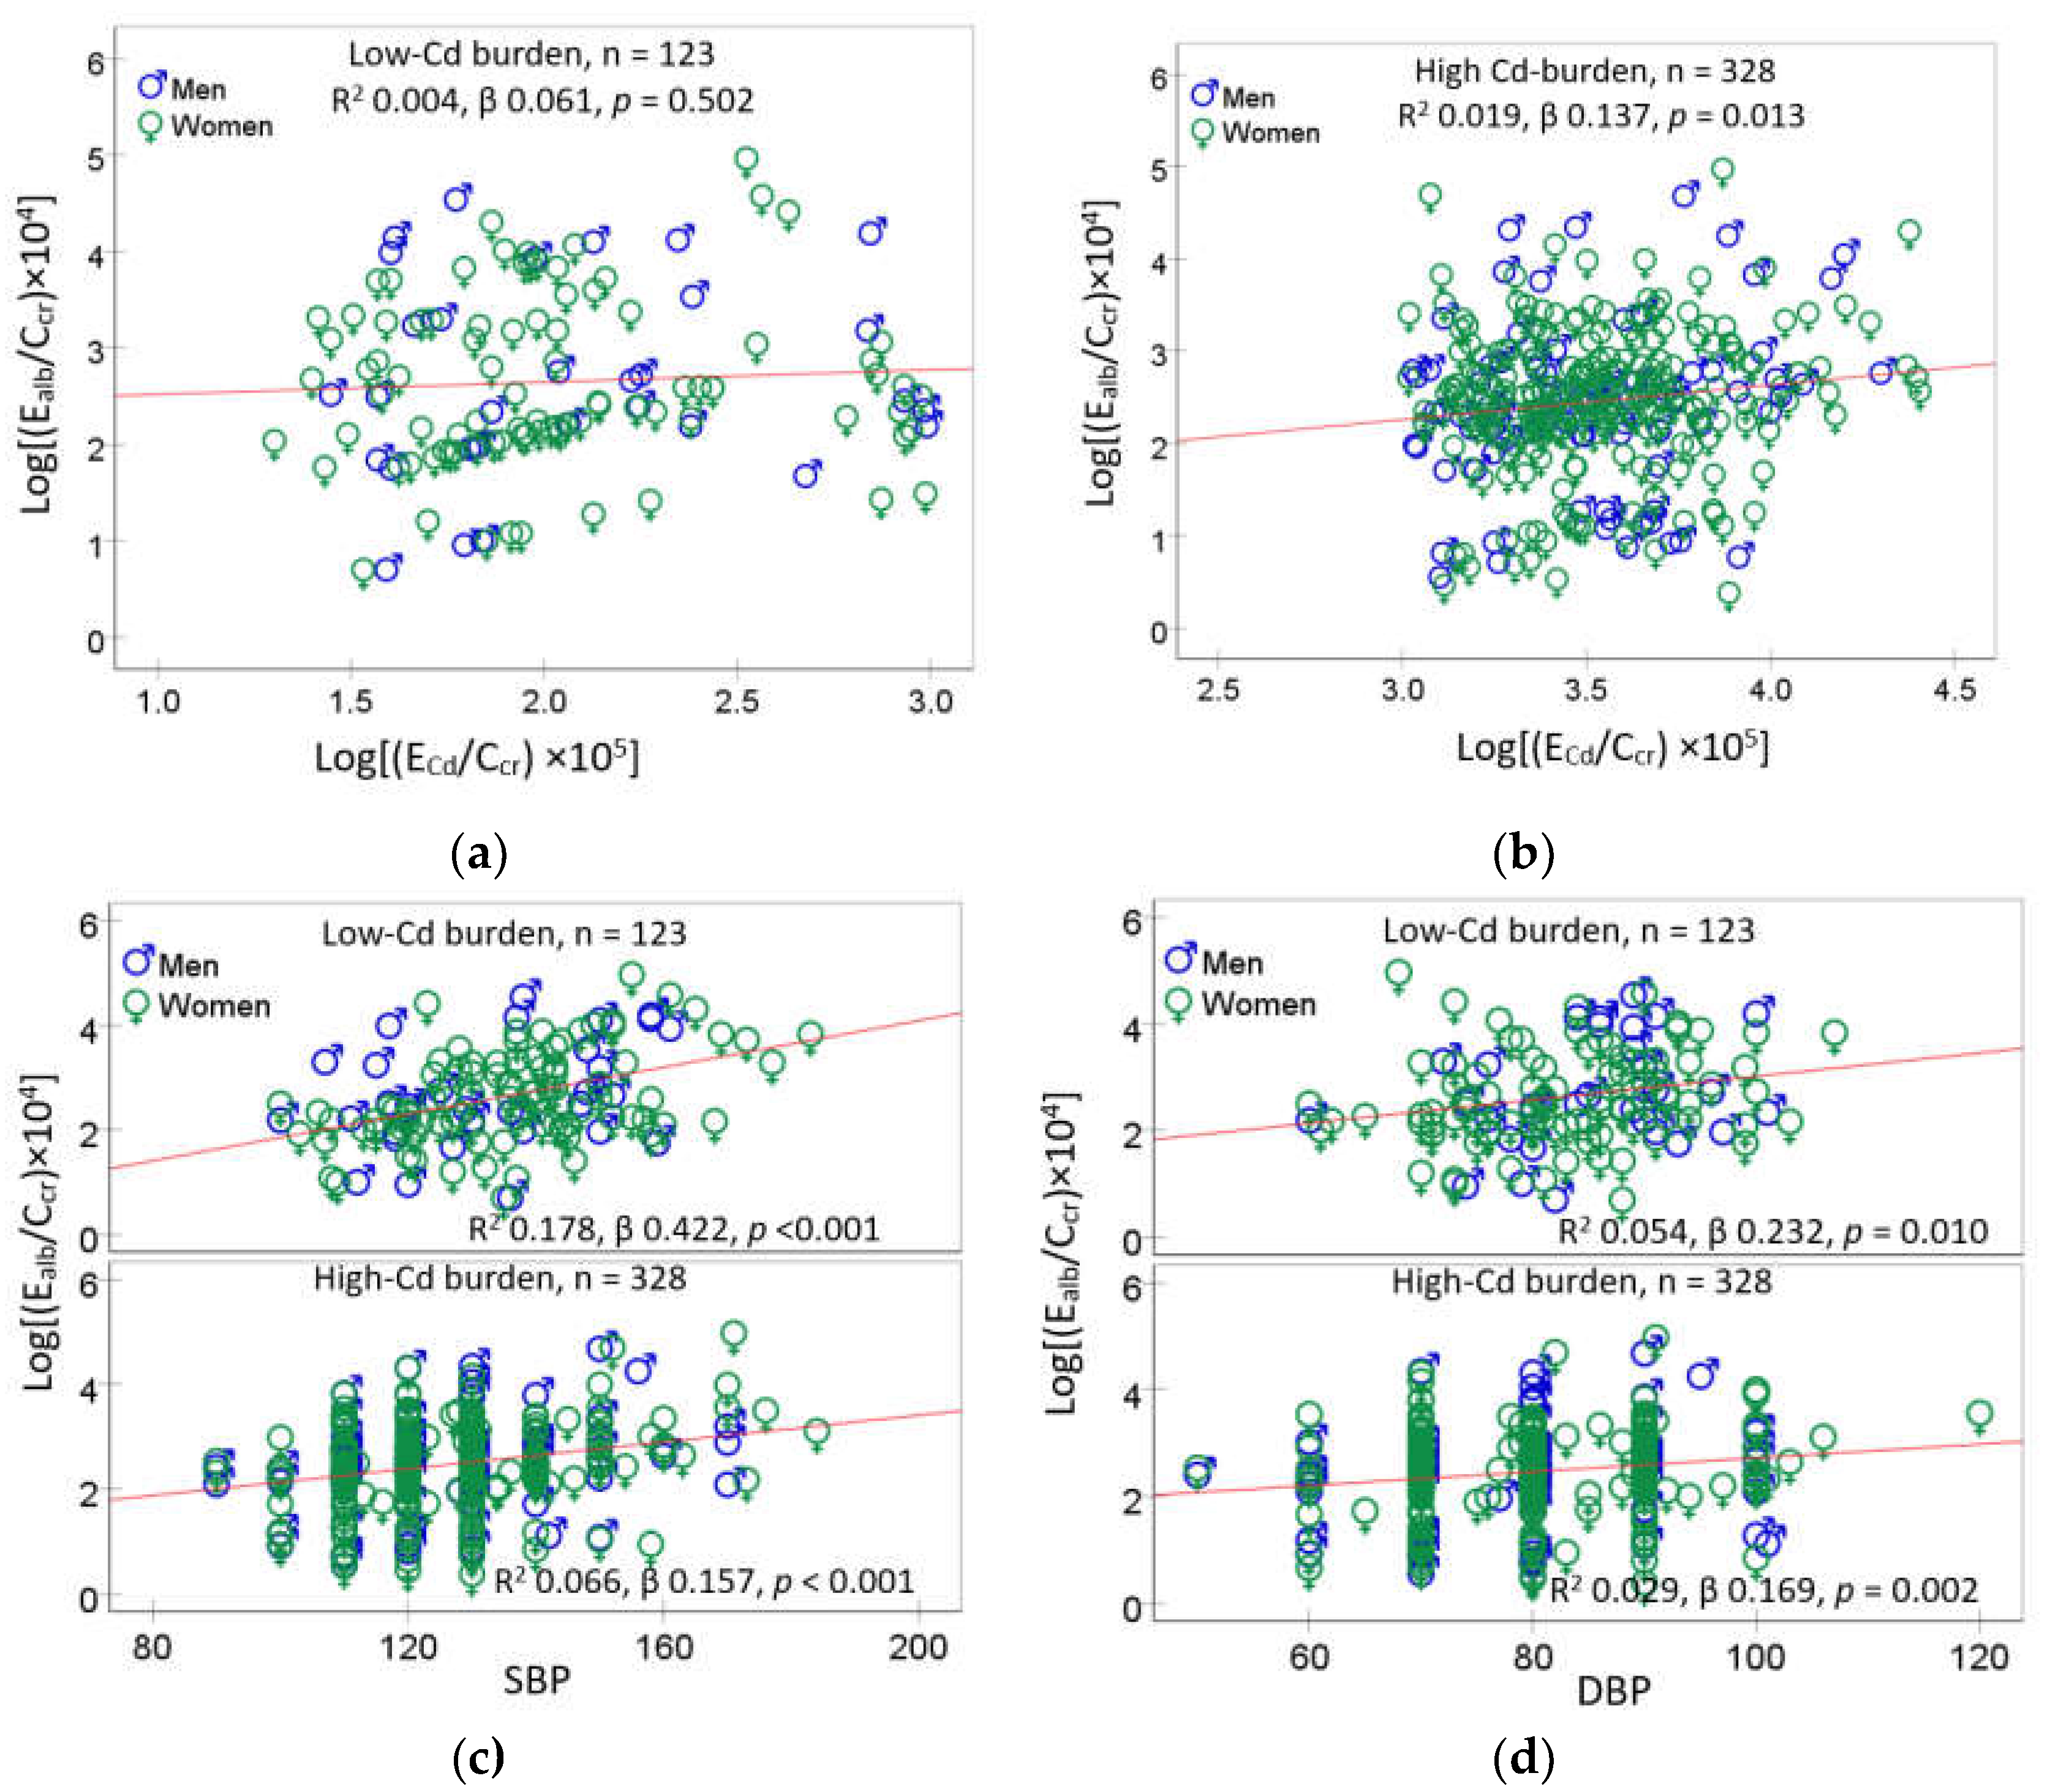
Figure 2.
Quantification of effects of blood pressure and eGFR levels on albumin excretion rate. Scatterplots relate log[(Ealb/Ccr) × 104] to SBP (a) and DBP (b) in subjects with eGFR ≤ 60, 61−90 and ≥ 90 mL/min/1.73 m2. Coefficients of determination (R2) and p-values and numbers of subjects are provided. Bar graphs represent mean log[(Ealb/Ccr) × 104] in eGFR subgroups with SBP ≥ 130 mmHg (c) and DBP ≥ 80 mmHg (d). SBP of 130 mmHg and DBP 80 mmHg were median SBP and DBP values, respectively. All means were adjusted for covariates (age, BMI, ECd/Ccr) and the interaction of smoking × hypertension × diabetes.
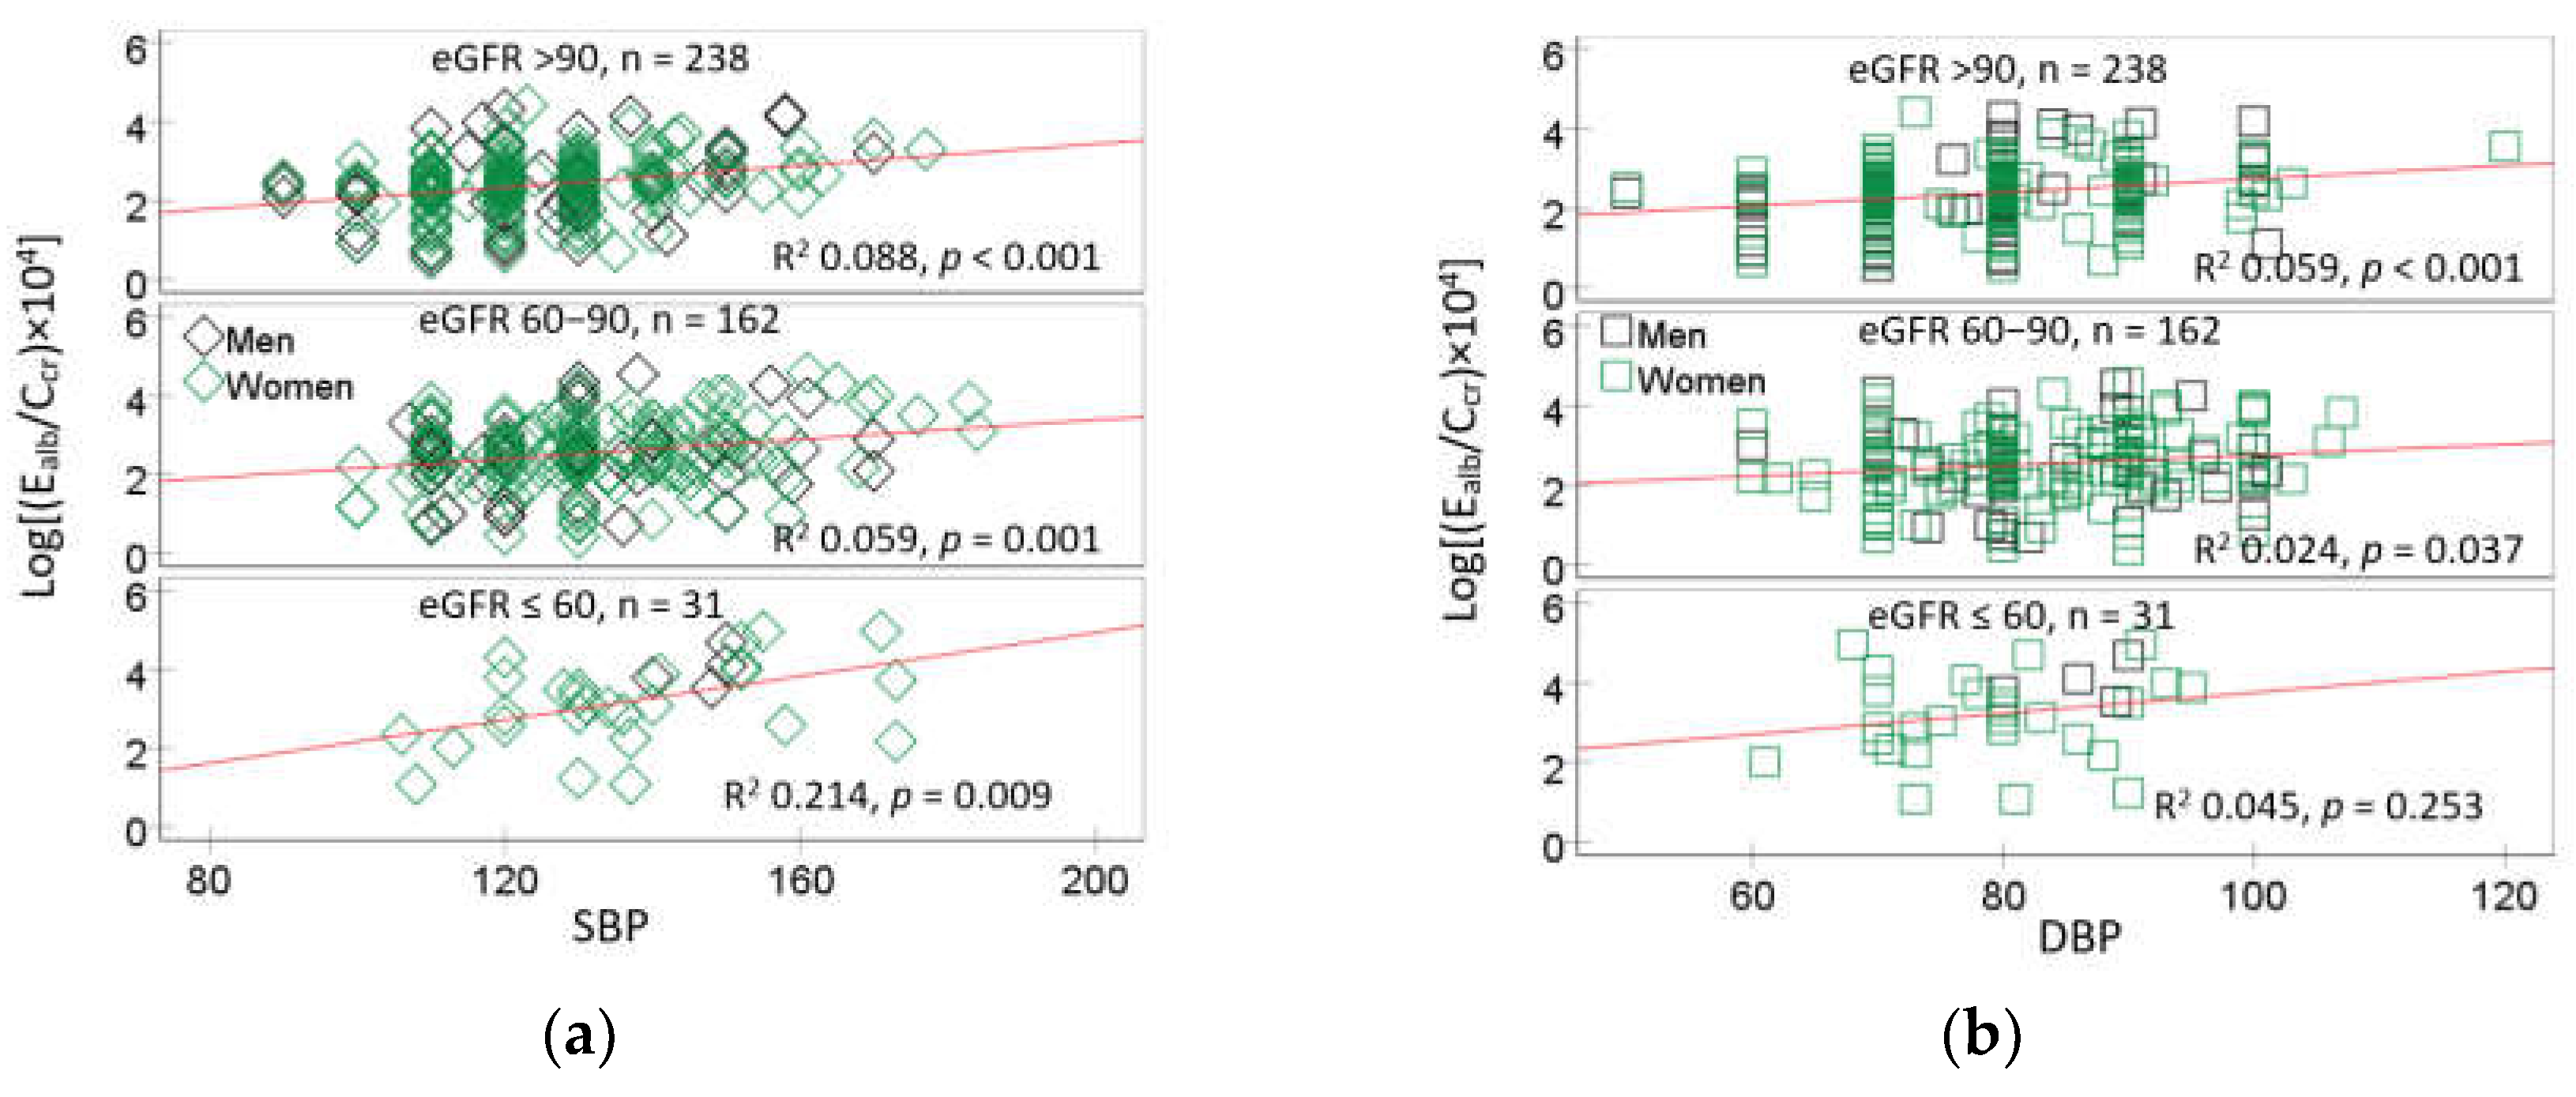
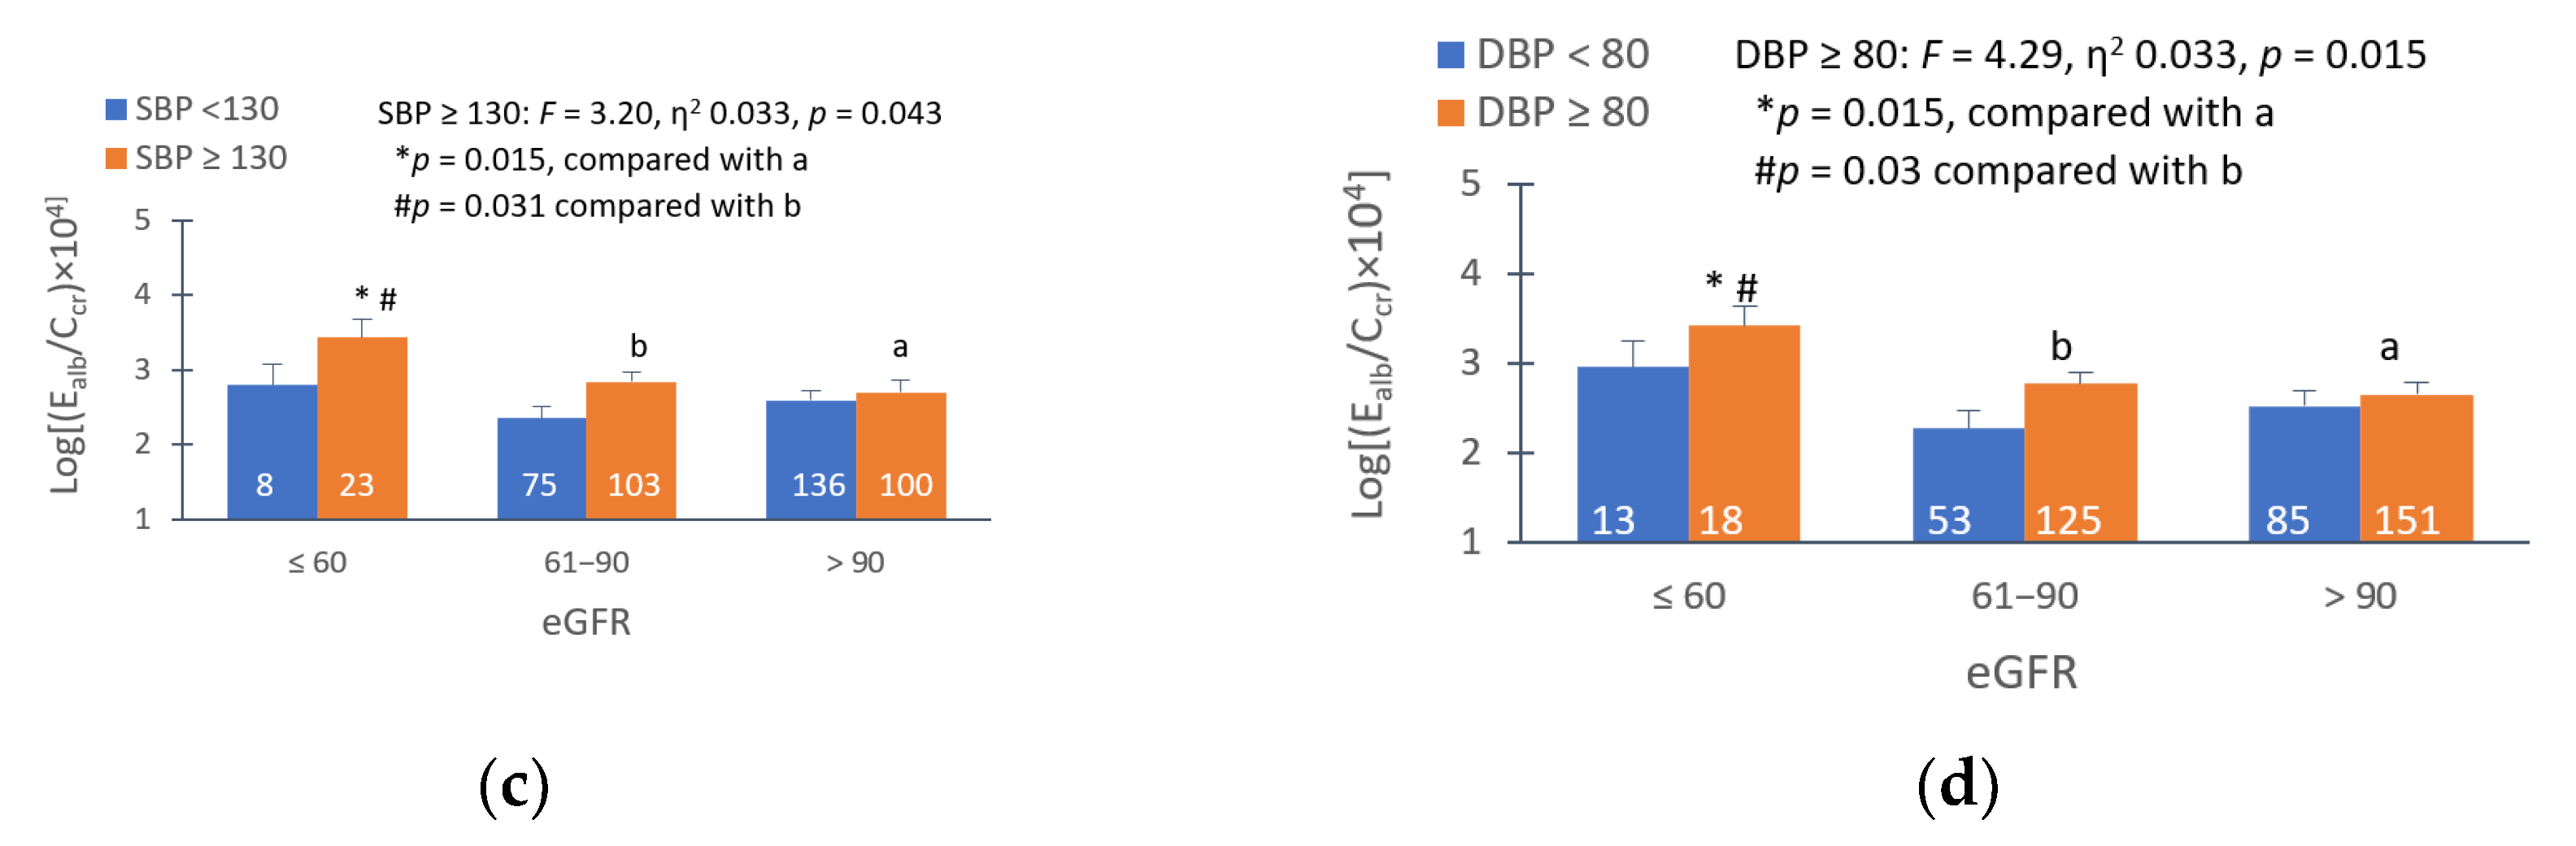
Figure 3.
Analysis of eGFR as the mediator of cadmium-induced blood pressure increment. A model depicts eGFR as the mediator of Cd effect on systolic blood pressure (a) and diastolic blood pressure (b), the Sobel test for an indirect effect of Cd on SBP (c) and DBP (d).
Figure 3.
Analysis of eGFR as the mediator of cadmium-induced blood pressure increment. A model depicts eGFR as the mediator of Cd effect on systolic blood pressure (a) and diastolic blood pressure (b), the Sobel test for an indirect effect of Cd on SBP (c) and DBP (d).
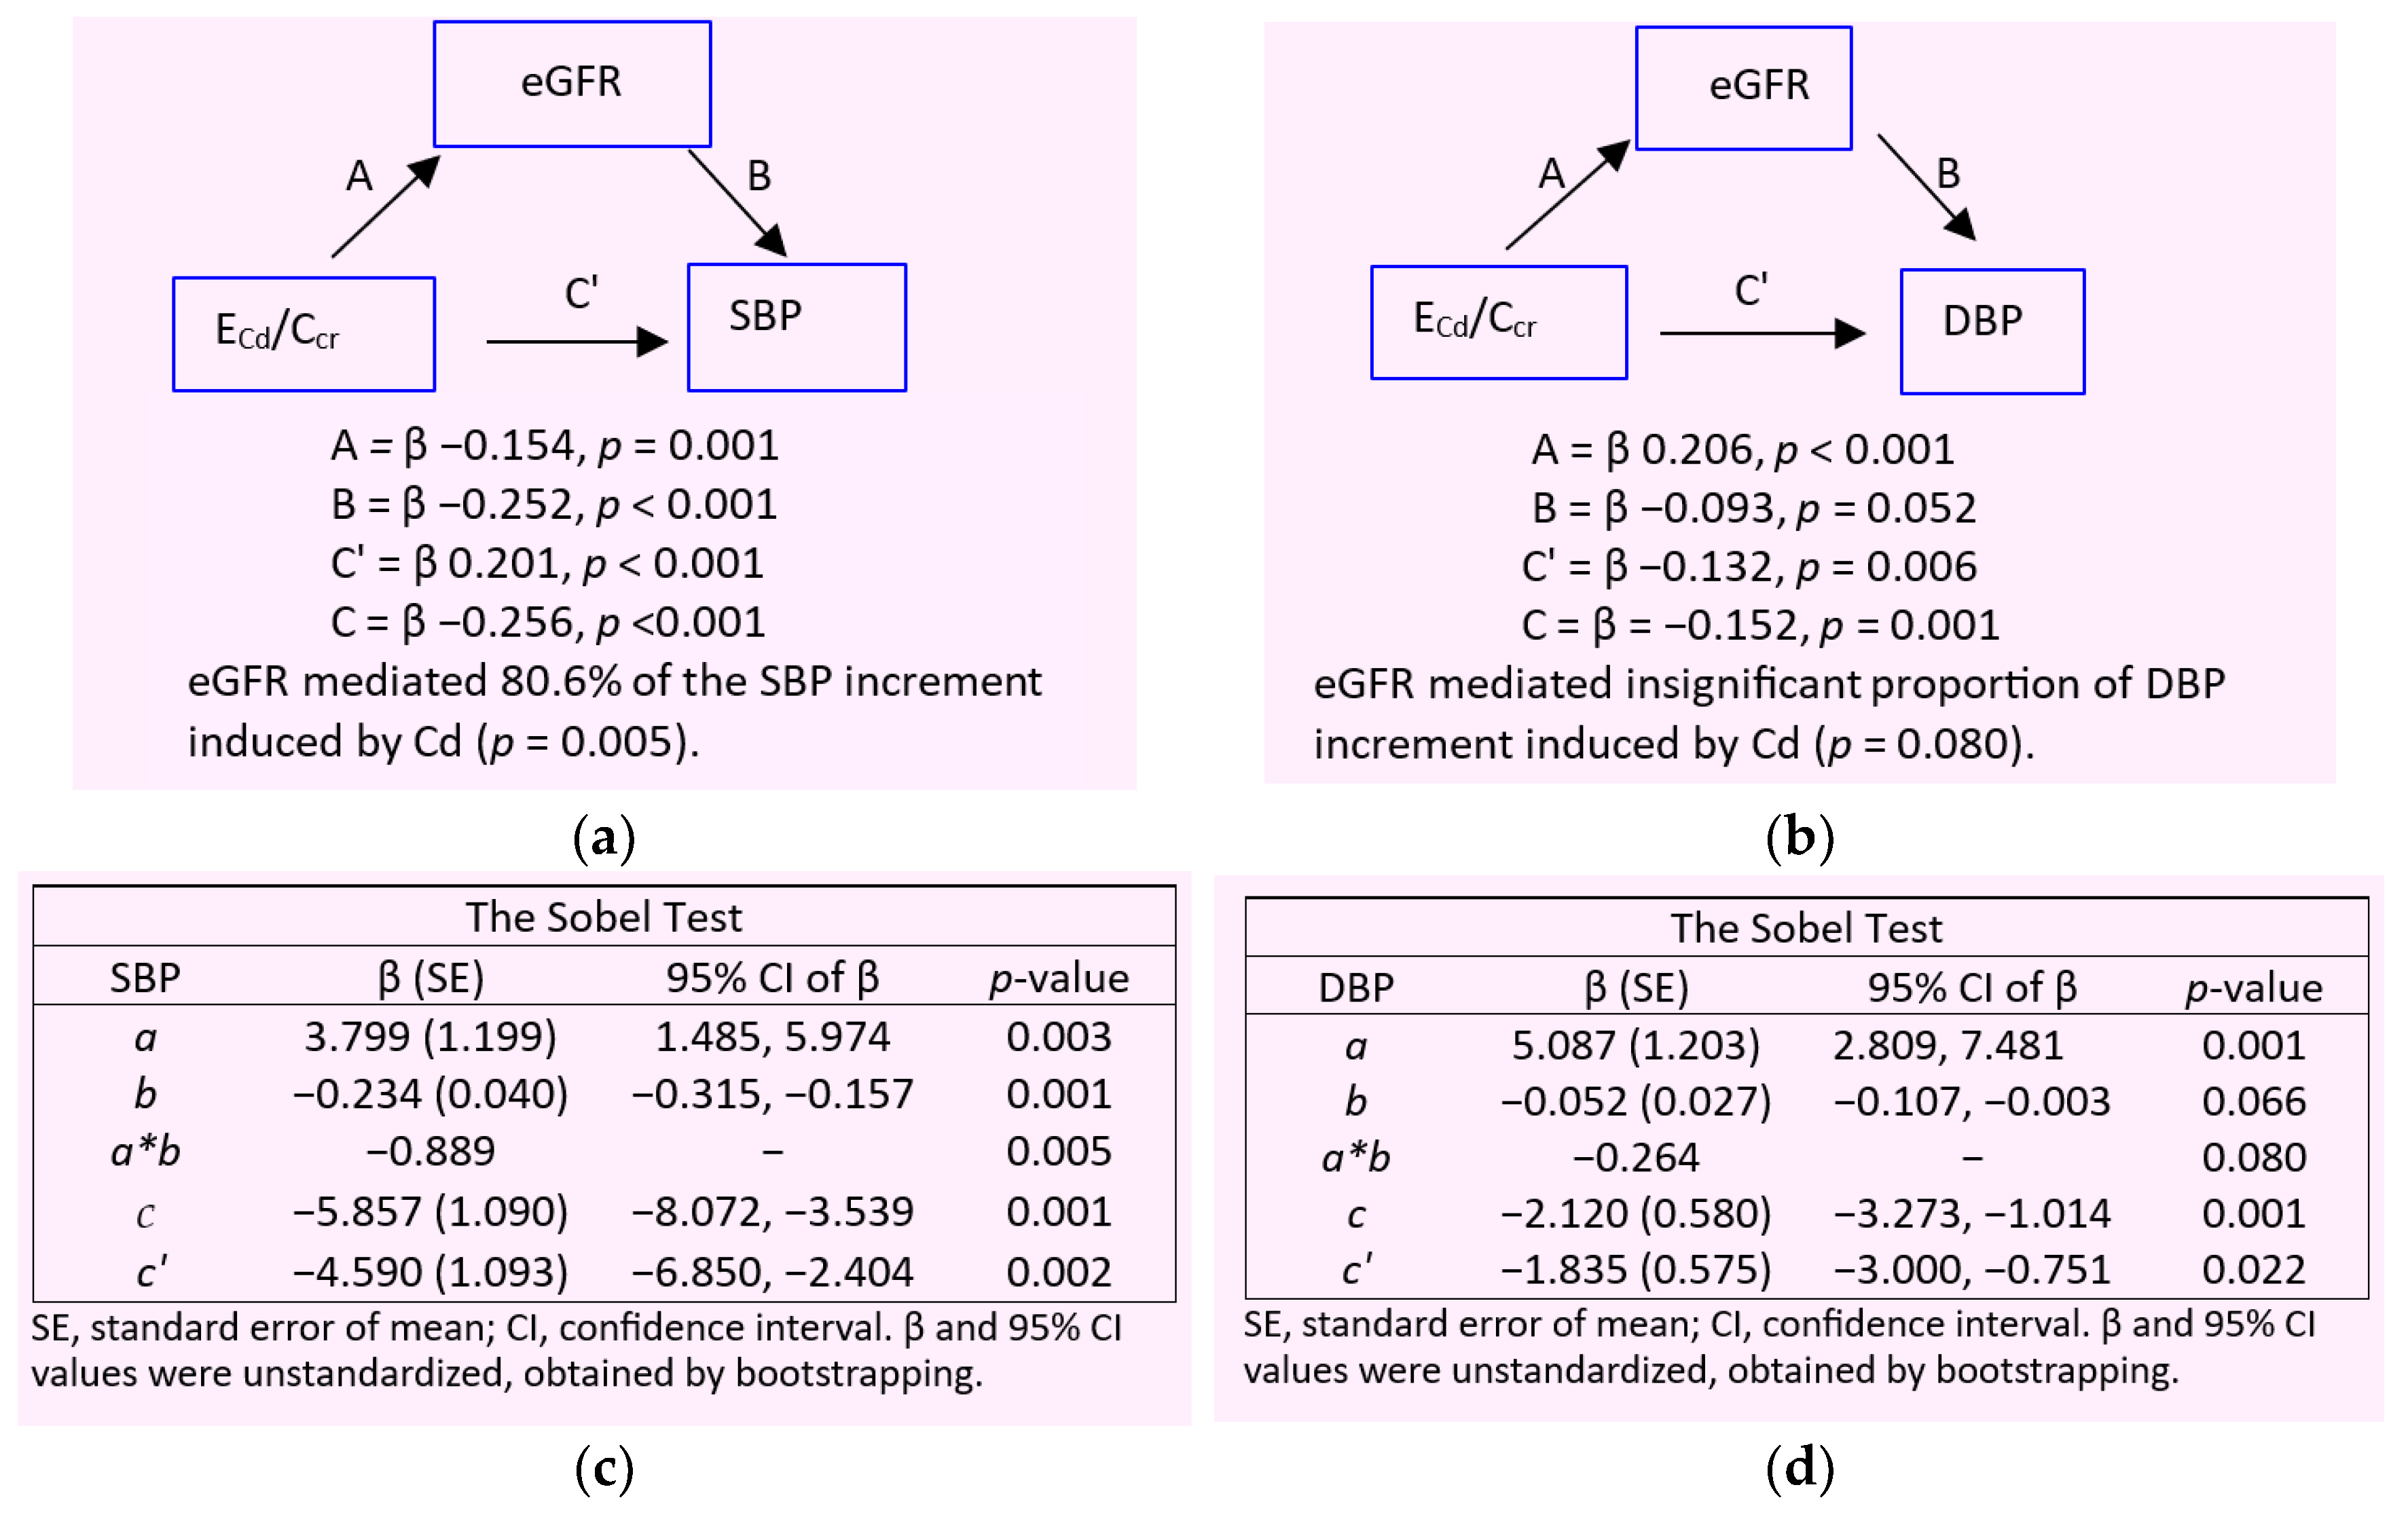
Figure 4.
Rising systolic blood pressure as the mediator of an elevation of albumin excretion induced by cadmium. A model depicts SBP (a) and DBP (b) as the mediator of Cd effect on albumin excretion rate, the Sobel test for an indirect effect of SBP (c) and DBP (d) on albumin excretion rate.
Figure 4.
Rising systolic blood pressure as the mediator of an elevation of albumin excretion induced by cadmium. A model depicts SBP (a) and DBP (b) as the mediator of Cd effect on albumin excretion rate, the Sobel test for an indirect effect of SBP (c) and DBP (d) on albumin excretion rate.
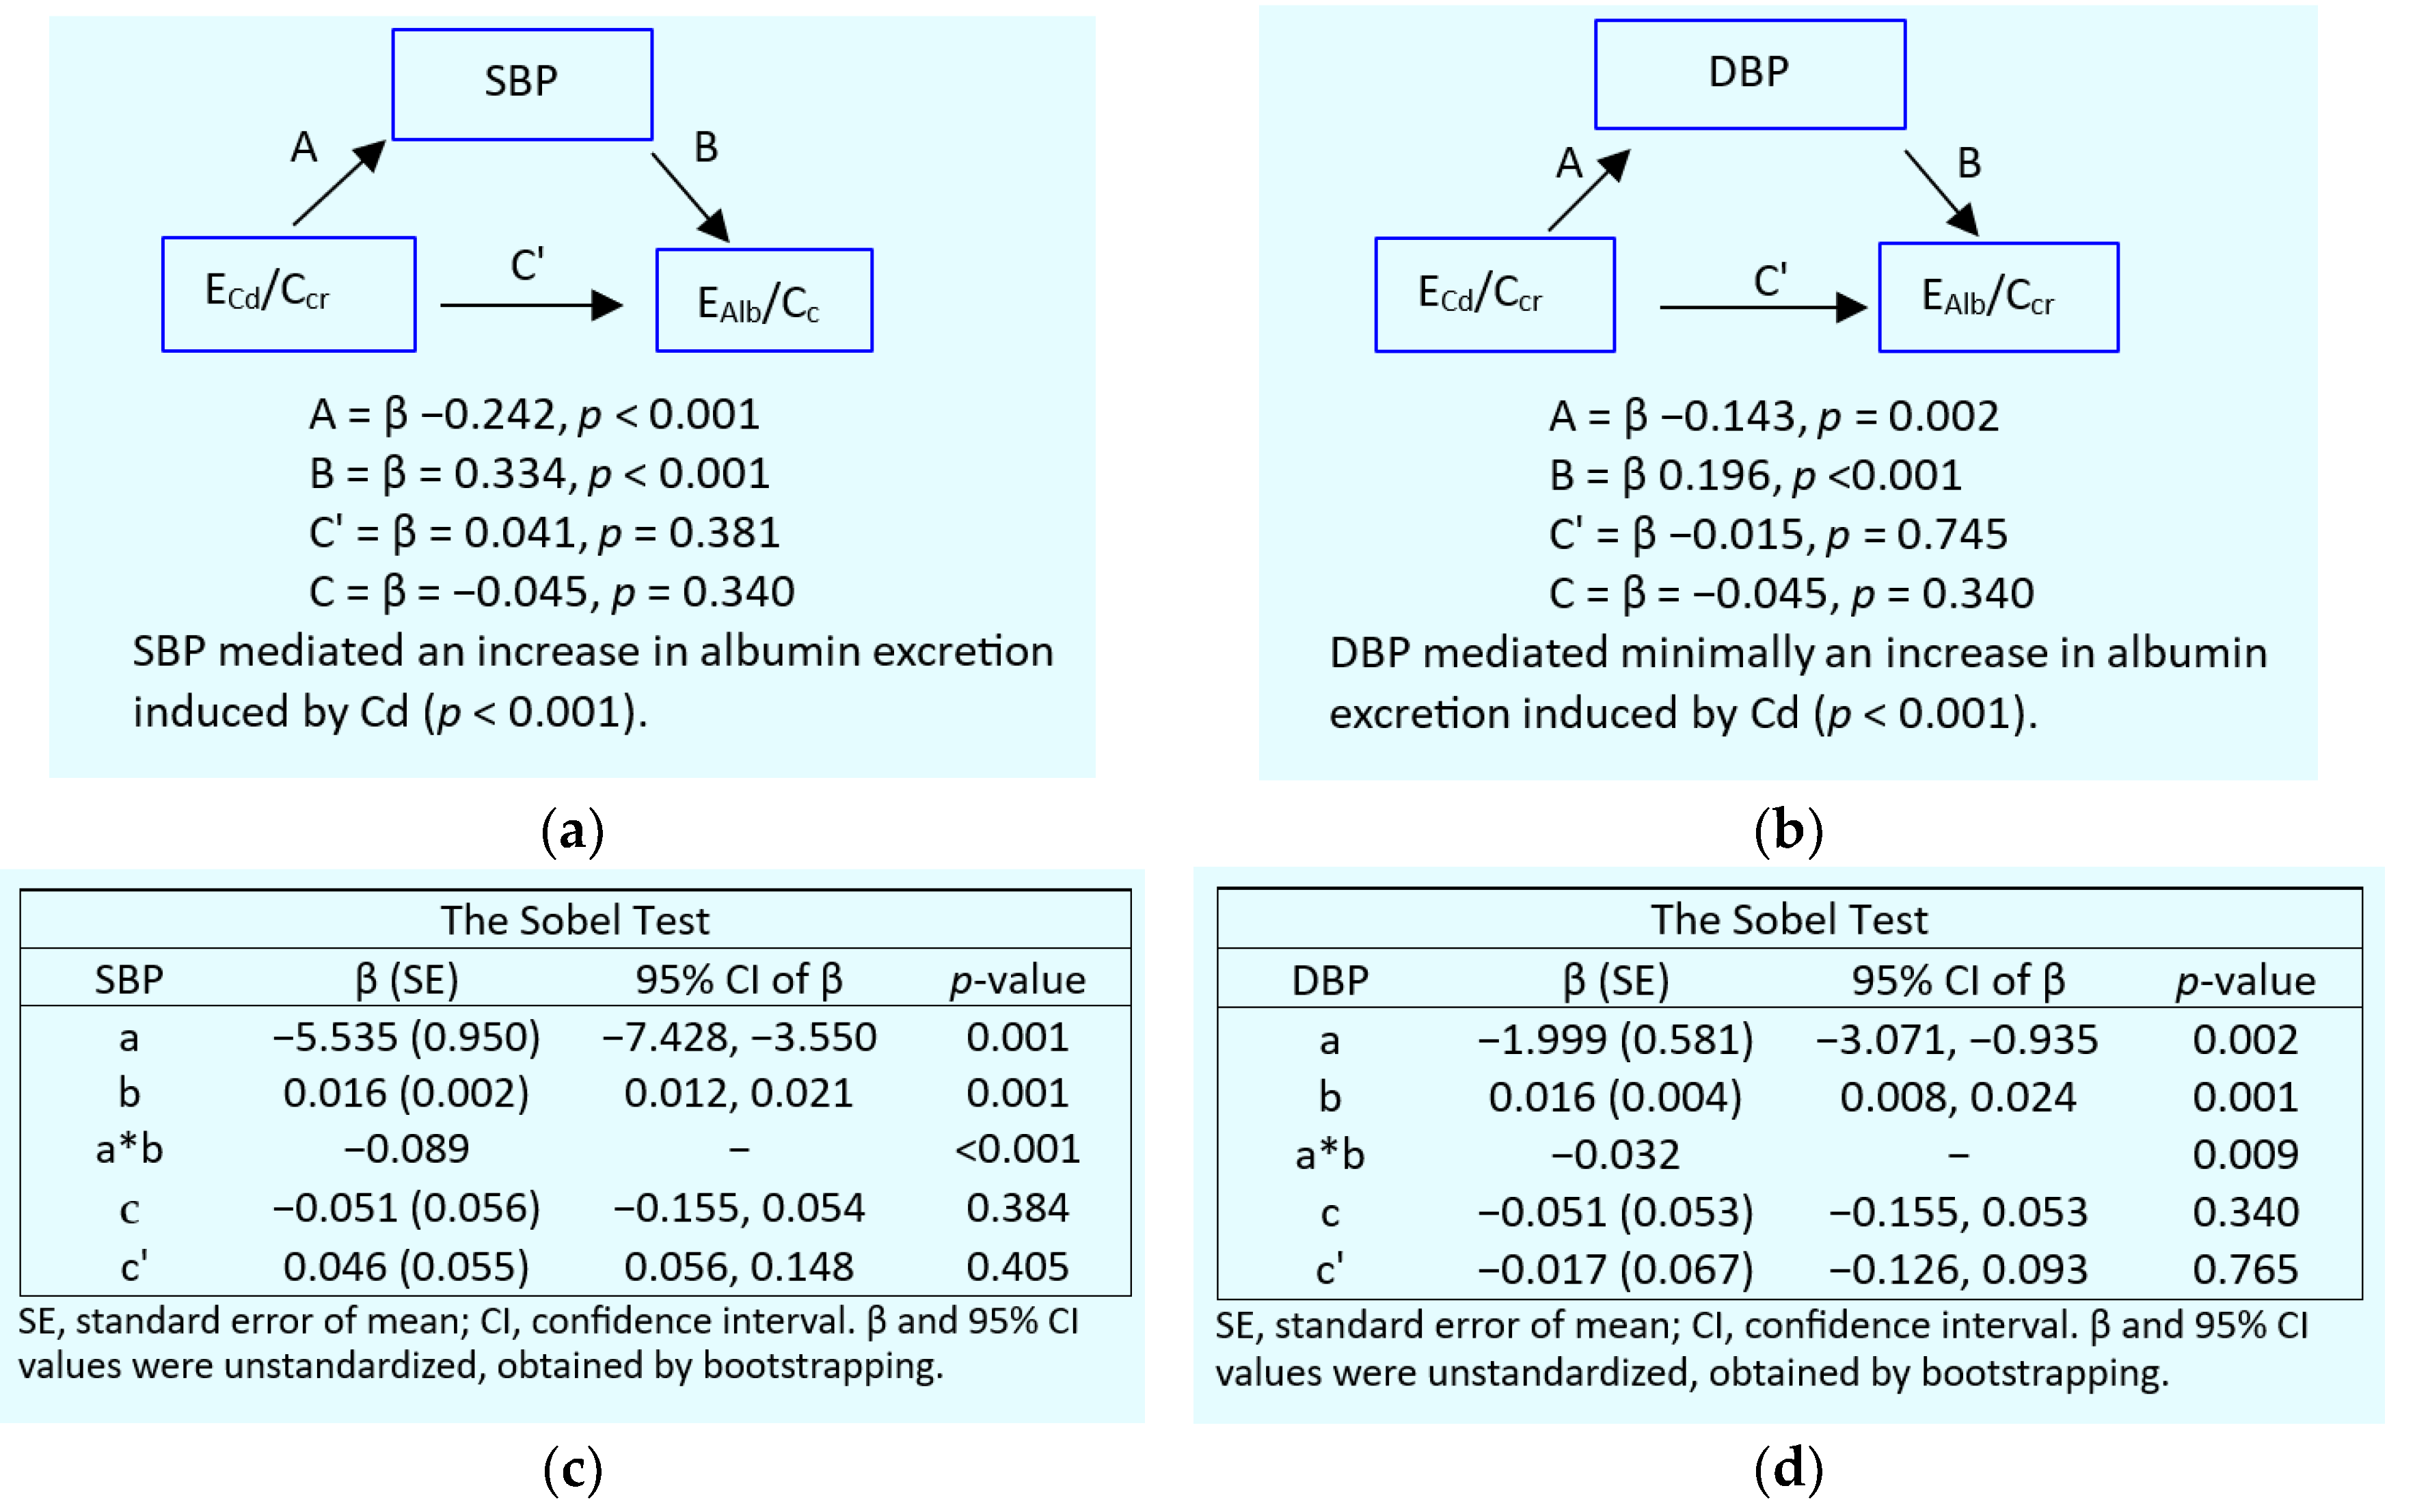

Table 1.
Descriptive characteristics of cohort participants according to β2-microglobulin excretion rates.
Table 1.
Descriptive characteristics of cohort participants according to β2-microglobulin excretion rates.
| Parameters | All n = 641 |
Eβ2M/Ccr, µg/L filtrate | |||
|---|---|---|---|---|---|
| < 1.0, n = 442 | 1.0 − 2.9, n = 69 | 3.0 − 9.9, n = 61 | ≥ 10, n = 61 | ||
| Age, years | 47.5 (10.6) | 44.2 (8.9) | 51.1 (9.1) | 55.5 (10.9) | 58.4 (9.8) *** |
| Age range, years | 16 − 80 | 16 − 69 | 21 − 75 | 31 − 80 | 42 − 79 |
| BMI, kg/m2 | 24.4 (4.0) | 24.2 (3.7) | 24.7 (5.2) | 24.8 (4.1) | 24.8 (4.2) |
| % BMI ≥ 30 kg/m2 (obese) | 6.3 | 5.0 | 10.4 | 7.2 | 10.0 |
| eGFR a, mL/min/1.73 m2 | 95 (19) | 101 (15) | 93 (14) | 83 (16) | 67 (18) *** |
| % Low eGFR (CKD) | 4.8 | 0.7 | 1.4 | 5.8 | 37.7 *** |
| % Women | 66.9 | 63.8 | 71.1 | 72.5 | 78.7 |
| % Hypertension | 39.8 | 34.4 | 42.2 | 52.2 | 62.3 *** |
| % Smoking | 29.0 | 31.0 | 30.4 | 15.9 | 27.9 |
| % Diabetes | 10.8 | 0.9 | 14.7 | 29.0 | 54.7 *** |
| Systolic blood pressure, mmHg | 126 (16) | 122 (13) | 129 (16) | 135 (18) | 140 (18) *** |
| Diastolic blood pressure, mmHg | 80 (10) | 78.4 (9.2) | 82.8 (10.6) | 84 (10) | 84 (9) *** |
| Normalized to Ecr (Ex/Ecr) | |||||
| ECd/Ecr, µg/g creatinine | 2.98 (4.01) | 3.00 (3.73) | 3.43 (4.35) | 2.35 (4.24) | 3.06 (5.17) *** |
| Eβ2M/Ecr, µg/g creatinine | 516 (2153) | 37 (36) | 221 (74) | 697 (274) | 4124 (5854) *** |
| Ealb/Ecr, mg/g creatinine (ACR) | 22 (65) | 12 (31) | 14 (25) | 22 (51) | 74 (147) *** |
| % Albuminuria b | 14.9 | 9.4 | 13.3 | 17,2 | 38.3 *** |
| Normalized to Ccr, (Ex/Ccr) c | |||||
| (ECd/Ccr) ×100, µg/L filtrate | 2.37 (3.35) | 2.27 (2.84) | 2.67 (3.84) | 2.01 (3.52) | 3.17 (5.34) ** |
| (Eβ2M/Ccr) ×100, µg/L filtrate | 556 (2857) | 27 (26) | 170 (52) | 587 (204) | 4789 (8159) *** |
| (Ealb/Ccr) ×100, µg/L filtrate | 22 (79) | 9 (25) | 11 (22) | 20 (50) | 88 (191) *** |
| % (Ealb/Ccr) ×100 ≥ 20 µg/L filtrate | 16.5 | 9.8 | 11.7 | 21.9 | 45.0 *** |
n, number of subjects; BMI, body mass index; eGFR, estimated glomerular filtration rate; cr, creatinine; alb, albumin; Cd, cadmium; ACR, albumin-to-creatinine ratio. a eGFR was determined using equations of the Chronic Kidney Disease Epidemiology Collaboration (CKD−EPI). b Albuminuria was defied as ACR ≥ 20 and ≥ 30 mg/g creatinine in men and women, respectively. c ECd/Ccr = [Cd]u[cr]p/[cr]u. Data for BMI and urinary albumin were from 617, and 451 subjects, respectively. All other data were from 641 subjects. Continuous variables are expressed as arithmetic mean and standard deviation (SD) values. For all tests, p ≤ 0.05 identifies statistical significance, determined with the Pearson Chi-Square test for differences in percentages and the Kruskal-Wallis test for differences of means among Eβ2M/Ccr groups. ***p < 0.001; **p = 0.003.
Table 2.
Prevalence odds ratios for three adverse outcomes in relation to cadmium body burden and other independent variables.
Table 2.
Prevalence odds ratios for three adverse outcomes in relation to cadmium body burden and other independent variables.
| Independent Variables/Factors | CKD a | Hypertension | Tubular dysfunction c | |||
|---|---|---|---|---|---|---|
| POR (95% CI) | p | POR (95% CI) | p | POR (95% CI) | p | |
| Age, years | 1.156 (1.096, 1.218) | <0.001 | 1.059 (1.041, 1.078) | <0.001 | 1.112 (1.075, 1.149) | <0.001 |
| BMI, kg/m2 | 1.027 (0.930, 1.135) | 0.599 | 1.120 (1.071, 1.171) | <0.001 | 0.962 (0.898, 1.031) | 0.273 |
| Log2[(ECd/Ccr) ×105], µg/L filrate | 3.517 (1.754, 7.051) | <0.001 | 1.218 (1.124, 1.319) | <0.001 | 1.037 (0.917, 1.173) | 0.567 |
| Gender | 0.532 (0.150, 1.887) | 0.329 | 1.462 (0.964, 2.215) | 0.074 | 1.321 (0.617, 2.571) | 0.413 |
| Smoking | 0.708 (0.226, 2.215) | 0.553 | 1.477 (0.959, 2.274) | 0.077 | 1.163 (0.585, 2.315) | 0.667 |
| Diabetes | 4.839 (1.725, 13.58) | 0.003 | 2.008 (1.072, 3.726) | 0.030 | 16.12 (7.219, 36.02) | <0.001 |
| Hypertension | 1.152 (0.497, 2.669) | 0.742 | − | − | 1.556 (0.924, 2.622) | 0.097 |
| CKD b | − | − | 0.877 (0.393, 1.958) | 0.750 | 17.67 (5.155, 60.56) | <0.001 |
CKD, chronic kidney disease; POR, prevalence odds ratio; CI, confidence interval; BMI, body mass index. a CKD was defined as eGFR ≤ 60 mL/min/1.73 m2. b Tubular dysfunction was indicated by Eβ2M/Ccr ≥ 3.0 µg/L filtrate. For all tests, p-values ≤ 0.05 indicate a statistically significant association between an individual independent variable and the POR for CKD, hypertension, or tubular proteinuria.
Table 3.
Hypertension as the key determinant of albuminuria.
| Independent Variables/Factors | Albuminuria a | |||||
|---|---|---|---|---|---|---|
| All, n = 445 | Normotension, n = 229 | Hypertension, n = 216 | ||||
| POR (95% CI) | p | POR (95% CI) | p | POR (95% CI) | p | |
| Age, years | 1.000 (0.962, 1.039) | 0.988 | 1.004 (0.942, 1.069) | 0.913 | 0.991 (0.940, 1.045) | 0.739 |
| Log2[(ECdCcr)×105], µg/L filtrate | 1.042 (0.905, 1.199) | 0.571 | 0.940 (0.750, 1.179) | 0.593 | 1.088 (0.894, 1.325) | 0.401 |
| Obese | 1.346 (0.525, 3.453) | 0.536 | 1.545 (0.277, 8.626) | 0.620 | 0.930 (0.269, 3.215) | 0.909 |
| CKD | 3.312 (1.272, 8.623) | 0.014 | 3.766 (0.626, 22.65) | 0.147 | 4.293 (1.072, 17.19) | 0.040 |
| Diabetes | 3.603 (1.559, 8.326) | 0.003 | 1.913 (0.397, 9.216) | 0.419 | 5.376 (1.795, 16.10) | 0.003 |
| Gender | 1.458 (0.715, 2.972) | 0.299 | 1.944 (0.690, 5.475) | 0.208 | 0.869 (0.304, 2.483) | 0.793 |
| Smoking | 0.835 (0.400, 1.743) | 0.630 | 0.812 (0.274, 2.409) | 0.708 | 0.776 (0.259, 2.328) | 0.651 |
| Tubular dysfunction b | ||||||
| Moderate | Referent | |||||
| Severe | 1.827 (0.822, 4.062) | 0.139 | 0.866 (0.213, 3.517) | 0.840 | 2.946 (1.038, 8.358) | 0.042 |
| Extremely severe | 2.428 (0.983, 5.997) | 0.054 | 0.655 (0.092, 4.671) | 0.673 | 4.167 (1.250, 13.90) | 0.020 |
POR, prevalence odds ratio; CI, confidence interval; BMI, body mass index. a Albuminuria was defined as Ealb/Ccr ≥ 0.2 mg/L filtrate in both men and women. b Moderate, severe, and extremely severe dysfunction were indicated by Eβ2M/Ccr <3, 3.0−9.9 and ≥ 10 µg/L filtrate. For all tests, p-values ≤ 0.05 indicate a statistically significant association between an individual independent variable and the POR for albuminuria.
Table 4.
Multiple linear regression analysis to define predictors of albumin excretion.
| Independent Variables/Factors |
Log[(Ealb/Ccr)×104], µg/L filtrate | |||||
|---|---|---|---|---|---|---|
| All, n = 451 | Women, n = 336 | Men, n = 115 | ||||
| β | p | β | p | β | p | |
| Model 1: SBP | ||||||
| Age, years | −0.075 | 0.217 | −0.047 | 0.502 | −0.135 | 0.248 |
| BMI, kg/m2 | 0.039 | 0.408 | 0.062 | 0.248 | −0.042 | 0.664 |
| eGFR, mL/min/1.73 m2 | −0.180 | 0.001 | −0.188 | 0.002 | −0.174 | 0.090 |
| Log[(ECd/Ccr)×105 ], µg/L filtrate | 0.103 | 0.073 | 0.102 | 0.132 | 0.109 | 0.332 |
| Diabetes | 0.179 | 0.001 | 0.141 | 0.023 | 0.285 | 0.007 |
| Systolic pressure, mmHg | 0.263 | <0.001 | 0.272 | <0.001 | 0.252 | 0.013 |
| Gender | 0.015 | 0.769 | − | − | − | − |
| Smoking | 0.046 | 0.379 | 0.085 | 0.115 | −0.035 | 0.710 |
| Adjusted R2 | 0.147 | <0.001 | 0.143 | <0.001 | 0.146 | 0.001 |
| Model 2: DBP | ||||||
| Age, years | −0.006 | 0.921 | 0.028 | 0.695 | −0.086 | 0.465 |
| BMI, kg/m2 | 0.051 | 0.289 | 0.072 | 0.191 | −0.026 | 0.797 |
| eGFR, mL/min/1.73 m2 | −0.195 | <0.001 | −0.201 | 0.001 | −0.198 | 0.057 |
| Log[(ECd/Ccr)×105 ], µg/L filtrate | 0.122 | 0.039 | 0.119 | 0.085 | 0.128 | 0.265 |
| Diabetes | 0.220 | <0.001 | 0.189 | 0.002 | 0.306 | 0.005 |
| Diastolic pressure, mmHg | 0.150 | 0.001 | 0.149 | 0.005 | 0.152 | 0.125 |
| Gender | 0.011 | 0.839 | − | − | − | − |
| Smoking | 0.032 | 0.547 | 0.068 | 0.214 | −0.040 | 0.680 |
| Adjusted R2 | 0.113 | <0.001 | 0.105 | <0.001 | 0.113 | 0.006 |
n, number of subjects; eGFR, estimated glomerular filtration rate; β, standardized regression coefficient; BMI, body mass index; adjusted R2, coefficient of determination. β indicates strength of association of Ealb/Ccr with eight independent variables (first column). Adjusted R2 indicates the proportion of Ealb/Ccr variation by which all independent variables explained. For all tests, p-values ≤ 0.05 indicate a statistically significant association of Ealb/Ccr with an individual independent variable.
Disclaimer/Publisher’s Note: The statements, opinions and data contained in all publications are solely those of the individual author(s) and contributor(s) and not of MDPI and/or the editor(s). MDPI and/or the editor(s) disclaim responsibility for any injury to people or property resulting from any ideas, methods, instructions or products referred to in the content. |
© 2025 by the authors. Licensee MDPI, Basel, Switzerland. This article is an open access article distributed under the terms and conditions of the Creative Commons Attribution (CC BY) license (http://creativecommons.org/licenses/by/4.0/).
Copyright: This open access article is published under a Creative Commons CC BY 4.0 license, which permit the free download, distribution, and reuse, provided that the author and preprint are cited in any reuse.


