1. Introduction
Water, often heralded as the quintessence of life, constitutes an indispensable resource fundamental to human sustenance, ecological equilibrium, and economic advancement. Despite its ostensible abundance, the availability of freshwater persists as a critical global challenge[
1]. The Earth's hydrosphere, encompassing an estimated 1,360 million km³ of water, comprises a mere 3% of freshwater, with less than 1% accessible for immediate human use[
2]. This paucity is acutely evident in urban locales such as Delhi, India, where escalating population growth, rapid urbanization, and industrial proliferation intensify the demand for potable water[
3].
In metropolitan regions like the National Capital Region (NCR) of Delhi, ensuring access to safe drinking water is further impeded by anthropogenic influences that degrade water quality[
4]. The discharge of untreated industrial effluents, agricultural runoff, and deficiencies in sewage infrastructure profoundly contaminate both surface and groundwater reservoirs. The World Health Organization estimates that over a billion individuals worldwide experience freshwater scarcity, with nearly half enduring health adversities stemming from substandard water quality[
5]. In this milieu, guaranteeing the safety and purity of drinking water assumes paramount importance for safeguarding public health and welfare.
Traditionally, water quality assessment has relied on the analysis of physical, chemical, and biological parameters, including pH, total dissolved solids (TDS), turbidity, and microbial content[
6,
7]. These conventional methodologies, entailing manual sample collection followed by laboratory evaluation, while effective, are inherently time-intensive and laborious, often precluding the provision of real-time data. Consequently, delays in detecting and mitigating contamination can precipitate severe repercussions for public health.
The advent of Internet of Things (IoT) technologies heralds a paradigm shift in addressing these challenges[
8,
9,
10]. By integrating microcontroller-based platforms, such as Arduino, with specialized sensors, it is now feasible to achieve automated, real-time monitoring of water quality parameters. These systems offer a cost-efficient and scalable mechanism for data acquisition and analysis, enabling timely interventions to avert health risks. Their potential is particularly pronounced in densely populated urban environments like Delhi, where expeditious detection and resolution are imperative for managing water quality concerns.
Delhi’s water quality predicaments are rooted in an interplay of natural and anthropogenic factors. The city's geographical positioning, coupled with its burgeoning population density, exerts immense pressure on its water resources. Groundwater, a vital drinking water source, is especially susceptible to contamination due to its protracted recharge cycle and pollutant infiltration from industrial and agricultural activities. Surface water sources, such as the Yamuna River, similarly endure severe pollution, exacerbated by untreated sewage and industrial discharges[
11,
12,
13].
In central and southeastern districts of Delhi, the Delhi Jal Board (DJB) administers the primary drinking water supply through an extensive pipeline network. Despite the DJB's efforts to uphold water quality, the aging infrastructure is prone to leaks and contamination, particularly in older urban sectors. Consequently, residents frequently resort to alternative sources, such as groundwater and commercially packaged drinking water, underscoring the necessity for continuous water quality monitoring to ensure the safety of public water supplies[
14].
Contemporary water quality monitoring systems leverage IoT technologies to surmount the limitations inherent in traditional methods. These systems integrate sensors designed to measure critical parameters, including pH, TDS, turbidity, and temperature. The sensor-generated data are processed by microcontrollers, such as Arduino, and transmitted to centralized platforms for analysis and visualization. This capability for real-time monitoring facilitates the prompt identification of contamination events, enabling swift corrective measures. The adoption of Arduino-based systems for water quality monitoring has gained traction owing to their affordability, scalability, and adaptability. Arduino microcontrollers, as open-source platforms, support a broad spectrum of sensors, rendering them highly versatile for diverse applications. When paired with specialized sensors, these systems yield precise and reliable measurements of water quality parameters, even in challenging environments. Furthermore, the incorporation of wireless communication technologies permits remote monitoring, amplifying their utility in urban settings.
This research endeavours to design, implement, and evaluate an Arduino-based water quality monitoring system tailored to the distinctive challenges of the Delhi metropolitan area. The primary objectives include the development of a cost-effective monitoring apparatus capable of real-time assessment of water quality parameters using Arduino technology and specialized sensors. Additionally, the study assesses the system’s efficacy in monitoring critical parameters such as pH, TDS, turbidity, and temperature, while evaluating its feasibility for extensive deployment in urban environments, particularly in developing regions confronting analogous challenges. By addressing these objectives, this research aspires to advance intelligent water management systems, with far-reaching implications for public health, environmental sustainability, and urban planning in rapidly expanding cities where water quality remains a pressing concern. This investigation involved the random collection of water samples from 47 public sources across Delhi and its environs using a standardized sampling protocol. The samples were analyzed employing an Arduino-based sensor system to measure pivotal water quality parameters. The system demonstrated exceptional accuracy and reliability, establishing itself as a viable alternative to traditional monitoring methodologies.
2. Design and Development
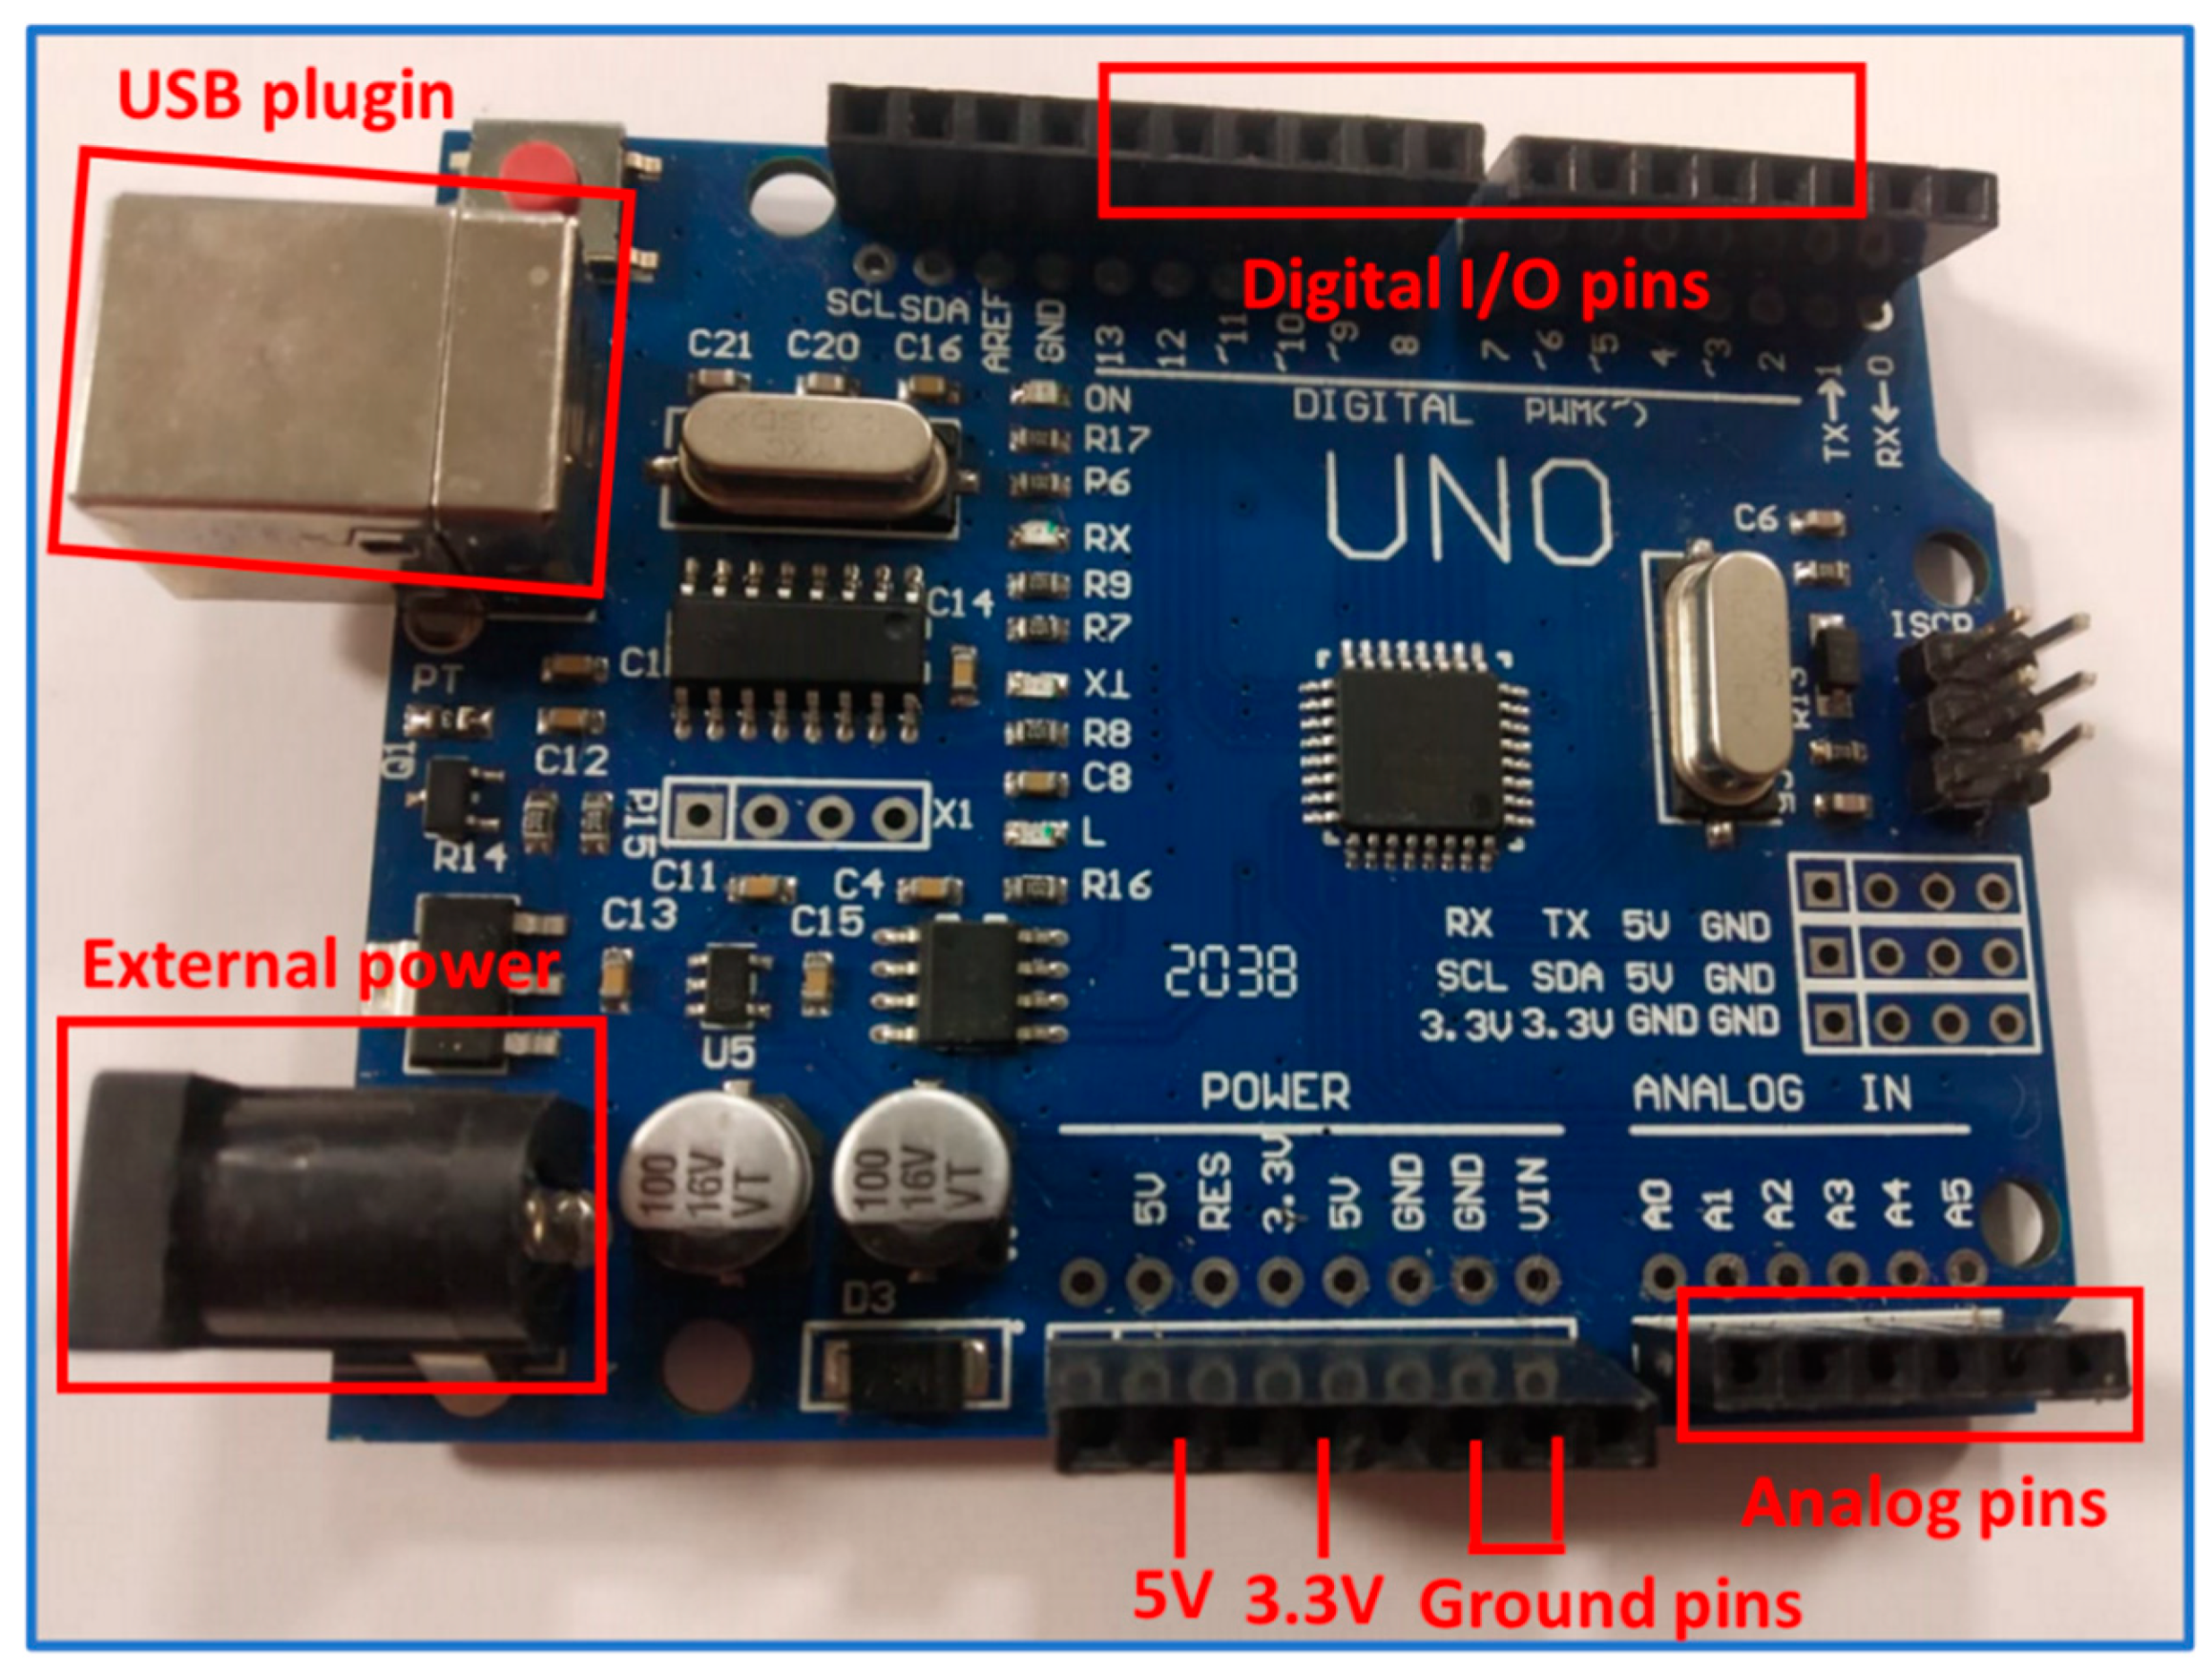
In this study, water quality assessment was conducted using a cost-effective and automated system based on an Arduino microcontroller interfaced with multiple sensors to collect and analyze data from various sampling sites. The core of the system is an Arduino UNO board, which incorporates the ATmega328 microcontroller, a versatile and widely adopted microchip suitable for real-time data processing and control applications (
Figure 1). The Arduino Integrated Development Environment (IDE) was utilized to write, compile, and upload the control code to the board, facilitating seamless interaction with the connected sensors. The UNO board features six analog input pins, designated as A0 through A5, which allow the simultaneous connection of up to six analog sensors[
10]. These sensors collect raw analog signals corresponding to key water quality parameters. The microcontroller processes these signals by converting them into digital data using its built-in Analog-to-Digital Converter (ADC), enabling precise and reliable measurements. Additionally, the board is equipped with two power supply pins rated at 3.3 volts and 5 volts, featuring integrated voltage regulation to provide consistent and stable power to the sensors, ensuring accurate readings. The output data is easily accessible and can be monitored in real-time by connecting the Arduino board to a laptop or portable device through a USB interface. This interface not only facilitates data transfer but also supplies power to the microcontroller. Alternatively, an external battery can be employed to enhance portability and field usability, making the system adaptable for diverse environmental monitoring scenarios.
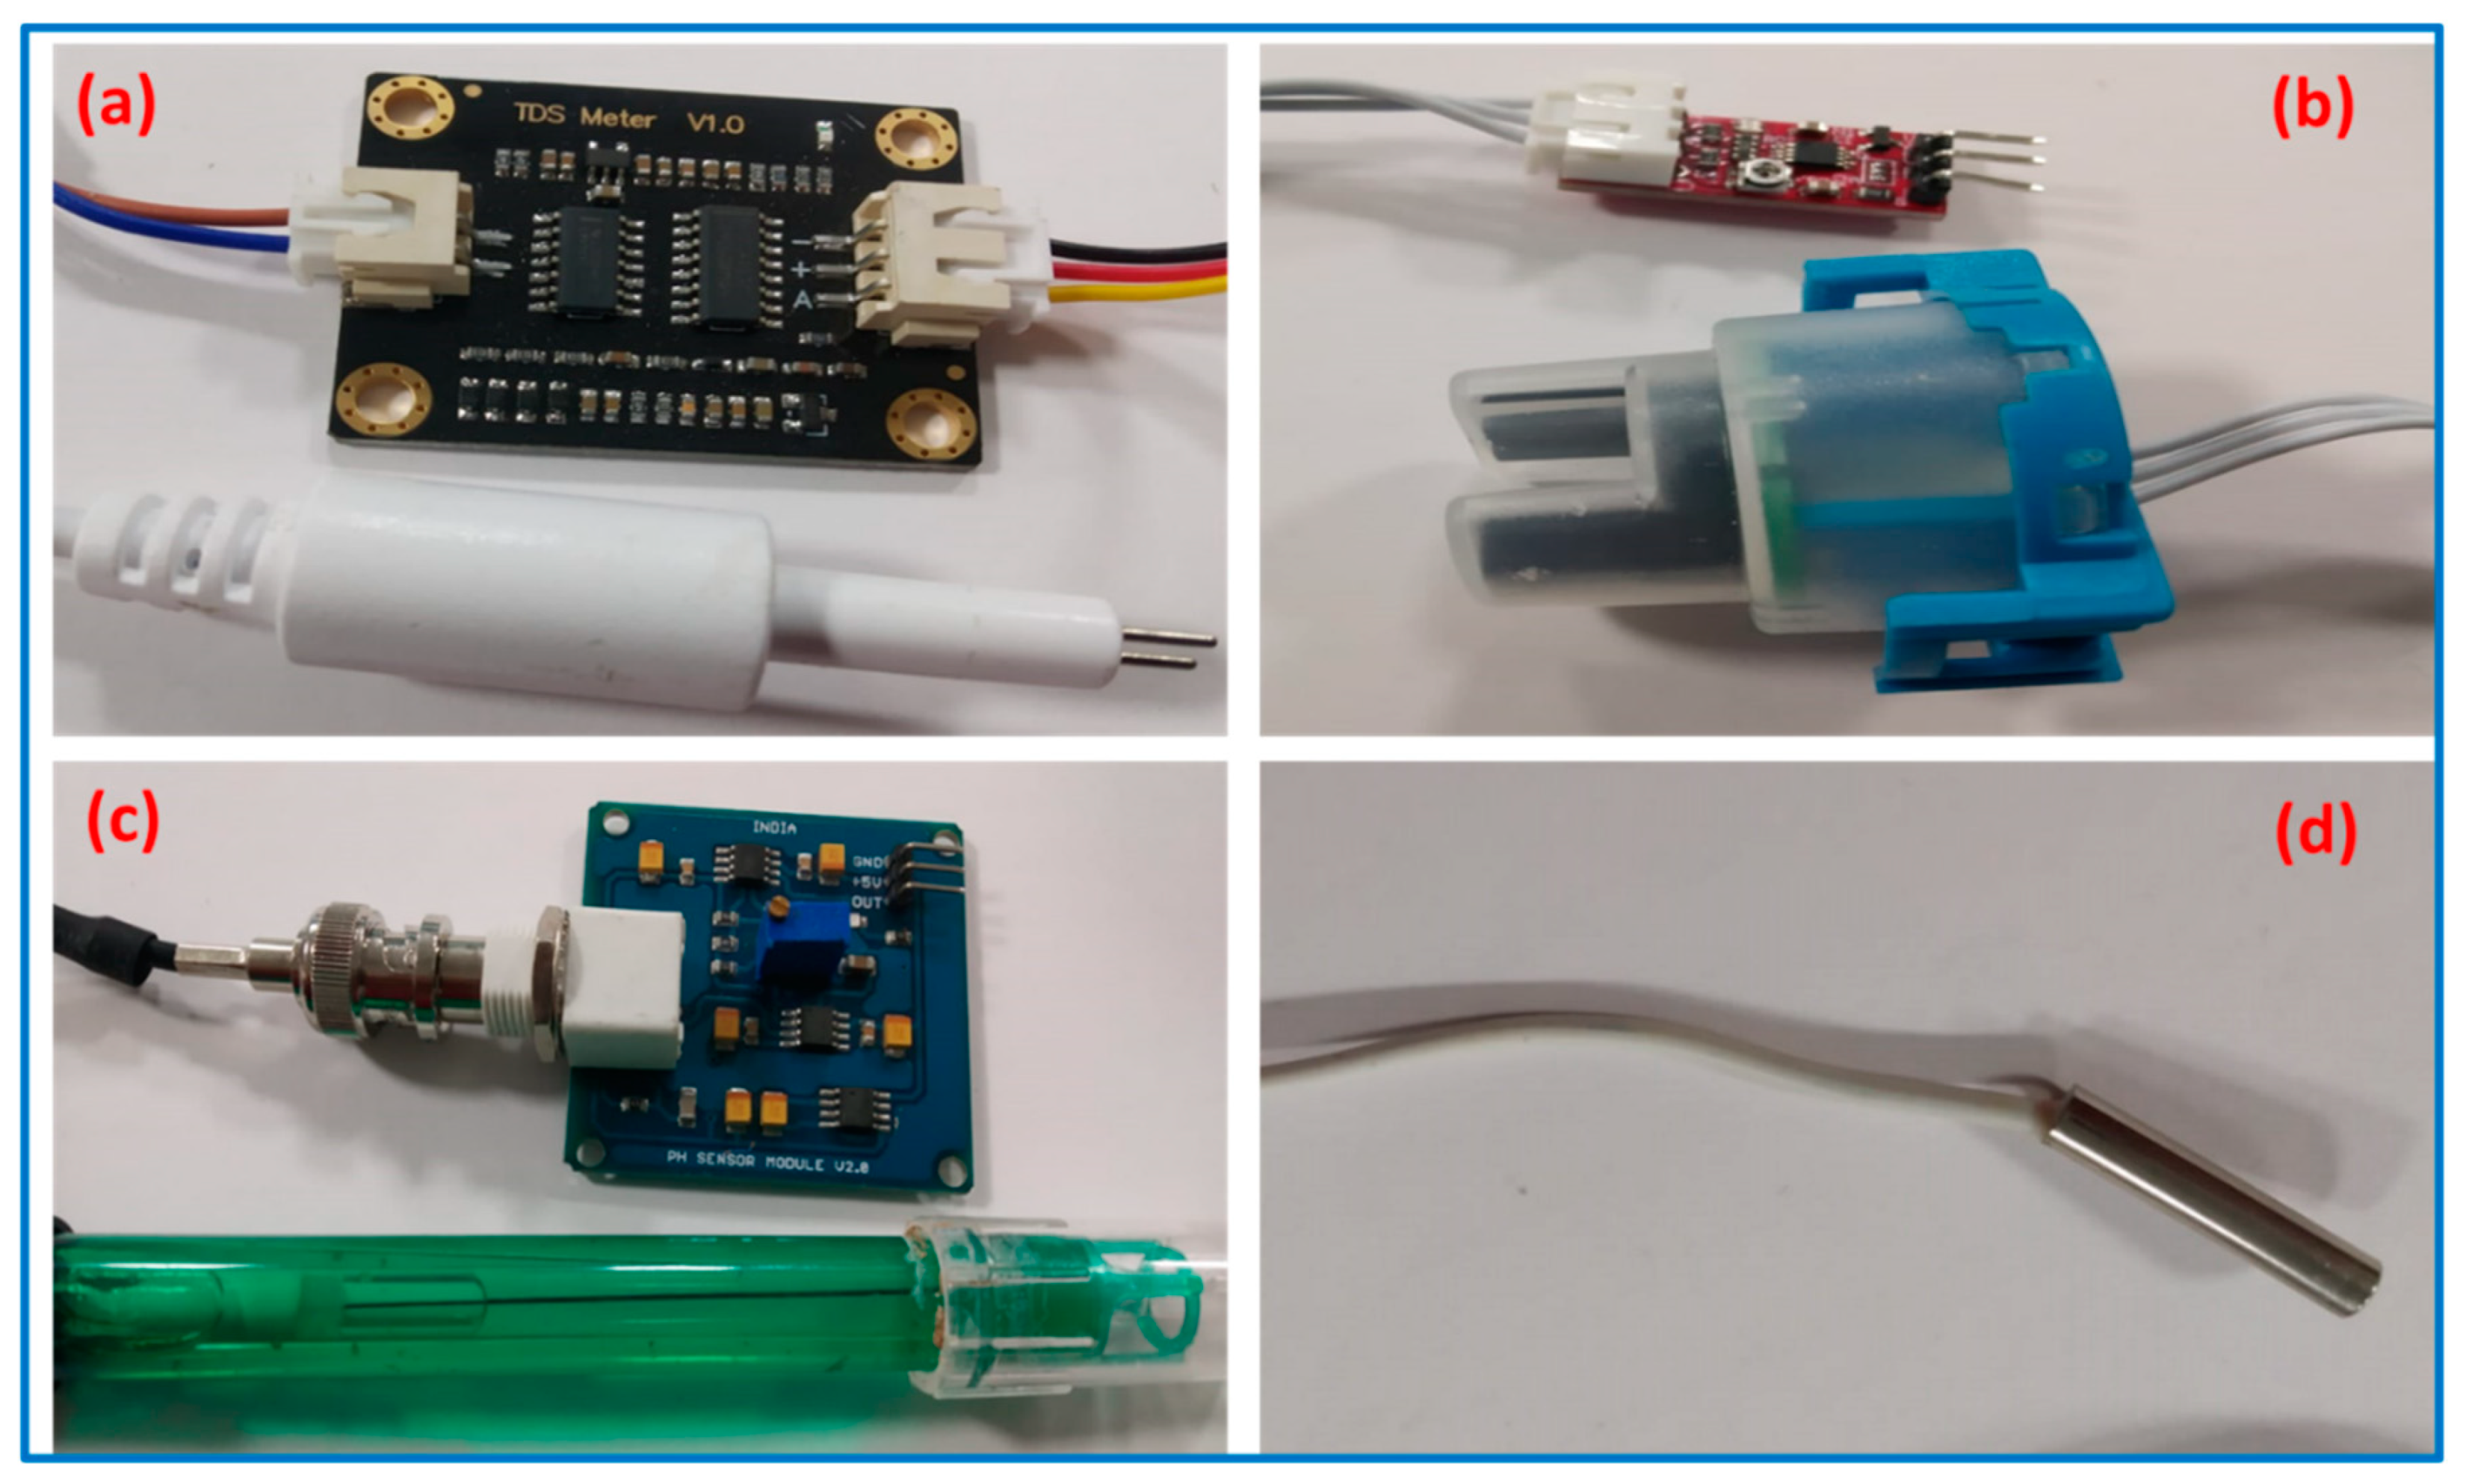
The physicochemical parameters, including pH, temperature, total dissolved solids (TDS), and turbidity, were analyzed using a suite of specialized sensors interfaced with the Arduino microcontroller. These sensors, depicted in
Figure 2, were selected for their accuracy, reliability, and compatibility with the monitoring system. The pH levels were measured using the ERMA INC. pH Electrode (PE-03), a robust sensor with a wide operational range of 0.0–14.0 pH and an accuracy of ±0.01 pH, ensuring high precision. The temperature sensor operates effectively within a temperature range of 0°C to 50°C, making it suitable for various environmental conditions and was calibrated in a similar way[
15]. For TDS measurement, the Techtonics Analog TDS Water Conductivity Sensor Module was employed. This sensor module is capable of monitoring water quality with a range of 0–1000 ppm, providing reliable insights into dissolved solids concentration in the samples. Turbidity, a critical parameter for assessing water clarity and the presence of particulate matter, was determined using the Robocraze Turbidity Detection Sensor Kit. This sensor operates at a standard voltage of 5 VDC and can handle a maximum current of 30 mA. It features a broad operational temperature range of -30°C to 80°C, ensuring consistent performance even in extreme conditions. Finally, temperature measurements were conducted using the IDUINO DS18B20 Stainless Steel Encapsulated Temperature Sensor. This waterproof digital temperature probe offers precise and stable readings, making it highly reliable for both field and laboratory applications. Together, these sensors provided comprehensive, accurate, and real-time monitoring of key water quality parameters.
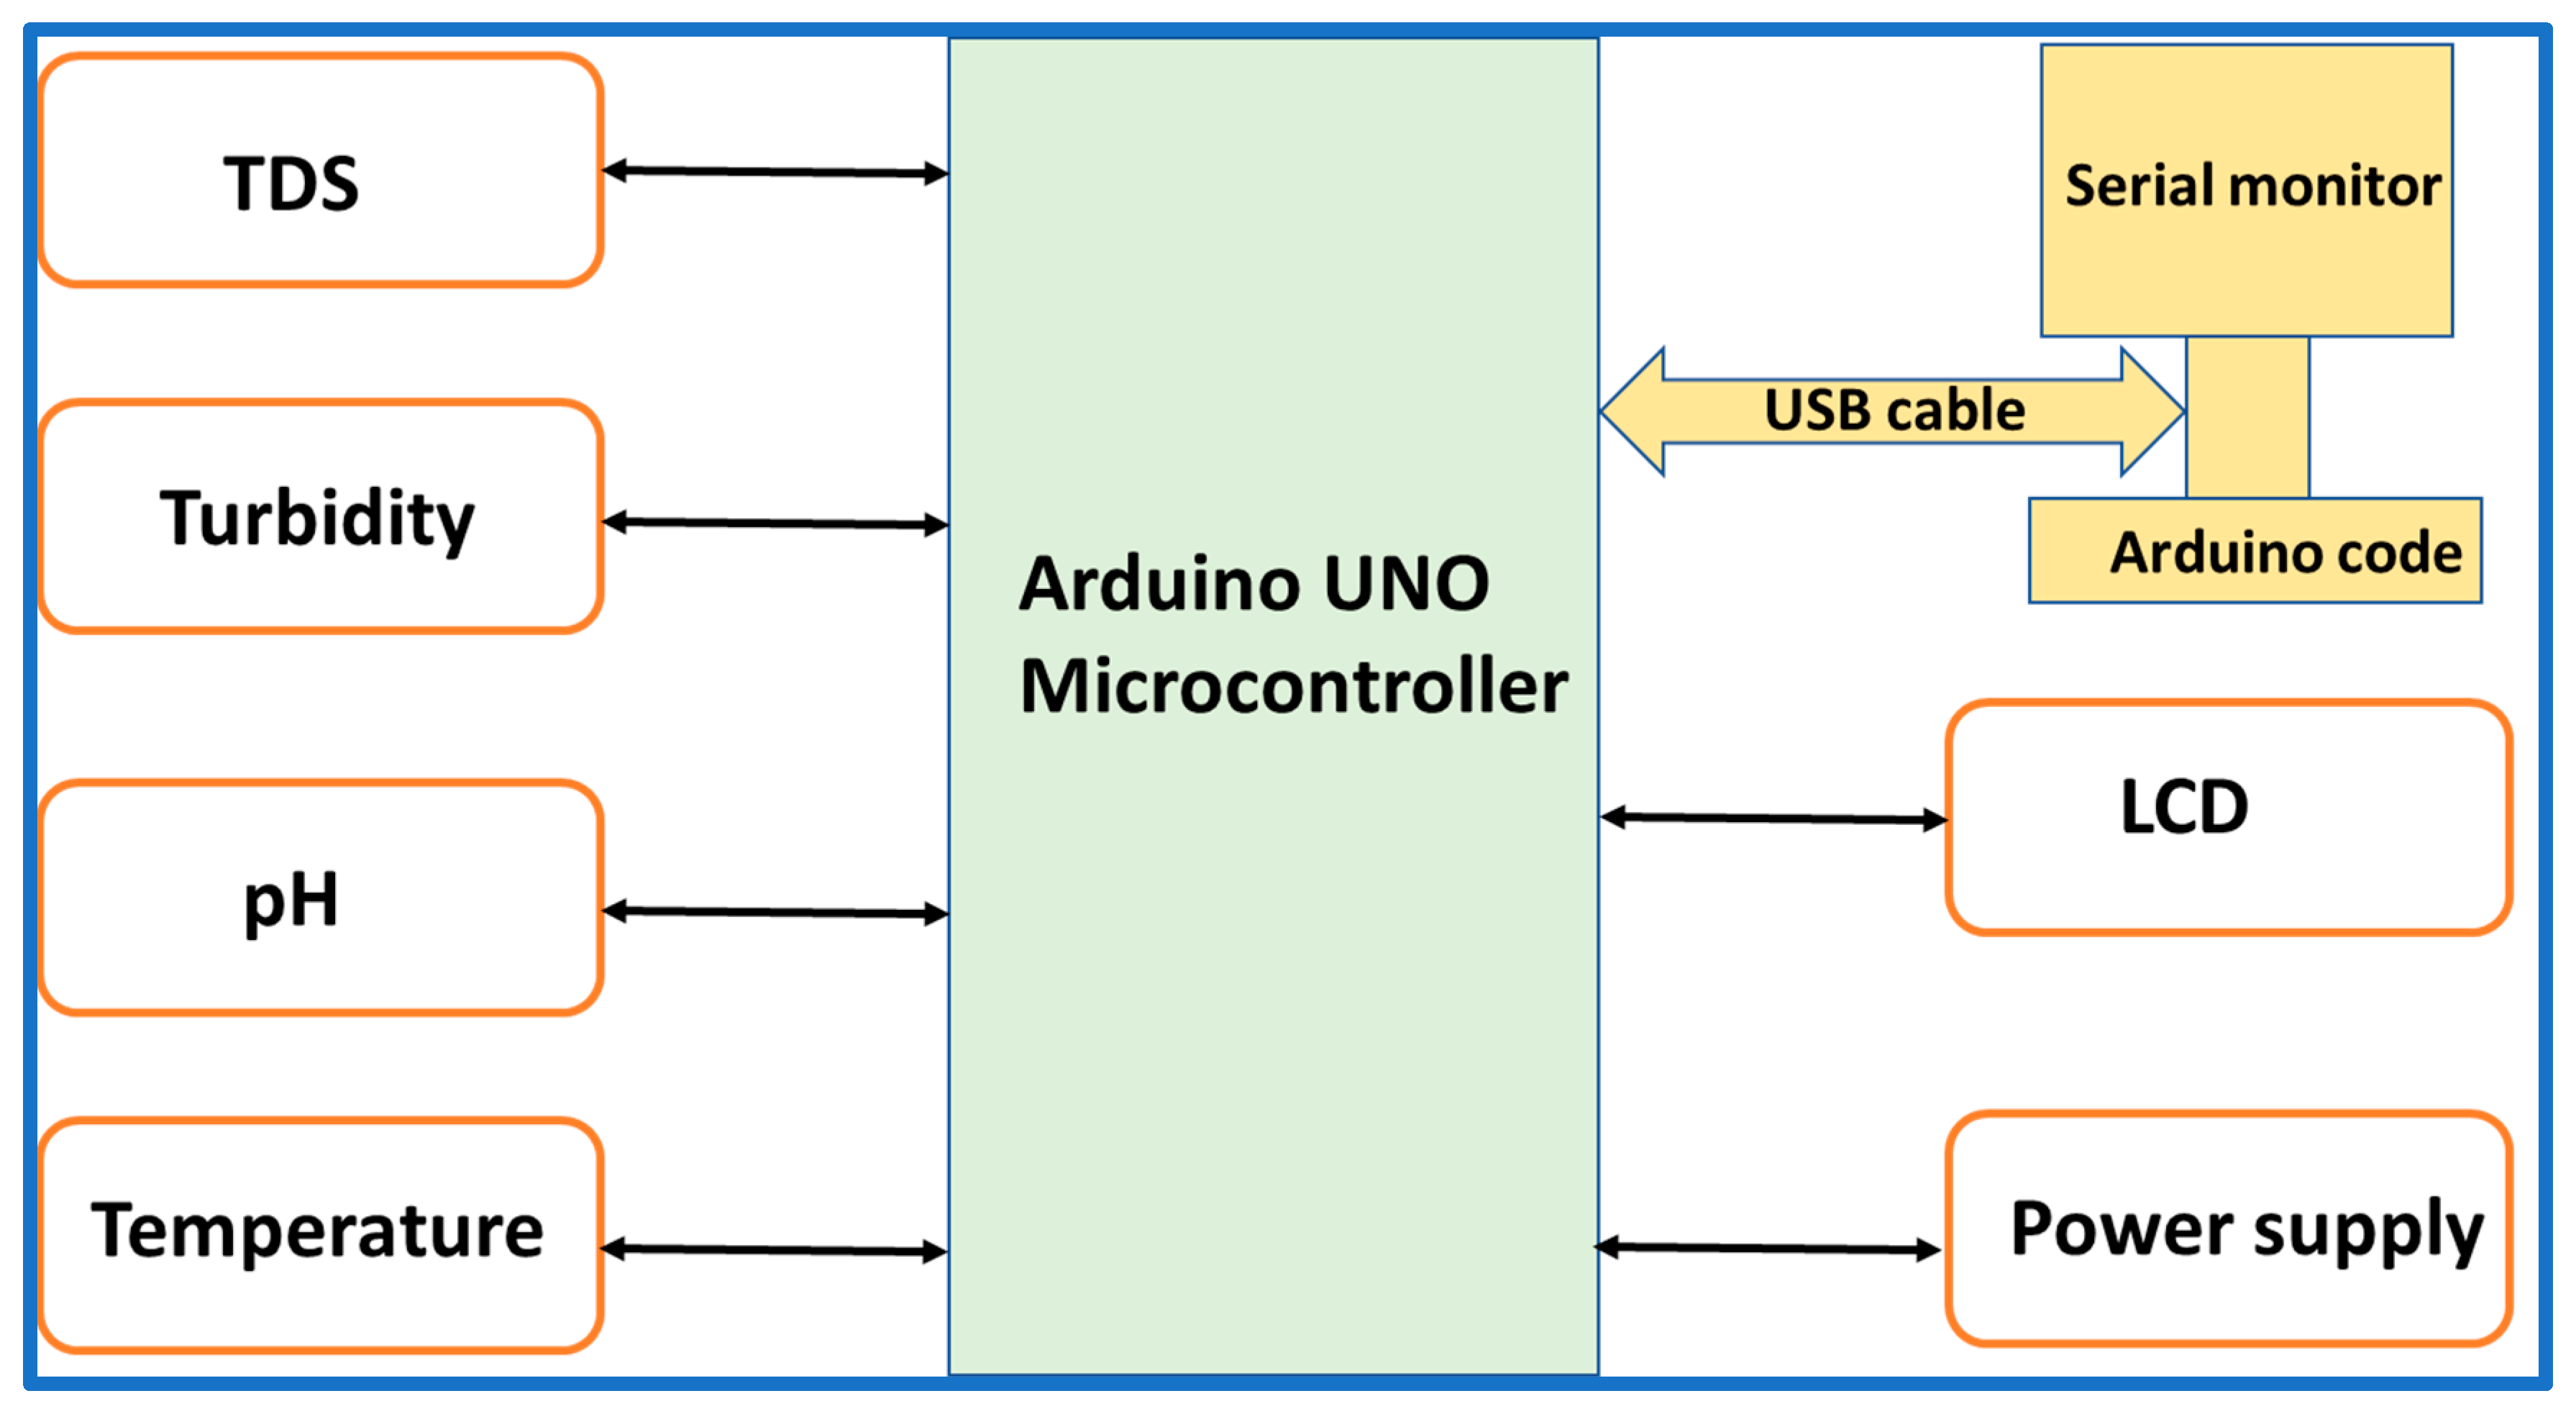
The architecture of the water quality monitoring system is centered around the Arduino UNO microcontroller, which serves as the core processing unit. A block diagram of the system is illustrated in
Figure 3. On the left side of the diagram, the interfaced sensors—namely TDS, pH, turbidity, and temperature—are depicted. These sensors are strategically placed within the water sample to be tested, whether from stored reservoirs or running water sources. On the right side, the system components include the power supply unit, an LCD display for real-time parameter visualization, and a USB-connected PC with a serial monitor for detailed data output and analysis. Sensors play a critical role in this system by converting physical parameters, such as dissolved solids concentration, pH, turbidity, or temperature, into corresponding measurable electrical signals. Each sensor is calibrated to deliver accurate readings within its operational range. These analog signals are then fed into the Arduino UNO's analog input pins, where they undergo analog-to-digital conversion for further processing. The Arduino UNO microcontroller processes the acquired data, applying optional filtering algorithms or preliminary calculations to ensure signal clarity and accuracy. It then transmits the processed information to the application layer through appropriate communication protocols. This transmission can occur via wired USB connections or integrated wireless communication modules, depending on the system design. The real-time display of water quality metrics on an LCD unit provides an immediate visual representation of the results, while the USB-attached PC allows for more detailed monitoring, logging, and analysis. This architecture ensures a comprehensive, reliable, and user-friendly water quality monitoring solution.
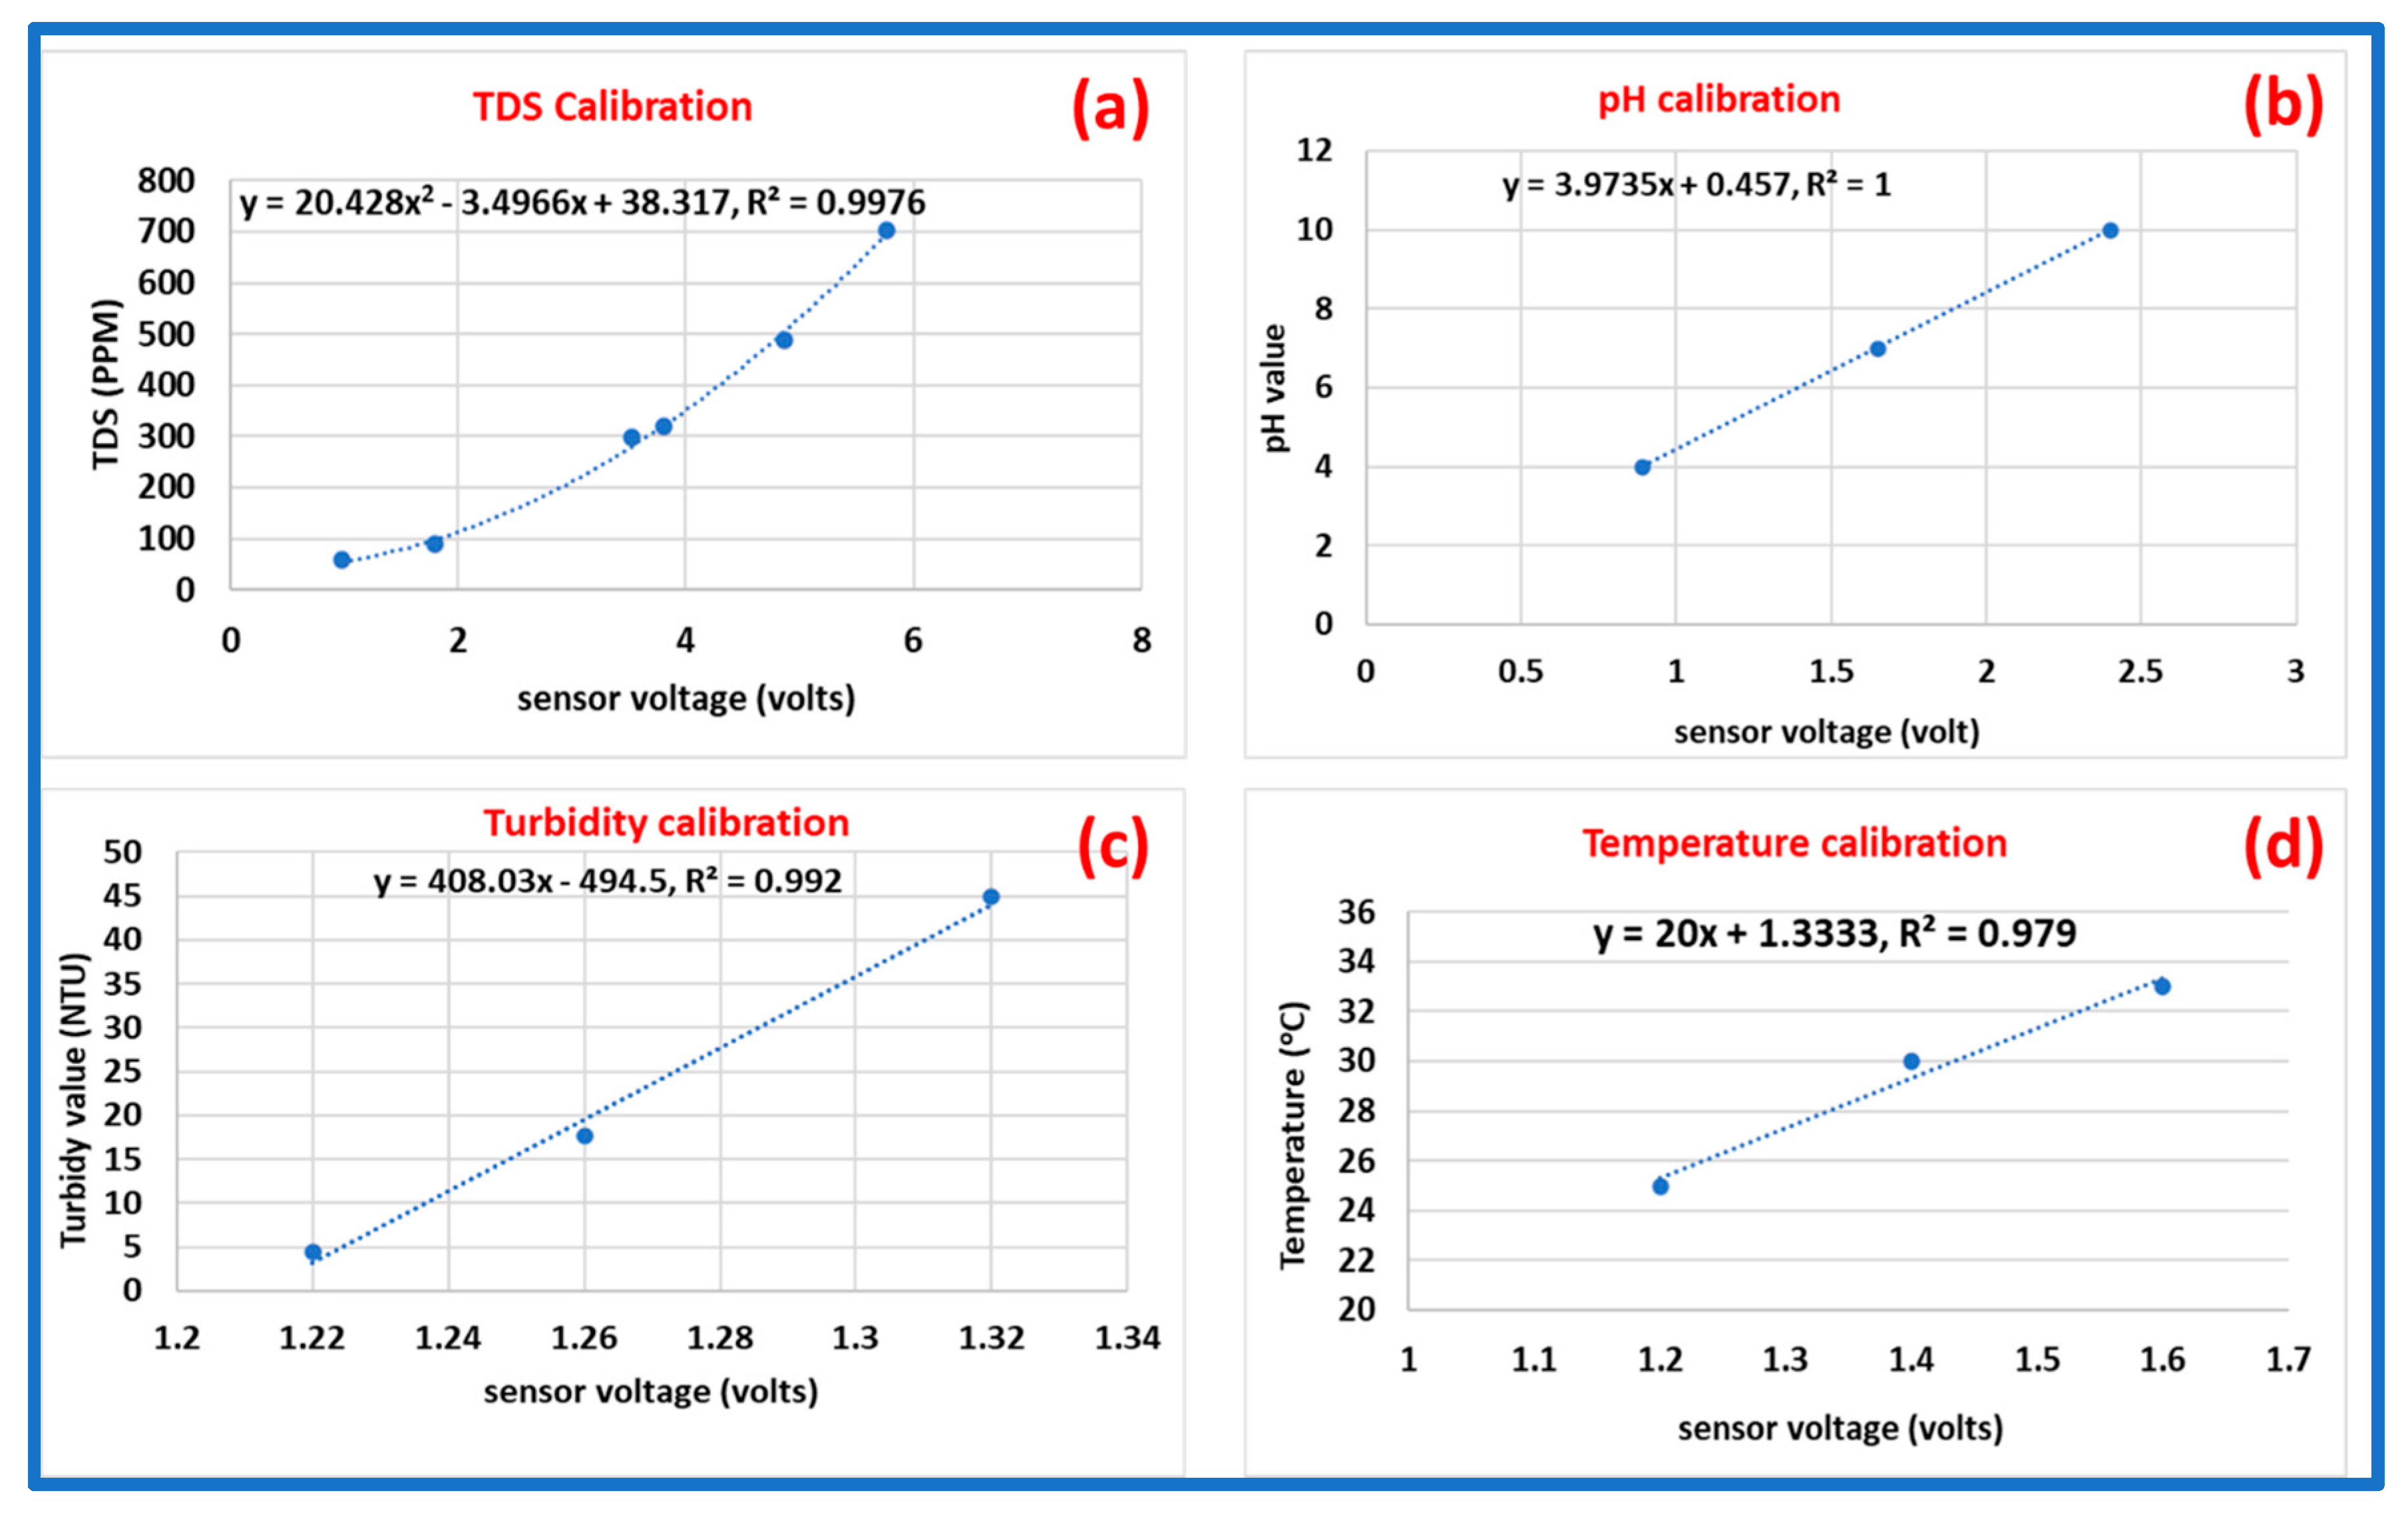
Following the successful interfacing of sensors with the Arduino UNO board, the subsequent critical step was sensor calibration to ensure measurement accuracy. Calibration was performed using standardized references and laboratory-grade instruments for each sensor type, as outlined below. For the TDS sensor, calibration was achieved by comparing its readings with those from a laboratory TDS sensor (VSI). A series of water samples with varying known TDS concentrations were prepared, and the corresponding sensor outputs were recorded. A calibration curve was plotted, as shown in
Figure 4a, demonstrating the correlation between the sensor readings and actual TDS values.
The pH sensor calibration involved the use of three NIST-traceable buffer solutions with known pH values: 4.0 (acidic), 7.0 (neutral), and 14.0 (basic). The sensor was immersed sequentially in each buffer solution, and the readings were adjusted to match the standard values. This process ensured accurate pH measurements across the sensor’s operational range. The resulting calibration curve is depicted in
Figure 4b. For the turbidity sensor, calibration was performed using laboratory turbidity meters and solutions prepared with Formazin, a standard reference material for turbidity. A stock solution with a turbidity value of 50 NTU was diluted with deionized (DI) water to produce samples with varying turbidity levels. These samples were measured using the turbidity sensor, and a calibration curve, shown in
Figure 4c, was established to correlate sensor output with true turbidity values. Finally, the temperature sensor calibration was conducted using a laboratory-grade thermometer. The sensor and thermometer were simultaneously exposed to varying water temperatures, and the readings were compared. Any discrepancies were corrected to align with the thermometer readings, as illustrated in
Figure 4d. This meticulous calibration process ensured the reliability and accuracy of all sensor measurements in the water quality monitoring system and for other futuristics applications[
16,
17,
18,
19,
20].
3. Samples Collection
Water samples for this study were meticulously collected across the National Capital Territory of Delhi and adjacent regions in Haryana, Uttarakhand, and Uttar Pradesh, following a systematic sampling protocol to ensure accuracy and representation. For each designated site, duplicate or triplicate specimens were collected to account for variability and improve statistical robustness. Detailed documentation of the sampling locations, including geographic coordinates and site characteristics, is presented in
Table 1. The study encompassed a comprehensive range of drinking water sources to provide a holistic assessment of water quality in the target areas. Samples were obtained from municipal water supplies managed by local governing bodies, subterranean aquifers accessed via wells, and commercially distributed bottled water products. Additionally, household filtration systems utilizing advanced reverse osmosis (RO) technology and public water dispensing booths located at transit hubs were included to represent both residential and transient water consumption scenarios. Each sample collection was performed using sterilized polyethylene bottles to prevent contamination. The bottles were pre-cleaned with nitric acid and rinsed thoroughly with deionized water. At the sampling sites, containers were rinsed with the source water prior to collection to ensure sample integrity. Following collection, all specimens were immediately sealed, labeled, and transported to the laboratory in temperature-controlled conditions to preserve their chemical and microbiological characteristics. By incorporating this diverse array of potable water sources, the study aimed to capture a detailed and inclusive profile of drinking water quality. This approach reflects the spectrum of water options available to both residents and travelers, ensuring the findings are relevant and actionable.
4. Result and Discussion
Delhi's persistent struggle with water scarcity is a multifaceted issue, intensified by rapid population growth and urbanization. The root cause lies in the limited availability of raw water, which restricts the ability to meet the city's increasing demand. According to the Census of India 2011, Delhi is home to 3.34 million households, out of which 2.72 million (81.3%) have access to piped water supply. Among these, 75.2% rely on treated water sources, while 6.1% depend on untreated sources. Conversely, approximately 0.461 million households (13.8%) depend on alternative sources such as tube wells, deep bore hand pumps, and public hydrants. Additionally, 0.164 million households (4.9%) source water from rivers, canals, ponds, tanks, springs, and other natural water bodies. The accessibility of drinking water varies significantly across the city[
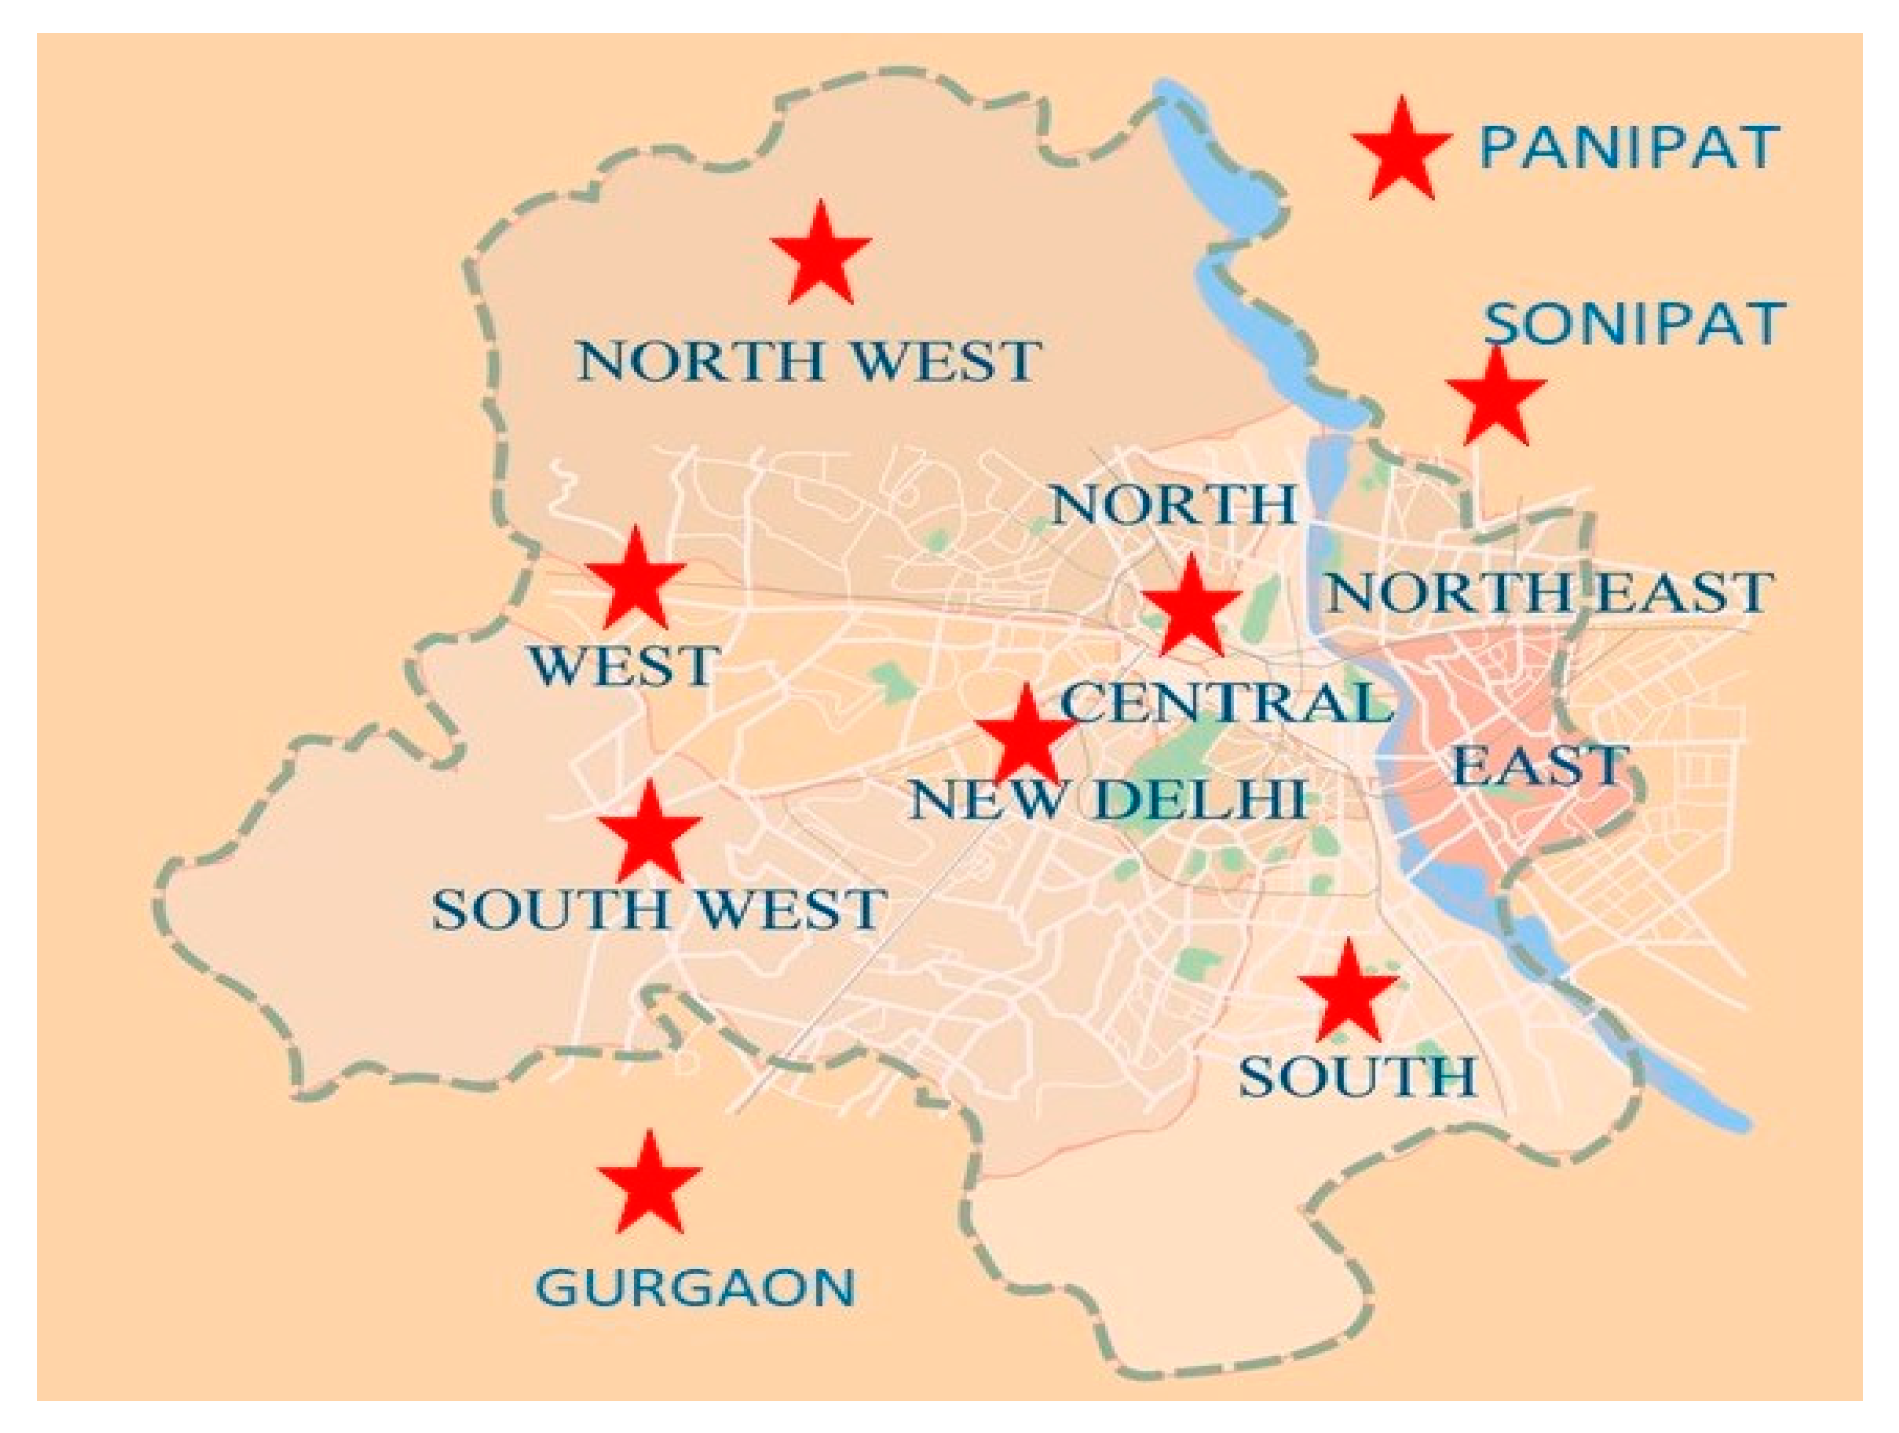
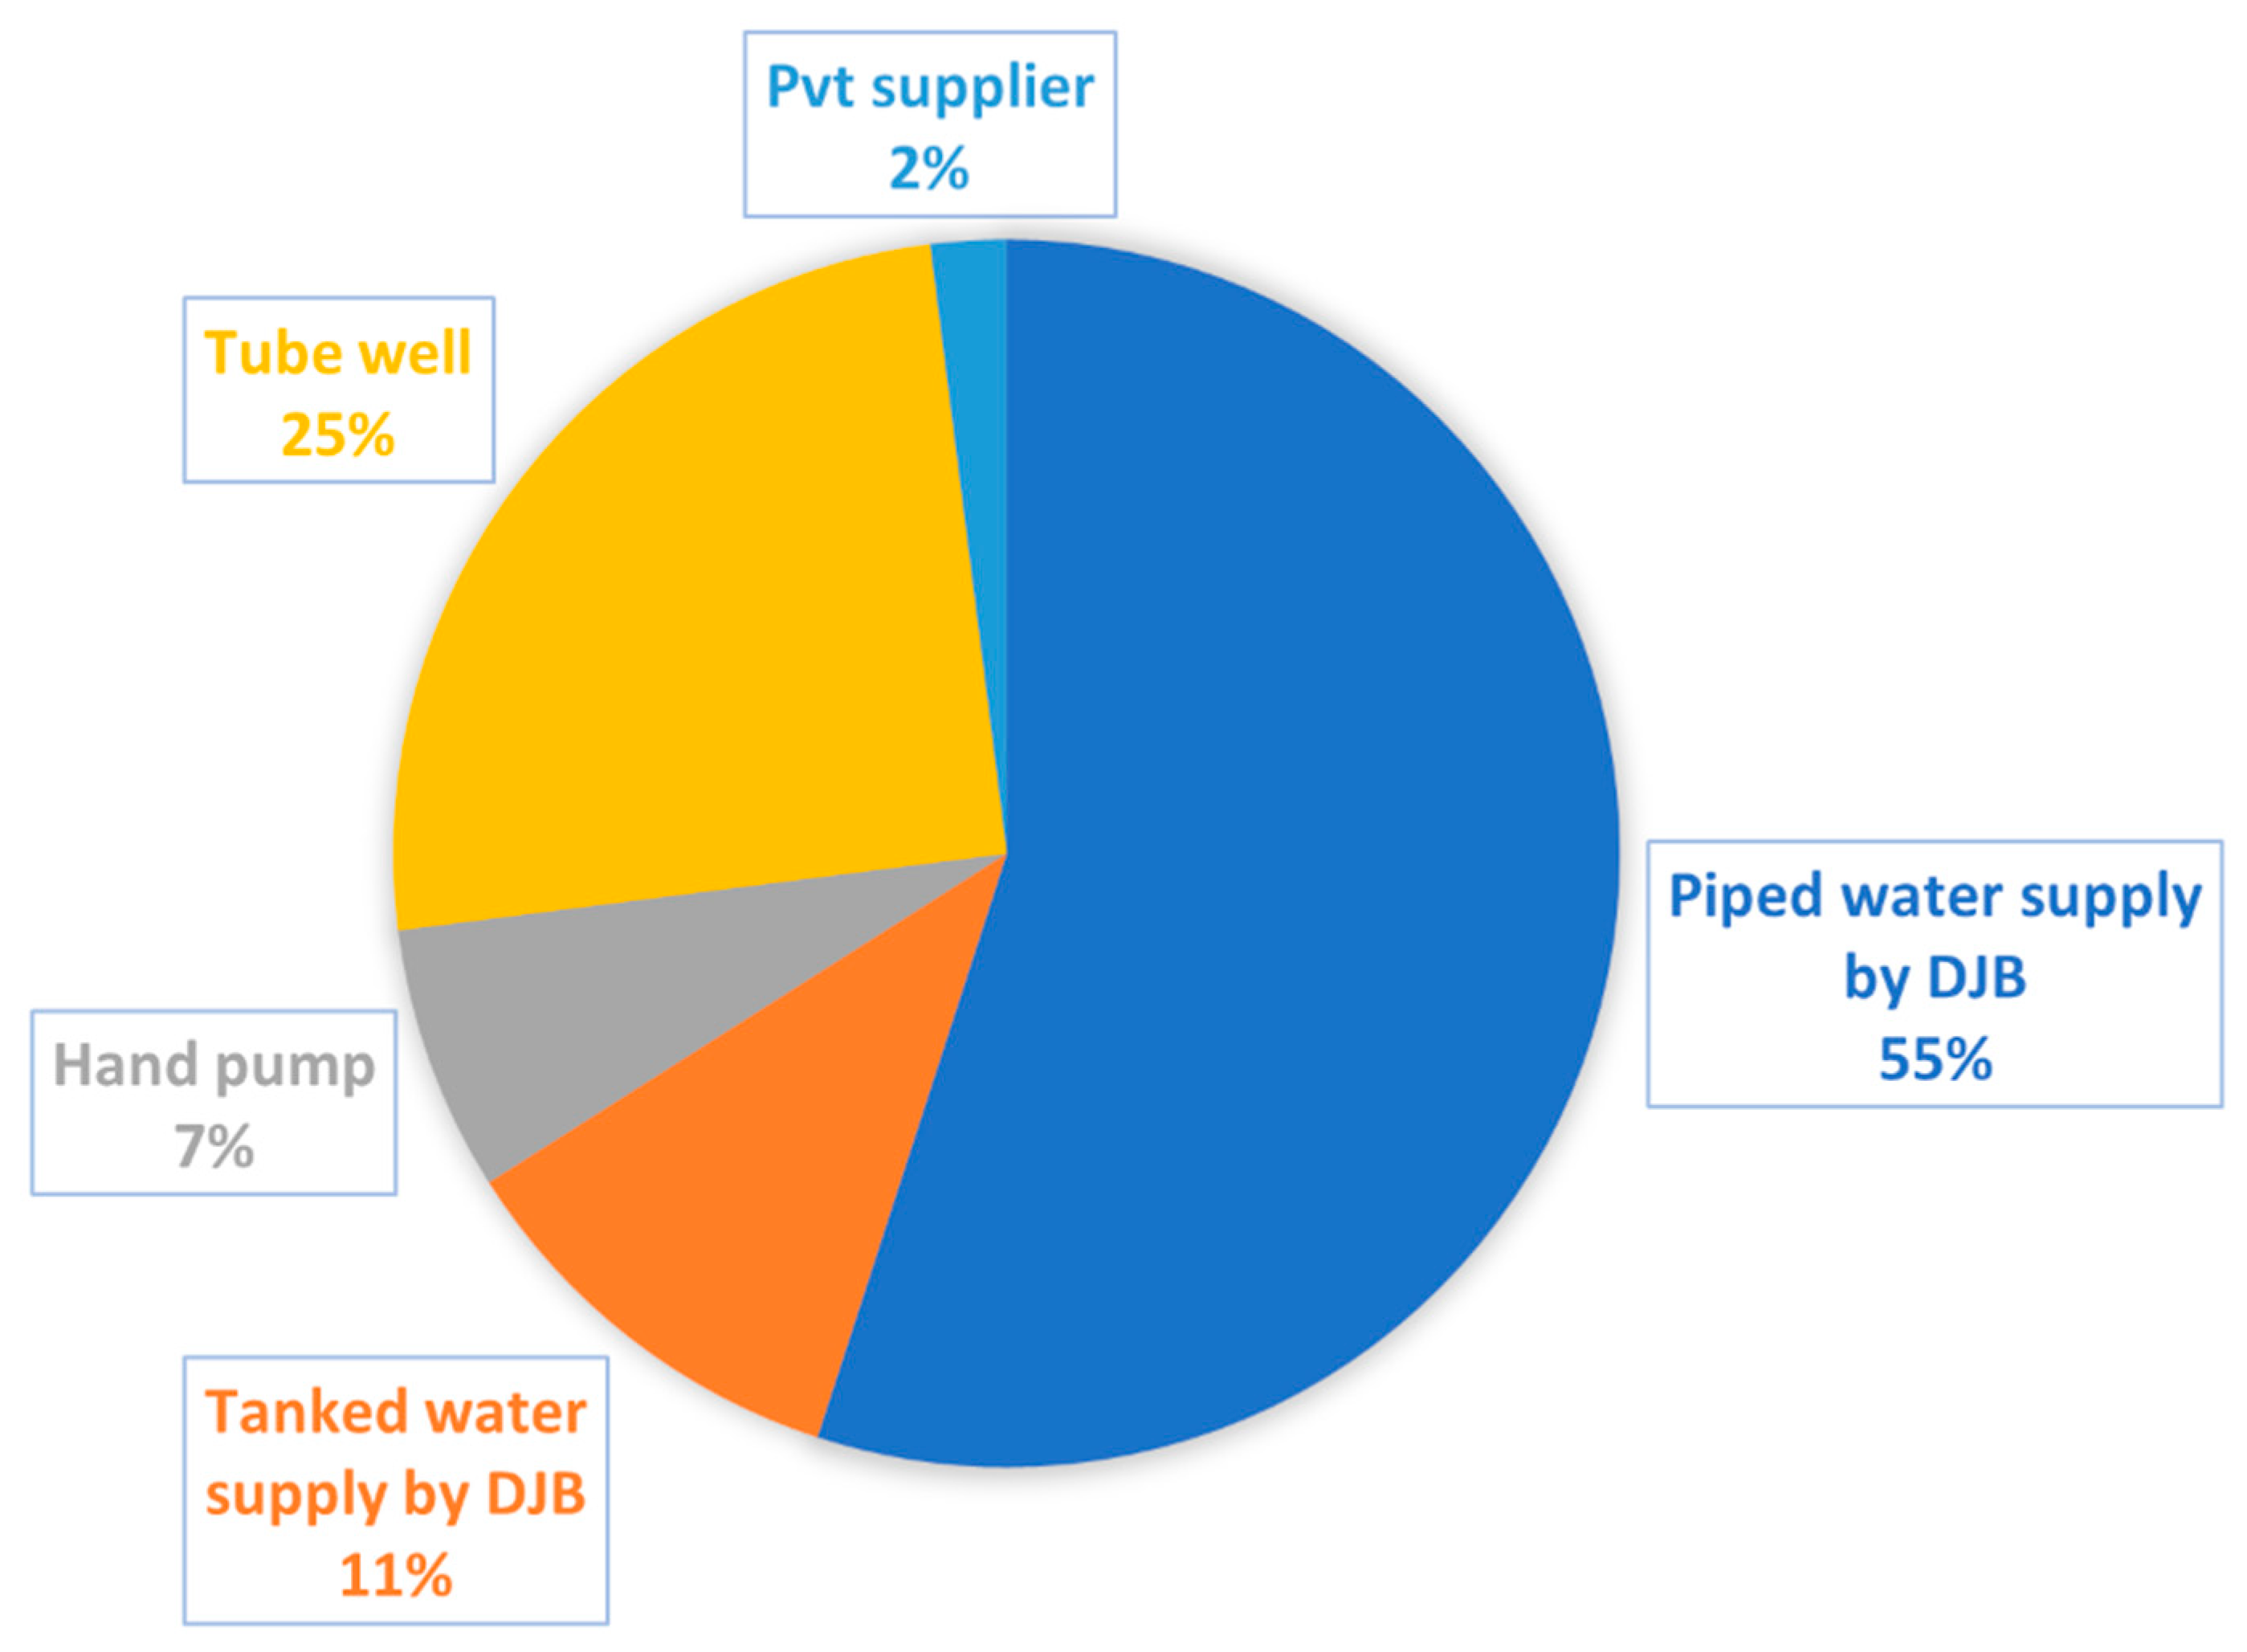
21]. About 78.4% of households have water available within their premises, whereas 15.4% must access it nearby, and 6.2% are compelled to travel farther distances to fetch water. This disparity highlights the uneven distribution of water resources, which poses a challenge for equitable access. The Delhi Jal Board (DJB) is the primary agency responsible for procuring, treating, and distributing potable water across the city. Its mandate extends beyond the three Municipal Corporations of Delhi to include the provision of treated water to the Delhi Cantonment Board and New Delhi Municipal Council. Despite these efforts, water consumption in the National Capital Territory (NCT) remains a critical issue, as illustrated in
Figure 6, which details the drinking water usage patterns across different regions within Delhi. Addressing these challenges requires a combination of policy reforms, infrastructure development, and sustainable resource management to ensure equitable and efficient water distribution for the city's residents[
22].
The water quality analysis of collected samples was conducted using Arduino-based sensors, with results revealing significant variations in key parameters. These measurements were assessed against the ISO 10500: Drinking Water, 2012 standards to evaluate their compliance with safety regulations[
23]. The analysis covered parameters such as pH, turbidity, and Total Dissolved Solids (TDS), which are essential for ensuring the safety and suitability of drinking water for human consumption. The pH values of the collected samples primarily fell within the acceptable range (6.5–8.5), as defined by the Bureau of Indian Standards (BIS). Raw water samples exhibited pH values between 7.7 and 8.1, which were within the desired range. Specifically, 93% of the samples met the BIS recommended pH range, while 4% showed slightly elevated pH levels, and 3% demonstrated marginally low pH values. These minor variations are not expected to pose significant health risks but warrant further investigation to maintain water quality standards.
Turbidity measurements displayed a broader range of results across different water sources. Groundwater, reverse osmosis (RO) treated water, and commercially bottled water samples consistently fell within the BIS acceptable range of 0.1 to 1 NTU, indicating clear water suitable for consumption. However, some tap water samples from the Delhi Jal Board (DJB) and municipal water (MW) sources exceeded the 1 NTU threshold, suggesting potential contamination. The elevated turbidity levels in these samples could indicate the presence of suspended solids or microorganisms, which may pose health risks if consumed over extended periods. The analysis of Total Dissolved Solids (TDS) further revealed significant deviations from the BIS-recommended range of 50 to 300 PPM. TDS levels are crucial as they reflect the concentration of dissolved minerals, salts, and other substances in water, affecting its taste and quality. Notably, 20% of samples from DJB and MW sources exhibited TDS levels above 300 PPM, indicating excessive mineral content. Such high TDS concentrations could negatively affect the taste and health safety of the water. Conversely, 40% of RO-treated and commercially bottled water samples showed TDS levels below 50 PPM, indicating over-demineralization. While these samples may appear purer, excessively low TDS may lead to the leaching of essential minerals from the body over time, affecting overall health.
All samples were collected and analyzed at ambient temperature, with specific values presented in
Table 2. The findings highlight the variability in drinking water quality across different sources in Delhi. While pH levels generally met safety standards, the elevated turbidity in some municipal sources and the widespread deviation from ideal TDS levels in both municipal and treated water sources suggest significant areas requiring attention. The results underscore the need for targeted interventions to improve water quality management practices and ensure consistent compliance with established safety standards across all water sources in the region. Analysis revealed that while pH levels in all samples adhered to acceptable standards, approximately 14% of the samples exhibited elevated TDS and turbidity levels, raising concerns over potential contamination risks. These findings highlight the importance of sustained monitoring and stricter quality control measures. In contrast, commercially packaged drinking water samples exhibited substantially lower TDS and turbidity levels, reflecting stringent quality control practices during production. These results suggest that while certain water sources in Delhi meet basic safety standards, others, particularly municipal sources, require immediate attention to reduce turbidity and TDS levels and safeguard public health.
5. Conclusions
This investigation proficiently illustrates the feasibility of a cost-effective, Arduino-driven system for real-time surveillance of essential water quality parameters, including pH, TDS, temperature, and turbidity, across diverse water sources in Delhi and its vicinity. By incorporating economical, portable sensors, the system facilitates the uninterrupted monitoring of water quality, crucial for identifying variations that might otherwise remain unnoticed using conventional sampling techniques. The data was compared with established safety benchmarks and largely adhered to the regulatory standards, especially in terms of pH and turbidity, with most water samples meeting the acceptable thresholds set by the Bureau of Indian Standards.
Nevertheless, substantial discrepancies were observed in the TDS levels, particularly within municipal water supplies, where 20% of the samples surpassed the prescribed upper limit of 300 parts per million. This deviation signals potential hazards stemming from excessive mineral concentrations, which could adversely impact both the palatability and health safety of the water. On the other hand, 40% of RO-treated and commercially bottled water samples exhibited TDS levels falling below 50 parts per million, indicating an overzealous demineralization process. These variations underscore the intricacies of maintaining balanced water quality and emphasize the need for proactive measures to enhance municipal water infrastructure, ensuring TDS levels stay within recommended limits.
The outcomes of this study highlight the transformative potential of affordable, IoT-enabled monitoring systems in revolutionizing water quality management. The adaptability and cost-efficiency of this technology make it highly amenable to wide-scale implementation, particularly in resource-deficient regions, positioning it as a promising tool for improving public health outcomes in urbanized areas. The system's ability to provide real-time data is invaluable, enabling timely interventions that are vital in mitigating health risks associated with compromised water sources. Additionally, this research exemplifies the practical application of IoT technologies in water quality monitoring and showcases how such systems can serve as critical instruments in urban planning and public health policy.
In particular, the study underscores the importance of embracing contemporary technologies to tackle the multifaceted challenges arising from rapid urban expansion and industrialization. In densely populated regions, where water quality is frequently undermined, the adoption of innovative solutions is paramount. The findings carry profound implications for public health, environmental sustainability, and policy development. By demonstrating the capabilities of Arduino-based systems for real-time monitoring, this study lays the groundwork for their integration into comprehensive water management frameworks. The insights gained can guide policy makers in formulating strategies that address water quality concerns and safeguard public health, especially in areas facing challenges akin to those encountered in Delhi.
Overall, while pH and turbidity levels in the water samples generally complied with the prescribed standards, the study highlights the pressing need for targeted interventions within municipal water systems to mitigate elevated TDS and turbidity. These results not only showcase the practicality and efficacy of IoT-driven monitoring systems in urban contexts but also emphasize their scalability and cost-effectiveness as a means to ensure safe drinking water. Such systems offer substantial promise in promoting sustainable water management practices, ultimately contributing to improved public health and the resilience of urban water infrastructure.
Acknowledgement
The authors would like to express their gratitude to the Director of CSIR-NPL, New Delhi, for providing the necessary facilities to carry out this work. Special thanks are extended to Dr. Ritu Srivastava, Chief Scientist at CSIR-NPL, New Delhi, for her valuable discussions and insightful contributions throughout the project.
References
- He, C.; Liu, Z.; Wu, J.; Pan, X.; Fang, Z.; Li, J.; Bryan, B.A. Future Global Urban Water Scarcity and Potential Solutions. Nat. Commun. 2021, 12, 4667. [Google Scholar] [CrossRef] [PubMed]
- Vörösmarty, C.J.; McIntyre, P.B.; Gessner, M.O.; Dudgeon, D.; Prusevich, A.; Green, P.; Glidden, S.; Bunn, S.E.; Sullivan, C.A.; Liermann, C.R.; et al. Global Threats to Human Water Security and River Biodiversity. Nature 2010, 467, 555–561. [Google Scholar] [CrossRef] [PubMed]
- Reid, A.J.; Carlson, A.K.; Creed, I.F.; Eliason, E.J.; Gell, P.A.; Johnson, P.T.J.; Kidd, K.A.; MacCormack, T.J.; Olden, J.D.; Ormerod, S.J. Emerging Threats and Persistent Conservation Challenges for Freshwater Biodiversity. Biol. Rev. 2019, 94, 849–873. [Google Scholar] [CrossRef] [PubMed]
- Akhtar, N.; Syakir Ishak, M.I.; Bhawani, S.A.; Umar, K. Various Natural and Anthropogenic Factors Responsible for Water Quality Degradation: A Review. Water 2021, 13, 2660. [Google Scholar] [CrossRef]
- WHO Water, Sanitation, Hygiene and Health: A Primer for Health Professionals. World Heal. Organ. 2019, 1–40.
- Kaur, B.J.; George, M.P.; Mishra, S. Groundwater Quality and Water Quality Index of Delhi City, India. 2014; 32, 865–871. [Google Scholar] [CrossRef]
- Bidhuri, S.; Khan, M.M.A. Assessment of Ground Water Quality of Central and Southeast Districts of NCT of Delhi. J. Geol. Soc. India 2020, 95, 95–103. [Google Scholar] [CrossRef]
- Gubbi, J.; Buyya, R.; Marusic, S.; Palaniswami, M. Internet of Things (IoT): A Vision, Architectural Elements, and Future Directions. Futur. Gener. Comput. Syst. 2013, 29, 1645–1660. [Google Scholar] [CrossRef]
- Khanh, Q.V.; Hoai, N.V.; Manh, L.D.; Le, A.N.; Jeon, G. Wireless Communication Technologies for IoT in 5G: Vision, Applications, and Challenges. Wirel. Commun. Mob. Comput. 2022, 2022, 3229294. [Google Scholar] [CrossRef]
- Geetha, S.; Gouthami, S. Internet of Things Enabled Real Time Water Quality Monitoring System. Smart Water 2016, 2, 1–19. [Google Scholar] [CrossRef]
- Adhikary, P.P.; Chandrasekharan, H.; Chakraborty, D.; Kamble, K. Assessment of Groundwater Pollution in West Delhi, India Using Geostatistical Approach. Environ. Monit. Assess. 2010, 167, 599–615. [Google Scholar] [CrossRef] [PubMed]
- Sarkar, A.; Ali, S.; Kumar, S.; Shekhar, S.; Rao, S.V.N. Groundwater Environment in Delhi, India. In Groundwater environment in Asian cities; Elsevier, 2016; pp. 77–108.
- Chatterjee, R.; Gupta, B.K.; Mohiddin, S.K.; Singh, P.N.; Shekhar, S.; Purohit, R. Dynamic Groundwater Resources of National Capital Territory, Delhi: Assessment, Development and Management Options. Environ. Earth Sci. 2009, 59, 669–686. [Google Scholar] [CrossRef]
- Kumar, A.; Biswas, R.; Modi, R.; Button, C. Place of Social, Cultural, and Ecological Water Values for Promoting Water Security in Delhi, India. Water (Switzerland) 2024, 16. [Google Scholar] [CrossRef]
- Pathak, S.; Jain, K.; Kumar, V.; Pant, R.P. Magnetic Fluid Based High Precision Temperature Sensor. IEEE Sens. J. 2017, 17, 2670–2675. [Google Scholar] [CrossRef]
- Singh, A.; Pathak, S.; Kumar, P.; Sharma, P.; Rathi, A.; Basheed, G.A.; Maurya, K.K.; Pant, R.P. Tuning the Magnetocrystalline Anisotropy and Spin Dynamics in CoxZn1-XFe2O4 (0 ≤ x ≤ 1) Nanoferrites. J. Magn. Magn. Mater. 2020, 493, 165737. [Google Scholar] [CrossRef]
- Kumar, P.; Pathak, S.; Singh, A.; Khanduri, H.; Basheed, G.A.; Wang, L.; Pant, R.P. Microwave Spin Resonance Investigation on the Effect of the Post-Processing Annealing of CoFe 2 O 4 Nanoparticles. Nanoscale Adv. 2020, 2, 1939–1948. [Google Scholar] [CrossRef] [PubMed]
- Singh, A.; Kumar, P.; Pathak, S.; Jain, K.; Garg, P.; Pant, M.; Mahapatro, A.K.; Rath, D.; Wang, L.; Kim, S.-K.; et al. A Threefold Increase in SAR Performance for Magnetic Hyperthermia by Compositional Tuning in Zinc-Substituted Iron Oxide Superparamagnetic Nanoparticles with Superior Biocompatibility. J. Alloys Compd. 2023, 968, 171868. [Google Scholar] [CrossRef]
- Singh, A.; Kumar, P.; Rajput, P.; Jain, K.; Pathak, S.; Puri, S.; Maurya, K.K.; Pant, R.P. Investigating the Impact of Zinc Ion Substitution on the Rheological Properties and Hyperthermia Potential of Cobalt Ferrite-Based Ferrofluids. Mater. Today Proc. 2023. [Google Scholar] [CrossRef]
- Singh, A.; Kumar, P.; Pathak, S.; Jain, K.; Garg, P.; Pant, M.; Mahapatro, A.K.; Singh, R.K.; Rajput, P.; Kim, S.-K.; et al. Tailored Nanoparticles for Magnetic Hyperthermia: Highly Stable Aqueous Dispersion of Mn-Substituted Magnetite Superparamagnetic Nanoparticles by Double Surfactant Coating for Improved Heating Efficiency. J. Alloys Compd. 2024, 976, 172999. [Google Scholar] [CrossRef]
- Bajaj, A.; Jamal, S.; Upadhyay, A.; Kumar, K.; Singh, M. Water Problems and Challenges: A Case Study of Delhi NCR. J. Water L. Use Manag. 17.
- Jain, S.K. Population Rise and Growing Water Scarcity in India–Revised Estimates and Required Initiatives. Curr. Sci. 2011, 101, 271–276. [Google Scholar]
- BUREAU OF INDIAN STANDARDS Product Manual for Drinking Water According To Is 10500 : 2012. 2020, 158, 626.e1-626.e2.
|
Disclaimer/Publisher’s Note: The statements, opinions and data contained in all publications are solely those of the individual author(s) and contributor(s) and not of MDPI and/or the editor(s). MDPI and/or the editor(s) disclaim responsibility for any injury to people or property resulting from any ideas, methods, instructions or products referred to in the content. |
© 2025 by the authors. Licensee MDPI, Basel, Switzerland. This article is an open access article distributed under the terms and conditions of the Creative Commons Attribution (CC BY) license (https://creativecommons.org/licenses/by/4.0/).