
Submitted:
27 December 2024
Posted:
30 December 2024
You are already at the latest version
Abstract
This work presents an advanced CFD model of a 5kW Molten Carbonate Fuel Cell stack intended to provide a broad analysis and deliver improved design through optimizing flow distribution. The goal is to provide variant analysis of flow distribution in the internal channels through the CFD model. SolidWorks was used to design the MCFC stack, and SOLIDWORKS® Flow Simulation was utilized to model the flow distribution inside the stack. The simulated stack was validated through an experimental investigation of a 5kW MCFC stack, empirically measuring pressure and flow distribution in an experimental laboratory station optimized for multi-scale fuel cell stack testing. The test was designed to examine a variety of internal flow distribution factors. The verified CFD model was employed for sensitivity analysis on various scales. To enhance the design, the influence of stack and single-cell constructional characteristics on the 5 kW MCFC was investigated.
Keywords:
fuel cells
; molten carbonate fuel cells
; computational fluid mechanics
; architecture
; mathematical modeling
1. Introduction
Alternative energy sources constitute an increasing share of the energy mix worldwide due to the global drive to cut emissions of greenhouse gases [1,2]. Renewable energy sources are attracting great research interest due to their minimal pollution, but they are prone to highly variable energy production [3]. Thus, energy storage in the form of hydrogen (and NH3) is being developed, as it can be utilized in fuel cells. These fuel cells include molten carbonate fuel cells (MCFC), which can provide electricity and heat. MCFC devices can be of variable size, from 1 kW up to several megawatts, and are easily scalable [4,5]. In addition, the MCFC units are capable of CO2 separation and they have a potential for application in the Power-to-Gas installation [6]. Recently, there were reported various research activities on MCFC development such as examining the supplying the MCFC with liquid fuels [7], the MCFC degradation [8] and study of the MCFC behavior in emergency scenarios [9]. As the numerical 0D models of MCFC stacks are well developed [10,11,12], the next research step is an optimization of the MCFC stack design. The parameters such as flow distribution were not considered in 0D modeling would play an important role in to performance of stack.
In the available literature there are works which are focused on the geometrical stack parameters and its examination based on the CFD modeling. Those simulations provides insight view for impact of the geometry on the temperature distribution on the key stack elements [13].
Within the stack and the temperature variations of key components Verda et al. [14] examined the possible design improvements of MCFC stacks, as the mass the temperature distribution impact the fuel cell efficiency and its lifetime. Authors have developed 3D model of the circular MCFC stack composed of 15 cells. Based on the proposed improvements, it was revealed that power density may be increased of about 20% through double side feeding. Additionally, the significant reductions in the temperature gradients, especially in transversal direction, can be achieved by adjusting the mass flow rate of cathodic gas supplied to the various cells.
Roh et al. [15] present the results of CFD modeling of a whole building containing an MCFC stack. The model includes all additional equipment, valves, pumps, etc. The modeling aimed to determine the strands of gas leakage in the vicinity of the fuel cell; the results of the simulations are shown in Figure 1. They set out the three-dimensional characteristics of the temperature, pressure, flow, and chemical composition of gases in the room. The model was developed for a fuel cell with rated power of 300 kW. As a result of the analyses, guidelines were developed for the room ventilation system and for the natural gas pipelines supplying the fuel cells.
A more detailed analysis of CFD results can be found in the publication [16], where a single fuel cell from a stack with a nominal power of 5 kW was analyzed. The entire stack consisted of 7 such fuel cells with an area of 7500 cm2 each. As a result of the calculations, the distributions of pressure, temperature and density of the electric current were obtained (see Figure 2).
The electric charge from the cell's surface is received through profiled metal plates, known as the current collector (see Figure 3). The shape and size of current collectors can affect the distribution of the main parameters inside the fuel cell. This issue was analyzed in detail using the CFD technique in publication [17].
Analysis was carried out in respect of a number of parameters influenced by the presence of the current collector, such as gas velocities and the accompanying pressure losses for both the cathode flow (see Figure 4) and the anode flow.
Publication [18] presents the results of CFD analysis for an MCFC separator with an area of 10,000 cm2. The results of the CFD analysis are shown in Figure 5. The purpose of the simulation was to check whether there is an even distribution of gas flow with a pressure drop of 14 Pa on the cathode side. The modeling results were verified by an experiment with the use of a smoke generator.
Due to the nature of the ionic conductivity of the electrolyte, MCFCs must be fed with a mixture of air and carbon dioxide on the cathode side. One method of supplying carbon dioxide to the cathode gas stream is by recycling the anode gases. However, the rest of the fuel must be oxidized in the air stream and this can be done with special afterburning chambers. The CFD analysis of this type of device is presented in publication [19] (for the results of the simulations, see Figure 7).
Simulations for the channel connecting individual anode channels and channels with internal reforming are included in the article [20]. The simulation results show the velocity fields based on which the flow-rate uniformity was estimated (see Figure 7).
Kyu-Seok Jung et al. [21] developed a CFD model of MCFC which considers electrochemical reaction, fluid, heat transfer, and reforming reaction of the external and internal reforming-type molten carbonate fuel cells. The model was used for the comparison of MCFC performance operating at the various conditions. The findings indicate that elevated temperatures and pressures enhance performance, while variations in gas composition significantly influence efficiency and output.
Yu and Lee [22] employ computational fluid dynamics (CFD) to investigate how varying the size of molten carbonate fuel cells (MCFCs) influences their performance and thermal characteristics. They analyze three flow configurations—co-flow, counter-flow, and cross-flow—across different cell sizes, ranging from 0.1 to 2 meters. The results reveal that beyond a certain size threshold, further increases in cell dimensions do not significantly impact performance metrics. Additionally, the study finds that the maximum temperature within the fuel cells converges as size increases, with this convergence point being dependent on the specific gas flow conditions.
The paper investigates the flow dynamics within a 5 kW MCFC stack using CFD simulations. The reliability of the stack is closely linked to the pressure differences between the cathode and anode sides. When current is drawn from the stack, a significant amount of heat is generated, necessitating its removal through an increased flow of cooling or oxidizing streams. The increased demand for cooling gas (oxidant gas) through the cathode side, could lead to the large pressure differences that can leading to shorting between electrodes. Another problem is the high velocity of gases – MCFCs achieve higher efficiency the more time the fuel spends in the anode chamber. Thus, the cross-section areas of electrode chambers should be related to gas manifold channel areas, seeking optimal gas flow through the fuel cell in order to reduce large pressure differences across the fuel cell and on both sides of the matrix.
The focus of this study is a CFD-based variant analysis of the internal flow distribution of the 5kW MCFC stack. The 5 kW MCFC stack was developed and manufactured by Warsaw University of Technology and Fuel Cell Poland LTD. Due to the liquid nature of the electrolyte, the issue of internal flow distribution is extremely significant in the MCFC: overpressure in one channel could push the molten electrolyte. The main scientific novelty of the paper is the advanced CFD model, validated on experimental investigation of internal flow distribution. Few CFD models of fuel cell stacks appear in the literature and none were validated against experimental observations of flow distribution in a real system. This research model enables a comprehensive sensitivity analysis of the MCFC stack in order to propose an appropriate control strategy.
2. Theory
2.1. Experimental Setup
The experimental investigation of pressure distribution in MCFC stack was conducted on a laboratory setup designed for testing MCFC stacks. Dried air was used as the working medium in the test and was pumped by a compressor at an operating pressure of 6 bar. The air was delivered and regulated through a Bronkhorst EL-FLOW mass flow controller with flow adjust range 15..500 Nl/min. The air was delivered to the stack through a DN32 pipe with a mechanical pressure sensor connected to the stack inlet. The pressure sensor used in the test has the measuring range 0..100 mbar with accuracy +/- 0.5%. In the MCFC stack the gas was delivered to the anode side inlet, and the rest of the pipes were open (see Figure 8).
Pressure drop was measured at anode side of the MCFC stack. The measurements are presented in the section “Model validation” and compared with CFD predictions.
2.2. Numerical Model
The MCFC stack was designed in SolidWorks 2020. Flow distribution inside the stack was simulated in SOLIDWORKS® Flow Simulation [23]. SOLIDWORKS® Flow Simulation is a widely used computational fluid mechanics tool [24,25,26], and the convergence of simulation results from ANSYS CFX 18.2 with SOLIDWORKS® Flow Simulation [27] allows SOLIDWORKS® Flow Simulation to be considered the primary tool for evaluating key elements of the MCFC stack.
The software is based on the Navier-Stokes equations, which combine mass, momentum and energy conservation for fluid flows. The conservation laws for mass, angular momentum and energy in the Cartesian coordinate system rotating with angular velocity about an axis passing through the coordinate system's origin are calculated by the following equations:
u fluid velocity,
ρ fluid density,
Si mass-distributed external force per unit mass due to porous media resistance,
h thermal enthalpy,
QH heat source or sink per unit volume,
τij viscous shear stress tensor,
qi diffusive heat flux. The subscripts denote summation over the three coordinate directions.
SOLIDWORKS® Flow Simulation solves the governing equations with a discrete numerical technique based on the finite volume method. The Cartesian rectangular coordinate system is used. Thus, the mesh cells are rectangular parallelepipeds with faces orthogonal to the specified axes of the Cartesian coordinate system. However, the cells are more complex near the boundary mesh. The near-boundary cells are portions of the original parallelepiped cells that are cut by the geometry boundary.
The heat transfer between the solid and fluid media is defined by the energy conservation equation 3, where the heat flux is defined by:
The stack consists of 60 repetitive fuel cells, but to optimize the performance of the CFD analysis, flow distribution was examined in only one fuel cell. The CFD analysis was based on internal flows inside the model. The fluid body assembly is shown in Figure 10.
The inlet opening was selected as a “flow” opening boundary condition with the specified gas parameters (see Table 1).
The predictions of the CFD model were compared with experimental data. Firstly, the impact of mesh size on the results was examined and compared with the experimental data. The results of the examination are shown in Figure 11. The mesh size corresponds to the general setting in Fluid Flow Simulation Solidworks Application.
As the simulation results became slightly dependent on the mesh size, the CFD prediction was plotted against the experimental data.
Since the CFD predictions closely reflect the experimental data, the SOLIDWORKS® Flow Simulation and the implemented model are assumed to be reliable and can be used for further examination.
3. Numerical Analysis of the Flow Distribution Inside the Electrode Channel
The 5 kW stack of MCFCs consists of 60 repetitive fuel cells. The nominal operation conditions for the stack operating at OCV are listed in Table 2.
In addition, to the nominal operating point, MCFC operation should be examined at two extra operating points, which are distinguished by fuel cell temperature:
- 450°C – melting temperature of electrolyte. Below 450°C, electrolyte is in powder form, which could be easily pushed out by a large overpressure.
- 500°C – the minimum operating temperature of MCFC. The flow distribution is examined to deliver data for the MCFC control strategy.
- 650°C – the nominal operating temperature of MCFC. At this operating point, flow distribution is the primary focus of interest.
Thus, flow distribution was investigated at 3 operating points, and the pressure plots were collected for each point. The pressure plots for the anode channel are shown in Figure 13.
The operating temperature 450°C and flow rate 0.5 Nl/min result in uniform pressure distribution across the channel. The pressure difference is less than 1 mbar. With an increase of temperature and flow rate, nonuniformity increases to 6 mbar (flow 4.0 Nl/min and 650°C). Additionally, the cross-flow of the gases is observed in the pressure distribution plots, i.e., gases for the cathode channel flow crosswise with respect to the anode channel.
The graph revealed the maximum overpressure at the anode side could reach 6 mbar for the nominal operating temperature. Based on the CFD prediction, the overpressure at the anode channel for three temperatures was plotted in Figure 14.
Conclusions
The work presents research on the gas flow distribution in a 5 kW MCFC stack, considering the integration of experimental validation with advanced CFD modeling. Unlike previous studies, which primarily focused on idealized or simplified models, this research bridges the gap between theoretical predictions and practical observations, offering a realistic assessment of the flow distribution challenges in operational MCFC systems. The validation proved the correctness of the adopted assumptions for the simulation as well as the choice of software: SOLIDWORKS® Flow Simulation gives reliable results for CFD predictions.
Key findings include the characterization of pressure distribution and its sensitivity to operational parameters such as temperature and gas flow rates. The study revealed that at the nominal operating temperature of 650°C, the maximum overpressure at the anode channel could reach 6 mbar, emphasizing the critical role of precise flow management in ensuring the stable operation of the fuel cell stack. Notably, the flow uniformity deteriorates with increasing temperature and flow rate, highlighting the challenges of managing thermal and flow dynamics in high-performance fuel cells. This was evident in the observed cross-flow of gases between the cathode and anode channels, a phenomenon that necessitates careful structural and operational adjustments to minimize performance losses. At 450°C, the uniform pressure distribution indicates a stable operational state, while higher temperatures and flow rates exacerbate non-uniformity flow. These findings are critical for developing strategies to mitigate adverse effects and enhance the durability and efficiency of MCFC stacks.
The implications of these findings extend beyond the immediate scope of this study. The validated CFD model serves as a powerful tool for sensitivity analysis and optimization, providing a foundation for designing control strategies to manage flow and pressure dynamics effectively. Additionally, the insights gained from this work contribute to the broader field of fuel cell research, particularly in the context of scaling up MCFC technology for industrial and power generation applications.
By addressing critical challenges in flow distribution and validating the findings through experimental data, the study provides a robust framework for enhancing the performance and reliability of MCFC systems. Future research should focus on extending this analysis to larger stacks and exploring advanced control mechanisms to further refine the operational efficiency of MCFC technology.
4. Acknowledgements
This paper has been prepared within the framework of the project: “Modular system based on Molten Carbonate Fuel Cells with tailored composite membranes designed for specific flue gas compositions oriented into CCS integration with an industrial power plant” - NOR/POLNORCCS/MOLCAR/0017/2020-00 which is co-financed by the programme “Applied research” under the Norwegian Financial Mechanisms 2014–2021 POLNOR CCS 2019 - Development of CO2 capture solutions integrated in power and industry processes. A part of research was funded by the Warsaw University of Technology within the Excellence Initiative: Research University (IDUB) programme under agreements “1820/92/Z01/2023”, “CPR-IDUB/55/Z01/2024”, “1820/304/201/2021”, and PostDoc PW
References
- Comission, E. Energy Union Package, A Framework Strategy for a Resilient Energy Union with a Forward-Looking Climate Change Policy. 2015, COM(2015).
- Nations, U. “Paris Agreement.” Report of the Conference of the Parties to the United Nations Framework Convention on Climate Change. (21st Sess.
- Liu, H.; Khan, M.Y.A.; Yuan, X. Hybrid Maximum Power Extraction Methods for Photovoltaic Systems: A Comprehensive Review. Energies 2023, 16. [Google Scholar] [CrossRef]
- Ishikawa, T.; Yasue, H. Start-up, Testing and Operation of 1000 KW Class MCFC Power Plant. J. Power Sources 2000, 86, 145–150. [Google Scholar] [CrossRef]
- Bischoff, M.; Huppmann, G. Operating Experience with a 250 KWel Molten Carbonate Fuel Cell (MCFC) Power Plant. J. Power Sources 2002, 105, 216–221. [Google Scholar] [CrossRef]
- Milewski, J.; Zdeb, J.; Szcz\keśniak, A.; Martsinchyk, A.; Kupecki, J.; Dybiński, O. Concept of a Solid Oxide Electrolysis-Molten Carbonate Fuel Cell Hybrid System to Support a Power-to-Gas Installation. Energy Convers. Manag. 2023, 276, 116582. [Google Scholar] [CrossRef]
- Dybiński, O.; Milewski, J.; Szabłowski, Ł.; Szczęśniak, A.; Martinchyk, A. Methanol, Ethanol, Propanol, Butanol and Glycerol as Hydrogen Carriers for Direct Utilization in Molten Carbonate Fuel Cells. Int. J. Hydrogen Energy 2023. [Google Scholar] [CrossRef]
- Dybiński, O.; Milewski, J.; Szcz\keśniak, A.; Martsinchyk, A.; Szabłowski, Ł. Experimental Investigation of Porous Anode Degradation of a Molten Carbonate Fuel Cell Fed with Direct Fermentation Product Composed of Bioethanol. Int. J. Hydrogen Energy 2023. [Google Scholar] [CrossRef]
- Szczęśniak, A.; Milewski, J.; Szabłowski, Ł.; Dybiński, O.; Futyma, K. Numerical Analysis of a Molten Carbonate Fuel Cell Stack in Emergency Scenarios. J. Energy Resour. Technol. 2020, 142. [Google Scholar] [CrossRef]
- Szczęśniak, A.; Milewski, J.; Szabłowski, Ł.; Bujalski, W.; Dybiński, O. Dynamic Model of a Molten Carbonate Fuel Cell 1 KW Stack. Energy 2020, 200, 117442. [Google Scholar] [CrossRef]
- Milewski, J.; Wołowicz, M.; Miller, A.; Bernat, R. A Reduced Order Model of Molten Carbonate Fuel Cell: A Proposal. Int. J. Hydrogen Energy 2013, 38. [Google Scholar] [CrossRef]
- Shuhayeu, P.; Martsinchyk, A.; Martsinchyk, K.; Szcz\keśniak, A.; Szabłowski, Ł.; Dybiński, O.; Milewski, J. Model-Based Quantitative Characterization of Anode Microstructure and Its Effect on the Performance of Molten Carbonate Fuel Cell. Int. J. Hydrogen Energy 2023. [Google Scholar] [CrossRef]
- Kim, Y.; Lim, K.; Salihi, H.; Heo, S.; Ju, H. The Effects of Stack Configurations on the Thermal Management Capabilities of Solid Oxide Electrolysis Cells. Energies 2023, 17, 125. [Google Scholar] [CrossRef]
- Verda, V.; Sciacovelli, A. Design Improvement of Circular Molten Carbonate Fuel Cell Stack through CFD Analysis. Appl. Therm. Eng. 2011, 31, 2740–2748. [Google Scholar] [CrossRef]
- Roh, G.; Na, Y.; Park, J.-Y.; Kim, H. Analysis of Internal Gas Leaks in an MCFC System Package for an LNG-Fueled Ship. Appl. Sci. 2019, 9, 2330. [Google Scholar] [CrossRef]
- Kim, S.-G.; Choi, Y.-J.; Jun, J.; Lim, H.-C.; Lee, J.-E. Verification of CFD Modeling for 5kW Class MCFC Stack Composed of 7 Unit Cells with 7,500cm 2 in Effective Electrode Area. ECS Trans. 2008, 12, 467–474. [Google Scholar] [CrossRef]
- Marra, D.; Bosio, B.; Arato, E. Fluid-Dynamic Characterisation of MCFC Gas Distributors. Chem. Eng. Process. Process Intensif. 2009, 48, 797–807. [Google Scholar] [CrossRef]
- Kim, S.-G.; Kuk, S.T.; Choi, Y.-J.; Jun, J.; Kim, D.-H.; Kim, B.; Lim, H.-C. Operation Results of the External Reforming Type 75kW Class MCFC Stack. ECS Trans. 2010, 26, 399–406. [Google Scholar] [CrossRef]
- Roh, G.; Na, Y.; Park, J.-Y.; Kim, H.W.H.; Kim, S.-G.; Choi, Y.-J.; Jun, J.; Lim, H.-C.C.; Lee, J.-E.; Seo, H.K.; et al. Computational Fluid Dynamic Analyses of Catalytic Combustors for 100 KW-Class Molten Carbonate Fuel Cell. Int. J. Hydrogen Energy 2009, 26, 72–78. [Google Scholar] [CrossRef]
- Cho 2008 Numerical Analysis of the Gas Flow Distribution Characteristics in the Anode Flow Channel of the Molten Carbonate Fuel Cell (MCFC).Pdf.
- Liu, X.; Chen, B.; Zhao, Y.; Jung, K.-S.; Zhang, K.; Lee, C.-W. Simulation of Internal Manifold-Type Molten Carbonate Fuel Cells (MCFCs) with Different Operating Conditions. Energies 2023, Vol. 16, Page 2700 2023, 16, 2700. [Google Scholar] [CrossRef]
- Yu, J.-H.; Lee, C.-W. Effect of Cell Size on the Performance and Temperature Distribution of Molten Carbonate Fuel Cells. Energies 2020, 13, 1361. [Google Scholar] [CrossRef]
- Matsson, J.E. An Introduction to SolidWorks ® Flow Simulation 2011.
- Wallace, J.S. INVESTIGATION OF SOLIDWORKS FLOW SIMULATION AS A VALID TOOL FOR ANALYZING AIRFOIL PERFORMANCE CHARACTERISTICS IN LOW REYNOLDS NUMBER FLOWS. 2019.
- Omo-Oghogho, E.; Sadjere, E.G. Analysis of a Simulated Flat Plate Solar Collector System Using Solidworks Flow Simulator Interface. Int. J. Eng. Innov. Res. 2020, 2, 121–128. [Google Scholar]
- Khoshim, B.S.; Akhmatov, A.A. DETERMINATION OF OPTIMAL QUANTITIES AND SIZES OF TANGENTIAL SWIRLERS OF VORTEX DEVICES IN SOLIDWORKS FLOW SIMULATION. J. Chem. Technol. 2021, 29, 442–448. [Google Scholar] [CrossRef]
- Ramlan, Imadduddin and Darlis, N. Comparison between Solidworks and Ansys Flow Simulation on Aerodynamic Studies. J. Des. Sustain. Environ. 2020, 2. [Google Scholar]
Figure 1.
Path lines of inlet flows from louvers and outlet flows to the exit holes on the ceiling (a) frontal view and (b) backside view [15].
Figure 1.
Path lines of inlet flows from louvers and outlet flows to the exit holes on the ceiling (a) frontal view and (b) backside view [15].
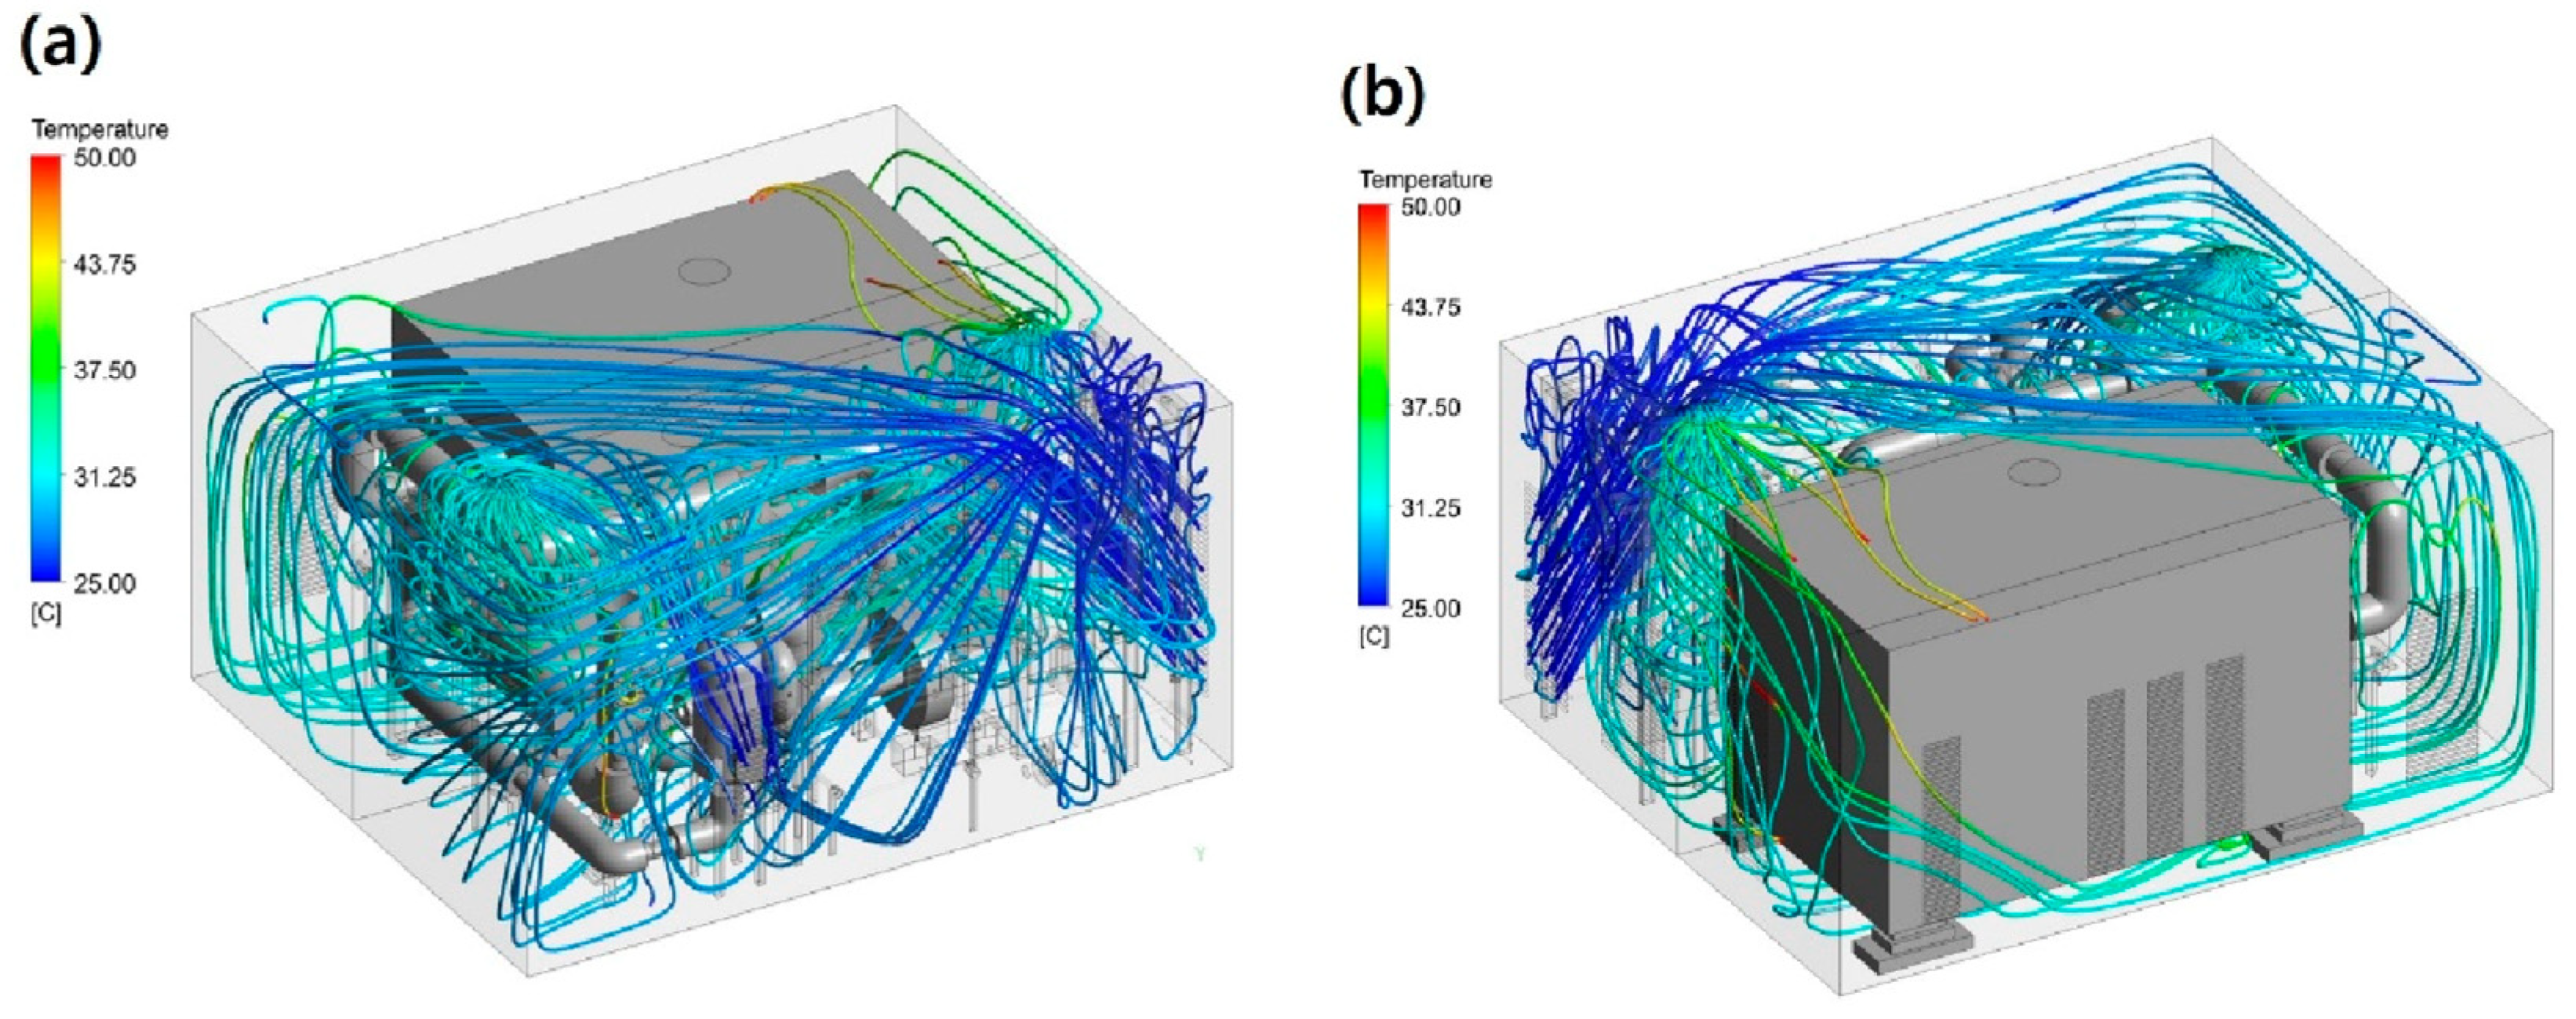
Figure 2.
CFD results of (a) pressure drop, (b) temperature distribution, and (c) current [16].
Figure 2.
CFD results of (a) pressure drop, (b) temperature distribution, and (c) current [16].
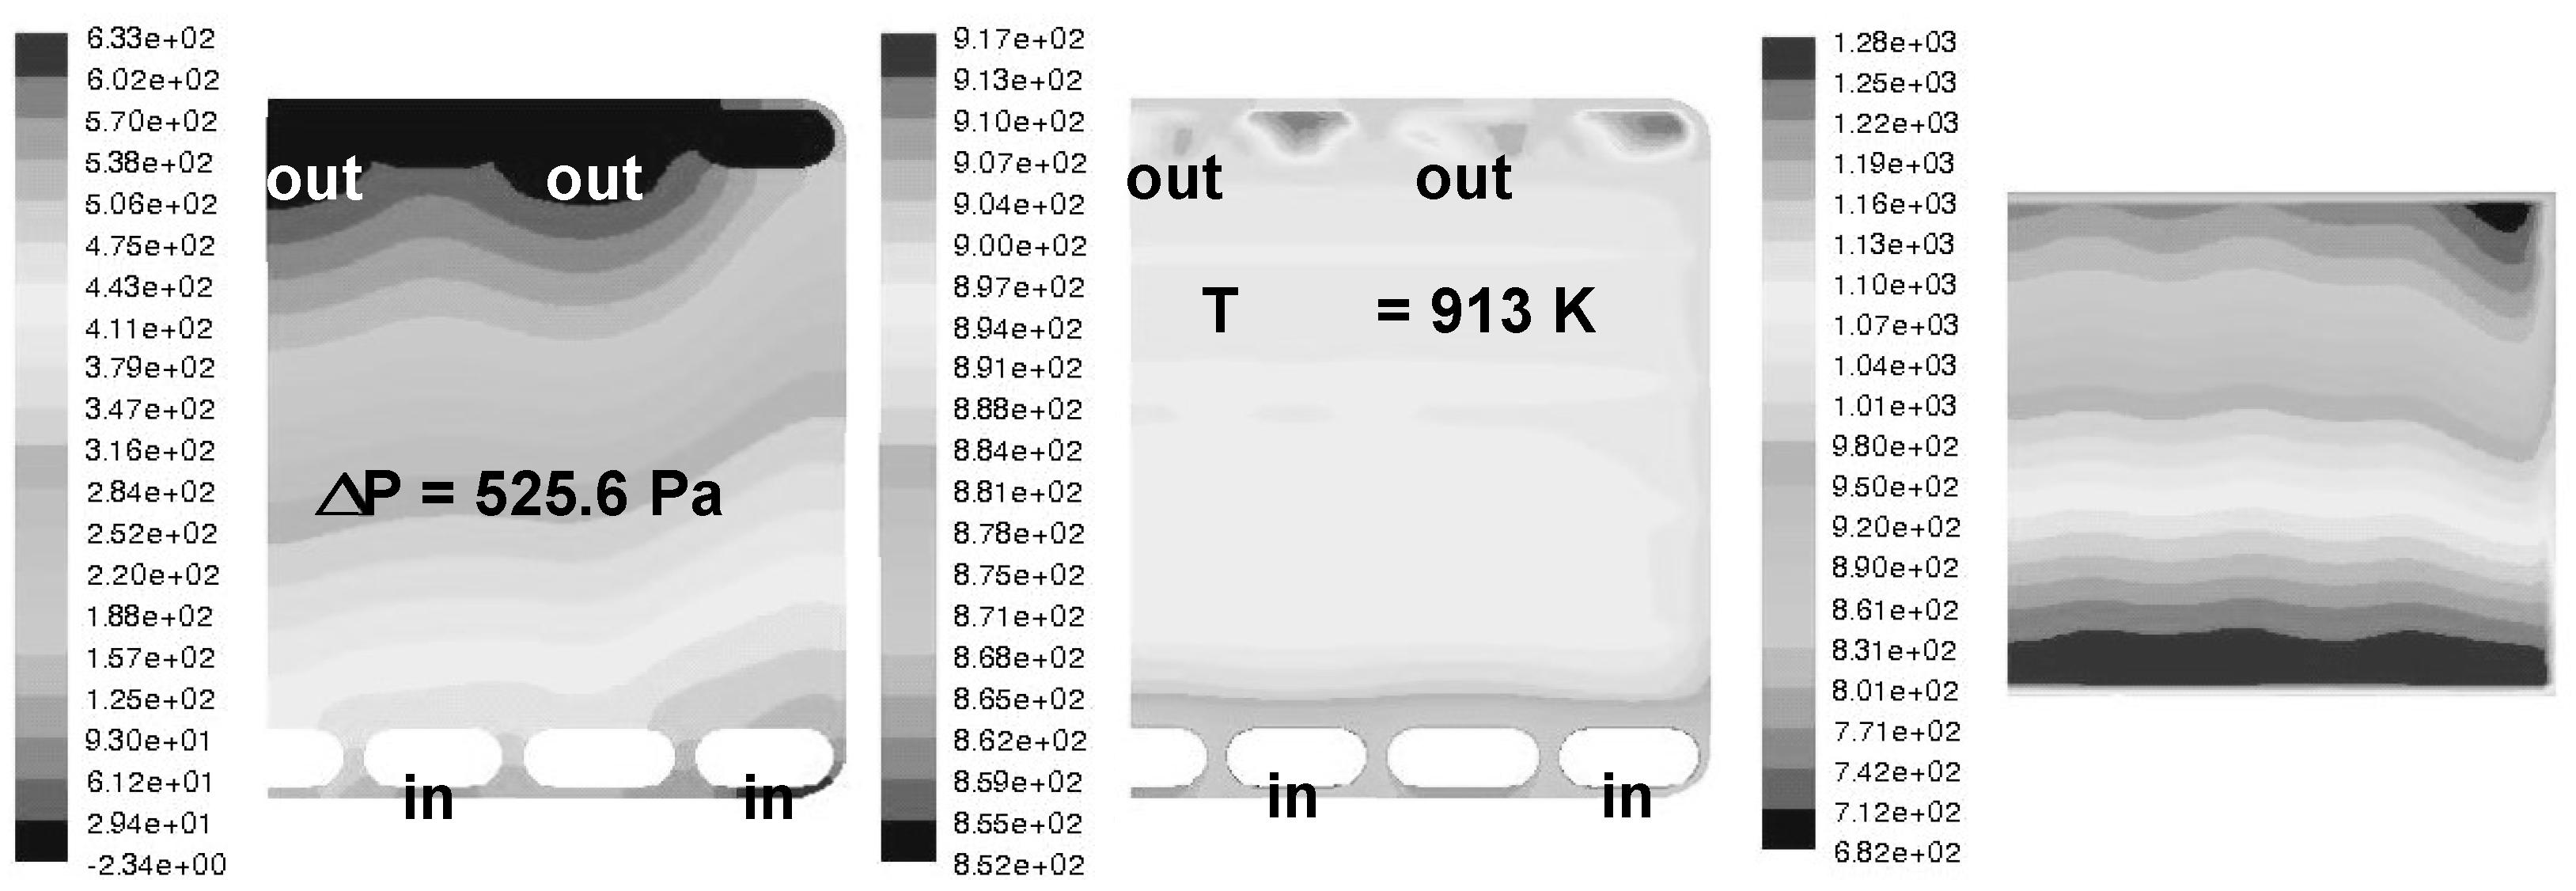
Figure 3.
CAD drawing of a portion of the current collector/gas distributor [17].
Figure 3.
CAD drawing of a portion of the current collector/gas distributor [17].
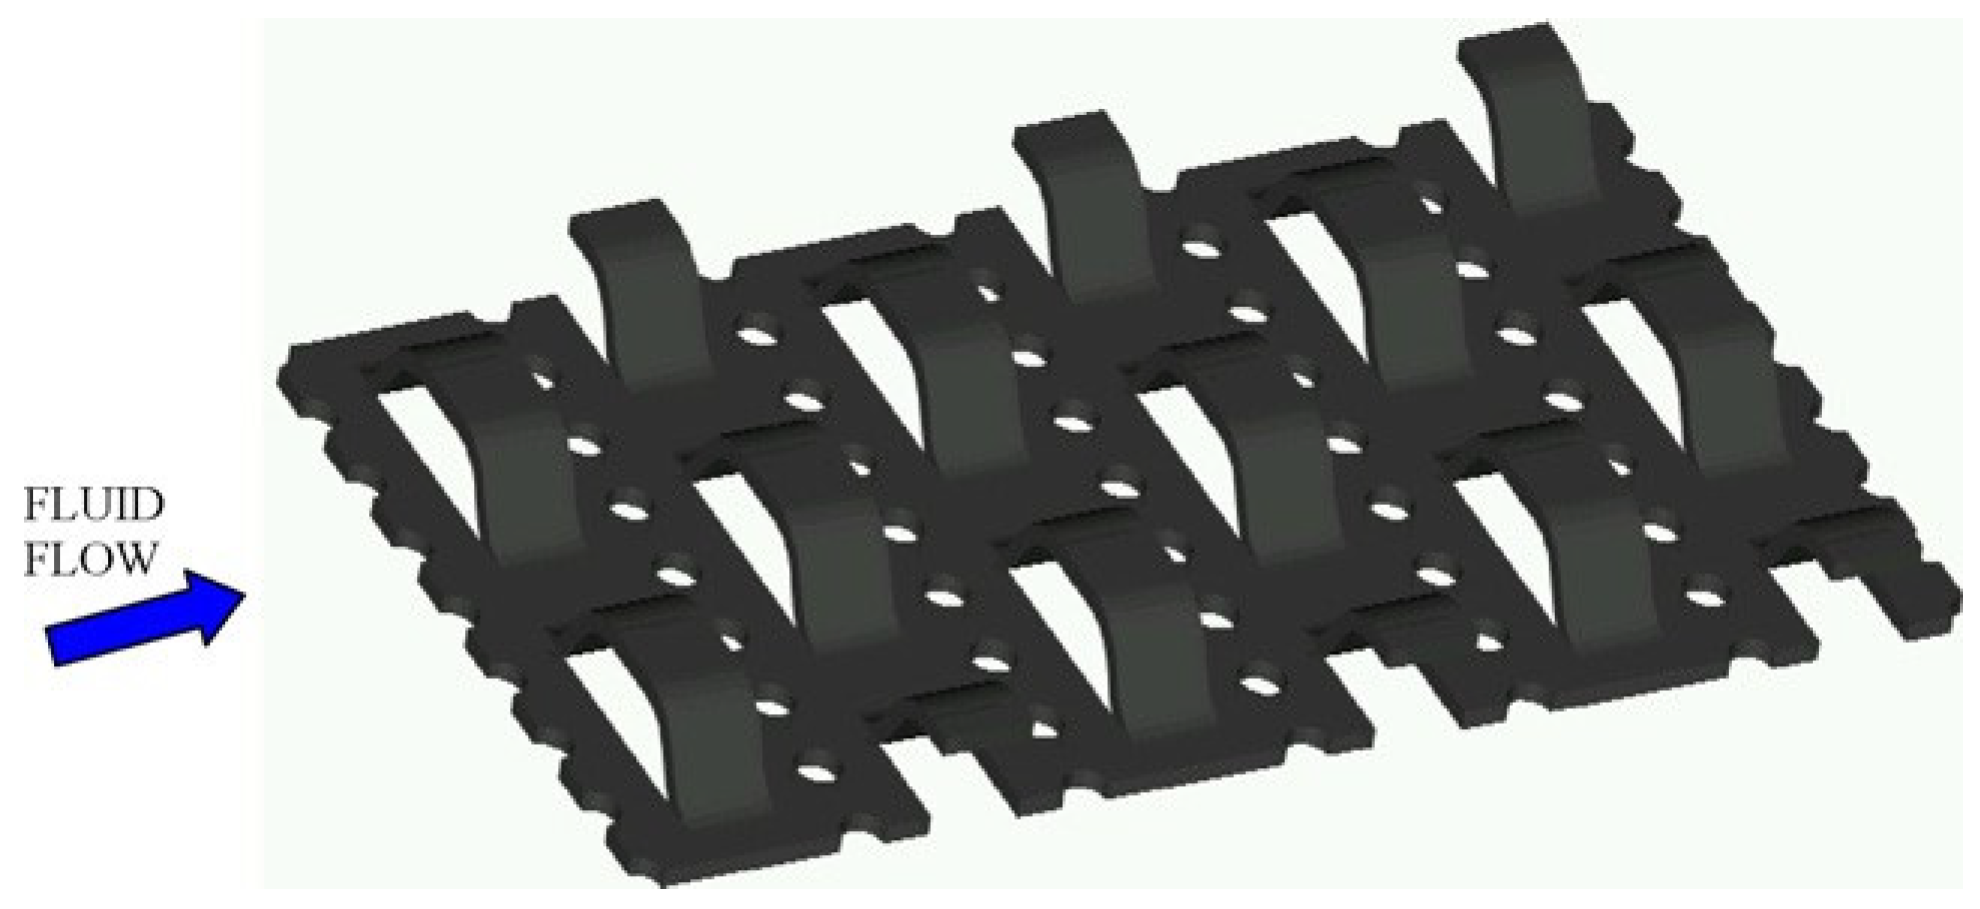
Figure 4.
Longitudinal model of the cathodic gas [17].
Figure 4.
Longitudinal model of the cathodic gas [17].
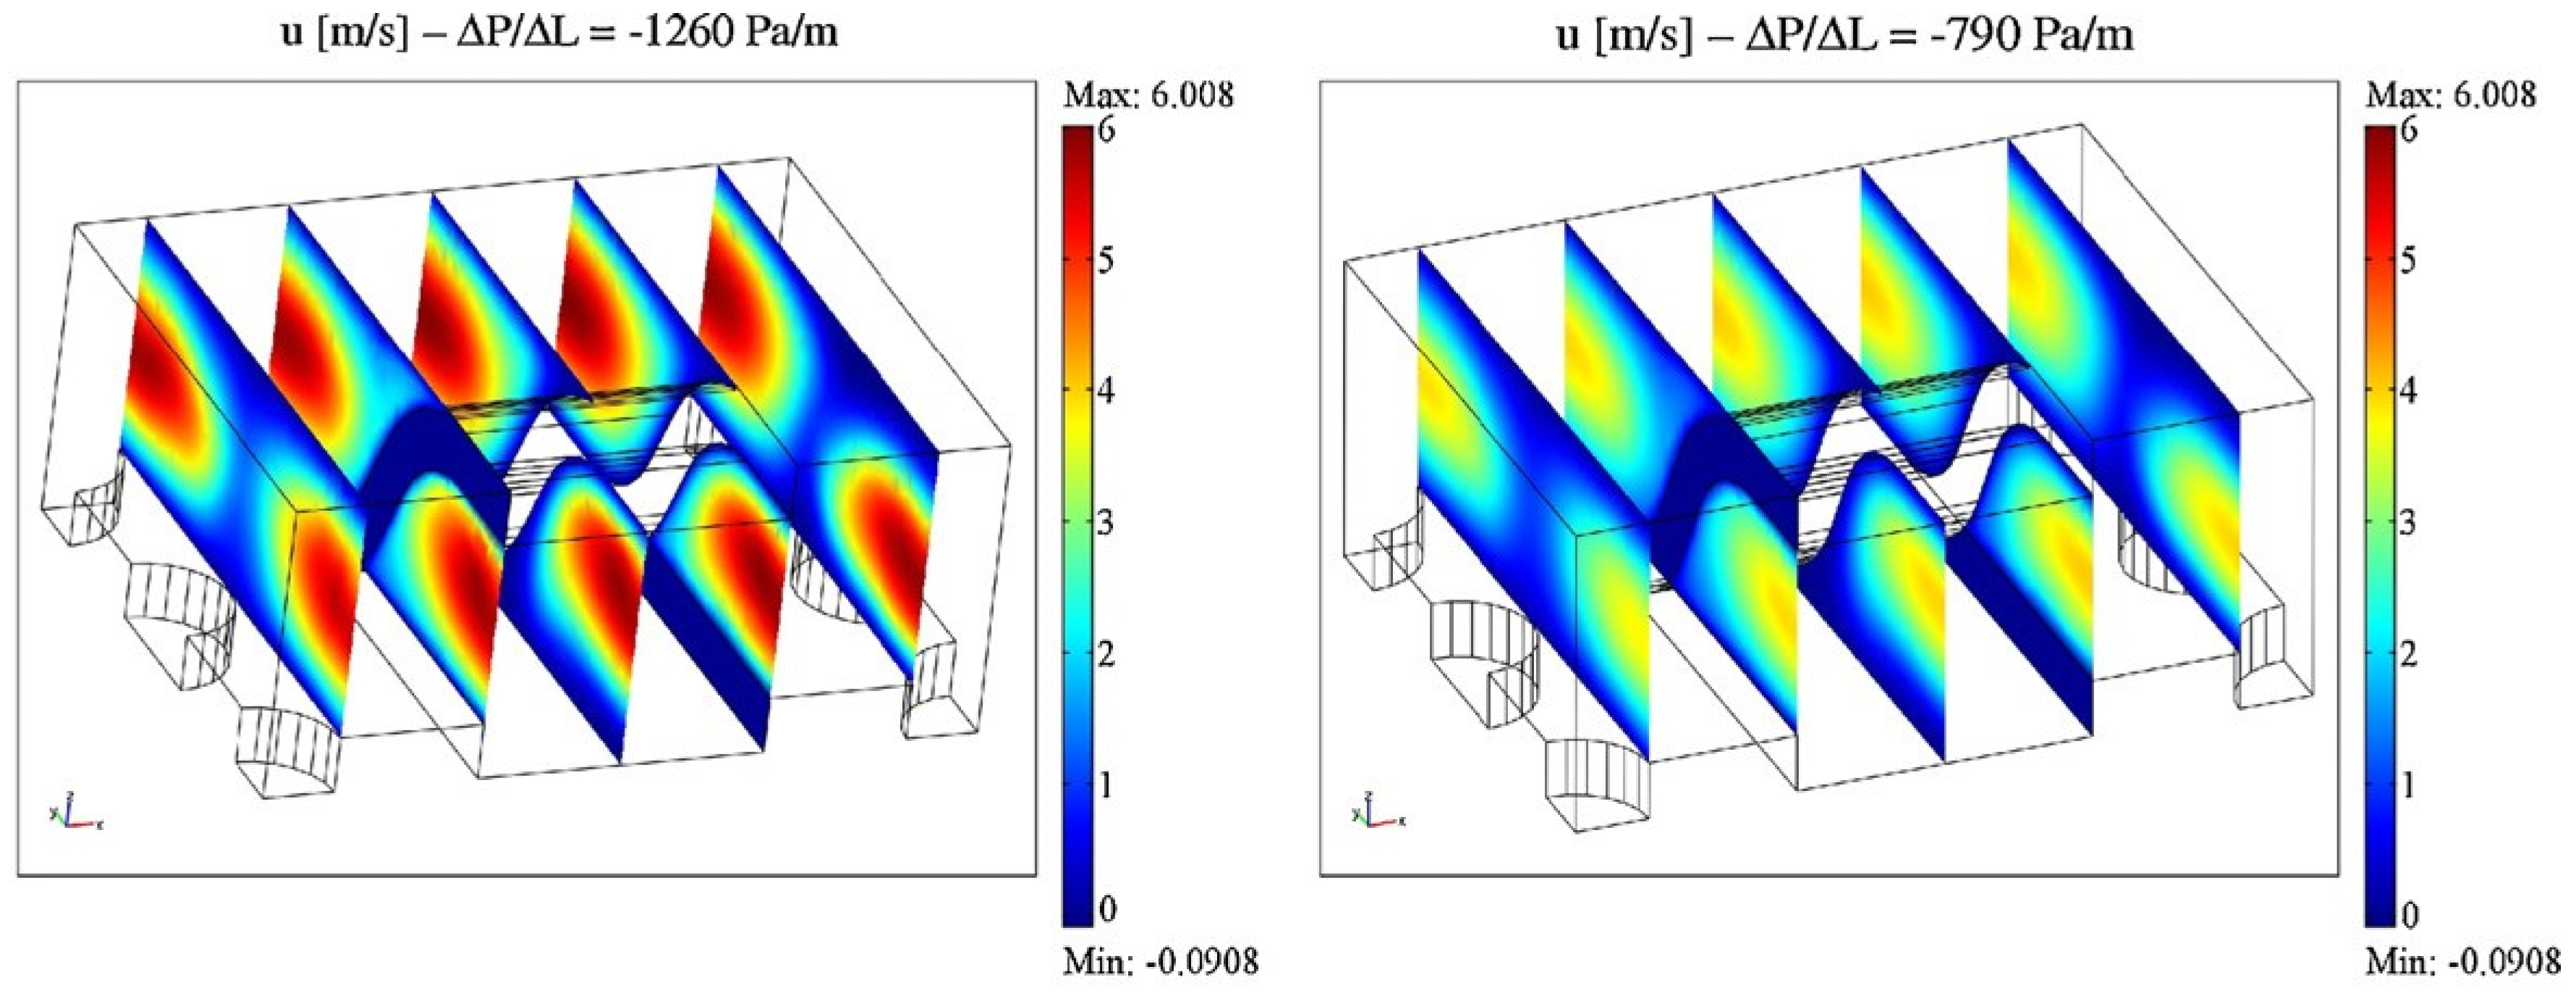
Figure 5.
The results of CFD analysis for gas velocity(left) and pressure drop(right) from inlet manifold to outlet manifold of air in MCFC separator [18].
Figure 5.
The results of CFD analysis for gas velocity(left) and pressure drop(right) from inlet manifold to outlet manifold of air in MCFC separator [18].
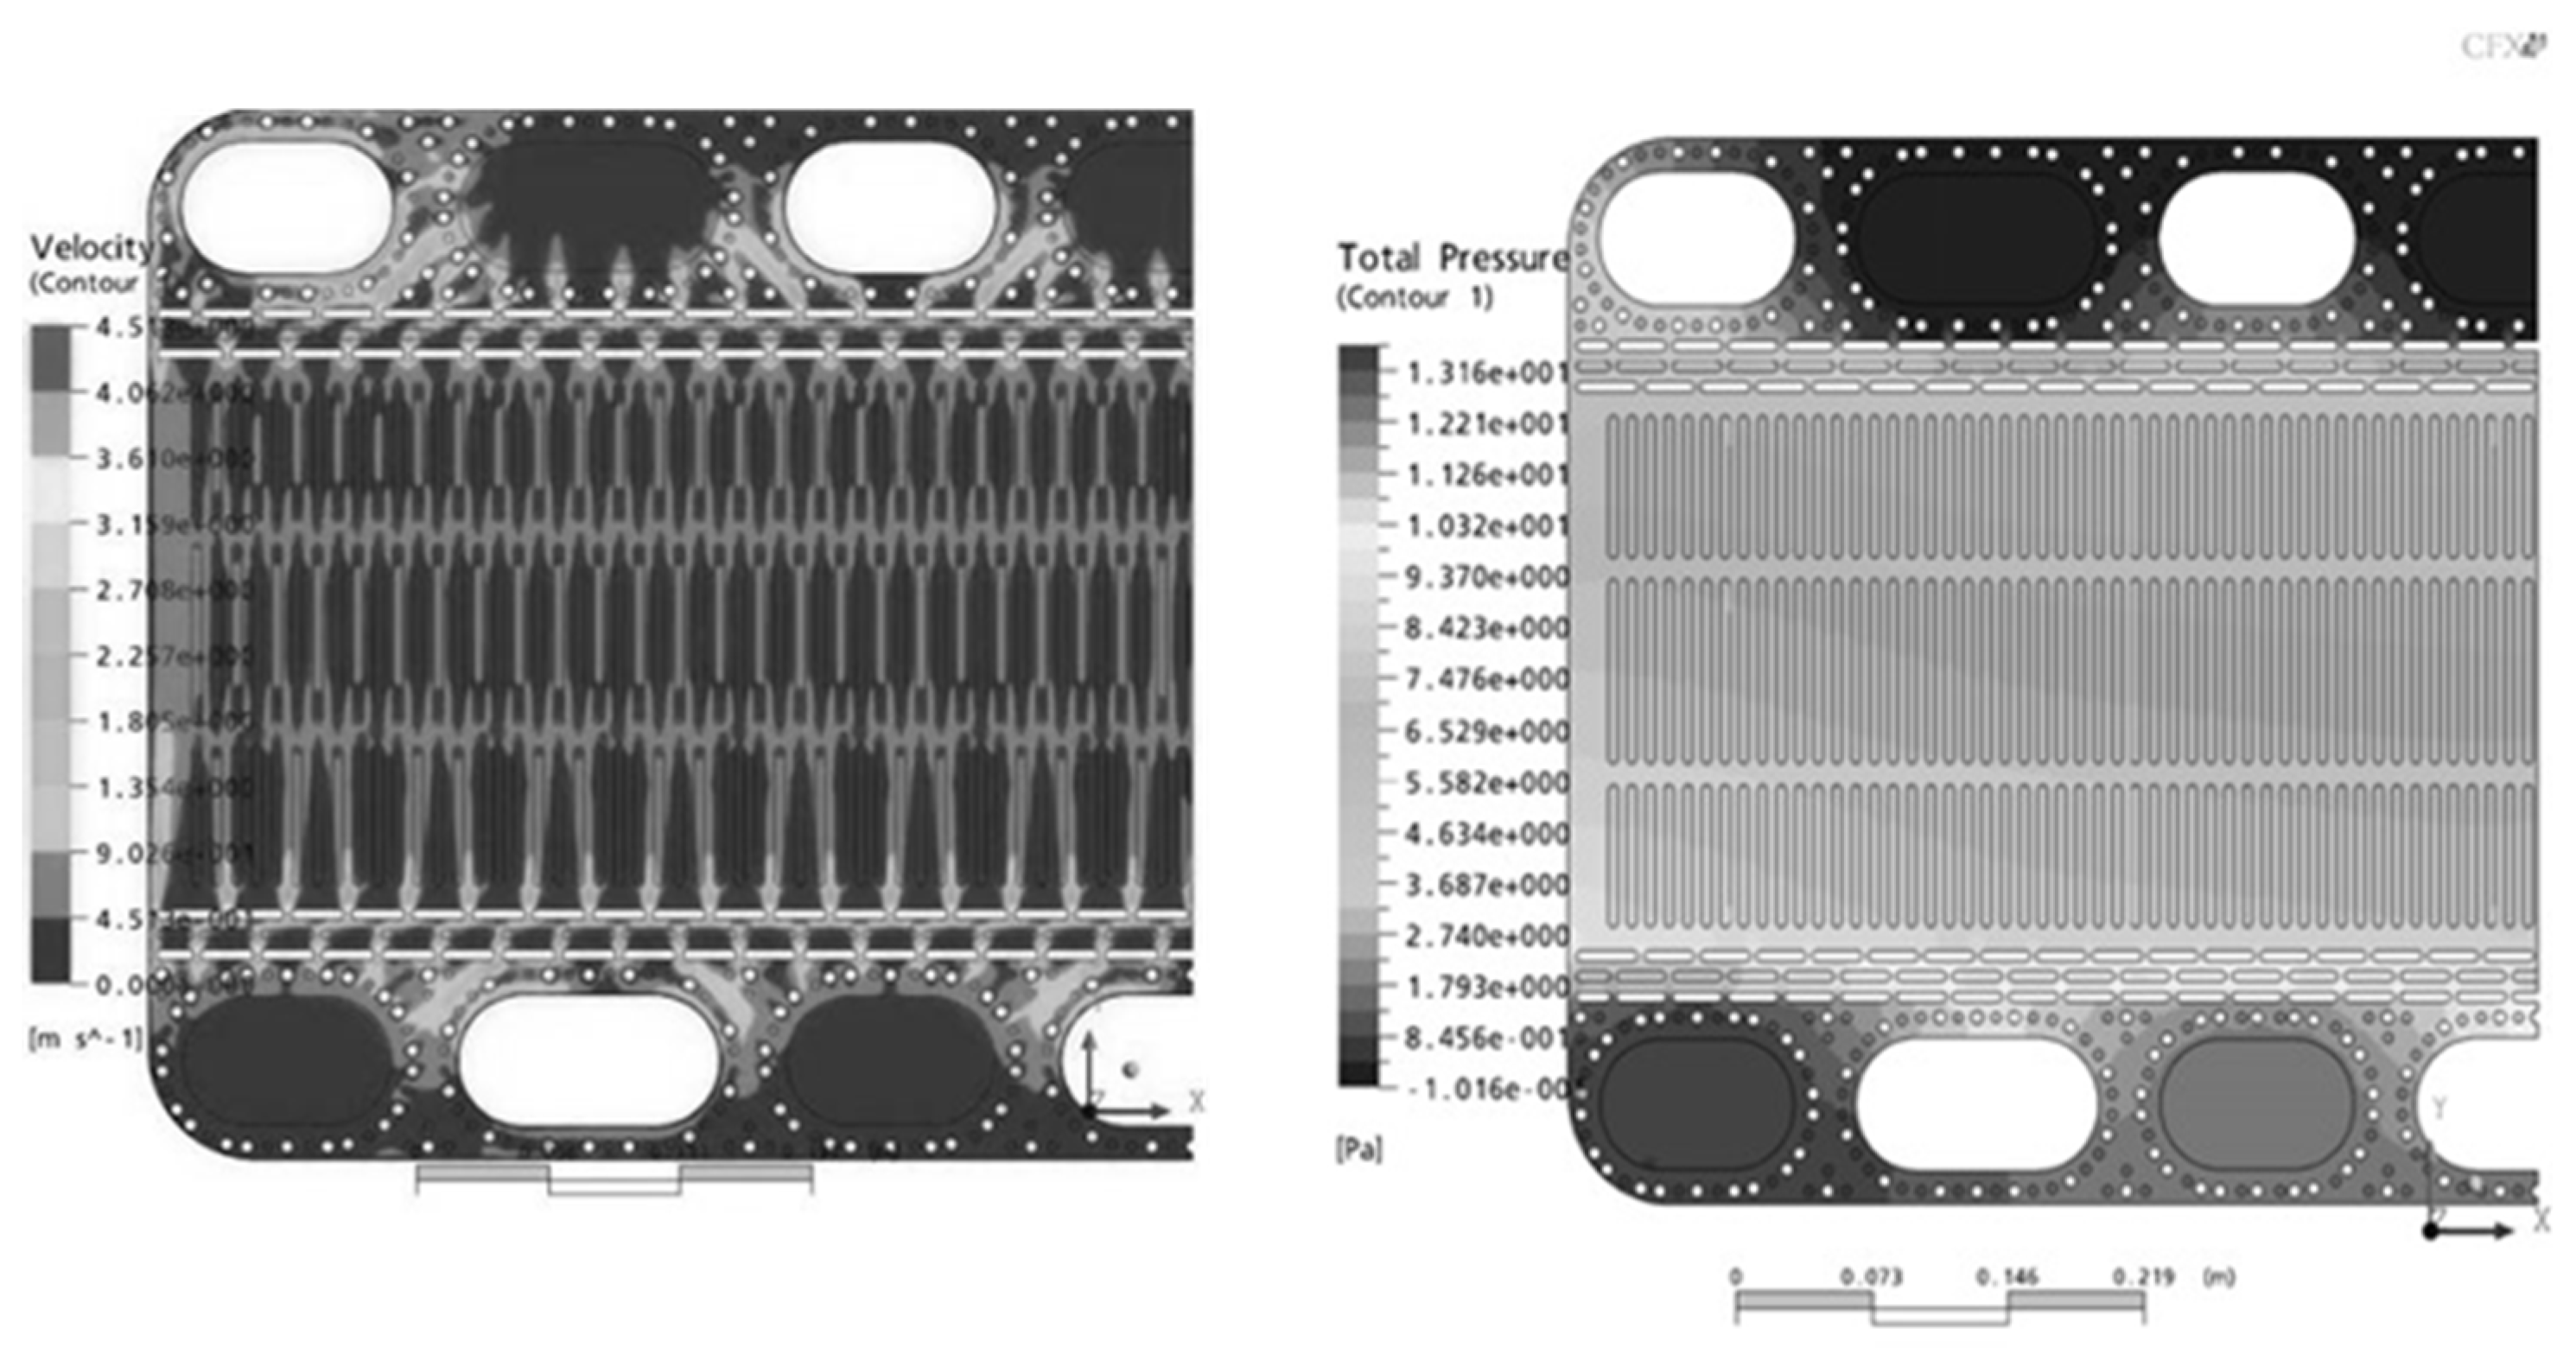
Figure 6.
: Flow path and temperature (K) distribution of the gases in the revised structure without a swirl device [19].
Figure 6.
: Flow path and temperature (K) distribution of the gases in the revised structure without a swirl device [19].
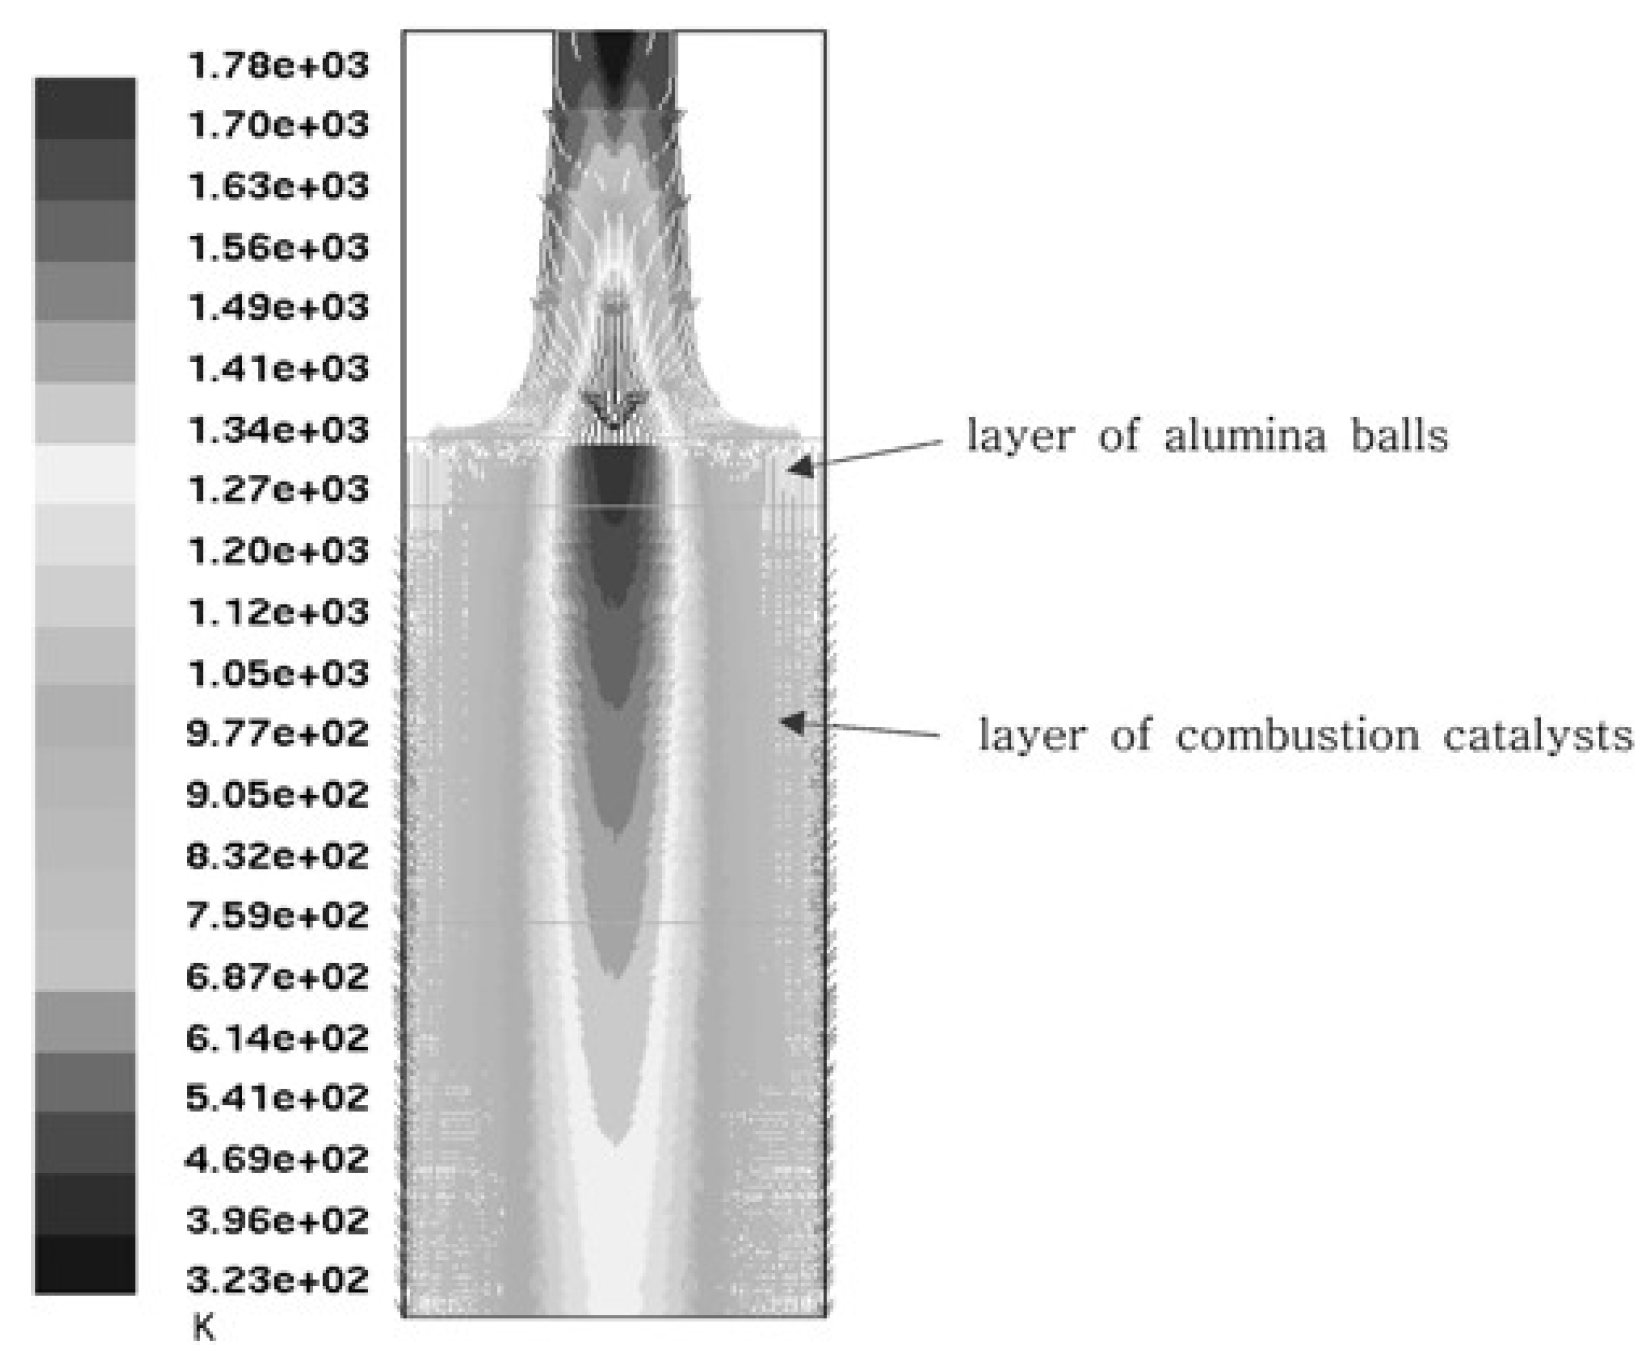
Figure 7.
: Flow-rate uniformity of the anode channels under mal-distributed inlet flow-rate condition [20].
Figure 7.
: Flow-rate uniformity of the anode channels under mal-distributed inlet flow-rate condition [20].
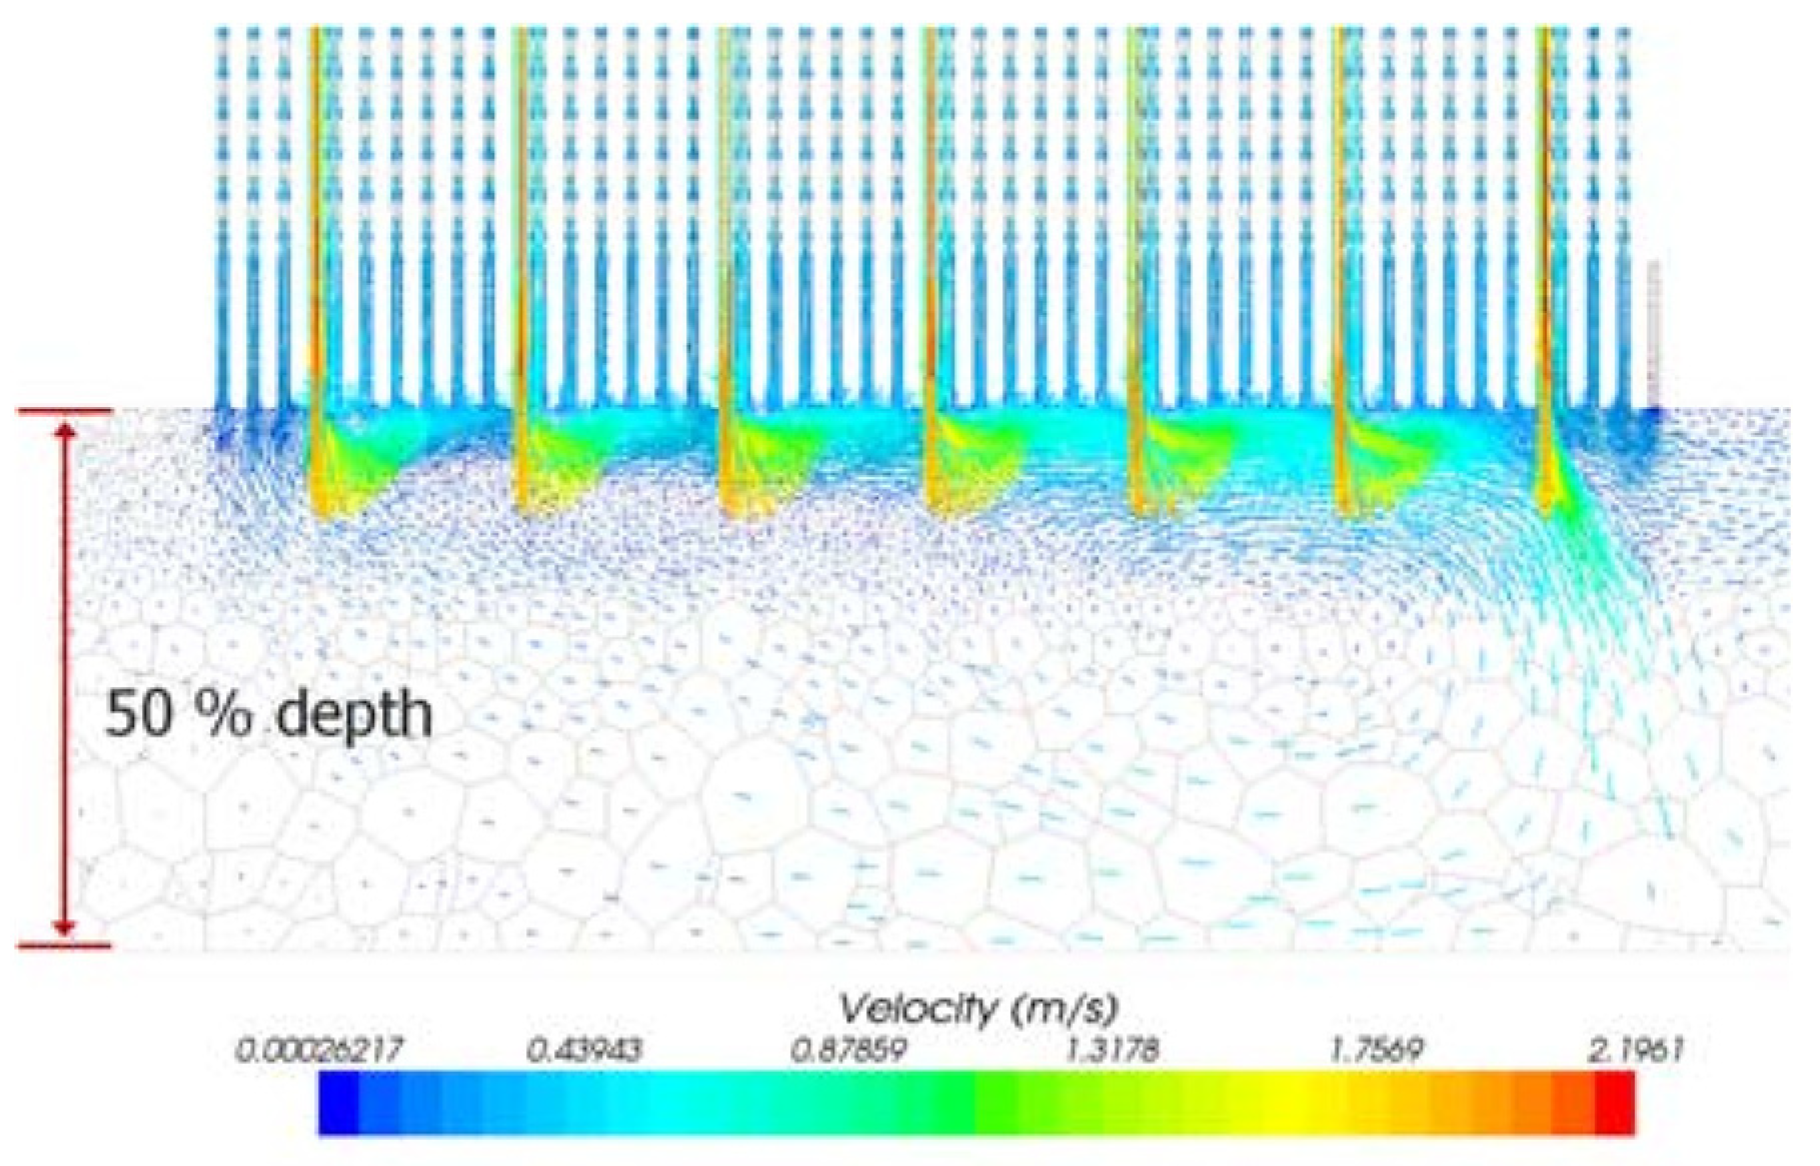
Figure 8.
: Experimental setup used to test pressure drop in the MCFC stack.
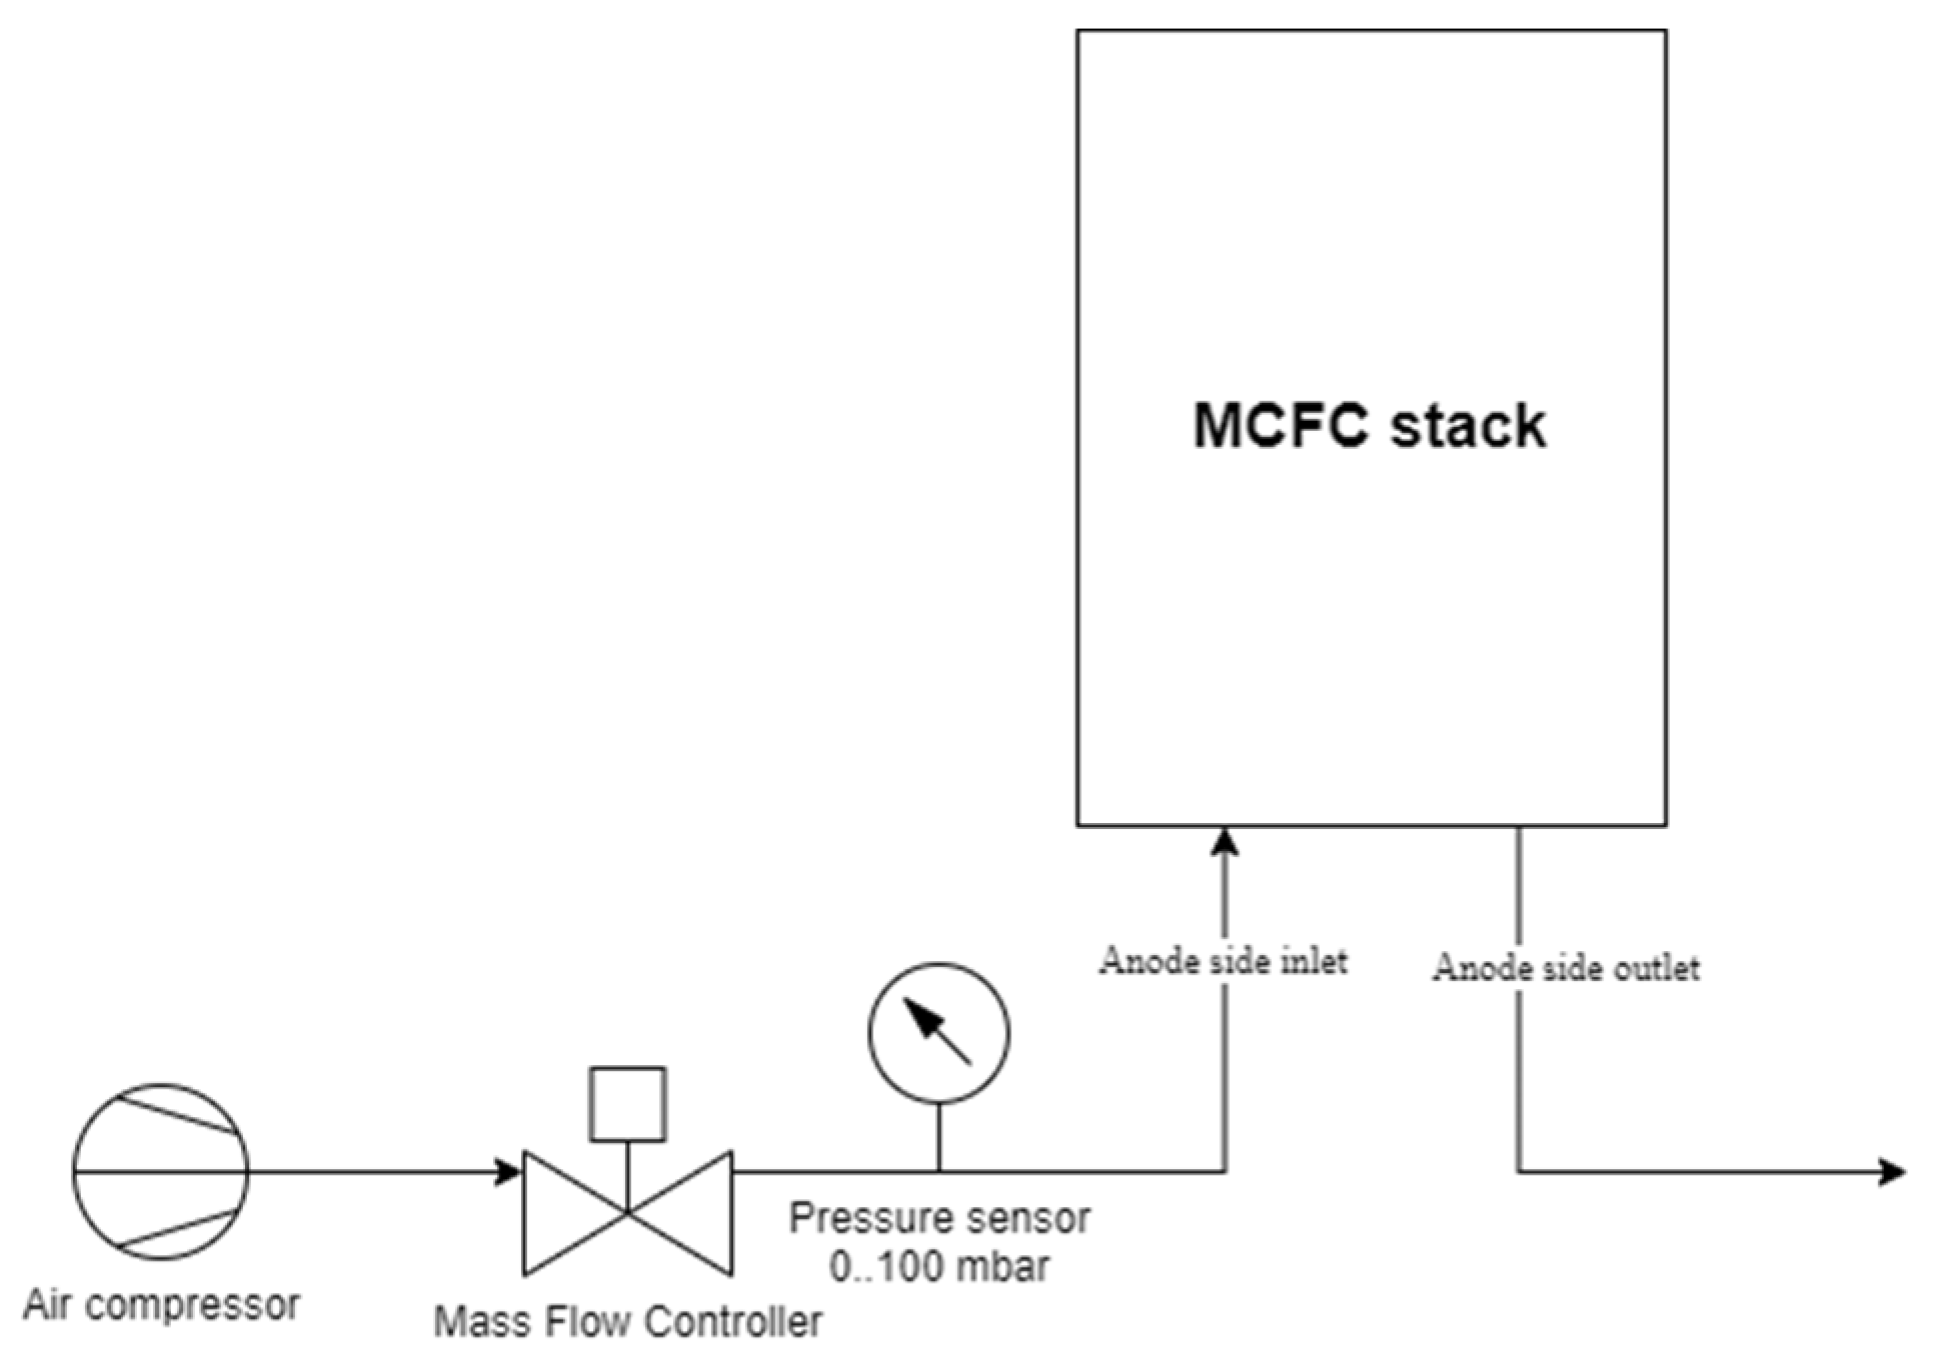
Figure 9.
: 5kW MCFC stack, used as a reference for CFD model and validation.
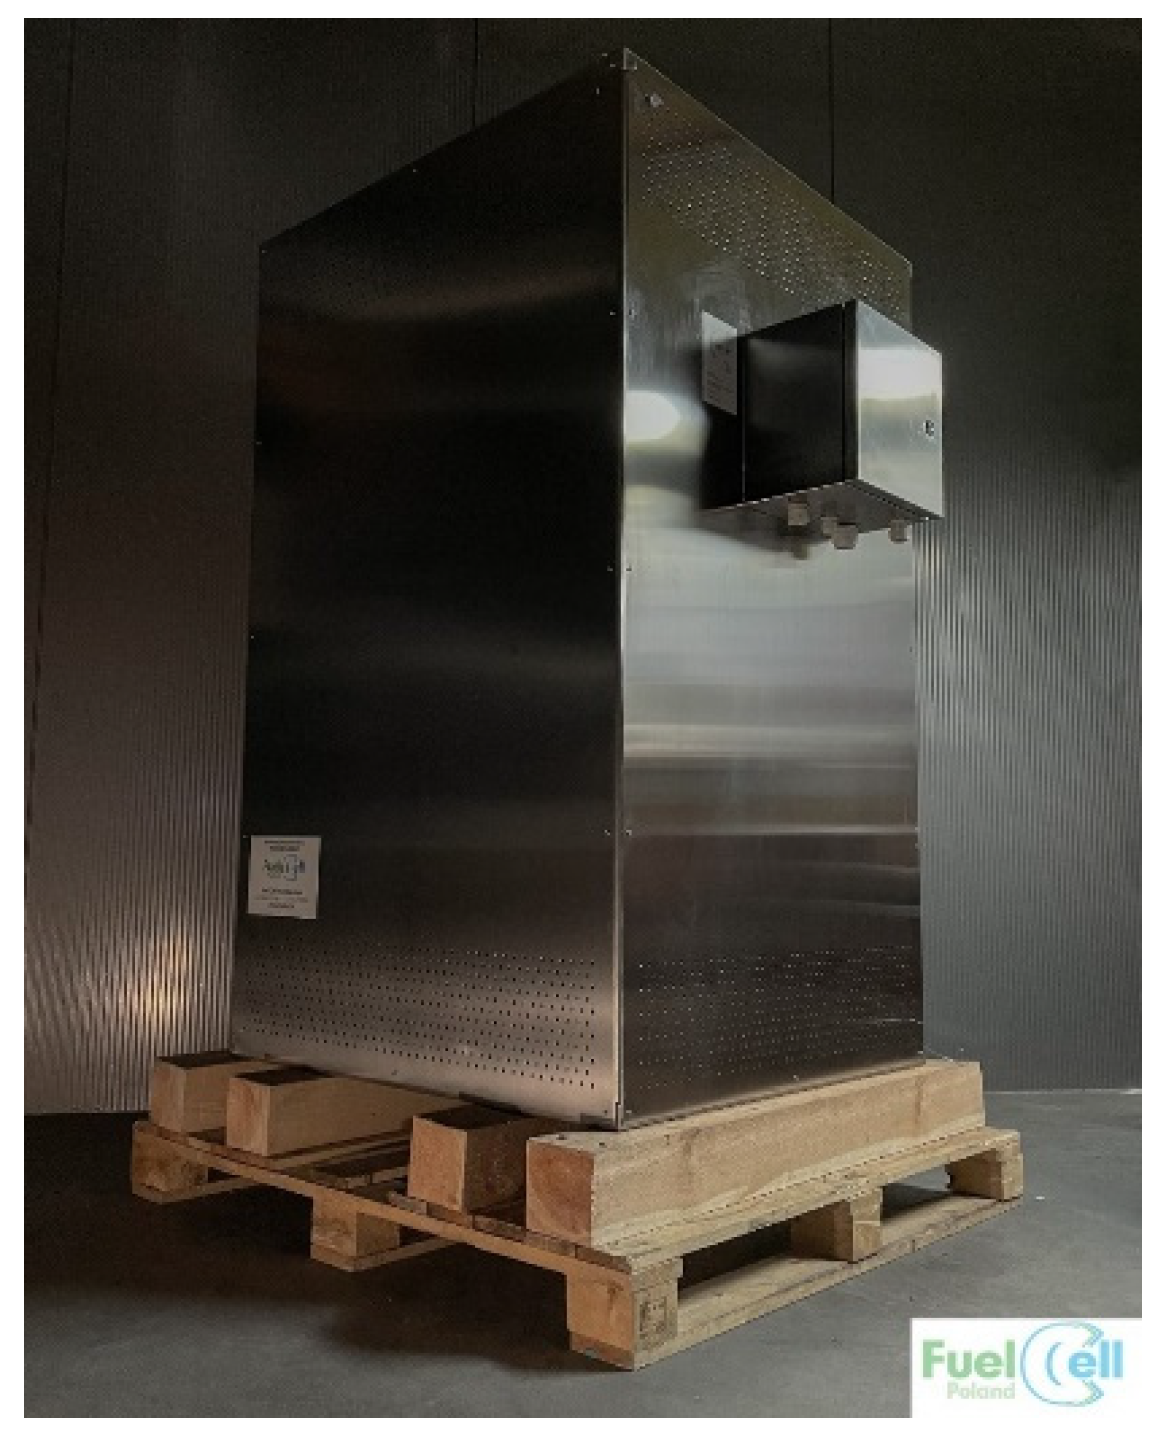
Figure 10.
: Bottom manifold of MCFC stack a) in CFD simulation, b) bottom view with inlets / outlets indication.
Figure 10.
: Bottom manifold of MCFC stack a) in CFD simulation, b) bottom view with inlets / outlets indication.
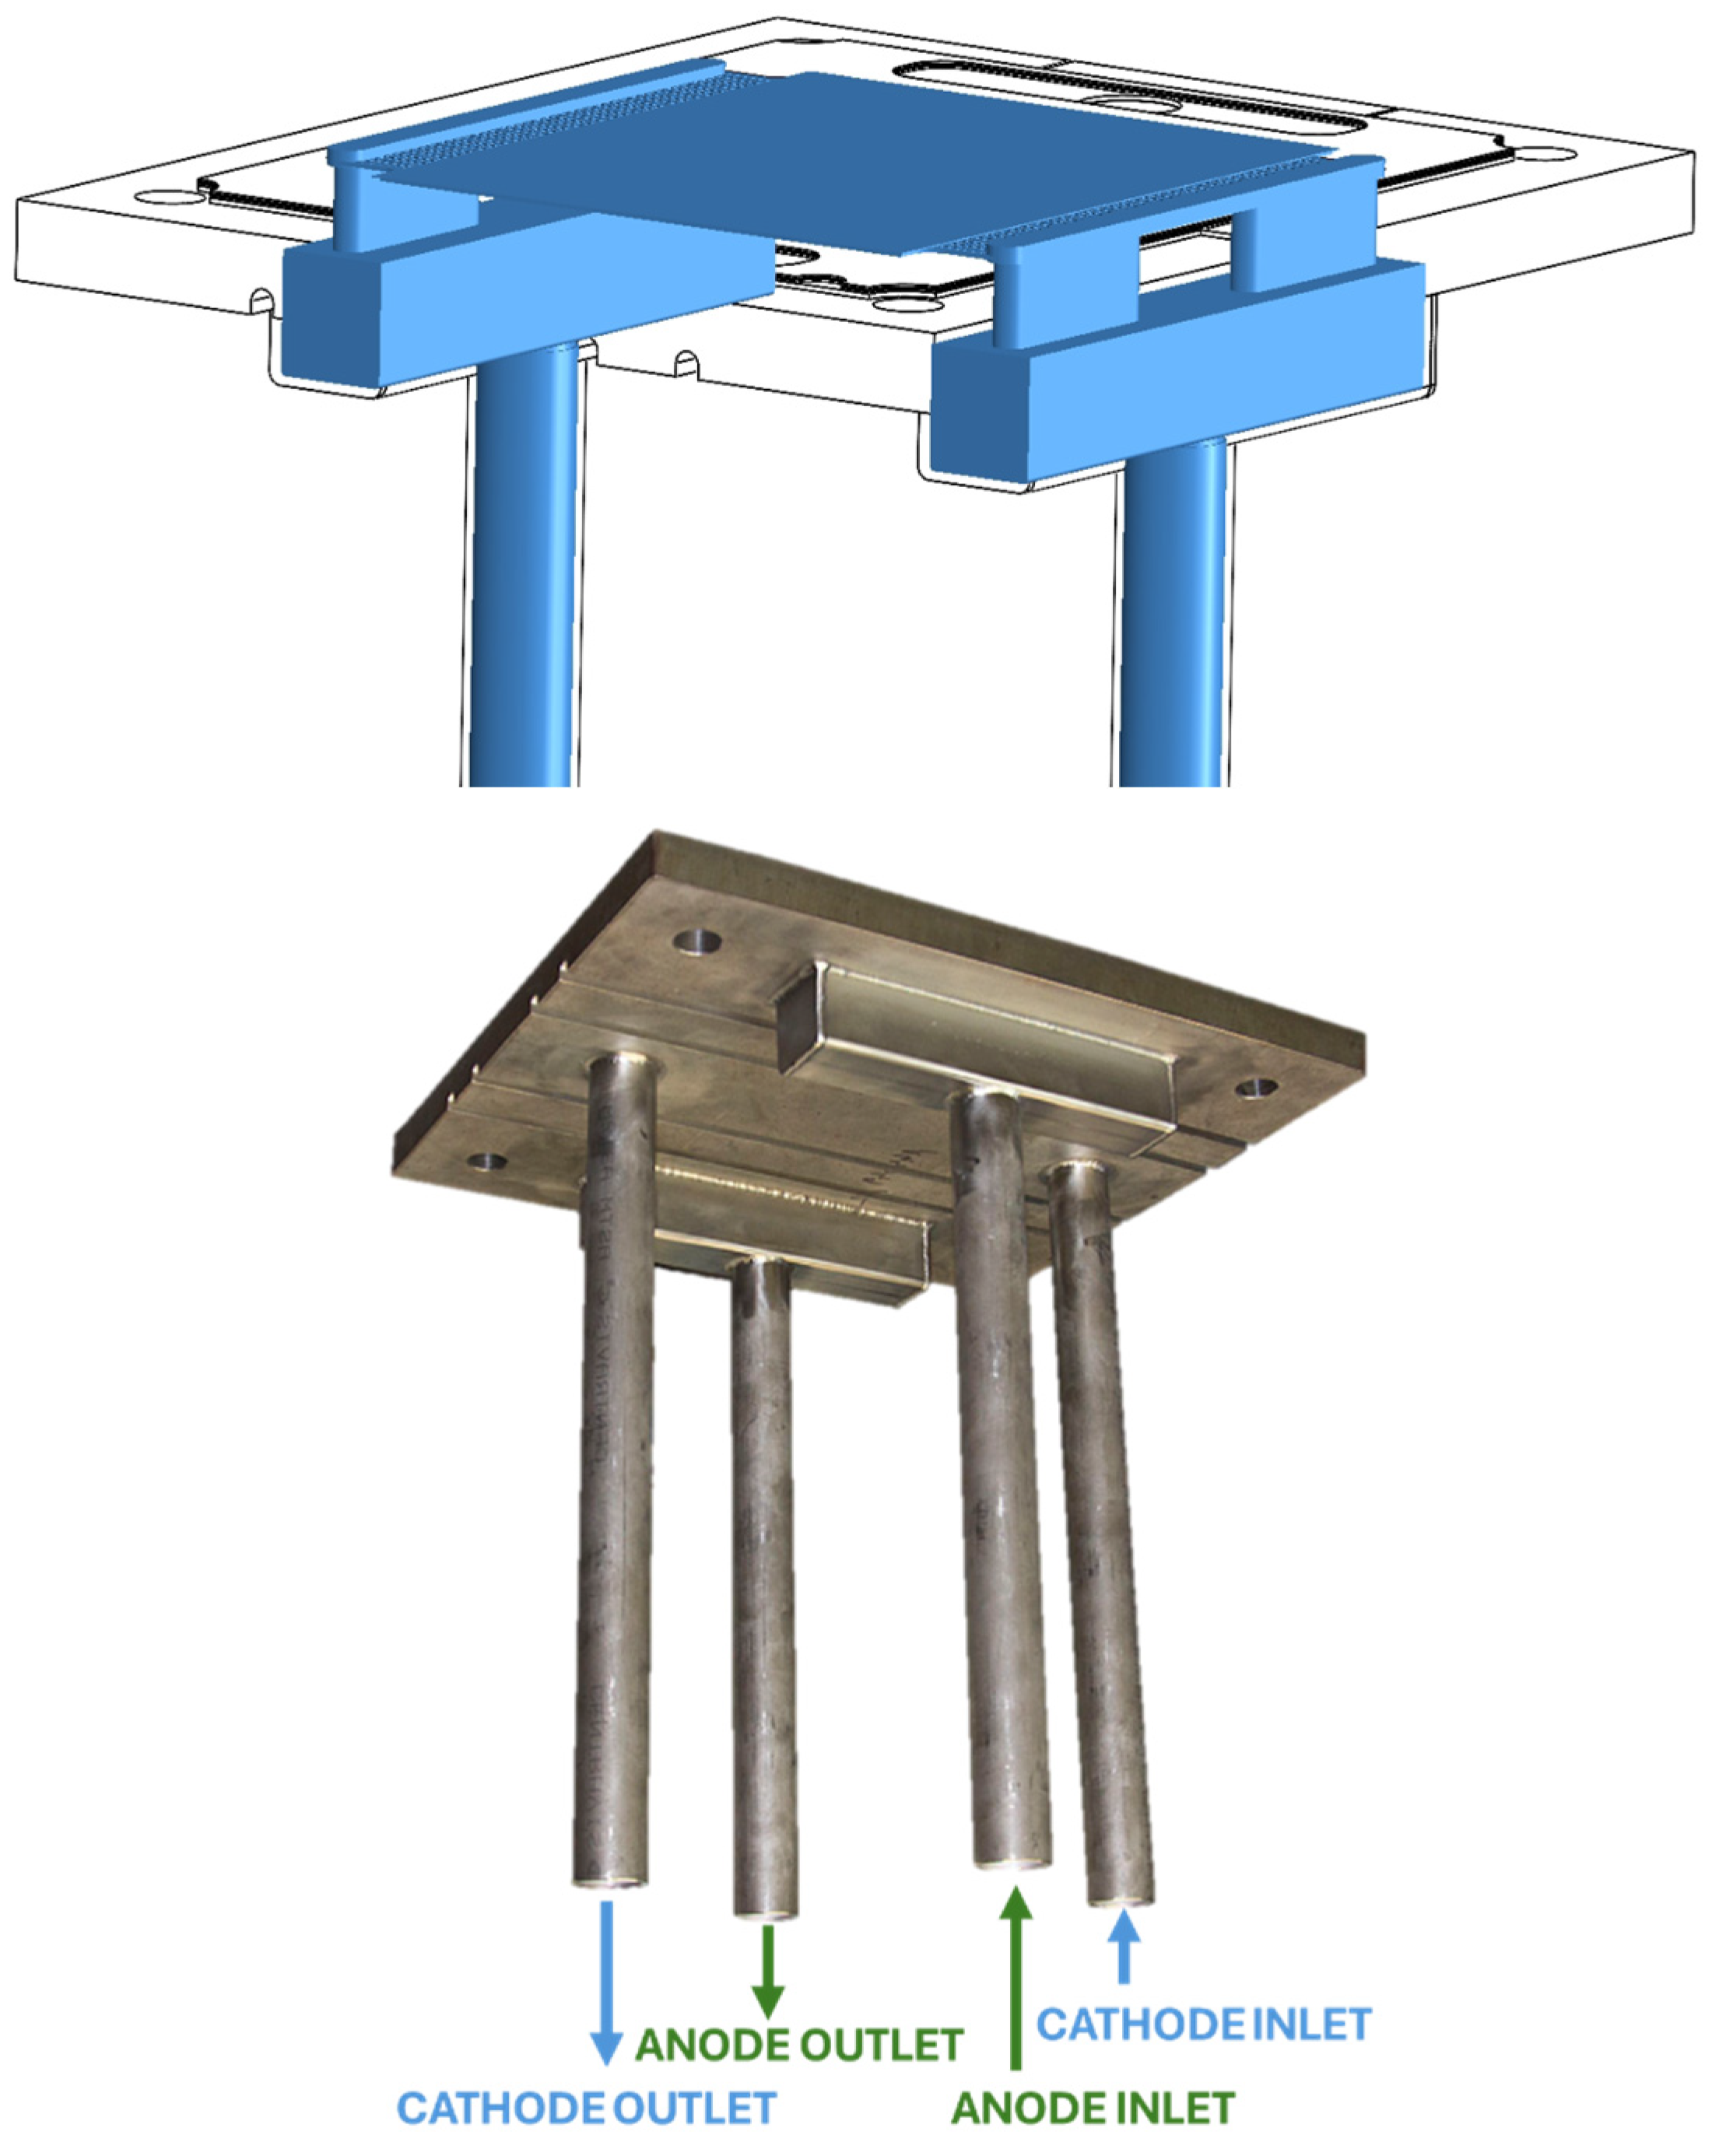
Figure 11.
: Sensitivity analysis of mesh size on the results.
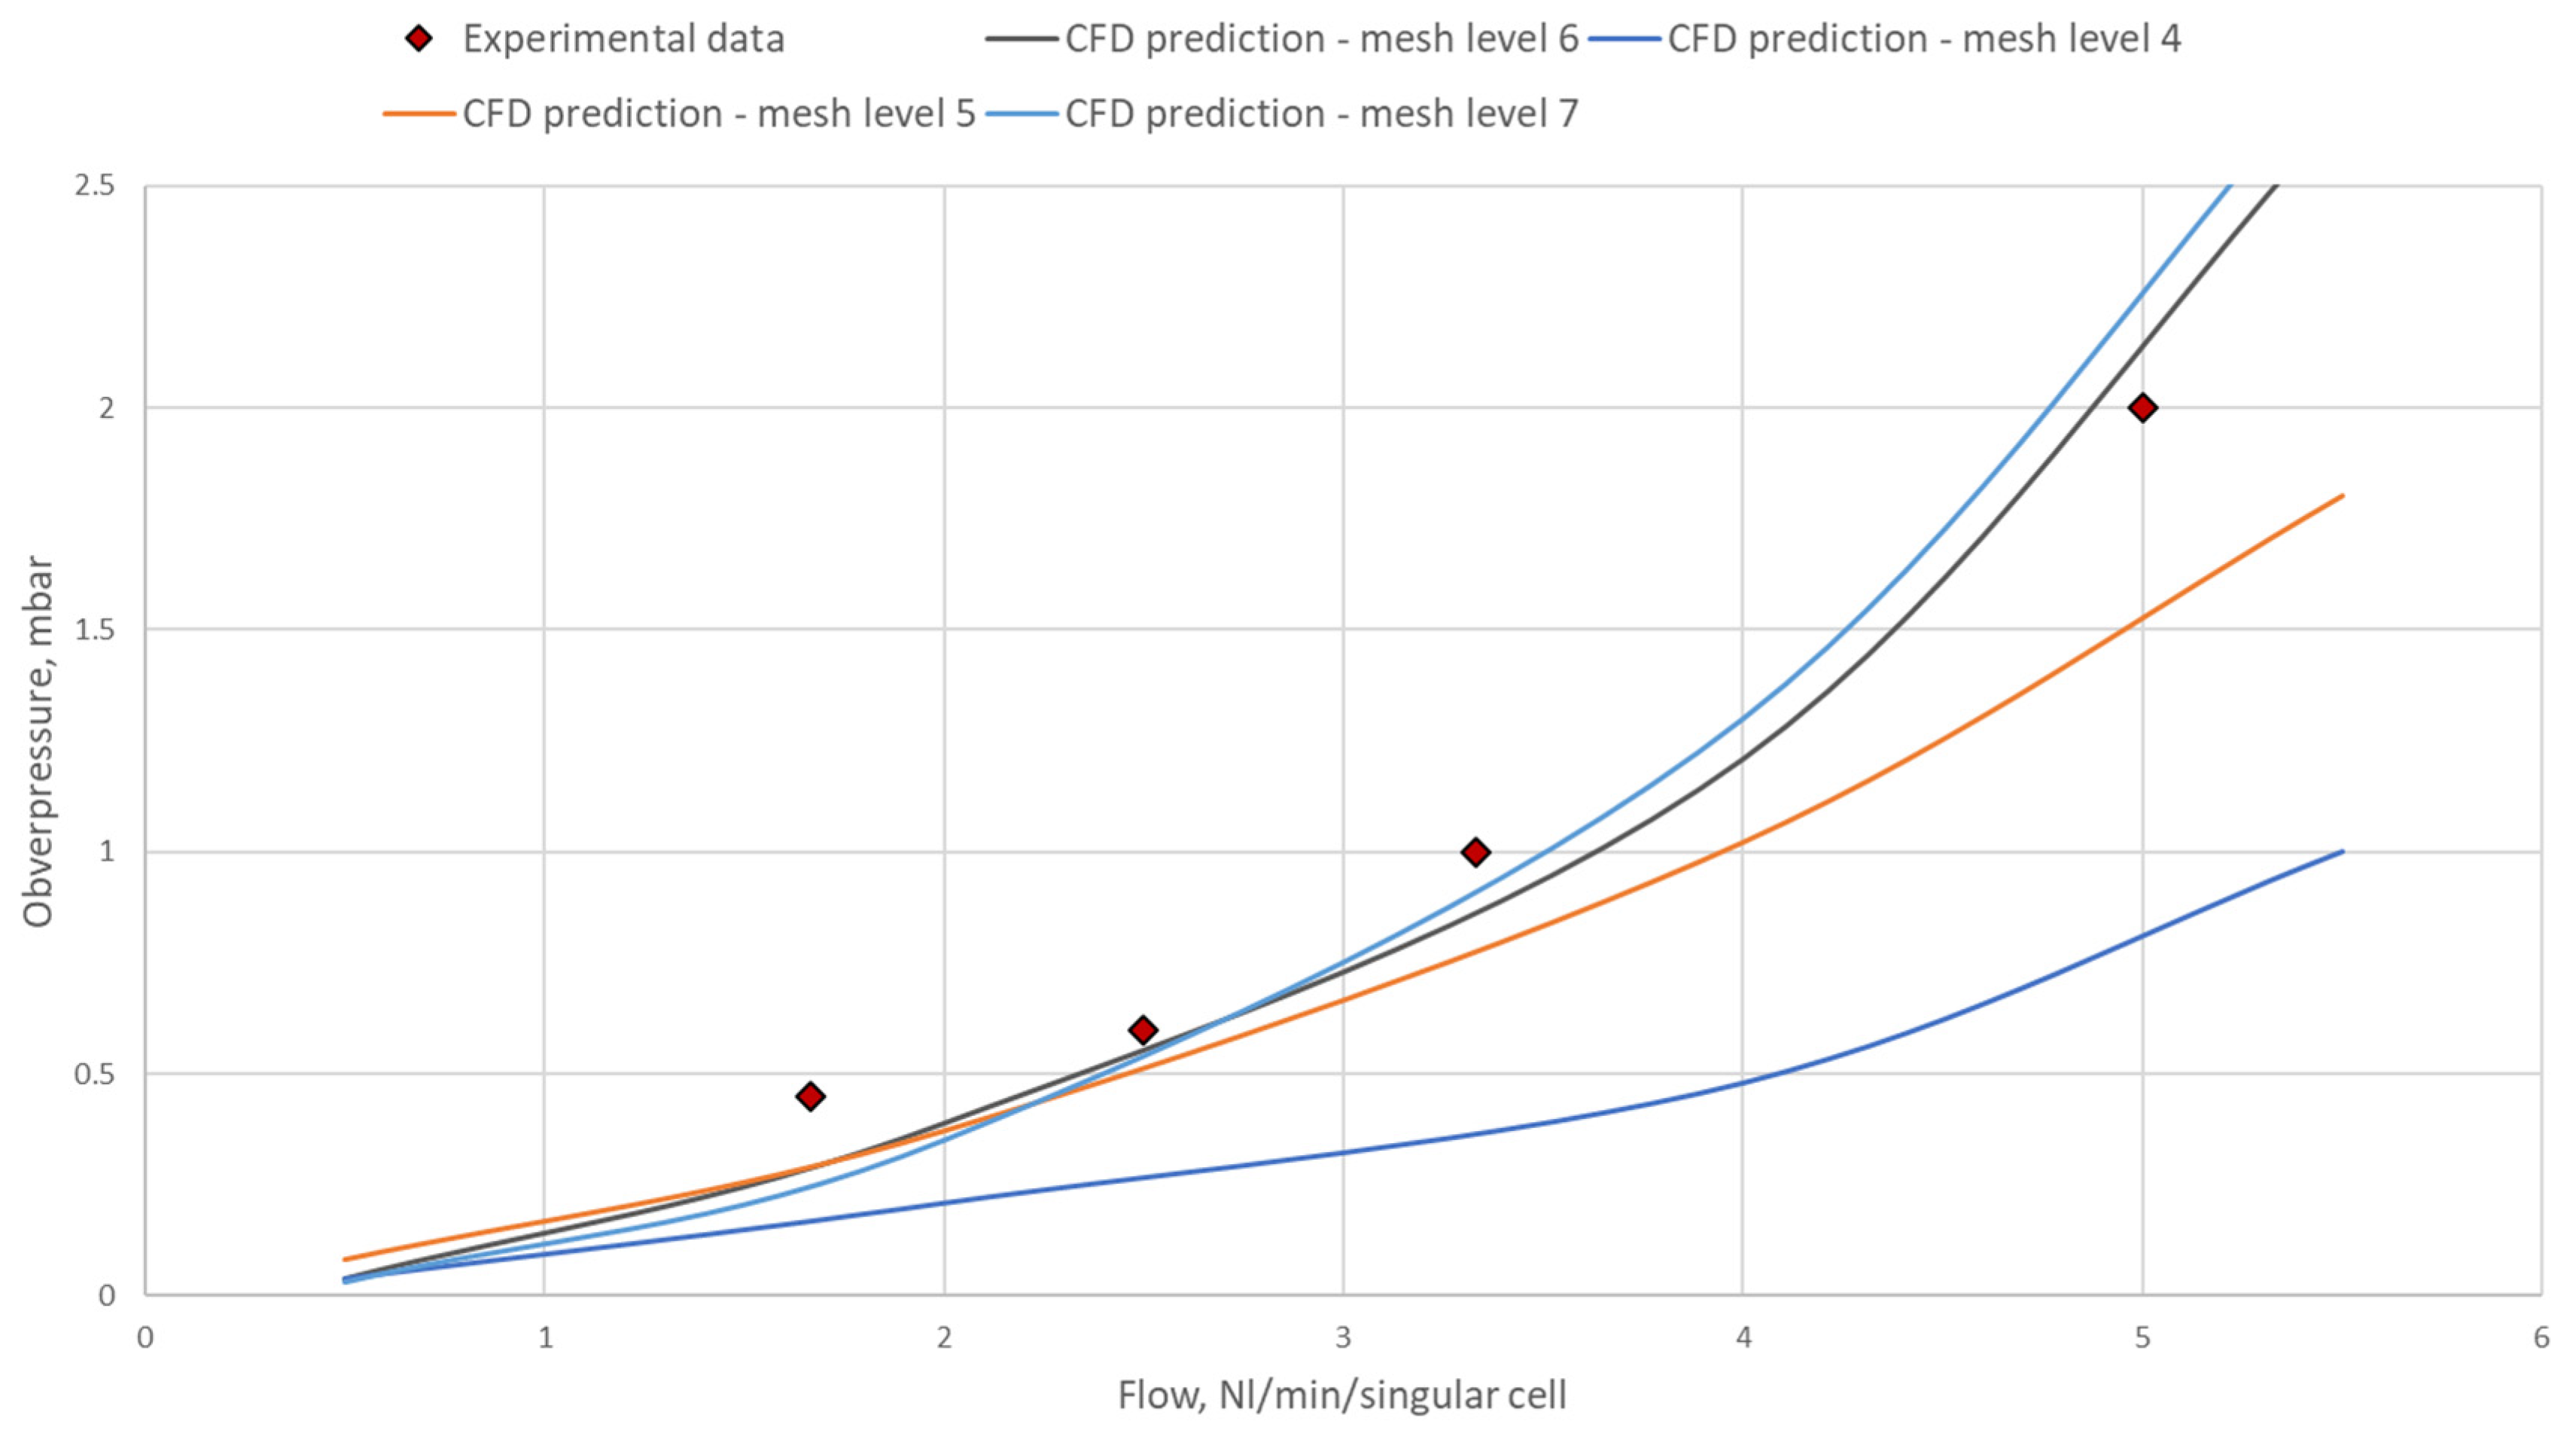
Figure 12.
: Comparison of the CFD prediction (mesh size 6) with the experimental results.
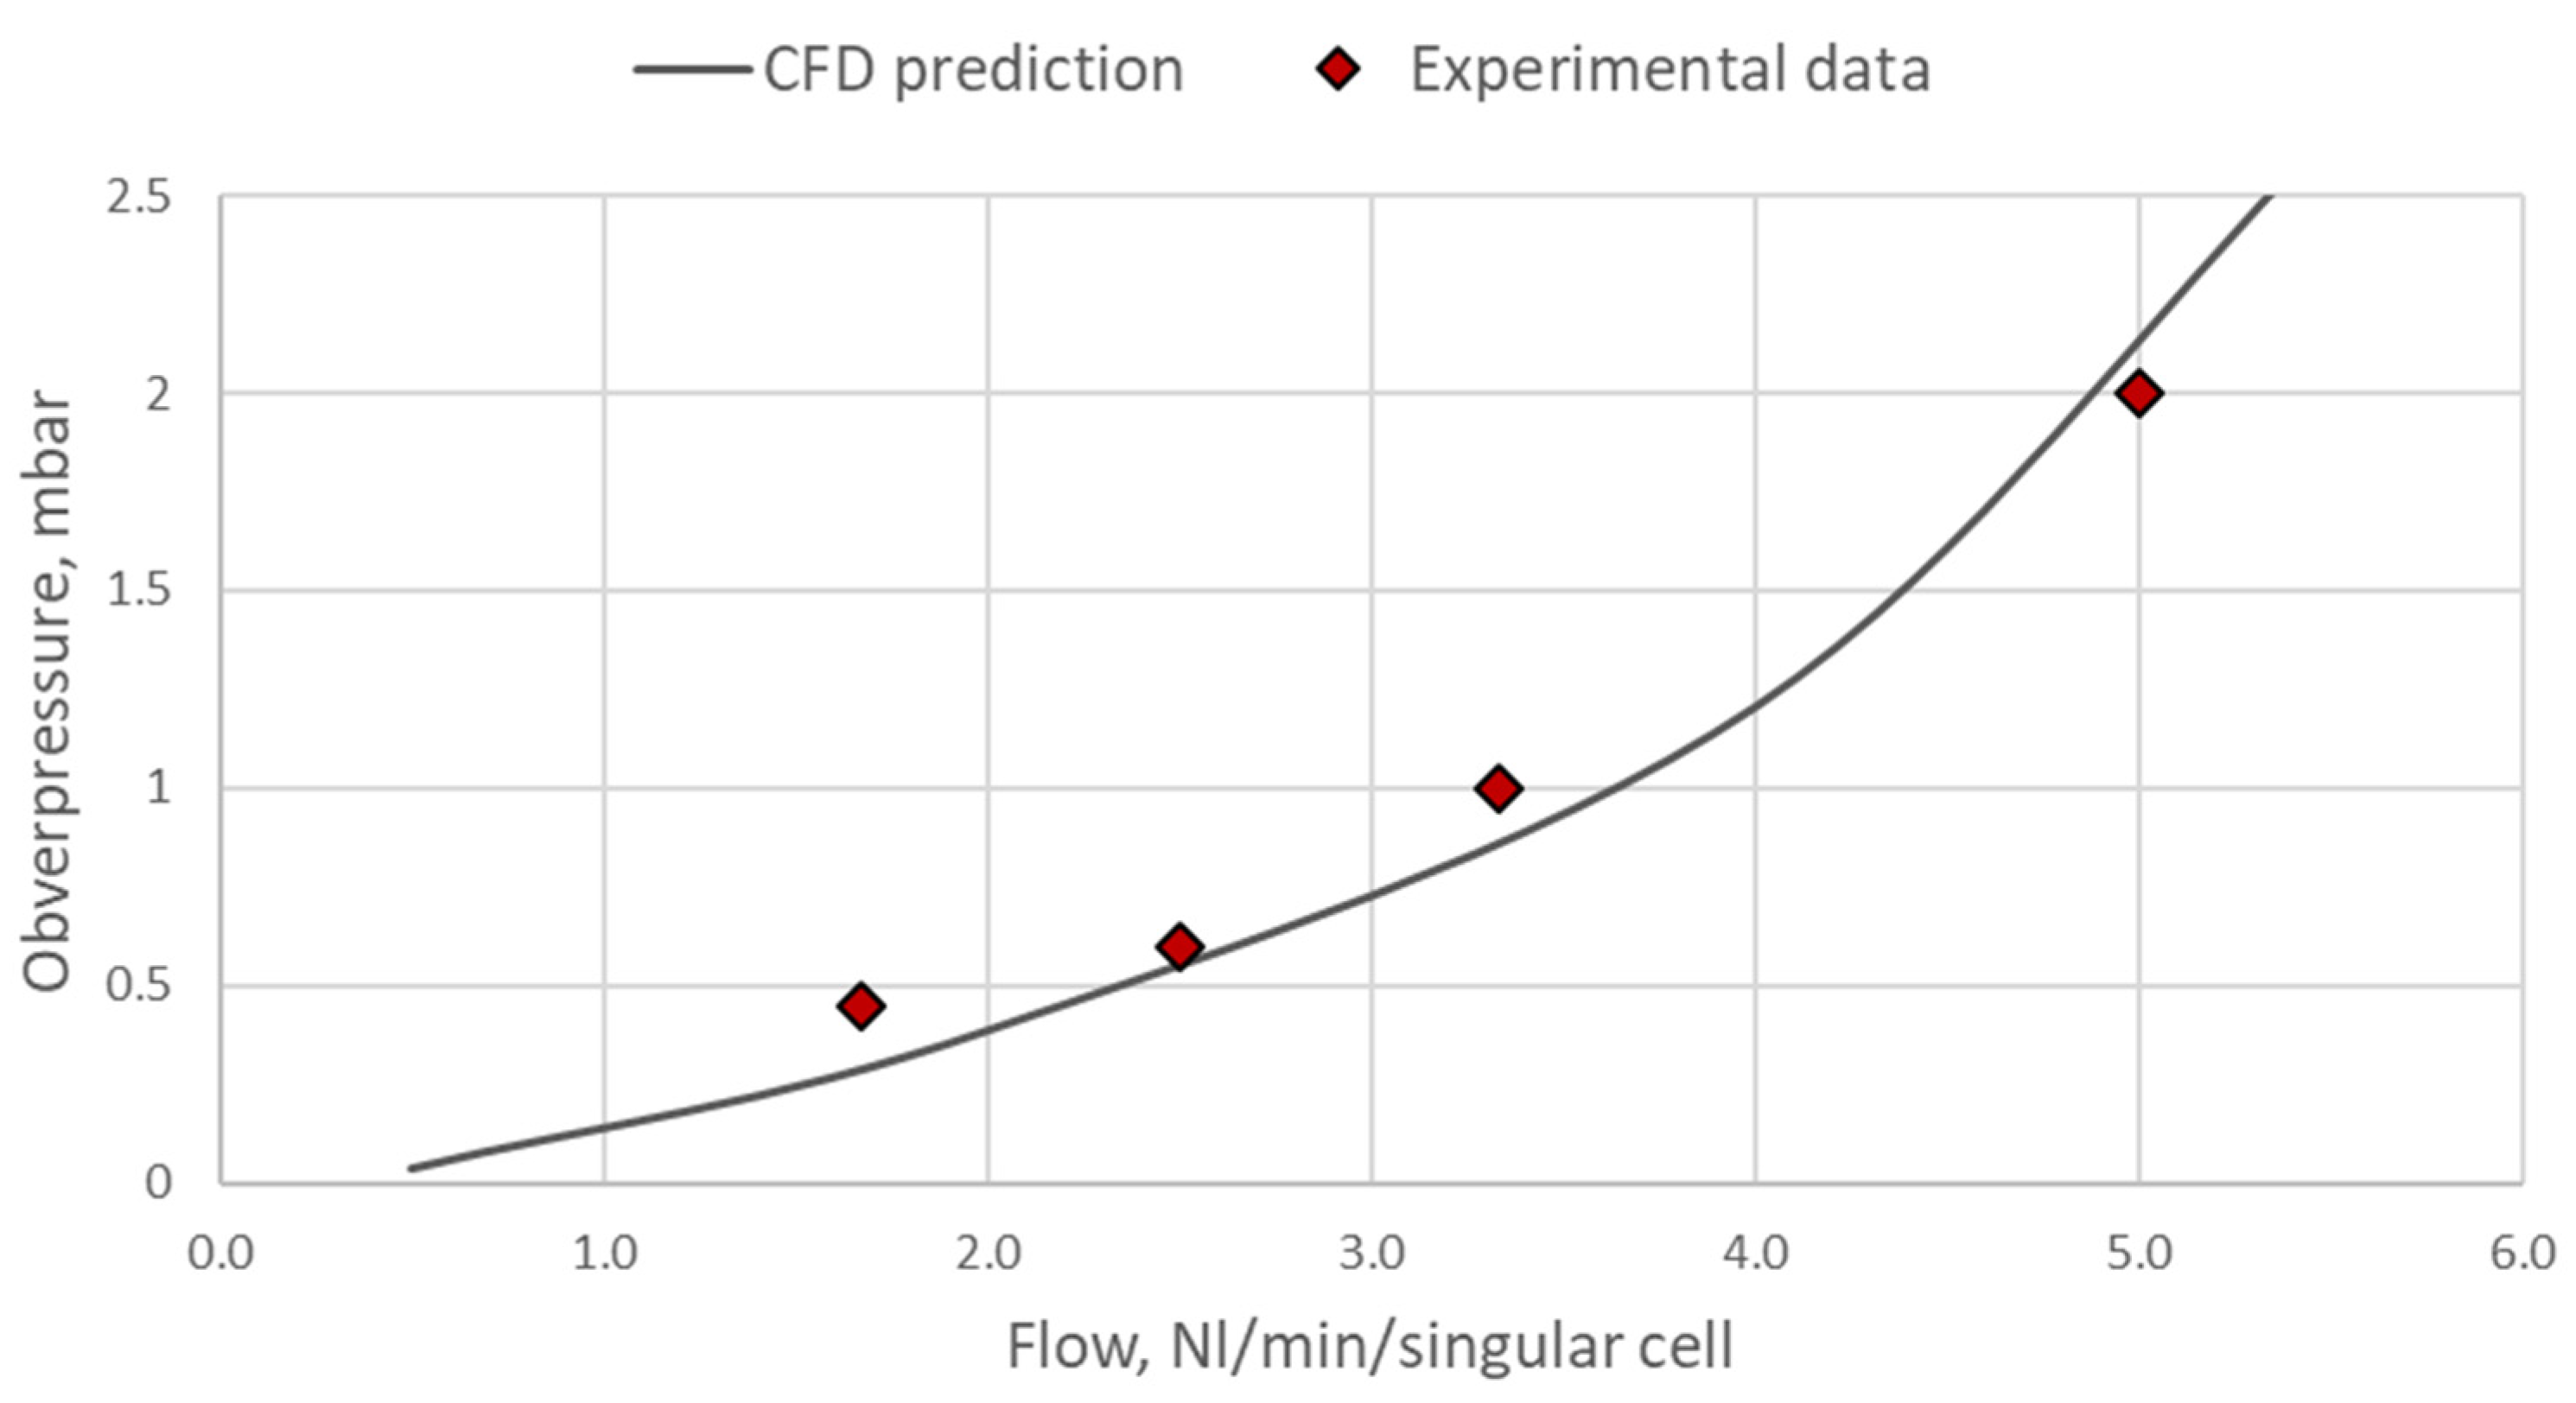
Figure 13.
: Pressure plots for the anode channel for the following operating conditions: 0.5 Nl/min: a) 450°C, b) 500°C, c) 650°C 2.0 Nl/min: d) 450°C, e) 500°C, f) 650°C 4.0 Nl/min: g) 450°C, h) 500°C, i) 650°C.
Figure 13.
: Pressure plots for the anode channel for the following operating conditions: 0.5 Nl/min: a) 450°C, b) 500°C, c) 650°C 2.0 Nl/min: d) 450°C, e) 500°C, f) 650°C 4.0 Nl/min: g) 450°C, h) 500°C, i) 650°C.
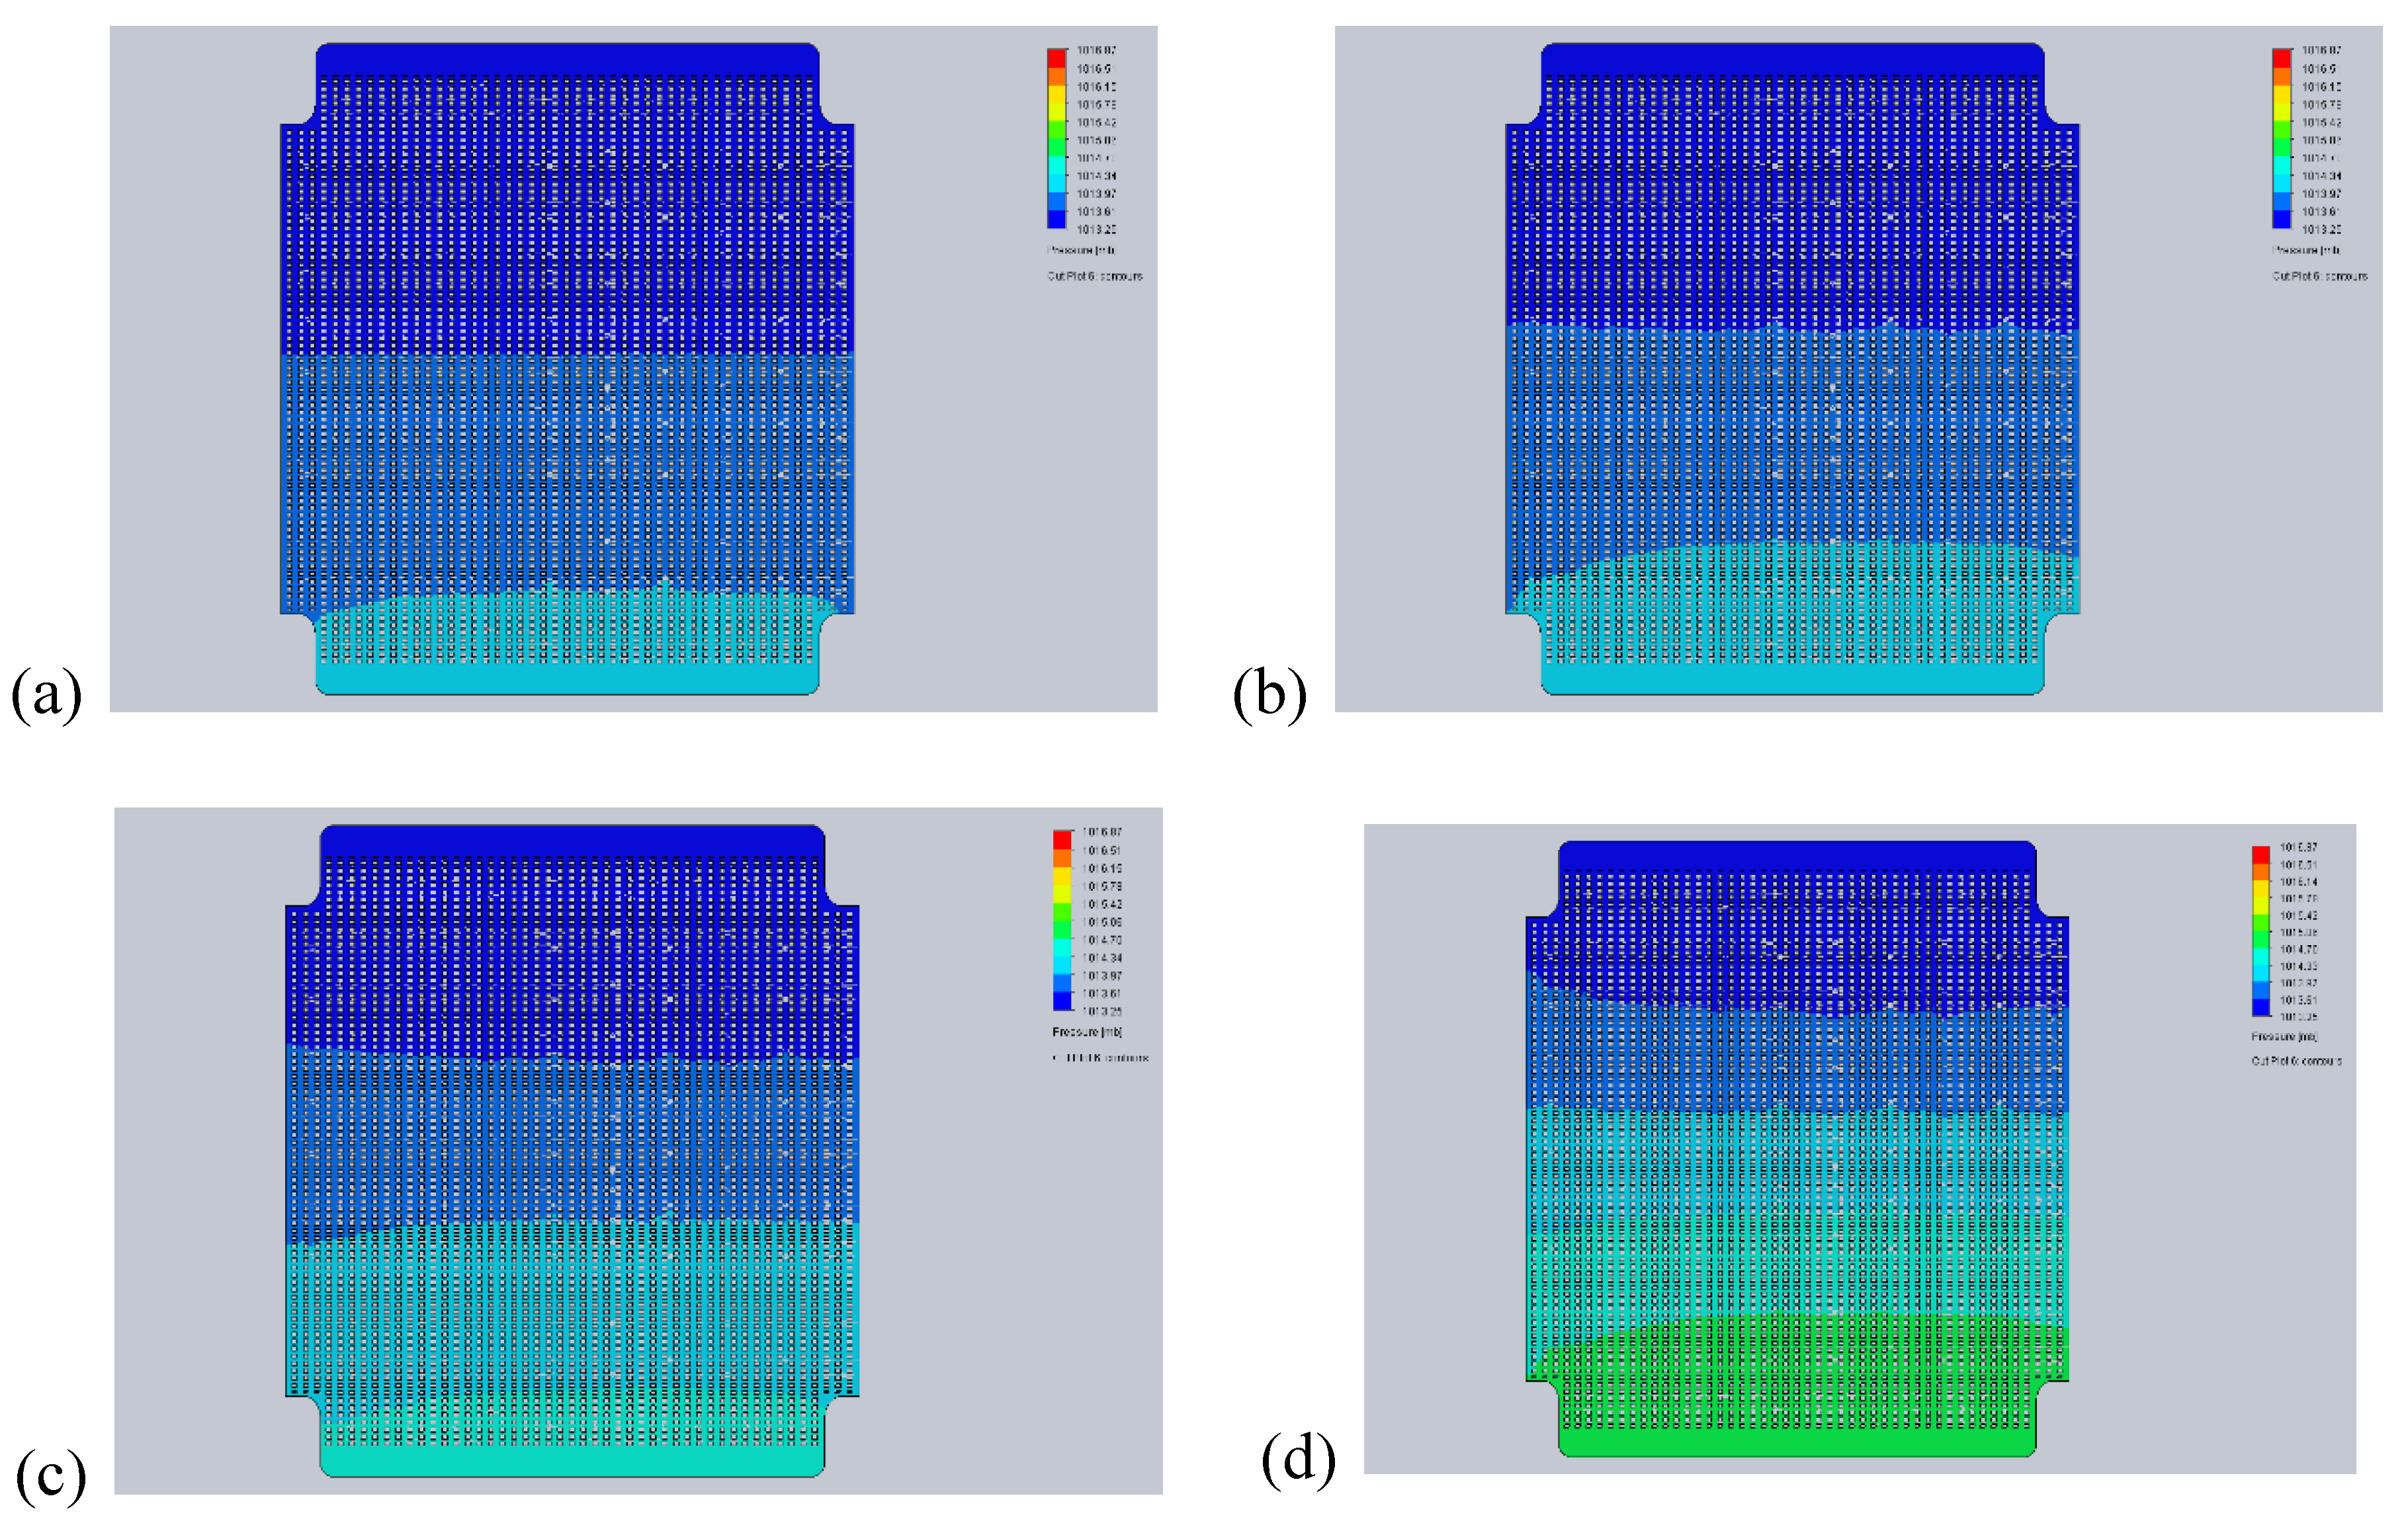
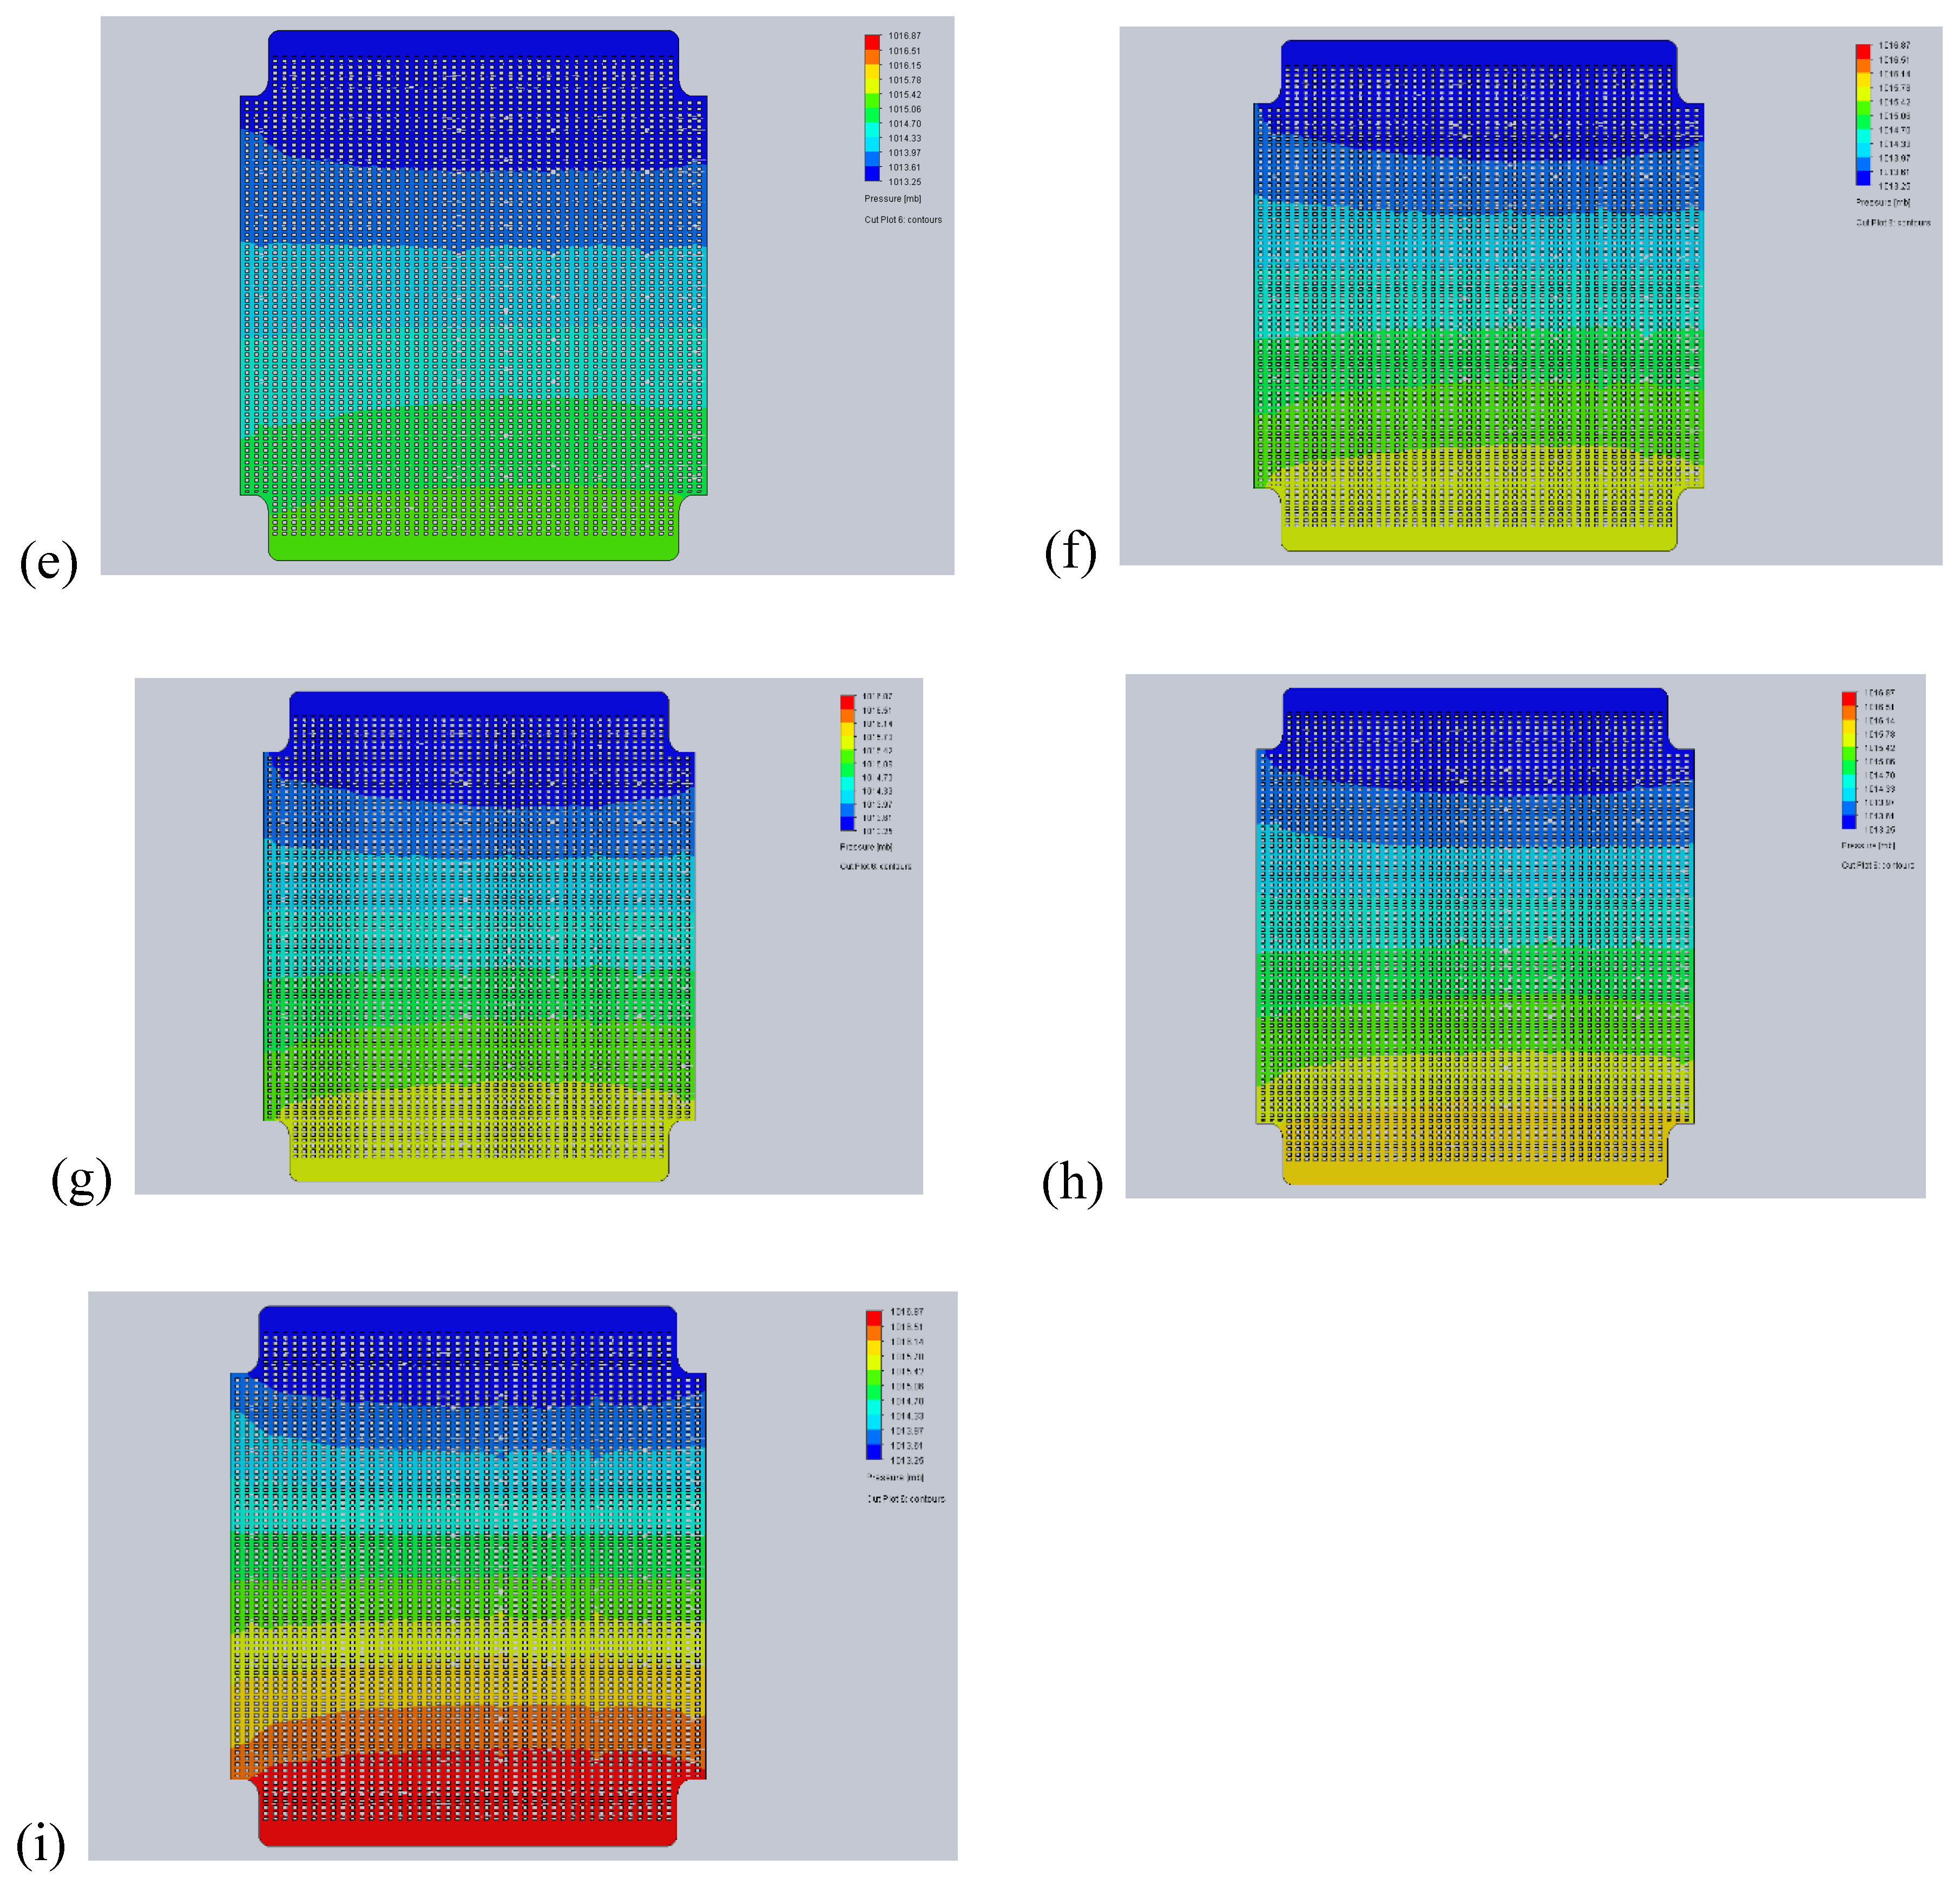
Figure 14.
: Co Overpressure as a function of flow rate at the anode channel for 3 operating temperatures: 450°C, 500°C, 650°C.
Figure 14.
: Co Overpressure as a function of flow rate at the anode channel for 3 operating temperatures: 450°C, 500°C, 650°C.
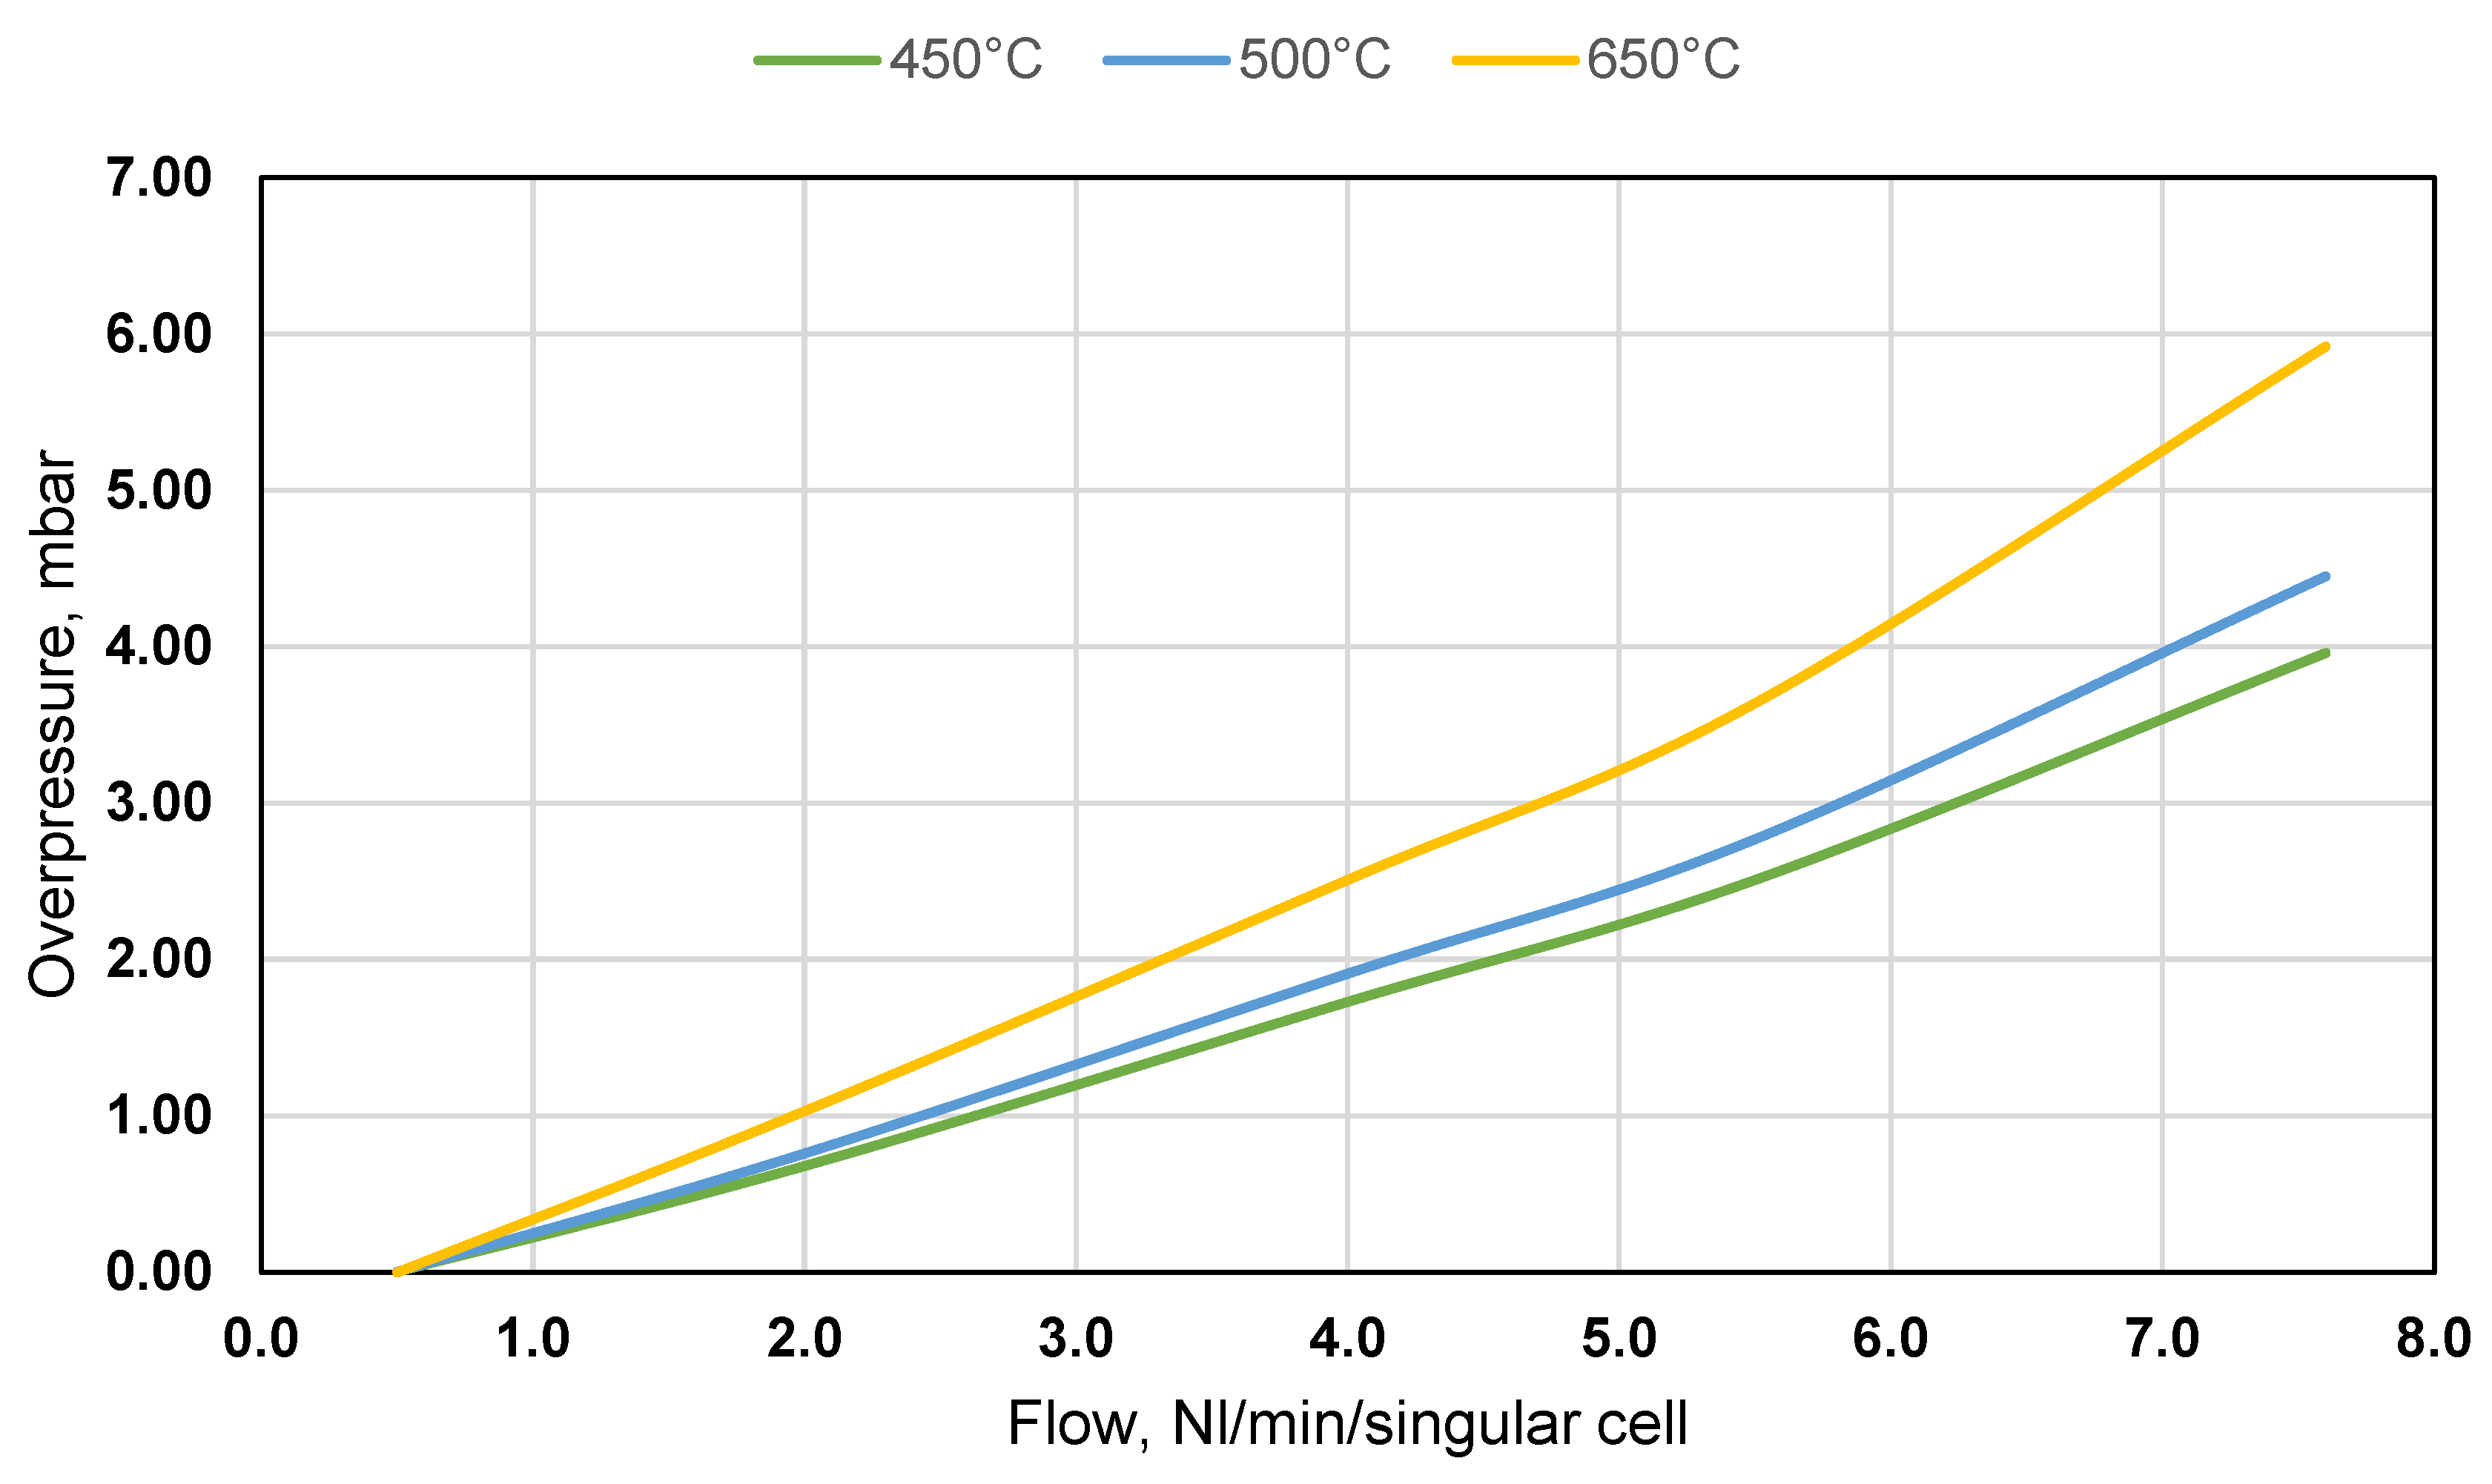

Table 1.
Boundary conditions.
| Inlet opening | Outlet opening | |
|---|---|---|
| Type | Flow | Environmental pressure |
| Fluid mixture | pure N2 | - |
| Flow | 50 .. 300 Nl/min | - |
| Ambient temperature | 20°C | - |
Table 2.
Nominal operating conditions.
| Parameter | Value |
|---|---|
| Anodic gas flow rate | H2: 1.75 Nl/min |
| Cathodic gas flow rate | CO2: 1.8 Nl/min |
| Air: 3.2 Nl/min | |
| Anodic gas temperature inlet | 650°C |
| Cathodic gas temperature inlet | 650°C |
| Current drawn from a cell | 0 A |
| Active cell area | 650 cm2 |
Disclaimer/Publisher’s Note: The statements, opinions and data contained in all publications are solely those of the individual author(s) and contributor(s) and not of MDPI and/or the editor(s). MDPI and/or the editor(s) disclaim responsibility for any injury to people or property resulting from any ideas, methods, instructions or products referred to in the content. |
© 2024 by the authors. Licensee MDPI, Basel, Switzerland. This article is an open access article distributed under the terms and conditions of the Creative Commons Attribution (CC BY) license (http://creativecommons.org/licenses/by/4.0/).
Copyright: This open access article is published under a Creative Commons CC BY 4.0 license, which permit the free download, distribution, and reuse, provided that the author and preprint are cited in any reuse.


