
Submitted:
23 December 2024
Posted:
24 December 2024
You are already at the latest version
Abstract
This work investigates the impact of acidification on olive pastes to improve the extraction of olive oil rich in bioactive phenolic compounds, a potential new functional food. Food-grade organic acids, specifically citric, ascorbic, and acetic acid were added prior to malaxation to modulate enzymatic activity during oil extraction. A randomized experimental design was carried out using acetic, ascorbic and citric acids, and three different doses of each of them. Three replicates of each acid and dose were randomly performed, plus the control trials carried out without using acids. The use of acids does not alter the extraction efficiency of the olive oil, nor does it modify the quality parameters regulated for extra virgin olive oils. They have the highest content of phenolic compounds, 37% more than control oils. In these oils, the secoiridoids group represents 79.4% of the total phenols, and of these, more than 50% is oleacein (237.58 ± 9.18 mg/kg). The high oleacein content increases the antioxidant capacity by up to 50% (433.63 ± 38.32 mg Trolox/kg) compared to control oils. An antioxidant capacity of 4.0 µmol Trolox/mg oleacein has been determined. 1% ascorbic acid improves the content of volatile compounds of the lipoxygenase (LOX) pathway and reduces the ethanol content compared to control oils.
Keywords:
olive paste acidification
; food-grade acids
; olive oil
; phenolic compounds
; antioxidant capacity
; volatile compounds
1. Introduction
Olive oil is a fat highly appreciated for its great nutritional and health value. It is widely consumed around the world and has a crucial role especially in the Mediterranean countries, which account for a substantial portion of the world's olive oil production and consumption [1]. Its composition of unsaturated fatty acids, bioactive compounds and distinct flavor and aroma make it a unique fat [2].
Among the minority components present in olive oil, phenolic compounds have a very important place due to their antioxidant properties and their relationship with the stability, bitter and spicy flavor of virgin oils. Between other benefits, these biomolecules act aiding in the treatment of inflammation, cardiovascular diseases, certain tumors, microbial activity, and cellular oxidative stress [3,4,5,6,7,8]. The European Commission has even approved a health claim regarding olive oils rich in polyphenols, specifically in hydroxytyrosol and its derivatives, for olive oils with a content of at least 5 mg of these compounds per 20 g of oil [9].
The most important group of phenolic compounds is the secoiridoids, produced during oil extraction processes by the hydrolysis of oleuropein and ligstroside, being oleacein (3,4-DHPEA-EDA), oleocanthal (p-HPEA-EDA) and their precursor aglycones, (3,4-DHPEA-EA) and (p-HPEA-EA) respectively, the ones present with the greatest proportion and antioxidant capacity [10]. Being hydroxytyrosol and tyrosol the final derivatives of oleacein and oleocanthal, respectively. Other phenolic compounds present in virgin olive oils are phenolic acids such as vanillic acid, ferulic acid and p-coumaric acid; phenolic alcohols such as tyrosol and hydroxytyrosol, lignans such as pinoresinol and flavonoids such as luteolin and apigenin [11,12,13].
The volatile and phenolic composition of the oils depends on the activity of the enzymes present in its fruit. These enzymes are influenced by factors such as the state of ripeness, the geographical area of the crop, water stress, as well as the technological conditions used in the extraction of the oil [14,15,16,17,18]. Milling and malaxation steps has a lot of influence on the phenolic content of the oil, especially on the secoiridoid derivatives. Low milling temperatures, low malaxation time, malaxation temperature around 25-27ºC, slightly acidic pH during malaxation and absence of oxygen, if possible, are conditions that favor the activity of lipoxygenases and β-glucosidase, increasing the desired phenolic compounds [19,20,21]. On the other hand, the increase in the state of ripeness of the olives favors the action of phenol-oxidase enzymes, decreasing the content of the oleacein, oleocanthal and their derivatives.
Oleocanthal rich oils aid in the treatment of Alzheimer’s disease by enhancing cognitive function in patients [22]. Also, Oleocanthal offers cardiovascular benefits in addition to therapeutic properties for treating inflammation, cancer and neurodegenerative conditions [23,24]. On the other hand, oleacein has antioxidant and anti-inflammatory properties that make it valuable in addressing inflammatory diseases and the treatment of hypertension [25,26].
Due to the multiple health benefits of oleacein and oleocanthal, several studies have tried to obtain these compounds in isolation from olive oil, using different procedures [27,28,29,30]. The aim of this work is to produce olive oils with a high content of bioactive phenolic compounds. Olive oils produced by this way can be marketed as functional foods that have greater positive health effects due to the properties of these phenolic compounds. For this purpose, food-grade organic acids (citric, ascorbic, and acetic acids) will be used to modify enzymatic activity towards pathways that maximize the production of the desired oleuropein derivatives. Also, this study will determine which acid and its optimal dose provide the best results in extraction yield, volatile compounds, antioxidant capacity, individual secoiridoid content, overall secoiridoid content, and total phenol content.
2. Materials and Methods
2.1. Olive Characterization
Olives (Olea europaea L. cv Picual) were harvested by hand from rainfed crops, in Jaen, south from Spain, during the 2023-2024 crop season, with a maturity index of 1.4, determined as described [31]. The moisture content was determined by drying milled paste at 105°C for 24 h. The oil content of the olive was determined using the Soxhlet method, following the Commission Regulation with previous modifications [9]. Approximately 10 grams of the sample were extracted for 4 hours with hexane.
2.2. Oil Extraction
Oil samples were obtained using the laboratory-scale Abencor system (MC2 Ingeniería y Sistemas S.L., Sevilla, Spain) as described by [32], including malaxation in open chambers. The extraction conditions for all trials were: malaxation time of 60 min, malaxation temperature of 25°C, and a crusher hole diameter of 5.5 mm. The appropriate doses of ascorbic (asc), citric (cit), and acetic (act) acids were added prior to malaxation. Doses of 1, 2 and 4% by weight of each acid were added to the independent sample pastes, including their 3 replicates. Also, it was extracted oil without acid to use it as control (ctr). Testing of the samples and their replicates was performed in random order (Table S1, from supplementary material). Extracted oils were decanted into a graduated tube for about 24 hours, paper filtered, and stored under a nitrogen atmosphere at −18°C until analysis. Extraction efficacy was calculated as the percentage of the amount of oil extracted relative to the real drupe oil content, as defined by [33].
2.3. Analysis of olive oil quality parameters.
The peroxide index, free acidity and extinction coefficients K270 were measured following the Commission Regulation [34].
2.4. Phenolic Compounds
The sample treatment process it was followed as proposed by the International Olive Council (IOC) was employed [35]. Details of the analytical method used were detailed in [36]. High Performance Liquid Chromatography (HPLC) (Shimadzu Corp., Kyoto, Japan) was used with a BDS Hypersil C18 column (Thermo Scientific, Waltham, Massachusetts, USA). The column specifications are 25 cm in length, 5 μm particle size, and 4.6 mm internal diameter. The elution flow rate was set at 1 mL/min, the oven temperature at 30°C, and the injected sample volume was 20 μL. The mobile phase consisted of water with 0.2% orthophosphoric acid, methanol, and acetonitrile. Phenolic compounds were identified by comparison to analytical standards except oleacein aglycone and the unidentified phenols whose concentration was determined as the IOC method. Results are expressed in milligrams of compound per kilogram of oil. Vanillic acid, vanillin, luteolin and p-coumaric acid were purchased from Sigma-Aldrich (St. Louis, MO, USA). Syringic acid and trans-ferulic acid was purchased from Fluka (Milan, Italy). Hydroxytyrosol, tyrosol and apigenin were purchased from HPC Standars GmbH (Cunnesdorf, Germany). Oleocanthal was purchased from Phytolab (Dutendorfer, Germany). Oleacein, oleuropein aglycone and pinoresinol were purchased from TRC (Toronto, Canada).
2.5. Volatile Compounds
The method used was previously described by [37], employing headspace solid-phase microextraction (HS-SPME) and gas chromatography-flame ionization detection (GC-FID). A 7890B model gas chromatograph and a DB-WAXetr capillary column (Agilent Technologies, CA, USA) were used. The SPME fiber, made of Carboxen/DVB/polydimethylsiloxane, had a length of 2 cm and a film thickness of 50/30 μm, and was acquired from Supelco (Bellefonte, PA, USA). 4-Methyl-2-pentanol served as the internal standard, and 35 external standards were employed. The compounds analyzed were grouped, hexanal, hexanol, (E)-2-hexenal, (E)-2-hexenol, (Z)-3-hexenol and (Z)-3-hexenyl acetate, named as C6 LOX, 1-penten-3-ol, 1-penten-3-one and (Z)-2-pentenol, named as C5 LOX, and lastly, ethanol. The results are expressed as mg of compound per kg of olive oil.
2.6. Antioxidant Capacity
The antioxidant capacity was determined by the ferric ion reducing antioxidant power (FRAP) method as same as described in [38]. A Trolox standard curve was used, and the results are expressed as Trolox equivalents (TE) per kilogram of oil.
2.7. Statistical Analysis
The results were processed using the StatGraphics Centurion XIX, (Statpoint Technologies, Inc., Warrenton, VA, USA), conducting a statistical analysis of the results. The Fisher's least significant differences (Fisher's LSD) were obtained for each response analyzed.
3. Results
The sample was characterized with 4 replicates, the means of content of moisture, oil and solids with their standard deviations are shown in Table 1.
3.1. Water pH and extraction efficiency
Table 2 shows the means of water pH after oil extraction and extraction efficiency, together with their standard deviations and Fisher's Least Significant Differences (Fisher's LSD). It is observed that the use of acids decreases the pH of the waters, the higher the percentage, the greater the decrease in pH. It should be noted that the experimental design was carried out in percentage of acid added to the pastes and not in molar ratio, so that the different molecular masses of the acids resulted in proportionally more acetic acid (60.05 g/mol) being added than ascorbic acid (176.12 g/mol) and citric acid (192.12 g/mol). This, together with the different pKa (acetic acid: 4.74, ascorbic acid: 4.10 and citric acid: 3.15) has resulted in waters with acetic acid being almost three times more concentrated than those obtained with ascorbic acid or citric acid at the same percentage. Considering, therefore, the proportion in moles of each acid and its pKa, the pH values in Table 2 are justified. It is observed that the waters obtained from pastes with 1% ascorbic acid are those with the least decrease in pH, going from 4.95 corresponding to the waters without added acids to 4.33 for the waters with 1% ascorbic acid.
On the other hand, Table 2 also includes the means and their standard deviations obtained for the extraction efficiency response, although statistically the differences are not significant (p-value = 0.4 >> 0.05), it can be observed that the use of acids mostly decreases the mean values of the response, except for the pastes with 1% ascorbic acid whose mean is higher than that of the pastes without the addition of acid by 1%. Therefore, it can be affirmed that the use of acids does not alter, from a statistical point of view, the extraction efficiency of the pastes, although if we look at the means, 1% ascorbic acid slightly improves it.
3.2. Oil quality parameters
Although the oils obtained cannot be considered virgin, according to Regulation (EU) 1308/2013 [39], due to the use of additives with chemical action that only lower the pH of the medium, the most common quality parameters have been analyzed to check whether the use of acids alters the extracted oils in any way. The free acidity of all the oils was determined except for those obtained with the addition of acetic acid to the pastes, since the content of this acid is one of the negative quality parameters of the oils, defined by IOC [40]. Considering the oils for which free acidity was determined, no statistically significant differences were found between the blanks and those obtained with acids added to the pastes, obtaining 0.14 ± 0.02 mean acidity and standard deviation. Likewise, no statistically significant differences were found for the peroxide index and K270, with values of 2.35 ± 0.32 and 0.16 ± 0.02, respectively. This indicates that the presence of acids does not alter the main quality parameters of the oils and, according to these, they could be considered as extra virgin.
3.3. Influence of acids on phenolic compound content and antioxidant capacity of oils
Regarding the content of the phenolic alcohols hydroxytyrosol and tyrosol, it was observed that the use of acids increased the hydroxytyrosol content, more the higher the concentration. At higher doses, the hydroxytyrosol content can even double, especially with acetic and citric acids. On the other hand, at lower doses, the acid that most increases the content of this alcohol is ascorbic acid (3.03 ± 0.35 mg/kg), with respect to the blank (2.20 ± 0.21 mg/kg). As for tyrosol content, acetic and citric acids increase it slightly in the oils, while ascorbic acid reduces it, with similar trends to those of hydroxytyrosol with increasing dosage. (Table S2, from supplementary material).
Respect to the phenolic acids in olive oil, it was observed that vanillic acid is the most abundant acid in all samples, followed by p-coumaric acid. In all cases, the use of acid in the pastes increases the content of these acids, but it is worth highlighting the great increase experienced by vanillin and ferulic acid when ascorbic acid is used to reduce the pH of the pastes (Table S3, from supplementary material).
When it comes to flavonoids, luteolin is the major component in all oils from acidified pastes. However, its content only increases with respect to the control oils when ascorbic acid is used. In the case of apigenin, its content increases with all acids, the most significant increase being observed with low doses of ascorbic acid. As for one lignan, pinoresinol, all doses of citric acid increase its content with respect to the control oils. In contrast, only low doses of the other two acids increase its content (Table S4, from supplementary material).
Finally, the most important family of phenols in olive oils, the secoiridoids, are considered. All of them are derived from oleuropein and ligstroside. The content of individual secoiridoids is shown in Table 3, it can be noted that oleuropein derivatives are the most prevalent in all oils produced, primarily oleacein (3,4-DHPEA-EDA) and its precursor oleuropein aglycone (3,4-DHPEA-EA). Ligstroside derivatives, such as oleocanthal (p-HPEA-EDA) and aglycone (p-HPEA-EA), are present in smaller amounts.
Table 3 shows that the oleacein content is higher in all the oils obtained with acids than in the control oils, especially in the oils with 1% ascorbic acid, whose content is the highest of all and almost double that of the blanks. The oleuropein aglycone content, on the other hand, is lower than that of the blanks in all oils except those obtained with 1% ascorbic acid. With respect to ligstroside derivatives, the content of both oleocanthal and aglycone is lower than that of the blanks in all oils, except for oleocanthal in oils obtained from 1% ascorbic acid pastes. Figure 1, oleacein and oleocanthal and its standard error, clearly shows that oils obtained with 1% ascorbic acid have a higher content of these compounds compared to the rest of the oils, including the blanks.
Table 3 also shows the total phenolic compound content and antioxidant capacity of the oils. It is observed that the phenol content decreases as the dose of acid used increases, except in the case of citric acid, which does not seem to have an influence, and that at lower doses the content of these compounds is higher than in the oils obtained without using acids. Thus, the oils obtained with ascorbic acid are those with the highest content of phenolic compounds, with a percentage 37.2% higher than the blanks, in those corresponding to the 1% dose. With the data in Table 3 it is possible to determine the total secoiridoid content in the oils, which compared to the content of total phenolic compounds, it can be deduced that this group of compounds represents more than 75% of the total phenols in the oils. It can also be determined that the oils obtained with ascorbic acid at low doses have the highest percentage of secoiridoids (79.4%). Regarding the antioxidant capacity, it can be observed a similar trend as phenols content in general, with the highest values related with the lowest doses of ascorbic acid, especially at 1% (Figure S1, from supplementary material).
Although there are minority compounds in olive oils with antioxidant capacity, for example tocopherols, given their low concentration, it can be approximated that the variations in the antioxidant capacity of the oils obtained in this work may be due to the variation in secoiridoids, especially oleacein, the secoiridoid with the highest antioxidant power. Figure 2 displays the antioxidant capacity values against the oleacein content, secoiridoids content, and total phenolic compound content in the oils, with their respective regression lines. For comparative purpose, it can be observed that the highest coefficient of determination corresponds to the fit with oleacein, followed by total phenol content, and finally by secoiridoids. This indicates that oleacein correlates with antioxidant capacity better than the other groups of compounds. The regression line of oleacein can be explained because without oleacein content there are still compounds with antioxidant capacity. The intercept of the both regression lines of secoiridoids and total phenols content can be attributed to the fact that not all of its compounds act as antioxidants. According to the oleacein slope in Figure 2, an approximate antioxidant capacity of 1.59 mg Trolox equivalent per mg is deduced (4.0 µmol Trolox/mg oleacein).
3.4. Volatile compound content in the oils obtained with acids
Table 4 shows the effect that the acidification of the olive paste had in the content of desirable compounds of 5 (C5) and 6 (C6) carbons related with the LOX pathway, and ethanol, an undesirable compound related with the fermentation of organic wastes in olive oil. As can be seen in Table 4, ascorbic and citric acids increase the content of C6 compounds with respect to the control oils, while acetic acid does not seem to affect them at low doses, but decreases them at higher doses. Acetic and citric acids decrease the content of C6 compounds as the dose increases, while ascorbic acid does not seem to have any effect. Considering the oils obtained with 1% ascorbic acid, an increase in C6 compounds of approximately 50% is determined, although the highest value is found at 1% of citric acid. In the case of C5 compounds, a trend similar to that of C6 compounds is observed, with a slight increase when ascorbic acid is used, the highest value being determined with the highest dose of ascorbic acid and the lowest of citric acid. Ascorbic and citric acids slightly decrease the ethanol content in oils, and acetic acid does so to a greater extent. Considering the oils obtained with 1% ascorbic acid, there is a decrease in ethanol content of approximately 18% with respect to the blanks. Therefore, the addition of 1% ascorbic acid to the pastes favors the enzymatic pathways responsible for the production of the volatile compounds of interest and decreases the undesirable ethanol content.
4. Conclusions
The results indicate that the use of acids does not alter, from a statistical point of view, the extraction efficiency of olive oil, nor does it modify the quality parameters regulated for extra virgin olive oils, although due to the use of acids they should be considered as functional foods.
In general, the phenolic content of the oils increases with the acidification of the pulp. The largest group of phenolic compounds in all oils are secoiridoids, > 75%, especially in those obtained with 1% ascorbic acid, which represent more than 79%. The oleacein content is higher in all the oils obtained with acids, especially in those obtained with 1% ascorbic acid, which almost double the oleacein content of the control oils. The oils obtained with ascorbic acid and the lowest dose are the only ones that increase oleuropein aglycone with respect to the control oils. Oils obtained with 1% ascorbic acid have the highest oleacein and oleocanthal content of all. These oils also have the highest antioxidant capacity, with an increase of almost 50% compared to control oils. The oils obtained with 1% ascorbic acid do not have the highest content of volatile compounds, although they also contain more than the control oils, and have a lower ethanol content. Therefore, 1% ascorbic acid allows obtaining oils that could be considered extra virgin, with a high content of phenolic compounds, mainly secoiridoids, with high antioxidant capacity, high content of volatile LOX compounds and low in ethanol.
Supplementary Materials
The following supporting information can be requested: Table S1, Table S2, Table S3, Table S4 and Figure S1. The following supporting information can be downloaded at the website of this paper posted on Preprints.org.
Author Contributions
Conceptualization, Espínola, F., Moya, M.; Data curation, Moya, M. , Peralta, R.; Formal analysis, Espínola, F., Moya, M.; Funding acquisition, Espínola, F., Moya, M.; Investigation, Peralta, R., Vidal, A.M.; Methodology, Peralta, R. , Vidal, A.M.; Project administration, Espínola, F., Moya, M.; Resources, ; Software, Moya, M.; Supervision, Espínola, F., Moya, M.; Validation, ; Visualization, ; Writing – original draft, Peralta, R., Moya, M., Ocaña, M.T.; Writing – review and editing, Espínola, F., Moya, M., Peralta, R., Ocaña, M.T. All authors have read and agreed to the published version of the manuscript.
Funding
This work was supported by Next Generation EU funds through “Programa Investigo”.
Informed Consent Statement
Not applicable.
Data Availability Statement
Data can be provided on request.
Conflicts of Interest
The authors declare no conflicts of interest.
References
- Neves, B.; Pires, I.M. The Mediterranean Diet and the Increasing Demand of the Olive Oil Sector: Shifts and Environmental Consequences. REGION 2018, 5, 101–112. [Google Scholar] [CrossRef]
- Brkić Bubola, K.; Lukić, M.; Mofardin, I.; Butumović, A.; Koprivnjak, O. Filtered vs. naturally sedimented and decanted virgin olive oil during storage: Effect on quality and composition. LWT 2017, 84, 370–377. [Google Scholar] [CrossRef]
- Burattini, S.; Salucci, S.; Baldassarri, V.; Accorsi, A.; Piatti, E.; Madrona, A.; Espartero, J.L.; Candiracci, M.; Zappia, G.; Falcieri, E. Anti-apoptotic activity of hydroxytyrosol and hydroxytyrosyl laurate. Food and Chemical Toxicology 2013, 55, 248–256. [Google Scholar] [CrossRef]
- Parkinson, L.; Cicerale, S. The Health Benefiting Mechanisms of Virgin Olive Oil Phenolic Compounds. Molecules 2016, 21, 1734. [Google Scholar] [CrossRef]
- Souza, P.A.; Marcadenti, A.; Portal, V.L. Effects of Olive Oil Phenolic Compounds on Inflammation in the Prevention and Treatment of Coronary Artery Disease. Nutrients 2017, 9, 1087. [Google Scholar] [CrossRef] [PubMed]
- Presti, G.; Guarrasi, V.; Gulotta, E.; Provenzano, F.; Provenzano, A.; Giuliano, S.; Monfreda, M.; Mangione, M.R.; Passantino, R.; San Biagio, P.L.; Costa, M.A.; Giacomazza, D. Bioactive compounds from extra virgin olive oils: Correlation between phenolic content and oxidative stress cell protection. Biophys Chem. 2017, 230, 109–116. [Google Scholar] [CrossRef]
- Gavahian, M.; Mousavi Khaneghah, A.; Lorenzo, J.M.; Munekata, P.E.S.; Garcia-Mantrana, I.; Collado, M.C.; Meléndez-Martínez, A.J.; Barba, F.J. Health benefits of olive oil and its components: Impacts on gut microbiota antioxidant activities, and prevention of noncommunicable diseases. Trends Food Sci.Technol. 2019, 88, 220–227. [Google Scholar] [CrossRef]
- Petričević, D.; Velimirović, D.; Drlje, T.D. Positive Health Effects of Olive Oil. Eur. J. Nutr. Food. Saf. 2021, 13, 1–10. [Google Scholar] [CrossRef]
- European Commission. Commission Regulation No 432/2012, establishing a list of permitted health claims made on foods, other than those referring to the reduction of disease risk and to children’s development and health 2012.
- de Torres, A.; Espínola, F.; Moya, M.; Alcalá, S.; Vidal, A.M.; Castro, E. Assessment of phenolic compounds in virgin olive oil by response surface methodology with particular focus on flavonoids and lignans. LWT 2018, 90, 22–30. [Google Scholar] [CrossRef]
- Romani, A.; Pinelli, P.; Mulinacci, N.; Galardi, C.; Vincieri, F.F.; Liberatore, L.; Cichelli, A. HPLC and HRGC analyses of polyphenols and secoiridoid in olive oil. Chromatographia 2001, 53, 279–284. [Google Scholar] [CrossRef]
- Bendini, A.; Cerretani, L.; Carrasco-Pancorbo, A.; Gómez-Caravaca, A.M.; Segura-Carretero, A.; Fernández-Gutiérrez, A.; Lercker, G. Phenolic Molecules in Virgin Olive Oils: a Survey of Their Sensory Properties, Health Effects, Antioxidant Activity and Analytical Methods. An Overview of the Last Decade Alessandra. Molecules 2007, 12, 1719. [Google Scholar] [CrossRef] [PubMed]
- Oliveras-López, M.J.; Innocenti, M.; Giaccherini, C.; Ieri, F.; Romani, A.; Mulinacci, N. Study of the phenolic composition of spanish and italian monocultivar extra virgin olive oils: Distribution of lignans, secoiridoidic, simple phenols and flavonoids. Talanta 2007, 73, 726–732. [Google Scholar] [CrossRef]
- Servili, M.; Esposto, S.; Lodolini, E.; Selvaggini, R.; Taticchi, A.; Urbani, S.; Montedoro, G.; Serravalle, M.; Gucci, R. Irrigation Effects on Quality, Phenolic Composition, and Selected Volatiles of Virgin Olive Oils Cv. Leccino. J. Agric. Food Chem. 2007, 55, 6609–6618. [Google Scholar] [CrossRef] [PubMed]
- Ramírez, E.; Medina, E.; Brenes, M.; Romero, C. Endogenous enzymes involved in the transformation of oleuropein in Spanish table olive varieties. J.Agric.Food Chem. 2014, 62, 9569–9575. [Google Scholar] [CrossRef]
- García-Rodríguez, R.; Romero-Segura, C.; Sanz, C.; Pérez, A.G. Modulating oxidoreductase activity modifies the phenolic content of virgin olive oil. Food Chem. 2015, 171, 364–369. [Google Scholar] [CrossRef] [PubMed]
- Clodoveo, M.; Camposeo, S.; Amirante, R.; Dugo, G.; Cicero, N.; Boskou, D. Research and Innovative Approaches to Obtain Virgin Olive Oils with a Higher Level of Bioactive Constituents. In Research and Innovative Approaches to Obtain Virgin Olive Oils with a Higher Level of Bioactive Constituents. In, 2015; pp. 179–215.
- Hachicha Hbaieb, R.; Kotti, F.; Valli, E.; Bendini, A.; Toschi, T.G.; Gargouri, M. Effect of Tunisian olive ripeness on endogenous enzymes and virgin olive oil phenolic composition. Journal of Food Composition and Analysis 2017, 62, 43–50. [Google Scholar] [CrossRef]
- Yousfi, K.; Cert, R.M.; García, J.M. Changes in quality and phenolic compounds of virgin olive oils during objectively described fruit maturation. European Food Research and Technology 2006, 223, 117–124. [Google Scholar] [CrossRef]
- Gómez-Rico, A.; Inarejos-García, A.M.; Salvador, M.D.; Fregapane, G. Effect of Malaxation Conditions on Phenol and Volatile Profiles in Olive Paste and the Corresponding Virgin Olive Oils (Olea europaea L. Cv. Cornicabra). J. Agric. Food Chem. 2009, 57, 3587–3595. [Google Scholar] [CrossRef]
- García-Vico, L.; Sánchez, R.; Fernández, G.; Sanz, C.; Pérez, A., G. Study of the olive β-glucosidase gene family putatively involved in the synthesis of phenolic compounds of virgin olive oil. J. Sci. Food Agric. 2021, 101, 5409–5418. [Google Scholar] [CrossRef]
- Batarseh, Y.S.; Kaddoumi, A. Oleocanthal-rich extra-virgin olive oil enhances donepezil effect by reducing amyloid-β load and related toxicity in a mouse model of Alzheimer’s disease. J. Nutr. Biochem. 2018, 55, 113–123. [Google Scholar] [CrossRef] [PubMed]
- Agrawal, K.; Melliou, E.; Li, X.; Pedersen, T.L.; Wang, S.C.; Magiatis, P.; Newman, J.W.; Holt, R.R. Oleocanthal-rich extra virgin olive oil demonstrates acute anti-platelet effects in healthy men in a randomized trial. Journal of Functional Foods 2017, 36, 84–93. [Google Scholar] [CrossRef] [PubMed]
- Scotece, M.; Conde, J.; Abella, V.; Lopez, V.; Pino, J.; Lago, F.; Smith, A.B.; Gómez-Reino, J.J.; Gualillo, O. New drugs from ancient natural foods. Oleocanthal, the natural occurring spicy compound of olive oil: a brief history. Drug Discov.Today 2015, 20, 406–410. [Google Scholar] [CrossRef] [PubMed]
- Filipek, A.; Czerwińska, M.E.; Kiss, A.K.; Wrzosek, M.; Naruszewicz, M. Oleacein enhances anti-inflammatory activity of human macrophages by increasing CD163 receptor expression. Phytomedicine 2015, 22, 1255–1261. [Google Scholar] [CrossRef] [PubMed]
- Filipek, A.; Czerwińska, M.E.; Kiss, A.K.; Polański, J.A.; Naruszewicz, M. Oleacein may inhibit destabilization of carotid plaques from hypertensive patients. Impact on high mobility group protein-1. Phytomedicine 2017, 32, 68–73. [Google Scholar] [CrossRef] [PubMed]
- Valli, M.; Peviani, E.G.; Porta, A.; D'Alfonso, A.; Zanoni, G.; Vidari, G. A Concise and Efficient Total Synthesis of Oleocanthal. Eur. J. Org. Chem. 2013, 2013, 4332–4336. [Google Scholar] [CrossRef]
- Adhami, H.; Zehl, M.; Dangl, C.; Dorfmeister, D.; Stadler, M.; Urban, E.; Hewitson, P.; Ignatova, S.; Krenn, L. Preparative isolation of oleocanthal, tyrosol, and hydroxytyrosol from olive oil by HPCCC. Food Chem. 2015, 170, 154–159. [Google Scholar] [CrossRef] [PubMed]
- Angelis, A.; Hamzaoui, M.; Aligiannis, N.; Nikou, T.; Michailidis, D.; Gerolimatos, P.; Termentzi, A.; Hubert, J.; Halabalaki, M.; Renault, J.; Skaltsounis, A. An integrated process for the recovery of high added-value compounds from olive oil using solid support free liquid-liquid extraction and chromatography techniques. Journal of Chromatography A 2017, 1491, 126–136. [Google Scholar] [CrossRef] [PubMed]
- Vidal, A.M.; Alcalá, S.; Ocaña, M.T.; De Torres, A.; Espínola, F.; Moya, M. Elaboration of extra-virgin olive oils rich in oleocanthal and oleacein: pilot plant’s proposal. European Food Research and Technology 2020, 246, 1459–1468. [Google Scholar] [CrossRef]
- Espínola, F.; Moya, M.; Fernández, D.G.; Castro, E. Improved extraction of virgin olive oil using calcium carbonate as coadjuvant extractant. J. Food Eng. 2009, 92, 112–118. [Google Scholar] [CrossRef]
- Espínola, F.; Moya, M.; Fernández, D.; Castro, E. Modelling of virgin olive oil extraction using response surface methodology. Int. J. Food Sci. Tech. 2011, 46. [Google Scholar] [CrossRef]
- Moya, M.; Espínola, F.; Fernández, D.; Torres, A.; Marcos, J.; Vilar, J.; Josue, J.; Sánchez, T.; Castro, E. Industrial trials on coadjuvants for olive oil extraction. J. Food Eng. 2010, 97, 57–63. [Google Scholar] [CrossRef]
- European Commission. Commission Regulation No 2568/91, on the characteristics of olive oil and olive-residue oil and on the relevant methods of analysis 1991.
- International Olive Council. Determination of biophenols in olive oils by HPLC. COI/T.20/Doc No 29/Rev 2 2022.
- Vidal Castro, A.; Alcalá Reyes, S.; Torres, A.; Espínola, F.; Moya, M. Modeling of volatile and phenolic compounds and optimization of the process conditions for obtaining balanced extra virgin olive oils. Grasas Aceites 2018, 69. [Google Scholar] [CrossRef]
- Vidal, A.M.; Alcalá, S.; de Torres, A.; Moya, M.; Espínola, F. Use of talc in oil mills: Influence on the quality and content of minor compounds in olive oils. LWT 2018, 98, 31–38. [Google Scholar] [CrossRef]
- Vidal, A.M.; Moya, M.; Alcalá, S.; Romero, I.; Espínola, F. Enrichment of Refined Olive Oils with Phenolic Extracts of Olive Leaf and Exhausted Olive Pomace. Antioxidants 2022, 11, 204. [Google Scholar] [CrossRef]
- European Commission. Regulation (EU) No 1308/2013 of the European Parliament and of the Council of 17 December 2013 establishing a common organisation of the markets in agricultural products and repealing Council Regulations (EEC) No 922/72, (EEC) No 234/79, (EC) No 1037/2001 and (EC) No 1234/2007 2013.
- International Olive Council. Sensory analysis of olive oil. COI/T.20/Doc No 4/Rev 1 2007.
Figure 1.
Average values of oleacein and oleocanthal, and their standard errors, determined in the oils obtained with the different acids and their doses.
Figure 1.
Average values of oleacein and oleocanthal, and their standard errors, determined in the oils obtained with the different acids and their doses.
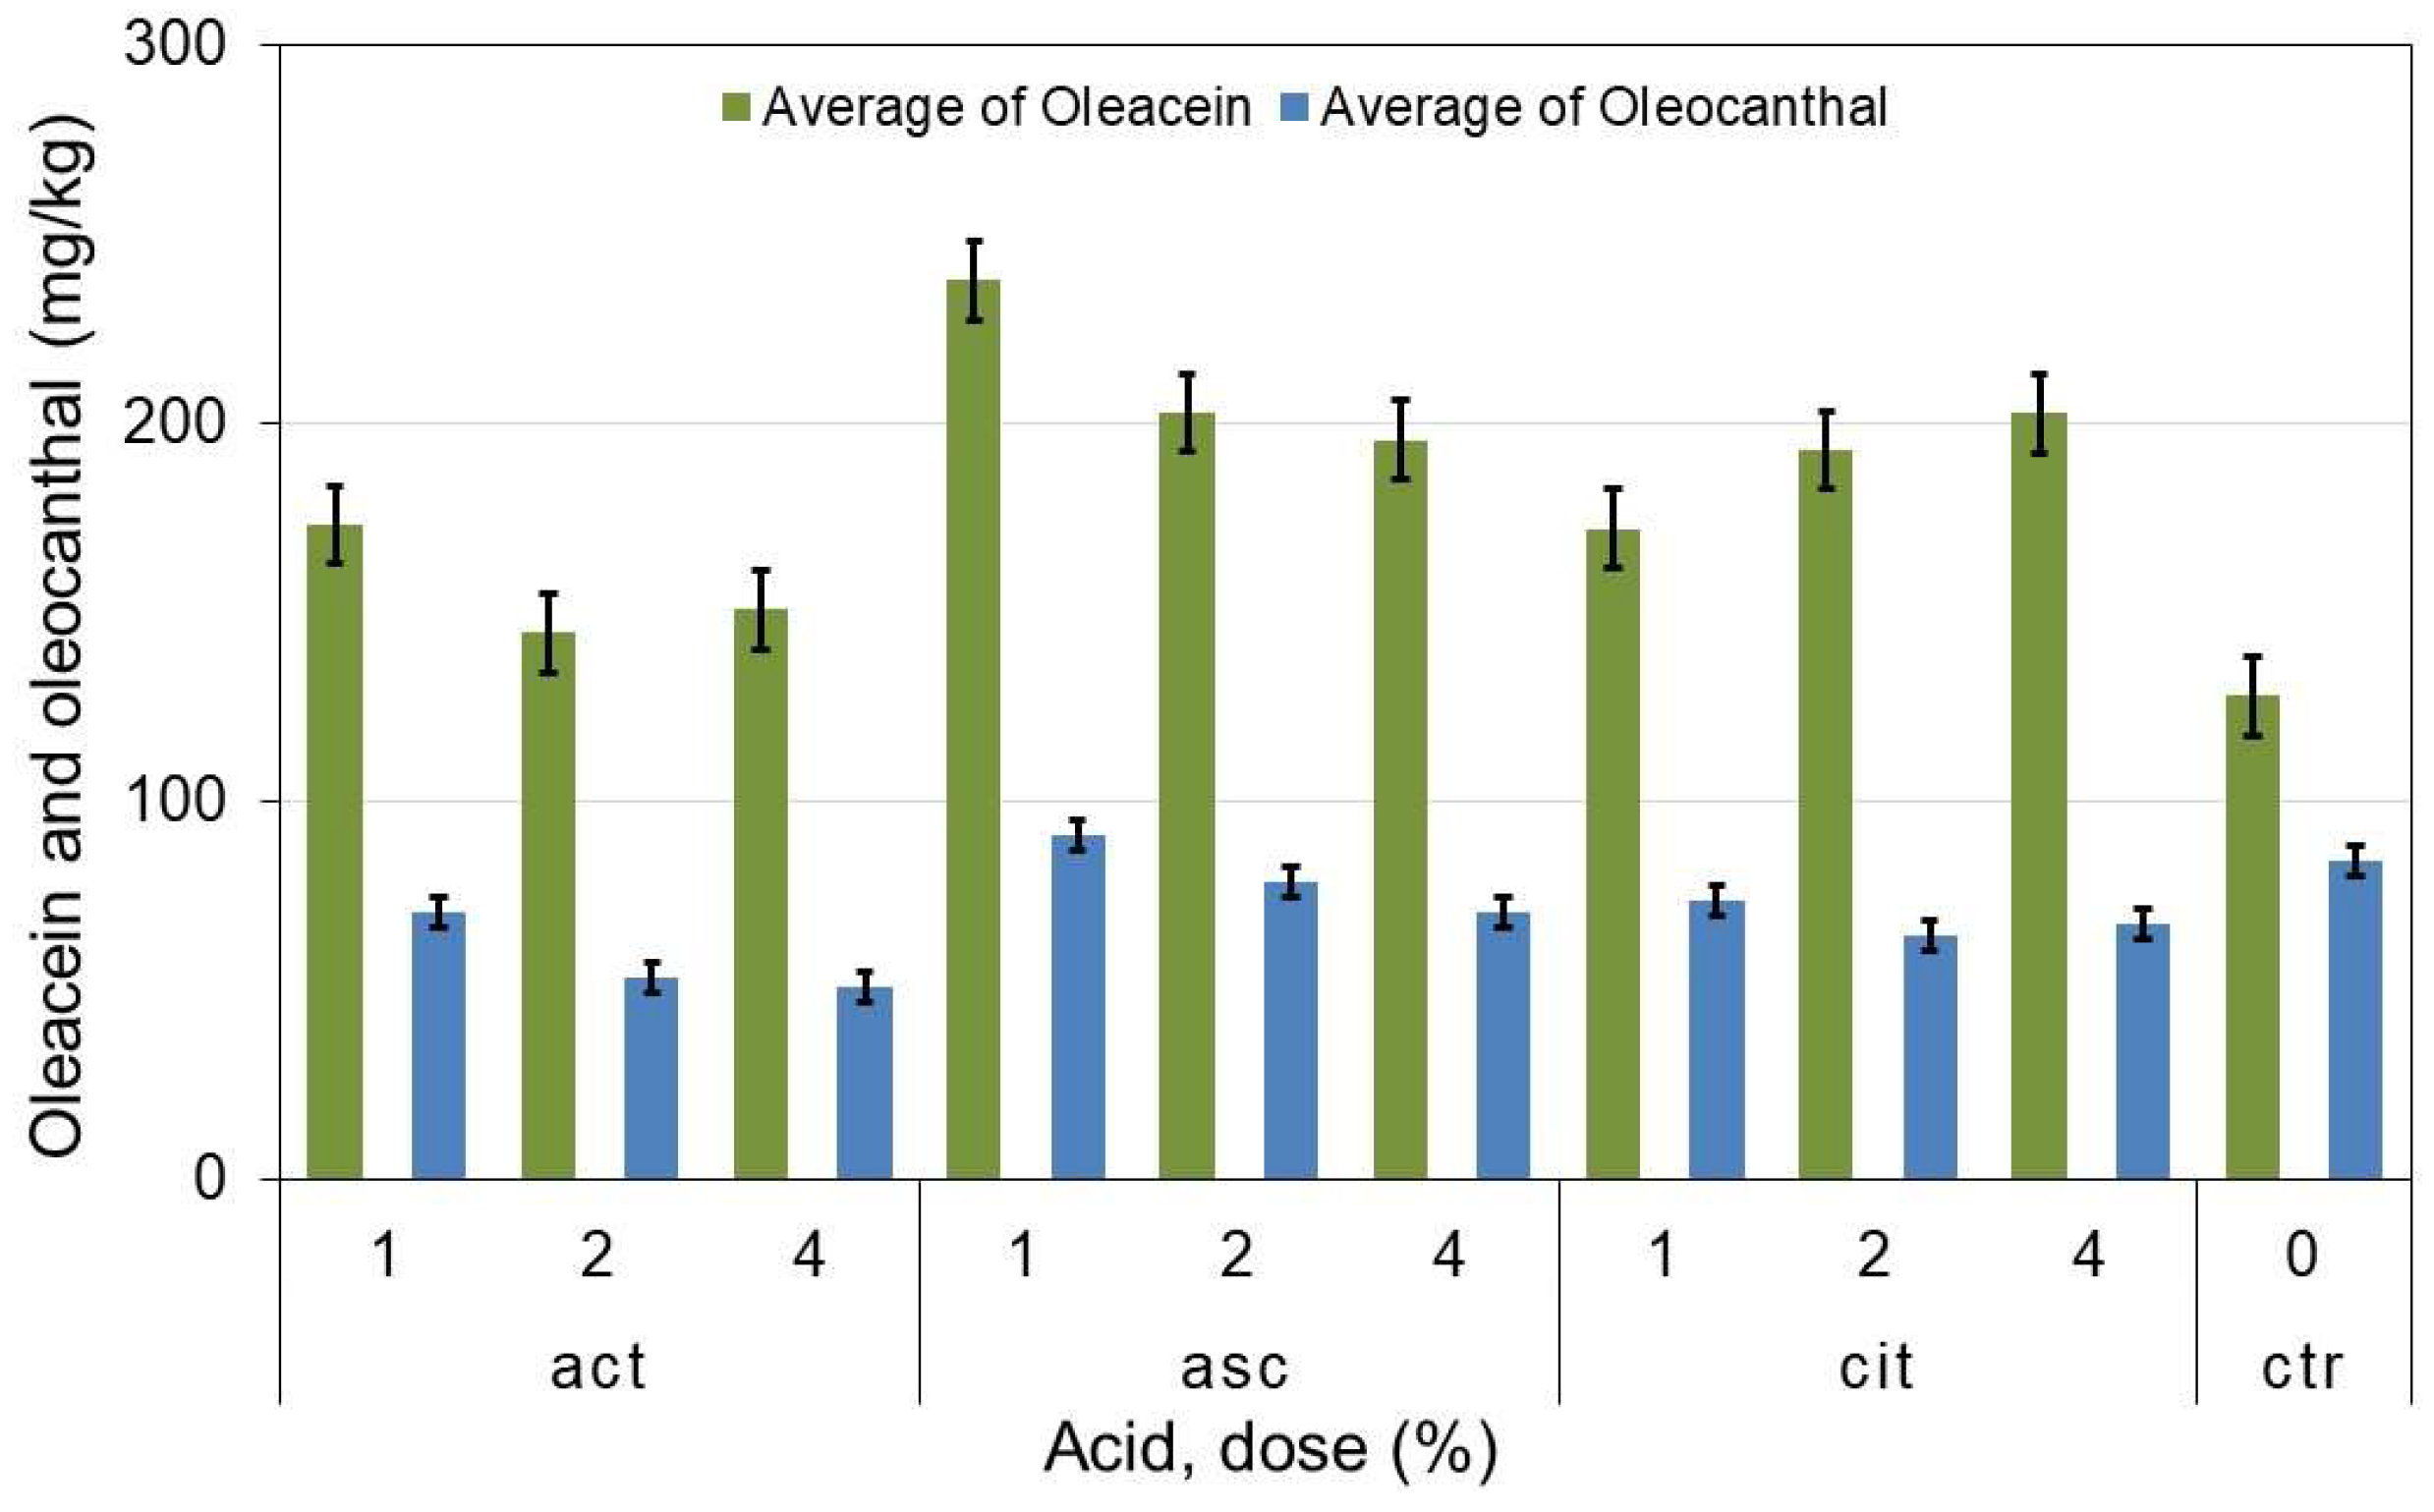
Figure 2.
Dependence of antioxidant capacity on the content of oleacein, secoiridoids and total phenols in the oils.
Figure 2.
Dependence of antioxidant capacity on the content of oleacein, secoiridoids and total phenols in the oils.
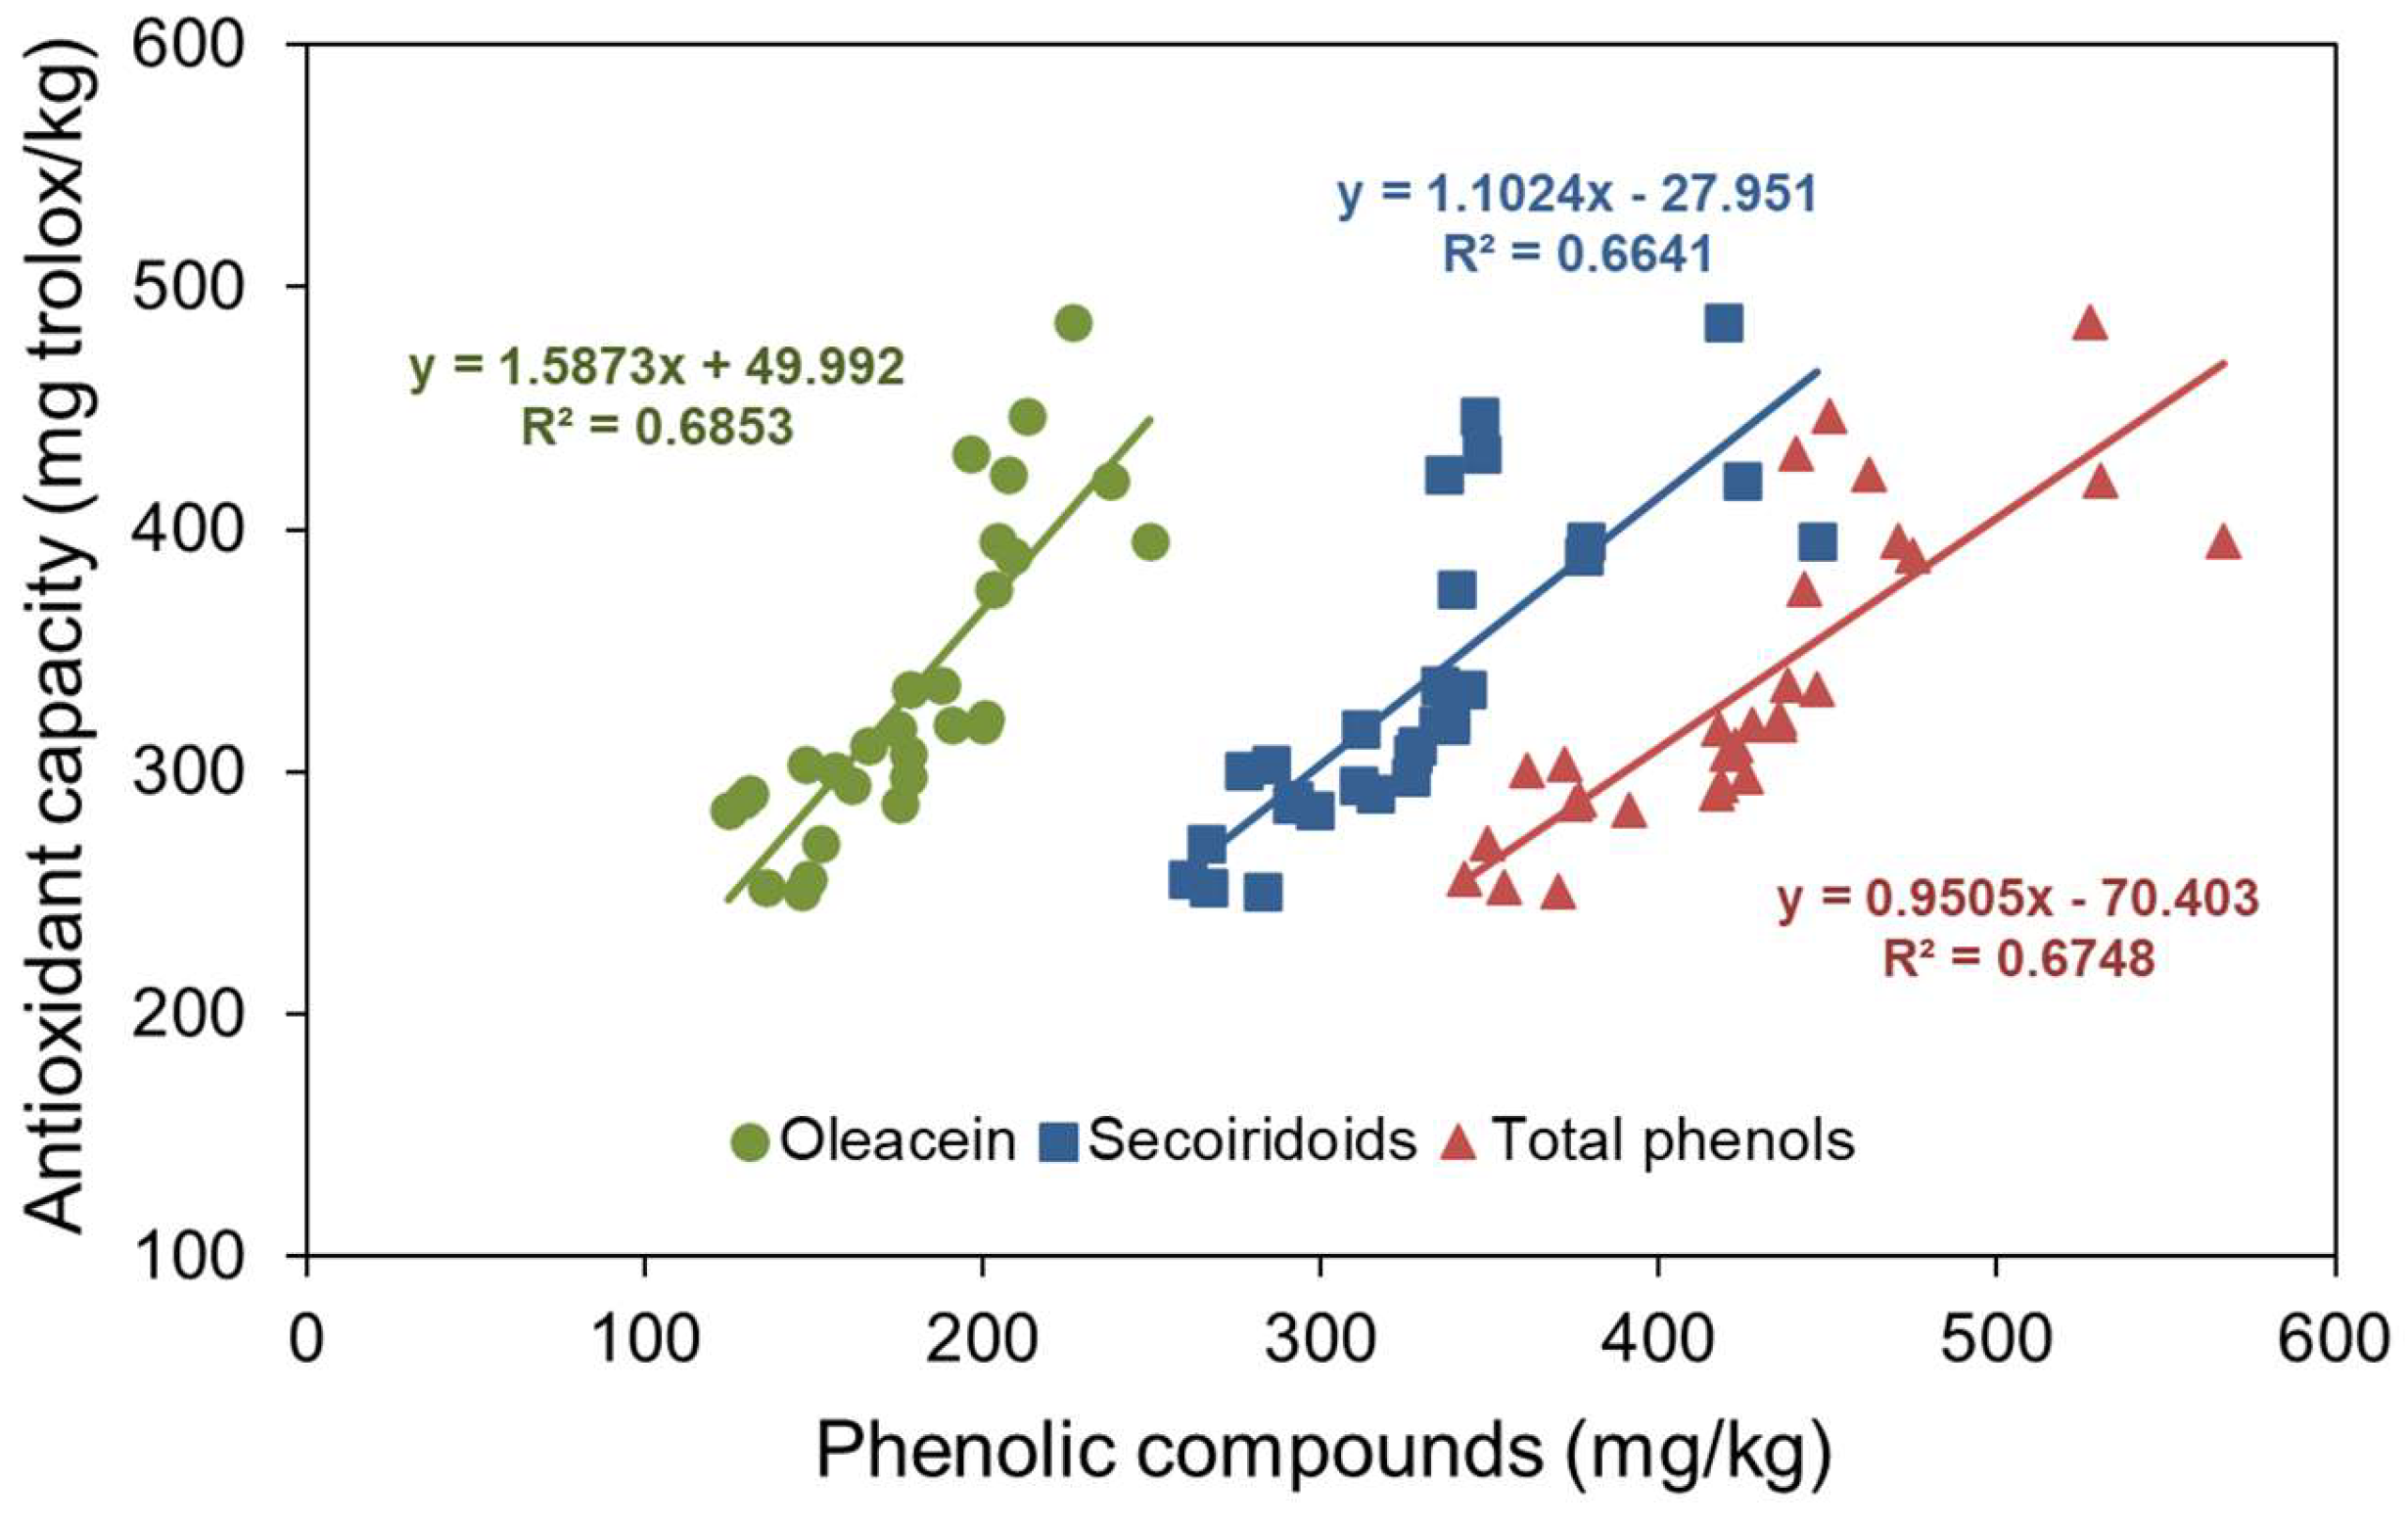

Table 1.
Composition of the raw material (olive) *.
| Water, % | Oil, % | Solids, % |
|---|---|---|
| 58.65 ± 0.26 | 13.35 ± 0.52 | 27.99 ± 0.72 |
* Mean and standard deviation of 4 replicates.
Table 2.
Average pH and extraction efficiency *.
| Acid | pH | Extraction efficacy, % |
|---|---|---|
| Control (0 %) | 4.95 ± 0.03 a | 67.81 ± 1.49 ab |
| Acetic (1 %) | 4.22 ± 0.04 b | 63.74 ± 3.96 ab |
| Acetic (2 %) | 3.99 ± 0.02 c | 66.27 ± 1.42 ab |
| Acetic (4 %) | 3.79 ± 0.01 d | 65.26 ± 2.78 ab |
| Ascorbic (1 %) | 4.33 ± 0.05 b | 68.83 ± 1.17 b |
| Ascorbic (2 %) | 3.96 ± 0.18 c | 67.53 ± 1.10 ab |
| Ascorbic (4 %) | 3.77 ± 0.00 d | 63.70 ± 3.60 ab |
| Citric (1 %) | 3.89 ± 0.04 cd | 66.24 ± 1.29 ab |
| Citric (2 %) | 3.48 ± 0.03 e | 63.45 ± 4.09 a |
| Citric (4 %) | 3.01 ± 0.02 f | 67.63 ± 1.83 ab |
| Fisher’s LSD | 0.14 | 5.29 |
* Mean and standard deviation of 3 replicates. Superscripts indicate which means are considered statistically equal or different according to Fisher's LSD at the 95% confidence level.
Table 3.
Individual Secoiridoids, Total Phenols and Antioxidant Capacity (FRAP).
| Acid | 3,4-DHPEA-EDA (oleacein), mg/kg |
p-HPEA-EDA (oleocanthal), mg/kg | 3,4-DHPEA-EA, mg/kg | p-HPEA-EA, mg/kg | Total Phenols, mg/kg |
FRAP, mg Trolox/kg |
|---|---|---|---|---|---|---|
| Control (0 %) | 127.97 ± 2.52 a | 84.16 ± 4.95 ab | 77.92 ± 4.72 a | 11.83 ± 1.06 a | 394.92 ± 16.79 a | 288.38 ± 2.82 ab |
| Acetic (1 %) | 173.04 ± 5.10 c | 70.61 ± 4.70 cd | 75.80 ± 8.04 ac | 8.15 ± 1.03 bcd | 428.75 ± 12.68 c | 321.23 ± 9.79 a |
| Acetic (2 %) | 144.62 ± 6.50 b | 53.73 ± 7.32 e | 64.47 ± 1.45 b | 8.74 ± 1.14 bc | 357.85 ± 8.80 b | 257.98 ± 8.94 b |
| Acetic (4 %) | 150.73 ± 3.88 b | 50.91 ± 2.47 e | 64.41 ± 7.63 b | 8.15 ± 0.47 bc | 358.59 ± 12.15 b | 286.66 ± 21.46 ab |
| Ascorbic (1 %) | 237.58 ± 9.18 e | 91.39 ± 2.15 b | 91.61 ± 3.65 d | 9.60 ± 0.67 cd | 541.77 ± 18.01 e | 433.63 ± 38.32 c |
| Ascorbic (2 %) | 202.80 ± 5.13 d | 78.66 ± 3.75 ac | 76.16 ± 5.79 a | 9.94 ± 0.63 d | 462.12 ± 15.35 d | 405.04 ± 18.60 c |
| Ascorbic (4 %) | 195.47 ± 4.91 d | 70.81 ± 3.76 cd | 61.29 ± 0.97 b | 8.85 ± 0.27 bcd | 431.37 ± 3.97 cd | 321.02 ± 1.28 a |
| Citric (1 %) | 172.16 ± 8.00 c | 74.06 ± 2.24 acd | 66.42 ± 1.20 bc | 8.82 ± 0.54 bcd | 421.42 ± 3.14 ac | 300.17 ± 5.39 ab |
| Citric (2 %) | 192.81 ± 12.30 d | 64.47 ± 7.52 d | 58.45 ± 2.36 b | 7.35 ± 0.35 b | 417.87 ± 30.50 ac | 327.42 ± 36.69 a |
| Citric (4 %) | 202.57 ± 10.65 d | 67.71 ± 5.51 d | 60.86 ± 1.93 b | 8.10 ± 0.29 bc | 450.18 ± 9.63 cd | 402.01 ± 47.66 c |
| Fisher’s LSD | 15.86 | 10.22 | 9.73 | 1.53 | 32.36 | 53.07 |
* Mean and standard deviation of 3 replicates. Superscripts indicate which means are considered statistically equal or different according to Fisher's LSD at the 95% confidence level.
Table 4.
Total volatile compounds of the lipoxygenase pathway, of 6 (C6) and 5 (C5) carbon atoms, and ethanol in oils *.
Table 4.
Total volatile compounds of the lipoxygenase pathway, of 6 (C6) and 5 (C5) carbon atoms, and ethanol in oils *.
| Acid | Total C6 LOX, mg/kg |
Total C5 LOX, mg/kg |
Ethanol, mg/kg |
|---|---|---|---|
| Control (0 %) | 8.69 ± 0.56 a | 2.01 ± 0.05 ab | 4.56 ± 0.19 a |
| Acetic (1 %) | 10.07 ± 0.62 d | 1.80 ± 0.00 a | 2.52 ± 0.10 c |
| Acetic (2 %) | 7.15 ± 0.57 c | 1.43 ± 0.08 d | 2.30 ± 0.16 bc |
| Acetic (4 %) | 4.67 ± 0.29 b | 0.49 ± 0.04 c | 1.93 ± 0.17 b |
| Ascorbic (1 %) | 12.82 ± 0.61 e | 2.23 ± 0.11 b | 3.74 ± 0.53 d |
| Ascorbic (2 %) | 10.92 ± 0.76 d | 3.03 ± 0.15 f | 2.81 ± 0.36 c |
| Ascorbic (4 %) | 14.07 ± 1.13 f | 3.27 ± 0.03 fg | 4.33 ± 0.19 ad |
| Citric (1 %) | 16.69 ± 0.34 g | 3.33 ± 0.29 g | 4.04 ± 0.48 ad |
| Citric (2 %) | 15.09 ± 0.67 f | 2.09 ± 0.12 b | 4.23 ± 0.26 ad |
| Citric (4 %) | 11.09 ± 0.64 d | 2.60 ± 0.12 e | 2.74 ± 0.24 c |
| Fisher’s LSD | 1.06 | 0.22 | 0.52 |
* Mean and standard deviation of 3 replicates. Superscripts indicate which means are considered statistically equal or different according to Fisher's LSD at the 95% confidence level.
Disclaimer/Publisher’s Note: The statements, opinions and data contained in all publications are solely those of the individual author(s) and contributor(s) and not of MDPI and/or the editor(s). MDPI and/or the editor(s) disclaim responsibility for any injury to people or property resulting from any ideas, methods, instructions or products referred to in the content. |
© 2024 by the authors. Licensee MDPI, Basel, Switzerland. This article is an open access article distributed under the terms and conditions of the Creative Commons Attribution (CC BY) license (http://creativecommons.org/licenses/by/4.0/).
Copyright: This open access article is published under a Creative Commons CC BY 4.0 license, which permit the free download, distribution, and reuse, provided that the author and preprint are cited in any reuse.


