
Submitted:
24 December 2024
Posted:
24 December 2024
You are already at the latest version
Abstract
The use of screw piles has grown up rapidly, yet their varied configurations and be-havior in different soils remain key research areas. This study examines the perfor-mance of Toe-wing (Tsubasa) and Spiral screw piles with similar tip areas under similar ground conditions, focusing on how helix position (Wp) and tip embedment depth (Ed) affect the ultimate pile capacity. In the case of fixed helix/toe-wing position with in-creasing pile tip depth, Spiral screw piles exhibited higher load-carrying resistance than toe-wing piles at relative densities of 55%, 80%, and 90%. Moreover, load-carrying re-sistance increased as the position of the helix/toe-wing increased (Wp > 0). For a fixed pile tip depth (Ed) and varying helix/toe-wing positions, spiral screw piles showed higher resistance than toe-wing piles when Wp < 90mm. Moreover, the resistance de-creased as the helix moved away (Wp/Dh > 0), and the pile tip acted independently when Wp/Dh > 1.38. Whereas, for toe-wing piles, ultimate pile capacity increased as the toe-wing moved away from the tip up to Wp/Dh = 2.15, then decreased, to reflect the independent behavior of the toe-wing and pile tip. Empirical equations are presented to convert installation effort and ultimate capacity from one type to another.
Keywords:
Toe-wing Screw Pile
; Spiral Screw Pile
; Ultimate Pile Capacity
; Installation Effort
; Helix Position Effects
; Pile load tests
; Embedment depth of pile tip
; Relative Density
1. Introduction
Screw piles and Tsubasa piles are widely acknowledged for their sustainability and environmentally friendly properties, making them a reliable and efficient choice for a broad range of deep foundation applications. These innovative foundation systems align with the growing demand for sustainable construction practices, offering versatility and adaptability across diverse geotechnical conditions.
Deep foundations are essential for transferring building loads to deeper, more stable soil layers or rock strata, especially when surface soil lacks sufficient bearing capacity. These foundations provide stability and support for bridges, high-rise buildings, and industrial complexes. Among various deep foundation systems, screw piles have emerged as one of the most popular and effective solutions. Known for their ease of installation, adaptability to different soil types, and load-bearing capacity, screw piles are widely used in both construction and infrastructure projects.
Screw piles are typically constructed from high-strength steel and consist of either an open or closed-end pipe with a helix welded at the pipe’s end (single helix). Saleem et al. [1] investigated the effect of pile end shape (flat, conical, cutting-edge) on installation effort and ultimate pile capacity without considering the helix plates. Cutting-edge shaft requires less installation effort (load and torque) than the other two shapes. It is also common to have piles with multiple helices (multi-helix) and piles featuring a continuous helical wing attached around a pipe shaft (continuous helix). These variations offer flexibility in design and application, making helical piles suitable for various ground conditions and load requirements [2]. Screw piles are commonly used for large structures in Japan and other Asian countries. These piles can have shaft diameters of up to 1,600 mm and helix-to-shaft ratios of up to 2.5. They are widely employed as foundation systems for bridges, buildings, and other infrastructure to resist seismic loads and support various civil engineering projects. Their ability to withstand dynamic forces makes them particularly valuable in earthquake-prone regions [3]. Screw piles offer the advantage of increased vertical bearing capacity due to the resistance provided by the wing portion. Various wing shapes have been developed and studied, with research focused on evaluating their impact on vertical bearing capacity. These advancements enhance the performance and versatility of screw piles in different soil conditions and applications.
The effects of wing position and shape on the vertical bearing capacity of various types of screw piles used in Japan have been investigated, and the relationship between vertical load and displacement at the pile tip was presented based on the results of numerous load tests. These findings provide valuable insights into optimizing screw pile design for improved performance [4,5]. Ho et al. [6] indicated that in the case of a single helix screw pile (without considering pile installation effect), the central shaft and helix behaved independently if dh/Dh ≥ 1.5 (dh is helix position from pile shaft tip as Dh is helix diameter). Screw-shaft piles demonstrate excellent performance, offering significantly greater bearing capacity than driven or bored shafts [7]. The addition of large blades significantly enhances the compressive and tensile capacities of screw piles, improving load-bearing efficiency, and increasing Young’s modulus of the surrounding soil enhances the bearing capacity and reduces settlement [8]. The previous test results show that the single helical pile has the highest bearing capacity and efficiency when the pitch is 0.02 times the blade’s buried depth, the blade diameter is 2.5 times the pile diameter, the multi-blade spacing is more than twice the blade diameter, and the number of blades is less than or equal to three. However, compared to the straight pile, the vertical bearing capacity of the single-inclined helical pile did not improve significantly [9].
Based on [10], for screw piles, the load carried by the central shaft beneath the helix increases as the helix diameter increases. This suggests that larger helix diameters lead to a more inward concentration of load distribution toward the central shaft. In a comparison between screw piles and straight-shaft piles with the same shaft diameter (Ds), the study found that the load on the shaft below the helix equals the tip load of the straight pile when the helix diameter is approximately 4.15 times the shaft diameter. These findings are based on tests conducted in dense, fine sand.
As screw piles are installed through a pressing and rotating process, the properties of the sandy soil at the pile-soil interface have been observed to change. According to [11], particle size distribution near the pile may change during installation, reducing the interface friction angle at large deformations. Both soil conditions and the geometric characteristics of the pile influence installation torque. It increases with higher sand density and greater installation depth [12,13]. The stresses in sandy soil vary spatially relative to the pile tip location; stress measurements by [14] showed that the stresses developed during installation were directly correlated with local qc values, and normalizing by qc reduced the impact of variations in the test setup. Numerical simulations of pile installation by [15] were compared with experimental results from centrifuge tests. Both results indicated a significant increase in effective vertical stress below the pile base and changes in porosity near the pile shaft. However, some differences were observed between the numerical and experimental results. Depending on the grain size characteristics of the sandy soil, in-situ soil density, pile spacing, and pile diameter, the installation process can result in noticeable compaction and an increase in lateral stress [16]. Malik et al. [17,18] investigated that the installation of a screw pile changes the state of the ground around the pile, and this change is related to the initial density of the ground and advancement ratio. This study presented empirical equations for this change to capture ultimate bearing capacity and installation effort.
The study conducted by [19] developed a FEM-SPH numerical model to simulate the installation of screw piles and analyze the resulting soil deformations. By comparing field installation tests, FEM-SPH simulations, and traditional FEM results, the study demonstrated that the FEM-SPH method offers superior accuracy and efficiency for handling large soil deformations during pile installation. The findings revealed that pile parameters, particularly spiral pitch and diameter, significantly influence installation torque, soil stress, and soil pressure. Two failure mechanisms were identified: heave failure in shallow soils (HFM), affected only by pile diameter, and cylindrical shear failure in deeper soils (CSFM), influenced by pile diameter and spiral pitch. It is well established that loose, clean, granular sandy soils tend to contract during the installation of displacement piles [20]. Notably, when piles are installed in loose sand, compaction can extend up to 3.5 to 6 diameters away from the pile shaft [21]. Moreover, [22] found that the void ratio decreased by approximately 5% near the lower half of driven piles. Unfortunately, few studies have been conducted on the extent and distribution of compaction around displacement piles since then. The vertical bearing capacity of screw piles with different blade configurations can be determined using Equation 1, based on guidelines from the Ministry of Land, Infrastructure, Transport and Tourism of Japan (MLIT). It is observed that the pile tip support capacity coefficient α is significantly higher for closed-end shapes compared to open-end shapes. Additionally, no substantial differences are noted based on the position or shape of the blades. The support capacity for cohesive soil is approximately 1.25 times greater than that for sandy soil [23].
α: Pile tip support capacity coefficient, (β, γ): Frictional resistance coefficients for the pile’s surrounding soil in sandy and cohesive soils, respectively, Ap: Effective cross-sectional area of the pile tip (m²), N: Average N value within a range of 1 Dw downward and 1 Dw upward from the blade (Dw: blade diameter), Ø: Perimeter of the shaft (m), Ns: Average N value of the sandy soil surrounding the pile, Ls: Effective length of the pile in contact with sandy soil surrounding it (m), qu: Average unconfined compressive strength of the cohesive soil surrounding the pile (kN/m²), Lc: Effective length of the pile in contact with cohesive soil surrounding it (m).
The Tsubasa pile is one of the most used screw pile types in Japan. Its key advantages include low noise during installation, minimal vibration, environmental friendliness during construction, independence from groundwater levels, recyclability, high execution speed, and economic efficiency [24]. The Tsubasa pile is a steel pipe pile equipped with a toe-wing mounted at the leading edge of the steel pipe. The wing-shaped component comprises two intersecting semicircular flat steel plates with a closed tip [24].
In the current literature, only a limited number of studies deal with the behavior of piles with toe-wings under different soil conditions and loading scenarios. Furthermore, there are no comparative analyses between toe-wing piles and alternative pile types, such as screw piles, to show which is better in dense sand in terms of installation effort (pushing load and torque) and ultimate bearing capacity. To address this gap, the present study conducts a comprehensive experimental investigation aimed at systematically comparing the performance characteristics of toe-wing screw piles and spiral screw piles under controlled soil conditions. The study examines the effect of helix/toe-wing position relative to the pile tip on ultimate pile capacity and installation effort. Additionally, the influence of the embedment depth of the helical plates is also analyzed under various relative densities in the experimental facility. This exhaustive approach aims to provide a clearer understanding of how these factors interact and contribute to the overall behavior of toe-wing and spiral screw piles in cohesionless soil.
2. Materials and Methods
2.1. Testing Procedure
The model ground was prepared with dry Toyoura sand, which has the following properties:

Table 1.
Properties of test Sand materials.
| Test Materials | Specific Gravity | D50 | Emax | Emin |
|---|---|---|---|---|
| Dry Toyoura Sand | 2.645 | 0.19 | 0.973 | 0.609 |
Garnier et al. [25] and Rakotonindriana et al. [26] reported that scale effects on pile tip resistance are negligible when the pile tip diameter to D50 ratio exceeds 35. In the present study, the Dh/D50 ratio was approximately 342.
This study used dry Toyoura sand to model the ground; according to the Unified Soil Classification System (USCS), the material is classified as fine sand. Two sand layers were used to simulate realistic ground conditions loose over dense. For all tests, the upper three layers were prepared in a loose state with a relative density of 45%, while the lower seven layers were constructed with varying relative densities of very dense (90%), medium dense (80%), and loose (55%), and the total height of the sand prepared in the container was 1000 mm. A systematic sand placement and compaction method was developed to achieve the required unit weight. The sand was placed and compacted in layers, each 100 mm thick, using a steel falling rammer. The compaction process was carefully calibrated before testing to ensure reproducibility of the target unit weight. Calibration involved adjusting the height of the rammer drop and the number of blows per area to match the desired unit weight. This method was refined through multiple trials, ultimately proving effective in achieving consistent and accurate compaction for the experimental setup.
2.2. Model Container
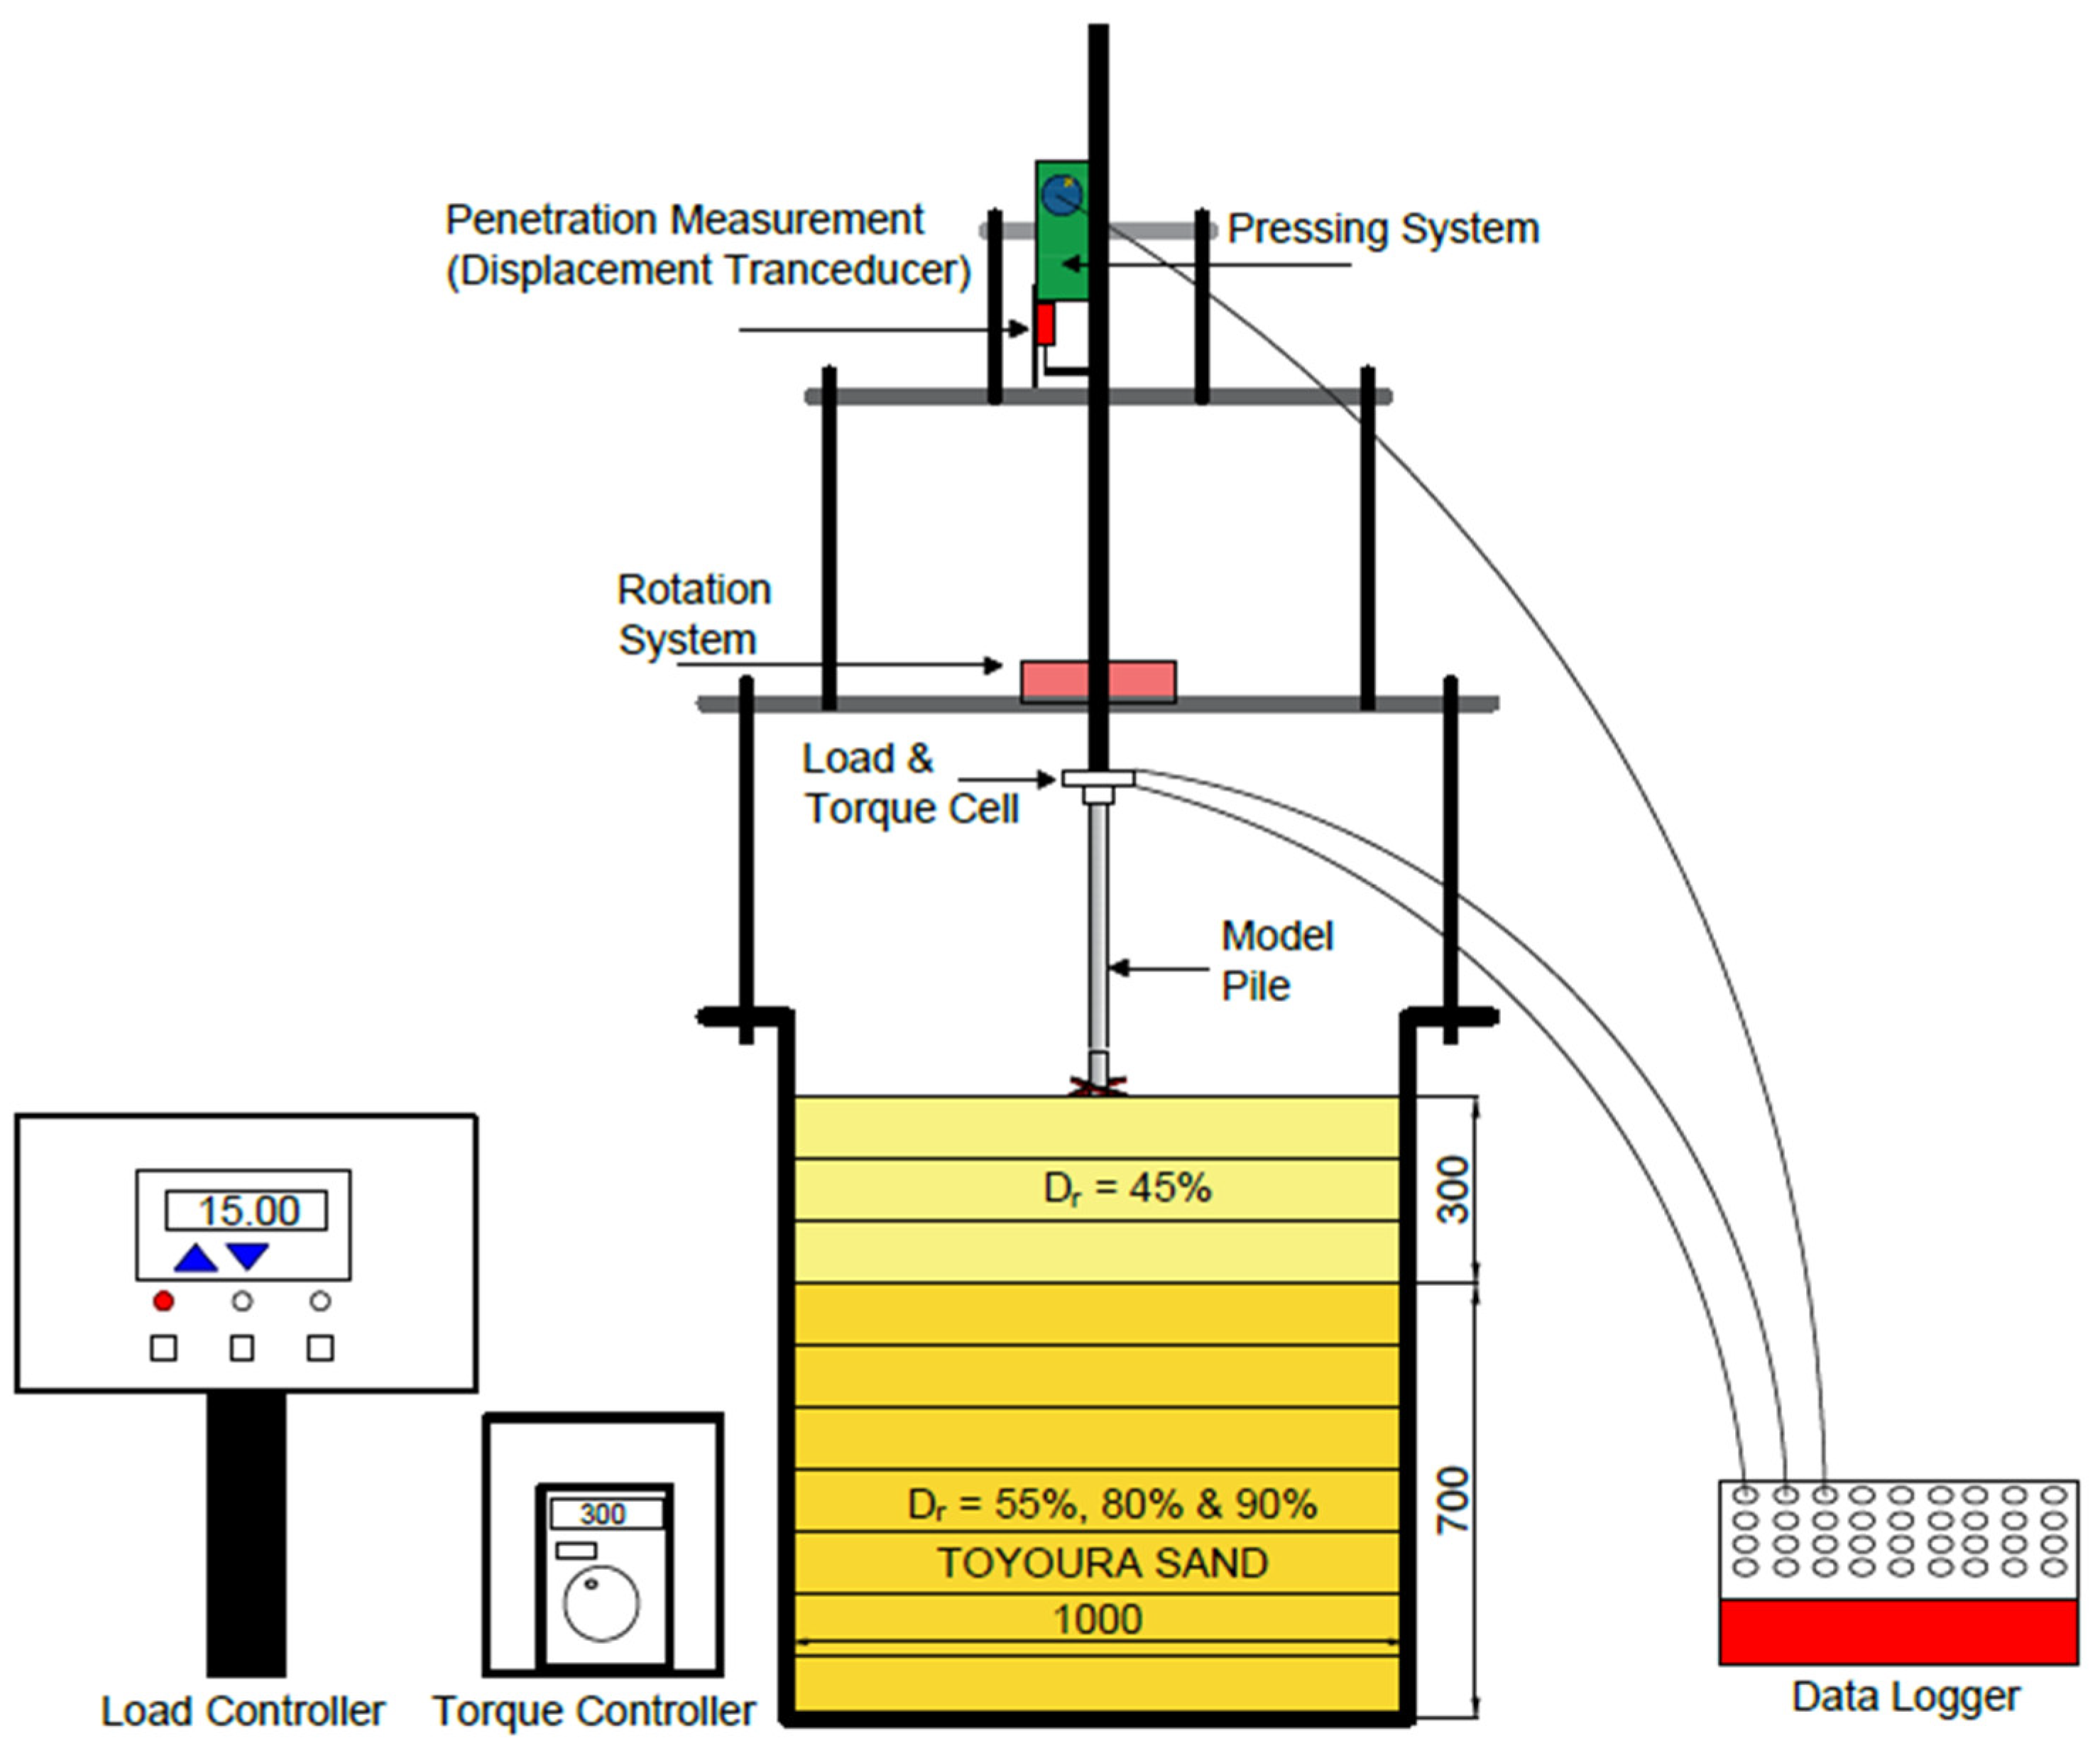
The container size plays a crucial role in pile load tests, as it significantly impacts the accuracy of results by minimizing boundary effects. The current study utilized a large rigid steel container to ensure reliable outcomes. The container has an inner diameter of 1000 mm and a height of 1100 mm. Previous studies suggest the zone affected by pile loading typically extends 3 to 8 times the pile tip diameter [27,28]. Realistic soil-pile interactions can be accurately replicated by ensuring the container size falls within this range. This minimizes interference from the container walls and preserves the integrity of the test environment. The influence zone below the pile tip should be 3.5 to 5.5 times the pile tip diameter [29]. The zone of influence around the pile is 0.9 to 1.4 times the length of the pile [30]. Therefore, for an embedded depth of 365 mm, the zone of influence around the pile is expected to range from 328 to 511 mm. In this study, the clearance around the pile was 15 times the tip diameter. The clearance below the pile tip was 545 mm (8 times the pile tip diameter).
Figure 1.
Experimental test setup (units in mm).
2.3. Model Screw Piles with Toe-Wing (Tsubasa Pile) & Spiral Screw Piles
The specifications of the small-scale spiral screw and toe-wing piles used in this study are provided in Table 2. Both types of piles were closed-ended, with similar pile tip areas, as illustrated in Figure 2. The spiral screw pile consisted of a central shaft with a single helix mounted near the tip. Likewise, the toe-wing screw piles were equipped with smooth, semicircular steel plates (toe-wings) attached to the central shaft, simulating actual piles. These toe-wing plates had diameters of 3 times the diameter of the steel shaft.
3. Results And Discussions
3.1. Scenario 1 - Fixed Helix/Toe-Wing Position with Increasing Pile Tip Depth From 0 to 90 mm
The installation of screw piles requires not only the application of torque but also the use of downward force, known as crowd, which makes installation much easier [31]. An experimental testing program was conducted using two screw pile models with distinct geometries. The study investigated how the shape of the screw element, the properties of the sand, and the depth of installation influenced the crowed force and torque required for installation. The toe-wing and spiral screw piles were installed using a combination of pressing and rotation, applied at the top of the pile head with an automatically controlled system that adjusts both the pushing force and rotation rate. The pressing rate was set to ensure that with each complete rotation, the pile was inserted into the ground by one pitch length of the corresponding helical plates, which was 28 mm/min for the corresponding piles. The rotation rate was fixed at one revolution per minute. Moreover, the embedment depth of the pile tip (Ed) increased from Wp = 0 mm to Wp = 90 mm, as shown in Figure 3(a).
Figures 3(b-d) show the load (P) during the installation of toe-wing and spiral screw piles in bearing layers with relative densities of 55%, 80%, and 90%. Overall, toe-wing screw piles require less installation load to reach the final embedment depth than spiral screw piles. According to a previous study [32], the installation process significantly influences the stress state of the surrounding soil, thereby affecting the overall soil-pile interaction. Moreover, the installation load decreased when the helix moved away from the pile tip (Wp > 0) for the spiral screw pile, whereas the installation load increased when the toe-wing moved away from the pile tip (Wp > 0) for the toe-wing screw pile. The installation load requirements at Wp = 50mm and Wp = 90mm are more or less similar for both types of piles. This means that when the helix/toe-wing moved away from the pile tip, its contribution towards the installation load was identical. The increase in installation load at the final stage is due to increased embedment depth (Ed) for both types of piles. Figure 3(e) shows the relationship between the maximum installation load ratio of the toe-wing (P toe-wing) over the spiral screw pile (P spiral) and the pile tip embedment depth (Ed) over the helix/toe-wing embedment depth (Ew). Empirical equations shown in Figure 3(e) can convert installation load requirements from one pile type to another within the provided range of Ed/Ew, i.e., 1.0 to 1.25.
The installation torque results for spiral and toe-wing piles at relative densities of 55%, 80%, and 90% are presented in Figure 4(a-c). The test results show that at the beginning stage of pile installation, the installation toque increases gradually with a linear trend. As the penetration depth increases, the trend shifts to a nonlinear increase, eventually reaching its maximum value [33]. The installation torque decreased as the helix/toe-wing moved away from the pile tip (Wp > 0) for both types of piles. However, at Wp = 0 (helix/toe-wing at pile tip), less installation torque is needed for the toe-wing screw pile than for the spiral screw pile. Moreover, when the helix/toe-wing position is greater than zero (Wp > 0), the installation torque requirement for the toe-wing screw pile in dense to very dense sand (Dr = 80-90%) is higher than the spiral screw pile. Whereas in loose sand conditions (Dr =55%), the toe-wing screw pile shows lesser torque requirements.
Figure 4(d) shows the relationship between the maximum installation torque ratio of the toe-wing (T toe-wing) over the spiral screw pile (T spiral) and the pile tip embedment depth (Ed) over the helix/toe-wing embedment depth (Ew). Empirical equations shown in Figure 4(d) can convert installation torque requirements from one pile type to another within the provided range of Ed/Ew, i.e., 1.0 to 1.25.
Pile load tests were conducted on spiral and toe-wing screw piles with varying helix/toe-wing positions (Wp) relative to the pile tip embedment depth (Ed), as can be seen in Figure 5(a). the load-settlement behavior for both piles, with bearing layer densities of 55%, 80%, and 90%, can be seen in Figure 5(b-d). The test results demonstrate that the spiral screw piles showed higher load-carrying resistance than the toe-wing screw piles at relative densities of 55%, 80%, and 90%. Moreover, load-carrying resistance increased as the position of the helix/toe-wing increased (Wp > 0), which is due to the increase in pile tip embedment depth (Ed) [34]. At the initial stage of the load-settlement curve, the spiral screw pile showed a stiffer response than the toe-wing screw pile, and this indicates that the soil-helix contact is better than the soil-toe-wing contact at all considered bearing layer relative densities (Dr).
Figure 5(e) shows the relationship between the ultimate pile capacity (pile capacity measured at settlement equals to 10% of helix/toe-wing diameter, Dh) ratio of the toe-wing (Qu toe-wing) over the spiral screw pile (Qu spiral) and the pile tip embedment depth (Ed) over the helix/toe-wing embedment depth (Ew). Empirical equations shown in Figure 5(e) can convert the ultimate pile capacity of one type of pile to another within the provided range of Ed/Ew, i.e., 1.0 to 1.25.
3.2. Scenario 2 - Varying Helix/Toe-Wing Position with Constant Pile Tip Depth
Further experimental tests were conducted to evaluate the effect of helix/toe-wing position, Wp (the distance of the helix from the pile tip), on the ultimate pile capacity of screw piles. The model ground was prepared with a uniform, dense condition, maintaining a relative density of 80%, as illustrated in Figure 6(a). Throughout all the test experiments, the depth of the pile tip remained constant while the helix position (Wp) was varied (0 to 220mm). The experimental test cases considered in this study are given in Table 3. This approach was implemented to investigate the mobilized shear strength contribution of the helix/toe-wing on the ultimate pile capacity of the screw piles. Moreover, to examine the effect of helix/toe-wing position on mobilized shear strength, various ratios of the helix/toe-wing position to helix/toe-wing diameter (Wp/Dh) were considered, ranging from 0 to 3.38. By analyzing different helix/toe-wing positions, the study aimed to determine how these ratios influence overall bearing capacity. This approach allows for a deeper understanding of how shifting the helix/toe-wing away from the pile tip affects the interaction between the pile and the surrounding soil, especially regarding soil confinement and shear mobilization.
The test results, as illustrated in Figure 6(b), showed that overall, spiral screw piles have higher load-carrying resistance than toe-wing screw piles when the helix/toe-wing position is less than 90mm (Wp < 90mm). Moreover, spiral screw pile load-carrying resistance decreased as the helix (Wp > 0) moved away from the pile tip [6], whereas toe-wing screw pile load-carrying resistance increased as the toe-wing moved away from the pile tip (Wp > 0 to 140mm) then decreased. Figure 6(c) shows the relationship between normalized ultimate pile capacity with varying helix/toe-wing positions (normalized by ultimate pile capacity of spiral screw pile at Wp = 0) and the embedment depth to helix/toe-wing depth ratio (Ed/Ew). This relationship indicated that at Ed/Ew = 1.33, both piles showed similar ultimate pile capacity. Empirical equations shown in Figure 6(c) can convert ultimate pile capacity from one pile type to another with varying Ed/Ew ratio (considered in this study) at a relative density of 80%.
Figure 6(d) shows the relationship between normalized ultimate pile capacity with varying helix/toe-wing positions (normalized by respective ultimate pile capacity at Wp = 0) and the helix/toe-wing position to helix diameter ratio (Wp/Dh). This relationship indicated that the ultimate pile capacity of the spiral screw pile decreased as the helix moved away from the pile tip due to the decrease in helix contribution towards bearing response. This contribution was drastically reduced when the Wp/Dh ratio was greater than 1.38, indicating that the helix and central shaft pile tip act independently (similar to [6]). Whereas, for the toe-wing screw pile, the ultimate pile capacity increased when the toe-wing moved away from the pile tip up to Wp/Dh = 2.15. This increase is due to the contribution of the toe-wing as it moves away from the pile tip towards the bearing response, which is because the toe-wing loosens the ground more when it is close to the tip. As it moves away, it less loosens the ground, increasing pile capacity. However, when Wp/Dh > 2.15, the pile capacity drastically decreased because the toe-wing and pile tip act independently rather than as a group.
4. Conclusions
This research makes a significant contribution to the understanding of the distinct differences between toe-wing and spiral screw piles. This topic has not been extensively explored in previous studies. It provides valuable insights into the effects of embedment depth ratio on the ultimate pile capacity of both screw piles. Additionally, it offers a deeper understanding of how the position of the helix influences both the end-bearing capacity and the installation effort. These findings represent a critical advancement in the field of deep foundations, particularly in optimizing the design and installation of screw piles. Based on the analyses conducted in this paper, the following conclusions can be drawn:
- In the case of fixed helix/toe-wing position with increasing pile tip embedment (Scenario 1), the toe-wing screw pile showed lesser installation load requirements than the spiral screw pile. As the helix distance from the pile tip increased (Wp, 0 to 90mm), the spiral screw pile installation requirements decreased, whereas, for the toe-wing screw pile, the behavior was reversed, i.e., increased. The installation torque decreased as the helix/toe-wing moved away from the pile tip (Wp > 0) for both types of piles. However, at Wp = 0 (helix/toe-wing at pile tip), less installation torque is needed for the toe-wing screw pile than for the spiral screw pile. Moreover, when the helix/toe-wing position is greater than zero (Wp > 0), the installation torque requirement for the toe-wing screw pile in dense to very dense sand (Dr = 80-90%) is higher than the spiral screw pile. Whereas in loose sand conditions (Dr =55%), the toe-wing screw pile shows lesser torque requirements. Empirical equations presented in Figure 3(e) for installation load requirements and Figure 4(d) for installation torque requirements can be used to convert the installation load and torque from one type of pile to another within the considered range of the Ed/Ew ratio (1.0 to 1.25).
- In Scenario 1, the spiral screw piles showed higher load-carrying resistance than the toe-wing screw piles at relative densities of 55%, 80%, and 90%. Moreover, load-carrying resistance increased as the position of the helix/toe-wing increased (Wp > 0), which is due to the increase in pile tip embedment depth (Ed). At the initial stage of the load-settlement curve, the spiral screw pile showed a stiffer response than the toe-wing screw pile, and this indicates that the soil-helix contact is better than the soil-toe-wing contact at all considered bearing layer relative densities (Dr). Empirical equations shown in Figure 5(e) can convert the ultimate pile capacity of one type of pile to another within the provided range of Ed/Ew, i.e., 1.0 to 1.25.
- In the case of fixed pile tip depth (Ed) with varying helix/toe-wing position (Scenario 2), spiral screw piles have higher load-carrying resistance than toe-wing screw piles when the helix/toe-wing position is less than 90mm (Wp < 90mm). Both piles showed a similar ultimate pile capacity at Ed/Ew = 1.33. Moreover, the ultimate pile capacity of the spiral screw pile decreased as the helix moved away from the pile tip due to the decrease in helix contribution towards bearing response. This contribution drastically reduced when the Wp/Dh ratio was greater than 1.38, indicating that the helix and central shaft pile tip act independently. Whereas, for the toe-wing screw pile, the ultimate pile capacity increased when the toe-wing moved away from the pile tip up to Wp/Dh = 2.15. This increase is due to less contribution of the toe-wing as it moves away from the pile tip towards the bearing response, which is because the toe-wing loosens the ground more when it is close to the tip. As it moves away, it causes less ground loosening, increasing pile capacity. However, when Wp/Dh > 2.15, the pile capacity drastically decreased because the toe-wing and pile tip act independently rather than as a group. Empirical equations presented in Figure 6(c) can convert ultimate pile capacity from one pile type to another with varying Ed/Ew ratio (considered in this study) at a relative density of 80%.
Author Contributions
Conceptualization, A.W.S, T.U. and A.A.M.; methodology, A.W.S, and T.U.; validation, A.W.S, T.U. A.A.M, and R.K.; formal analysis, T.U and A.A.M.; investigation, A.W.S.; resources, A.W.S.; data curation, A.W.S.T.U and A.A.M.; writing—original draft preparation, A.W.S and A.A.M.; writing—review and editing, T.U and A.A.M.; visualization, A.W.S.; supervision, T.U.; project administration, T.U. All authors have read and agreed to the published version of the manuscript.
Funding
This research received no external funding.
Institutional Review Board Statement
Not applicable.
Informed Consent Statement
Not applicable.
Data Availability Statement
The data presented in this study are available upon request from the corresponding author.
Acknowledgments
The corresponding author is thankful to the (UEDA) Memorial Foundation and Saitama University for providing the opportunity to conduct this research.
Conflicts of Interest
The authors declare no conflict of interest.
References
- Saleem, M.A.; Malik, A.A.; Kuwano, J. End Shape and Rotation Effect on Steel Pipe Pile Installation effort and Bearing Resistance. Geomechanics and Engineering, 2020, 23(6), 523-533. [CrossRef]
- Wada, M.; K, Tokimatsu.; S, Maruyama.; and M, Sawaishi. Effects of cyclic vertical loading on bearing and pullout capacities of piles with continuous helix wings. Soils Found, 2017, 57 (1), 141–153. [CrossRef]
- Nagata, M.; and H. Hirata. Study on the uplift resistance of screwed steel pile. Nippon Steel Technical Rep. No. 92, Tokyo, Nippon Steel and Sumimoto Metal, 2005, 73–78.
- Tsuchiya, T.; Kohsaka, M. Statistical study on the vertical bearing capacity of screw piles. AIJ J. Technol. Design 21 (49), 2015,991–994 (in Japanese). [CrossRef]
- Tsuchiya, T.; Nagai, H.; Shimo, N. Statistical study on settlement characteristics at the toe of screw piles. AIJ J. Technol. Design 22 (52), 2016, 915–918 (in Japanese). [CrossRef]
- Ho, H.M.; Malik, A.A.; Kuwano, J.; Brasile, S.; Tran, T.V.; Mazhar, M.A. Experimental and Numerical Study on Pressure Distribution under Screw and Strainght Pile in Dense Sand. International Journal of Geomechanics, 2022, 22(9), 04022139. [CrossRef]
- Zuo, H.; Jin, N.; Xu CY. Experiment on the vertical bearing capacity of screw grout pile in a cohesive area. J Shenyang Jianzhu Uni (Nat Sci),32(2):2016, 225–31.
- Peng, Ding.; Yang,Liu.; Cheng,Shi.; Fanguang,Meng.; Wei, Li.; Zhiyun, Deng.; and Xu, Chang.Study on Bearing Mecha-nism of Steel Screw Pile. Buildings 2024, 14, 3376. [CrossRef]
- Yifeng, Lin.; Jiandong, Xiao.; Conghuan, Le.; Puyang, Zhang.; Qingshan, Chen.; and Hongyan, Ding. Bearing Characteristics of Helical Pile Foundations for Offshore Wind Turbines in Sandy Soil. J. Mar. Sci. Eng.mdpi. 2022, 10, 889. [CrossRef]
- Malik, A.A.; Jiro, Kuwano. Single Helix Screw Pile Behavior Under Compressive Loading/Unloading Cycles in Dense Sand. Geotech Geol Eng, (2020), 38:5565–5575. Volume 38, pages 5565-5575. [CrossRef]
- Yang,Z.X.; Jardine,R.J,.; B,T, Zhu.; and S, Rimoy. Stresses Developed around Displacement Piles Penetration in Sand, Journal of Geotechnical and Geoenvironmental Engineering, 2014, no. 3, art, 140.
- Ghaly, A.; and A, Hanna. Experimental and Theoretical Studies on Installation Torque of Screw Anchors. Canadian Geotechnical Journal, 1991, Vol. 28, Issue 3, 353–364. [CrossRef]
- Spagnoli, G.; C M, Mendez Solarte.; Cde, Hollanda Cavalcanti Tsuha.; and P, Oreste. Parametric Analysis for the Estimation of the Installation Power for Large Helical Piles in Dry Cohesionless Soils. International Journal of Geotechnical Engineering, 2018, Vol.144, Issue 6, 1–11. (in press).
- R,J, Jardine.; B,T, Zhu.; P, Foray, Z,X, Yang.Measurement of stresses around closed-ended displacement piles in sand, Géotechnique, 2013, vol. 63, Issue 1, 1–17.
- J, Dijkstra.; W, Broere.; O, M, Heeres. Numerical simulation of pile installation, Computers and Geotechnics, 2011, vol. 38, Issue 5, 612–622. [CrossRef]
- T,C, Siegel.; W,M, NeSmith.; W,M, NeSmith.; P,E, Cargill.Ground improvement resulting from the installation of drilled displacement piles, in Proceedings of the DFI’s 32nd Annual Conference Deep Foundations. Colorado Springs, USA, 2007, 129–138.
- Malik, A.A.; Ahmed, S.I.; Ali, U.; Shah, S.K.H.; Kuwano, J. Advancement Ratio Effect on Screw Pile Performance in the Bearing Layer. Soil and Foundations, 2024, 64(6), 101537. [CrossRef]
- Malik, A.A.; Ahmed, S.I.; Kuwano, J.; Maejima, T. Effect of Change in Penetration to Rotation Rate on Screw Pile Performance in Loose Sand. In: Hazarika, H., Haigh, S.K., Chaudhary, B., Murai, M., Manandhar, S. (eds) Climate Change Adaptation from Geotechnical Perspectives. CREST 2023, 2023. Lecture Notes in Civil Engineering, 447, Springer, Singapore. [CrossRef]
- Qingxu,Zhao.; Yuxing,Wang.; Yanqin, Tang.; Guofeng, Ren.; Zhiguo, Qiu.; Wenhui,Luo.; and Zilong, Y. Numerical Analysis of the Installation Process of Screw Piles Based on the FEM-SPH Coupling Method.College of Engineering, South China Agricultural University, Guangzhou 510642, China. Applied Sciences MDPI, Volume 12, Issue 17, Appl. Sci. 2022, 12(17), 8508. [CrossRef]
- E.I. Robinsky.; C.F. Morrison. Sand Displacement and Compaction around Model Friction Piles, Canadian Geotechnical Journal, vol. 1, Issue 2, 1964, 81–93. [CrossRef]
- G.G. Meyerhof. Compaction of Sands and Bearing Capacity of Piles, Journal of the Soil Mechanics and Foundations Division, 1959, vol. 85, Issue 6, 29-9.
- C. Szechy. The Effects of Vibration and Driving Upon the Voids in Granular Soil Surrounding a Pile, in Soil Mechanics and Foundation Engineering, vol. 2. 1961, 61–164.
- Tsutomu, TSUCHIYA.; Mai, KOHSAKA. Statistical Study on Vertical Bearing Capacity of Screw Piles. AIJ J. Technol. Des., Vol. 21, Issue 49, Oct, 2015, 991-994.
- Kawai, M.; Ichikawa, K..; and Kono, K. Development of New Type of Screwed Pile with Large Bearing Capacity and Ecological Driving Method Tusbas PileTM, In: Tran-Nguyen H.H., Wong H, Ragueneau F., Ha-Minh C. (eds), Proceedings of the 4th Congres International de Geotechnique – Ouvrages – Structures, CIGOS217, Lecture Notes in Civil Engineering, Vol. 8, Springer, 2018,411-425.
- Garnier, J.; Gaudin, C.; Springman, S, Cullingan,; SM., Goodings, D..; Konig, D.; Kutter, B.; Phillips, R.; Randolph, MF.; and Thorel,L. Catalogue scaling laws and similitude questions in geotechnical centrifuge modeling, Int J Phys Model Geotech, Vol. 3,2007, 1–24.
- Rakotonindriana, MHJ.; Kouby, AL.; Buttigieg, S.; Derkx, F.; Thorel, L.; and Garnier, J. Design of an instrumented model pile for axial cyclic loading. In: Laue J, Seward L (eds) Physical modeling in Geotechnics Springman. Taylor & Francis Group, London, 2010, 991–996.
- Kishida, H. Stress Distribution of Model Piles in Sand. Soils and Foundations, Vol. 4, Issue 1, 1963, 1-23. [CrossRef]
- Robinsky, EI.; Morrison, CF. Sand displacement and compaction around model friction piles. Can Geotech J, (1964),1(2):81–93. [CrossRef]
- Yu, F.; Yang, J. Bearing capacity of open-ended steel pipe piles in sand. J Geotech Geoenviron Eng, (2012), 138(9):1116–1128.
- Randloph, MF.; Worth. CF Analysis of deformation of vertically loaded piles. J Geotech Eng Div,(1978), 104(12):1465–1488.
- Zhang, D.J.Y.; Chalaturnyk, R.; Robertson, P.K.; Sego, D.C.; Cyre, G. Screw anchor test program (Part I & II): instrumentation, site characterization and installation. In: 1998, Proceedings of the 51st Canadian Geotechnical Conference. Edmonton.
- Nasr, M.H. Performance-based design for helical piles. In: Contemporary Topics in Deep Foundations. American Society of Civil Engineers,2009, USA, 496–503.
- Qingxu, Zhao.; Kun, Hu.; Yuxing, Wang.; Yanqin, Tang.; Guofeng, Ren.Analysis on torque and pile--soil interaction of anti--flood screw pile during the installation process.Arabian Journal of Geosciences, Springer,2022, Volume 15, article number 1018.
- Venkatesan, Vignesh.; and Muthukumar, Mayakrishnan.Design parameters and behavior of helical piles in cohesive soils—A review,Arabian Journal of Geosciences,Springer, 2020,Volume 13, article number 1194.
Figure 2.
Model toe-wing and spiral screw piles with varying toe-wing positions from the pile tip.

Figure 3.
Installation load of the spiral screw and toe-wing piles at various positions of helix/toe-wing, Wp (a) Model steel container and screw piles, units in mm (b) at relative density, Dr = 90% (b) at relative density, Dr = 80% (c) at relative density, Dr = 55% (d) Relationship between embedment depth ratio and P (Toe-Wing) / P (Spiral) at relative densities of 90%, 80%, and 55%.
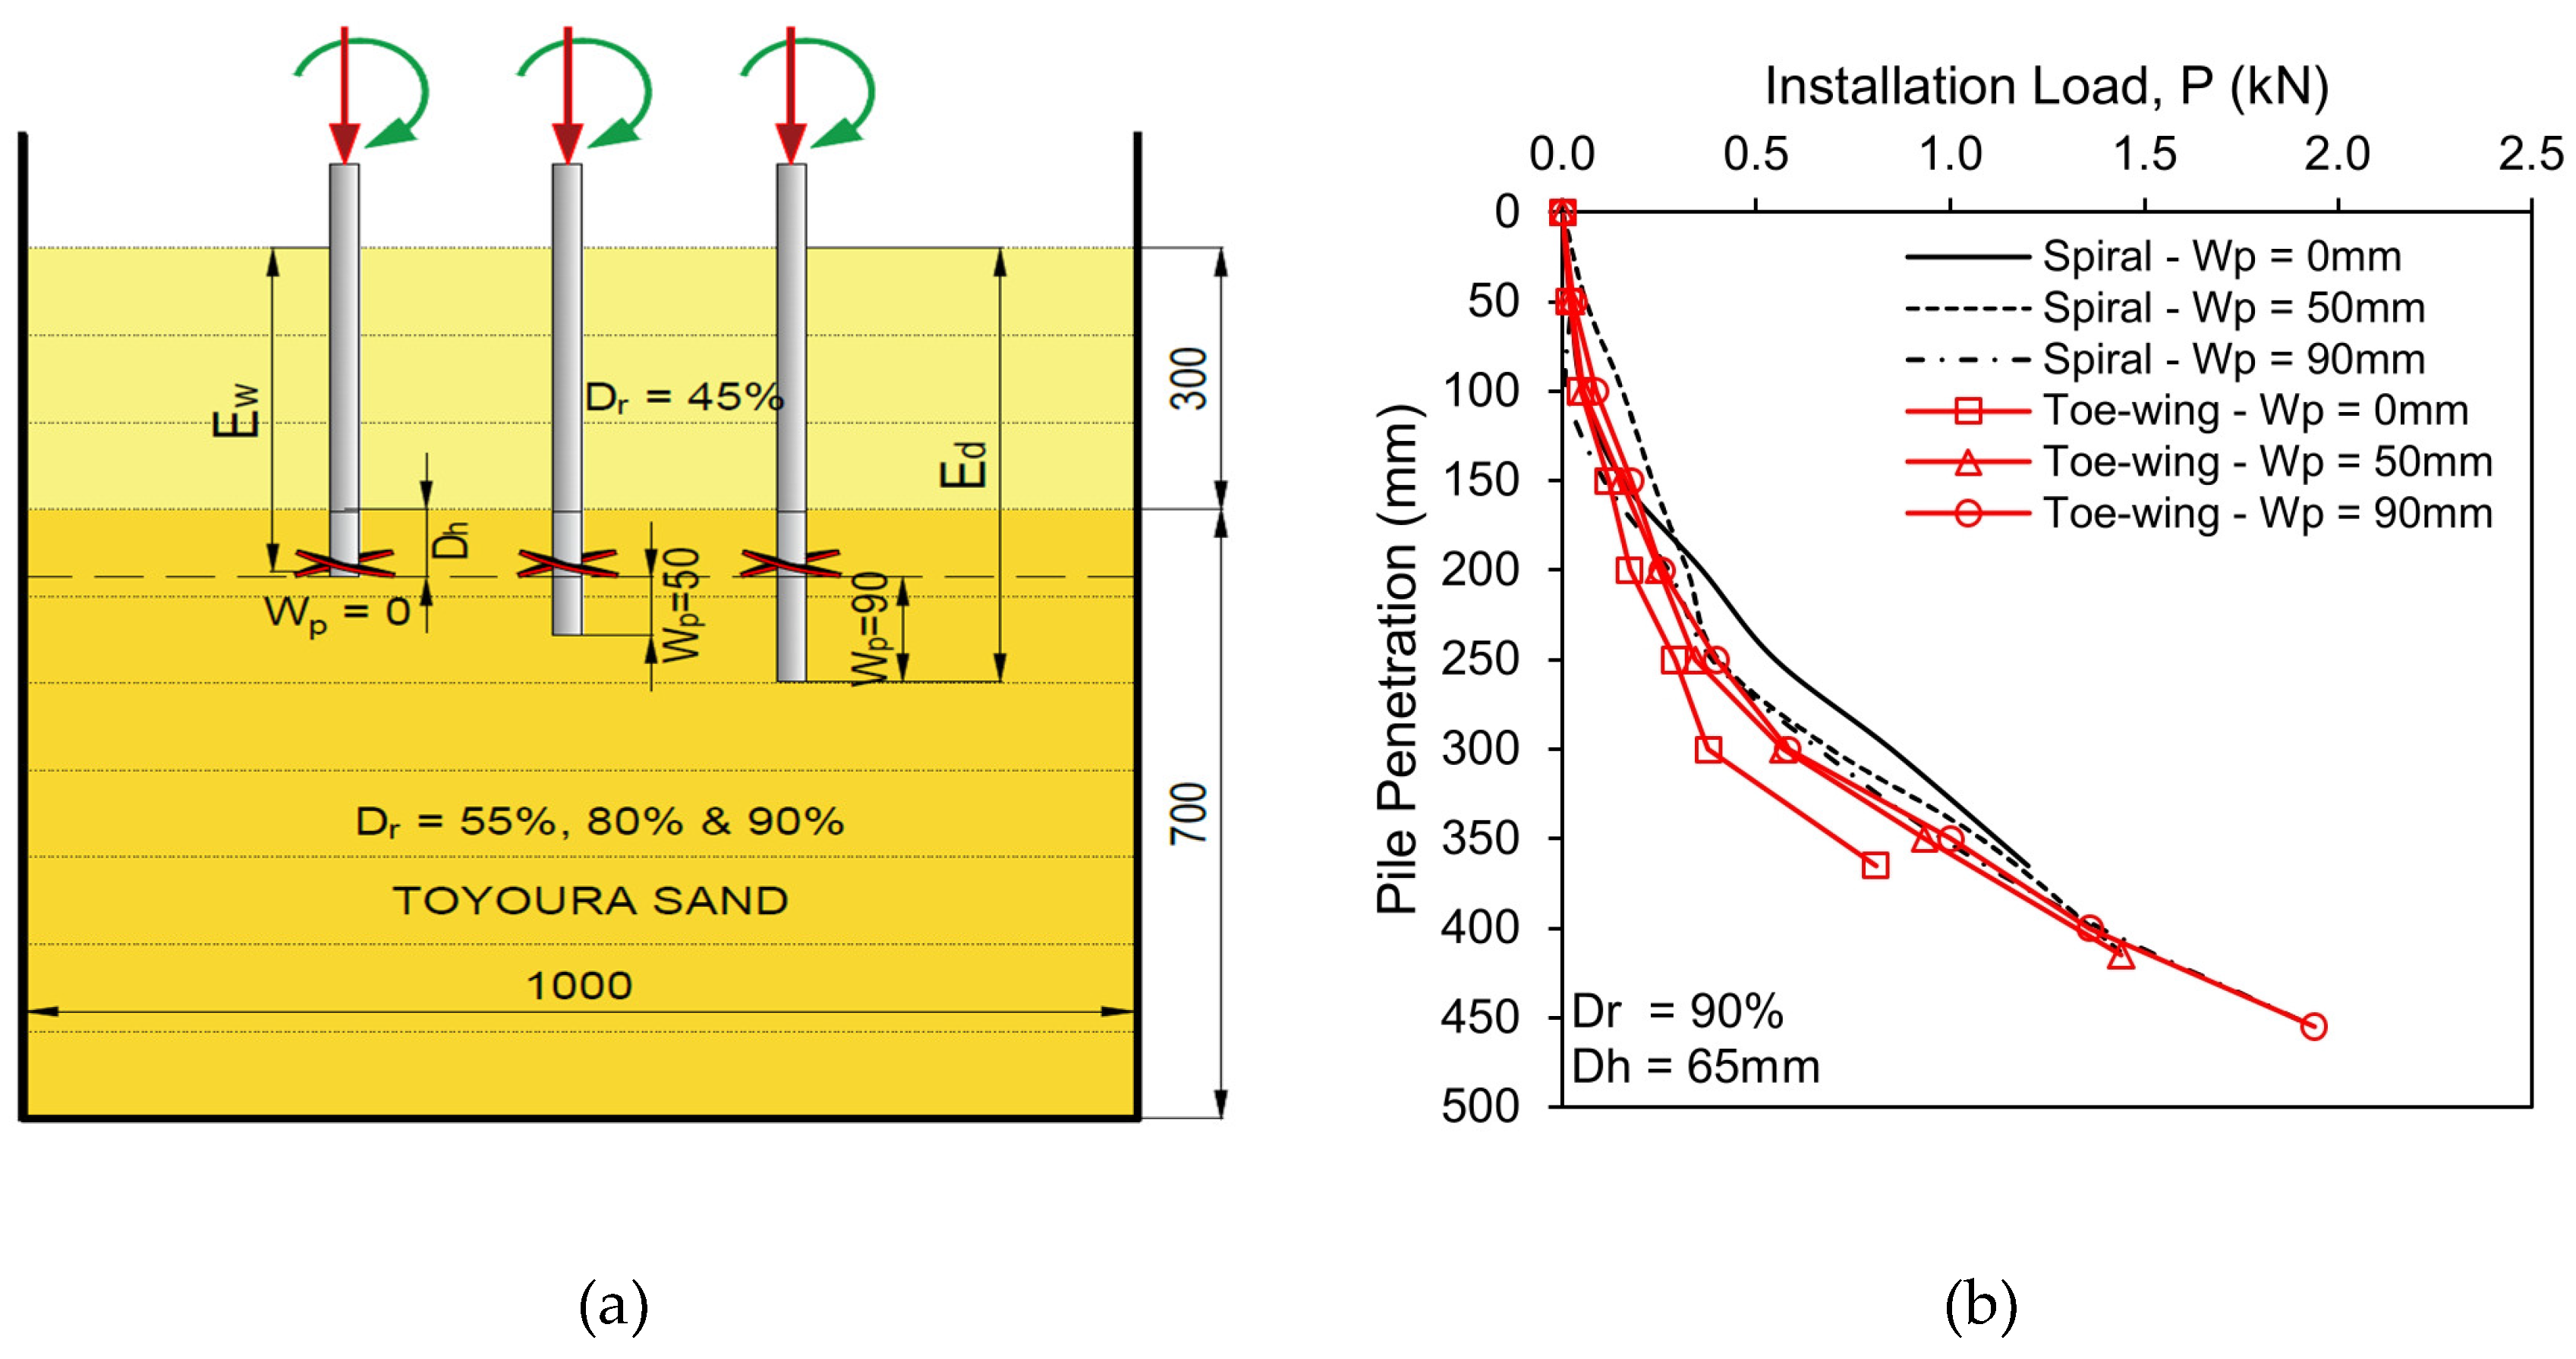
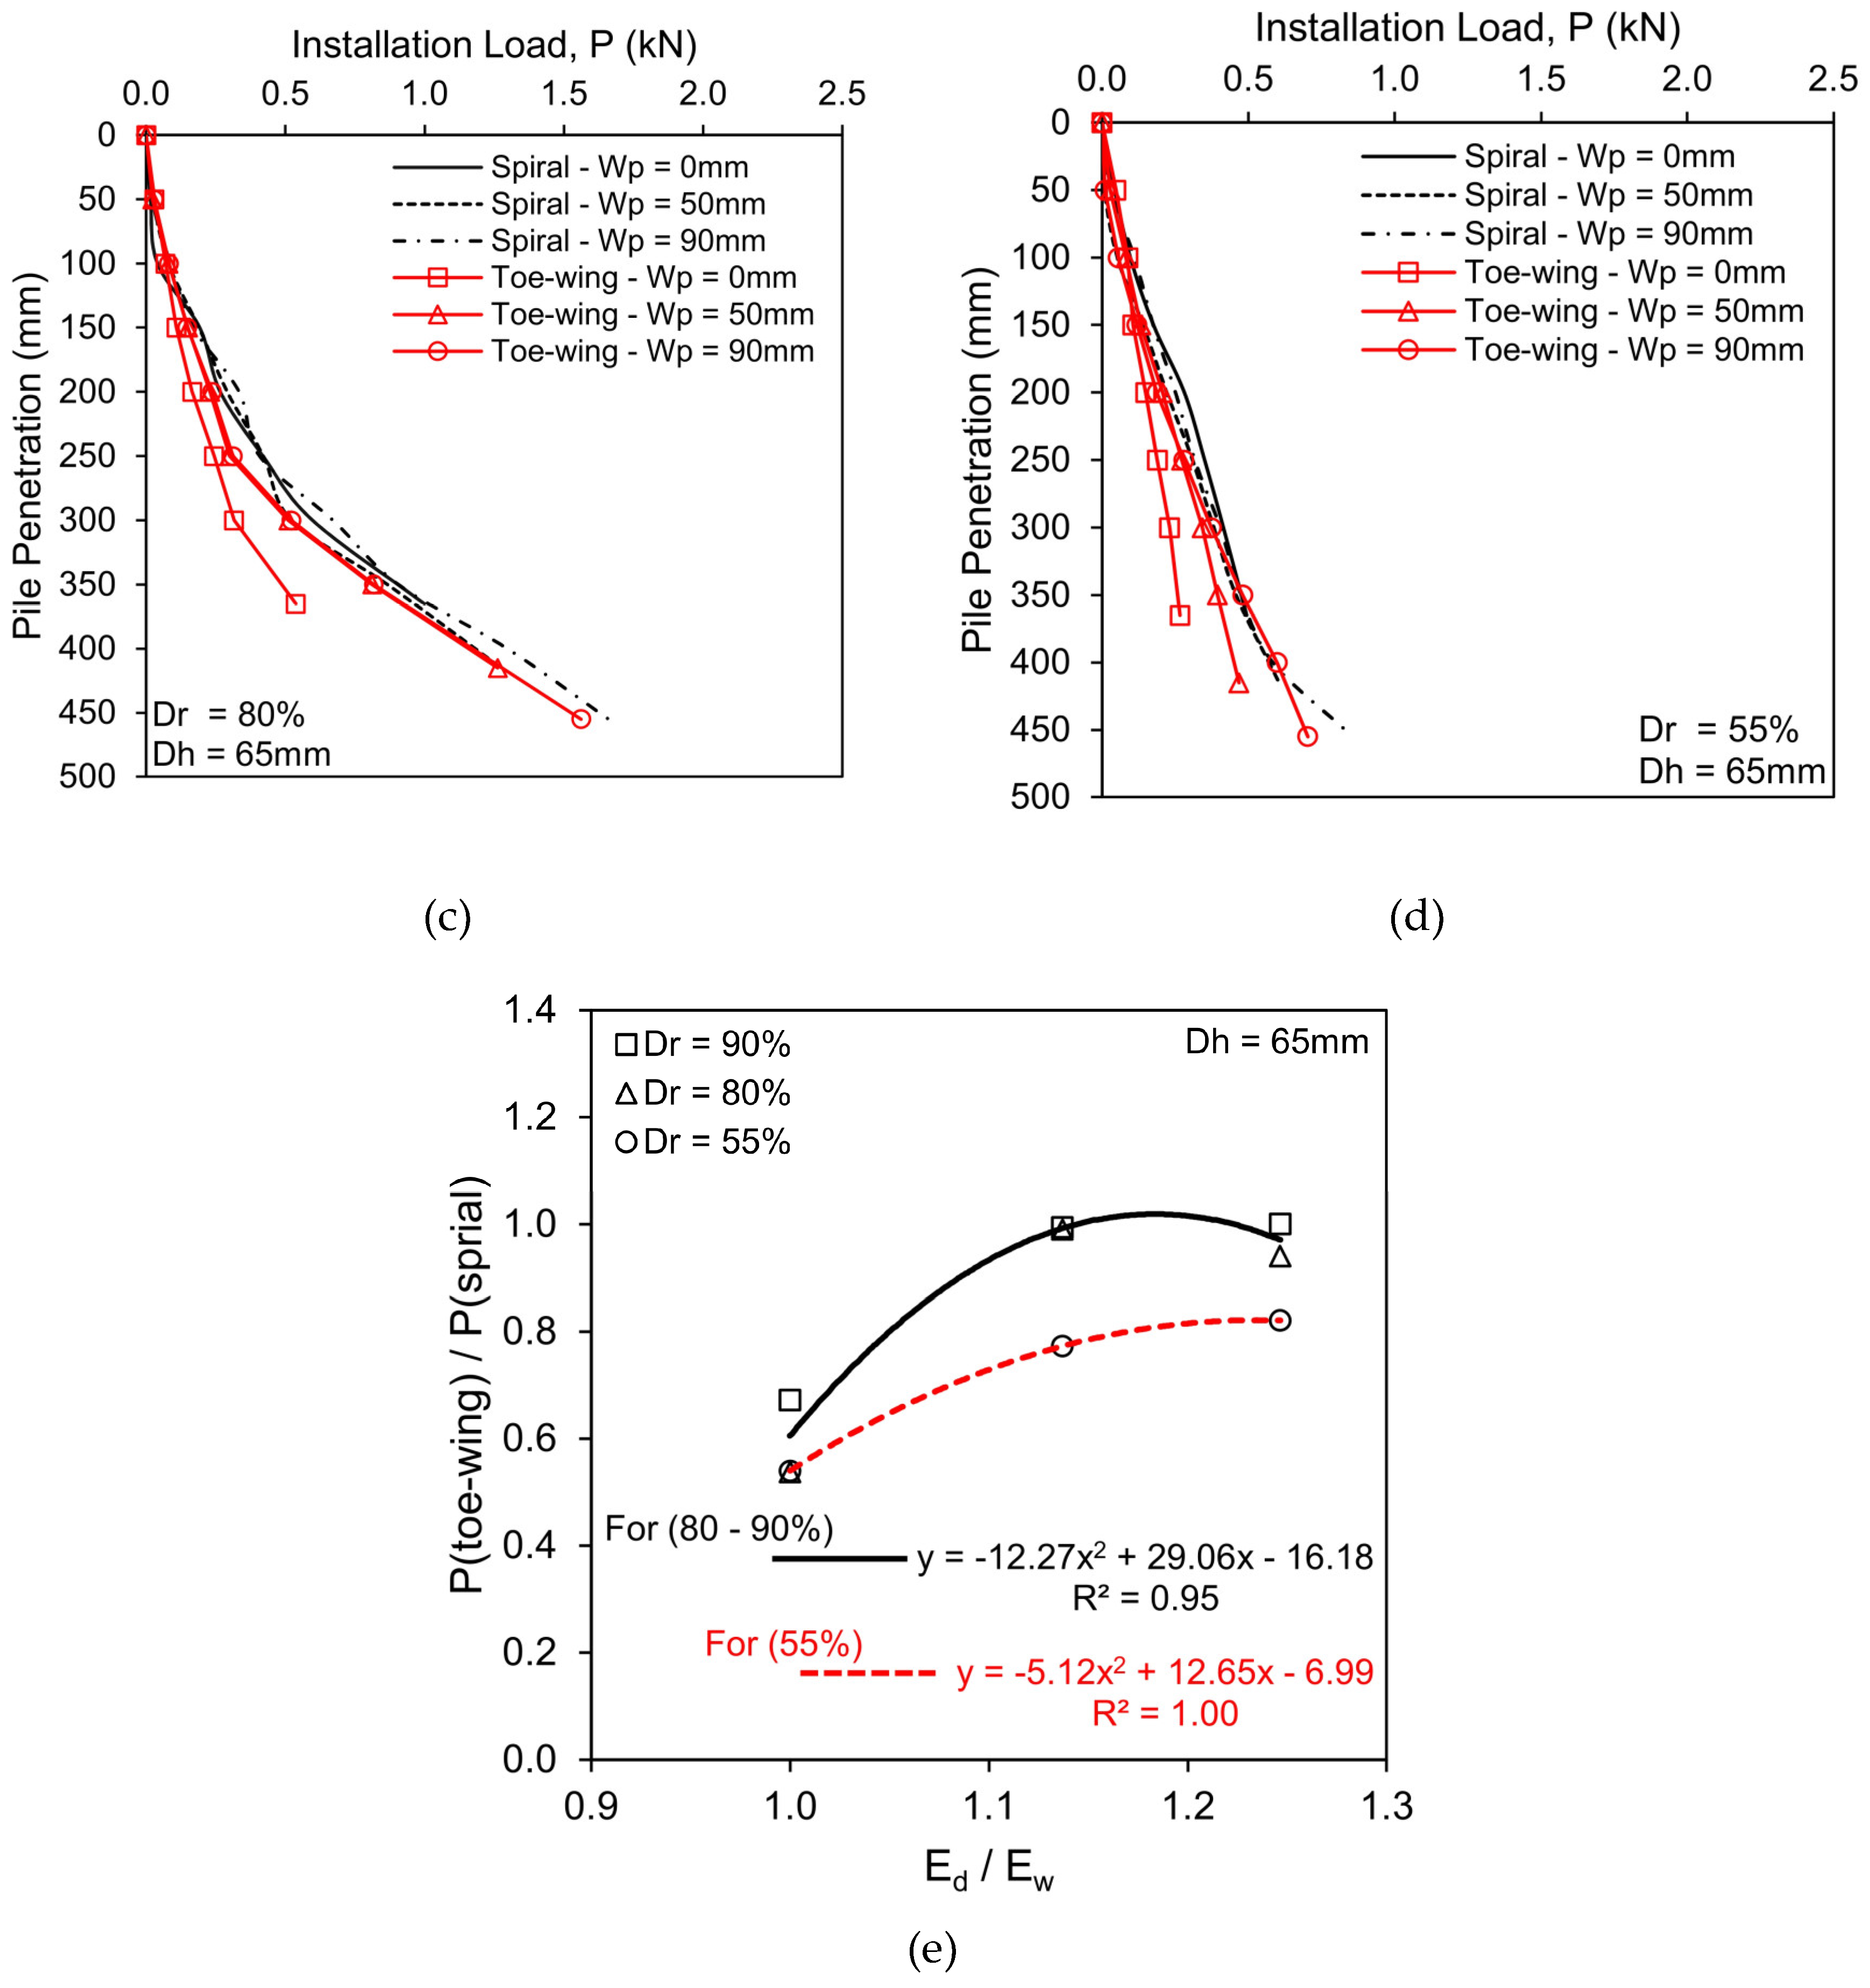
Figure 4.
Installation torque of the spiral and toe-wing screw piles at various positions of helix/toe-wing, Wp (a) Model steel container and screw piles, units in mm (b) at relative density, Dr = 90% (b) at relative density, Dr = 80% (c) at relative density, Dr = 55% (d) Embedment depth ratio versus ratio of installation torque for spiral and toe-wing screw piles at relative densities of 55%, 80%, and 90%.
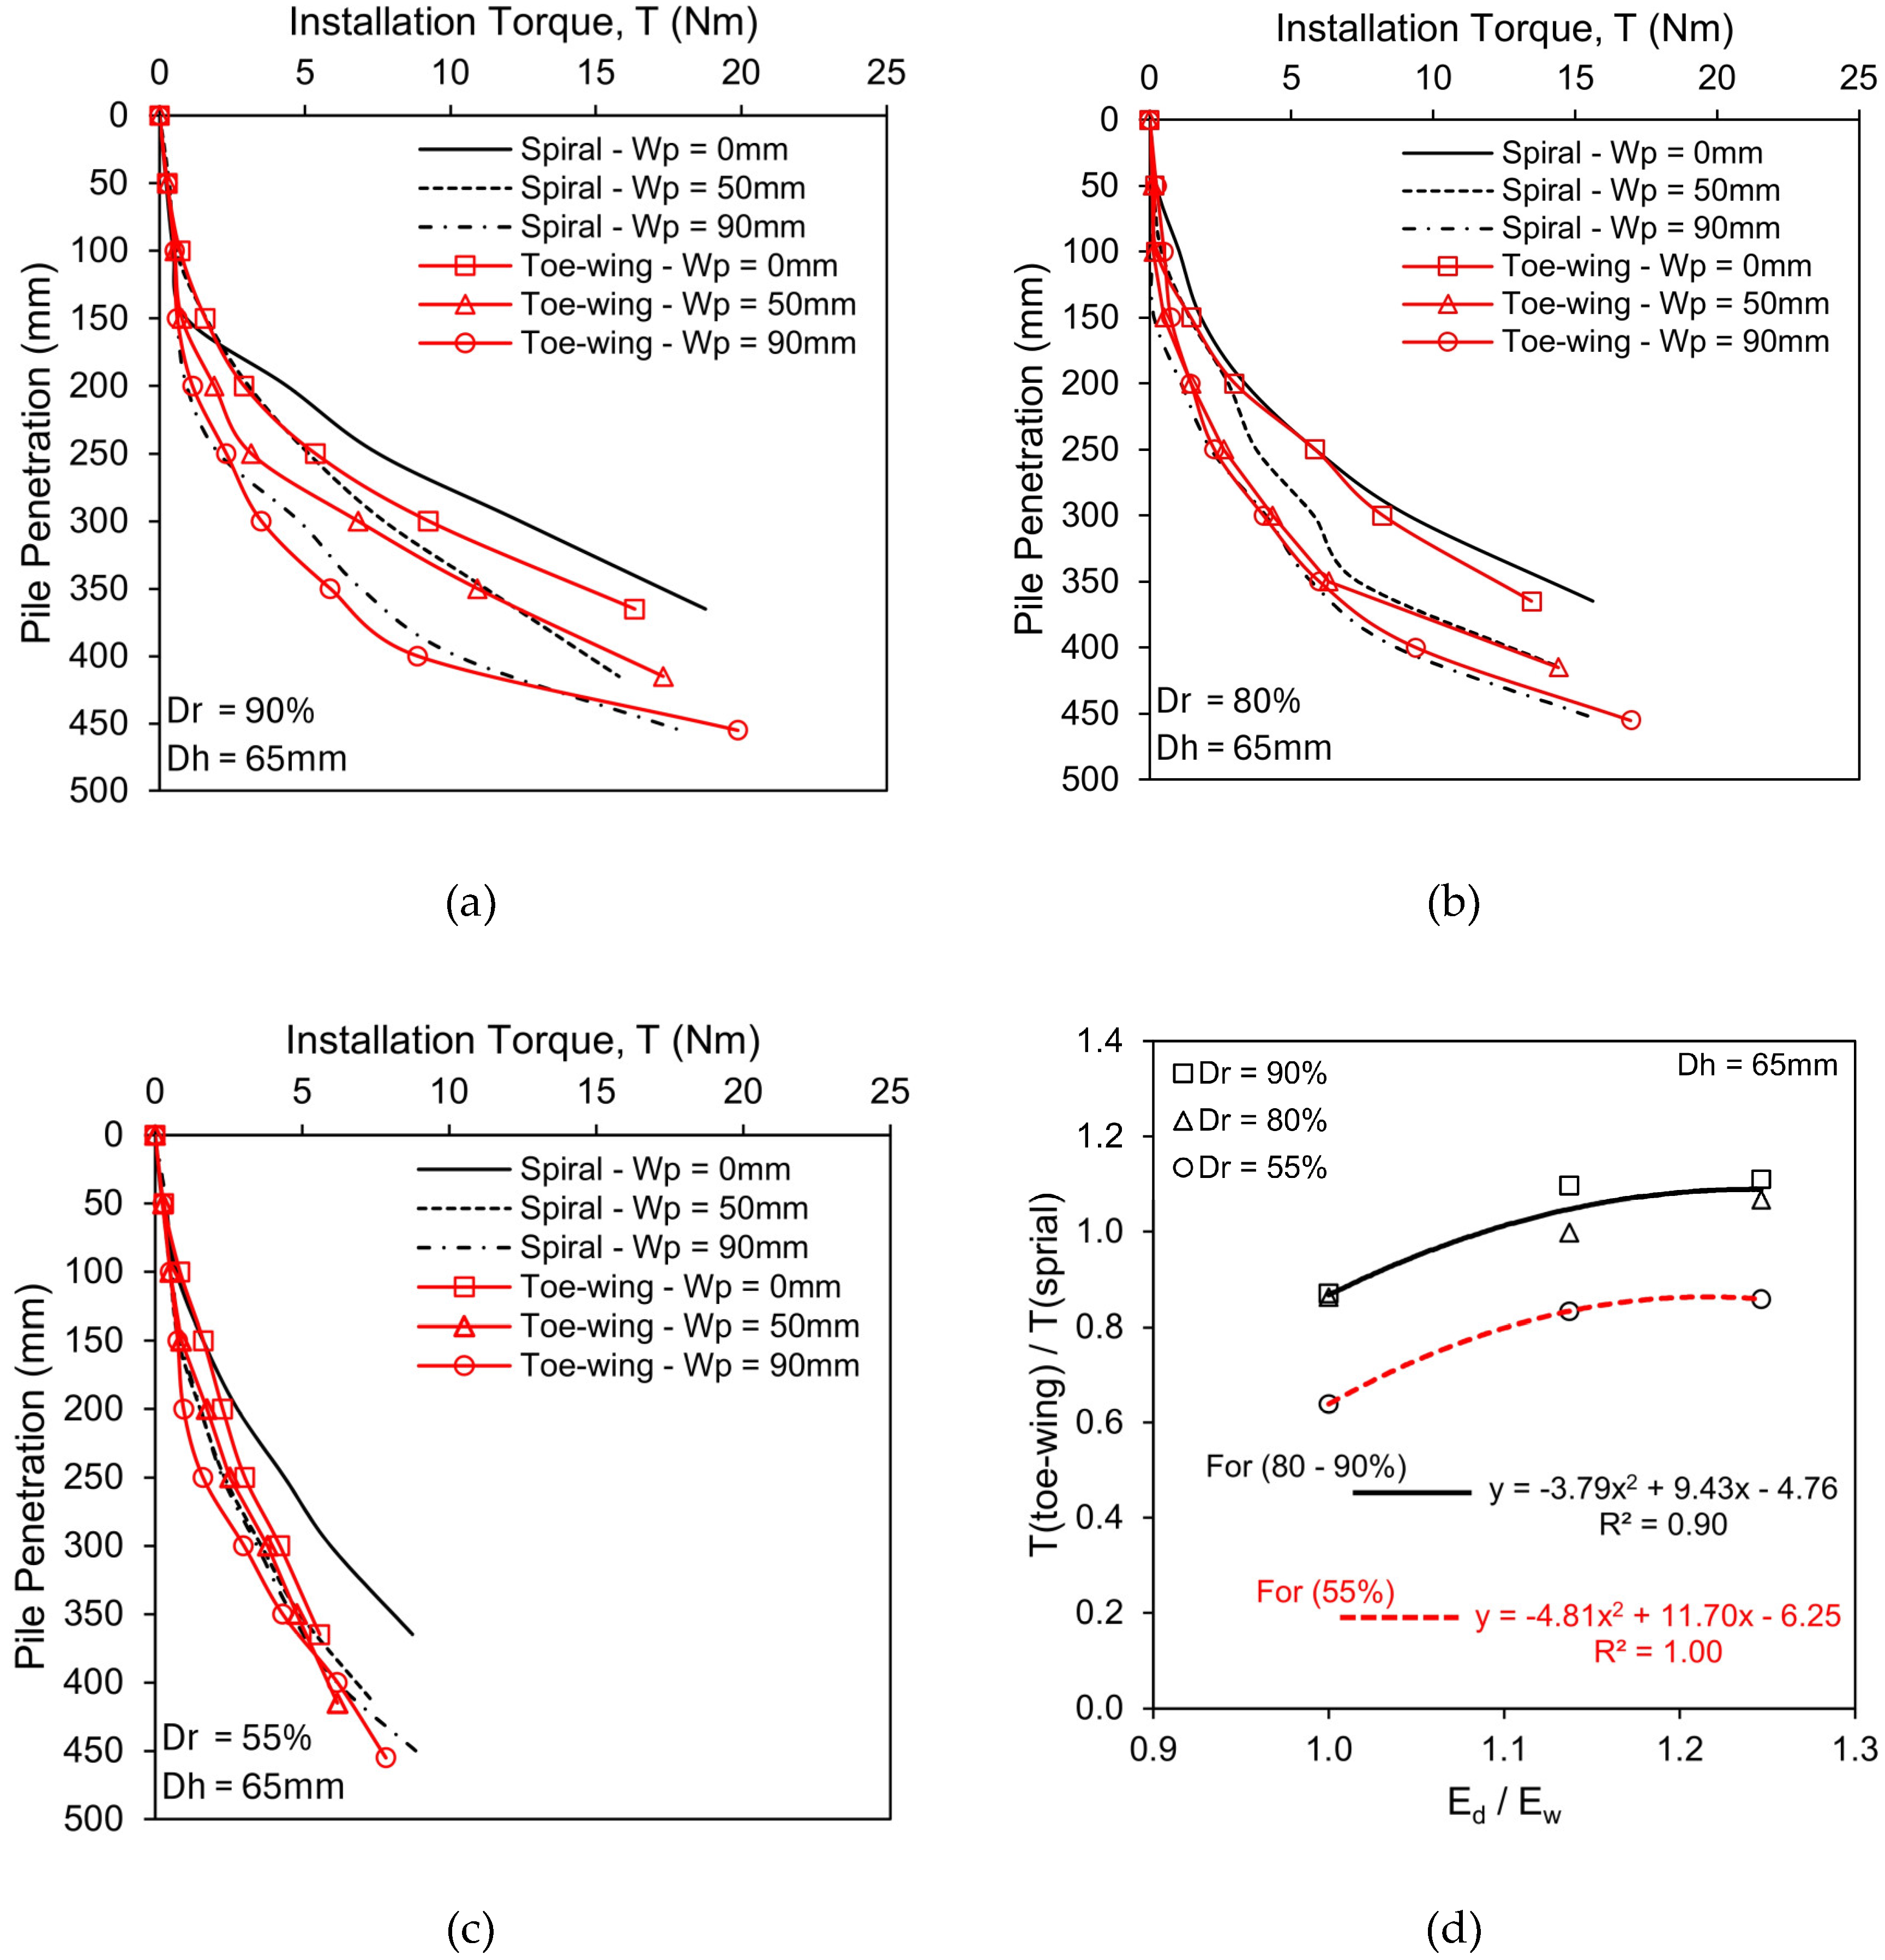
Figure 5.
The load-settlement response for spiral and toe-wing piles with varying wing plate positions (Wp) is presented for different relative densities (a) Schematic illustration of testing setup (b) at a relative density of 90% (c) at a relative density of 80% (d) at a relative density of 55% (e) Embedment depth ratio against the ratio ultimate pile capacity at various densities.
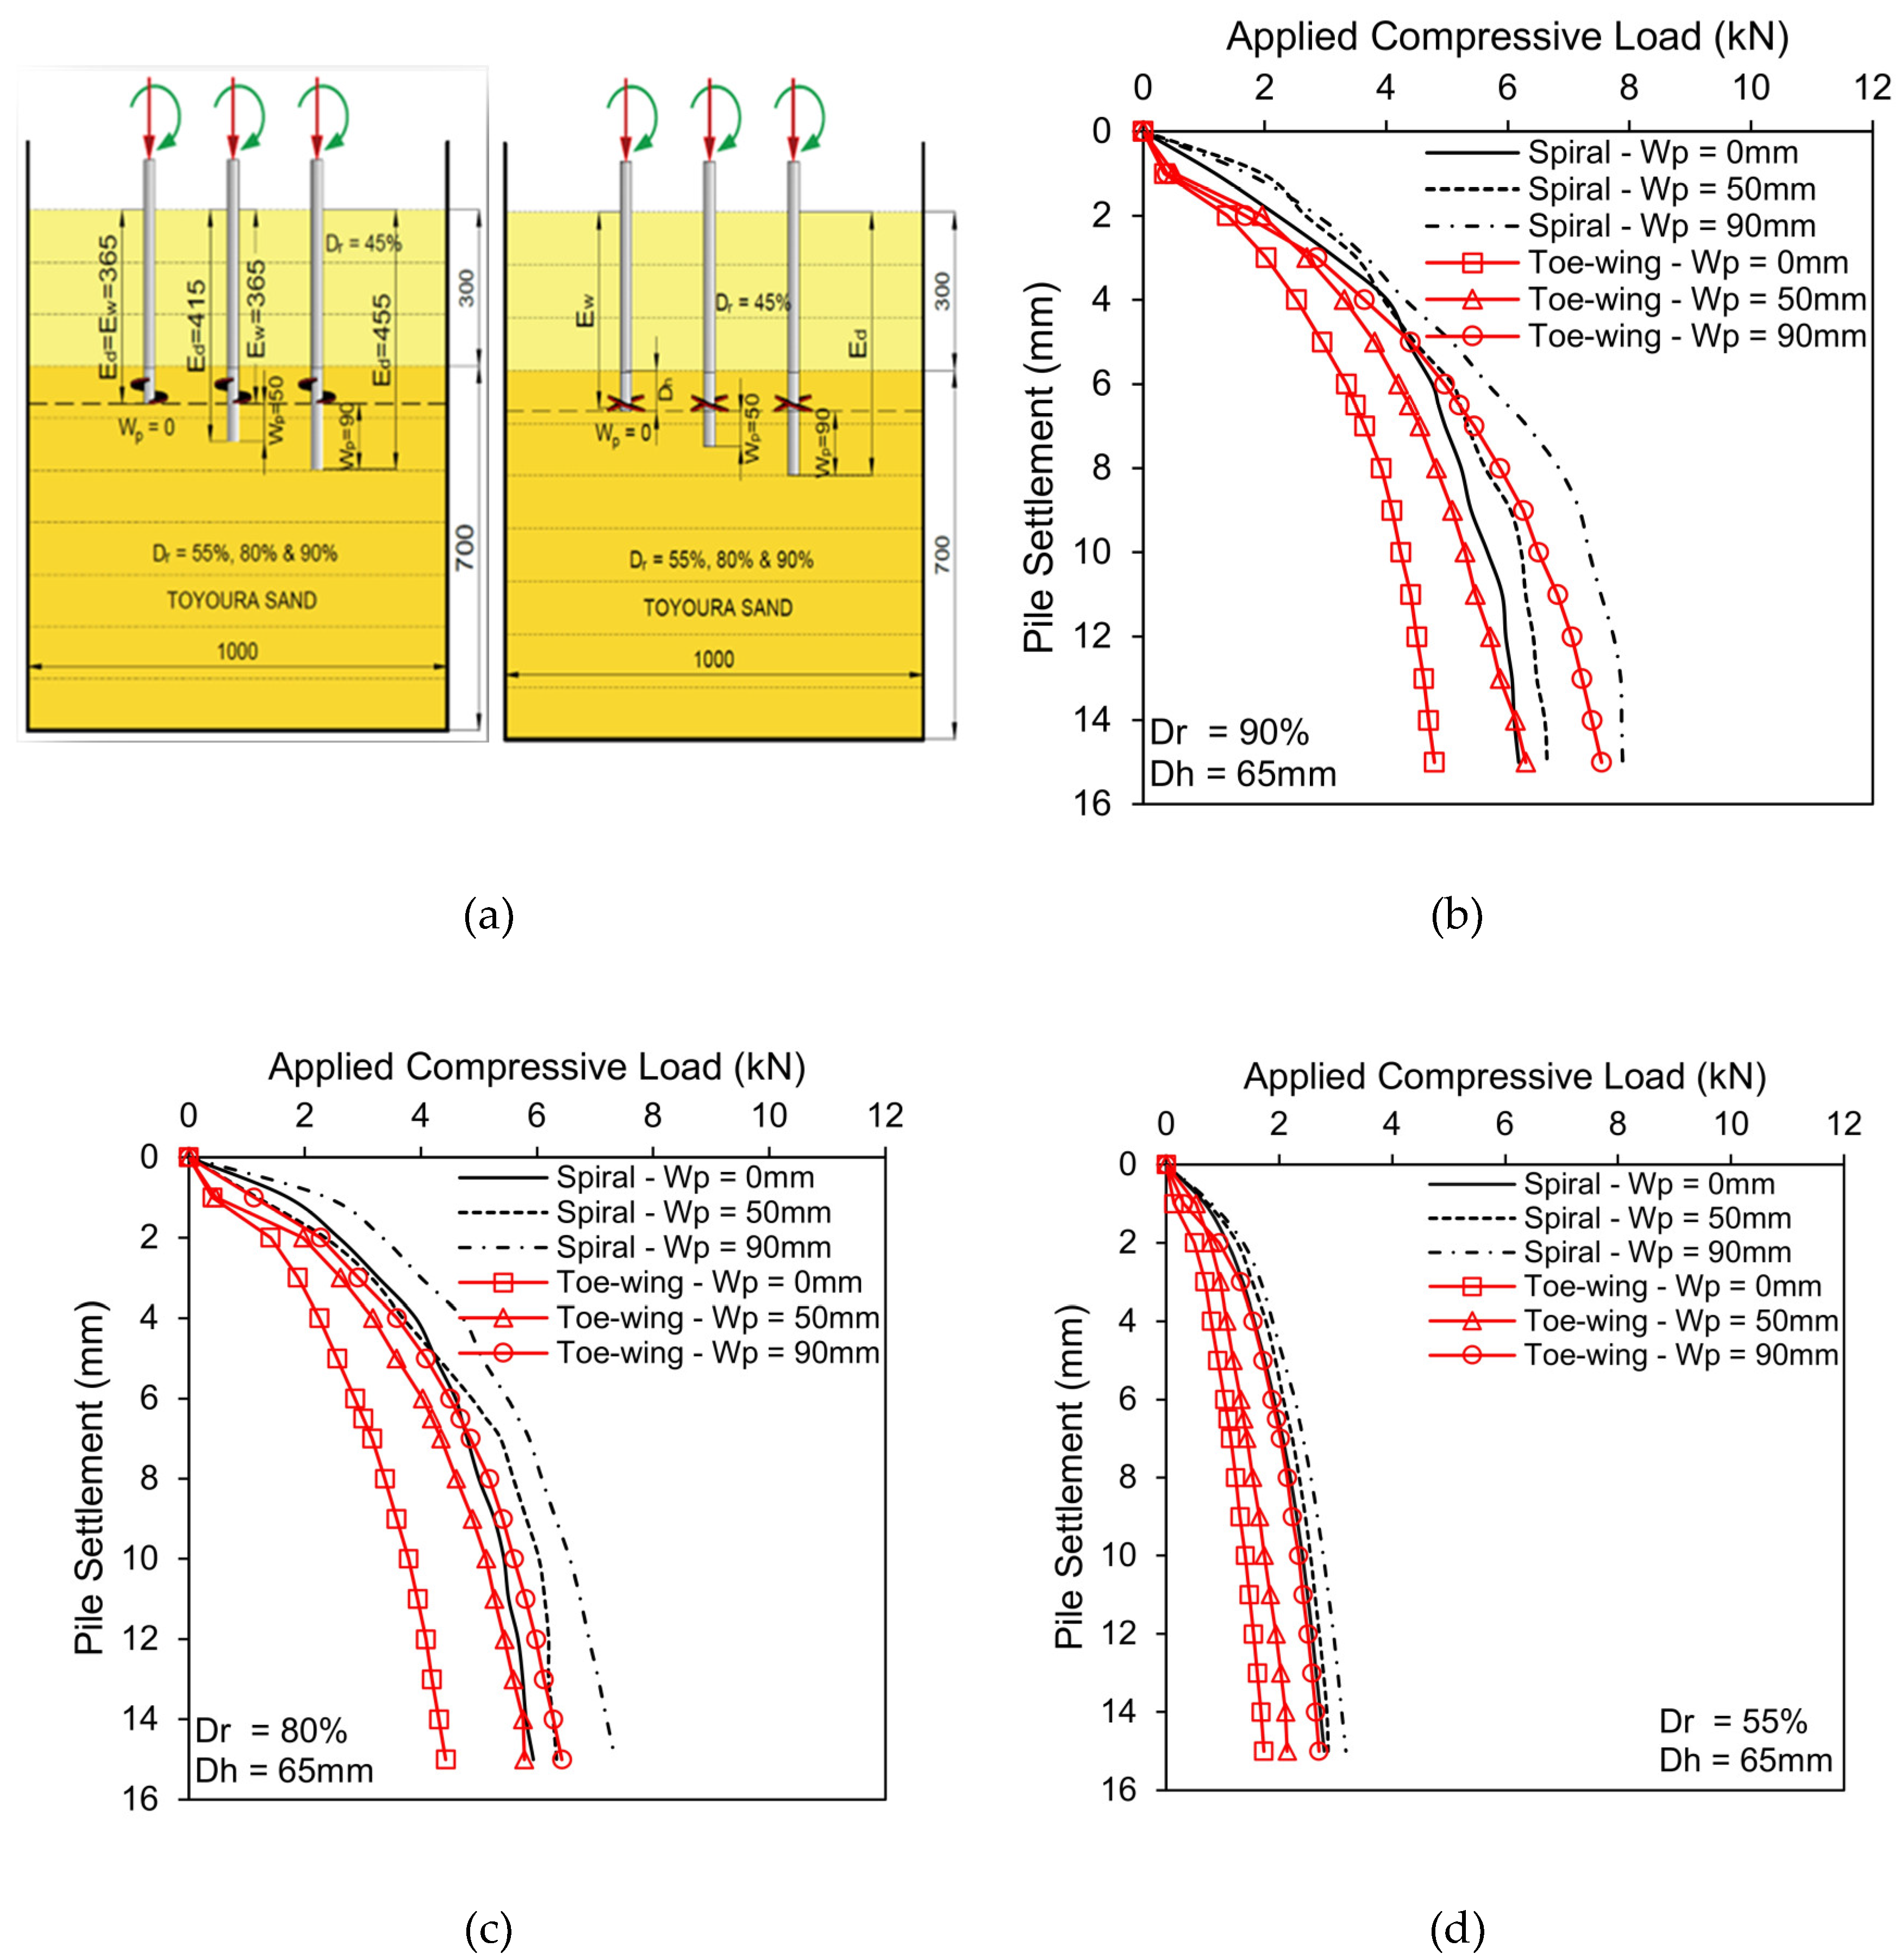
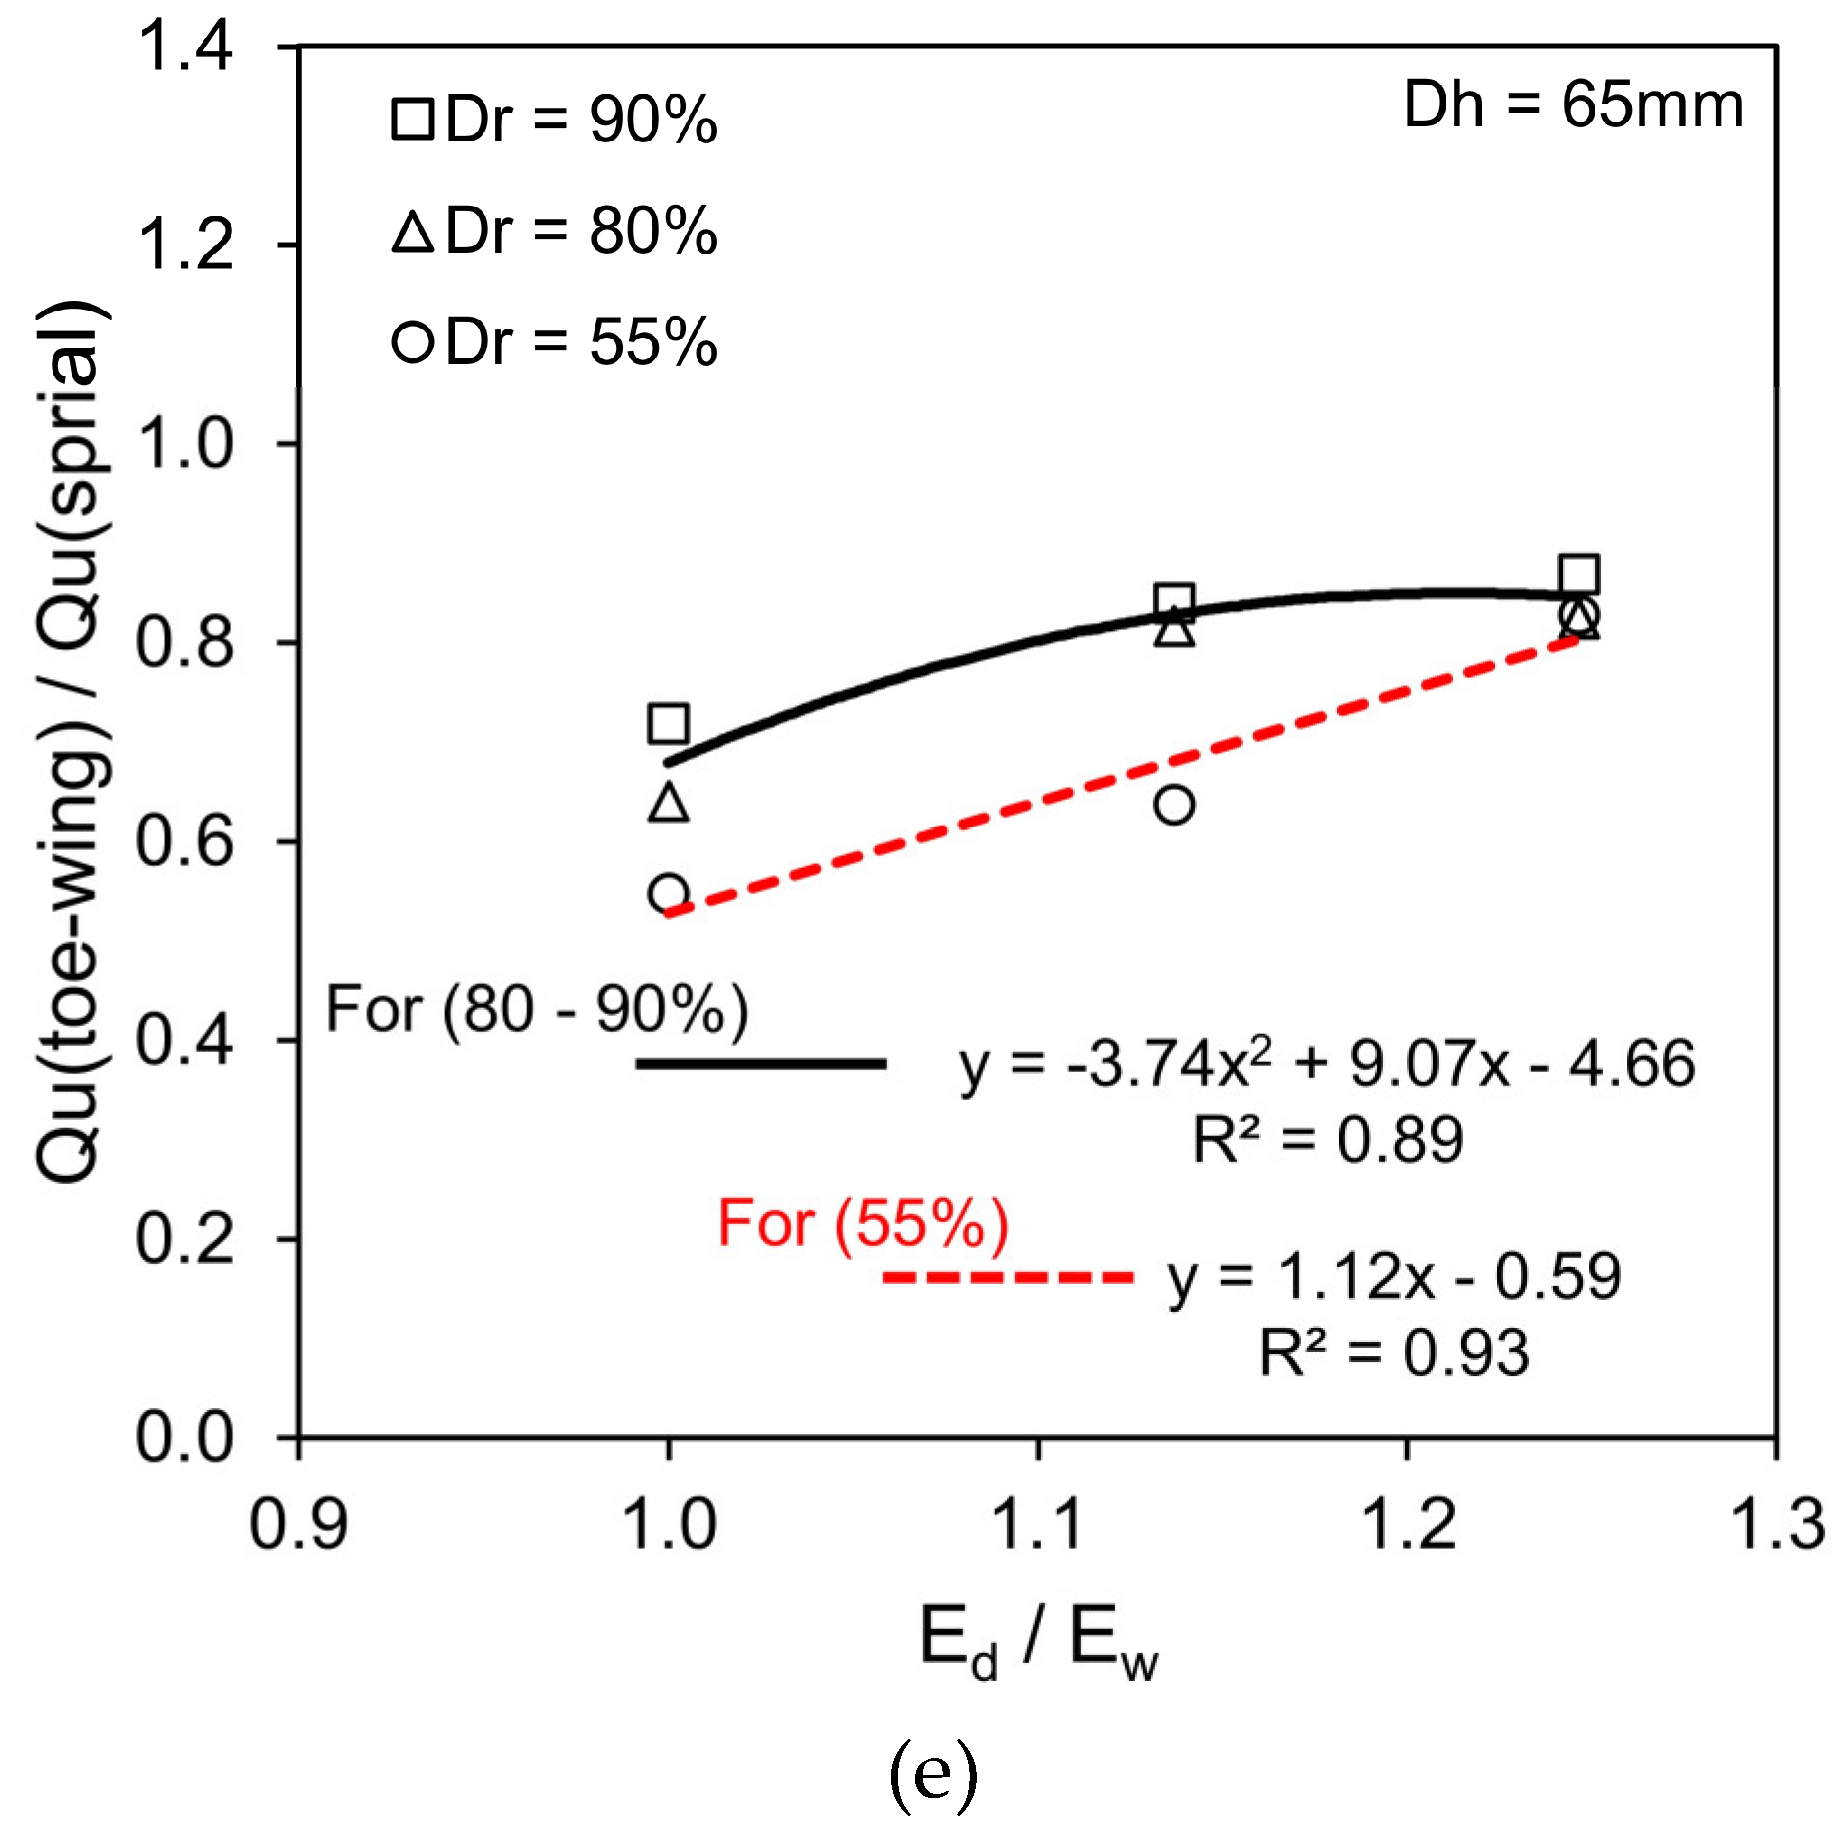
Figure 6.
(a) Schematic diagram illustrating the position of the helix/toe-wing relative to the pile tip in the model container (b) Load settlement response at various positions of the helix/toe-wing from pile tip (Wp) of screw piles at a relative density of 80% (c) Relationship between normalized ultimate pile capacity and Ed/Ew ratio (d) Relationship between normalized ultimate pile capacity and helix/toe-wing position to helix diameter ratio.
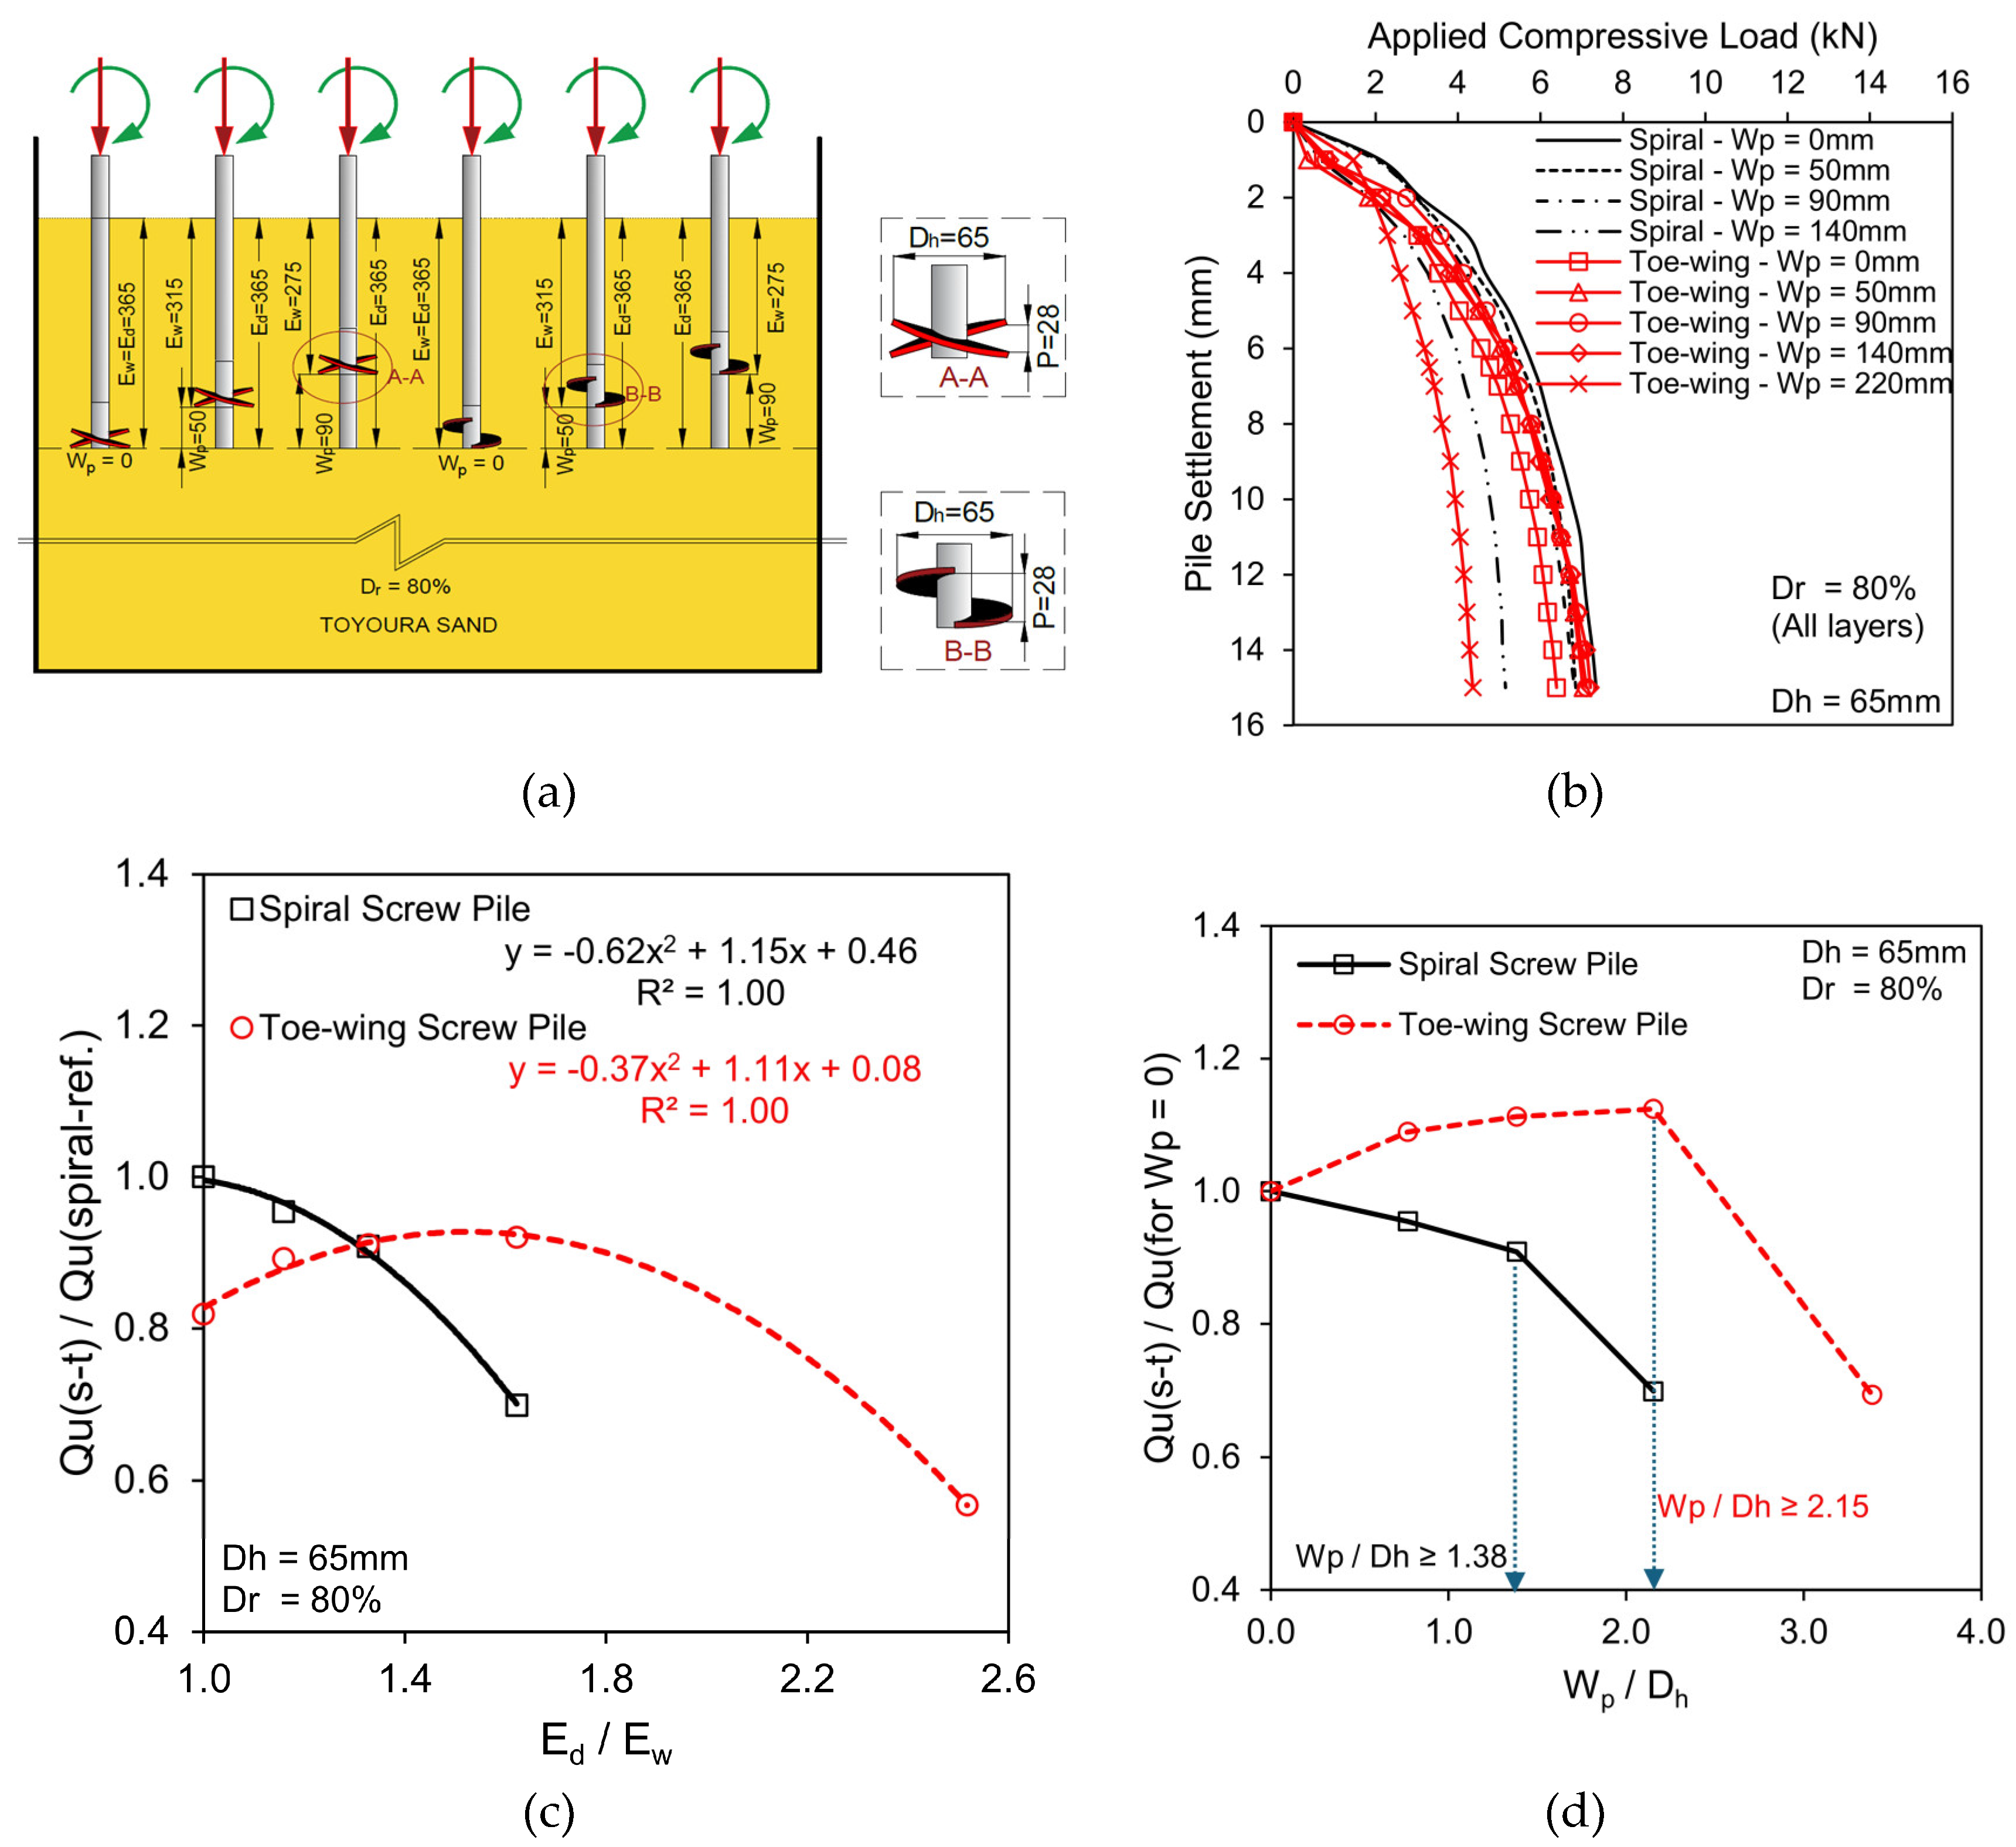
Table 2.
Physical specifications of toe-wing & spiral screw piles.
|
[mm] |
[mm] |
[mm] |
[mm] |
[degree] |
[mm] |
[mm] |
|---|---|---|---|---|---|---|
| 500 (Toe-wing) | 21.7 | 65 | 3.6 | 25 | 0, 50, 90 | 365, 415, 455 |
| 500 (Spiral) | 21.7 | 65 | 3.6 | 0, 50, 90 | 365, 415, 455 |
Notes: LS = Pile shaft length, DS = Pile shaft diameter, Dh = Toe-wing diameter, TW = Toe-wing thickness, IW = Toe-wing plates inclination, Wp = Toe-wing position from the pile tip, and Ed=Embedment depth of pile end tip.
Table 3.
Test cases of spiral and toe-wing screw piles.
| Screw Pile Type | Dh (mm) | Wp (mm) | Pitch (mm) | Ew (mm) | Wp/Dh |
| Toe-wing Screw Pile | 65 | 0, 50, 90, 140, 220 | 28 | 365 | 0, 0.77, 1.38, 2.15, 3.38 |
| Spiral Screw Pile | 65 | 0, 50, 90, 140 | 28 | 365 | 0, 0.77, 1.38, 2.15 |
Disclaimer/Publisher’s Note: The statements, opinions and data contained in all publications are solely those of the individual author(s) and contributor(s) and not of MDPI and/or the editor(s). MDPI and/or the editor(s) disclaim responsibility for any injury to people or property resulting from any ideas, methods, instructions or products referred to in the content. |
© 2024 by the authors. Licensee MDPI, Basel, Switzerland. This article is an open access article distributed under the terms and conditions of the Creative Commons Attribution (CC BY) license (http://creativecommons.org/licenses/by/4.0/).
Copyright: This open access article is published under a Creative Commons CC BY 4.0 license, which permit the free download, distribution, and reuse, provided that the author and preprint are cited in any reuse.


