Submitted:
20 December 2024
Posted:
24 December 2024
You are already at the latest version
Abstract
Chinese classics carry traditional Chinese culture, including books and records, and gather the Chinese wisdom, values, and spirit that have been accumulated by the Chinese nation for thousands of years, which is an indispensable part of world civilization. As China becomes more involved in international political, economic, and cultural activities, the translation and external dissemination of Chinese cultural classics help deepen the international audience’s understanding and recognition of the mainstream values of Chinese culture and China's propositions in various international affairs. To represent the research focus and development trend of the “translation and introduction” and “external dissemination” of Chinese classics and to discuss the inherent connection between the translation and dissemination of Chinese classics, relevant literature collected from 2013--2023 was retrieved by the keyword “Chinese classics” in the advanced search interface of the Web of Science (WOS). The function of cluster analysis and the construction of the heatmap in the open-source statistical software R studio revealed that there was a mismatch in the research focus between the translation and external dissemination of Chinese classics. Translation focuses on philosophical research at the cross-cultural level, whereas dissemination focuses more on exploring the translation of works at the literary level.
Keywords:
traditional Chinese classics
; dissemination
; translation and introduction
; cluster analysis
; heatmap
1. Introduction
Chinese classics, as vessels of rich traditional Chinese culture and the philosophical tenets of the Chinese nation, serve as the wellspring of cultural confidence for the Chinese people. They possess the transformative functions of nurturing the virtues of good fortune, establishing a righteous worldview, and enlightening the mind with wisdom. A growing cohort of scholars, from a diverse array of perspectives, are dedicated to exploring the discourse utility inherent in the translation and dissemination of Chinese classics (Xiong Xin; Chen Yujing,2016:3), reflecting the growing international recognition of the importance of understanding Chinese culture, particularly in the context of China's expanding economic influence (Xing Yu,2024:91). Web of Science (WOS) is a large-scale comprehensive, multidisciplinary, core journal citation index database that includes three major citations: the Science Citation Index (SCI) and the Social Sciences Citation Index (SSCI) Arts & Humanities Citation Index (A&HCI). Moreover, two chemical information databases—Current Chemical Reactions (CCR) and Index Chemicus (IC) and Science Citation Index Expanded (SCIE), Conference Proceedings Citation Idex-Science (CPCI-S) and Conference Proceedings Citation index-Social Sciences & Humanities (CPCI-SSH)—were included (Yuan Fei; Li Long, 2013:63). Anchored in a rich dataset of scholarly literature sourced from the Web of Science (WOS) between 2013 and 2023, this study utilizes the open-source statistical software R studio, harnessing its sophisticated tools for clustering analysis and heatmap visualization. It provides a thorough examination of the research focus, thematic interconnections, and evolutionary trends in the field of translating and disseminating Chinese classics to an international audience.
2. The Focus and Trends of Translating Chinese Classics
This section primarily concentrates on the translation research of Chinese classics within the Web of Science (WOS) database to explore the overarching trend in the external translation and dissemination of these texts. The search parameters were set to “classic translation” and “Chinese” via the “Advanced Search” dialog box, with the command TS=(classic AND translation AND Chinese). The publication year or public year was restricted to the period from 2013--2023, and the document type was limited to “Article”. On the basis of the above search strategy, a total of 146 studies were identified. Following the initial retrieval of high-frequency keywords from the 146 articles, a subsequent reorganization was conducted to eliminate any unreadable or irrelevant terms. Micro word cloud word frequency statistics software was subsequently used to analyze the prevalence of the remaining keywords. In the final step, the remaining high-frequency words were refined, with common invalid data such as “translation”, “China”, “classifications”, “of”, “the”, and similar terms being excluded, to yield the effective data graph presented in Figure 1:
Figure 1 presents a word cloud that employs variations in font size and color to denote the frequency and significance of keywords pertaining to the translation and introduction of Chinese classics. The prominence of a term's font size within the word cloud is directly proportional to its frequency of occurrence across the 146 studies, thereby reflecting the subject's prominence in academic research. In the word cloud, “Literature” and “Philosophy” are prominently featured, indicating that Chinese classics, along with philosophical concepts such as Confucianism and Taoism, are central to the discourse on translation and introduction. The prevalence of the high-frequency terms “Cultural” and “Cross-cultural' underscores the importance of cross-cultural communication in the translation and dissemination of Chinese classics. This process extends beyond mere linguistic translation, serving as a conduit for the conveyance of cultural values and philosophical insights to international audiences. The prominence of the high-frequency words “Confucianism” and “Dao” in the word cloud underscores the significant role of these philosophical systems in the international dissemination and scholarly research of Chinese classics. The frequent occurrence of these terms indicates that Confucian and Taoist thought are not only central to the translation and introduction of Chinese classics but also attract considerable attention within the realms of literature and philosophy (Niu Zhen, 2023:76). The appearance of the term “Russian” as a high-frequency word indeed signifies engagement with Chinese classics in Russia, indicating two key aspects: the translation and introduction of Chinese classics within Russia and the contributions of Russian scholars to the field of Chinese classics translation.
The word cloud map of frequency statistics reveals that over the past decade, scholars worldwide have predominantly employed central terms such as “literature”, “philosophy”, “culture”, “cross-cultural”, “Russian”, “Laozi”, “Dao”, “Confucianism”, and “Poetry” in the English translation discourse of Chinese classics. Figure 2 presents a histogram illustrating the top 7 keywords according to their frequency, as visualized through a micro word cloud.
Clustering is a data analysis technique that involves partitioning a dataset into multiple subsets or clusters. The goal is to ensure that the data points within each cluster are highly similar to each other while being markedly different from those in other clusters. The primary objective of clustering is to uncover the inherent groupings and relationships within the data, revealing structures that may not be immediately apparent (Lv Jjiangping,2005:24). Clustering analysis technology is particularly valuable for its quantitative analytical capabilities. It enables an objective assessment of information objects, allowing for a deep understanding of the patterns and repeatability inherent in those objects across various informational contexts. Furthermore, it leverages actual data to establish foundational condition features during the clustering process. This approach ensures that the results of clustering analysis are a true reflection of the data's objective characteristics, minimizing the influence of subjective biases. (Zhang Lixia,2022:93).
Figure 2 shows the clustering analysis dataset, with the horizontal axis representing the top 7 most frequently extracted keywords: “literature”, “cultural”, “Russian”, “philosophy”, “crossculture”, “Confucianism”, and “Daodejing”. The vertical axis spans the time range from 2013--2023, with each year used as the basic unit for analysis. The frequency of these 7 elements within the abstracts of scholarly articles is counted, and the Web of Science (WOS) database is queried to compile the dataset for subsequent clustering analysis. To distinguish the time column from the numerical data in other datasets, it is categorized as Type 1 in the dataset. This classification is detailed in Table 1:
Before conducting cluster analysis on the first 7 keywords in Table 1 via R language, the following code is used to download the packages of MASS, tidyverse, cluster, factoextra, and fpc, which are not available in R by default: #.libpaths, #install.packages and #library. Tidyverse is used to read data, cluster is used for clustering analysis, factoextra is used to draw visual clustering distribution maps of principal components, and the fpc package is used for DBSCAN, distance calculation of clustering analysis, point type determination, etc.
The dataset was subsequently entered into an Excel sheet, named translation material, and saved. csv format before being imported into R studio. The code of
> clsdata <- read.csv("C:/Users/19723/OneDrive/desktop/translationmaterial.csv")
> plot(clsdata)
are used to draw the clustering results of seven keywords, as shown in Figure 3:
The scatter plot of the seven keywords in Figure 3 reveals the binary relationships among all specified variables. On the basis of the scatter plot, these data can be inferred to be spatially divided into several clusters, as the points are dispersed across multiple areas, exhibiting a distributed arrangement rather than a linear one. Therefore. There is a nonlinear relationship between the seven keywords. For example, the relationship between “literature” and “cultural” is relatively dense, whereas that between “crosscultural” and “Confucianism” is even denser.
When performing clustering on the seven keywords, the first step is to determine the number of cluster centers. First, the dataset is loaded with data (translation material), then the data are standardized after the first column is excluded using the df <- scale (translation material[-1]), and the result is stored in df. Finally, head(df) is used to view the first 6 rows of df, as shown in Figure 4:
Figure 4. Dataset of translation material (df value).
Taking "literature" and "cultural" as instances, the aforementioned dataset is clustered, and the number of centers is set to 2 for the first clustering:
> km.res <-kmeans(df,2,nstart = 25)
> km.res$cluster,
Check the number of samples in each group after clustering:
> km.res$size
Examine the centroids of each cluster:
> km.res$centers,
The following results were obtained, as shown in Figure 5:
On the basis of the above clustering results, a plot of sample points and cluster centroids is created, as shown in Figure 6:
On the basis of the clustering results shown in Figure 6, when the number of centers is set to 2, the clustering effect is not obvious, and the data values do not closely surround the cluster centroids and appear dispersed. However, after setting the center value to 4, with the same steps used for calculation, the plots of the sample points and cluster centroids are shown in Figure 7.
The following comparison shows the sample points after performing K-means clustering with center=2 and center=4. When center=4, the data are more densely clustered around the centroids. In Figure 7, the four cluster centroids have the following mean intervals for the sample points around them: the first cluster centroid has a mean interval of (-1.0, -0.5), the second cluster centroid has a mean interval of (-0.5, -0.4), the third cluster centroid has a mean interval of (0.3, 0.5), and the fourth cluster centroid has a mean interval of (-1.5, 1.0). Therefore, in the subsequent clustering calculations, the center value is uniformly set to 4.
Since the keyword with the highest frequency is “literature”, the following cluster diagrams are created with “literature” as the basic unit, showing the clustering of “literature” with the other keywords “cultural”, “Russian”, “Philosophy”, “cross-culture”, “Confucianism”, and “Daodejing”, as shown in Figure 8. The step and the code are as follows:
# Draw a cluster diagram
plot(df, col = km.res$cluster, pch = 19, frame = FALSE, main = "K-means with k=4")
points(km.res$centers, col = 1:2, pch = 8, cex = 3)
# Select specific columns in the dataset for further clustering analysis
data <- df[c("cultural", "literature")]
# Draw a scatter plot of the selected data
plot(data, asp = 1, pch = 20, cex = 0.8)
# K-means clustering is performed on the selected data with a 4-cluster center count of 4.
k2 <- kmeans(data, centers = 4, nstart = 25)
# Draw the clustering results graph in a new graphical window
x11()
plot(data, asp = 1, pch =20, cex = 0.8, col=k2$cluster)
Using the same method, cluster analysis was performed on the pairs “Russian” and “literature”, “Philosophy” and “literature”, “crossculture” and “literature”, “Confucianism” and “literature”, “Daodejing” and “literature”. The following results were obtained, as shown in Figure 9:
Since “literature” is considered the basic unit, in reality, Figure 9 compares the clustering effects of six elements: cultural, Russian, philosophy, cross-cultural, Confucianism, and Daodejing. In the context of the clustering analysis, the pair "Russian-Literature" presents the least distinct clustering pattern, with the sample points aligning in a linear fashion and the interval around the mean of these sample points falling within (0,2). This outcome is attributed to the clustering analysis dataset presented in Table 1, which indicates that scholarly research pertaining to "Russian" is notably focused within the years 2013, 2015, and 2016, with an average of just one piece of literature related to "Russian" in each of the other years. The least obvious clustering element is "cross-cultural," with its three class centers arranged linearly and most of the sample points located in the interval (0, 5), with only one outlier sample point on the number 15. In Table 1, "cross-cultural" research literature reached a notable peak in 2013. Nonetheless, beginning in 2014, there was a marked decline in the relevance of such documents, culminating in a mere single relevant research document by 2023. The most dispersed sample distribution is observed for 'cultural'. The four class centers are situated across four distinct intervals, and the sample point means are similarly distributed across four separate intervals, specifically, (0,5), (10,15), (15,20), and (20,25). On the basis of the dataset in Table 1, from 2013--2018, scholars produced a substantial body of literature on the translation of classics from a "cultural" perspective. The sample distribution for "Confucianism" is relatively scattered, with its three clustering centers concentrated in the interval (0,6), and most of the samples also concentrated in the same interval. Corresponding to the dataset in Table 1, except for a noticeable increase of 9 articles related to it in 2017, the research on the translation of Chinese classics from this perspective has remained relatively stable in other years. “Philosophy” exhibits a relatively compact sample distribution, with its four cluster centers positioned within the two intervals of (0,5) and (5,10). An examination of the data in Table 1 clearly reveals that from 2013--2017, scholarly research from this perspective was quite prevalent, but there was a slight decline in interest after 2017. "Daodejing" has the most even sample distribution, with its samples spread across four distinct intervals. Both its four cluster centers and sample means are distributed across four consecutive intervals: (0,5), (5,10), (10,15), and (15,20). On the basis of the clustered dataset presented in Table 1, there is clearly a generally consistent pattern in the volume of scholarly literature concerning the translation of Chinese classics, with a particular focus on the “Daodejing”. The period from 2013--2015 witnessed a peak in the number of publications of relevant studies. Following a minor dip, there was a brief resurgence in the number of publications, which subsequently experienced another decline, ultimately settling into a stable phase. Over the past decade, a consistent theme in academic research on the translation of Chinese classics has been the focus on the keyword “Daodejing”, complemented by an interest in “philosophy”, “Confucianism” and “cultural” aspects. More recently, scholars have integrated the keywords “cross-cultural” and “Russian” into their studies on the translation of these texts, indicating a shift toward a more global and comparative perspective in their research endeavors.
3. The Emphasis and Trend of the External Dissemination of Chinese Classics
In this section, the external dissemination of Chinese classics on the basis of the relevant documents included in WOS will be further explored. The topic for the Advanced Search in WOS is set as “Chinese”, “classic translation” and “spread”, setting the search range to “ALL=(classic translation * Chinese * Spread* Propagate* Disseminate)”. There are very few documents retrieved through the conditions set above; therefore, Year Publication and Document Type have not been set as limitations. With the system automatically defaults to the time span of 2015--2022, 13 documents can be found in WOS, as shown in Table 2.
Although WOS has collected over 1.7 billion cited studies and 159 million records, it is obvious from Table 2 that there have been few research papers on the translation and introduction of Chinese classics on WOS in recent years, and the relevant literature can only be traced back to 2015. Although these documents cover a wide range of content, such as Chinese fables, Marxists, Confucius, Funeral Customs, Dao, the Story of Stone, minority classics, and medical culture, there is only one or two studies in each field, and the research content is not in depth. For example, the research field of the literature “Traditional Indian medicine in China: The status quo of recognition development and research” published in 2015 is medicine, but the research direction of the journal is traditional medicine in India rather than the translation of ancient Chinese medical classics. The eighth article, “The initial stage of Russian Chinese cultural interactions”, focuses on cultural exchanges between China and Russia, which is unrelated to the translation of Chinese cultural classics.
A heatmap is a visualization technique for presenting three-dimensional data in two dimensions, using different colors (or shades of colors) to represent the quantity, size, or frequency of a monitoring value or event occurrence. R language is widely recognized in the academic community as an excellent tool for processing data visualization, which effectively solves the visualization of analyzing data and makes the results of the analysis intuitive and easy to understand (Wang Liang, 2023:107). Therefore, it is feasible to use R language to draw heatmaps to observe the research emphasis of the external dissemination of Chinese classics.
First, by employing microword cloud frequency statistics software to analyze the term frequency of keywords in 13 documents and excluding irrelevant words such as “of”, “the” and “translation”, the top five high-frequency words identified are “cultural”, “cross-cultural”, “communication”, “literature” and “spread”. Based on the aforementioned keywords, keyword frequency statistics are performed on the abstracts of 13 pieces of literature to compile the first dataset, as depicted in Table 3:
For “public year (publication year)”, when two or more articles are published in the same year, a unique identifier is appended to each article's public year to facilitate easy identification. For example, if three articles are published in 2017, their public years are denoted as “20171”, “20172”, and “20173” by adding a sequential number to the year. The dataset compiled via this method is named “dataoneone”.
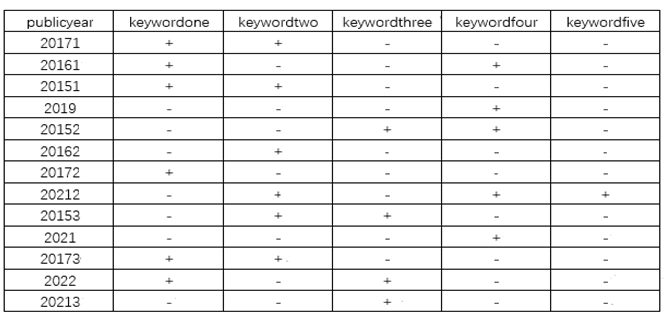
Second, to facilitate the creation of heatmaps for the five datasets, it is essential that the horizontal and vertical axes of each dataset be aligned consistently. The content filled is indicated with “+” or “-”. The assignment of “+” or “-” to each keyword of the 13 articles is determined by comparing them with the top five high-frequency keywords previously identified: keywordone, keywordtwo, keywordthree, keywordfour, and keywordfive. Keywords that are similar in meaning or closely related to these high-frequency terms are assigned a “+”. On the other hand, keywords that significantly differ in meaning or exhibit a weaker association are assigned a “-”. By following this procedure, Dataset 2 is generated and named “datatwotwo”, as depicted in Table 4. Similarly, the remaining datasets are constructed in sequence.
A heatmap was drawn via R after the two datasets were obtained. First, the programming package “pheatmap”, which is the abbreviation for “pretty heatmaps”, is downloaded, and the program is written as follows:
> library(pheatmap)
> dataoneoneoneone <- read.csv("C:/Users/19723/OneDrive/desktop/dataoneoneone.csv", header = TRUE, row.names = 1)
> datatwotwotwo <- read.csv("C:/Users/19723/OneDrive/desktop/datatwotwotwo.csv", header = TRUE, row.names = 1)
>pheatmap(dataoneoneone, cluster_rows = FALSE, cluster_cols = FALSE, breaks = c(4, 2, 1,0), color = c("orange","blue","gray"), display_numbers = datatwotwotwo)
Then, the following heatmap can be obtained:
In Figure 10, three sample value ranges are designated with three distinct colors: orange, blue, and yellow. The interval (2,4) is indicated in orange, (1,2) in blue, and (0,1) in gray. On the basis of the search results, the research focus on the external dissemination of Chinese classics can be ascertained by analyzing and comparing the top 5 high-frequency words previously identified—culture (keywordone), cross-culture (keywordtwo), communication (keywordthree), literature (keywordfour), and spread (keywordfive)—with the keywords from each of the 13 articles, along with the corresponding counts of “+” and “-” indicators. Upon analyzing dataset 2, it becomes evident that the “+” symbols are assigned to keywords that closely correspond with the high-frequency words identified, whereas the “-” symbols are used to denote those that diverge from these terms. Consequently, a higher frequency of “+” signs in the heatmap indicates a stronger emphasis on the corresponding keyword. The ranking of the five keywords on the basis of the number of “+” signs is as follows: keywordone(culture) and keywordtwo (cross-culture) are tied the highest, followed by keywordfour(literature), then keywordthree (communication), and finally keywordfive (spread), which as the fewest. In other words, the research focus is most heavily concentrated on “cultural” and “cross-cultural” aspects, with “literature” ranking next, followed by “communication” and “spread”, which receive the least. Given the equal number of “+” signs for “cultural” and “crosscultural”, further analysis of their research focus can be conducted by examining the sample size. This additional comparison will help to determine if there is a significant bias toward one of these two areas within the dataset. First, the orange color block with the largest interval value is identified. Next, disregard the color blocks that are marked with a “-” and focus only on those marked with a “+”. In the case of “cultural” and “crosscultural”, both have an equal number of orange blocks, with three blocks each. Next, the blue color blocks that are marked with a “+” are examined. For both “cultural” and “cross-cultural”, the number of blue blocks remains equal, with three blocks each. Finally, the gray color blocks with the smallest interval values are examined. In this case, “cultural” has one gray color block marked with a “+”, whereas “cross-cultural” has none of the gray color blocks marked with a “+”. Therefore, in the study of the external dissemination of Chinese classics, 'cultural' remains the primary keyword for research, followed by “cross-cultural”, “literary”, “communication” and “spread” as secondary keywords.
4. Comparative Analysis of Research Focuses in Translation and Dissemination
There is an inherent correlation between the translation and the external dissemination of Chinese classics. Once the extent of scholarly usage of keywords in these fields has been established, a further comparative analysis and illustration of their research focus can be conducted. This analysis is visually represented in the diagram presented in Figure 11:
Figure 11 reveals a distinct pattern in the thematic use of “cultural” and “cross-cultural” keywords in research on the translation and introduction of Chinese classics. In the context of translation and introduction, these terms are seldom employed by scholars as central themes. Conversely, in the realm of external dissemination, “cultural” and “cross-cultural” emerge as the predominant thematic keywords, indicating that scholars predominantly focus on these aspects in their research. When translating Chinese classics, scholars predominantly concentrate on “philosophy”, delving into the profound thoughts and ideologies that these texts encapsulate. In contrast, in regard to the international dissemination of these classics, the emphasis shifts toward the “literary” domain, highlighting the narrative and artistic elements that resonate across cultures.
Scholarly research in the translation and dissemination of Chinese classics tends to exhibit a certain degree of one-sidedness, reflecting inherent biases or specific focuses within the field. Given that “Daodejing”, “Confucianism”, and “Russian” can all be subsumed under the broader categories of “philosophy” and “culture”, scholars in the field of translation studies tend to concentrate their research efforts on “philosophy”, “culture”, and “crossculture”. Studies have revealed that while 'Communication' and 'Spread' are deemed high-frequency terms in the realm of external communication research, the actual scholarly emphasis has not been centered on these terms (Perales-Aguirre, A.M. et al. 2024:263). Instead, there is a notable alignment between the key terms in external communication research and those in translation studies, with a particular emphasis on the term “Cultura”. This pattern indicates a scholarly inclination toward investigating cultural dimensions in the translation and dissemination of classic Chinese literature. This inclination may stem from the pivotal role that cultural elements play in cross-cultural communication (Xiao Tang-jin, 2018:1689). Furthermore, the translation of Chinese classics should ideally progress from a phase of translation to one of dissemination. However, research on the translation and dissemination of these classics to the outside world has exhibited asymmetry. While the translation phase is more heavily weighted toward philosophical studies, the dissemination phase leans more toward literary exploration, creating a disparity in the focus of scholarly attention.
5. Conclusions
How to better spread traditional Chinese culture in today's world with international cultural integration through the external dissemination of Chinese classics, explain China's propositions, possess the international discourse share, make more audiences feel the breadth and depth of Chinese culture, accept the values and aesthetic taste implied in China's spiritual and cultural construction, and then recognize the importance of the coexistence of the Chinese path to modernization and Western style modernization is a topic of great concern for every scholar who spreads Chinese cultural classics at home and abroad. In addition, what should be disseminated, what should be added or deleted in translation, and how to translate for the aesthetic needs of the audience runs through the whole process of the translation and dissemination of Chinese classics to the outside world. The data statistics and analysis in this study reveal that scholars have shifted their research focus from the dissemination of Chinese classics from purely literal semantic transmission to the comparison of the essences of Eastern and Western cultures and cross-cultural communication; however, the spread width of traditional Chinese classics' items and the exploration depth of the connotations still need to be strengthened urgently for the significant differences reflected in the interpretation of the spiritual connotations of Chinese culture and the acceptance of traditional Chinese aesthetic values in the perception and evaluation of traditional Chinese culture among international audiences from different cultural backgrounds. To bridge the gap in cultural cognition and evaluation and better promote the translation and dissemination of Chinese classics, it is necessary for the academic community at home and abroad to carry out close cooperation, deeply study and interpret the spiritual essence of traditional Chinese culture, take into account the aesthetic needs and cultural adaptation of audiences from different cultural backgrounds, accurately convey the core values and concepts contained in Chinese classics, effectively narrow the cultural differences between East China and West China, enhance mutual understanding, promote cultural mutual learning, and thus build a diversified, harmonious, mutually respectful and common, prosperous global cultural environment.
Author Contributions
As the first and corresponding author, substantially contributes to the conception, the design of the work, the drafting of the work and the revising of the work critically for important intellectual content, and the final approval of the version to be published. What’s more, contribute to be accountable for all aspects of the work in ensuring that questions related to the accuracy or integrity of any part of the work are appropriately investigated and resolved.
Ethical Approval
This article does not contain any studies with human participants performed by any of the authors.
Informed Consent
This article does not contain any studies with human participants performed by any of the authors.
Data availability
All data included in this study are available upon request by contact with the corresponding author.
Conflicts of Interests
The authors declare no competing interests.
References
- Xiong Xin; Chen Yujing. (2016). Discourse Power of Chinese Culture in International Communication. Youth Journalist, 30,(08): 30-31. [CrossRef]
- Xing Yu.(2024). Research on the C-E Translation of Chinese Classics between 2002 and 2022: Review and Prospect. Lecture Notes on Language and Literature,7(03):91-95. [CrossRef]
- Yuan Fei;Li Long. (2013). Discussion on Web of Science Retrieval Skills——to SCIE as an Example. Journal of Modern Information, 33,(05):62-65. [CrossRef]
- Niu Zhen. (2023). Research on the Inheritance of Traditional Chinese Culture in Classics—the Journey to the West as an Example. Frontiers in Educational Research, 6(03): 74-78. [CrossRef]
- Lv Jiangping.(2005). Cluster analysis and its visualization methods. Statistics and Decision, 199,(10):24-26. [CrossRef]
- Zhang Lixia. (2022). The Practice of Cluster Analysis in Foreign Linguistics Research. Journal of Honghe University, 20,(05): 91-93. [CrossRef]
- Perales-Aguirre, A.M. et al. (2024). External Communication: A Systematic Literature Review 2019–2023.
- In: Nagar, A.K., Jat, D.S., Mishra, D.K., Joshi, A. (eds) Intelligent Sustainable Systems. WorldCIST 2023.
- Lecture Notes in Networks and Systems, vol 828:261-269. Springer, Singapore. [CrossRef]
- Wang Liang; Huang Jiangyun; Xu Tan. (2023). Research on Visualization of Discipline Performance.
- Evaluation Data in Public Hospitals Based on R Language. China Digital Medicine, 18,(06): 107-113. [CrossRef]
- XIAO Tang-jin. (2018). Cross-cultural Communication Translatology: Theories and Practice. Journal of Literature and Art Studies, 8,(12):1687-1695. [CrossRef]
Figure 1.
Word frequency statistics.
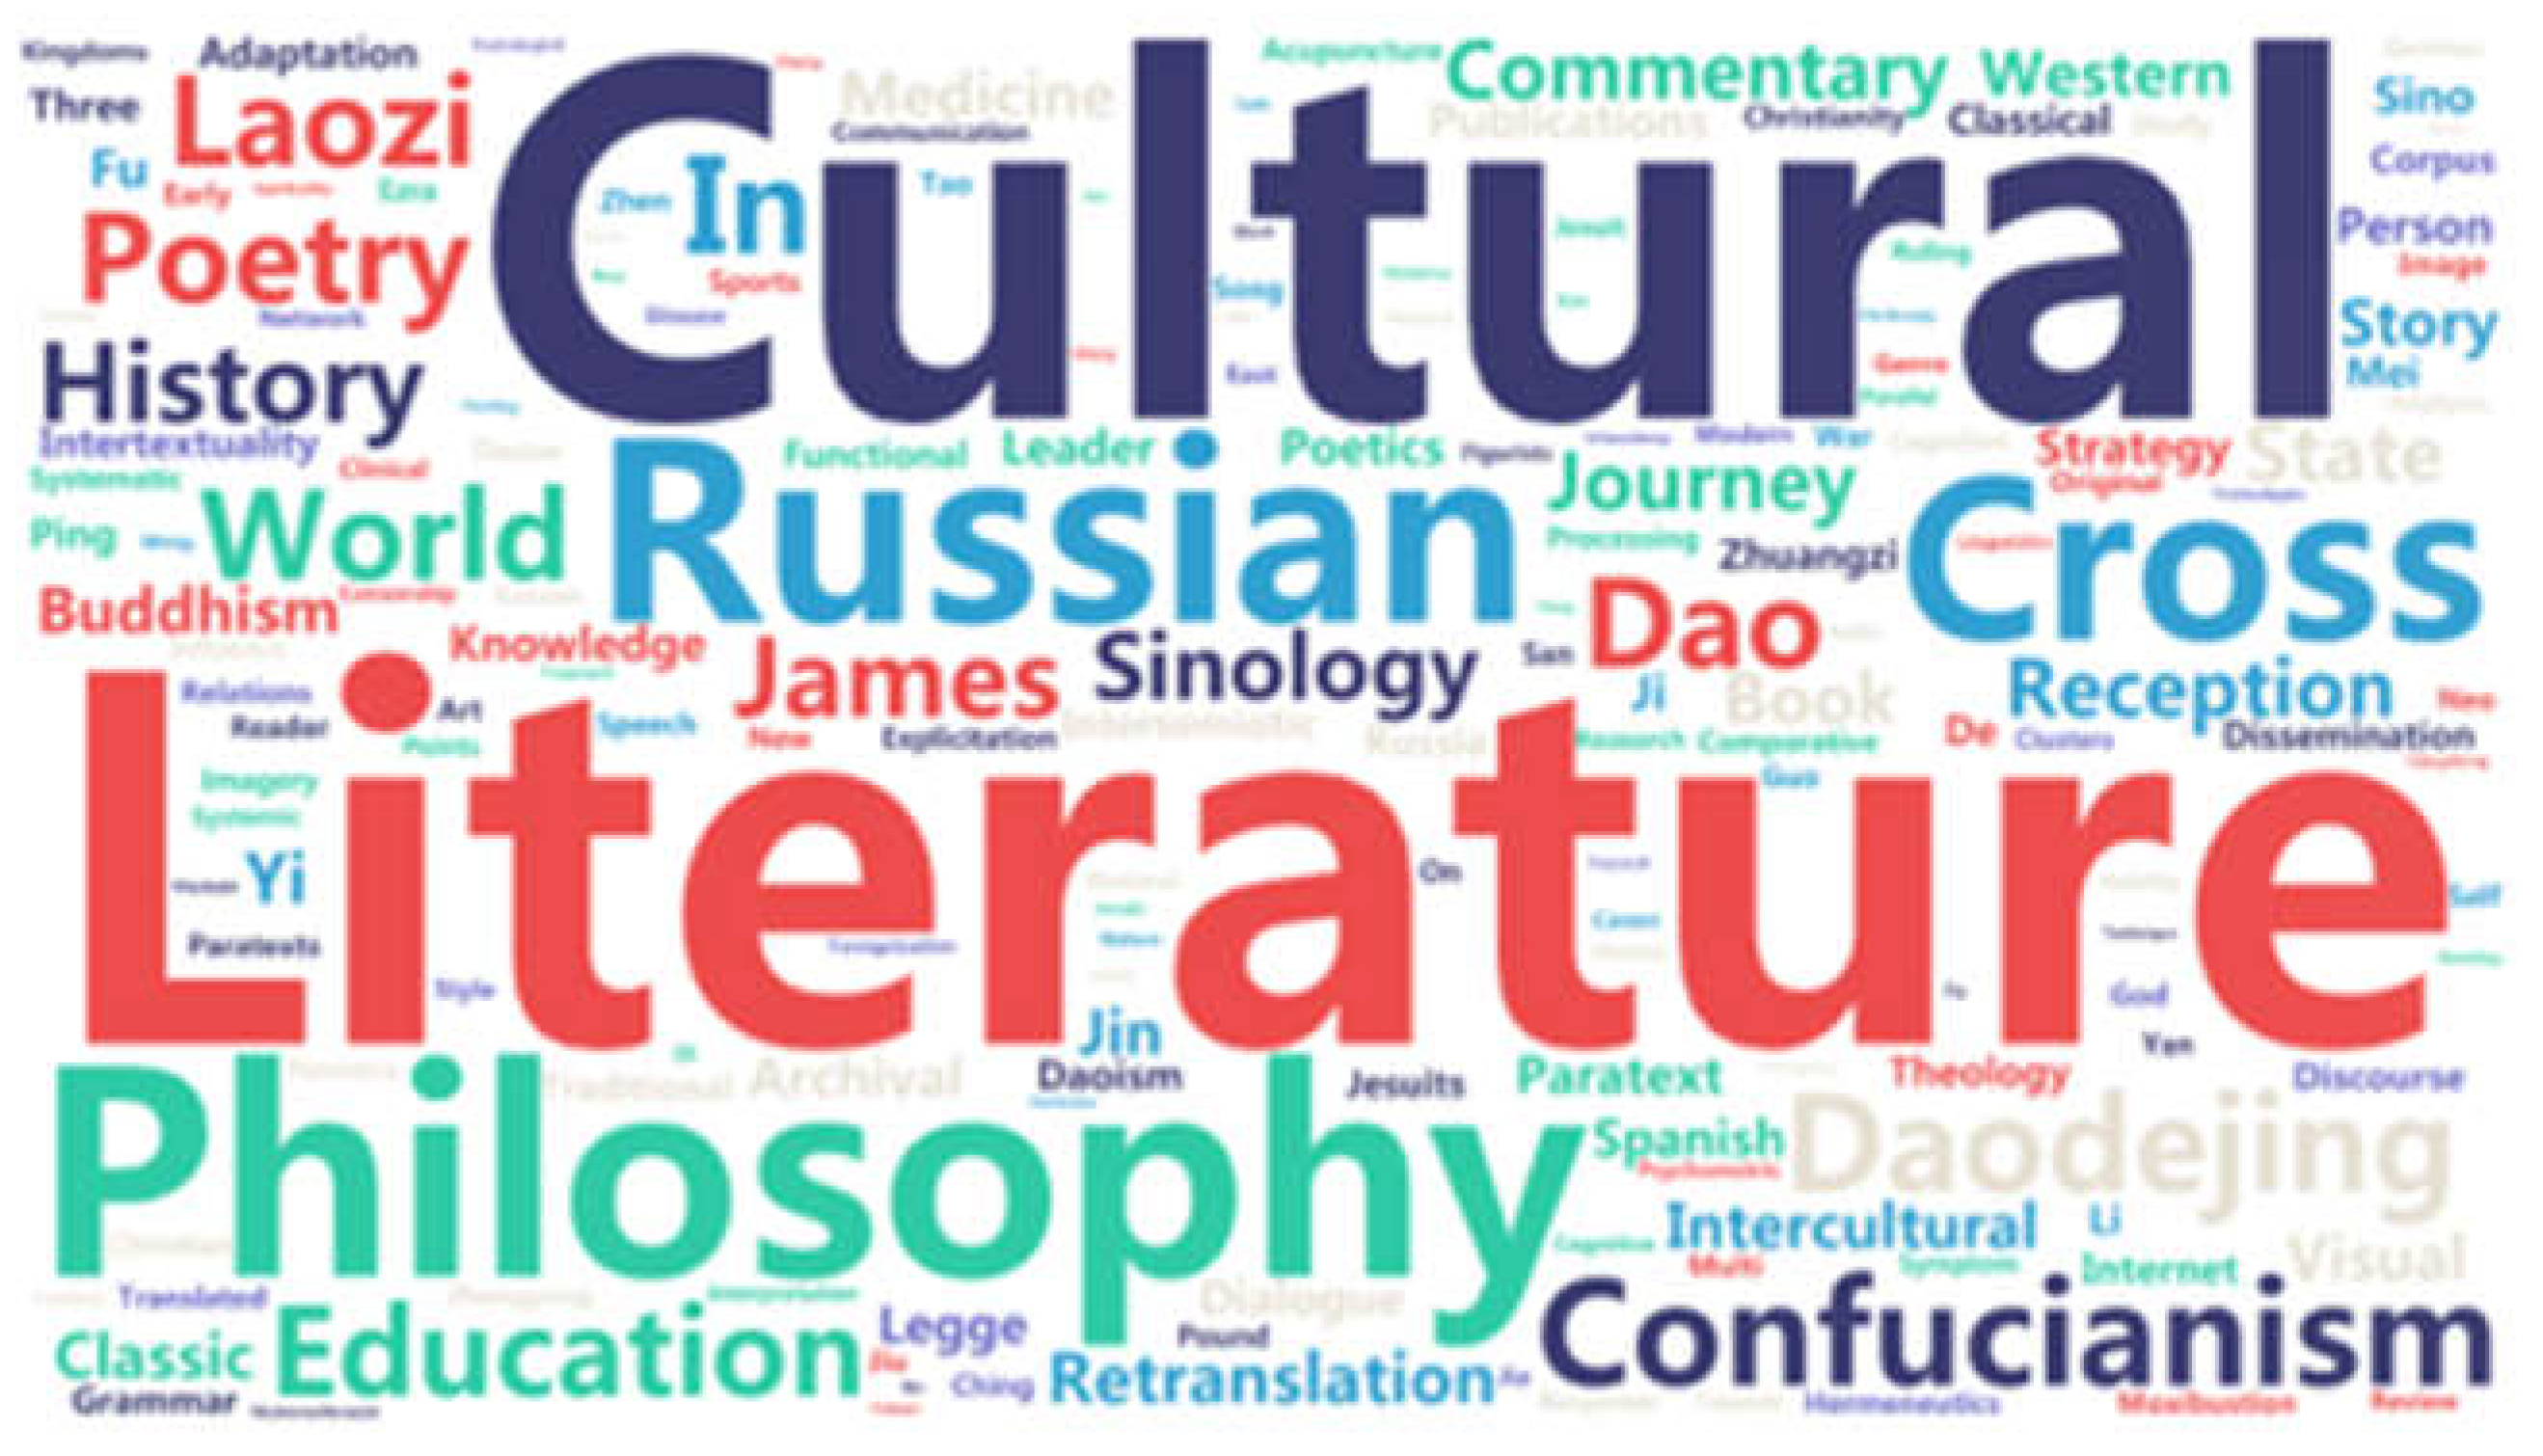
Figure 2.
Top 7 word frequency analysis bar charts.
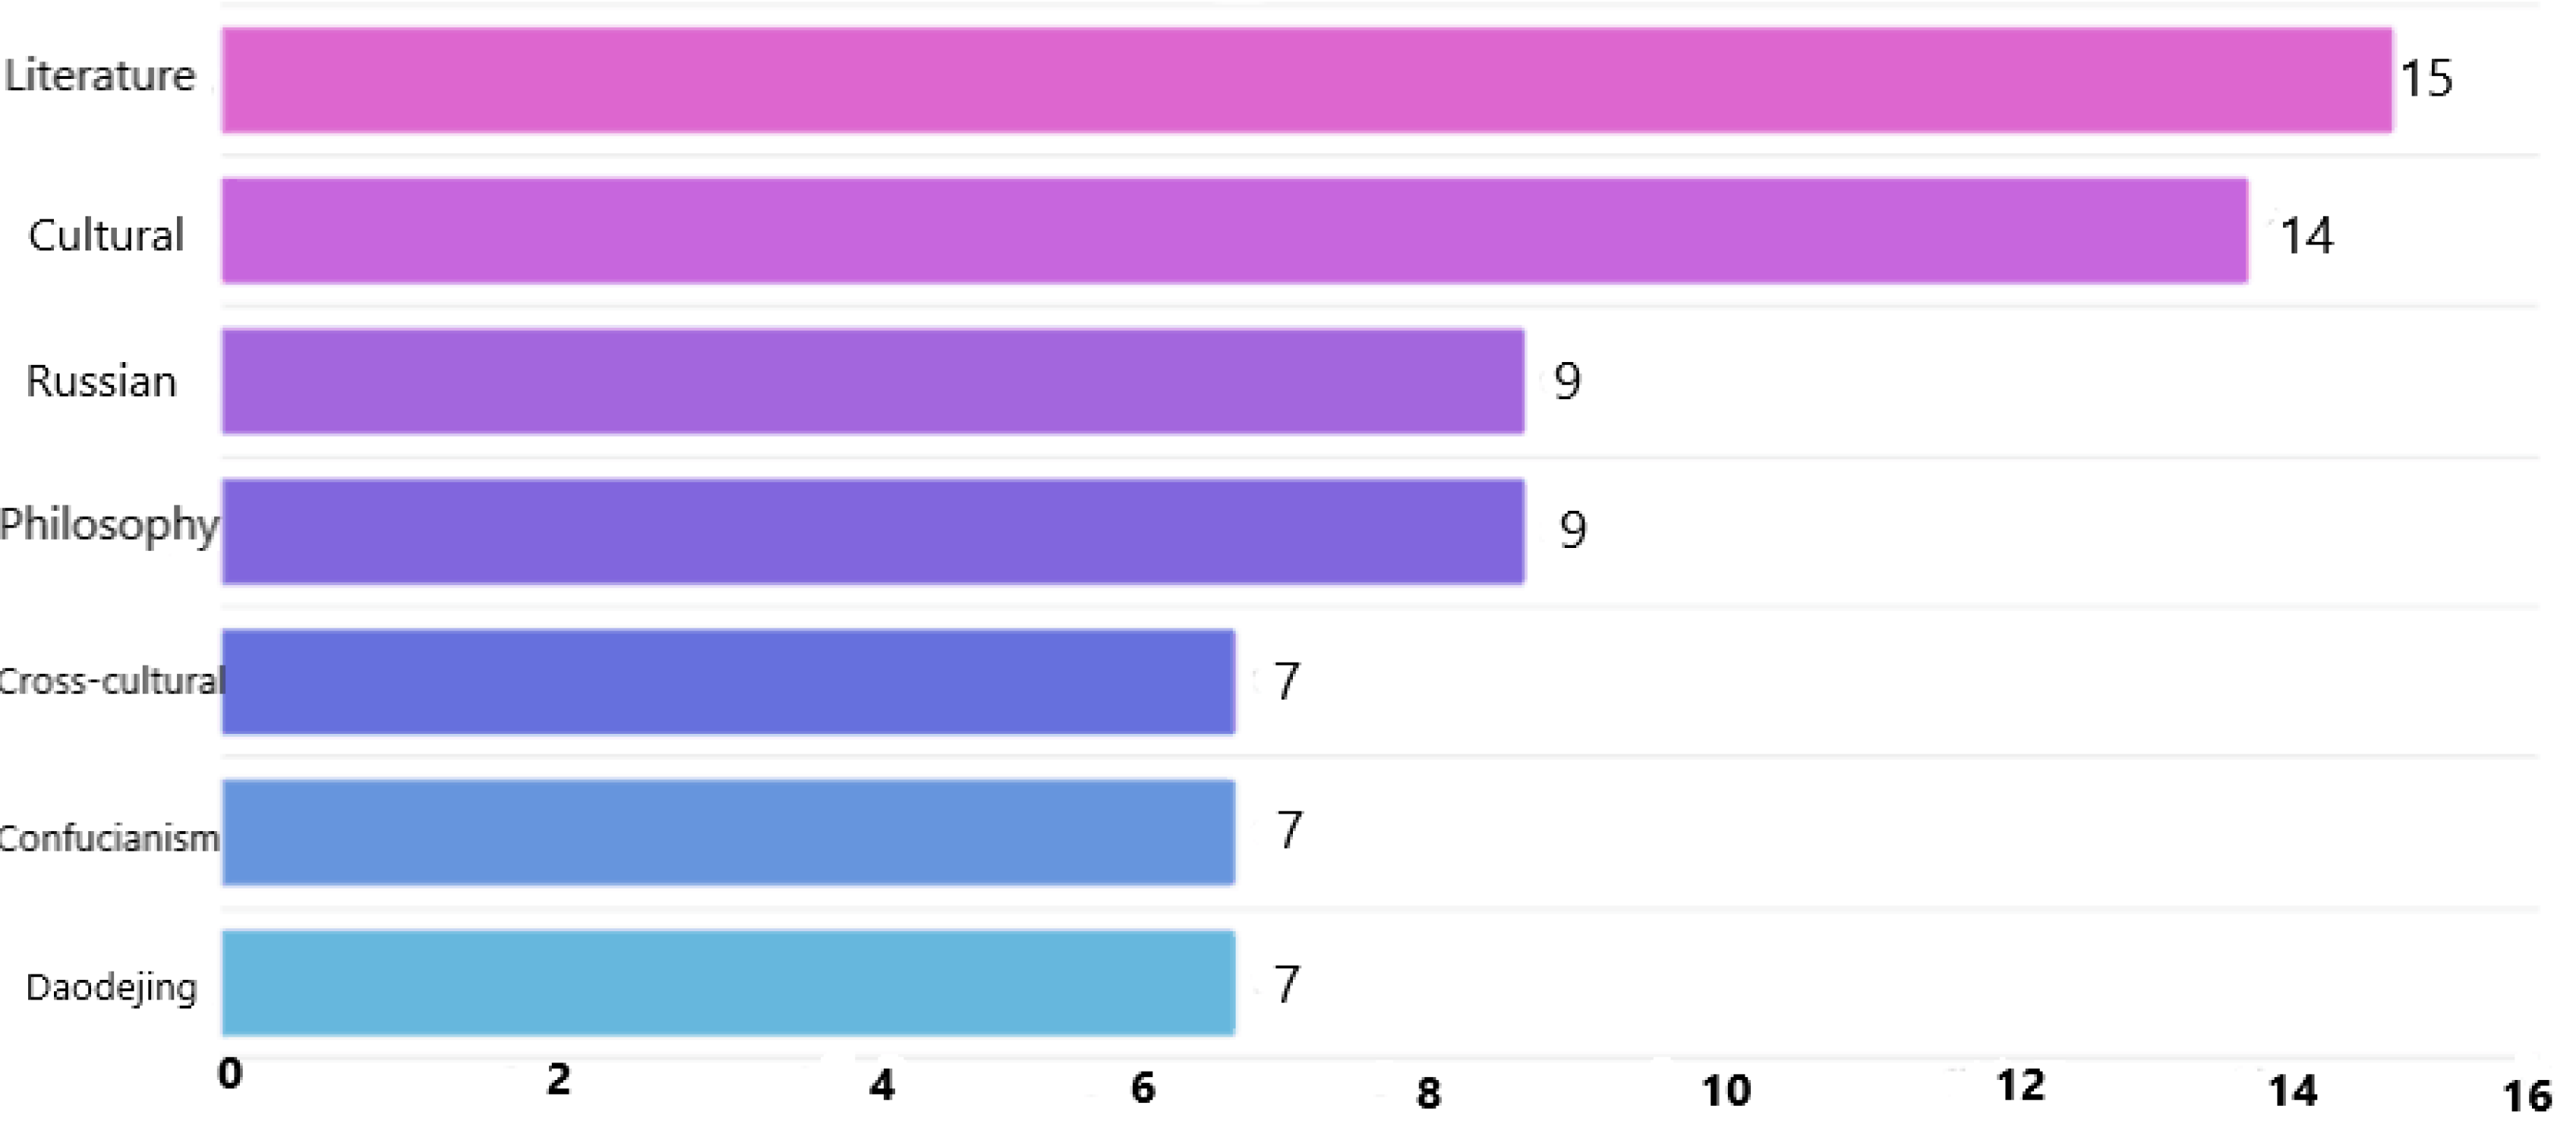
Figure 3.
K-means cluster analysis.
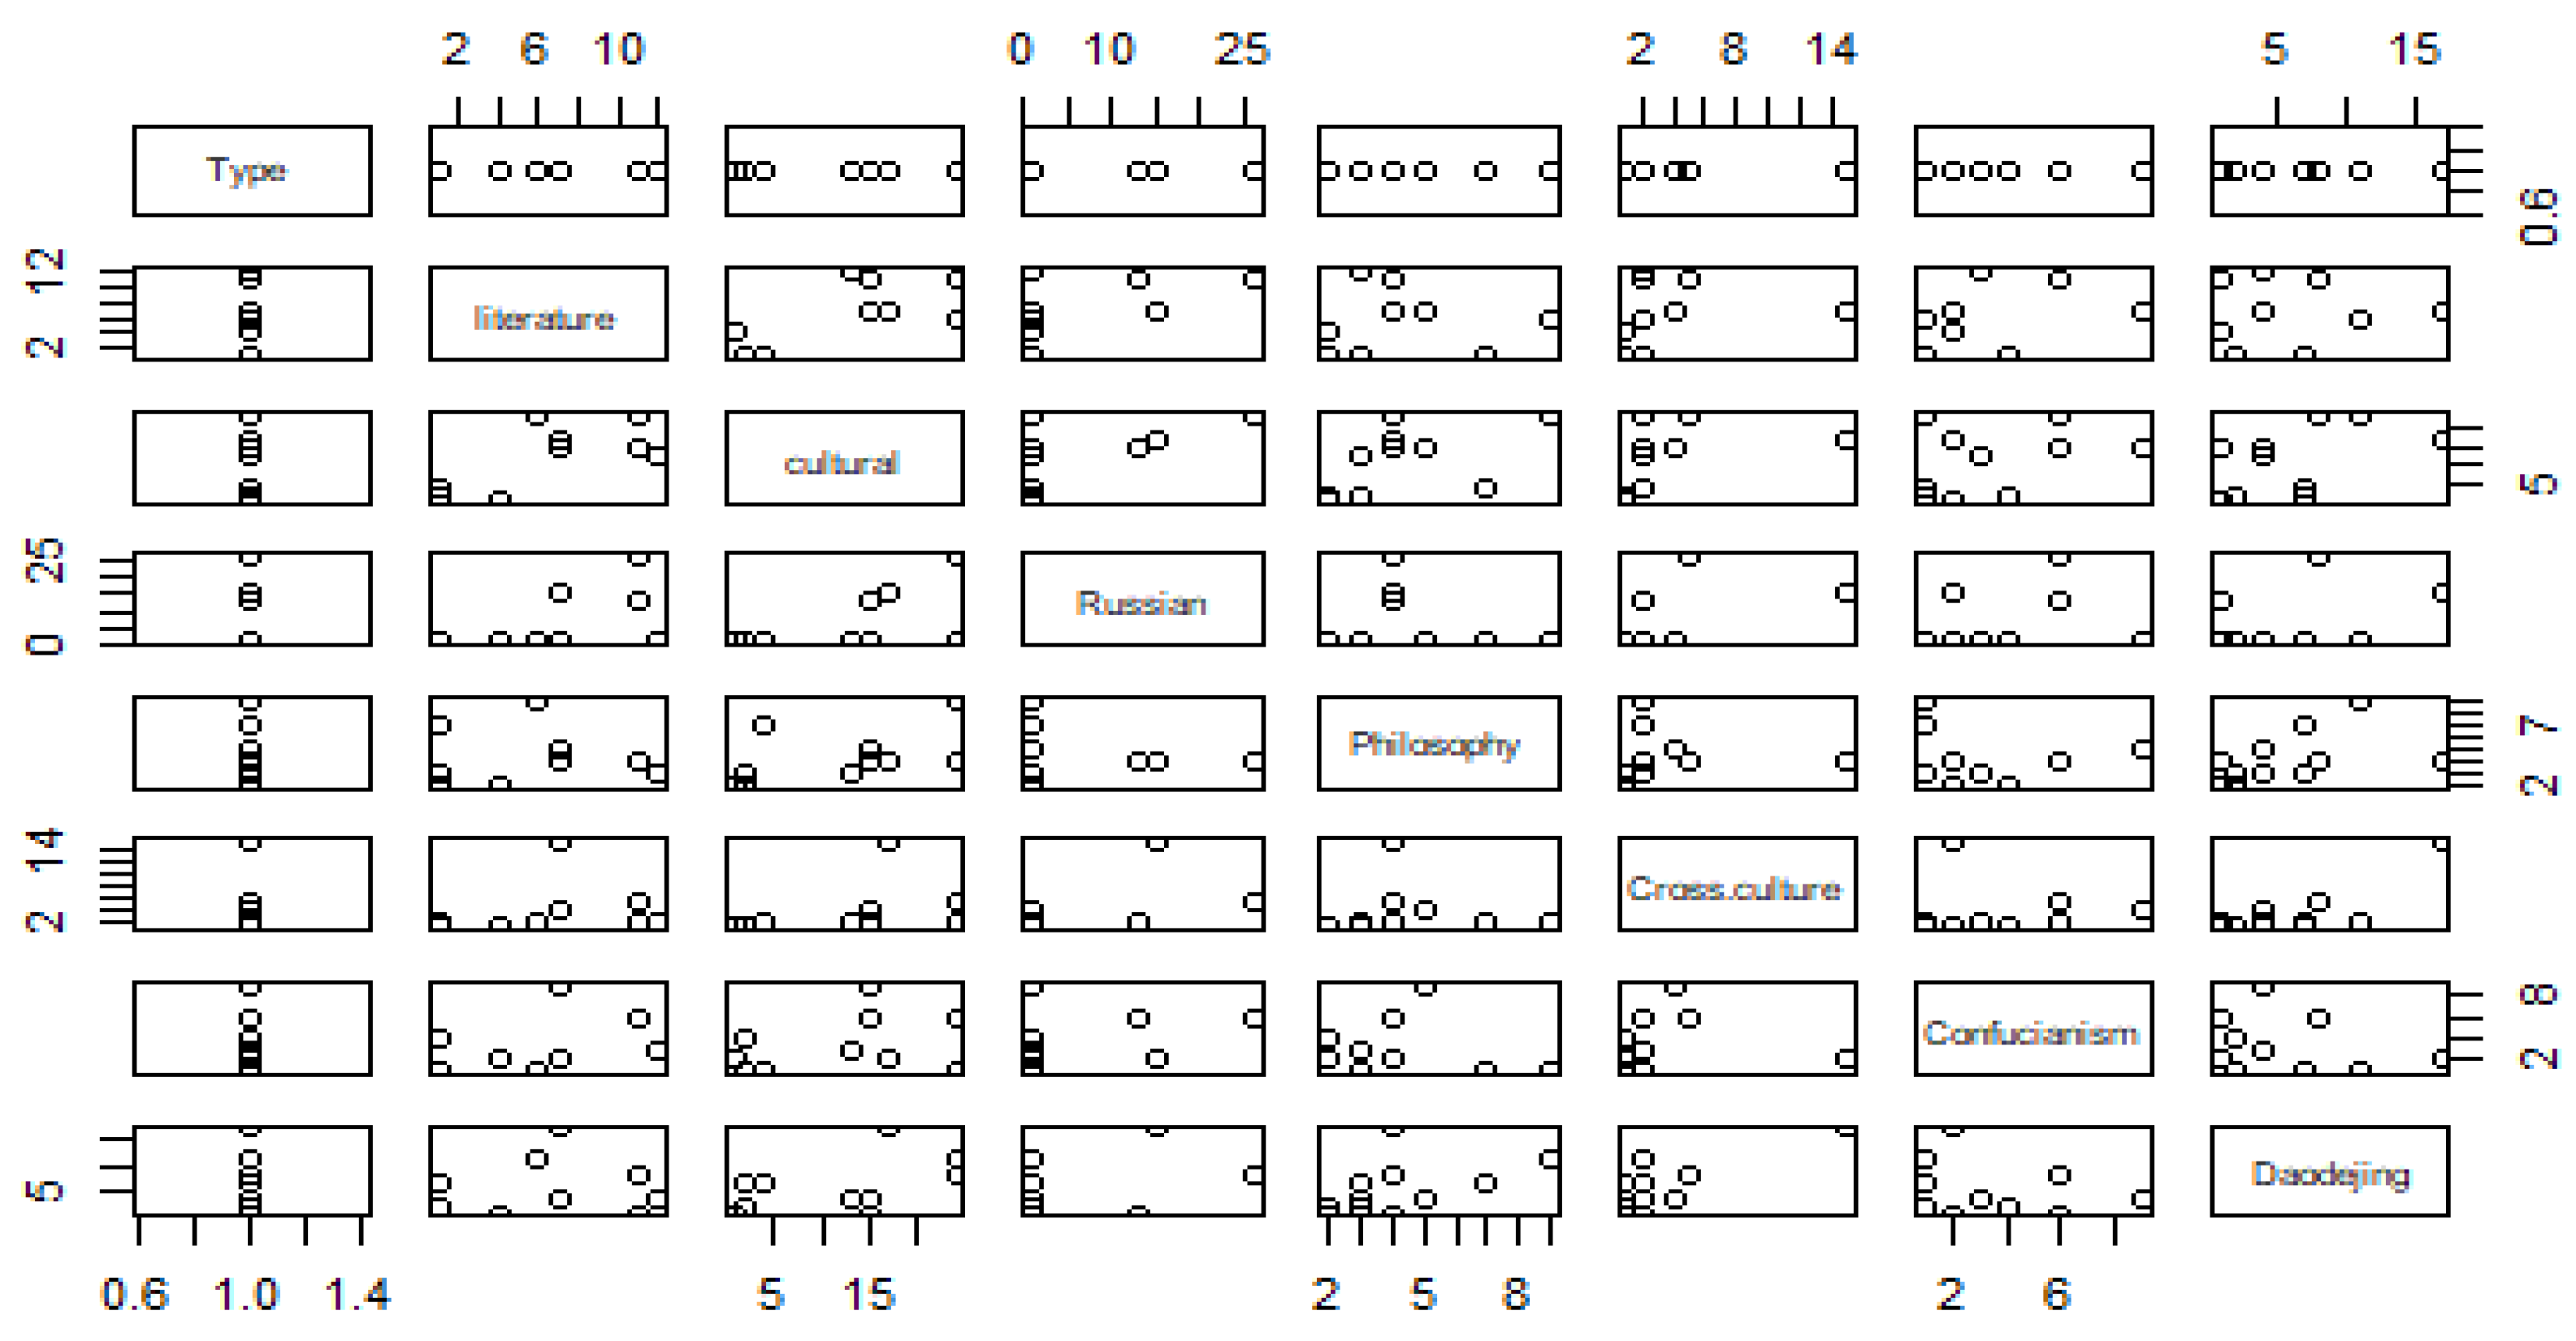
Figure 4.
Dataset of translation material (df value).
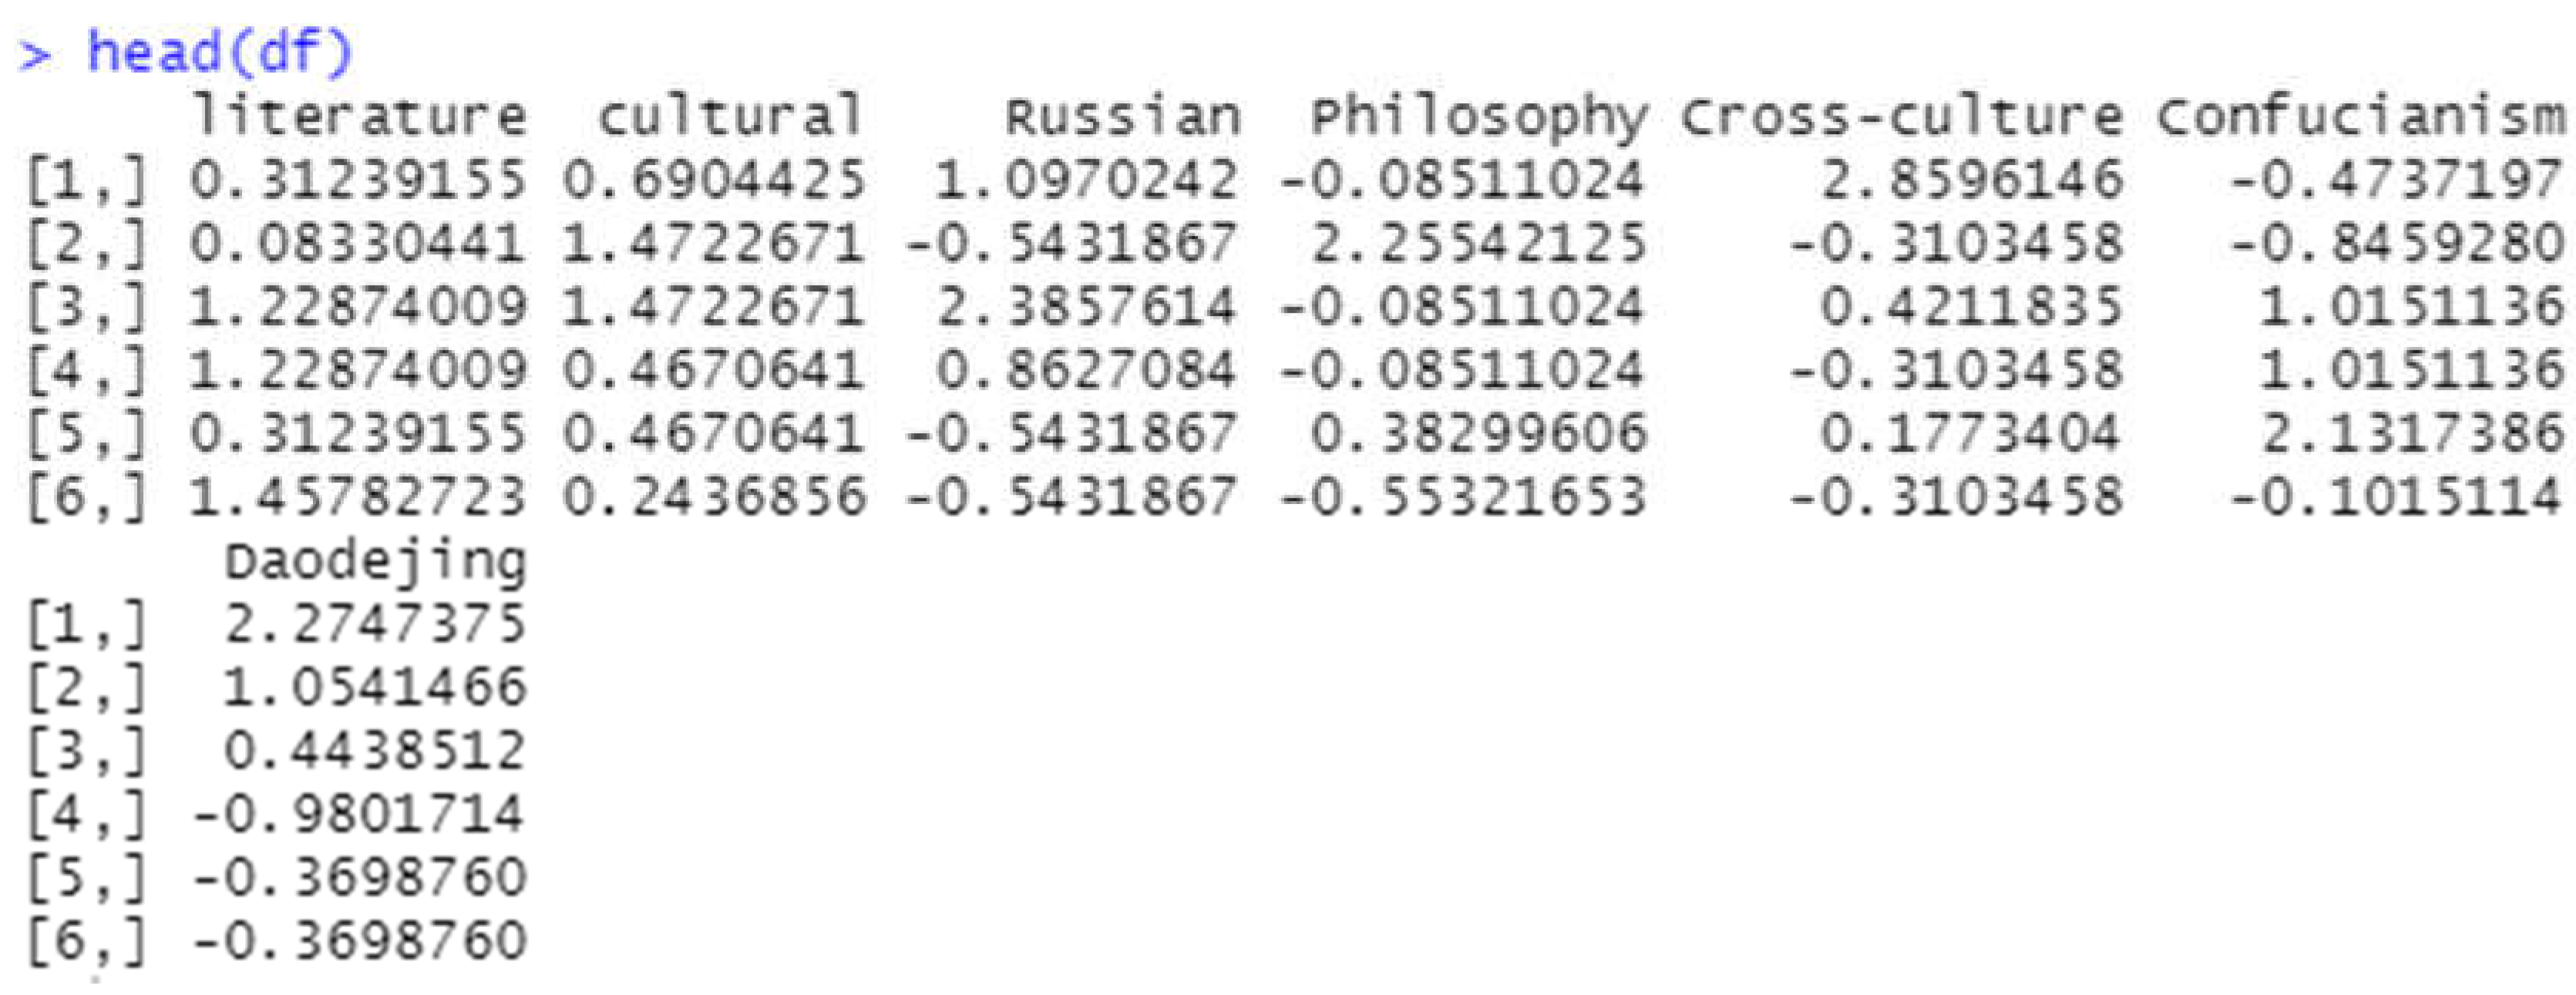
Figure 5.
Cluster of literature & culture when center =2 on K-means.
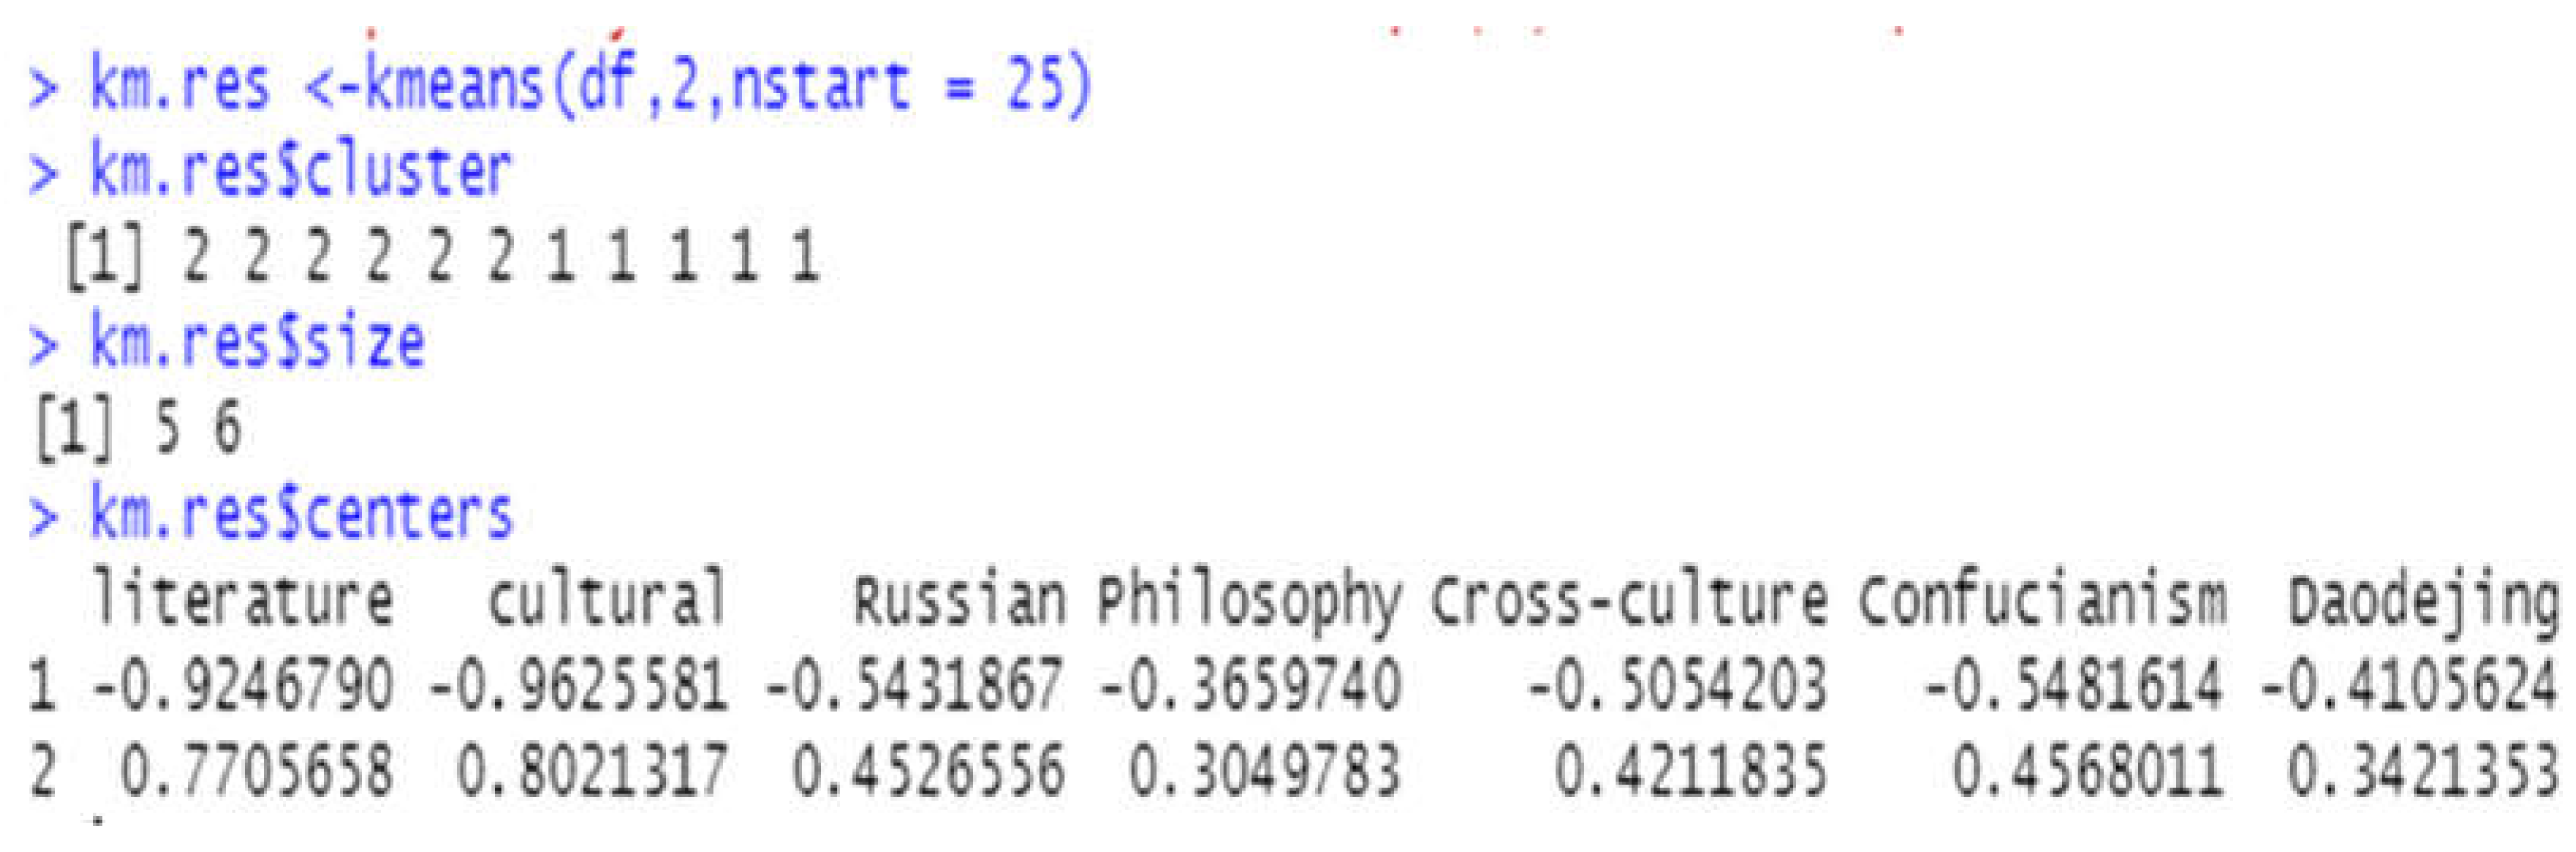
Figure 6.
Literature and cultural sample points when Center=2.
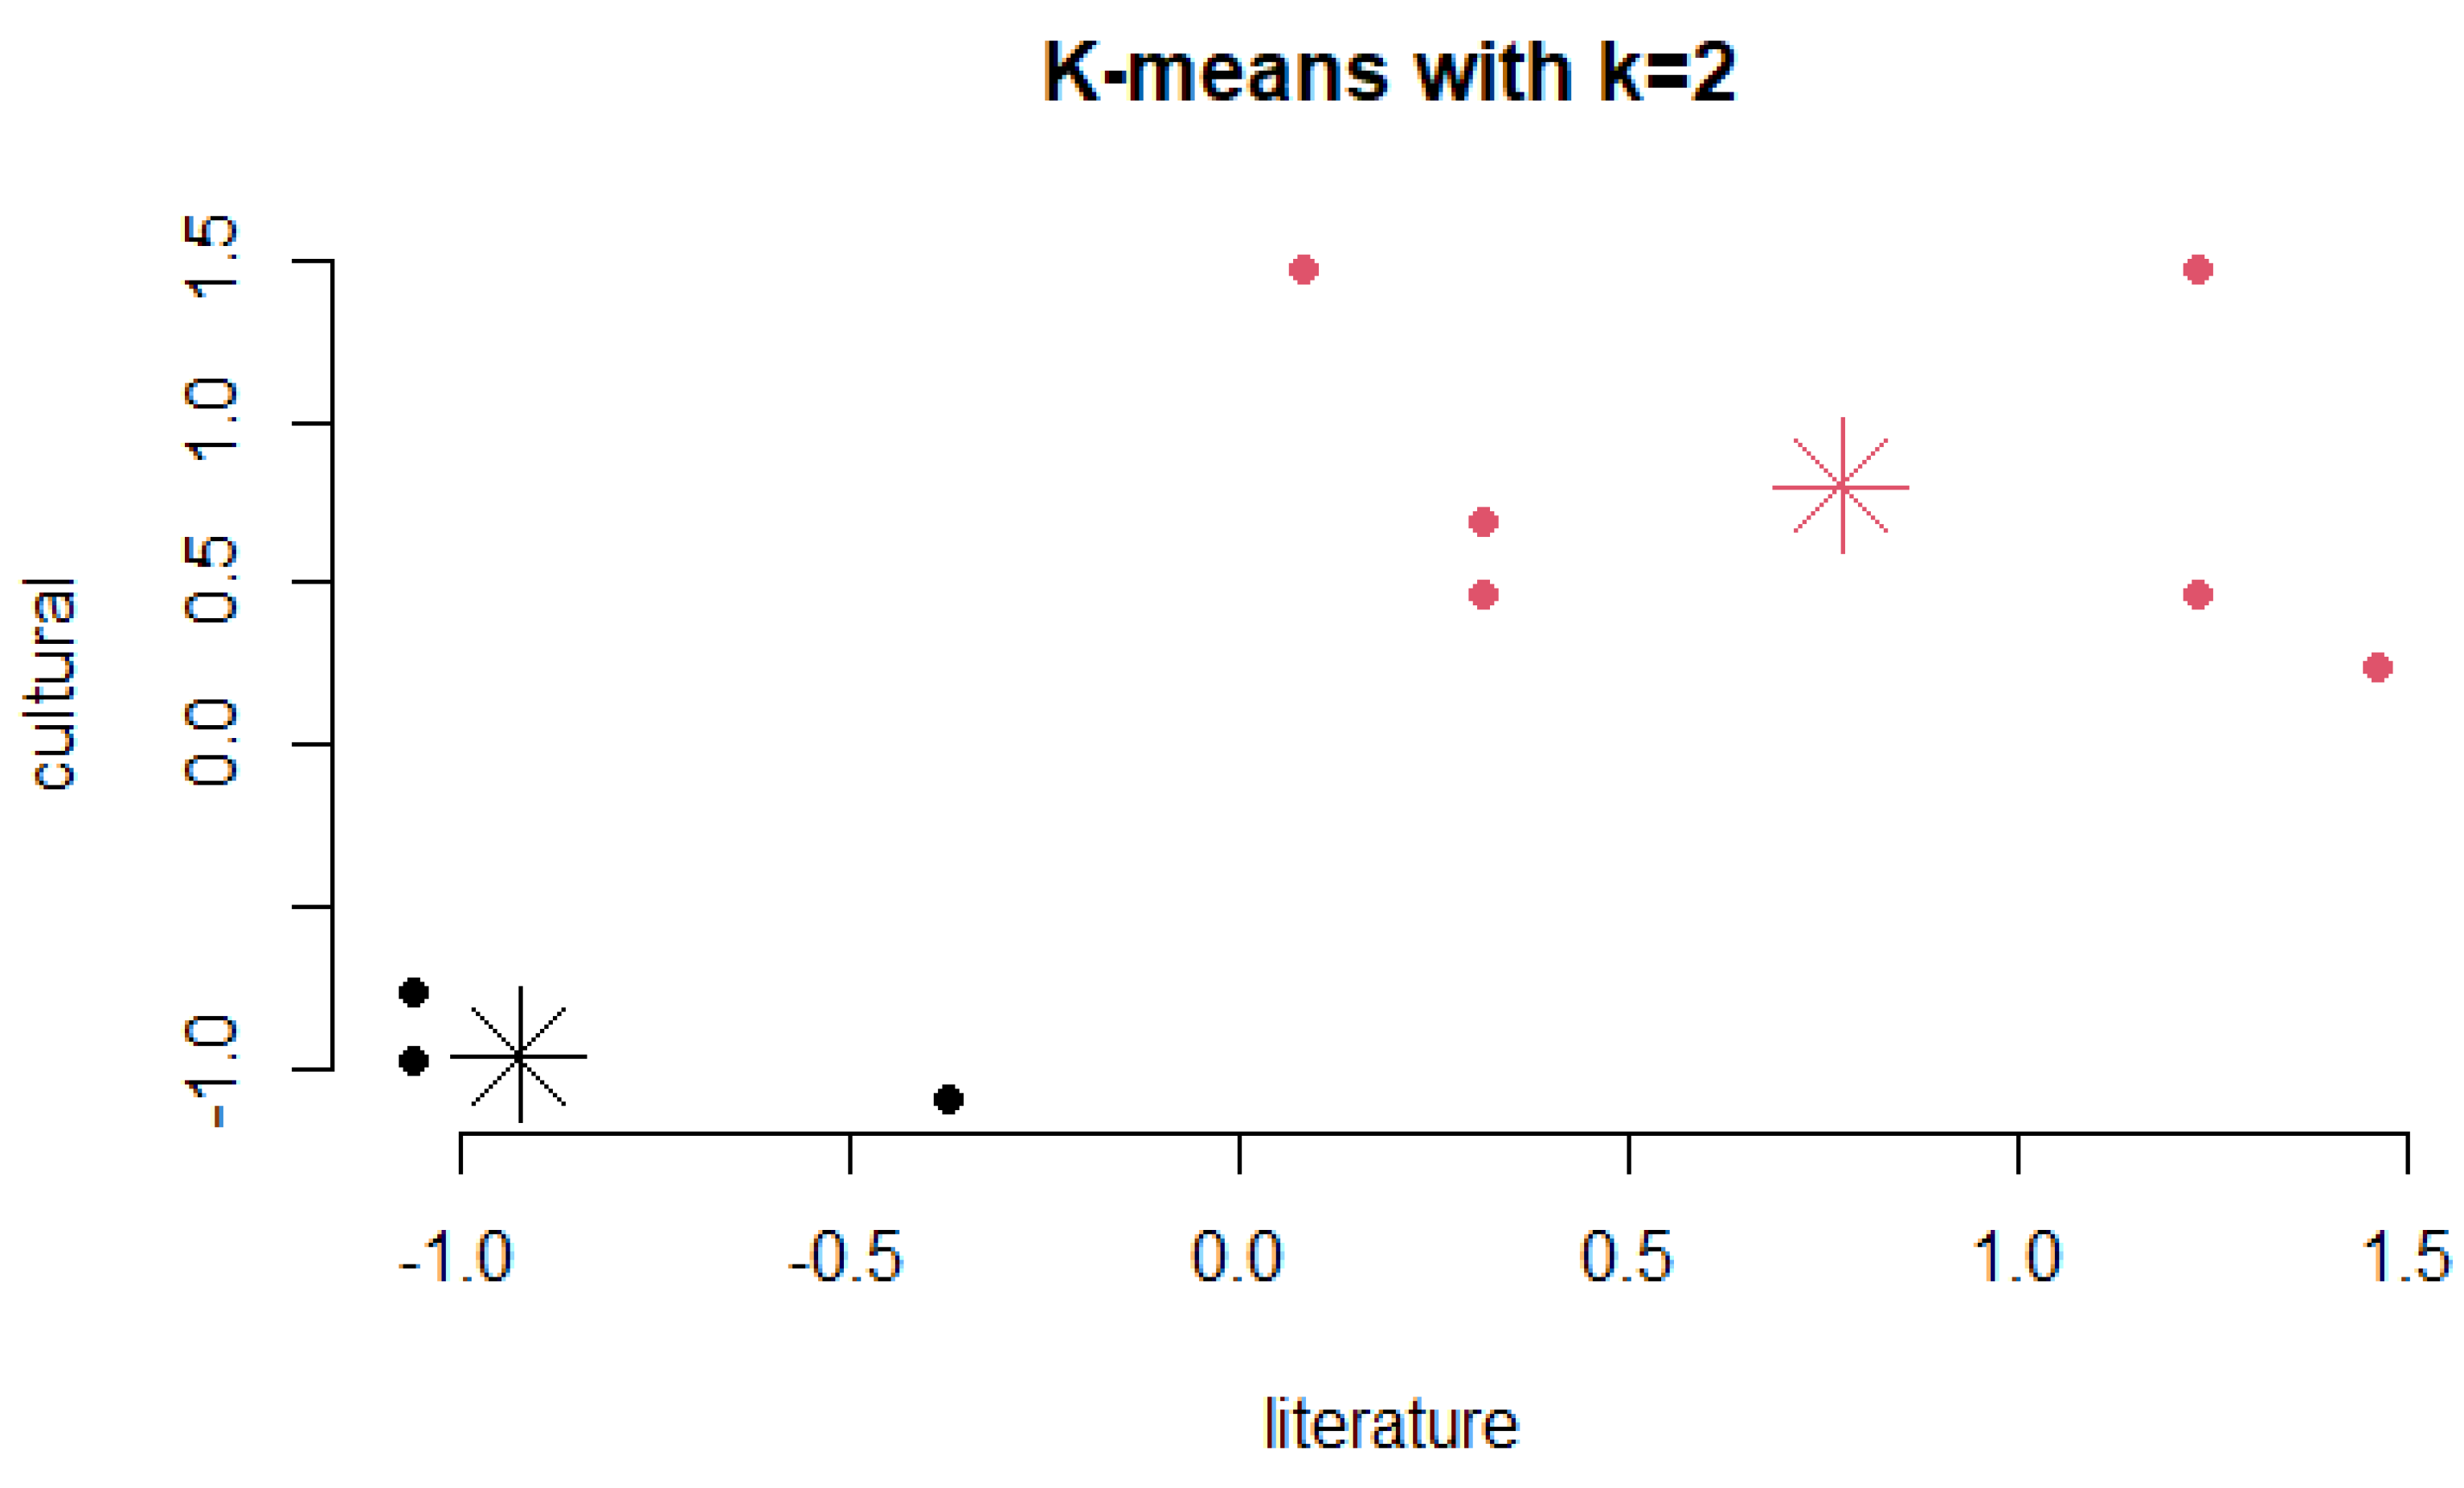
Figure 7.
Literature and cultural sample points when Center=4.
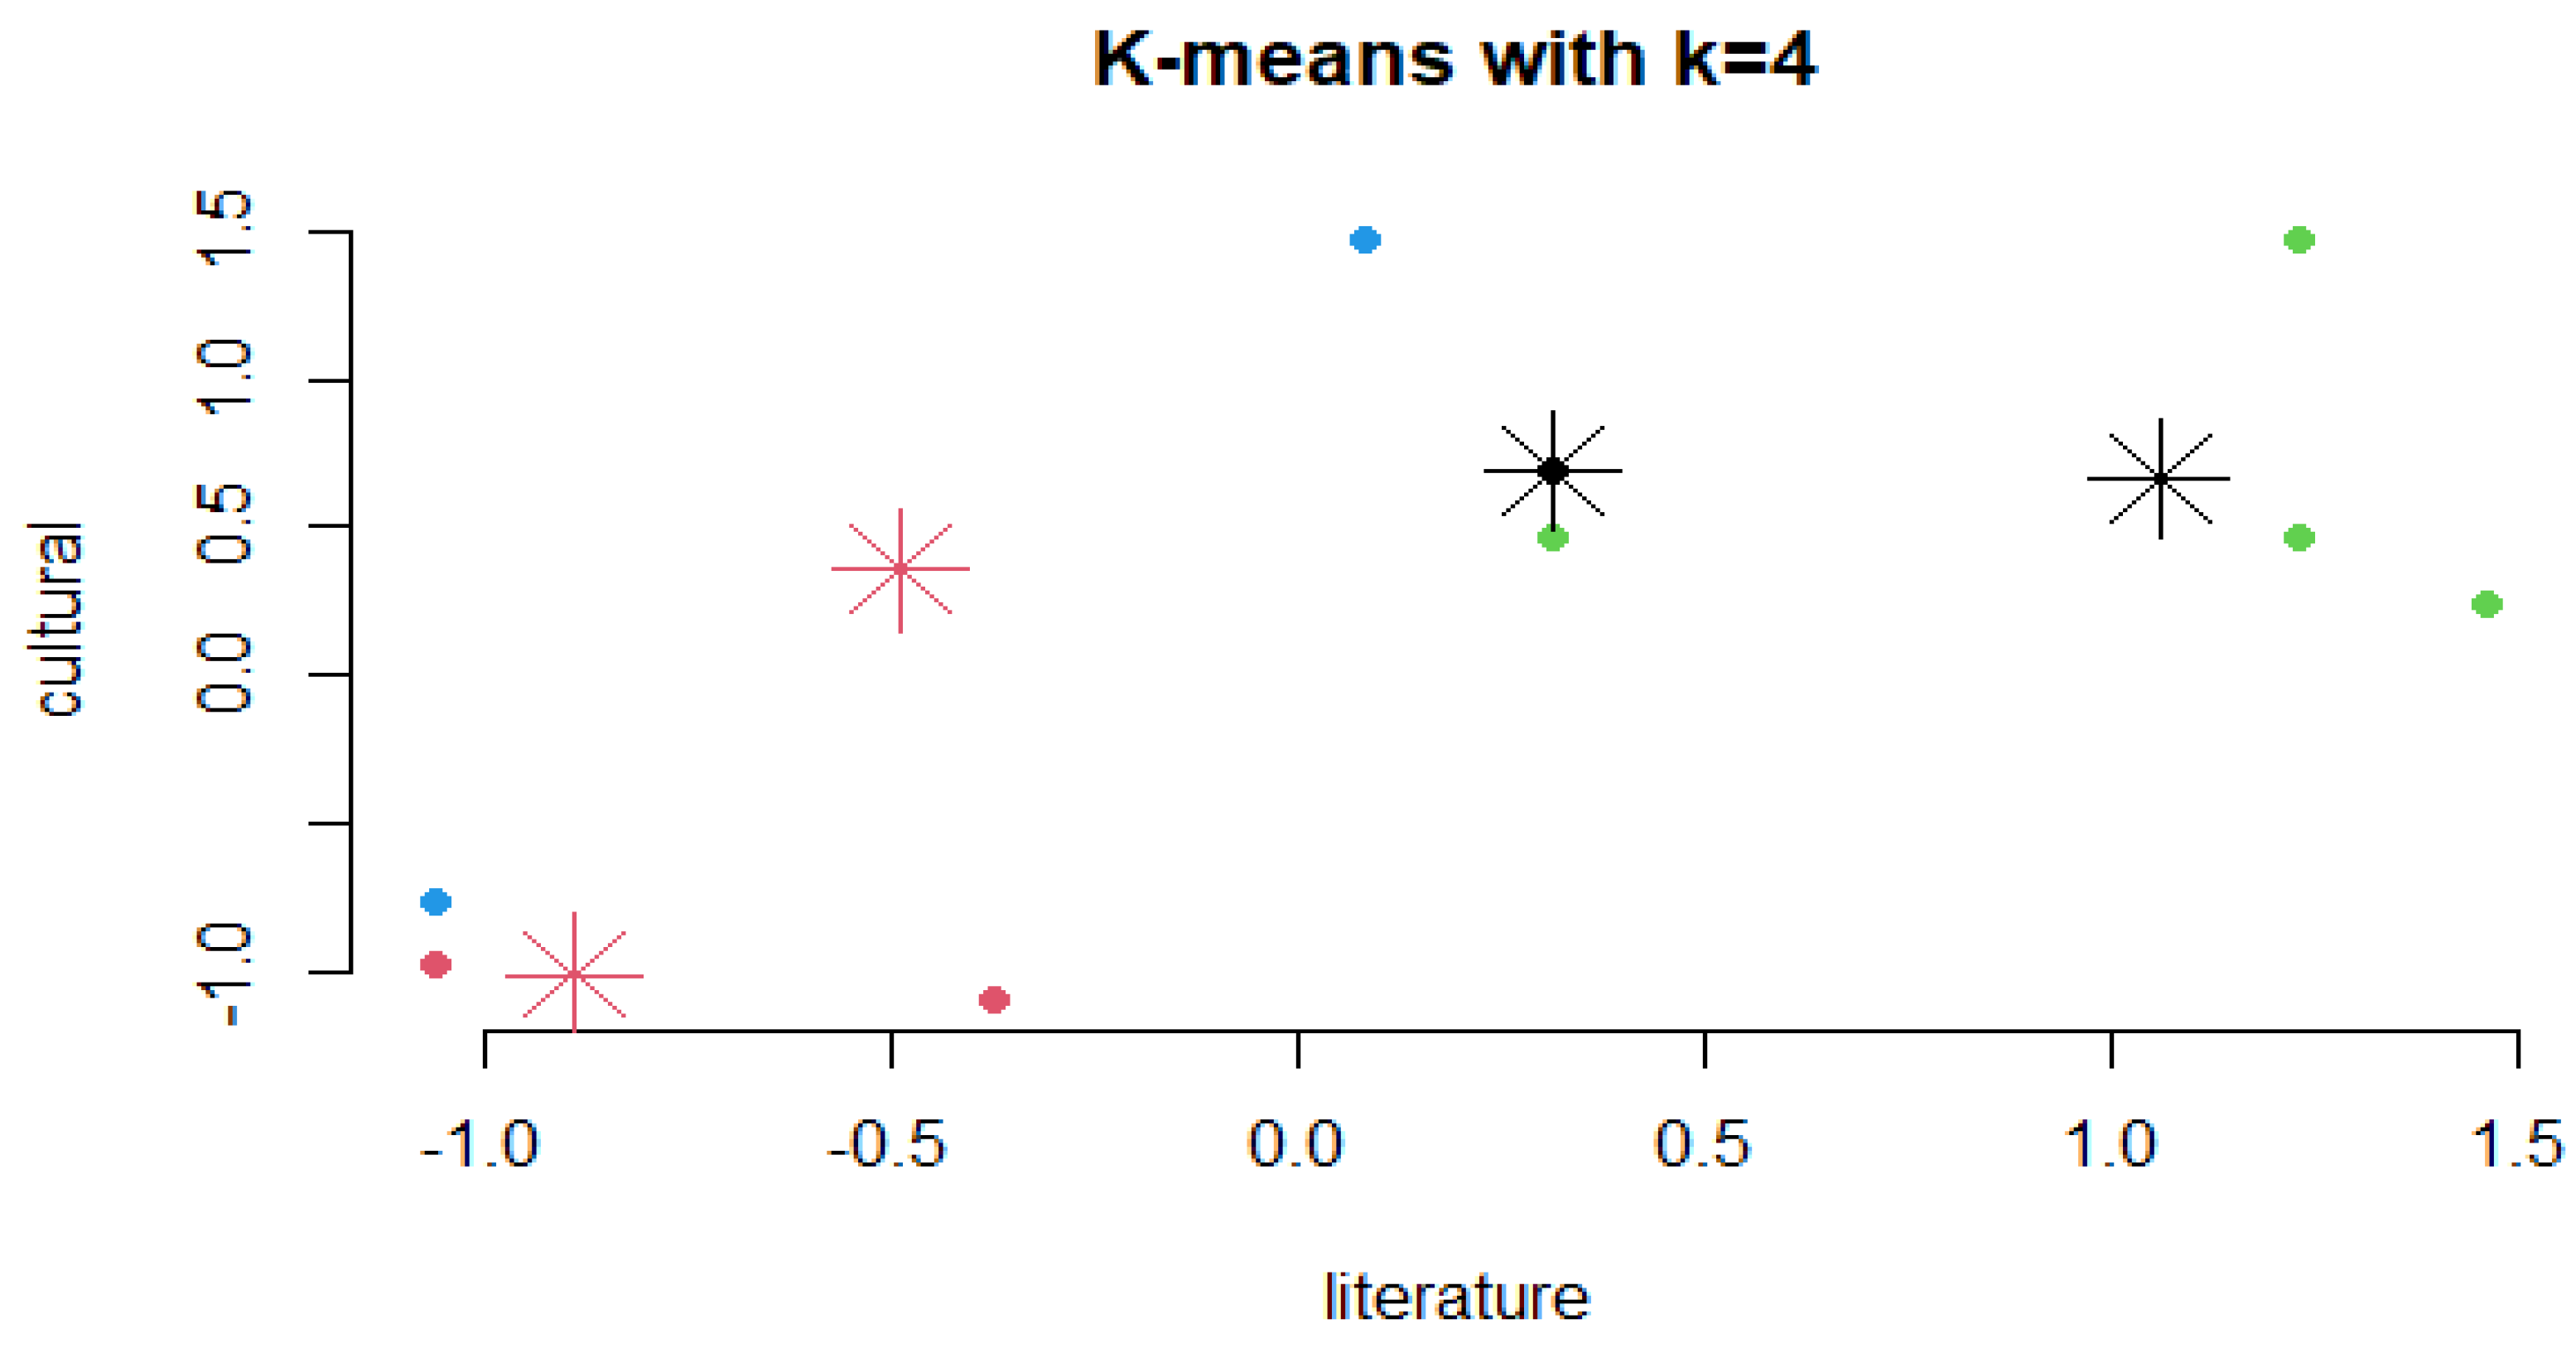
Figure 8.
Cluster diagram of culture & literature.
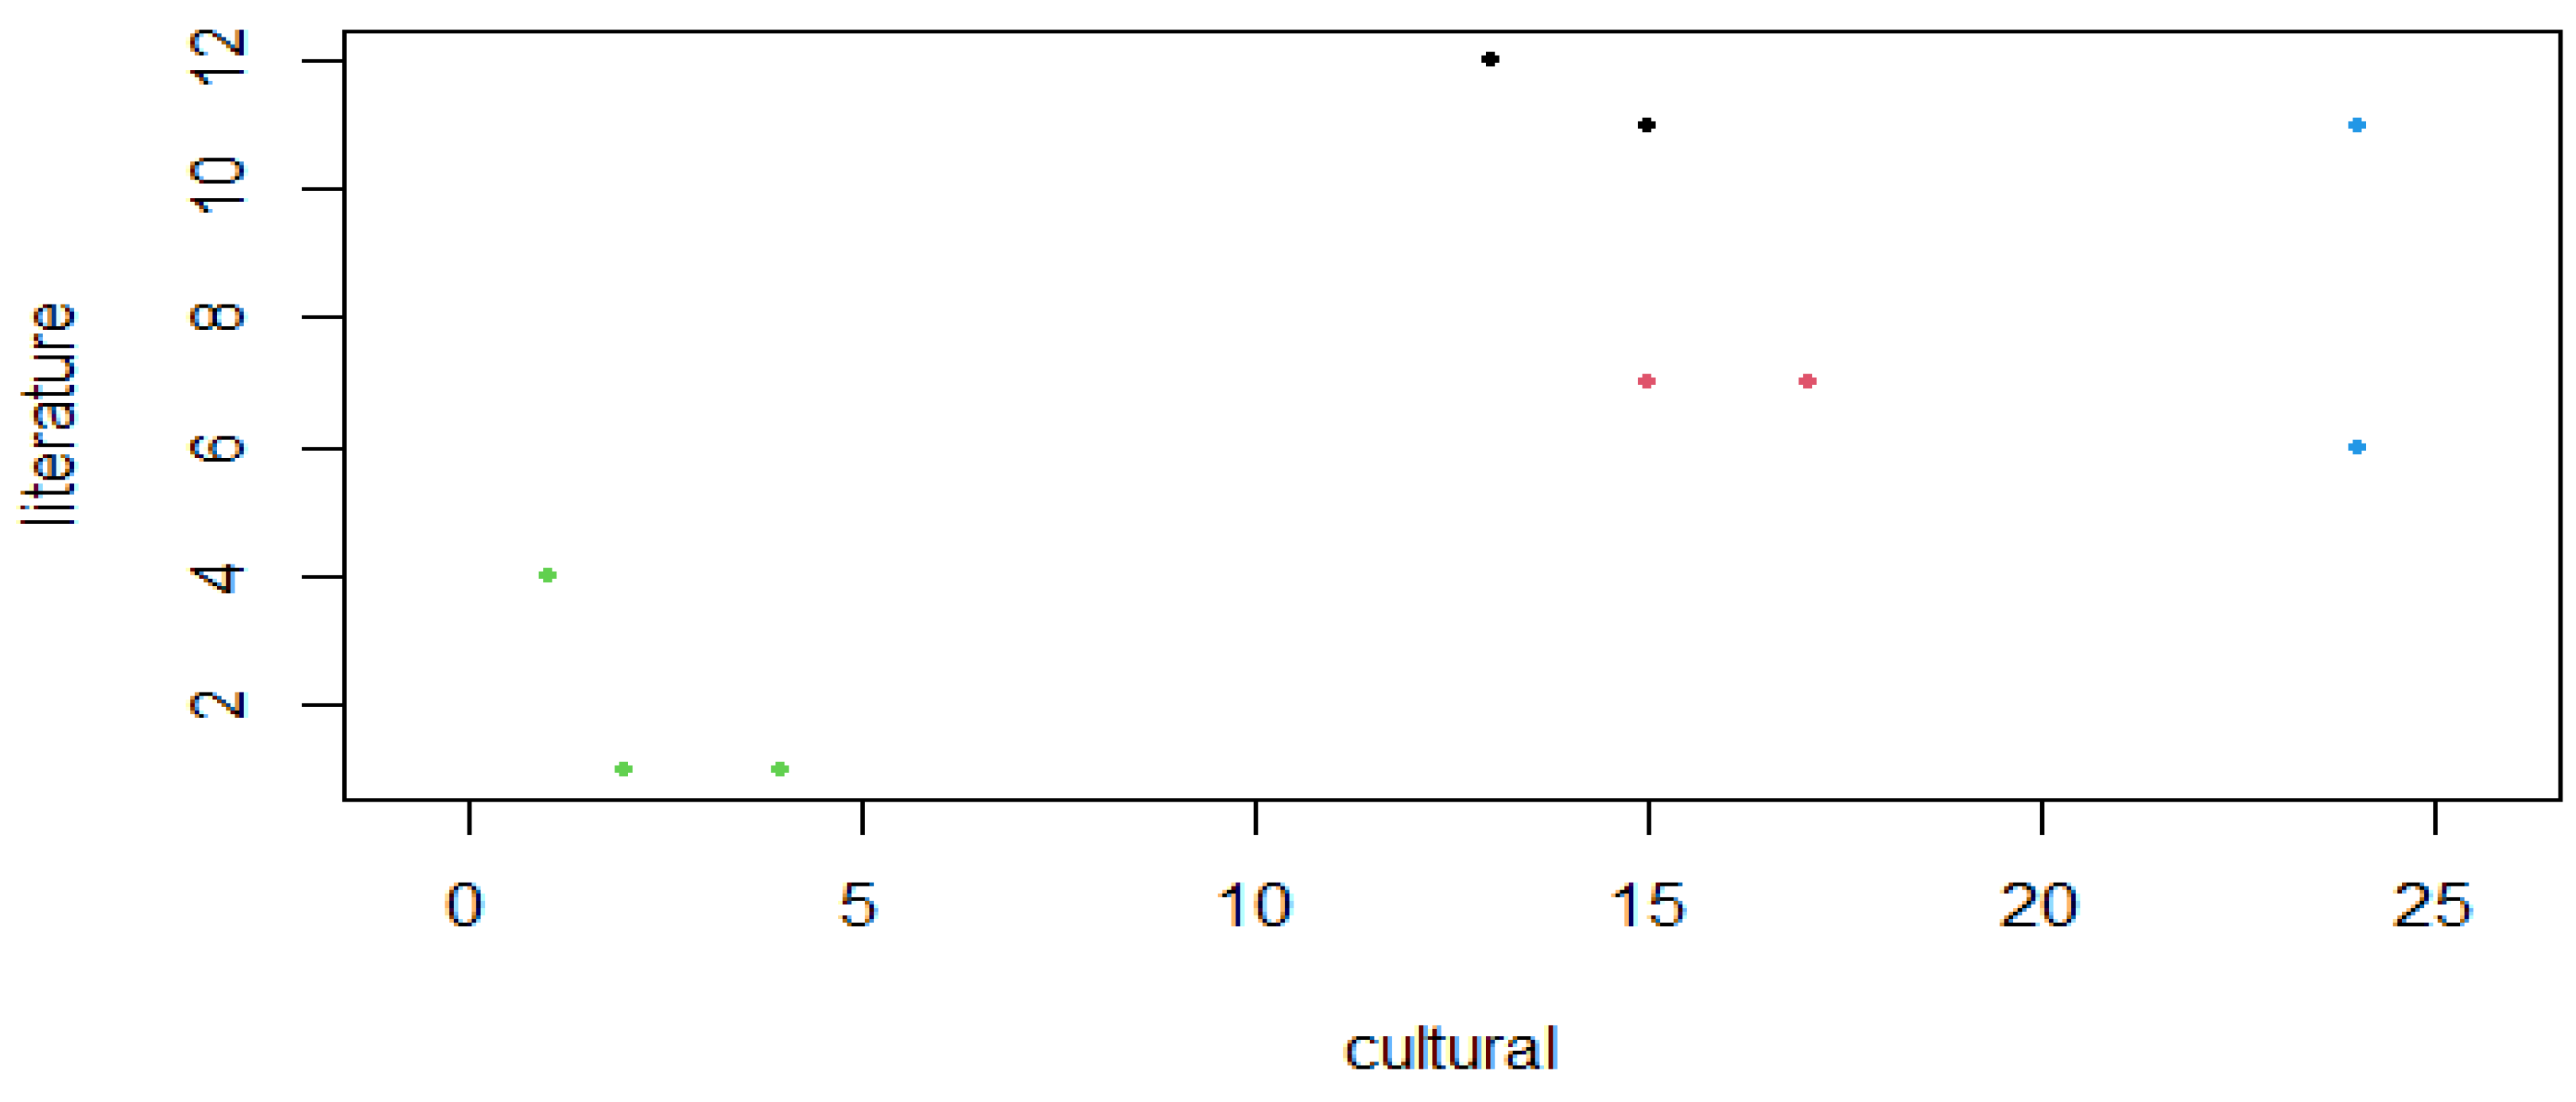
Figure 9.
Cluster diagram of the 6 elements.
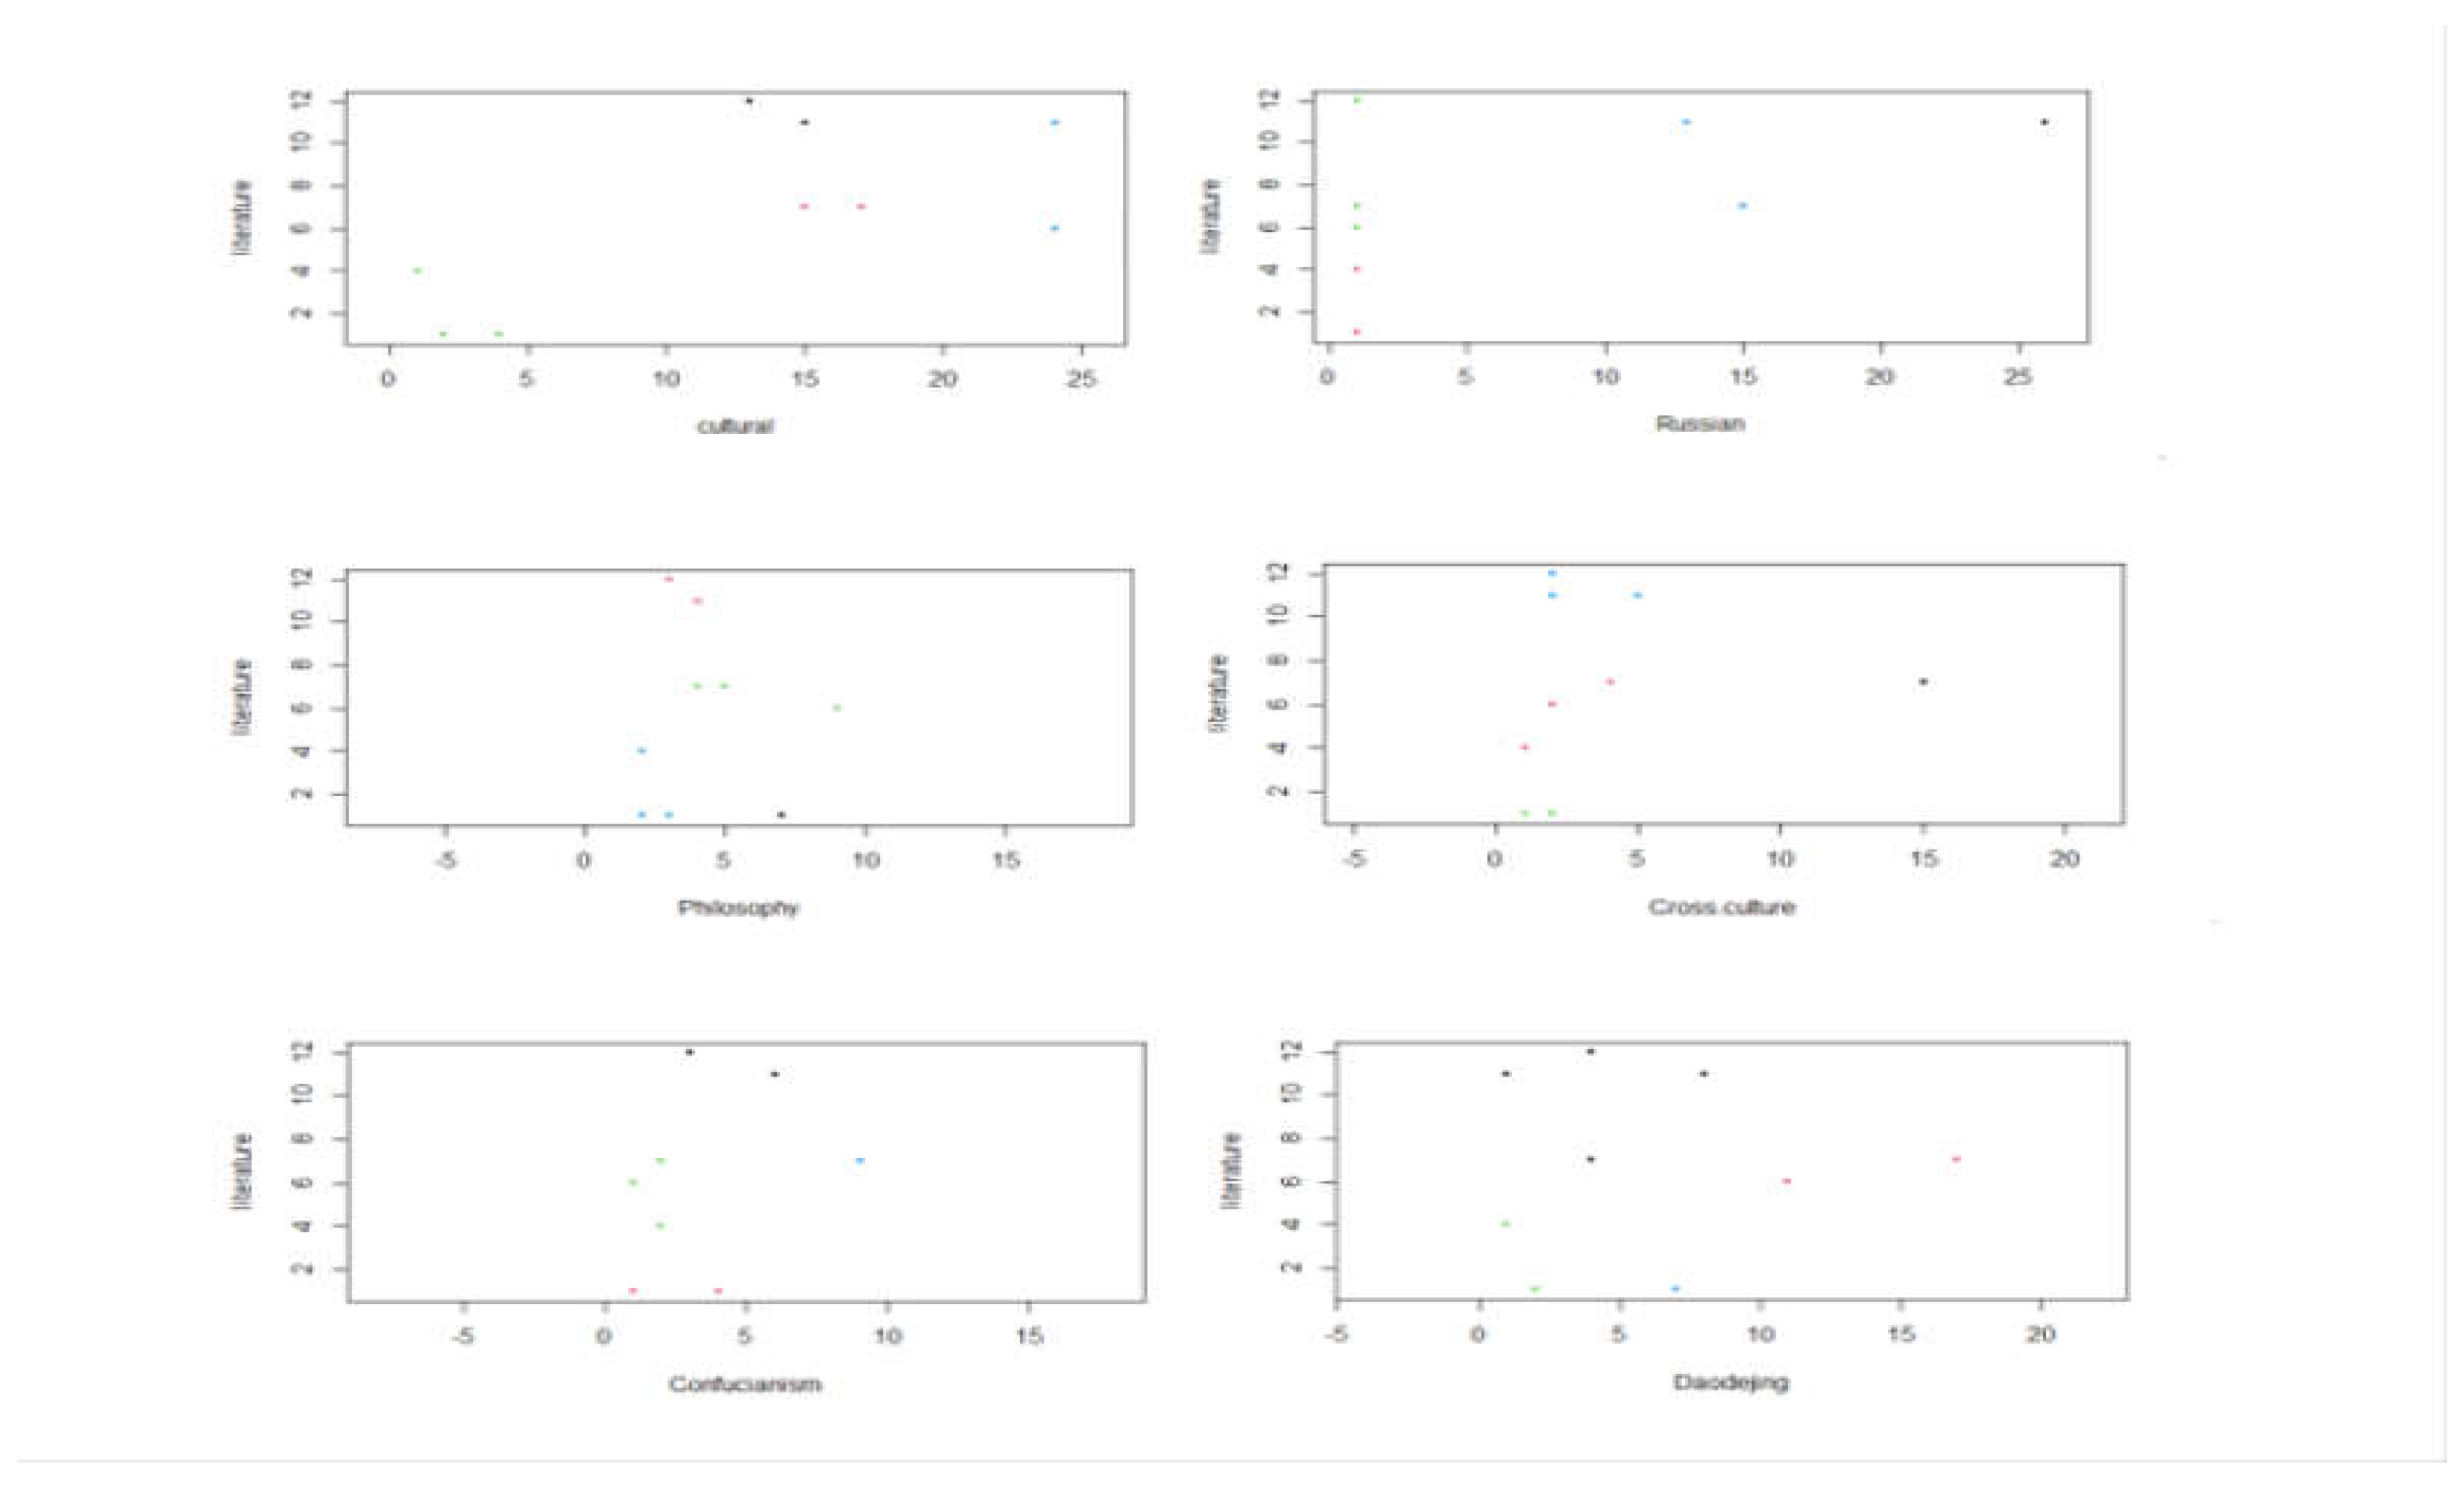
Figure 10.
Heatmap of dataoneone - data from two countries.

Figure 11.
High-frequency words in translation and dissemination research.
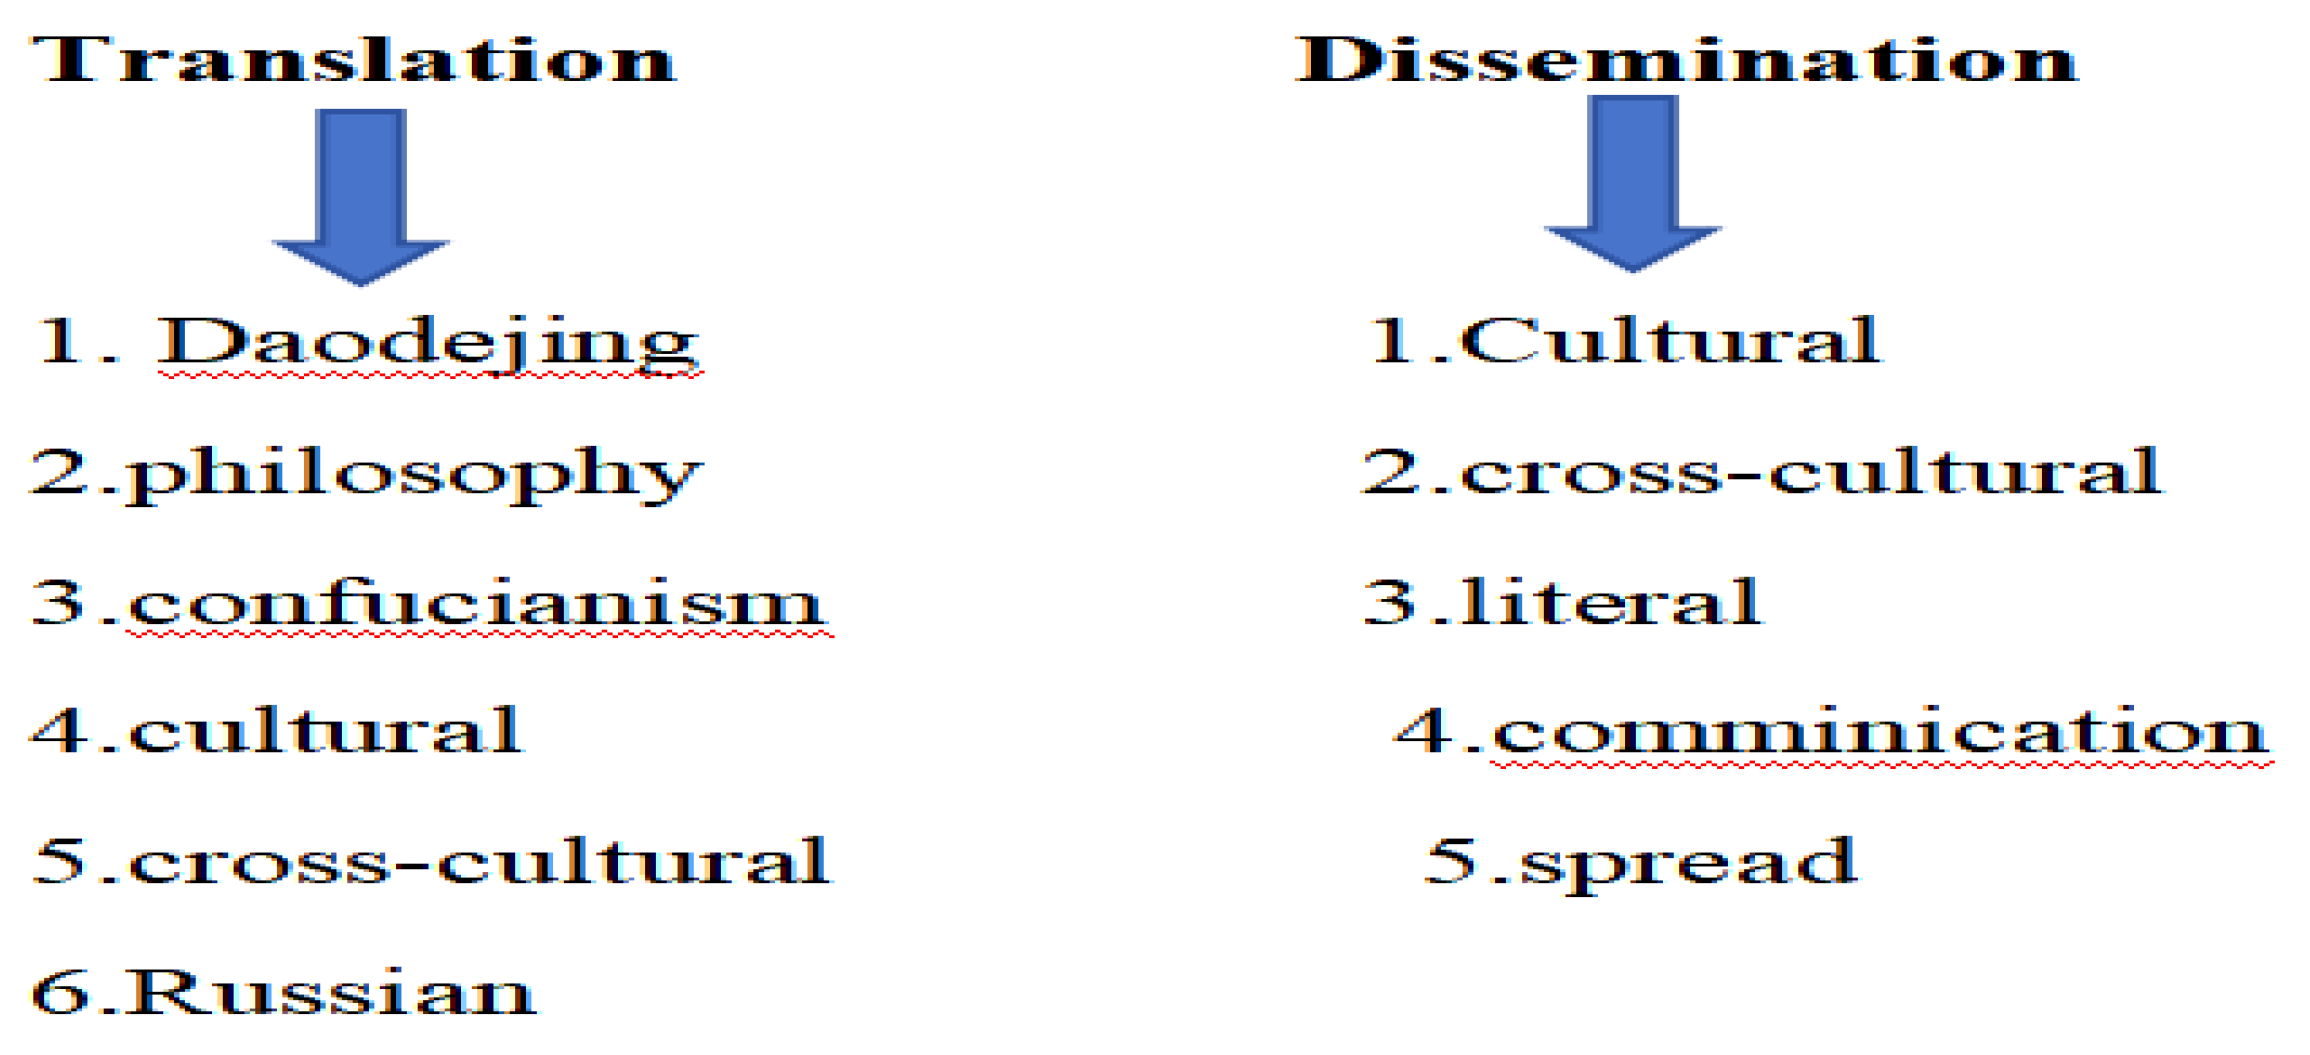

Table 1.
Cluster analysis dataset.
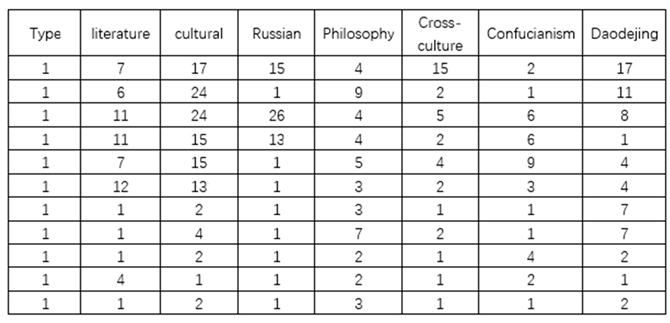 |
Table 2.
Document title (2015--2022).
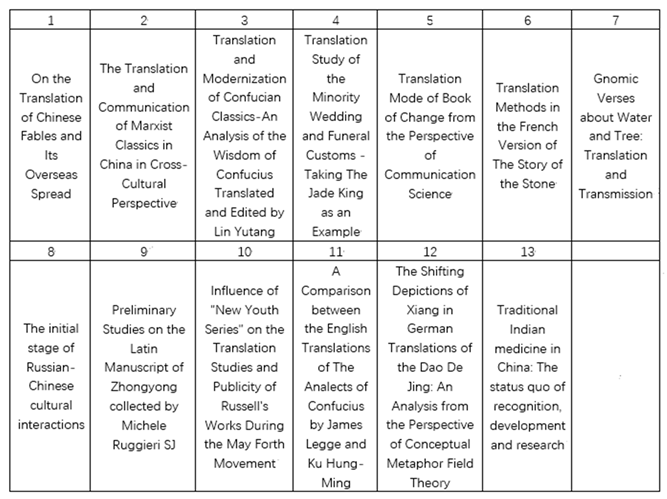 |
Table 3.
Heatmap dataset 1.
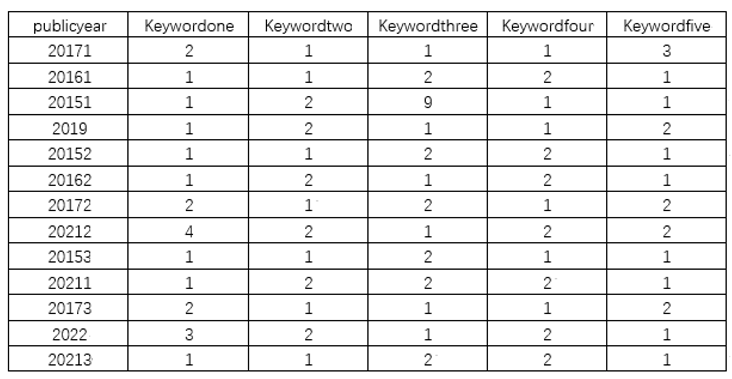 |
(keywordone=cultural, keywordtwo=cross-cultural, keywordthree=communication, keywordfour=literature, keywordfive=spread).
Table 4.
Heatmap dataset 2.
 |
Disclaimer/Publisher’s Note: The statements, opinions and data contained in all publications are solely those of the individual author(s) and contributor(s) and not of MDPI and/or the editor(s). MDPI and/or the editor(s) disclaim responsibility for any injury to people or property resulting from any ideas, methods, instructions or products referred to in the content. |
© 2024 by the authors. Licensee MDPI, Basel, Switzerland. This article is an open access article distributed under the terms and conditions of the Creative Commons Attribution (CC BY) license (http://creativecommons.org/licenses/by/4.0/).
Copyright: This open access article is published under a Creative Commons CC BY 4.0 license, which permit the free download, distribution, and reuse, provided that the author and preprint are cited in any reuse.


