
Submitted:
17 December 2024
Posted:
17 December 2024
You are already at the latest version
Abstract
In order to investigate the corrosion behavior of Mg-Gd based soluble magnesium alloy materials, two aspects, environmental factors and microstructural point of view, were discussed in this study respectively. Among them, the environmental factor aspect was carried out by immersion weight loss tests at different Cl- concentrations and different temperatures. In terms of microstructure, the influence of different initial tissue morphologies on the corrosion behavior of the alloy was mainly investigated, and the second phase Mg5Gd, prepared by melting, was subjected to immersion weight loss tests and electrochemical tests. The results show that the corrosion rate of the alloy increases with the increase of Cl- concentration and temperature, but the growth trend is not linear, in which the Cl- concentration of 1% to 3% and the temperature of 75 °C to 100 °C have a significant effect on the corrosion rate of the alloy, respectively; the dissolution rate of Mg-Gd-based soluble magnesium alloy after extrusion + perforation deformation was greatly improved from 8.37 mg/cm2/h in the as-cast state to 43.85 mg/cm2/h. Combined with the microstructure analysis, it is believed that the extrusion destroys the coarse reticulated second phase in the as-cast state organization, which reduces the corrosion-blocking network effect of the second phase; electrochemical tests showed that the second phase Mg5Gd formed after the addition of the rare earth element Gd had a high electrochemical activity.
Keywords:
corrosion behavior
; Immersion Weight Loss
; second phase
; Trial electrochemical tests
; dissolution rate
; corrosion mechanism
1. Introduction
Magnesium alloy, as the lightest structural metal with a density of only 1.74 g/cm³ [1,2], possesses remarkable properties such as high vibration absorption, excellent casting performance, efficient heat dissipation, and superior electromagnetic shielding. These attributes have positioned magnesium alloys as one of the most promising materials for development in the 21st century [3]. However, their poor corrosion resistance [4,5,6] also opens opportunities for innovative applications, such as biodegradable well-completion tools in the oil and natural gas industry [7].
These dissolvable magnesium alloy tools, used during oil and gas extraction, offer the advantage of not requiring removal after use. Instead, they dissolve in neutral potassium chloride solutions, reducing construction costs and proving particularly valuable for extracting unconventional hydrocarbons with low porosity and permeability. To optimize the functionality of these tools, it is critical to study the corrosion and dissolution behavior of the material and understand the factors influencing its corrosion rate.
The corrosion behavior of magnesium alloys is influenced by three primary factors: alloying [8,9,10], the nature of the surface corrosion product film [11,12,13], and environmental conditions [14]. For example, Wang et al. [15] studied Mg-2Gd, a soluble magnesium alloy used in oilfield sealing tools, and found that increasing nickel (Ni) content (0.1, 0.2, and 0.5 wt.%) enhanced strength, hardness, and corrosion rate but reduced elongation. This was attributed to structural transitions from rare-earth to basic fiber structures, as well as changes in the LPSO (long-period stacking ordered) phase volume and grain size.
Similarly, Pan et al. [16] explored the impact of strontium (Sr) on Mg-Zn-Mn alloys in Hanks' solution, revealing that increased Sr content reduced second-phase spacing, leading to enhanced micro-coupling corrosion and higher corrosion rates. They concluded that an optimal Sr content balances corrosion resistance and biomedical compatibility. Zhang et al. [17] demonstrated that incorporating gadolinium (Gd) into Mg-Zn-Y alloys improved corrosion resistance due to a reticulated LPSO phase, particularly at x = 5 in the Mg97-xZnYGdx composition.
The role of corrosion product films has also been investigated. Sun et al. [18] analyzed Mg-4Nd-xZn alloys and found that oxides and insoluble compounds in the corrosion product film significantly influenced corrosion behavior. Specifically, Mg-4Nd-3Zn alloys exhibited better corrosion resistance due to oxide formation during micro-coupling corrosion processes.
Beyond alloy composition, environmental factors also play a significant role. Parameters such as solution pH [19,20], anionic species [21,22], and ambient temperature [23,24] can drastically impact the corrosion rate. For instance, magnesium alloys corrode several times faster in humid environments than in dry ones [25]. Despite extensive research on alloying and environmental effects on magnesium alloy corrosion[26], By 2020, high-performance Mg-RE-based alloys are gradually developed, especially high-plasticity Mg-Gd-based and Mg-Y-based alloys have gradually become the focus of attention of many researchers due to their superior mechanical properties, however, there is no uniform understanding in China on the law of the influence of the addition of the rare-earth element gadolinium (Gd) after the addition of the degradation properties of magnesium alloys. Meanwhile, few studies have been reported on the corrosion process of soluble material Mg-Gd-based alloys for energy extraction completion tools under different environmental factors (including Cl- concentration and temperature) over time.
Over the past five years, our group has conducted extensive research on various alloy systems [27,28,29,30,31,32,33], and designs and prepares a high plastic soluble Mg-Gd based magnesium alloy to meet the function of the use of biodegradable completion tool bridge plugs, recently; and applies it to oil and natural gas extraction and completion engineering to reduce the construction cost and improve the utilization rate of materials. this paper addresses this gap by focusing on Mg-Gd-based soluble magnesium alloys, specifically examining their dissolution behavior after extrusion and perforation. The study evaluates how different chloride ion concentrations and temperatures affect the dissolution rate and investigates the influence of initial microstructural states, particularly the second phase, on corrosion behavior. These findings aim to provide theoretical support for the broader application of soluble magnesium alloys in energy extraction and well-completion engineering.
2. Methods and Approaches for Experiments
2.1. Materials and Solutions
The materials used in this study consist of cast Mg-Gd-based soluble magnesium alloy rods and Mg-Gd-based soluble magnesium alloy tubes subjected to extrusion and perforation deformation. The deformed tubes have an outer diameter of 120 mm and an inner diameter of 40 mm. Figure 1 illustrates the process flow and the finished product of tube production, with the alloy compositions detailed in Table 1. To prepare the second-phase and α-Mg matrix specimens, as-cast rods with a diameter of 50 mm and a height of 250 mm were melted and processed accordingly.
2.2. Microstructure Analysis
The microstructure of the as-cast and metamorphic alloys was photographed using a ZEISS OXFORD scanning electron microscope (SEM). X-ray diffraction (XRD) was employed to identify the physical phases of the Mg-Gd-based as-cast and metamorphic soluble magnesium alloys.
The test specimens were all sized at 10 mm × 10 mm × 10 mm. Initially, the specimens were polished with silicon carbide sandpaper (grain size 5000) and then mechanically polished with water sandpaper specifically designed for magnesium alloys until surface scratches were minimized. Following this, the specimen surfaces underwent electrolytic polishing and etching with a corrosive solution composed of 2.1 g of picric acid, 5 ml of acetic acid, 5 ml of distilled water, and 35 ml of ethanol. This step facilitated the observation of grain boundaries.
The electrolytic solution was prepared with a perchloric acid-to-ethanol ratio of 1:9. Electrolysis was conducted for 120 seconds at a voltage of 20 V and a current of 0.3 A.
2.3. Immersion Weight Loss Test
Immersion loss-in-weight specimens with a diameter of 40mm and a height of 10mm were intercepted from the thick-walled pipe and the melted second phase, α-Mg matrix, respectively. The corrosion test parameters are shown in Table 2. During the experiment, the specimens were taken out every 1h and blown dry after being cleaned with alcohol, and the relevant experimental data such as height (h), diameter (d), and weight (m) were recorded, respectively. The dissolution rate was calculated by Equiation:
where P is the mass reduction per square centimeter of the specimen per unit time (unit: mg/cm2/h); ΔM=m1-m2 is the mass difference (unit: mg), m1 is the pre-test mass and m2 is the post-test mass, (unit: mg); is the average value of the surface area of the specimen before and after the test (unit: cm2); T is the time between each measurement of the specimen (unit: h).
2.4. Electrochemical Testing
The test was primarily conducted in a 5 wt% KCl solution at room temperature using an electrochemical workstation (model CHI760E). The alloy samples were cut into small cubes measuring 10 × 10 × 10 mm using wire-cutting for use as working electrodes. These were wrapped with epoxy resin to expose only one surface, while the back of the sample was connected to the red terminal of the electrochemical workstation using an Al wire covered with an insulating layer.
A platinum electrode, sized 10 mm × 10 mm × 0.5 mm, was used as the test electrode, and a saturated calomel electrode served as the reference electrode. The specimens underwent testing for open circuit potential (OCP), alternating current impedance spectroscopy (EIS), and Tafel polarization curves for both the α-Mg matrix phase and the second phase of the Mg-Gd-based alloy.
To minimize experimental error, three parallel specimens were prepared, and each was tested three times. The open-circuit potential test was performed for a duration of 1800 seconds. For the AC impedance spectroscopy test, the parameters were set as follows: 104 Hz for high frequency, 0.1 Hz for low frequency, a maximum magnitude of 0.005, a settling time of 2 seconds, and a period of 1. The measured data were fitted to an equivalent circuit using the software ZSimpWin. The Tafel polarization curve test was conducted at a scanning rate of 0.01 V/s, with a settling time of 2 seconds.
3. Results and Discussion
3.1. Study on the Effect of Different Initial Organization States on Corrosion Behavior
Figure 2 illustrates the organization and morphology of Mg-Gd-based cast and variable-form soluble magnesium alloys. Figure 2(a) shows that the second phase in the as-cast soluble magnesium alloy is distributed along the grain boundaries in a network-like pattern with a coarse structure. Figure 2(b) displays the microstructure of the deformed alloy, revealing that extrusion and perforation deformation lead to grain and grain boundary refinement. The grain size decreases significantly from the original 75 μm to approximately 30 μm, a change attributed to the continuous dynamic recrystallization mechanism (CDRX). Additionally, the coarse meshed second-phase structure observed in the as-cast state was disrupted, forming lath-like or granular morphologies aligned in a specific axial direction. A high density of twins was also observed within the grains.
Figure 3 shows the morphology of Mg-Gd-based cast and variable-form soluble magnesium alloys dissolved over time in a 3 wt% KCl solution at 93°C. Figure 3(a) illustrates the early stage of dissolution, where tiny bubbles are localized on the surface of the cast soluble magnesium alloy, and a passivation film forms as the reaction progresses [34]. As seen in Figure 3(a1), the surface of the as-cast material initially turns black upon immersion in the solution, with some shiny areas covered by the product film. In the later stages of the reaction, as the corrosion product film continues to detach, α-Mg dissolution from the bare surface occurs, leading to large corrosion holes as shown in Figure 3(a2).
Figure 3(b) highlights the dissolution behavior of the variable-form soluble magnesium alloy. In the early stage of the reaction, the dissolution is highly vigorous. Upon immersion in the KCl solution, a large amount of H2 is rapidly generated on the alloy's surface, forming large and dense bubbles. Additionally, pitting corrosion holes are already visible on the alloy surface (Figure 3b1) at this stage. As the reaction proceeds, these features evolve into uniform pitting corrosion craters (Figure 3b2) [35,36]. Based on these observations, the initial reaction phenotypes demonstrate that variable-form soluble magnesium alloys dissolve at a faster rate compared to cast magnesium alloys.
To quantitatively compare the dissolution performance of cast and variable-form magnesium alloys, we calculated their dissolution rates over a 12-hour period. The results showed that the difference in degradation rates between the cast and variable-form magnesium alloys during the first 2 hours was minimal. This can be attributed to the initial adaptation process required for corrosion, involving chloride Cl− erosion and the formation of the corrosion product film.
As shown in Figure 4(a), the reaction rate of the variable-form soluble magnesium alloy increases significantly after two hours. This indicates that the corrosion product film formed in the deformed state does not easily adhere to the magnesium alloy's surface, thereby allowing the corrosion process to continue unimpeded.
To assess the degradation rate of these magnesium alloys more accurately, we analyzed the weight gradient change over time. This approach provides a comparative analysis of degradation rates under different initial states. As illustrated in Figure 4(b), at the 2-hour mark, the weight gradient change of the cast magnesium alloy is 0.49 g, while the variable-form alloy has a change of 0.63 g—indicating only a slight difference at this stage. However, by the 12-hour point, the weight gradient change for the cast magnesium alloy reaches only 0.696 g, while the variable-form magnesium alloy shows a substantial weight gradient change of 3.718 g. This demonstrates that the variable-form magnesium alloy exhibits a much higher dissolution rate during the later stages of the corrosion reaction.
In conclusion, variable-form magnesium alloys exhibit superior dissolution properties compared to cast magnesium alloys.
3.2. Study on the Effect of Corrosion Behavior of Rare-Earth-Rich Second Phase Alloys
Almost all studies on soluble magnesium alloys are related to the second phase, which is the key factor affecting the corrosion rate, including its composition, morphology, and volume fraction [37].
Figure 5 shows the XRD patterns of Mg-Gd-based cast and variomorphic soluble magnesium alloys. XRD analysis shows that Mg-Gd-based cast soluble magnesium alloys are mainly composed of the α-Mg matrix phase and the Mg5Gd phase; the number of diffraction peaks of variomorphic soluble magnesium alloys is basically the same as those of the as-cast alloys, which suggests that the extrusion+perforation deformation does not have much effect on the types of phases in the soluble magnesium alloys. In terms of the intensity of the diffraction peaks, the intensity of the diffraction peaks of α-Mg is the strongest in the as-cast and deformed soluble magnesium alloys, and the diffraction peaks of the Mg5Gd phase are weaker.
Figure 6 shows the dissolution weight loss test of melting the second phase Mg5Gd, α-Mg matrix, and Mg-Gd-based alloys, respectively, at 93°C for 8 h in a solution with a KCl concentration of 3%. It was found that the dissolution rate of the second phase of Mg5Gd was very fast, and the dissolution rate reached 160 mg/cm2/h after only 4h, which was about four times the dissolution rate of the Mg-Gd base alloy; from the corrosion solution after corrosion in Figure 6b,c, it was observed that a large number of flocculent precipitates were generated from the second phase of Mg5Gd after the reaction for 8h (shown in Figure 6c), while the surface of the corrosion solution of the pure magnesium was still slightly clear and the corrosion products were less (shown in Figure 6b). it can also be concluded from the amount of corrosion product generation that the dissolution rate of the Mg5Gd second phase is faster than that of the pure Mg matrix specimen; from the rate of weight loss and the amount of corrosion product generation, the second phase of the Mg-Gd-based alloy itself has a very high electrochemical activity, which plays a certain positive role in the process of corrosion and dissolution; as the corrosion proceeds, the Mg5Gd second phase specimen fractured at the 5th h (shown in Figure 6a), afterwards, the dissolution rate remained at a high value of 183 mg/cm2/h, which was due to the fracture resulting in an increase in the contact area between the specimen and the corrosive solution, and also indicates that the magnitude of the degradation rate is related to the contact area of the specimen surface exposed in the corrosive solution.
From the corrosion rate curve of matrix α-Mg in Figure 6a, it can be seen that the dissolution rate of the specimen containing only α-Mg matrix is almost 0 in a short period of time; from the corroded specimen, it can also be observed that there are only a small number of pitting holes on the surface of the specimen, and the weight loss is not obvious. Comparison of the results of the immersion weight loss tests of the second phase Mg5Gd and Mg-Gd-based alloys initially suggests that the addition of the rare earth element Gd can improve the dissolution rate of pure magnesium to a large extent and that the presence of multiple phases is faster than the corrosion rate of a single phase for Mg-Gd-based soluble magnesium alloys [38,39].
In addition, the different influence of the second phase on the soluble magnesium alloy is also determined by their potential difference with the Mg matrix [40].
Table 3 shows the magnitude of the open-circuit potential values of the α-Mg magnesium matrix and the second phase (Mg5Gd) at different time intervals. From the test results, it can be seen that the open-circuit potential values of both of them gradually increase with the extension of time and, after 1h, basically remain stable. Among them, the value of open-circuit potential when the α-Mg magnesium matrix is stabilized is -1661 mV; the open-circuit potential of the second phase is -1647 mV; the difference between the two potentials is 14 mV, and from the condition of forming micro-electrolytic coupling corrosion, the two satisfy the condition of forming electrolytic coupling corrosion.
Figure 7(a) shows the polarization curve test results of the matrix phase α-Mg and the second phase Mg₅Gd. From the graph, it can be observed that the self-corrosion potential of the second phase is slightly more negative than that of the base phase (-1.48 V vs -1.50 V), indicating that the Mg₅Gd phase acts as a highly effective anodic phase relative to the base phase. This leads to the formation of an effective galvanic couple with the base phase, promoting increased dissolution rates of the magnesium alloy. Furthermore, the cathodic polarization curve of the base phase is steeper than that of the second phase, suggesting that the base phase is more prone to polarization compared to the second phase. This can slow the corrosion process to a certain extent.
Figure 7(c) displays the Bode plots for the matrix phase α-Mg and the second phase Mg₅Gd. It is evident that the impedance modulus of the matrix phase α-Mg is significantly larger than that of the second phase Mg₅Gd in the low-frequency range. Additionally, from the phase angle diagram, both the matrix phase and the second phase exhibit two phase angle peaks, implying that the AC impedance spectrum contains two time constants. The magnitude of these phase angle peaks can be used to evaluate corrosion resistance, with higher peaks corresponding to better corrosion resistance [41]. This observation is also supported by the Nyquist diagram (Figure 7(b)), which consists of two capacitive arcs in the high-frequency and low-frequency ranges.
The capacitive arcs in the high-frequency range are typically associated with the charge transfer resistance of the oxide film on the alloy's surface. Conversely, the middle- and low-frequency arcs correspond to charge transfer resistance within the corrosive layer and localized corrosion, respectively. The AC impedance spectrum results reveal that the radius of the capacitive ring for the magnesium matrix is approximately 75, while that of the second phase is around 25. A larger radius of the capacitive ring is indicative of a more corrosion-resistant material. This suggests that the dissolution rate of the Mg₅Gd second phase is faster than that of the α-Mg matrix, aligning with the findings from dissolution loss experiments. Furthermore, this confirms that the Mg₅Gd second phase functions as the microanode in galvanic corrosion, while the α-Mg matrix acts as the cathode. This interaction establishes a micro-coupling corrosion model that accelerates the corrosion process.
3.3. Study of the Effect of Cl- Concentration on the Corrosion Behavior of Alloys
Figure 8(a) shows the relationship between corrosion time and the corrosion rate of Mg-Gd-based soluble magnesium alloy specimens in different Cl⁻ concentration solutions. As observed in the figure, during the initial 3 hours of immersion in Cl⁻ concentrations ranging from 1% to 7%, the specimens exhibit an accelerated corrosion rate. From 3 hours to 12 hours, the corrosion rate gradually stabilizes as dissolution progresses. After 12 hours, the corrosion rate displays a decreasing trend under 1%, 5%, and 7% Cl⁻ concentrations.
Figure 8(b) presents a schematic diagram showing the average corrosion rate plotted against final weight loss for the Mg-Gd-based alloy specimens after corroding for 16 hours, at which point stability is achieved. It is evident that the corrosion rate increases with higher Cl⁻ concentrations. However, the rate of this increase is significantly steeper when the Cl⁻ concentration is in the range of 1% to 3%, compared to the range of 3% to 7%. Specifically, the corrosion rate rises from 32.36 mg/cm²/h to 43.85 mg/cm²/h as Cl⁻ concentration increases from 1% to 3%, representing a 1.36-fold enhancement. In contrast, the rate only increases from 43.85 mg/cm²/h to 47.02 mg/cm²/h as Cl⁻ concentration rises from 3% to 7%, corresponding to a 1.08-fold enhancement. This suggests that the relationship between Cl⁻ concentration and the corrosion rate is not linear.
Figure 8(c) illustrates a schematic diagram of the corrosion products formed in the beaker containing Mg-Gd-based alloy specimens after 16 hours of dissolution at various Cl⁻ concentrations. The amount of corrosion products is observed to increase progressively with increasing Cl⁻ concentration. At 7% Cl⁻ concentration, a significant quantity of corrosion products has overflowed from the beaker. Additionally, bubbles on the surface of these corrosion products become more pronounced as the Cl⁻ concentration increases.
Figure 8(d) provides a comparison of the final specimen thickness after 16 hours of corrosion and dissolution. The figure highlights that at a Cl⁻ concentration of 7%, the specimen's diameter and thickness are the smallest observed, measuring 28.6 mm and 2.8 mm, respectively. Compared to their initial values, the diameter decreased by 11.4 mm, and the thickness decreased by 7.2 mm.
As can be seen from Figure 9a, the surface of magnesium alloy after corrosion is covered with corrosion pits, combined with Figure 9b, it can be seen that the corrosion products of magnesium alloy are mainly Mg(OH)2, in addition to a small amount of MgCO3 and Mg5Gd. Among them, the main reaction formula is:
Mg+H2O--Mg(OH)2+H2;
MgCO3 is generated by the reaction of H2CO3 formed by CO2 in the air reacts with Mg(OH)2 in the solution to generate; the Mg5Gd phase basically does not react with the solution, and as corrosion proceeds, the Mg5Gd phase that is polarized at the grain boundaries loses its dependence on the substrate and undergoes detachment. At this time, in the surface film is incomplete, defects, the second phase adjacent to the magnesium substrate, etc., pitting holes will be formed, inside and outside of the etching hole constitutes a microcouple corrosion primary battery, etching holes to the depth of the expansion, will eventually form pitting corrosion.
In order to further analyze the surface of the corroded specimen to study the corrosion type of Mg-Gd-based alloys, the surface of the final corroded specimen of the varimorphic alloy was photographed in super depth of field. Figure 9 shows the topography and 3D rendering of the surface of the metamorphic specimen of Mg-Gd based alloy after 12h immersion. It can be observed from the figure that pitting corrosion dissolution mainly occurs in the metamorphic alloy, and the corrosion pit is large, reaching 438.1 μm.
Through the experimental analysis, it is evident that the concentration of Cl⁻ significantly promotes the corrosion of soluble magnesium alloys. The findings not only provide insights into the joint mechanisms underlying corrosion evolution across different stages in varying Cl⁻ concentration environments but also offer a deeper understanding of how the corrosion rate of soluble magnesium alloys can be regulated by adjusting Cl⁻ concentration.
To further analyze the effect of Cl⁻ concentration on corrosion behavior, this study presents a schematic diagram illustrating its impact on the corrosion mechanism of magnesium alloys (Figure 10). Cl⁻, as an active and oxidizing ion, is preferentially adsorbed at defects within the passivation film of magnesium alloys during the reaction process. This adsorption alters the composition and properties of the passivation film [42], leading to a higher local corrosion rate at the defect sites compared to the surrounding areas. These active sites serve as initiation points for pitting corrosion, resulting in the formation of pitting nuclei. The higher the concentration of Cl⁻, the greater the number of pitting nuclei formed.
As shown in Figure 10, the dissolution process within the pitting holes proceeds as follows: the magnesium (Mg) inside the pitting hole continues to dissolve, forming Mg²⁺. The Mg²⁺ is subsequently hydrolyzed in the corrosion solution, leading to the formation of Mg(OH)₂, which plugs the orifice of the pitting hole. This hydrolysis reaction produces a continuous increase in H⁺ within the pitting hole. To maintain electroneutrality, a large amount of Cl⁻ diffuses into the pitting hole.
The continuous influx of H⁺ causes the local pH within the pitting hole to decrease, while the accumulation of Cl⁻ further exacerbates the progression of pitting corrosion. Therefore, higher Cl⁻ concentrations accelerate the development of pitting corrosion. However, as the corrosion process progresses, the pH of the magnesium alloy's corrosion solution gradually increases. This increase can lead to the polarization of the soluble magnesium alloy, which slows down the corrosion process to some extent.
Ultimately, the interplay between pitting corrosion promotion and the occurrence of polarization leads the system to a stable equilibrium state. At this equilibrium, the corrosion rate stabilizes, maintaining a constant rate of corrosion over time.
3.4. Study of the Effect of Temperature on the Corrosion Behavior of Alloys
Figure 11(a) shows the relationship between corrosion time and corrosion rate for Mg-Gd-based soluble magnesium alloy specimens in a 3 wt% Cl⁻ solution at various temperatures. From the figure, it can be observed that the corrosion rate of Mg-Gd-based alloys gradually increases with rising temperature. When the temperature is below 50°C, the increase in corrosion rate is minimal. However, as the temperature rises from 50°C to 75°C, the corrosion rate increases significantly with temperature elevation. Additionally, Figure 11(b) demonstrates that the fitted curves remain relatively flat during the initial stages, but when the temperature exceeds 75°C, the effect of temperature on the corrosion rate becomes much more pronounced. This indicates that temperature influences the film-forming mechanism on Mg-Gd-based composite surfaces.
Figure 11(c) shows that at the initial stage of dissolution at 25°C, when the specimen is immersed in KCl solution for 1 hour, a dense black corrosion product film forms on its surface. Observations of this alloy surface (Figure 12a) reveal insoluble substances that appear in a network-like structure. XRD analysis (Figure 12b) confirms that the black product film likely consists of a mixture of MgCO₃ and Mg(OH)₂, which are distributed between the grains and within grain boundaries, forming an effective corrosion barrier network. This corrosion product film reduces the dissolution rate because the second phase is uniformly distributed and abundant.
In contrast, Figure 11(d) shows that after 1 hour of corrosion at a high temperature (100°C), no dense black product film similar to that formed at 25°C is observed on the alloy surface. This suggests that at elevated temperatures, the black corrosion product film does not form, highlighting that temperature affects the initial corrosion surface film formation on Mg-Gd-based alloys. Furthermore, only a very small amount of Mg(OH)₂ is present on the surface at high temperatures (Figure 12b).
At high temperatures, Cl⁻ in the KCl solution can hinder the deposition of Mg(OH)₂ or even destroy it by converting it into soluble MgCl₂ through the following chemical reactions:
2Cl-+Mg2+——MgCl2
2Cl-+Mg(OH)2——MgCl2+2OH-
2Cl-+Mg——MgCl2+2e-
This results in a large number of small corrosion pits starting to appear on the surface of the specimen, which provide a channel for the corrosion of Cl-, thus accelerating the corrosion rate of the alloy.
Figure 12(c, d) presents the schematic diagrams of the corrosion behavior of Mg-Gd-based alloys at ambient (room temperature) and elevated temperatures, respectively.
From the immersion weight loss test, it is observed that at room temperature, the alloy surface forms a dense black passivation film that effectively blocks the corrosion process. Surface observations show that some regions of this film may detach over time, leading to localized galvanic coupling corrosion between the film and the alloy surface. However, since the detached areas of the film account for only a small fraction of the alloy surface, galvanic coupling has only a limited effect on the overall corrosion process. This protective passivation film remains the dominant factor inhibiting corrosion, as evidenced by the relatively unchanged corrosion rate over a 10-hour test period.
In contrast, at elevated temperatures, no passivation film is generated during the initial stage, unlike at room temperature. The absence of this protective film allows micro-electrochemical coupling corrosion to occur between the matrix phase (αα-Mg) and the second phase on the alloy surface due to the presence of potential differences [43,44]. Initially, the electrochemical reaction proceeds slowly because the magnesium alloy surface is relatively smooth. However, as defects develop on the surface, the corrosion rate increases, continuing until the reaction slows over the entire surface as it becomes more uniform.
4. Conclusions
This study investigates the dissolution behavior and mechanisms of Mg-Gd-based soluble magnesium alloys by examining their dissolution states from various perspectives, including initial organizational states, electrochemical properties of the second phase, and environmental factors such as temperature and Cl⁻ concentration. The key findings are as follows:
- (1)
- The initial state of organization has a great influence on corrosion behavior. During the corrosion reaction, the corrosion product film produced in the deformed state is not easy to be deposited on the surface of the magnesium alloy to hinder the corrosion process, which leads to a substantial increase in the reaction rate after two hours, and the measured weight loss rate is much higher than that of the cast magnesium alloy; from the viewpoint of the initial reaction and the synthesized phenomena of the reaction, the dissolution rate of the transformed soluble magnesium alloy is faster than that of the cast magnesium alloy.
- (2)
- There is a potential difference between the second phase Mg5Gd and the matrix α-Mg, which can form micro-electro-coupling corrosion to accelerate the corrosion rate of Mg-Gd-based soluble magnesium alloy. And for Mg-Gd-based soluble magnesium alloy for a variety of components of the mixture than a single component corrosion rate faster, adding a certain amount of rare earth element Gd is conducive to the dissolution rate.
- (3)
- With the increase of Cl- concentration and temperature, the corrosion rate of Mg-Gd-based soluble magnesium alloys is increasing, but none of them is linearly increasing. When the Cl- concentration is from 1% to 3%, the corrosion rate grows significantly; when the Cl- concentration is from 3% to 7%, the corrosion rate grows slower; for the temperature, when the corrosion temperature is lower than 75 °C, the temperature has less influence on the corrosion rate of the Mg-Gd-based alloy; and when it is more than 75 °C, the increase of the temperature has a significant effect on the corrosion rate.
Acknowledgments
The authors gratefully acknowledge the financial support of the National Natural Science Foundation of China (Nos. 52375363, 52205400 and U1910213); the Fundamental Research Program of Shanxi Province (202203021212321).
References
- Mordike B L, Ebert T. Magnesium: Properties applications potential[J]. Materials Science and Engineering: A, 2001, 302(1):37-45. [CrossRef]
- R.C. Zeng, L. Y. Cui and W. Ke, Biomedical Magnesium Alloys: Composition, Microstructure and Corrosion, Acta Metallurgica Sinica, 2018, Vol. 54, Issue 9, Pages 1215-1235, ISSN: 0412-1961. [CrossRef]
- Birbilis N, Easton M A, Sudholz A D, et al. On the corrosion of binary magnesium-rare earth alloys[J]. Corrosion Science, 2009, 51(3):683-689. [CrossRef]
- M. J. Anjum, V. Z. Asl, M. Tabish, Q. X. Yang, M. U. Malik, H. Ali, et al. A revieiw on understanding of corrcsion and protection strategies of magnesium and its alloys, Surface Review and Letters, 2022, Vol. 29, Issue 12, ISSN: 0218-625X. [CrossRef]
- J. S. Liao, M. Hotta and N. Yamamoto,Corrosion behavior of fine-grained AZ31B magnesium alloy, Corrosion Science, 2012, Vol. 61, Pages 208-214, ISSN: 0010-938X. [CrossRef]
- J. Sun, W. Du, J. Fu, K. Liu, S. Li, Z. Wang, et al. A review on magnesium alloys for application of degradable fracturing tools, Journal of Magnesium and Alloys, 2022, Vol. 10, Issue 10, Pages 2649-2672, ISSN: 2213-9567. [CrossRef]
- Niu H-Y, Deng K-K, Nie K-B, et al. Microstructure, mechanical properties and corrosion properties of Mg-4Zn-xNi alloys for degradable fracturing ball applications[J]. Journal of Alloys and Compounds, 2019, 787:1290-1300. [CrossRef]
- D. Bian, X. Chu, J. Xiao, Z. Tong, H. Huang, Q. Jia, et al. Design of single-phased magnesium alloys with typically high solubility rare earth elements for biomedical applications: Concept and proof, Bioactive Materials, 2023, Vol. 22, Pages 180-200,ISSN 2452-199X. [CrossRef]
- Y. X. Liu, Research Progress in Effect of Alloying on Electrochemical Corrosion Rates of Mg Alloys, Rare Metal Materials And Engineering, 2021, Vol. 50, Issue 1, Pages 361-372,ISSN: 1002-185X. WOS:000616982300050.
- Zhou M, Liu C, Xu S, et al. Accelerated degradation rate of AZ31 magnesium alloy by copper additions[J]. Materials and Corrosion, 2018, 69(6):760-769. [CrossRef]
- Y. Cai, H. Yan, M. Zhu, K. Zhang, X. Yi and R. Chen,High-temperature oxidation behavior and corrosion behavior of high strength Mg-xGd alloys with high Gd content, Corrosion Science, 2021, Vol. 193, Pages 109872, ISSN: 0010-938X. [CrossRef]
- Q. M. Peng, B. C. Ge, H. Fu, Y. Sun, Q. Zu and J. Y. Huang, Nanoscale coherent interface strengthening of Mg alloys, Nanoscale, 2018, Vol. 10, Issue 37, Pages 18028-18035, ISSN:2040-3364. [CrossRef]
- C. J. Shuai, B. Wang, S. Z. Bin, S. P. Peng and C. D. Gao, Interfacial strengthening by reduced graphene oxide coated with MgO in biodegradable Mg composites, Materials & Design, 2020, Vol. 191, ISSN: 0264-1275. [CrossRef]
- H. L. Huang and W. L. Yang,Corrosion behavior of AZ91D magnesium alloy in distilled water,Arabian Journal OF Chemistry,2020, Vol. 13, Issue 7, Pages 6044-6055,ISSN: 1878-5352. [CrossRef]
- Y. Wang, D. Zhang, S. Zhong, Q. Dai, J. Hua, Y. Luo, et al. Effect of minor Ni addition on the microstructure, mechanical properties and corrosion behavior of Mg–2Gd alloy, Journal of Materials Research and Technology, 2022, Vol. 20, Pages 3735-3749, ISSN: 2238-7854. [CrossRef]
- H. Pan, K. Pang, F. Z. Cui, F. Ge, C. Man, X. Wang, et al. Effect of alloyed Sr on the microstructure and corrosion behavior of biodegradable Mg-Zn-Mn alloy in Hanks' solution, Corrosion Science, 2019, Vol. 157, Pages 420-437, ISSN: 0010-938X. [CrossRef]
- J. Y. Zhang, M. Xu, X. Y. Teng and M. Zuo, Effect of Gd addition on microstructure and corrosion behaviors of Mg-Zn-Y alloy, Journal of Magnesium and Alloys, 2016, Vol. 4, Issue 4, Pages 319-325, ISSN: 2213-9567. [CrossRef]
- L. X. Sun, D. Q. Ma, Y. Liu, L. Liang, Q. W. Qin, S. T. Cheng, et al. Influence of corrosion products on the corrosion behaviors of Mg-Nd-Zn alloys, Materials Today Communications, 2022, Vol. 33, ISSN: 2352-4928. [CrossRef]
- Y. H. Duan, Y. Sun, J. H. He, Z. Z. Guo and D. S. Fang,Corrosion Behavior of As-Cast Pb-Mg-Al Alloys in 3.5% NaCl Solution,Corrosion, 2012, Vol. 68, Issue 9, Pages 822-826, ISSN: 0010-9312. [CrossRef]
- L. Prince, X. Noirfalise, Y. Paint and M. Olivier, Corrosion mechanisms of AZ31 magnesium alloy: Importance of starting pH and its evolution, Materials and Corrosion-werkstoffe Und Korrosion, 2022, Vol. 73, Issue 10, Pages 1615-1630, ISSN:0947-5117. [CrossRef]
- L. Wang, T. Shinohara and B.-P. Zhang, Influence of chloride, sulfate and bicarbonate anions on the corrosion behavior of AZ31 magnesium alloy, Journal of Alloys and Compounds, 2010, Vol. 496, Issue 1, Pages 500-507, ISSN 0925-8388. [CrossRef]
- Y. Zhang, X. Wang, Y. Kuang, B. Liu, K. Zhang and D. Fang, Enhanced mechanical properties and degradation rate of Mg-3Zn-1Y based alloy by Cu addition for degradable fracturing ball applications, Materials Letters, 2017, Vol. 195, Pages 194-197, ISSN: 0167-577X. [CrossRef]
- C. Peng, G. Cao, T. Gu, C. Wang, Z. Wang and C. Sun, The effect of dry/wet ratios on the corrosion process of the 6061 Al alloy in simulated Nansha marine atmosphere, Corrosion Science, 2023, Vol. 210, Pages 110840, ISSN: 0010-938X. [CrossRef]
- S. Oh, M. Kim, K. Eom, J. Kyung, D. Kim, E. Cho, et al. Design of Mg–Ni alloys for fast hydrogen generation from seawater and their application in polymer electrolyte membrane fuel cells, International Journal of Hydrogen Energy, 2016, Vol. 41, Issue 10, Pages 5296-5303, ISSN: 0360-3199. [CrossRef]
- Q. Jiang, D. Lu, L. Cheng, N. Liu and B. Hou, The corrosion characteristic and mechanism of Mg-5Y-1.5Nd-xZn-0.5Zr (x = 0, 2, 4, 6 wt.%) alloys in marine atmospheric environment, Journal of Magnesium and Alloys, Volume 12, Issue1, 2024, Pages 139-158, ISSN: 2213-9567. [CrossRef]
- Wang Z, Chen D, Fang Q, et al. Effects of finite temperature on the surface energy in Al alloys from first-principles calculations[J]. Applied Surface Science, 2019, 479:499-505. [CrossRef]
- H. L. Huang and W. L. Yang, Corrosion behavior of AZ91D magnesium alloy in distilled water, Arabian Journal of Chemistry, 2020, Vol. 13, Issue 7, Pages 6044-6055, ISSN:1878-5352. [CrossRef]
- Xie, H., Wang, J., Li, Y., Song, J., Hu, H., Qin, L., et al. Fast shot speed induced microstructure and mechanical property evolution of high pressure die casting Mg-Al-Zn-RE alloys, Journal of Materials Processing Technology, 2024, Vol. 331, Pages 118523, ISSN: 0924-0136. [CrossRef]
- Zou, J., Ma, L., Zhu, Y., Qin, L., & Yuan, Y,Gradient microstructure and superior strength–ductility synergy of AZ61 magnesium alloy bars processed by radial forging with different deformation temperatures, Journal of Materials Science & Technology, 2024, Vol. 170, Pages 65-77, ISSN: 0010-938X. [CrossRef]
- Qin, L., Du, W., Cipiccia, S., Bodey, A. J., Rau, C., & Mi, J.,Synchrotron X-ray operando study and multiphysics modelling of the solidification dynamics of intermetallic phases under electromagnetic pulses. Acta Materialia, 2024, Vol. 265, 119593, ISSN 2213-9567. [CrossRef]
- Zhang, Z., Khong, J. C., Koe, B., Luo, S., Huang, S., Qin, L., ... & Mi, J. (2021). Multiscale characterization of the 3D network structure of metal carbides in a Ni superalloy by synchrotron X-ray microtomography and ptychography. Scripta Materialia, 2021, Volume 193, Pages 71-76, ISSN 1359-6462. [CrossRef]
- Huang, S., Luo, S., Qin, L., Shu, D., Sun, B., Lunt, A. J., ... & Mi, J. (2022). 3D local atomic structure evolution in a solidifying Al-0.4 Sc dilute alloy melt revealed in operando by synchrotron X-ray total scattering and modelling. Scripta Materialia, 2022, Volume 211, 114484, ISSN 1359-6462. [CrossRef]
- Zhang, Y., Huang, T., Zhou, Z., Li, M., Tan, L., Gan, B., ... & Liu, L. (2021). Variation of Homogenization Pores during Homogenization for Nickel-Based Single-Crystal Superalloys. Advanced Engineering Materials, 2021, Volume 23(6), 2001547. [CrossRef]
- Qin, L., Shen, J., Feng, Z., Shang, Z., & Fu, H. (2014). Microstructure evolution in directionally solidified Fe–Ni alloys under traveling magnetic field. Materials Letters, 2014, Volume 115, Pages 155-158, ISSN 0167-577X. [CrossRef]
- Ehsan Gerashi, Reza Alizadeh, Terence G. Langdon, Effect of crystallographic texture and twinning on the corrosion behavior of Mg alloys: A review, Journal of Magnesium and Alloys, 2022, Volume 10, Issue 2, Pages 313-325,ISSN 2213-9567. [CrossRef]
- L. Li, W. Liu, F. Qi, D. Wu and Z. Zhang, Effects of deformation twins on microstructure evolution, mechanical properties and corrosion behaviors in magnesium alloys - A review, Journal of Magnesium and Alloys, 2022, Vol. 10, Issue 9, Pages 2334-2353, ISSN 2213-9567. [CrossRef]
- Y. Lu, J. Wang, X. Li, W. Li, R. Li and D. Zhou,Effects of pre-deformation on the microstructures and corrosion behavior of 2219 aluminum alloys,Materials Science and Engineering: A, 2018, Vol. 723, Pages 204-211, ISSN: 0921-5093. [CrossRef]
- B. Feng, G. Liu, P. Yang, S. Huang, D. Qi, P. Chen, et al. Different role of second phase in the micro-galvanic corrosion of WE43 Mg alloy in NaCl and Na2SO4 solution, Journal of Magnesium and Alloys, 2022, Vol. 10, Issue 6, Pages 1598-1608, ISSN: 2213-9567. [CrossRef]
- H.R. J. Nodooshan, W. Liu, G. Wu, Y. Rao, C. Zhou, S. He, et al. Effect of Gd content on microstructure and mechanical properties of Mg–Gd–Y–Zr alloys under peak-aged conditio,Materials Science and Engineering: A, 2014, Vol. 615, Pages 79-86, ISSN: 0921-5093. [CrossRef]
- H. Yu, Y. Hongge, C. Jihua, S. Bin, Z. Yi, S. Yanjin, et al. Effects of minor Gd addition on microstructures and mechanical properties of the high strain-rate rolled Mg–Zn–Zr alloys, Journal of Alloys and Compounds, 2014, Vol. 586, Pages 757-765, ISSN: 0925-8388. [CrossRef]
- D. Filotás, B.M. Fernández-Pérez, L. Nagy, G. Nagy, R.M. Souto, Investigation of anomalous hydrogen evolution from anodized magnesium using a polarization routine for scanning electrochemical microscopy, Journal of Electroanalytical Chemistry, 2021, Vol. 895, Pages 115538, ISSN:1572-6657. [CrossRef]
- S. Oh, M. Kim, K. Eom, J. Kyung, D. Kim, E. Cho, et al. Design of Mg–Ni alloys for fast hydrogen generation from seawater and their application in polymer electrolyte membrane fuel cells, International Journal of Hydrogen Energy, 2016, Vol. 41, Issue 10, Pages 5296-5303, ISSN:0360-3199. [CrossRef]
- L. H. Yang, C. G. Lin, H. P. Gao, W. C. Xu, Y. T. Li, B. R. Hou, et al. Corrosion Behaviour of AZ63 Magnesium Alloy in Natural Seawater and 3.5 wt.% NaCl Aqueous Solution, INTERNATIONAL JOURNAL OF ELECTROCHEMICAL SCIENCE, 2018 ,Vol. 13, Issue 8, Pages 8084-8093, ISSN:1452-3981. [CrossRef]
- Y. Zhu, C. Hao, Z. Li, J. Zou, L. Qin, Y. Niu, et al. First-principles study of binary and ternary phases in Mg-Gd-Ni alloys,Physica B: Condensed Matter, 2024, Vol. 685, Pages 416065, ISSN: 0921-4526. [CrossRef]
- M. Yamasaki, S. Izumi, Y. Kawamura and H. Habazaki, Corrosion and passivation behavior of Mg–Zn–Y–Al alloys prepared by cooling rate-controlled solidification, Applied Surface Science, 2011, Vol. 257, Issue 19, Pages 8258-8267, ISSN: 0169-4332. [CrossRef]
Figure 1.
(a,c) Manufacturing process flow diagram; (b,d) Physical diagram of the bar and pipe in processed state.
Figure 1.
(a,c) Manufacturing process flow diagram; (b,d) Physical diagram of the bar and pipe in processed state.
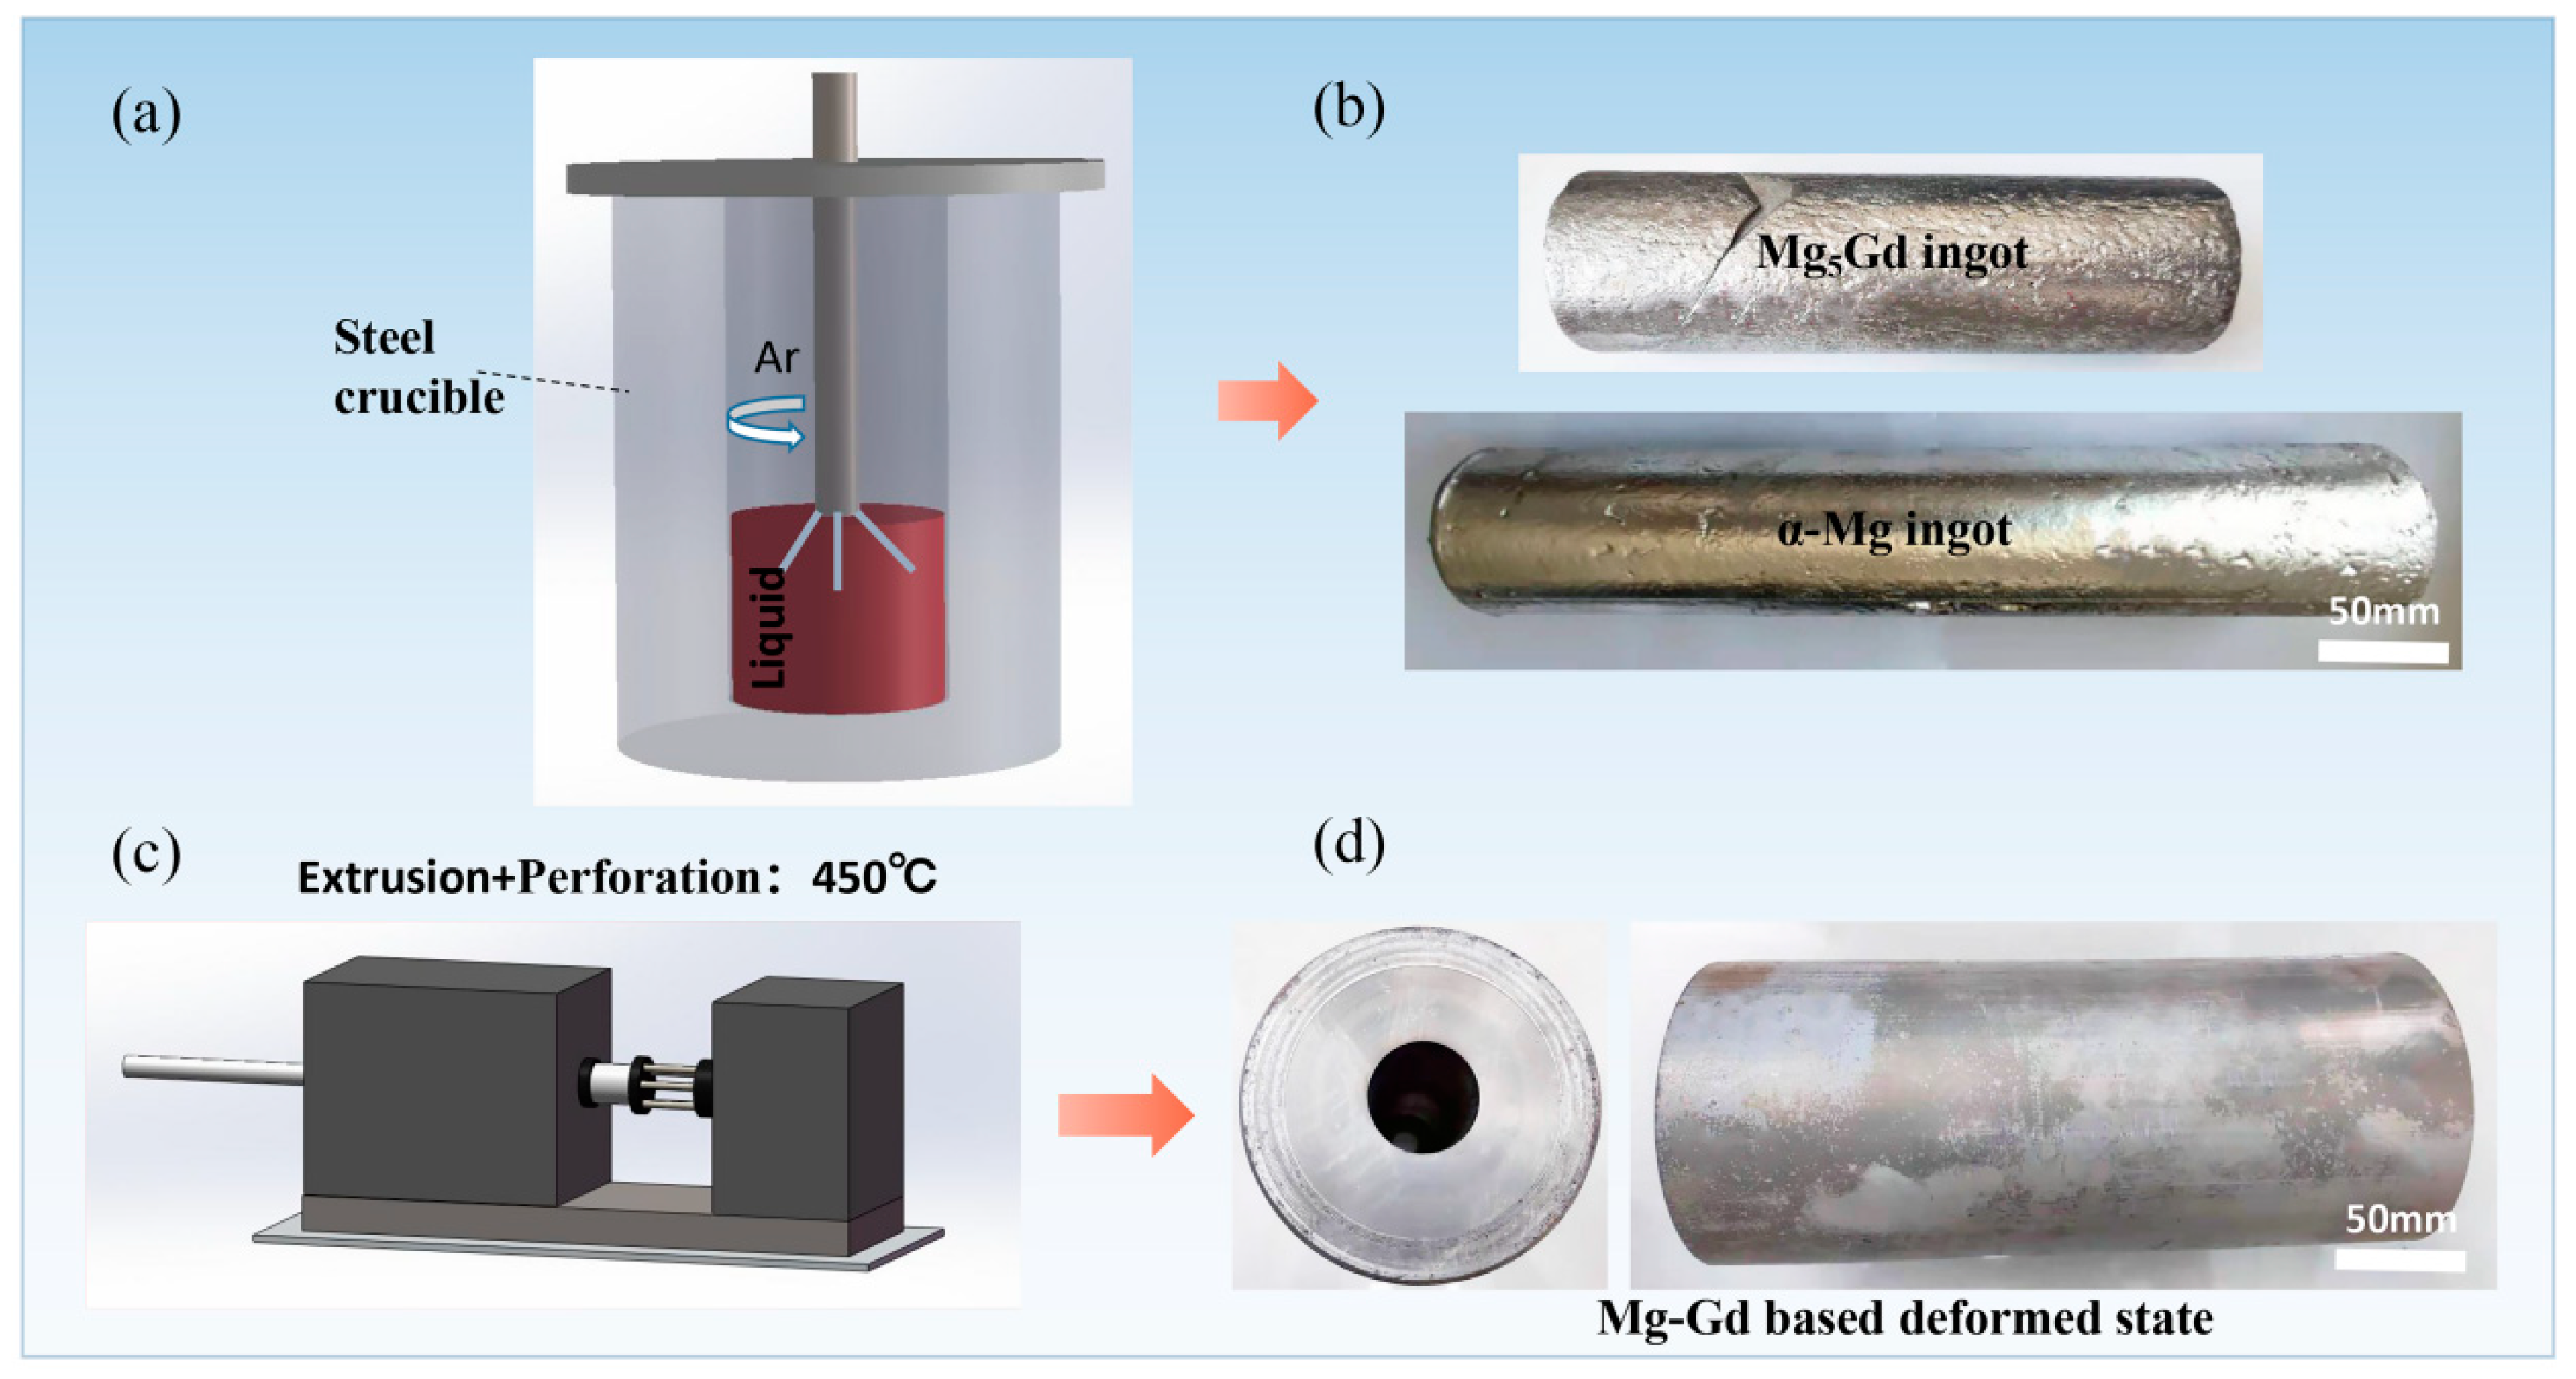
Figure 2.
Mg-Gd-based alloys (a) as-cast histomorphometry; (b) metamorphic histomorphometry.
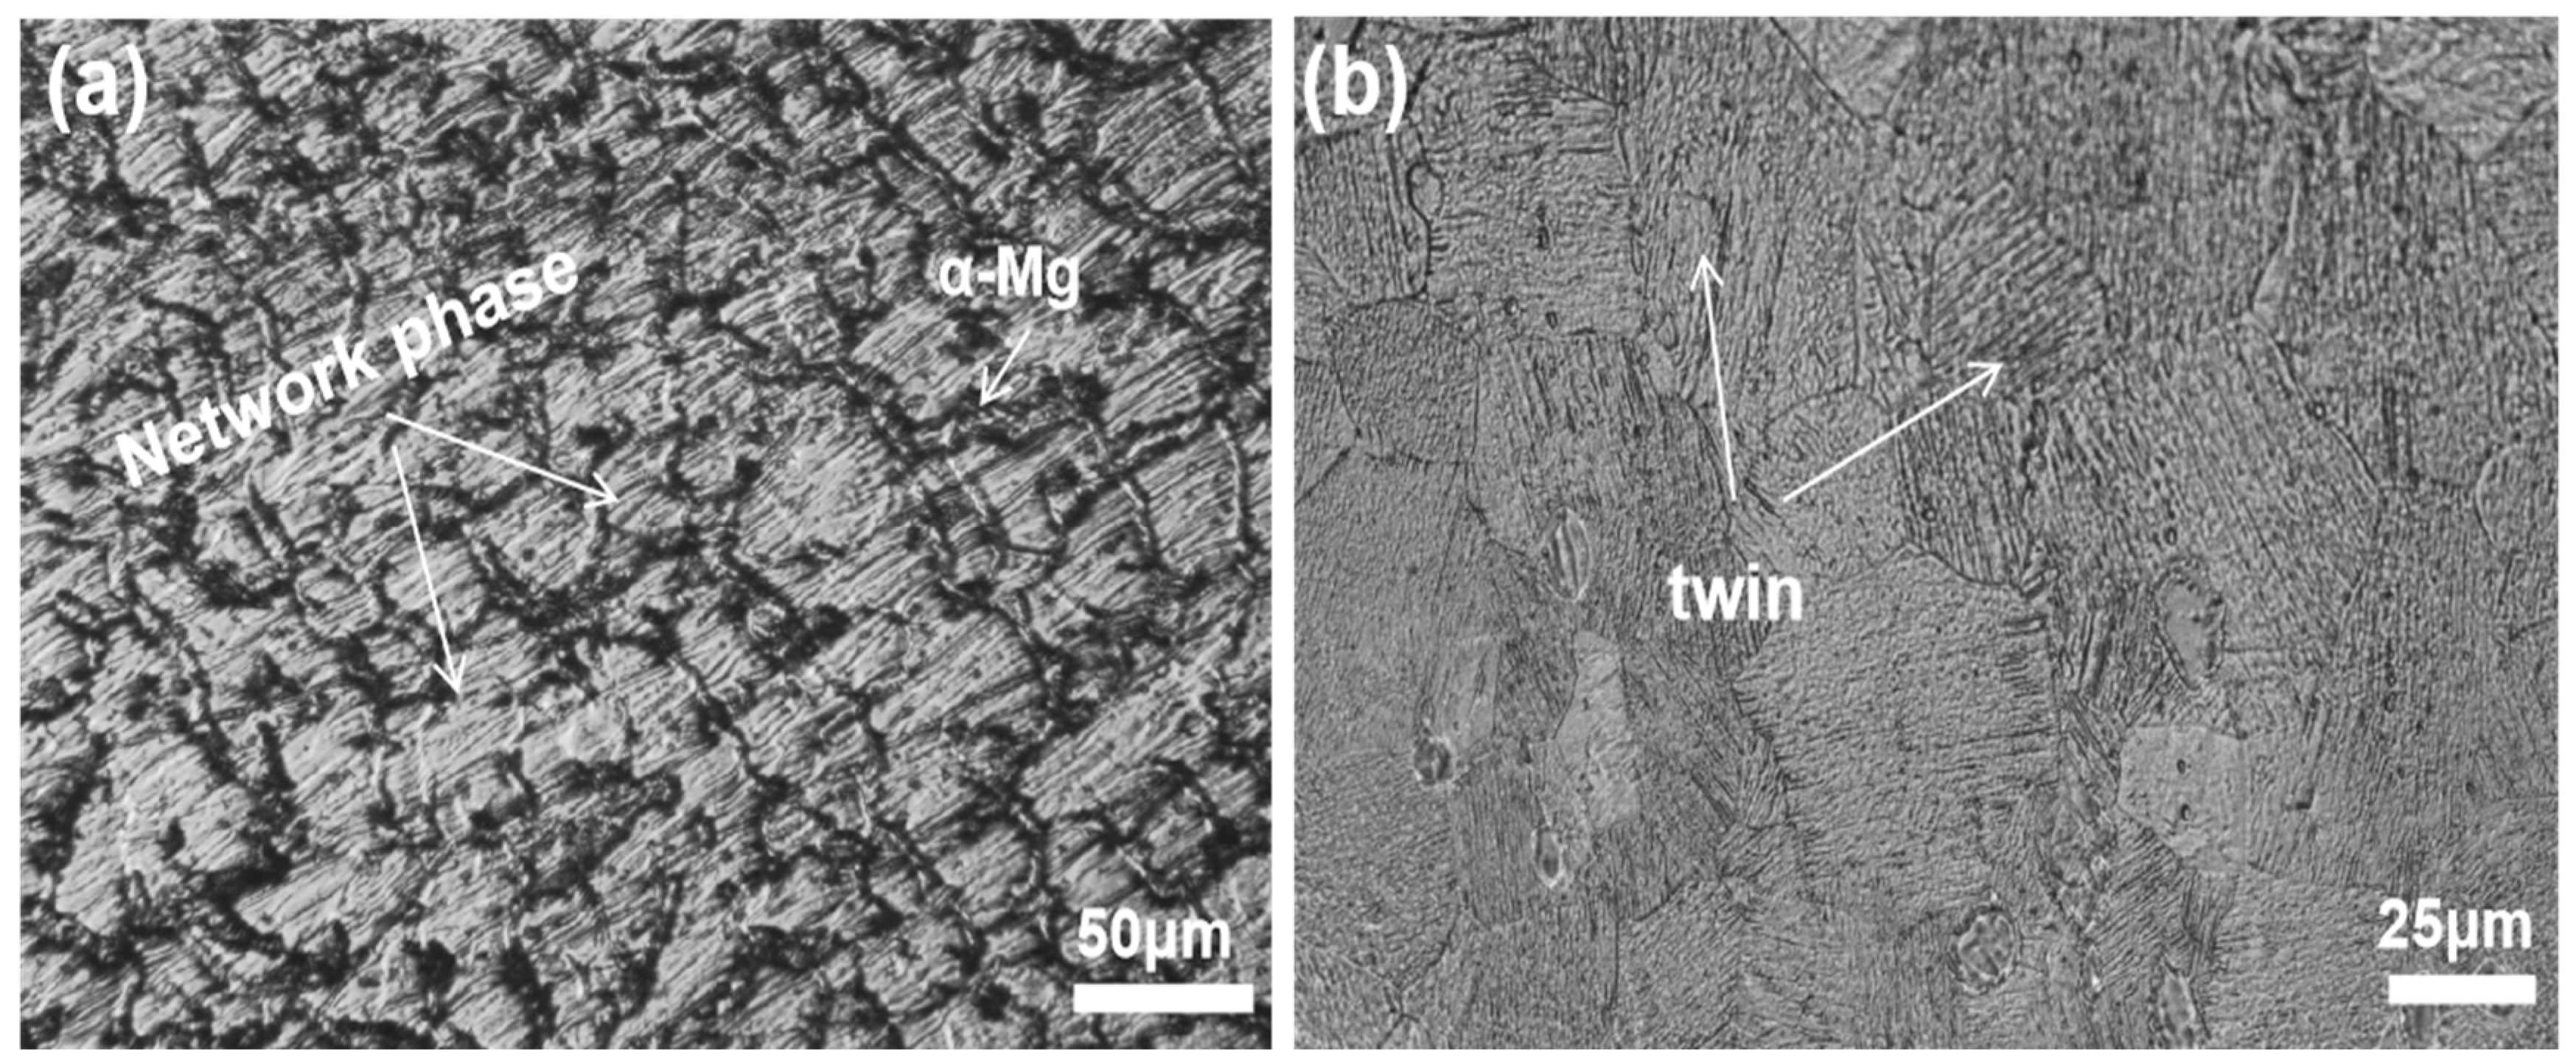
Figure 3.
Macroscopic morphology of Mg-Gd-based cast (a) and variant (b) forms under immersion in 3 wt% KCl solution;.
Figure 3.
Macroscopic morphology of Mg-Gd-based cast (a) and variant (b) forms under immersion in 3 wt% KCl solution;.
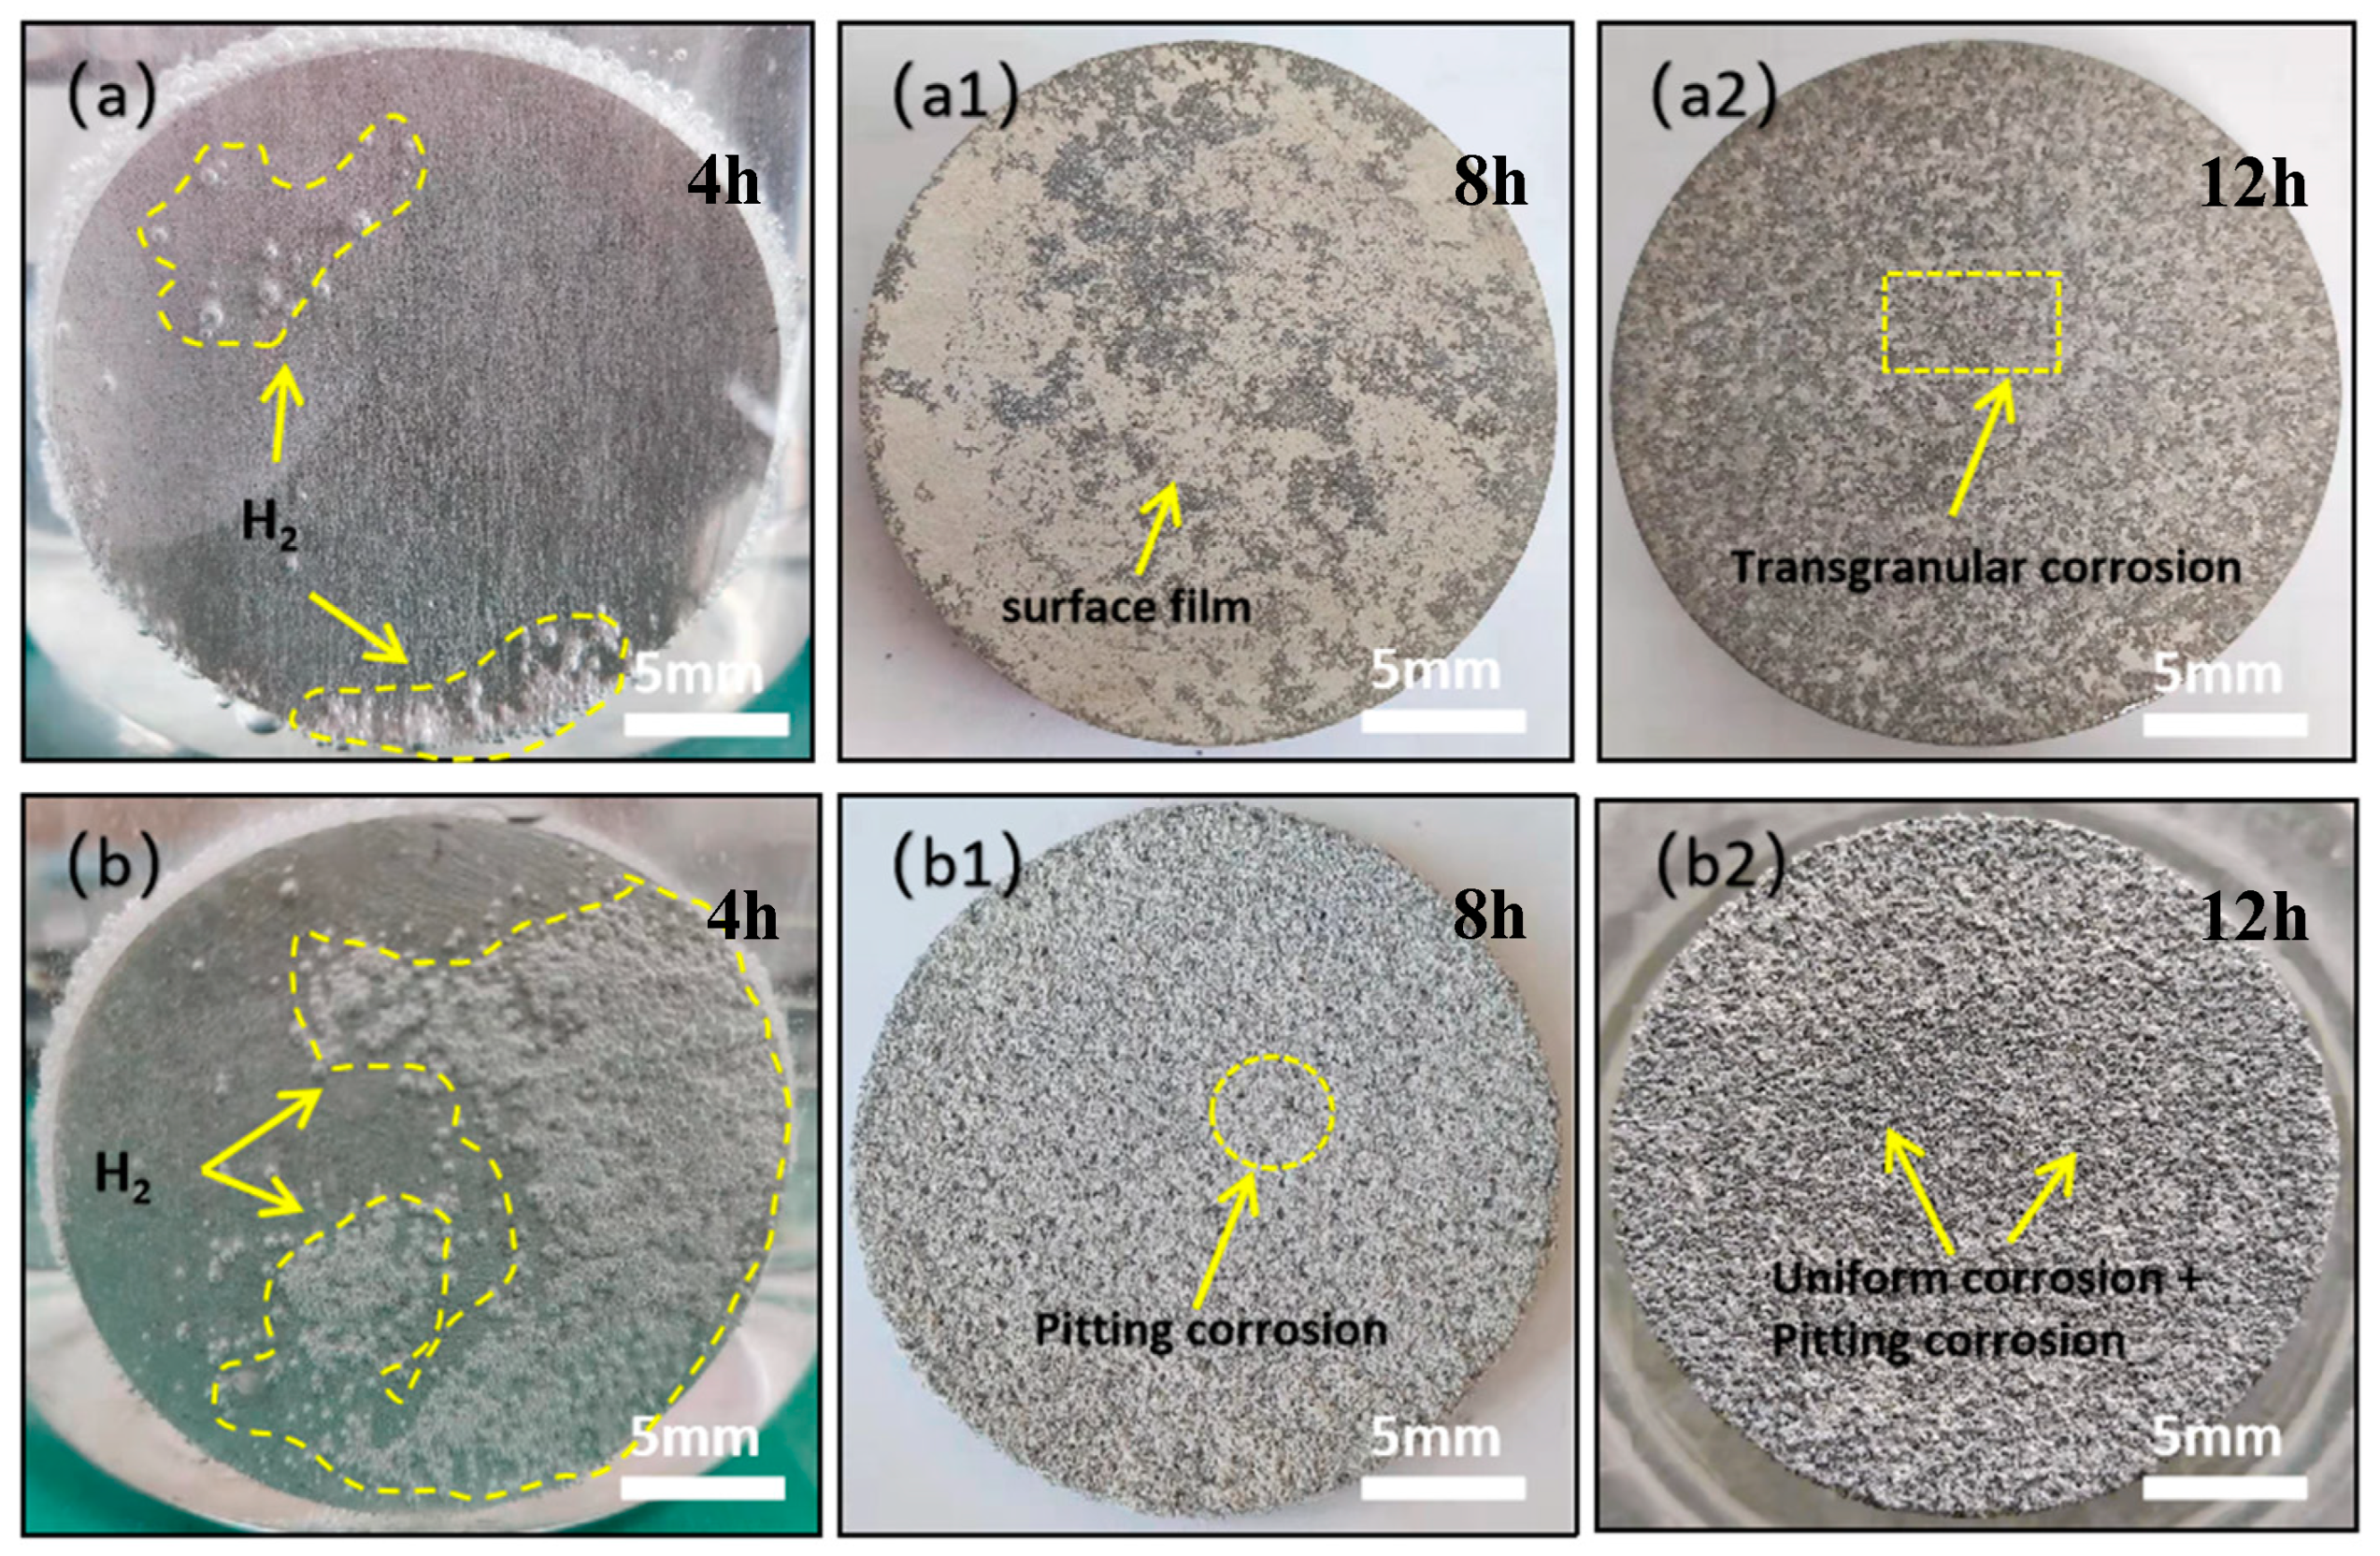
Figure 4.
(a) Calculated dissolution rate curves for as-cast and variomorphic forms; (b) change in weight gradient between as-cast and variomorphic forms.
Figure 4.
(a) Calculated dissolution rate curves for as-cast and variomorphic forms; (b) change in weight gradient between as-cast and variomorphic forms.
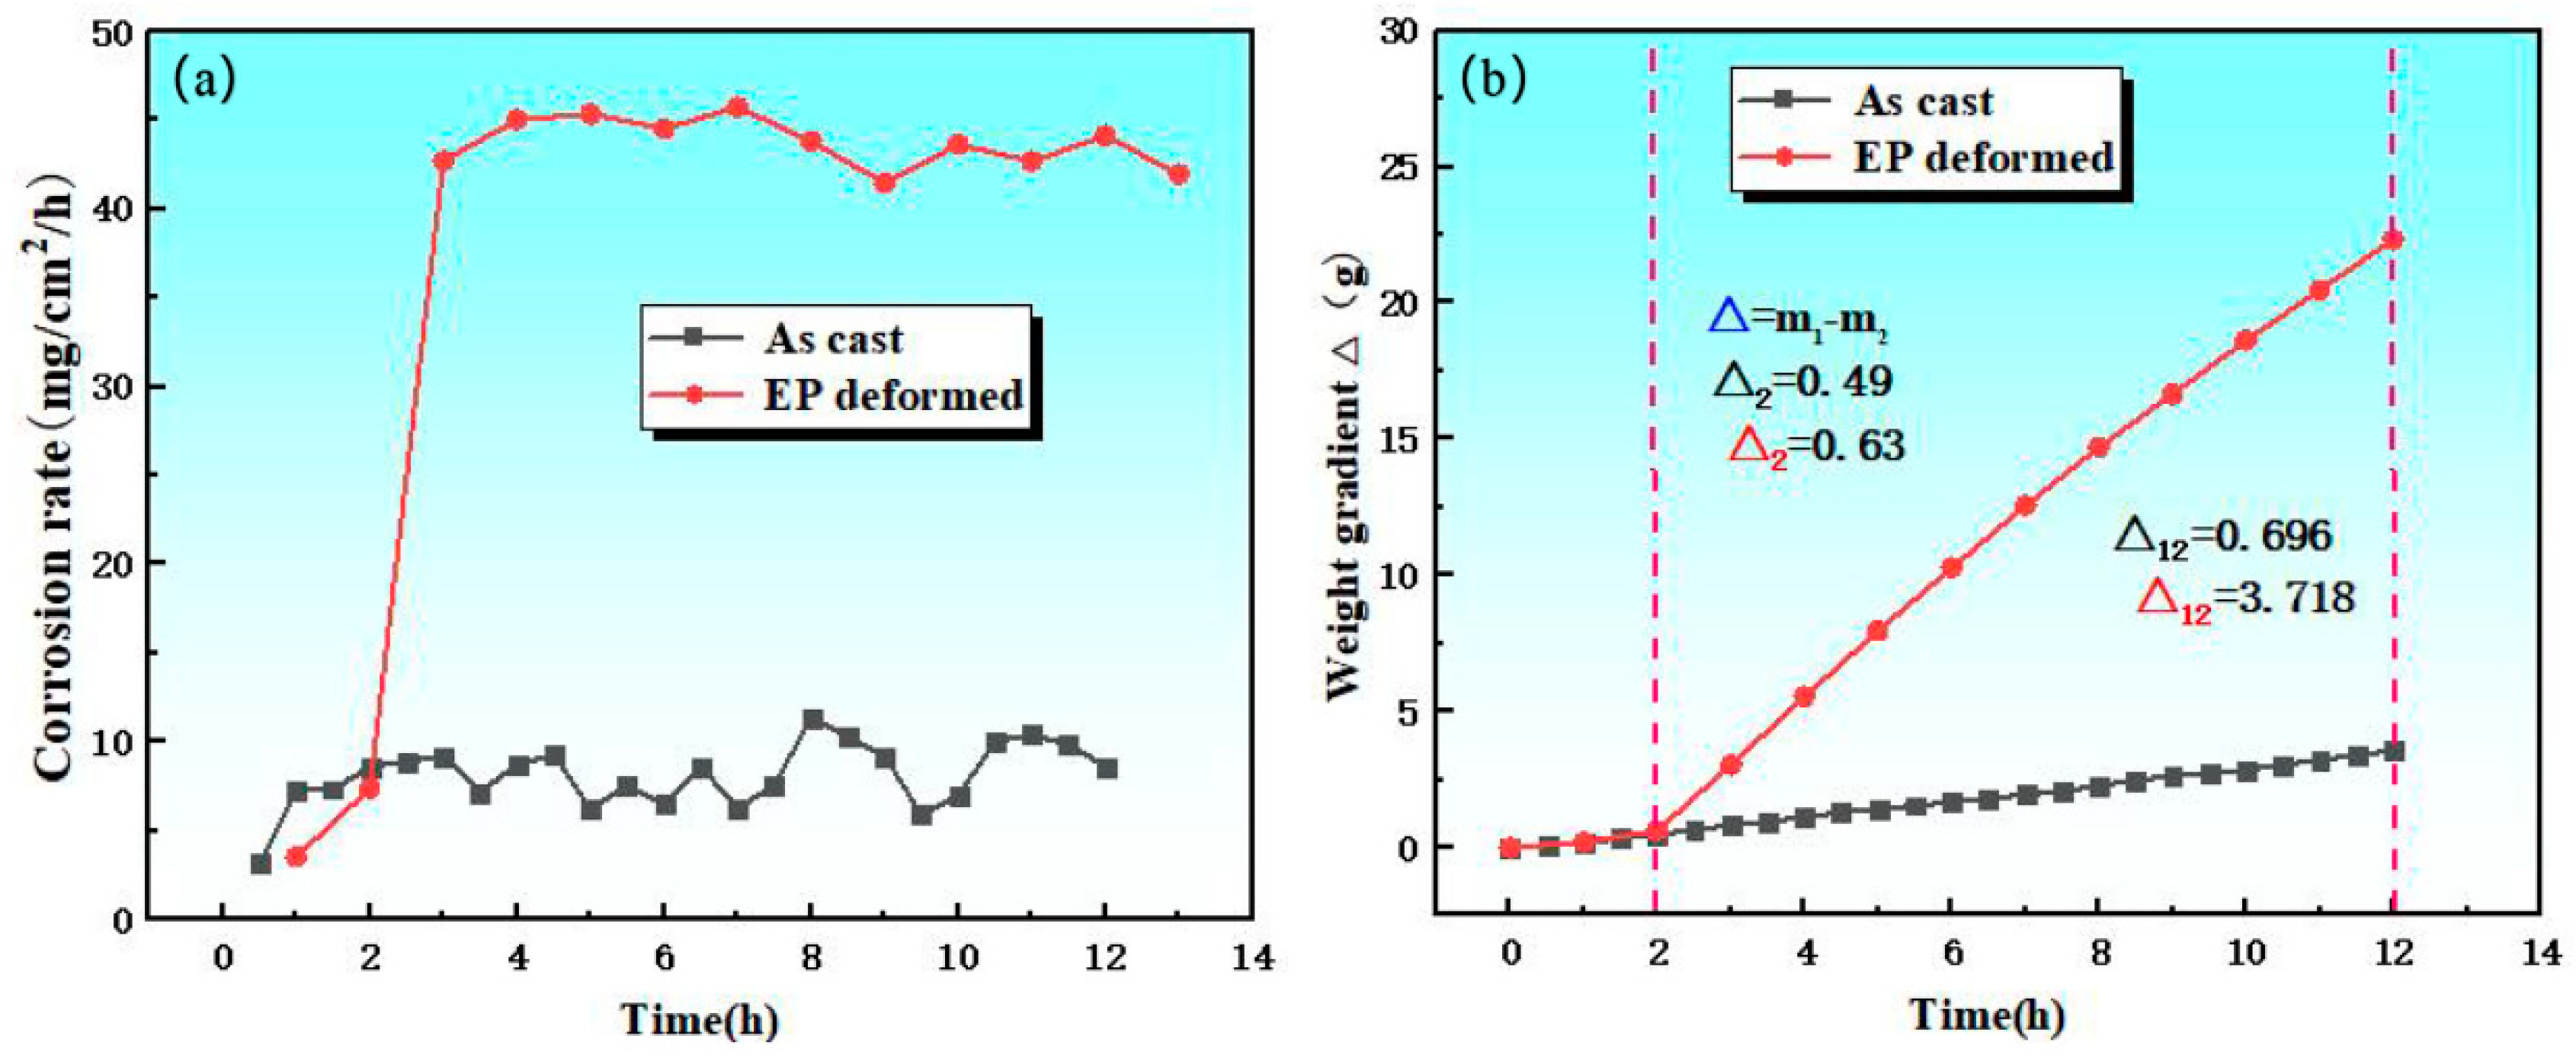
Figure 5.
Mg-Gd-based soluble magnesium alloy as-cast and metamorphic XRD test results.
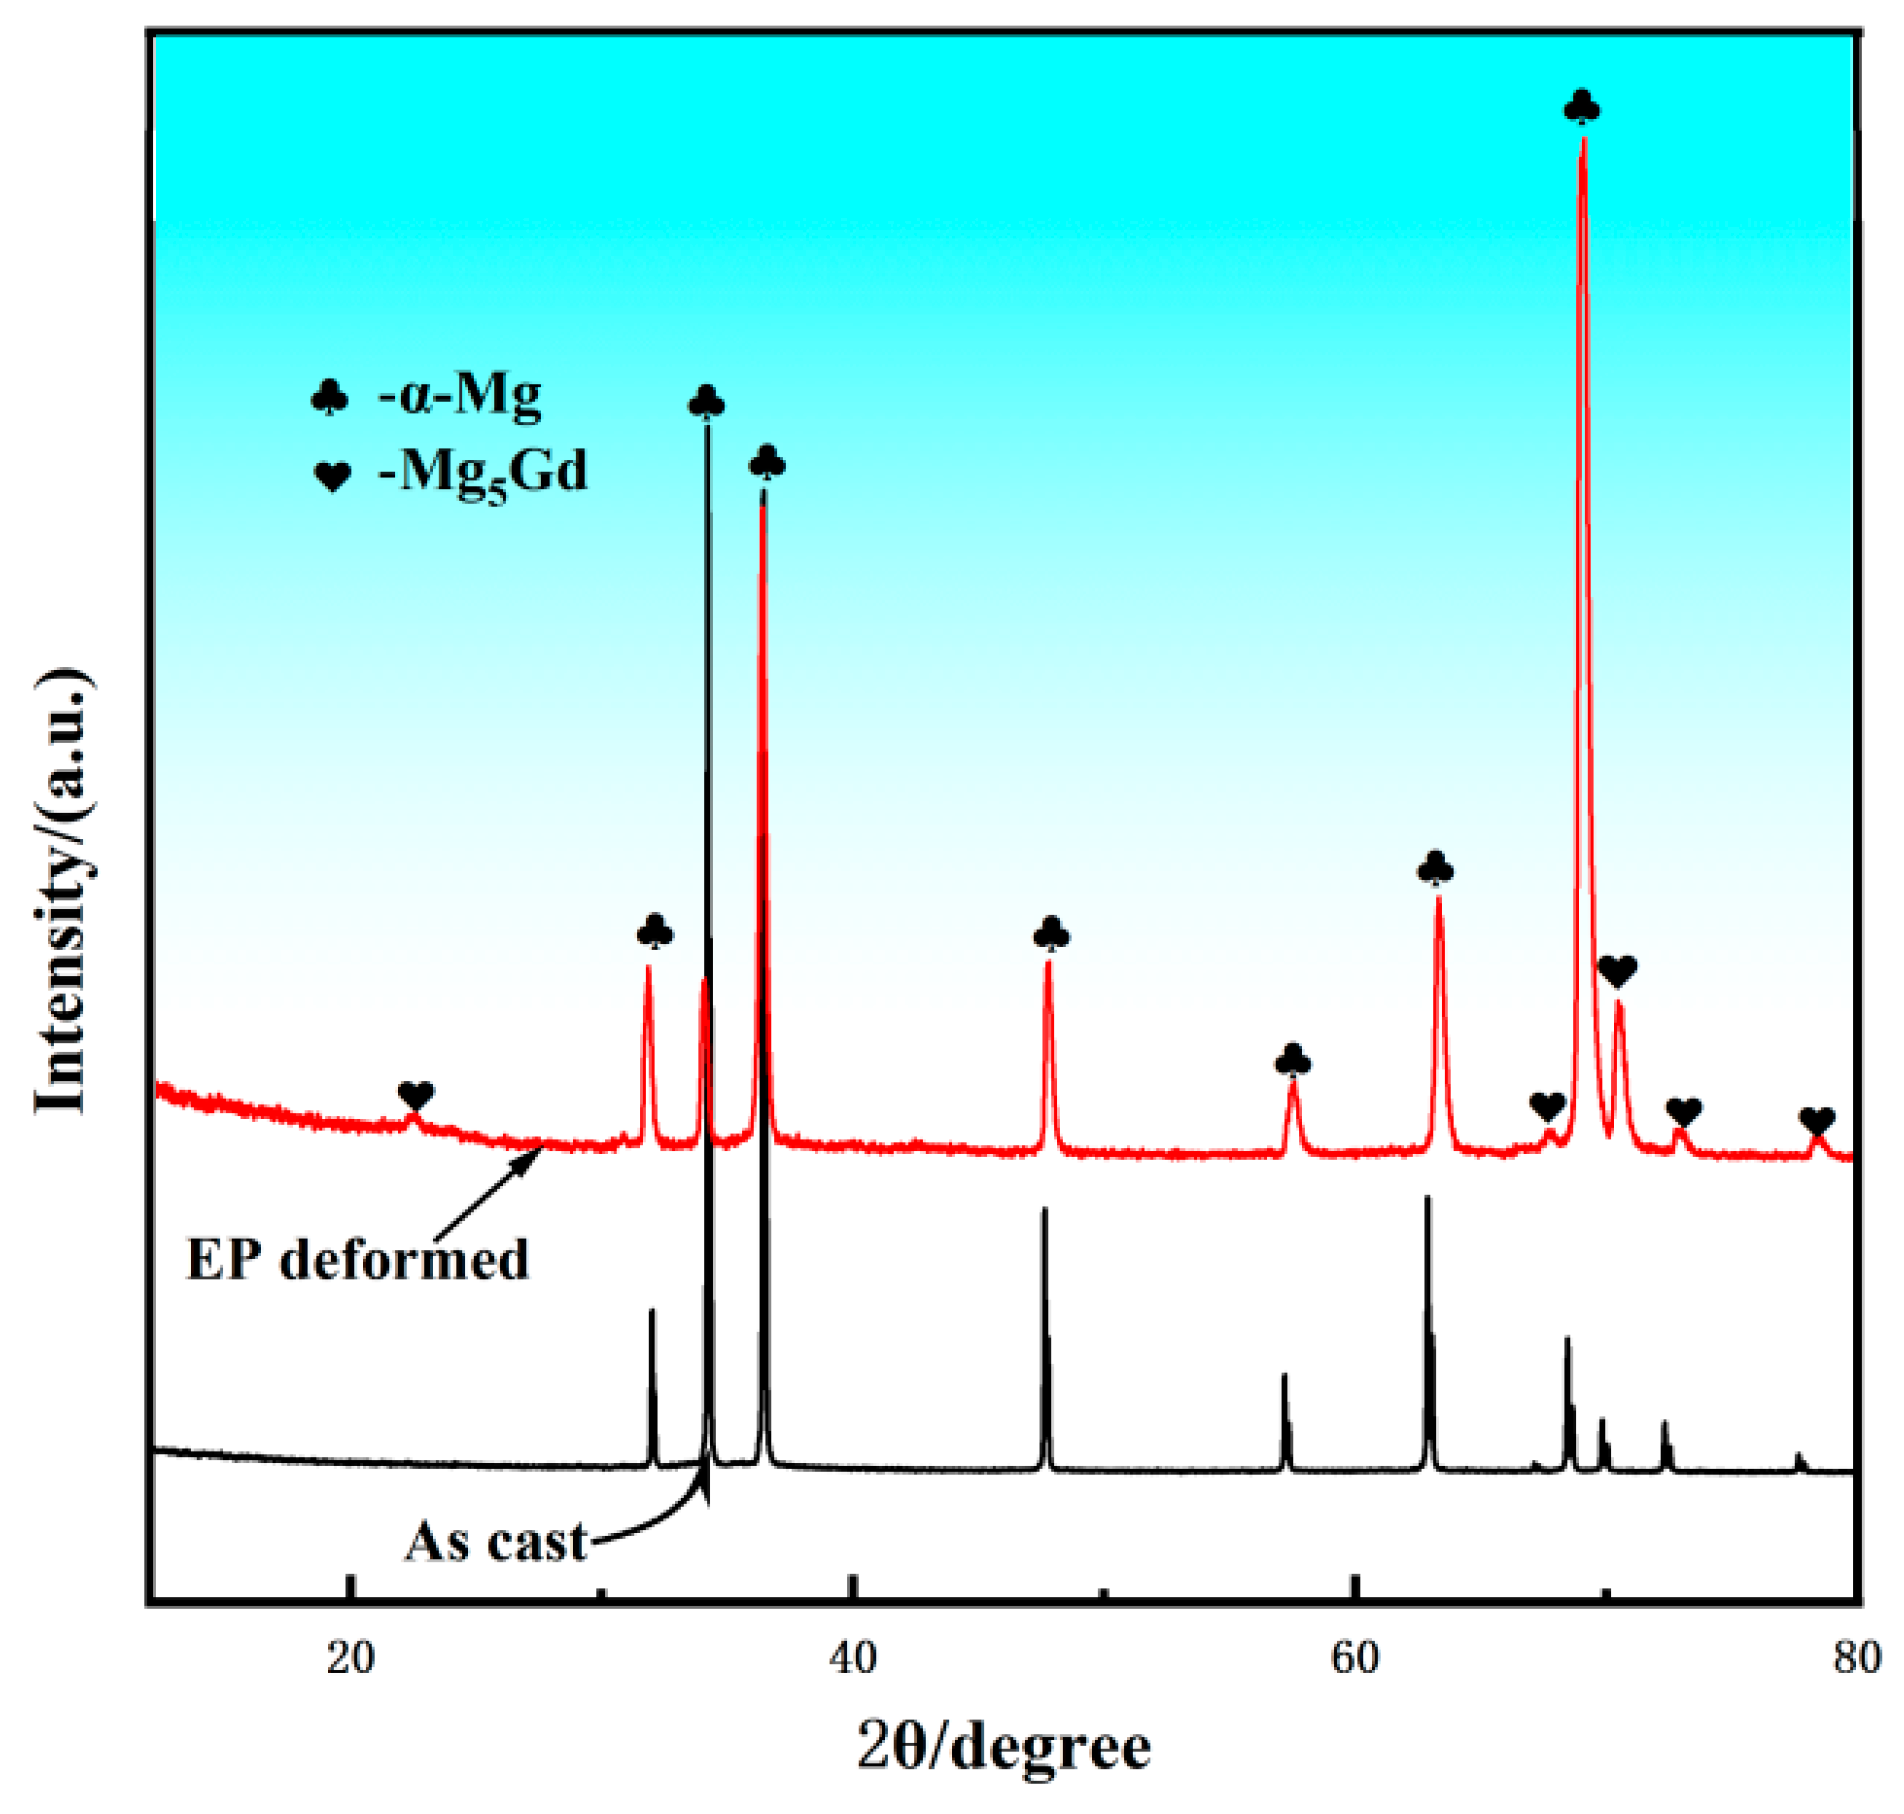
Figure 6.
Measurement curve of the dissolution rate of the second phase Mg5Gd with α-Mg matrix and macroscopic morphology of dissolved specimens.
Figure 6.
Measurement curve of the dissolution rate of the second phase Mg5Gd with α-Mg matrix and macroscopic morphology of dissolved specimens.
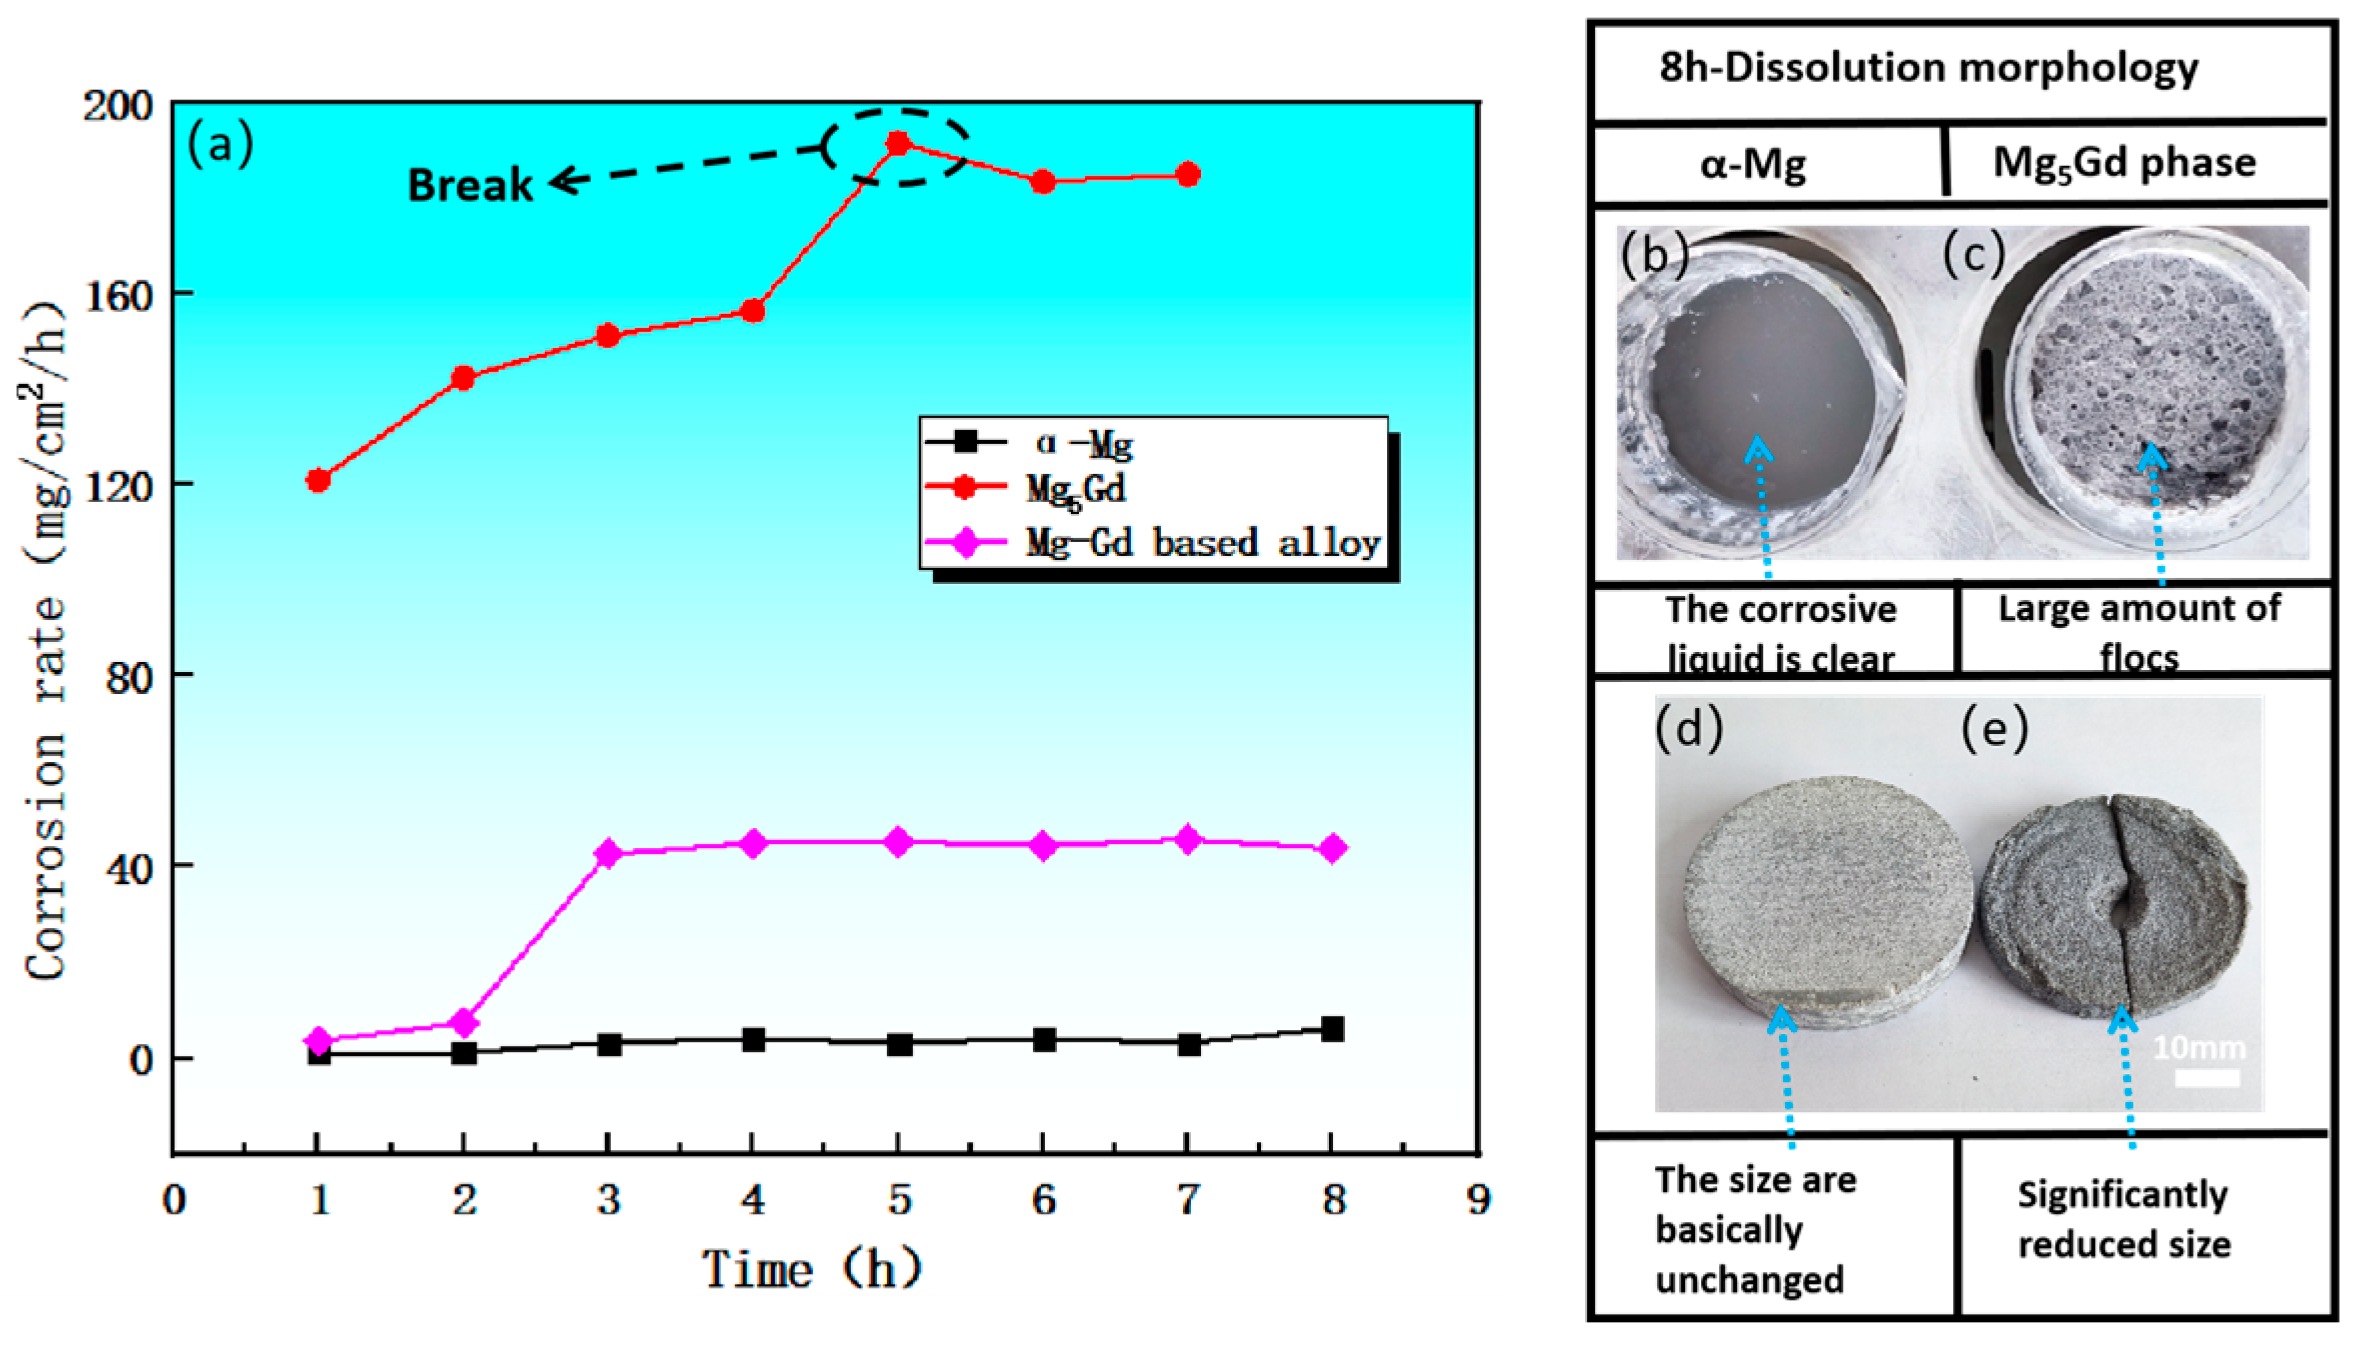
Figure 7.
α-Mg matrix and second phase Mg5Gd (a) polarization curves; (b) Nyquist plots; (c) Porter plots; (d) equivalent circuit diagrams.
Figure 7.
α-Mg matrix and second phase Mg5Gd (a) polarization curves; (b) Nyquist plots; (c) Porter plots; (d) equivalent circuit diagrams.
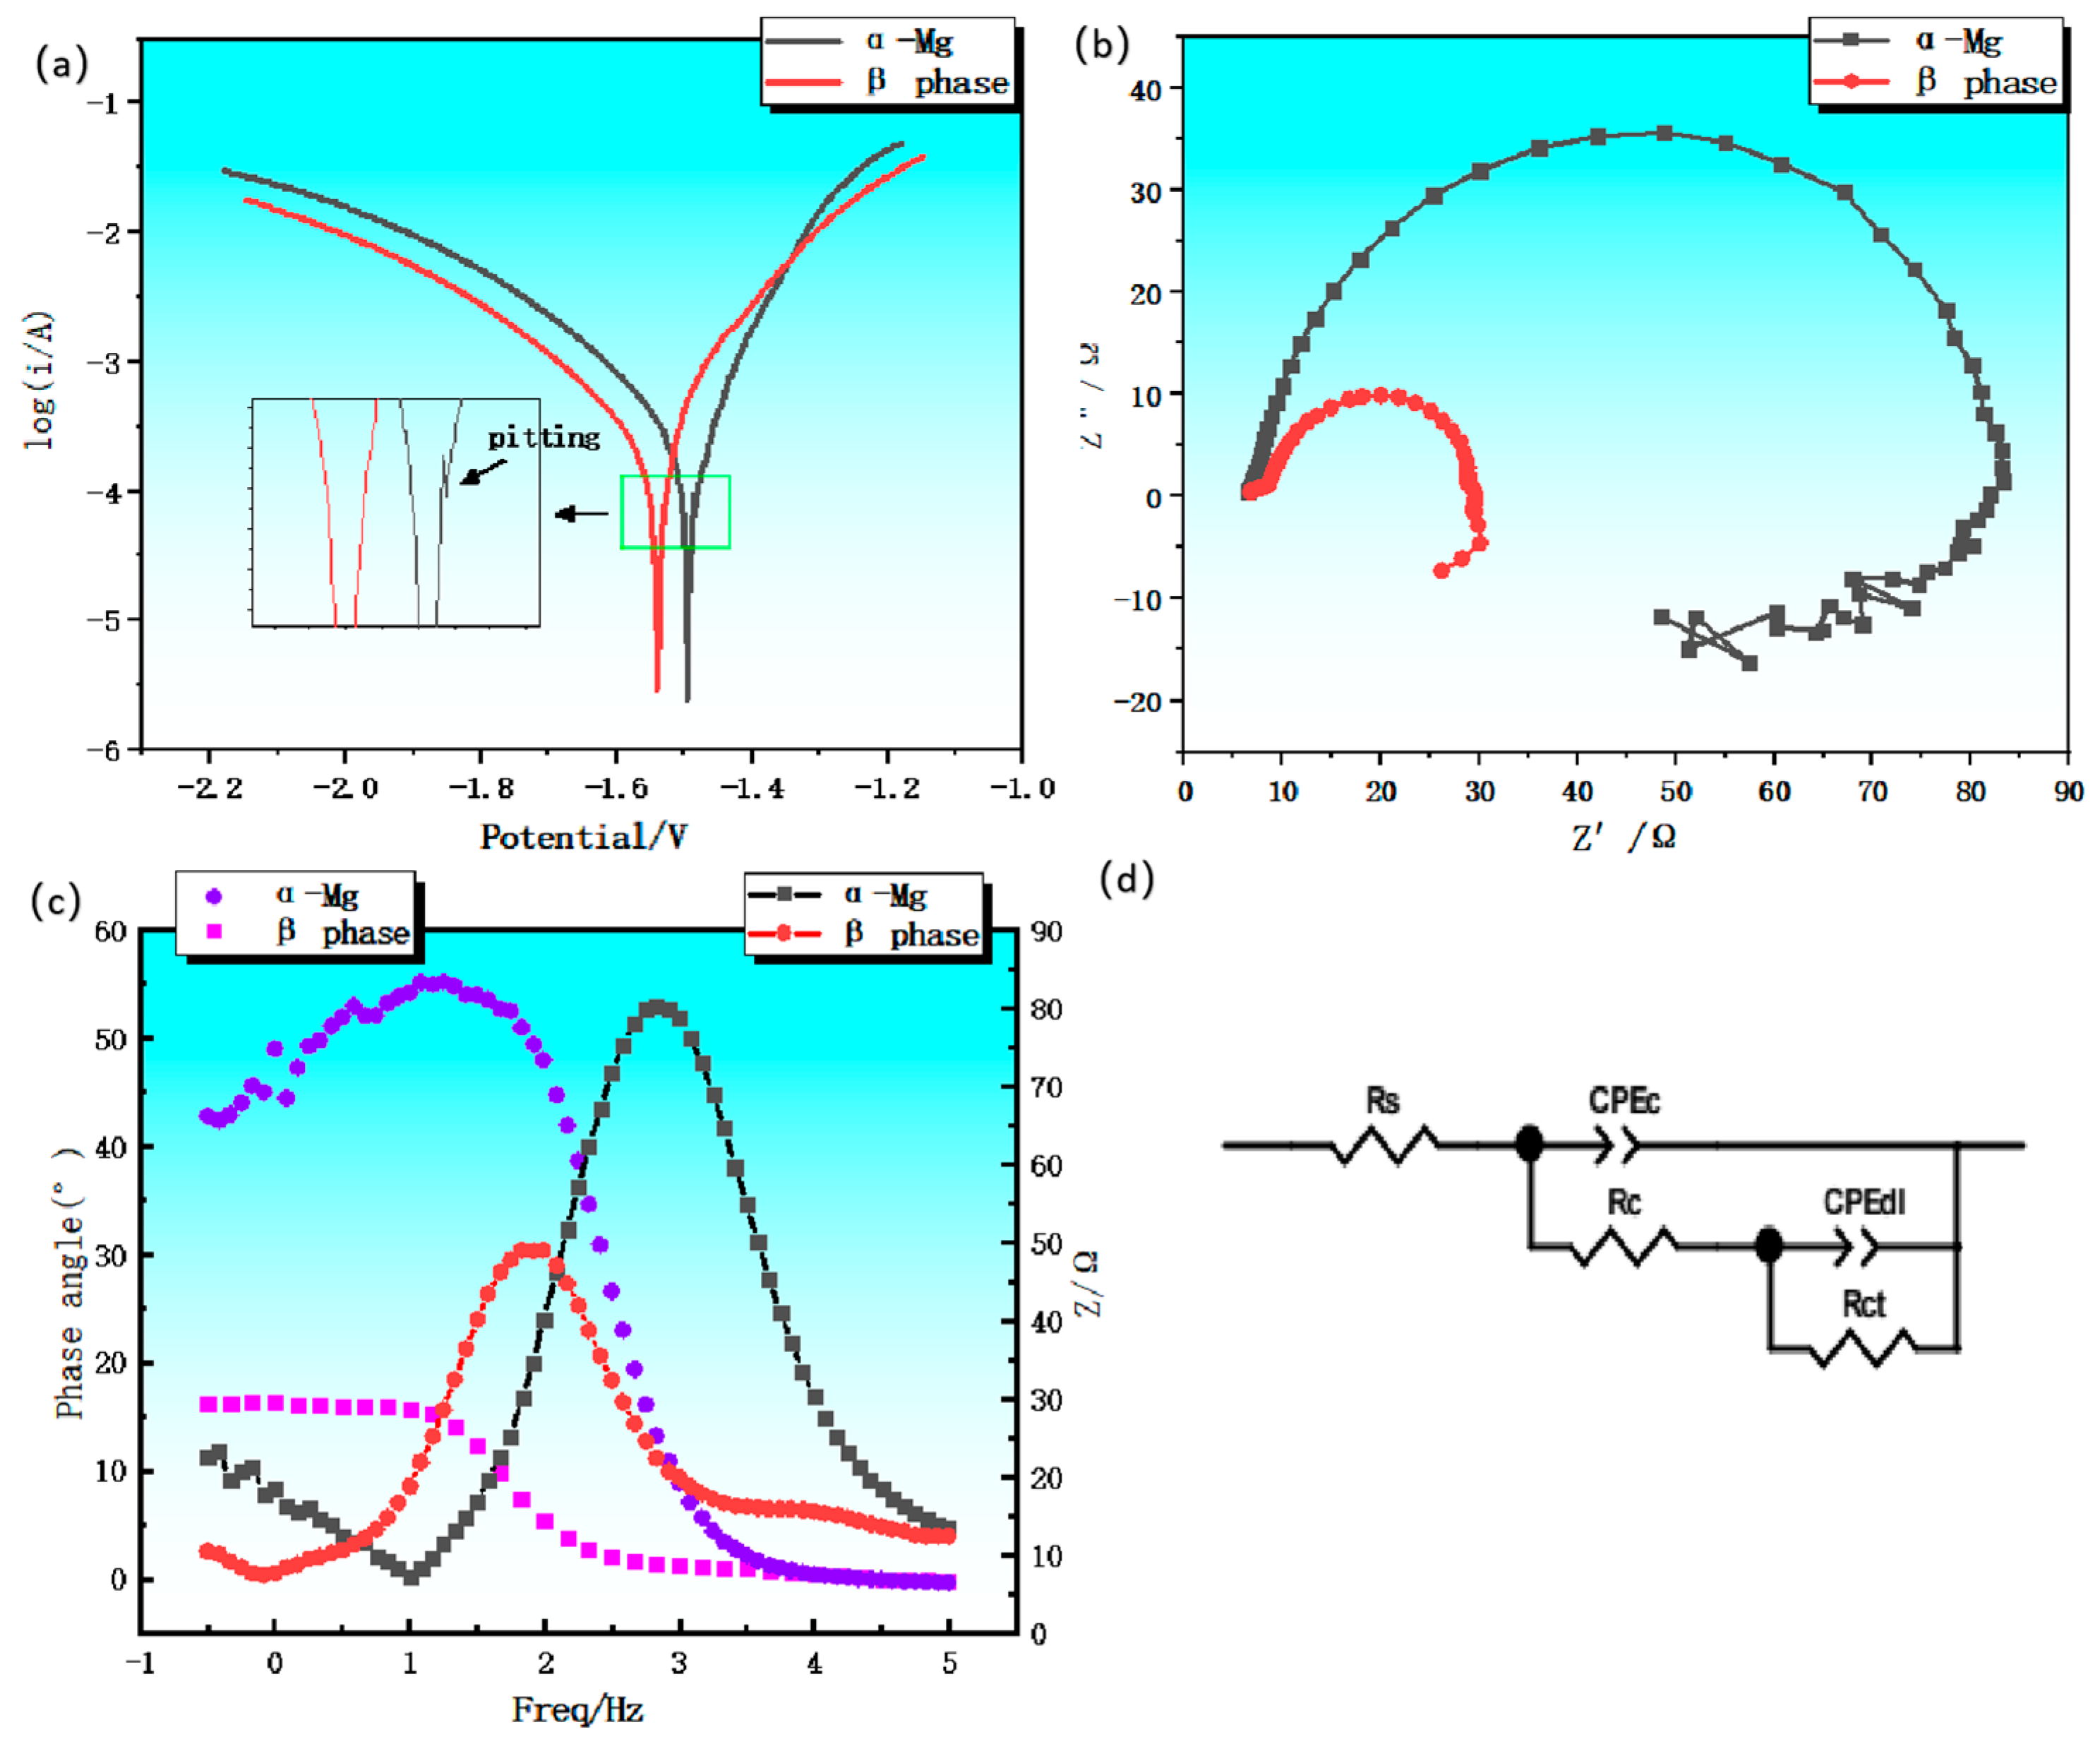
Figure 8.
Mg-Gd-based soluble magnesium alloys at 93 °C with different Cl- concentrations:. (a) Dissolution rate curves; (b). Weight loss and corrosion rate after 16h of corrosion; (c) Schematic diagram of corrosion products in the beaker after 16h of dissolution; (d) Comparison of specimen thickness after 16h of corrosion.
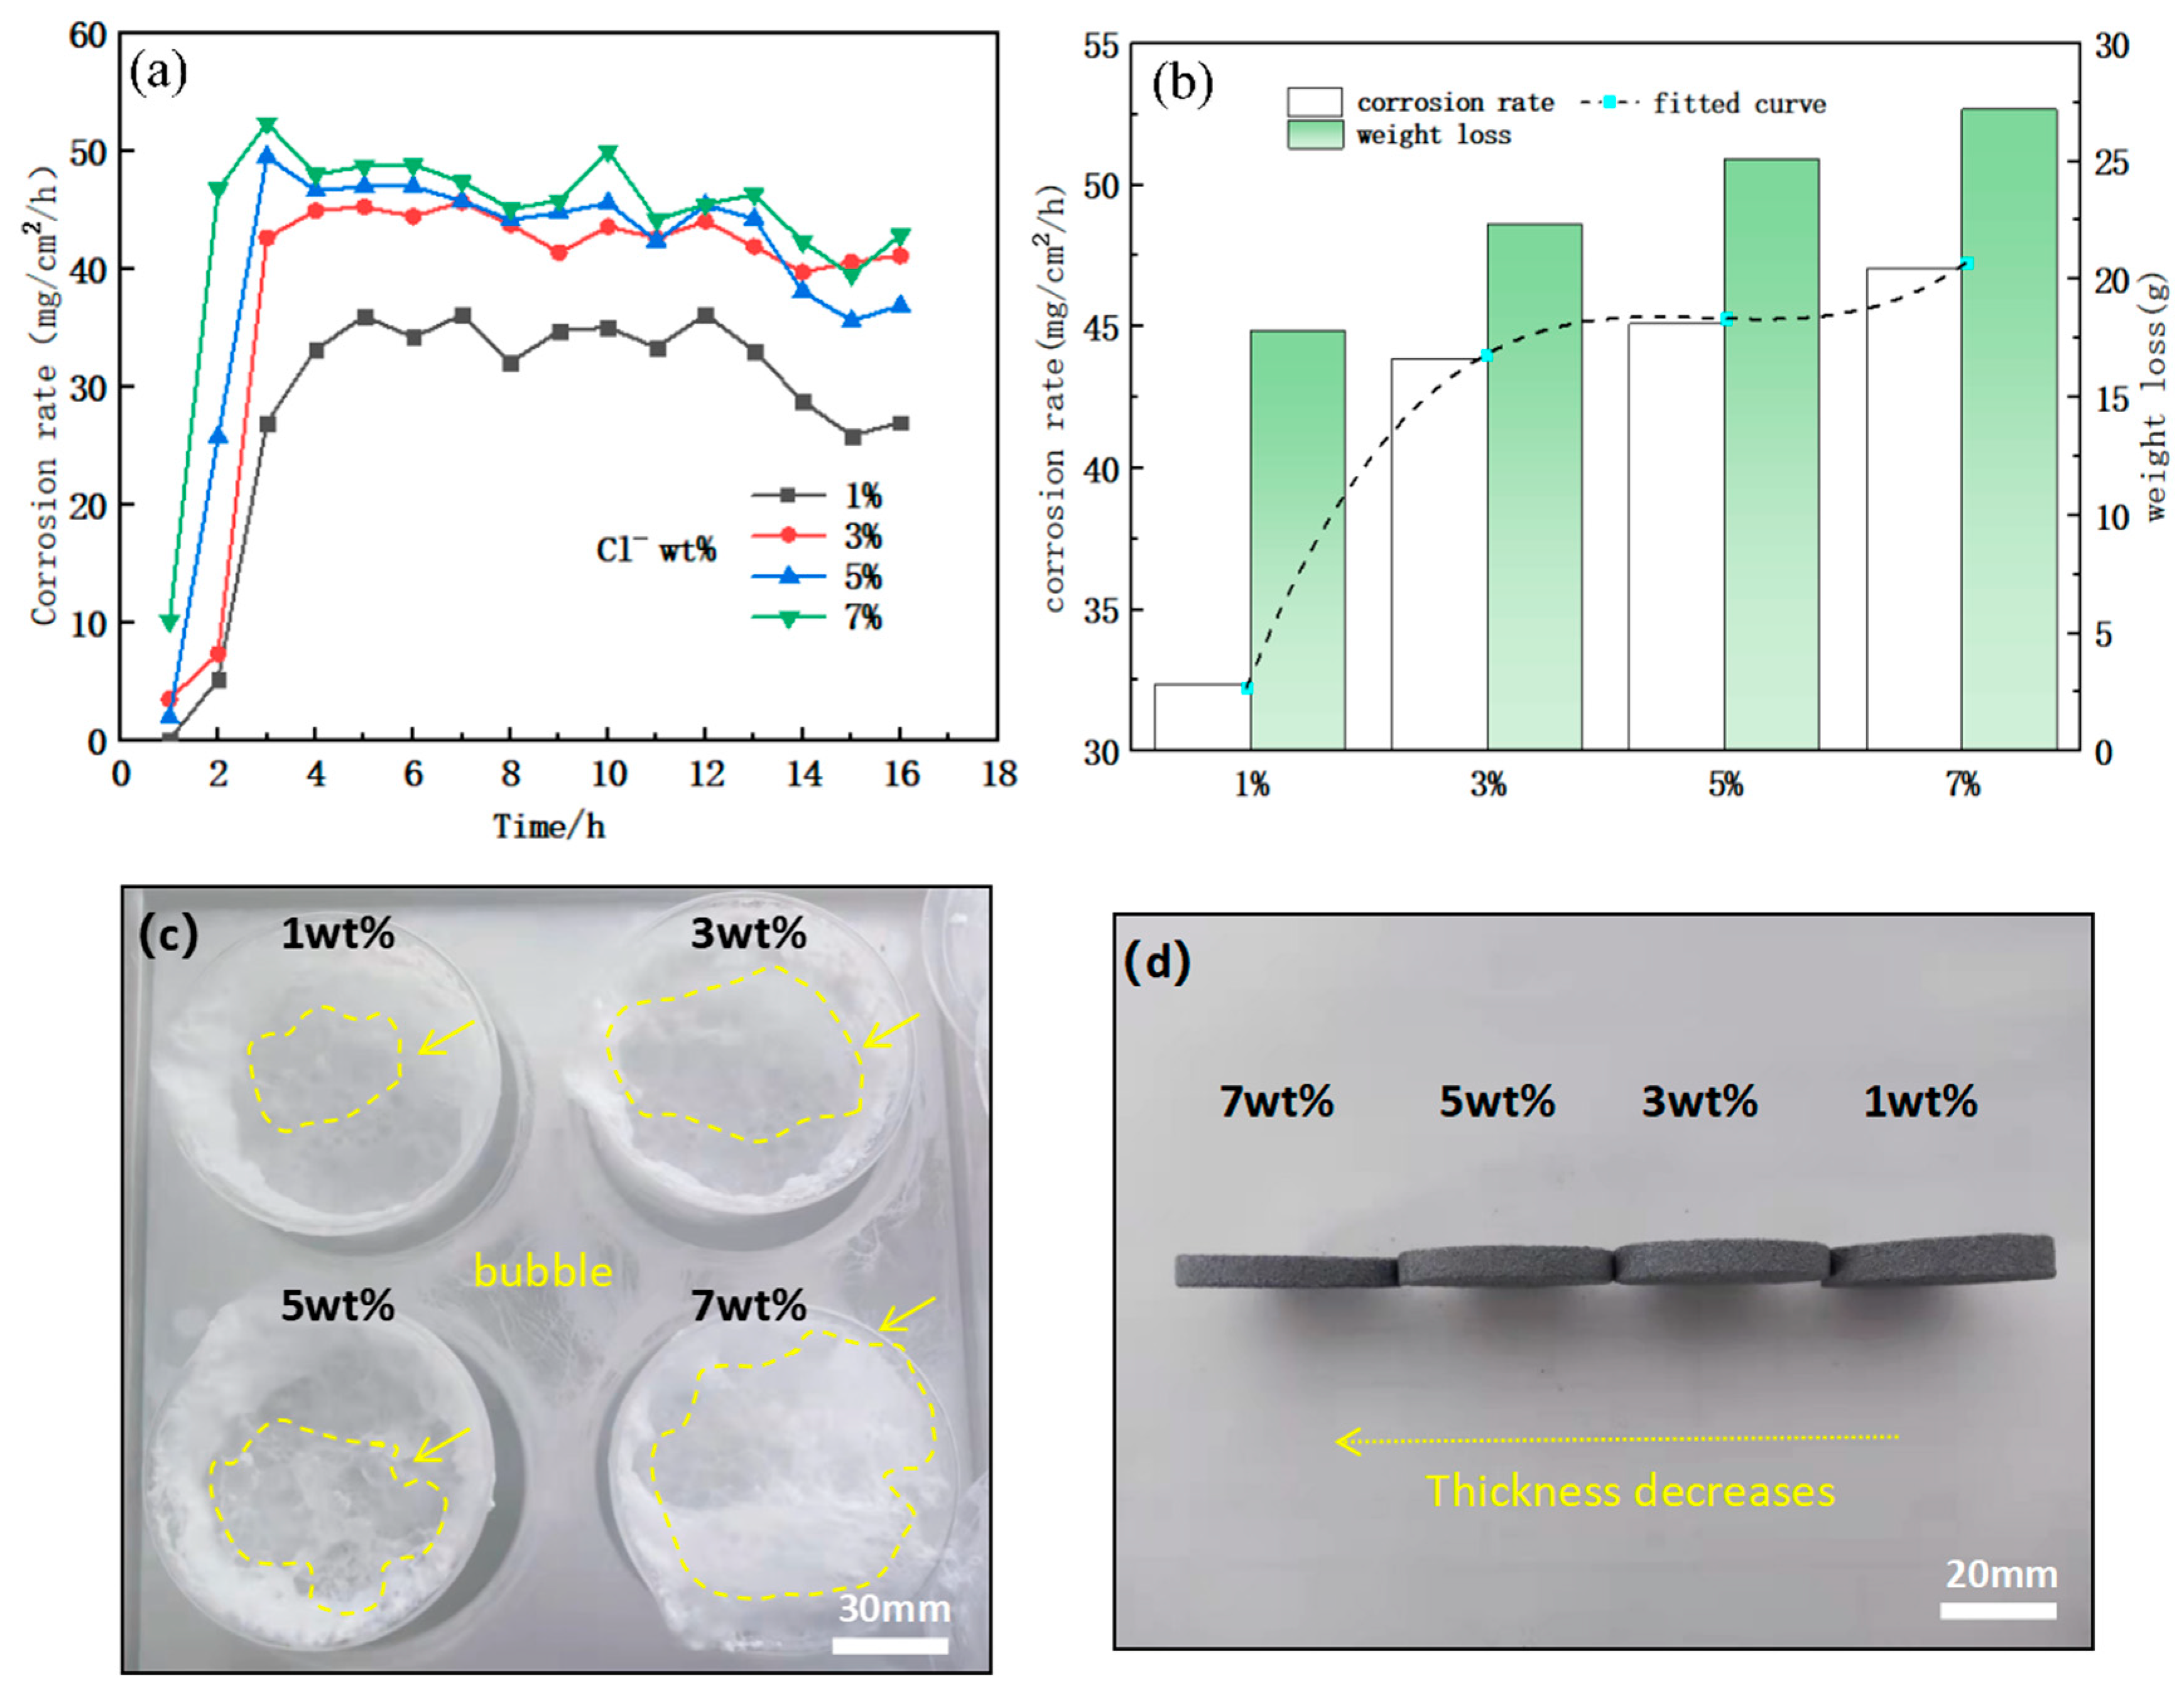
Figure 9.
Mg-gd-based soluble magnesium alloy dissolution products of (a), macroscopic morphology; (b) XRD compositional analysis; (c,d), 3D renderings.
Figure 9.
Mg-gd-based soluble magnesium alloy dissolution products of (a), macroscopic morphology; (b) XRD compositional analysis; (c,d), 3D renderings.
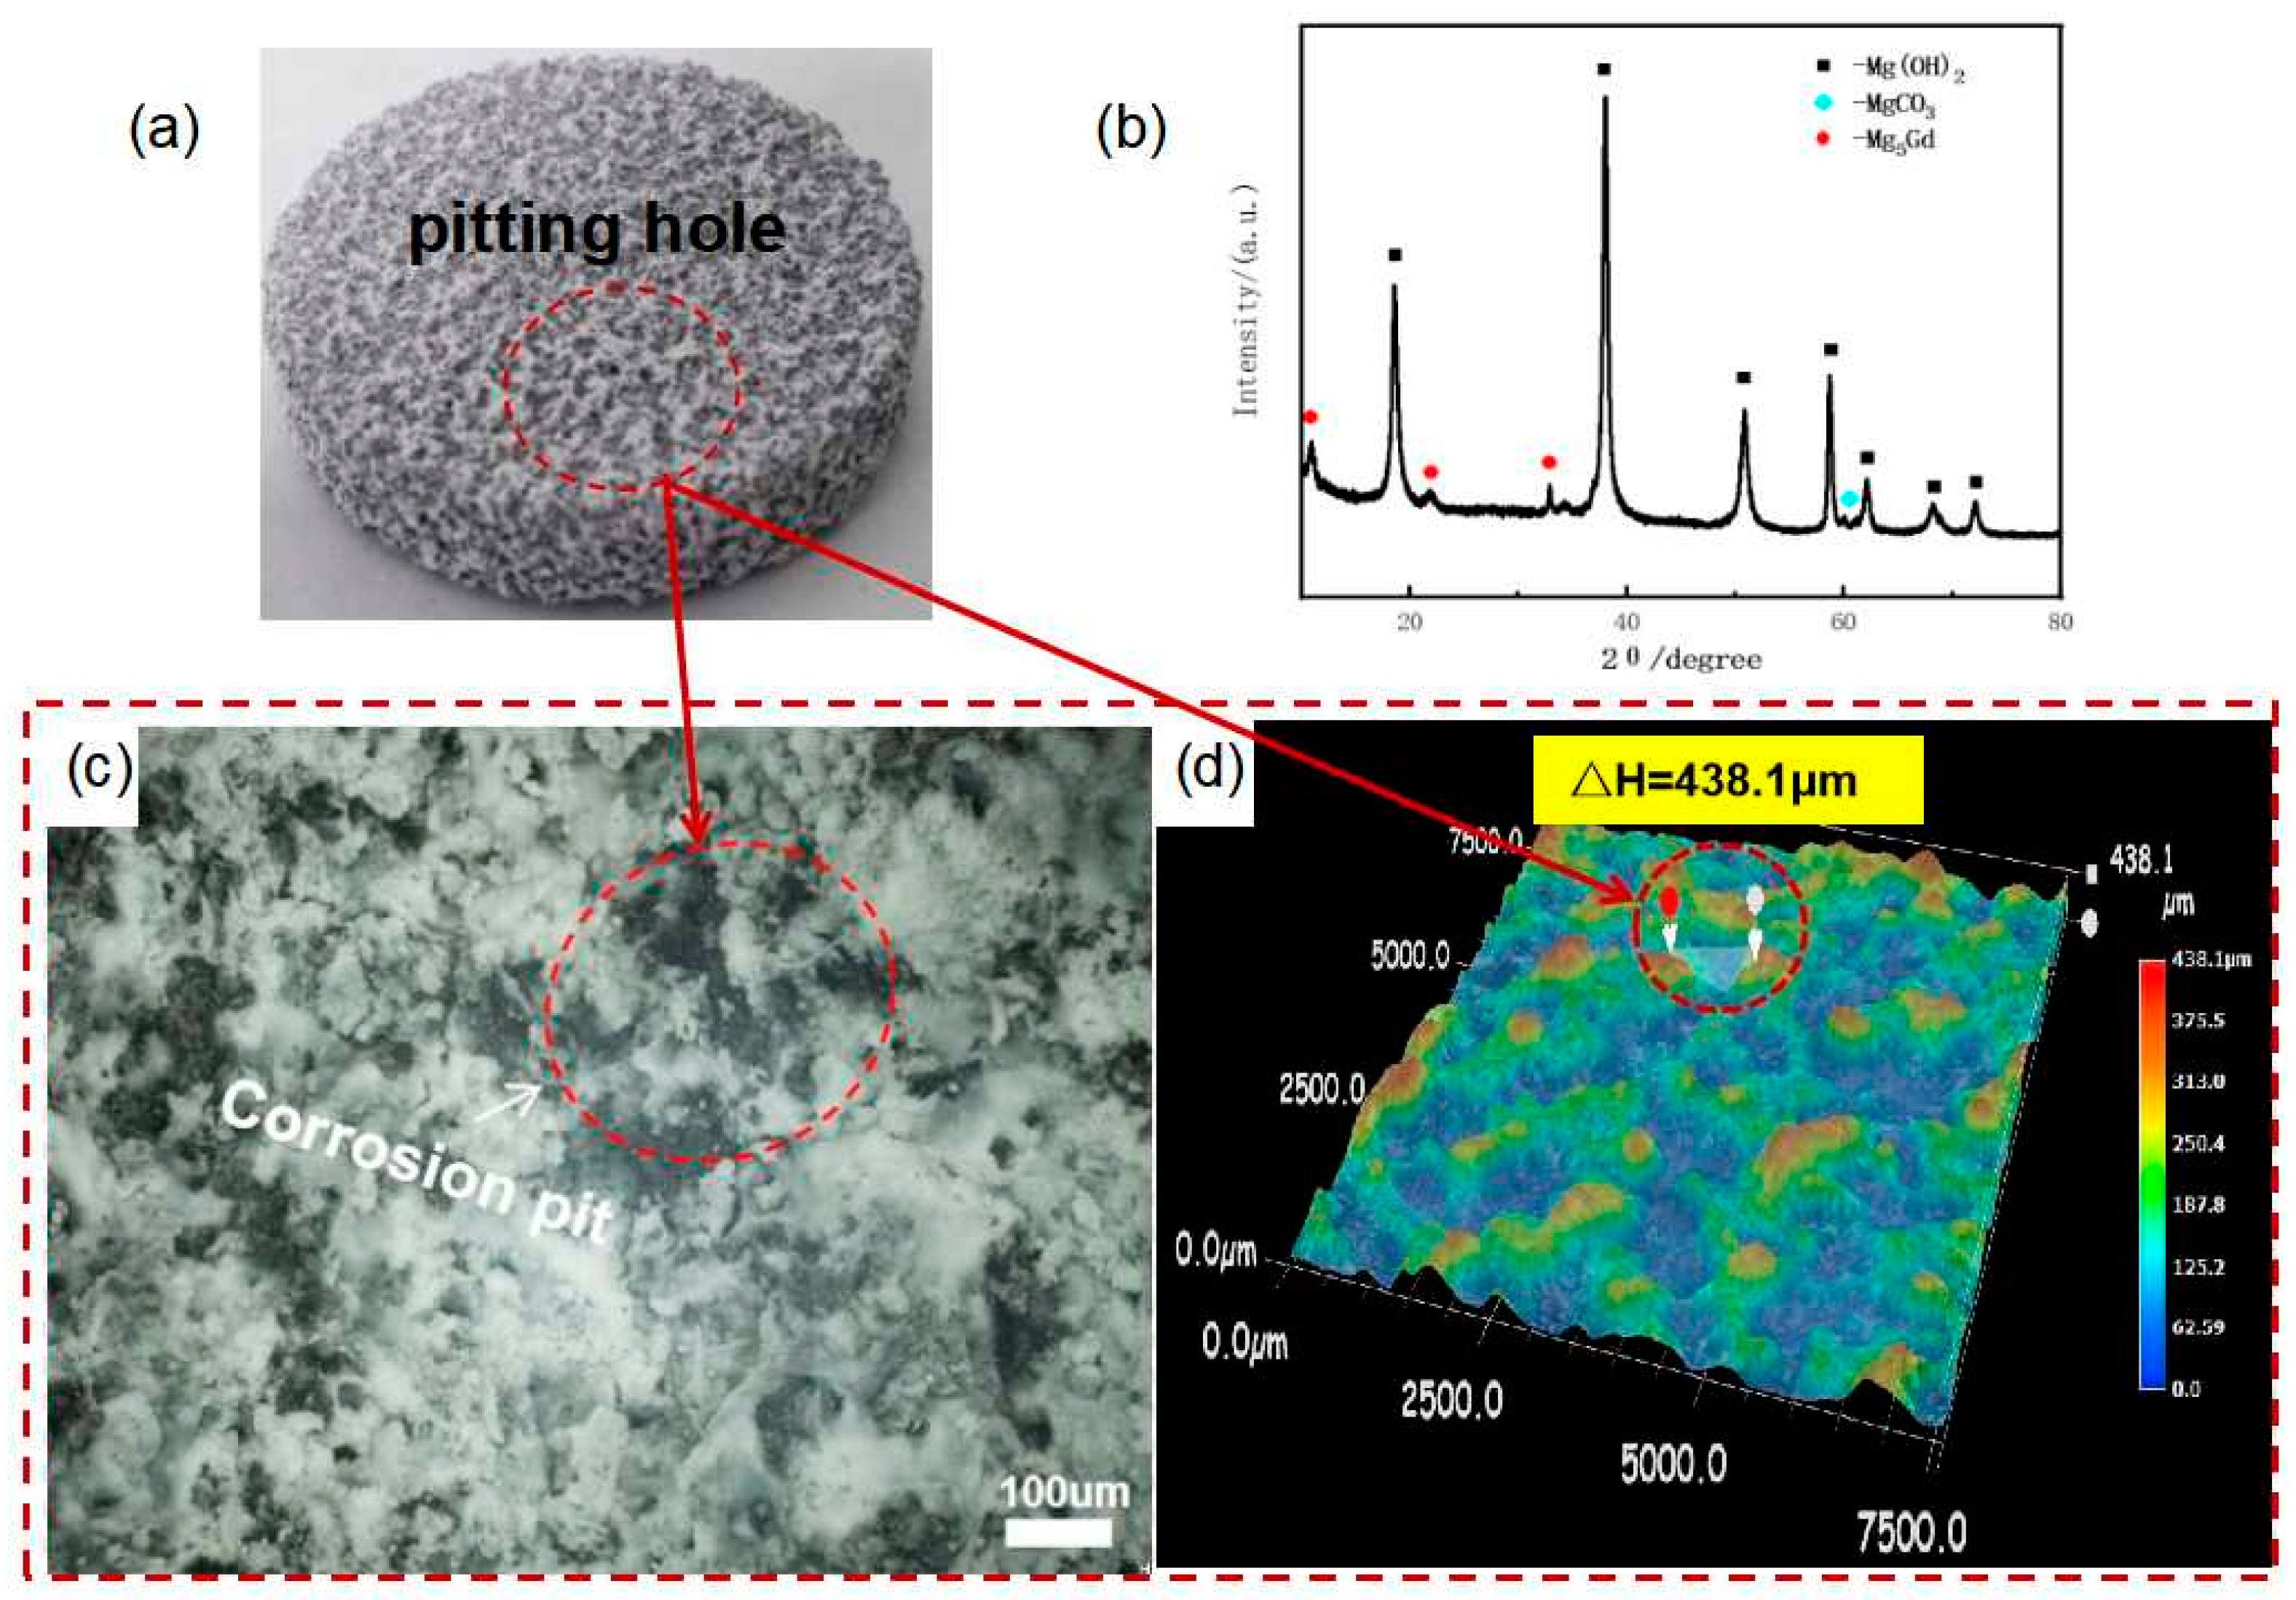
Figure 10.
Schematic diagram of the effect of Cl- on the corrosion mechanism of magnesium alloys.
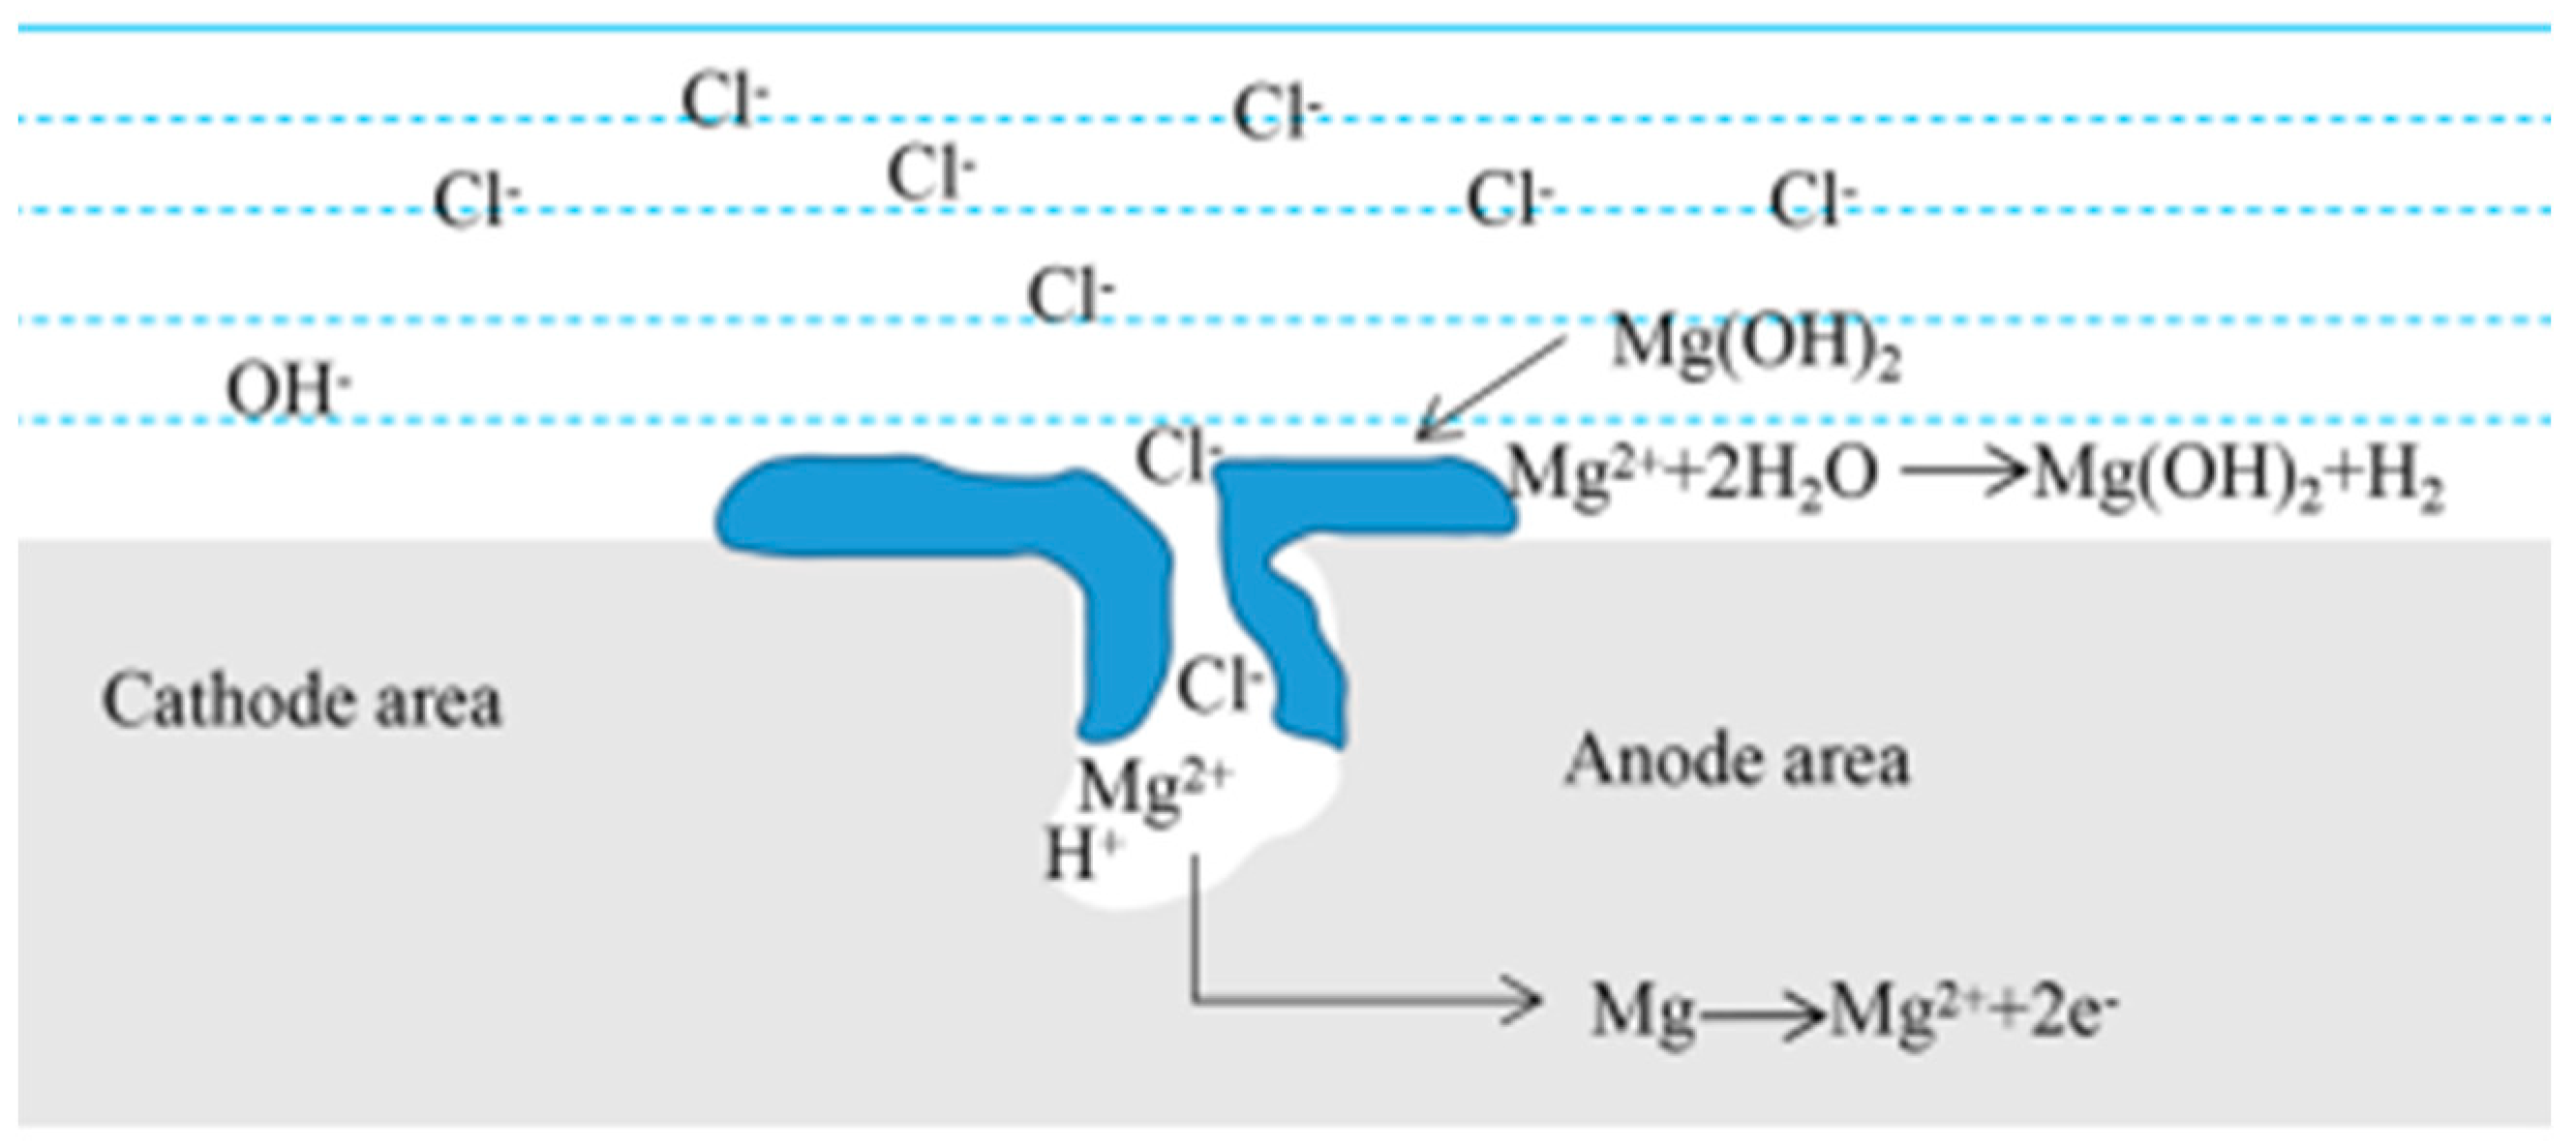
Figure 11.
Mg-Gd-based soluble magnesium alloy at a Cl- concentration of 3%: (a) dissolution rate curves at different temperatures; (b) weight loss and corrosion rate after 11 hours of corrosion at different temperatures; (c) surface morphology of corroded specimens after 25 °C and 1h; (d) surface morphology of corroded specimens after 100 °C and 1h;.
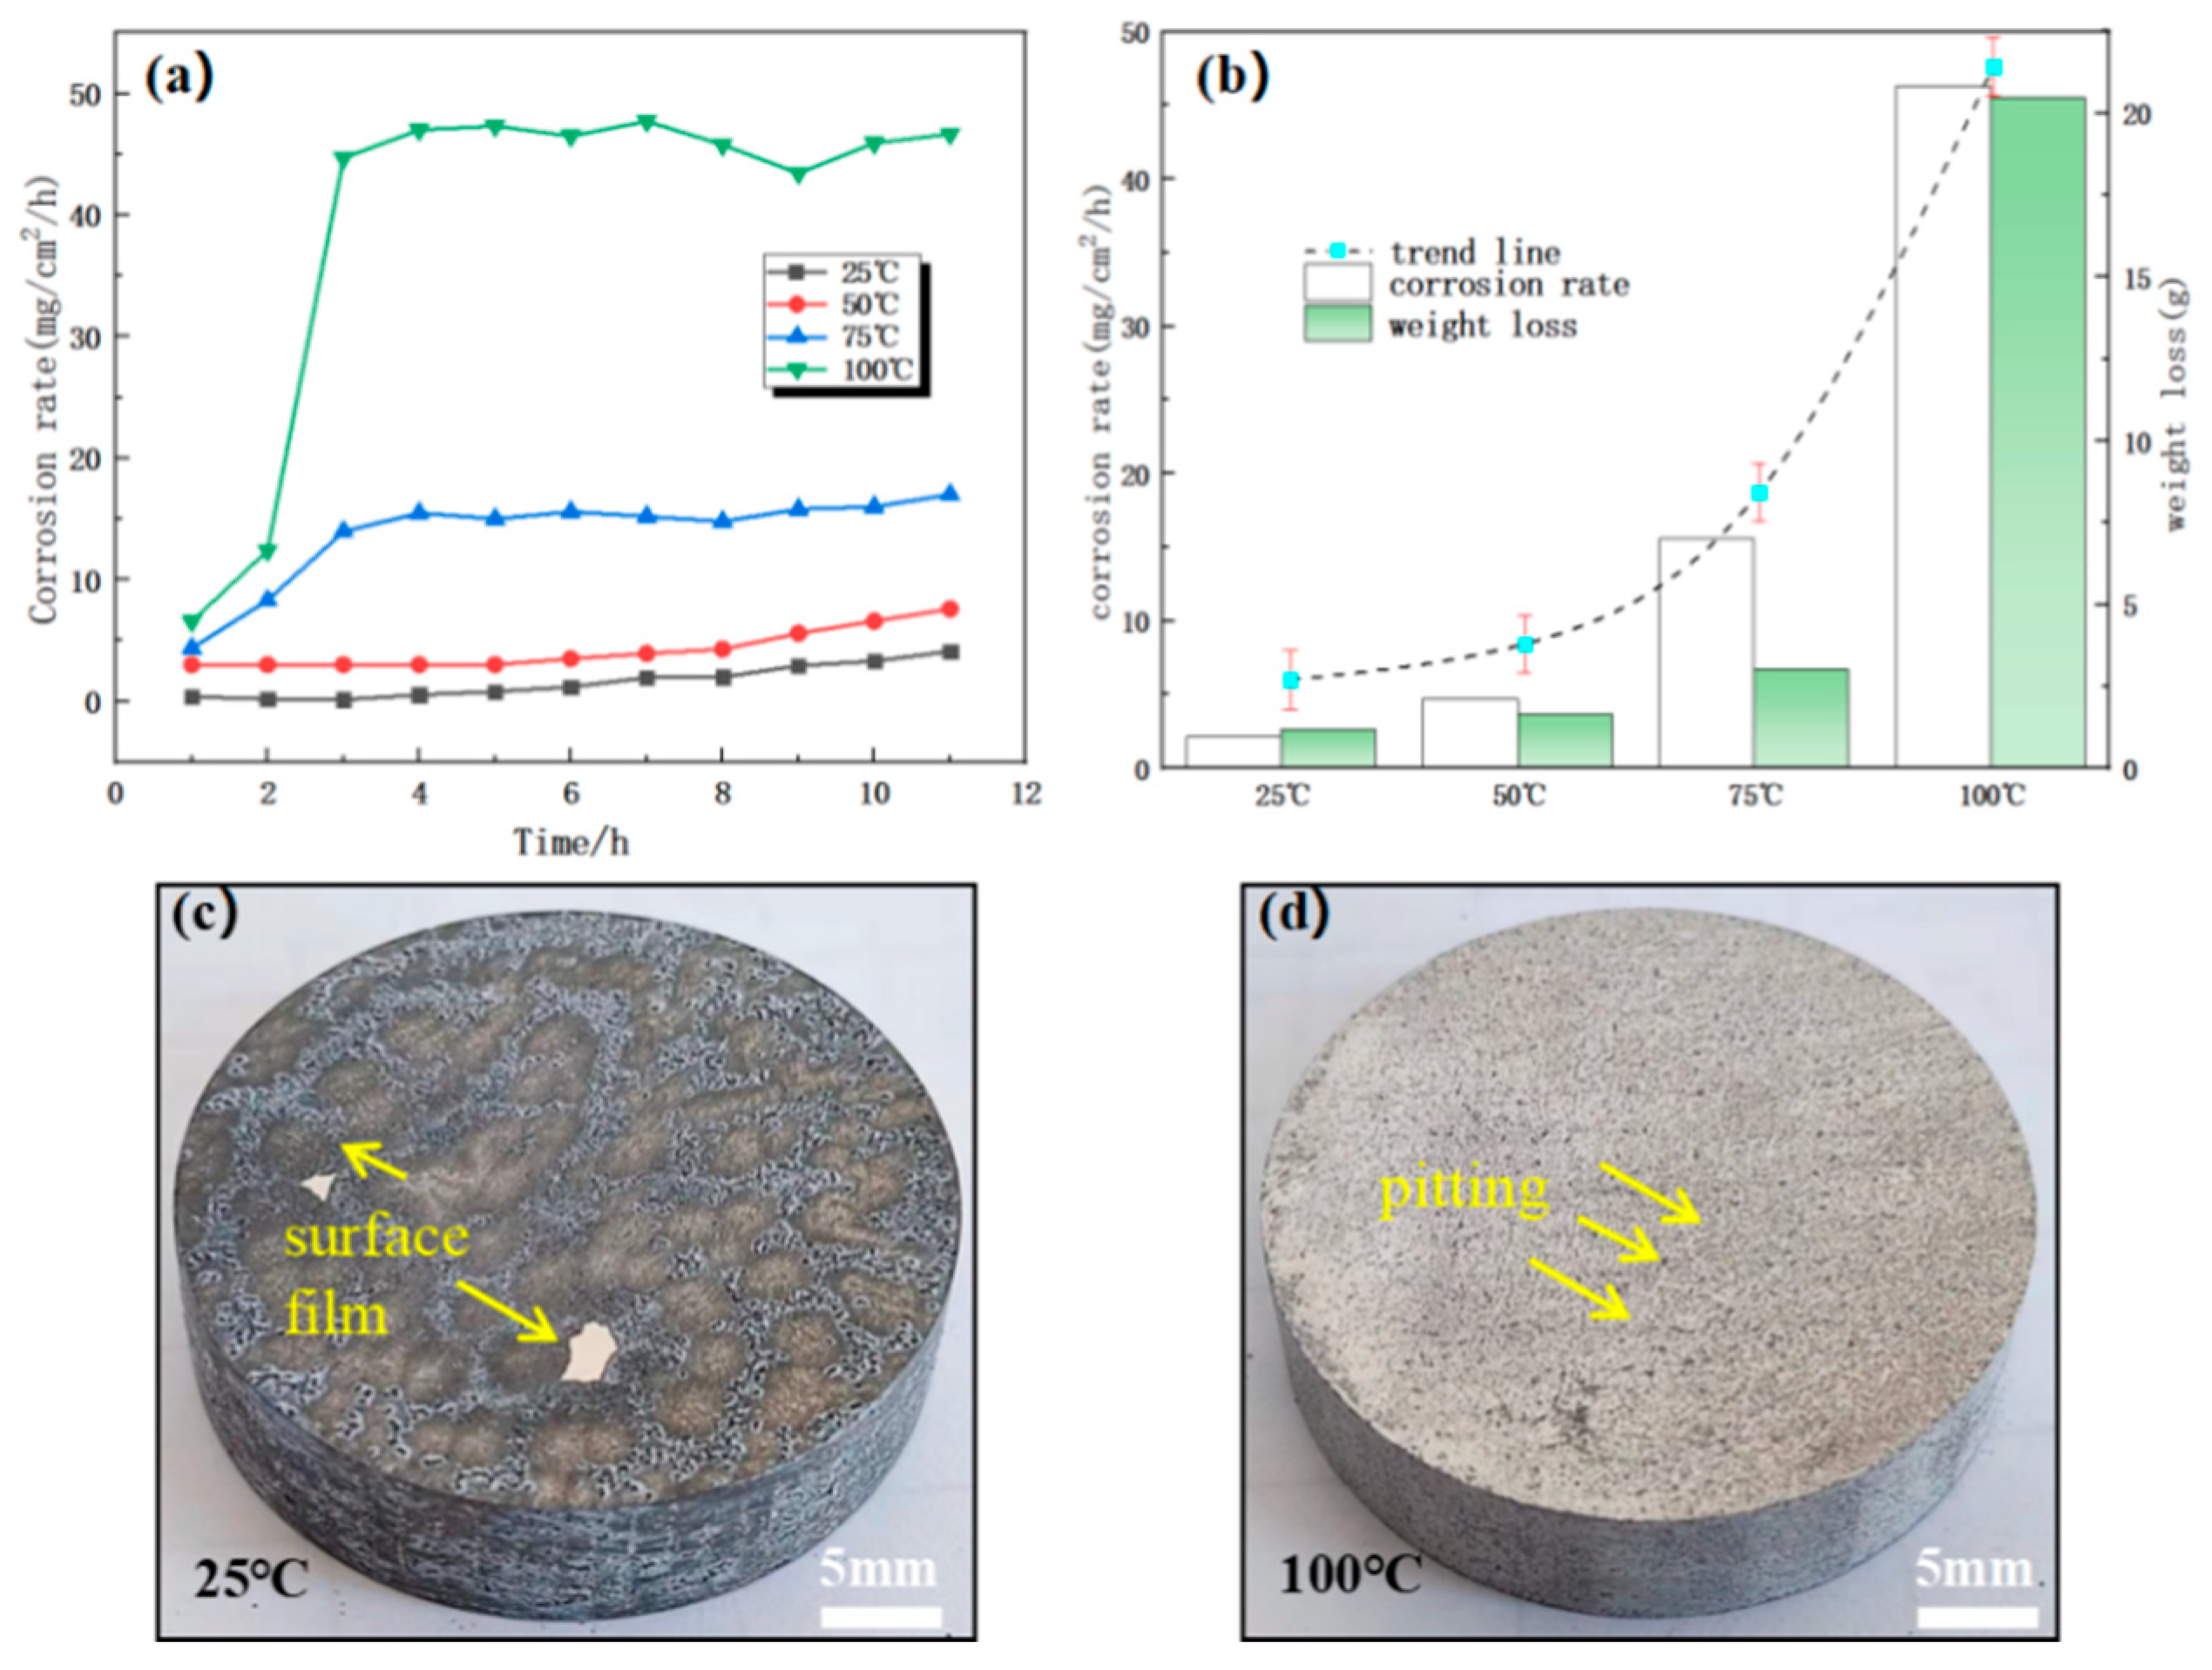
Figure 12.
Characterization of the product film on the surface of corroded parts at 25°C (a); xrd analysis of the product on the surface of corroded parts at different temperatures (b); Schematic representation of initial corrosion at 25 C (c) and 100 C (d).
Figure 12.
Characterization of the product film on the surface of corroded parts at 25°C (a); xrd analysis of the product on the surface of corroded parts at different temperatures (b); Schematic representation of initial corrosion at 25 C (c) and 100 C (d).
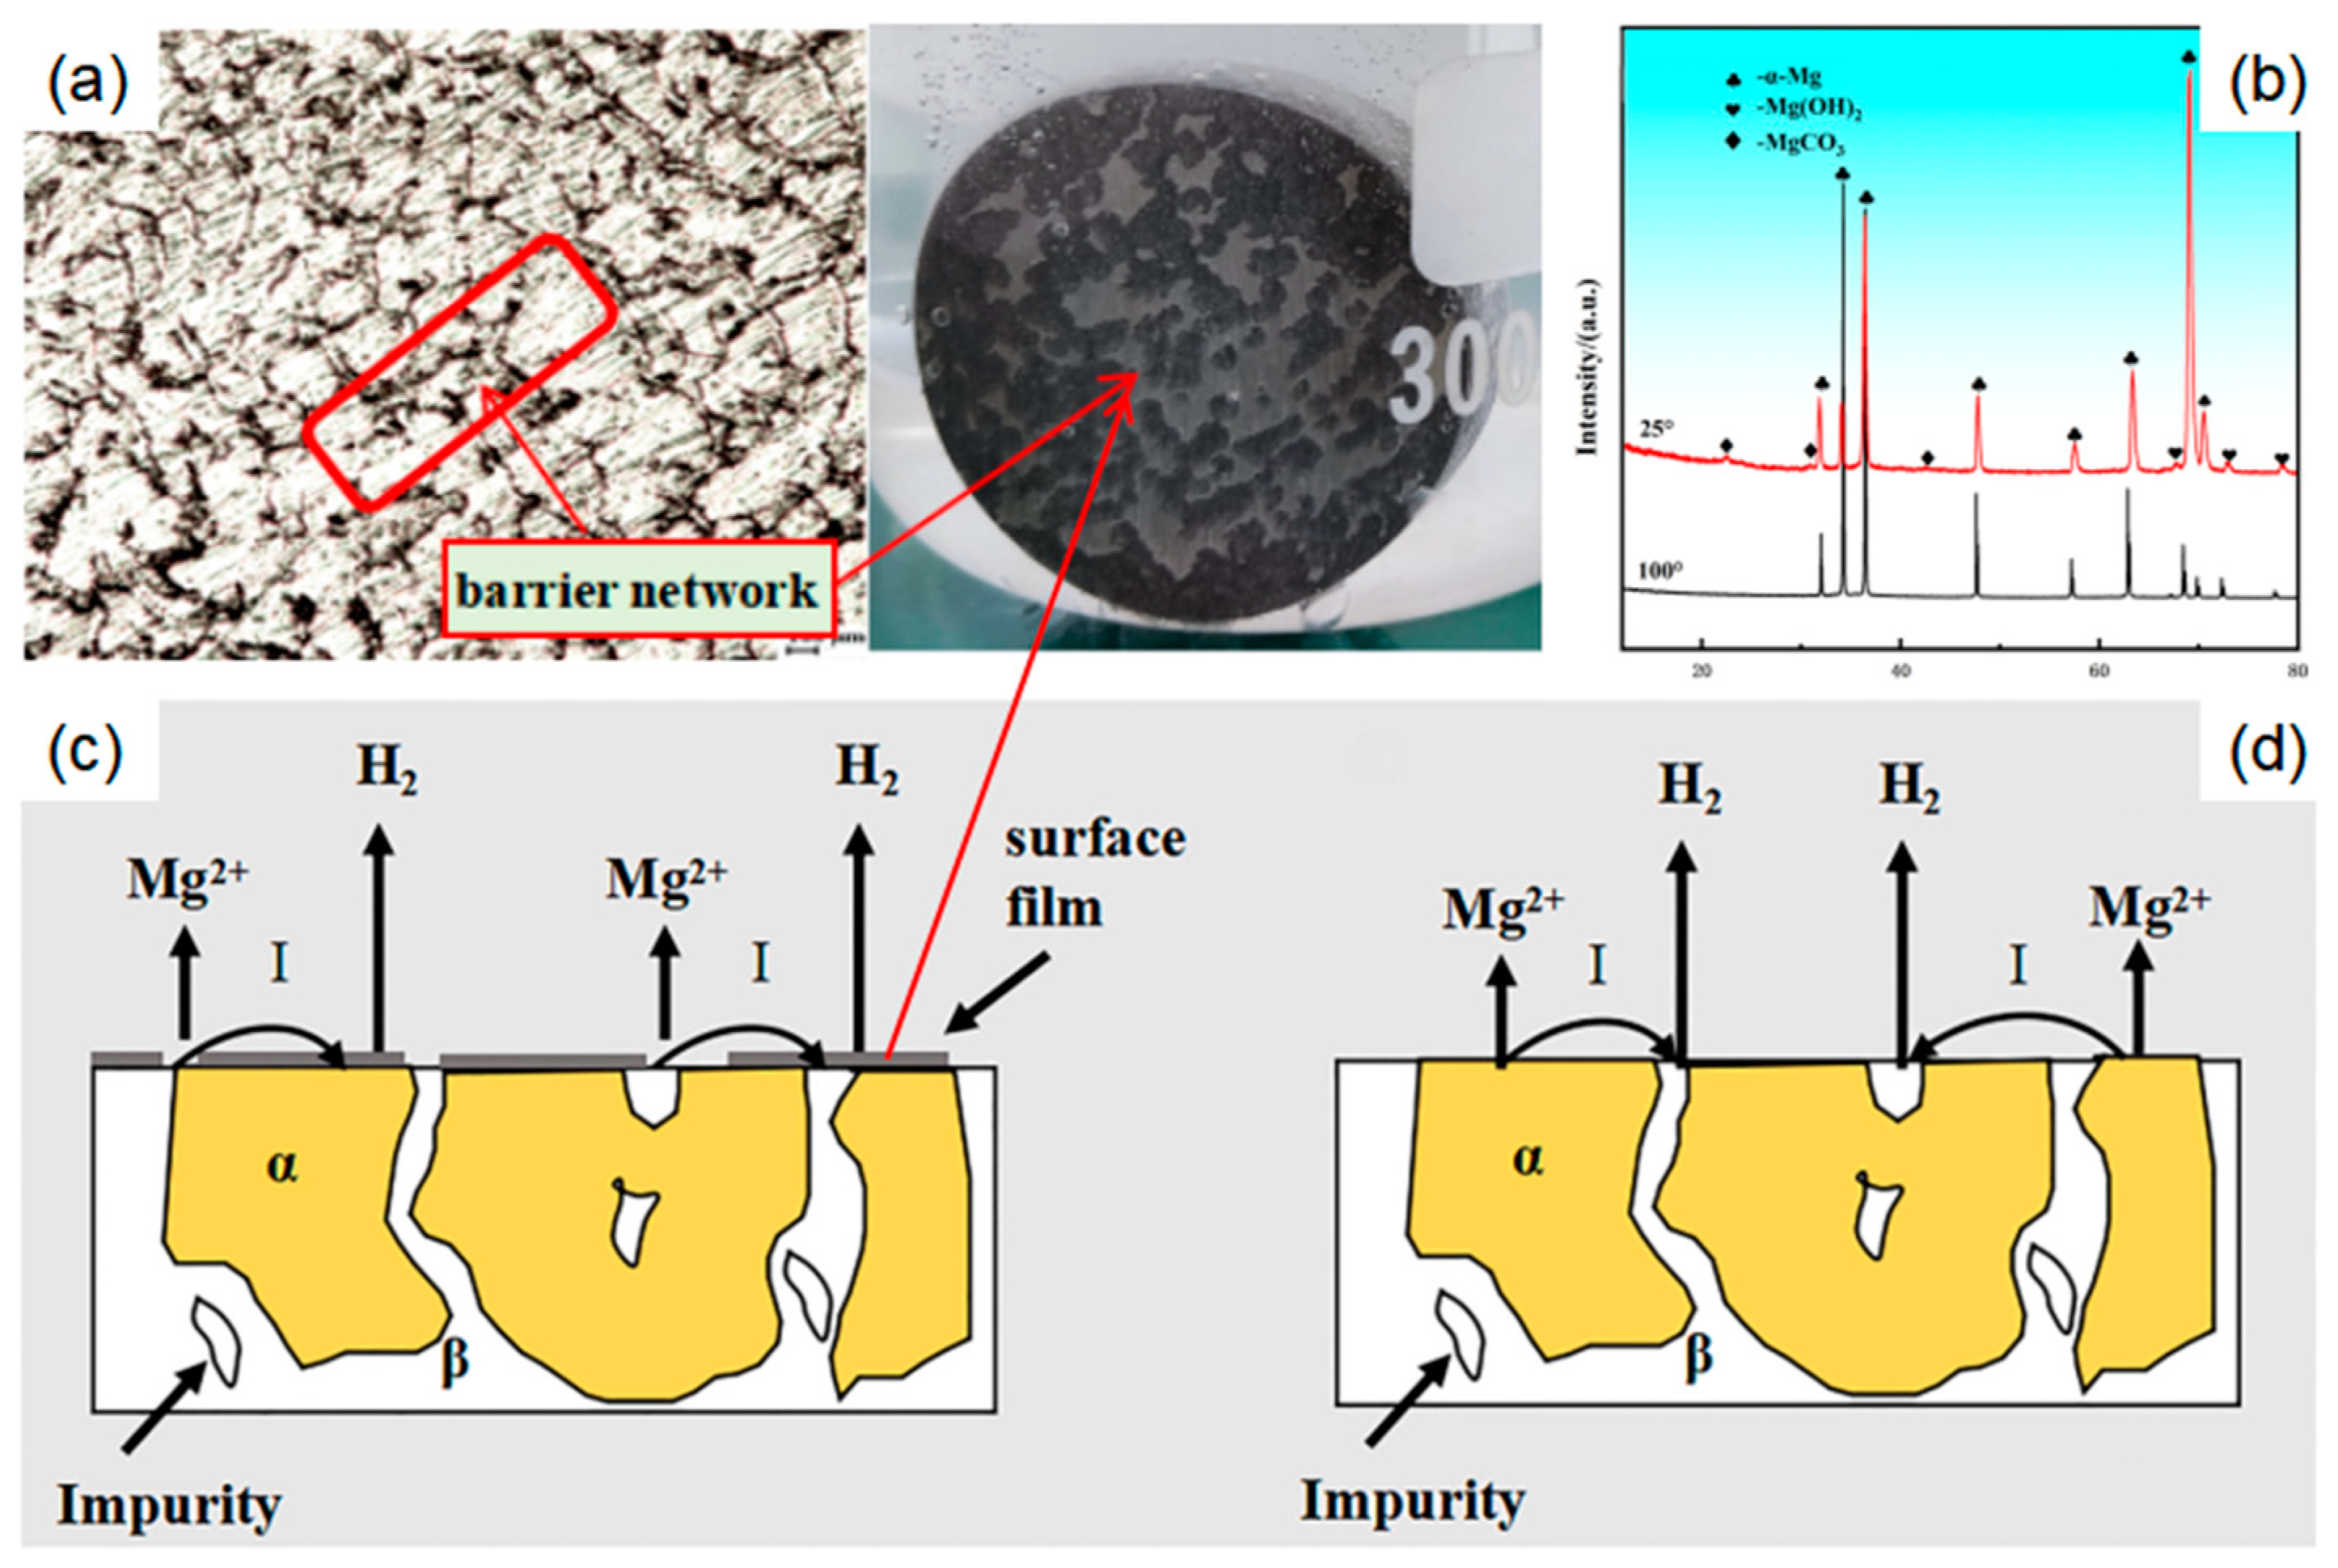

Table 1.
Chemical composition Mg-Gd-based alloys.
| Element | Gd | Ni | Cu | Fe | Si | Mg |
|---|---|---|---|---|---|---|
| Content(wt%) | 1.85 | 0.15 | 0.02 | 0.01 | 0.01 | Balance |
Table 2.
Corrosion test parameters for Mg-Gd based alloys.
| experimental material | Temperature /°C | KCl concentration /% | Timing/h | Corresponding results analysis |
|---|---|---|---|---|
| Mg-Gd alloys in cast form | 93 | 3 | 12 | Figure 3a,Figure 4 |
| Metamorphic Mg-Gd alloys | 93 | 3 | 12 | Figure 3b,Figure 4 |
| matrix phase α-Mg | 93 | 3 | 8 | Figure 6 |
| the second phase Mg5Gd | 93 | 3 | 8 | Figure 6 |
| Metamorphic Mg-Gd alloys | 93 | 1, 3, 5, 7 | 16 | Figure 8 |
| Metamorphic Mg-Gd alloys | 25, 50, 75, 100 | 3 | 11 | Figure 11 |
Table 3.
Open-circuit potentials (V) of the matrix phase and the second phase of Mg-Gd-based alloys in 5 wt% solution of KCl concentration. t=25°C.
Table 3.
Open-circuit potentials (V) of the matrix phase and the second phase of Mg-Gd-based alloys in 5 wt% solution of KCl concentration. t=25°C.
| Sample | 0 min | 1 h | 1.5 h |
|---|---|---|---|
| α-Mg | -1.705 | -1.662 | -1.661 |
| Mg5Gd | -1.684 | -1.651 | -1.647 |
Table 4.
Electrochemical parameter fitting of equivalent circuit.
| Sample | RS[Ω/CM-2] | RCT[Ω/CM-2] | YDL[ΩCM-2SN] | NDL |
|---|---|---|---|---|
| α-Mg | 6.757±0.08 | 79.41 | (1.96±0.03)×10-5 | 0.915±0.003 |
| Mg5Gd | 5.862±0.08 | 27.44 | (0.07±0.03)×10-5 | 0.883±0.003 |
Disclaimer/Publisher’s Note: The statements, opinions and data contained in all publications are solely those of the individual author(s) and contributor(s) and not of MDPI and/or the editor(s). MDPI and/or the editor(s) disclaim responsibility for any injury to people or property resulting from any ideas, methods, instructions or products referred to in the content. |
© 2024 by the authors. Licensee MDPI, Basel, Switzerland. This article is an open access article distributed under the terms and conditions of the Creative Commons Attribution (CC BY) license (http://creativecommons.org/licenses/by/4.0/).
Copyright: This open access article is published under a Creative Commons CC BY 4.0 license, which permit the free download, distribution, and reuse, provided that the author and preprint are cited in any reuse.


