
Submitted:
11 December 2024
Posted:
12 December 2024
You are already at the latest version
Abstract
Background/Objectives: Côa Valley located in the northeast of Portugal, harbors more than 500 medicinal plant species. Among them, four species stand out: Equisetum ramosissimum Desf. used to treat hemorrhages, urethritis, hepatitis, and rheumatic diseases; Rumex scutatus L. subsp. induratus (Boiss. & Reut.) Malag. consumed in salads or with mashed potatoes and used to reduce inflammation and constipation; Geranium purpureum Vill. and Geranium lucidum L. used as antipyretic agents, for pain relief, to halt hemorrhages, and to address gastric and inflammatory diseases. Given the immense medicinal potential of these four species, we evaluated its protective effect on in vitro model for the lipotoxicity associated to Non-Alcoholic Fatty Liver Disease (MASLD). Methods: Cytotoxicity of decoction (D) and hydroalcoholic (EtOH80%) extracts from the four species was assessed through the resazurin and sulforhodamine B (SRB) assays. Lipoprotection potential was determined by incubating previously human HepG2 cells with the extracts and then incubated with palmitic acid (PA). Lipid accumulation was determined through the Nile Red assay. Results: The extracts induced minimal cell metabolic and cell mass decrease at 25 and 50 µg/mL concentrations, indicating their safety. At 100 µg/mL, the cell metabolic activity was moderately affected in all extracts, except for E. ramosissimum extracts. Pre-incubation with E. ramosissimum decoction, significantly decreased the neutral lipid accumulation measured after PA accumulation. Conclusions: These findings suggest that E. ramosissimum decoction, rich in kaempferol derivatives, exhibits a notable capacity reducing lipid accumulation in the cell model of metabolic dysfunction-associated steatotic liver disease (MASLD).

Keywords:
Côa Valley (Portugal)
; plant extracts
; Equisetum ramosissimum Desf.
; MASLD
; lipid-lowering effect
1. Introduction
Located on the final stretch of the Côa river in the Alto Douro region just north of Portugal, the Côa Valley Archaeological Park is home to over 80 paleolithic rock art sites and more than 1200 decorated rocks. As a result, this unique open-air Palaeolithic rock art area has been recognized as a World Heritage Site by UNESCO since 1998 [1]. Notwithstanding, the Côa Valley, which has a typically hot and dry Mediterranean microclimate, features over 500 plant species with potential medicinal properties. Owing to exposure to adverse environmental conditions, which encompass water scarcity, high temperatures, and intense solar radiation, plants inhabiting this territory are anticipated to synthesize a diverse array of phytochemicals, including polyphenols [2], which might be useful in the management and prevention of oxidative-based diseases like MASLD [3].
Among them, Equisetum ramosissimum Desf. an Equisetaceae member (Figure 1A, B), Rumex scutatus L. subsp. induratus (Boiss. & Reut.) Malag. from the Polygonaceae family (Figure 1C, D), as well as Geranium purpureum Vill. (Figure 1E, F) and Geranium lucidum L. (Figure 1G, H) both belonging to the Geraniaceae family, are promising medicinal plant species found in this typically dry landscape. Also E. ramosissimum, best known as ramose scouring rush, is the most widely distributed Equisetum species, being found in the European, Asian and African continents, as it can thrive in multiple types of habitats [4,5]. This plant has been used to treat jaundice, hepatitis, hemorrhages and urethritis [6]. The Geranium genus is composed of over 250 species with annual/perennial flowering plants largely found in the northern hemisphere mountainous regions [7]. G. lucidum, is a small-scaled annual flowering plant with shiny bright green leaves, hence its common name shiny geranium or shining crane's bill [8]. G. purpureum, also known as little robin, is a plant of spontaneous growth in Mediterranean and Sub-Mediterranean regions, typically in dry, and open spaces [9]. Interestingly, essential oils of these plant species have an intense use in perfumery. Regarding traditional medicine, plants from the genus Geranium, have been used for treating gastric ailments, inflammatory disorders, hemorrhages, gall bladder, and fever [10]. R. induratus, commonly known as buckler sorrel or French sorrel, is a native plant to the Iberian Peninsula that usually grows in stone-filled and dry areas [11,12]. The leaves of the plant are consumed in its raw form and its sharp, tangy flavor is typically enjoyed in salads, or with mashed potatoes seasoned with olive oil [11]. However, it remains underutilized as part of a healthy and balanced dietary regime, as the general population is seldom aware of its potential for consumption, and the plant’s commercialization and distribution is sporadic in local markets [11,13]. The genus Rumex, and particularly R. induratus, has long been used in traditional medicine as an antimicrobial, antiviral, anti-inflammatory and for its laxative properties [14,15].
In this study, our objective was to investigate the polyphenol content of four medicinal plant species originating from the Côa Valley region (Portugal) and evaluate the protective effects of these plants on a cell model of steatosis observed during MASLD. This is a burgeoning global public health concern, encompassing a spectrum of liver-affecting diseases, ranging from simple steatosis to metabolic dysfunction-associated steatohepatitis, cirrhosis, and eventually hepatocellular carcinoma [16,17]. The pathophysiology of MASLD is considered to be multifactorial and markedly associated with genetic, epigenetic and environmental factors that lead to the accumulation of fat in the liver, culminating in its inflammation and fibrosis [18,19]. MASLD is characterized by several parallel “multihits” that include oxidative stress, generally considered a crucial contributor to liver injury and MASLD pathology [18,20]. Indeed, reactive oxygen species (ROS) cause hepatocellular injury by inhibiting mitochondrial respiratory chain enzymes and inactivating membrane sodium channels and glyceraldehyde-3-phosphate dehydrogenase [21,22]. Oxidative stress also enhances lipid accumulation and cytokine production, and intensifies lipid peroxidation, originating oxidized phospholipids and reactive aldehydes that directly induce hepatic inflammation [23,24]. Currently, there are no effective treatments approved for MASLD, with conventional recommendations primarily emphasizing healthy lifestyle modifications and dietary habits for individuals affected by the condition. Polyphenols have become a focal point of extensive research as potential therapeutic agents for the treatment of MASLD [25,26]. These antioxidant compounds are widely found in the chemical composition of several plants and were shown to prevent oxidative stress and alleviating insulin resistance [25,27]. Henceforward, two common extraction methods were employed: Ethanol (alcohol), preferred for its ability to extract diverse bioactive compounds, particularly polyphenols, flavonoids, and alkaloids, relevant for conditions like MASLD due to their antioxidant properties. Ethanol at a concentration of 80% (80% ethanol and 20% water) is often preferred because it strikes a balance between extracting a wide range of compounds, including both polar and non-polar constituent; Decoction, boiling plant material in water, is known for extracting water-soluble compounds such as polysaccharides and saponins, commonly found in traditional medicine. These methods provide insight into potential therapeutic effects, capturing a wide spectrum of bioactive constituents, essential for managing conditions like MASLD.
In this work, decoction and EtOH80% extracts of E. ramosissimum, G. lucidum, G. purpureum, and R. induratus were prepared and chemically characterized through high-performance liquid chromatography coupled to photodiode array detection and electrospray ionization tandem mass spectrometry (HPLC-DAD-ESI/MSn). The cytotoxicity of extracts was determined on human hepatocellular carcinoma (HepG2) cells. Afterwards, the extracts were tested in an in vitro cell model of palmitic acid-induced lipotoxicity.
2. Results and Discussion
2.1. Extract Composition
Different families of phenolic compounds were tentatively identified in the four samples studied. A total of fifty-two phenolic compounds were found, twenty-four in G. lucidum and G. purpureum (Table 1), eleven in E. ramosissimum (Table 2), and seventeen in R. induratus (Table 3), divided in phenolic acids (chlorogenic, caffeic, ferulic and p-coumaric acid derivatives), ellagic acid derivatives, and flavonoids (O- and C-glycosylated derivatives). The chemical structures of relevant phenolic compounds identified in the aforementioned plants were designed using the ChemDraw Software (Figure 1). The phenolic profile of all the species examined in this study has not been previously established by other authors. Only the profile of plants within the same genus is currently available. The identification of phenolic compounds, as described below, relied on comparisons with standards existing in the laboratory, pertinent literature related to the genus of the studied plants, and additional references describing specific compounds.
2.1.1. Phenolic Acids
Research efforts focusing on the activity of phenolic acids have demonstrated several health benefits, including antioxidant and anti-inflammatory activity, as an antimicrobial agent, and has been linked to the prevention of several cancers and pathologies, as is the case of MASLD [27,34,35]. Eleven phenolic acids were found in the four samples studied, mainly chlorogenic, caffeic, ferulic and p-coumaric acid derivatives. Peaks 1g ([M-H]- at m/z 353) and 10e ([M-H]- at m/z 193) named as 3-O-caffeoylquinic acid and ferulic acid, respectively, were identified by comparing the retention time, UV and mass spectra with those of the available standard compounds. The presence of caffeoylquinic acid derivatives in Geranium species was already previously reported by [36,37] in Geranium robertianum L. and Geranium molle L. while ferulic acid was also reported in Equisetum hyemale L. extracts by [38].
Glycosylated phenolic acids were also detected in E. ramosissimum and R. induratus samples. Peak 1r with a protonated ion [M-H]- at m/z 341, presented an MS2 response characteristic to the caffeic acid molecule (m/z at 179 and 135), which corresponded to the loss of the hexosyl moiety (162 u), being tentatively identified as caffeic acid hexoside. The same pattern was observed for peaks 4e, 6e, 7r, and 8r ([M-H]- at m/z 355), in which was observed the loss of the hexosyl moiety in the transition to the MS2 responses (m/z at 193 and 178, ferulic acid molecule), being all tentatively identified as ferulic acid hexoside. Two glycosylated p-coumaric acid derivatives were also found in R. induratus samples, peaks 5r and 6r ([M-H]- at m/z 325), which due to the close retention times, were considered cis and trans isomers, respectively. Finally, peaks 4g ([M-H]- at m/z 367) and 3g ([M-H]- at m/z 337), tentatively identified as 3-O-feruloylquinic and 3-O-p-coumaroylquinic acid, respectively, were tentatively identified by the previous reported in Ilex paraguariensis by [39].
2.1.2. Ellagic acid derivatives
Ellagic acid derivatives were only found in Geranium spp. samples. The presence of this type of compounds has been extensively studied and described by other authors [36,37,40], as the main and the most significant molecules in this plant genus. Peak 14g was identified as ellagic acid, by comparing with the available standard compound protonated ion ([M-H]- at m/z 301) but above all with the characteristic UV spectra at 280 nm.
Peaks 5g and 6g ([M-H]- at m/z 951), tentatively identified as geraniin and geraniin isomer I, respectively, are the most representative ellagic acid derivatives of this plant genus [36,37,40]. Geraniin demonstrates a remarkable array of health-promoting attributes, including potent antioxidant, antimicrobial, anticancer, cytoprotective, and immune-modulatory properties [41,42]. Moreover, it exhibits analgesic qualities and shows significant promise in addressing hypertension, cardiovascular diseases, and metabolic dysregulation, making it a versatile candidate for therapeutic applications [41]. It was the major compound found in the two Geranium samples, especially in the decoction preparation of G. purpureumm with 39.89±0.04 mg/g extract, representing 61.25% of the total ellagic acid derivatives amount, and 50.69% of the total phenolic compounds found in this sample.
Other derivatives of ellagic acid were identified, albeit in a more modest abundance, with their prevalence surpassing that of other compound families, namely peak 11g that presented a deprotonated ion [M-H]- at m/z 433 and a unique MS2 fragment at m/z 301 (ellagic acid) that corresponded to the loss of a pentosyl unit ([M-H-132]-) being tentatively identified as ellagic acid pentoside. Peak 11g ([M-H]- at m/z 609) loss 308 u (146 u + 162 u), corresponding to a deoxyhexosyl and hexosyl unit, respectively, being tentatively identified as ellagic acid deoxyhexosyl-hexoside. Peaks 7g/8g/9g/10g ([M-H]- at m/z 705) were all tentatively identified as ellagic acid dideoxyhexosyl-hexoside, very similar to peak 11g, except for the presence of just one more deoxyhexosyl unit. Finally, peak 2g was tentatively identified as ellagitannin, solely for the presence of the 301 unit at MS2 and the characteristic UV spectra at 270 nm, not allowing the identification of the type of ellagitannin in concrete.
2.1.3. Flavonoids
The flavonoid family was undoubtedly the most representative in terms of number of compounds identified, highlighting the presence of derivatives of apigenin, isorhamnetin, kaempferol, luteolin, and quercetin.
Peak 14r ([M-H]- at m/z 609) was identified as quercetin-3-O-rutinoside by comparison with the available standard compound. A large number of identified flavonoids were those with:
- one O-glycosylation: luteolin-O-hexoside (peaks 18g/20g);
- two O-glycosylation: kaempferol-O-dihexoside (9e), isorhamnetin-O-dihexoside (16r/17r), isorhamnetin O-deoxyhexosyl-hexoside (peak 19g), and luteolin-O-deoxyhexosyl-hexoside (peaks 13g/17g);
- - three O-glycosylation: quercetin-O-dihexosyl-O-dihexoside (peak 3e) and kaempferol-O-dihexosyl-O-dihexoside (peaks 1e/2e/8e) [43];
- - an acetyl linkage with O-glycosylation: kaempherol-O-acetyl-dihexoside (peak 11e) and kaempherol-O-hexosyl-O-acetyl-dihexoside (peak 5e);
- - phenolic acids linkage with O-glycosylation: isorhamnetin-O-caffeoyl-O-deoxyhexosyl-dihexoside (peaks 3r/4r), luteolin galloyl O-deoxyhexosyl-hexoside (peak 21g), luteolin galloyl O-hexoside (peak 23g), quercetin galloyl O-deoxyhexosyl-hexoside (peak 15g), and quercetin galloyl O-hexoside (peak 16g) [44];
- - and C-glycosylation combined or not with O-glycosylation: apigenin 6-C-hexosyl-8-C-pentoside [peak 9r, [45]], apigenin-C-hexoside [peak 15r, [46]], apigenin-C-hexoside-O-pentoside [peaks 12r/13r, [46]], luteolin-6-C-(2-O-pentosyl)hexoside [peaks 10r/11r, [47]], rhamnosylvitexin [peak 2r, [48]] and cupressuflavone [peak 7e, [49]].
The extensive array of flavonoids found in the four samples under investigation underscores the profound significance of this study. The presence of flavonoids exhibiting diverse degrees of polymerization and associations with various functional groups opens a countless of potential applications for the EtOH80% extracts and decoction preparation of G. lucidum, G. purpureum, E. ramosissimum, and R. induratus.
The glycosylation of flavonoids enhances their solubility and stability compared to aglycones, which is especially important given the role of dietary flavonoids and their glycosides in preventing and treating chronic diseases [50]. In both in vitro and in vivo studies, the impact of glycosylation on flavonoid pharmacokinetics is a subject of increasing interest [51]. C-glycosyl flavonoids have shown superior antioxidant and anti-diabetic effects in vitro when compared to their O-glycosyl counterparts and aglycones. Notably, in some cases, in vitro de-glycosylation of natural flavonoid glycosides has enhanced antioxidant activity [52]. For flavonoids to be efficiently absorbed by the body, they need to reach the small intestine in their unchanged form. It is noteworthy that most flavonoid glycosides maintain their structural integrity even following cooking processes, displaying resistance to the low pH and digestive enzymes present in the stomach. [53].
Finally, peaks 24g and 22g were tentatively identified as luteolin derivative ([M-H]- at m/z 575) and quercetin derivative ([M-H]- at m/z 591), respectively, presenting both just one MS2 fragment at m/z 285 and 301, respectively; however, the units lost between full MS and MS2 does not give information to identify the sugar moiety and type of linkage.
2.2. Effects of the different extracts on metabolic activity
HepG2 cells are an ideal in vitro model for studying hepatolipotoxicity, given their strong capability to uptake and store fatty acids. This is facilitated by the presence of lipid-metabolizing enzymes like 3-hydroxy-3-methyl-glutaryl-coenzyme A reductase (HMG-CoA reductase) and triglyceride lipase (H-TGL) [54,55].
To evaluate the hepatoprotective effect of these extracts, it is imperative that the concentration of the plant extract does not induce any toxicity in the cells in the established timeline (Figure 2A). Initially, we examined the cytotoxicity of the extracts on HepG2 cells. Compared to the control group (untreated cells), all extracts exhibited a dose-dependent impact on cellular metabolic activity. Notably, concentrations of 25 and 50 µg/mL resulted in minimal to no reduction in cellular metabolic activity (Figure 2B-I). However, at the highest concentration (100 µg/mL), both extracts of G. lucidum, G. purpureum, and R. induratus exhibited a decrease in metabolic activity compared to untreated cells (Figure 2A-C, H and I). E. ramosissimum showed no significant decrease in cell metabolic activity for any of the concentrations tested (Figure 2F-G). Overall, the EtOH80% extracts of G. purpureum and R. induratus caused the largest decay of cellular metabolic activity at 100 µg/mL, reducing that parameter to 75% and 80%, respectively, when compared to the control (Figure 2B, H). No correlation was found between the extract method and effects in metabolic activity. From this, we can conclude that all extracts showed no or little cytotoxicity in concentrations up to 50 µg/mL. This observation was also consistent with the positive control, which exhibited no cytotoxic effects up to a concentration of 200 µM (Figure S1A, supplementary information). Concomitantly, the effects of the different extracts were evaluated when incubated with PA. The addition of PA at 100 µM for 24h did not decrease the metabolic capacity of HepG2 cells, as previously reported (Figure 2B-I) [56-58]. Compared with control and PA alone, all extracts presented little to no reduction in the metabolic activity of cells at 25 and 50 µg/mL (Figure 2B-I). Similarly, the highest extract concentration (100 µg/mL) apart from the EtOH80% extract of E. ramosissimum, resulted in a reduction (under 20%) of the metabolic activity when compared with control and PA addition, indicating cytotoxicity for the highest extract concentration (Figure 3A-H). Of the four plants tested, both extracts of E. ramosissimum were safe to HepG2 cells even for the highest concentration.
Overall, the EtOH80% extract of G. purpureum presented the largest decrease in cell metabolic activity, particularly in the highest concentration and following PA incubation (Figure 2B). This finding is in line with what has been previously described for Geranium species, which demonstrates an antiproliferative capacity against several cancer cell lines, including for the hepatocellular carcinoma HuH7 cell line [59]. Conversely, the EtOH80% extract of E. ramosissimum showed minimal toxicity to HepG2 cells, even at high concentrations (Figure 2F). A dose-dependent decrease in cell metabolic activity was observed for the decoction, which is in agreement with results obtained in human melanoma cells, following incubation with an aqueous extract of E. ramosissimum (Figure 2G) [6]. Given that the primary compounds identified in both extracts of E. ramosissimum in this study are kaempferol derivatives, the safety of these plant extracts on HepG2 cells might be attributed to the documented low toxicity of kaempferol on this cell line. Prior research has demonstrated that kaempferol exhibits minimal toxicity on HepG2 cells, even at concentrations up to 100 µM and during incubation periods of up to 48 hours. [60].
2.3. Effects of tested extracts on cell mass
HepG2 cells were incubated with decoction and EtOH80% extracts of plants for 24h, at different concentrations (25, 50 and 100 µg/mL). The cell protein, an indirect measurement of cell mass was further determined by the SRB assay. As observed for the metabolic activity assay, all extracts presented little to no reduction in the cell mass at 25 and 50 µg/mL when compared with the control (untreated cells) (Figure 3A-H). Of the four plants tested, the EtOH80% extract of E. ramosissimum did no reduce cell mass even at the highest concentration (Figure 3E). Overall, both extracts of G. purpureum at 100 µg/mL resulted in a loss of cell mass (Figure 3A-B). Of all plants, an increase in cell mass was observed at 25 and 50 µg/mL was observed only for R. induratus (Figure 3H). Remarkably, a similar trend was observed with silibinin at 100 µM. Notably, the cell mass of HepG2 increased by 15% and 30% at concentrations of 50 and 100 µg/mL of silymarin, respectively. (Figure S1B, supplementary information). Among the tested extracts, only the decoctions of E. ramosissimum and R. induratus cause a statistically significant decrease of cell mass. This may suggest that the aforementioned extracts stimulate the proliferation of HepG2 cells. No correlation was found between the extract type and variation in cell mass.
Subsequently, the impacts of various extracts were assessed during cell incubation with palmitic acid (PA). As observed previously for the metabolic activity assay, all plant extracts caused little to no reduction in cell mass at 25 and 50 µg/mL, when compared with the control (BSA) and PA regimens (Figure 3A-H). In contrast, the highest concentration (100 µg/mL) tested for all extracts resulted in a decrease in cell mass of up to 50% of the control value and PA. Notably, the cell mass increase reported for the extracts was not observed following PA addition. This can be due to the toxic action of the lipid that, after being added to cells following a 24 h extract incubation, resulted in cell death. Overall, the EtOH80% extract of G. lucidum presented the worst outcome, particularly at the highest concentration and following PA incubation, in which a cell mass decrease close to 50% was observed (Figure 3D). As observed for the metabolic activity, out of the four plants tested, both extraction methods of E. ramosissimum showed to be safe to the cells even at the highest concentration tested (Figure 3E-F). As already mentioned above for the cell metabolic activity, the safety of the E. ramosissimum extract may be associated with the high kaempferol content of both extract, that has been described before as presenting little toxicity to HepG2 cells up to 48 h of incubation [60].
2.4. Effects of tested extracts on preventing PA-induced lipid accumulation in HepG2 cells
To investigate cellular lipotoxicity, palmitate (PA) is commonly employed to markedly enhance lipid droplet (LD) formation. This triggers an increase in ROS levels, leading to mitochondrial dysfunction manifested by decreased O2 levels and mitochondrial membrane potential (ΔΨm). [17,61,62]. Taking this into account, we sought to investigate the lipid accumulation lowering potential of the same extracts on PA-treated HepG2 cells. PA treatment significantly increased the neutral lipid accumulation in HepG2 up to 50% when compared to the control (BSA), in all groups tested (Figure 4A-H). From the Geranium species, the decoction of G. purpureum and G. lucidum EtOH80% extract, at concentrations of 50 and 100 µg/mL, resulted in a slight reduction in the accumulation of neutral lipids when compared with the PA values, although not reaching statistical significance (Figure 4B-C). Similarly, a slight decrease in the lipid content was measured for the EtOH 80% extract of R. induratus, which was also dose-dependent (Figure 4G). Of all the plants, both extracts from E. ramosissimum decreased the accumulation of neutral lipids when compared to PA alone (Figure 4E-F). More precisely, the decoction of E. ramosissimum significantly reduced the neutral lipid accumulation in a dose-dependent manner to values closer to the control, in all concentrations (Figure 4F). Interestingly, for the highest concentration, the extent of the reduction in lipid accumulation observed for this extract was higher than that obtained for the lipid decreasing compound silibinin (44% vs 27% reduction compared with PA values, respectively (Figure S1C, supplementary information). This effect may be associated with the anti-lipotoxicity and anti-adipogenic effects of the phenolic compound kaempferol, which was identified in the chemical composition of E. ramosissimum. In addition to this work, kaempferol was previously described in the chemical composition of EtOH80% extract of stems from E. ramosissimum [63]. This flavonol has been associated with lower lipogenesis by upregulating the expression of Insing-2a, decreasing the phosphorylation of SREBP-1, but increasing GKS-3 phosphorylation. This culminates in the inactivation of SREBP-1, a key lipogenic transcription factor [64]. Another paper also described the capacity of kaempferol to decrease lipid accumulation and oxidative stress on HepG2 cells [65]. Our results are also corroborated by recent work performed by Zhao et al., [66], in which the protective effect of kaempferol on lipid accumulation in HepG2, through activation of the NF-E2–related factor 2 (Nrf2) signaling pathway was reported. Furthermore, kaempferol inhibited the NF-κB pathway in oleic acid-induced HepG2 cells, thereby inhibiting inflammation and fibrosis in high-fat diet-induced rats [67]. In the scope of our work, complementary assays will be carried out to determine the mechanism of action of this promising extract.
3. Materials and Methods.
3.1. Materials
Bovine serum albumin (BSA), Dulbecco’s modified Eagle’s medium (DMEM, D5030), fetal bovine serum (FBS), glucose, glutamine, HEPES, Nile Red, palmitic acid (C16:0) (PA), resazurin, silibinin, sodium pyruvate, sulforhodamine B (SRB), were purchased from Sigma-Aldrich (St. Louis, MO, USA). Penicillin, streptomycin, and trypsin were purchased from Gibco-Invitrogen (Grand Island, NY, USA). Sodium bicarbonate was purchased from Thermo Scientific (Waltham, MA, USA).
3.2. Plant Material
Samples of the plant E. ramosissimum, flowering aerial parts of G. lucidum and G. purpureum, and R. induratus in the fruiting phase were collected in May 2021. The four studied plants were collected in the Côa Valley River. Voucher specimens were placed at the Herbarium of the University of Aveiro (AVE), with the numbers AVE251 representing E. ramosissimum, AVE256 representing G. lucidum, AVE263B representing G. purpureum, and AVE254A representing R. induratus. After the harvesting process, the plants were dried and kept at room temperature (25 °C), in the dark, until extraction.
3.3. Extraction procedures
3.3.1. Decoction extraction
Initially, water (150 mL) was poured to dried and powdered plant (5 g). The extraction procedure occurred with magnetic stirring, at boiling temperature, for 20 min., and shielded from the light with aluminum foil. Once the decoction extract was at room temperature, it was filtered under vacuum with a Büchner funnel and Whatman No. 4 paper, followed by reduction of its volume using a vacuum rotator. After lyophilization, the decoction residue was obtained. The extract yields were as follows: 21.2% for E. ramosissimum, 30.6% for G. lucidum, 32.4% for G. purpureum, and 3.6% for R. induratus.
3.3.2. Hydroalcoholic extraction
To dried and powdered plant material (5 g), a hydroalcoholic extraction was performed using an ethanol/water (80:20 v/v) (EtOH80%) solution (125 mL), with magnetic stirring at room temperature for 1h, and shielded from the light with aluminum foil. After that, the mixture was decanted. To the remaining plant material, another EtOH80% solution (125 mL) was poured, and extraction occurred under the same conditions. This extract was also decanted, and the two extraction solutions combined, and filtered under vacuum with a Büchner funnel and Whatman No. 4 paper. Ethanol was evaporated using a vacuum rotator and the obtained aqueous residue was subsequently freeze-dried. The obtained extract yields were as follows: 12.6% for E. ramosissimum, 21.4% for G. lucidum, 26.4% for G. purpureum, and 1.2% for R. induratus. The obtained lyophilized EtOH80% and decoction extracts were redissolved in water to a final concentration of 10 mg/mL, functioning as stock solutions preserved at -20 °C. These stock solutions were further diluted to different concentrations to be tested in the subsequent assays.
3.4. HPLC–DAD–ESI/MS analysis of hydroalcoholic and decoction extracts
The extracts were analyzed as previously stated by us in [28], with minimal adjustments. Briefly, all extracts were filtered through a 0.22 µm disposable LC filter disk, and the extracts’ samples were analyzed with a Dionex Ultimate 3000 UPLC (Thermo Scientific, San Jose, CA, USA) system equipped with a diode array detector with an electrospray ionization mass detector coupled to it (LC-DAD-ESI/MSn). A Waters Spherisorb S3 ODS-2 C18 (3 μm, 4.6 × 150 mm, Waters, Milford, MA, USA), with the column thermostatized at exactly 35 °C, was used to achieve chromatographic separation. Solvents used consist of 0.1% formic acid in water and acetonitrile, using an elution grade for 50 minutes and re-equilibration of the column for 10 minutes, with a flow rate of 0.5 mL/minute. Double online detection was performed in the DAD (using 280 and 370 nm as preferred wavelengths), as well as in a mass spectrometer (MS) that was connected to a HPLC system through the DAD cell outlet. Detection of MS was carried out using a Linear Ion Trap LTQ XL mass spectrometer (Thermo Finnigan, San Jose, CA, USA), in the negative mode, equipped with an ESI source. Data were obtained with Xcalibur® data system (Thermo Finnigan, San Jose, CA, USA). Regarding phenolic compounds, these were identified by comparing their retention times, mass spectra, and UV-Vis with standard compounds, when such comparison is available. If not, compounds were identified by comparing the aforementioned data with those reported in the literature. Compound quantification was performed using the following calibration curves: apigenin-6-C-glucoside (y = 107.025x + 61.531, R2 = 0.999, Limit of detection (LOD) = 0.19 µg/mL; Limit of Quantification (LOQ) = 0.63 µg/mL); apigenin-7-O-glucoside (y = 10.683x – 45.794; R2 = 0.999, LOD = 0.10 μg/mL; and LOQ = 0.53 μg/mL); caffeic acid (y = 388.345x + 406.369, R2 = 0.994, LOD = 0.78 μg/mL; LOQ =1.97 μg/mL); chlorogenic acid (y = 168.823x – 161.172, R2 = 0.9999, LOD = 0.20 µg/mL; LOQ = 0.68 µg/mL); ferulic acid (y = 633.126x – 185.462, R2 = 0.999, LOD = 0.20 μg/mL; 1.01 μg/mL); ellagic acid (y = 26.719x – 317.255, R2 = 0.999, LOD = 41.20 µg/mL; LOQ = 124.84 µg/mL); p-coumaric acid (y = 301.950x + 6966.7, R2 = 0.999, LOD = 0.68 μg/mL, LOQ = 1.61 μg/mL); and quercetin-3-O-glucoside (y = 34.843x – 160.173, R2 = 0.999, LOD = 0.21 µg/mL; LOQ = 0.71 µg/mL). For the compounds without a standard compound, the calibration curve of the most structurally similar compound was used. Obtained results were presented as mg per g of extract.
3.5. Cell culture and extract treatment
Human hepatocellular carcinoma (HepG2) cells (Catalogue nº: 85011430, ECACC, Porton Down, UK) were cultured in a 5 % CO2 atmosphere at 37 °C in low-glucose DMEM supplemented with 5 mM glucose, 1mM sodium pyruvate, 6 mM L-glutamine, 5 mM HEPES, 3.7 g/L sodium bicarbonate, 10% FBS and 1% antibiotic-antimycotic (penicillin-streptomycin 100x solution) as previously described [29,30]. Cells were seeded at 4.5 x 10⁴ cells/cm2 in 96-well plates and grown until 70% confluence. After that, cells were incubated with the different plant extracts at different concentrations (50, 100, and 200 µg/mL) for 24h. Following extract incubation for 24h, the cells were treated with the vehicle BSA (0.1 g/mL) and PA (0.1 mM).
3.6. Palmitic Acid/BSA Conjugation
The conjugation of PA with BSA was performed as previously described [30]. Briefly, PA and BSA were prepared using BSA free-fatty acid (Catalogue A6003, Sigma-Aldrich, USA), with a concentration of 0.1 g/mL. PA was combined with BSA at a 1:1 ratio and incubated for 1h at 37 °C. Additionally, a control solution was prepared using the same proportion of free-fatty acid BSA (0.1 g/mL) diluted with 150 mM NaCl.
3.7. Cell Metabolic Activity
HepG2 cells were seeded in 96-well plates and subjected to different treatments. Following incubation, the cell metabolic activity was determined following the resazurin reduction principle [31]. After discarding the culture medium, cells were incubated for 2 h with 80 µL of culture medium supplemented with 10 µg/mL of resazurin solution. The fluorescence was measured with 570 nm excitation and 600 nm emission wavelengths in a Biotek Cytation 3 reader (Biotek Instruments, Winooski, VT, USA).
3.8. Cell Mass
Cells were seeded in a 96-well plate and subjected to different treatments. SRB assay was then performed for cell mass determination based on the measurement of cellular protein content [32]. After discarding the culture medium, wells were rinsed with PBS (1X) and cells were fixed by adding 80 µL of 1% acetic acid in 100% methanol solution and kept at -20°C overnight. Then, the fixation solution was discarded, and the plate was kept in the incubator until completely dry at 37 °C. 50 µL of 0.05% SRB in 1% acetic acid solution was added to the wells and incubated for 1 h at 37 °C. The wells were washed with 1% acetic acid solution to remove unbound SRB solution residues. Following this, 100 µL of Tris (10 mM, pH 10.5) solution was used to dissolve SRB by stirring the plate for 30 minutes using an orbital shaker. The absorbance was measured at 510 nm and background measurement at 620 nm at room temperature in a Biotek Cytation 3 reader (Biotek Instruments, Winooski, VT, USA).
3.9. Nile Red Staining
Following the different treatments, the neutral lipid accumulation in HepG2 cells was evaluated using the Nile Red assay [33]. After discarding the culture medium, 100 µL of Nile Red solution (freshly diluted from stock solution of 0.5 mg/mL in acetone at 1:200 in medium without FBS) was added to each well and incubated for 2 h protected from the light at 37 °C. Then, Nile Red solution was removed, and the cells washed with PBS (1X) twice. The lipid content in the wells was measured in fluorescence with 520 nm excitation and 620 nm emission in a Biotek Cytation 3 reader (Biotek Instruments, Winooski, VT, USA). The results were normalized for the cell mass content of the wells, using the SRB assay [32].
3.10. Statistic Analysis
The data from this work were analysed using GraphPad Prism 8.02 software (GraphPad Software, Inc.). Data from multiple experiments is presented as the mean ± standard error of the mean (SEM). Statistical significance was assessed using two-way ANOVA followed by Tukey post hoc test for multiple comparisons, to compare different extract concentrations with the control. Statistical significance was accepted with *p<0.05, **p<0.01, ***p<0.0005, ****p<0.0001 for comparisons between extract concentrations vs control, and #p < 0.05, ##p<0.01, ###p<0.0005, ####p<0.0001 for comparisons between extract concentrations vs PA.
5. Conclusions
The in-depth chemical analysis of EtOH80% extracts and decoctions from G. lucidum, G. purpureum, E. ramosissimum, and R. induratus revealed a rich array of phenolic components, including flavonoids, phenolic acids, and ellagic acid derivatives. These compounds contribute to the pharmacological potential of the extracts, known for their diverse health benefits such as anti-inflammatory, antioxidant, antibacterial, and anticancer effects. The presence of glycosylated flavonoids, particularly in the EtOH80% extracts, highlights their enhanced stability and solubility, potentially improving their bioavailability and medicinal effectiveness. In fact, C-glycosyl flavonoids have demonstrated significantly stronger antioxidant and anti-diabetic actions compared to their O-glycosyl counterparts, underlining the importance of structural modifications in enhancing biological activity. Biological assessment using HepG2 cells indicated minimal cytotoxicity of the extracts at concentrations up to 50 µg/mL, with no significant impact on cell metabolic activity or mass. However, at higher concentrations (100 µg/mL), some extracts, particularly those of G. purpureum and R. induratus, exhibited cytotoxic effects. Interestingly, extracts of E. ramosissimum showed minimal toxicity even at the highest concentration, possibly due to the presence of kaempferol derivatives known for their low toxicity on HepG2 cells. Furthermore, the extracts, especially the decoction of E. ramosissimum, demonstrated promising effects in preventing PA-induced lipid accumulation in HepG2 cells. This observed reduction in neutral lipid accumulation suggests potential anti-lipotoxic and anti-adipogenic properties, possibly mediated by kaempferol derivatives present in the extracts. In summary, our study evaluated the hepatoprotective capabilities of four native plants from the Côa Valley region of Portugal. Among them, E. ramosissimum stood out for significantly reducing cellular lipid accumulation. These findings highlight the safety and potential therapeutic application of E. ramosissimum extract in mitigating lipid accumulation, warranting further in vivo validation.
Supplementary Materials
The following supporting information can be downloaded at the website of this paper posted on Preprints.org.
Author Contributions
Ricardo Amorim: Writing – original draft, Investigation, Methodology. Mário Pedro Marques: Writing – original draft, Investigation, Methodology. Catarina Melim: Writing – original draft, Investigation, Methodology. Carla Varela: Methodology, Investigation. Vilma A. Sardão: Methodology, Investigation. José Teixeira: Supervision, Writing – review & editing. Maria Inês Dias: Writing – original draft, Methodology, Investigation. Lillian Barros: Methodology, Investigation. Paulo J. Oliveira: Supervision, Writing – review & editing. Célia Cabral: Funding acquisition, Supervision, Conceptualization. The final version of the manuscript was read and approved by all authors.
Funding
Please add: This work was funded by Foundation for Science and Technology (FCT, Portugal), through the following projects: UIDB/04539/2020 - DOI: 10.54499/UIDB/04539/2020, UIDP/04539/2020 - DOI: 10.54499/UIDP/04539/2020, LA/P/0058/2020 - DOI: 10.54499/UIDP/04539/2020, CôaMedPlants project: COA/BRB/0019/2019 – DOI: 10.54499/COA/BRB/0019/2019, and through national funds FCT/MCTES to CIMO (UIDB/00690/2020 and UIDP/00690/2020) and SusTEC (LA/P/0007/2020) and M.I.D and L.B contracts (CEEC Institutional).
Institutional Review Board Statement
Not applicable.
Informed Consent Statement
Not applicable.
Data Availability Statement
All data generated or analyzed during this study are included in this published article.
Conflicts of Interest
The authors declare that they have no known competing financial interests or personal relationships that could have appeared to influence the work reported in this paper.
References
- CoaParque webpage, 2023. https://arte-coa.pt/a-regiao-2/ (accessed 15th May 2024).
- Di Ferdinando, M., Brunetti, C., Agati, G., Tattini, M. Multiple functions of polyphenols in plants inhabiting unfavorable Mediterranean areas. Environ. Exp. Bot. 2014. [CrossRef]
- Yang, K., Chen, J., Zhang, T., Yuan, X., Ge, A., Wang, S., Xu, H., Zeng, L., Ge, J. Efficacy and safety of dietary polyphenol supplementation in the treatment of non-alcoholic fatty liver disease: A systematic review and meta-analysis. Front. immunol. 2022. [CrossRef]
- Zhang, C., Wang, X., Jiang, S., Zhou, M., Li, F., Bi, X., Xie, S., Liu, J. Heavy metal pollution caused by cyanide gold leaching: a case study of gold tailings in central China. Environ. Sci. Pollut. Res. 2021. [CrossRef]
- Ranđelović, D., Mihailović, N., Jovanović, S. Potential of Equisetum ramosissimum Desf. for remediation of antimony flotation tailings: a case study. Int. J. Phytoremediation. 2019. [CrossRef]
- Li, P.H., Chiu, Y.P., Shih, C.C., Wen, Z.H., Ibeto, L.K., Huang, S.H., Chiu, C. C., Ma, D. L., Leung, C. H., Chang, Y. N., Wang, H. M. D. Biofunctional Activities of Equisetum ramosissimum Extract: Protective Effects against Oxidation, Melanoma, and Melanogenesis. Oxid. Med. Cell. Longev. 2016. [CrossRef]
- Radulović, N.S., Stojković, M.B., Mitić, S.S., Randjelović, P.J., Ilić, I.R., Stojanović, N.M., Stojanović-Radić, Z.Z. Exploitation of the antioxidant potential of Geranium macrorrhizum (Geraniaceae): Hepatoprotective and antimicrobial activities. Nat. Prod. Commun. 2012. [CrossRef]
- Esfandani-Bozchaloyi, S., Zaman, W. Taxonomic significance of macro and micro-morphology of Geranium L. species Using Scanning Electron Microscopy. Microsc. Res. Tech. 2018. [CrossRef]
- Radulovic̈, N.S., Dekic̈, M.S. Volatiles of Geranium purpureum Vill. and Geranium phaeum L.: Chemotaxonomy of Balkan Geranium and Erodium species (Geraniaceae). Chem. Biodivers. 2013. [CrossRef]
- Nunes, R., Pasko, P., Tyszka-Czochara, M., Szewczyk, A., Szlosarczyk, M., Carvalho, I.S. Antibacterial, antioxidant and anti-proliferative properties and zinc content of five south Portugal herbs. Pharm. Biol. 2017. [CrossRef]
- Pinela, J., Morales, P., Cabo Verde, S., Antonio, A.L., Carvalho, A.M., Oliveira, M.B.P.P., Cámara, M., Ferreira, I.C.F.R. Stability of total folates/vitamin B9 in irradiated watercress and buckler sorrel during refrigerated storage. Food Chem. 2019. [CrossRef]
- Pinela, J., Barreira, J.C.M., Barros, L. Verde, S.C., Antonio A.L., Oliveira, M.B.P.P., Carvalho, A.M., Ferreira, I.C.F.R. Modified atmosphere packaging and post-packaging irradiation of Rumex induratus leaves: a comparative study of postharvest quality changes. J. Food Sci. Technol. 2016. [CrossRef]
- Ferreres, F., Ribeiro, V., Izquierdo, A.G., Rodrigues, M.Â., Seabra, R.M., Andrade, P.B., Valentão, P. Rumex induratus leaves: Interesting dietary source of potential bioactive compounds. J. Agric. Food Chem. 2006. [CrossRef]
- Vasas, A., Orbán-Gyapai, O., Hohmann, J. The Genus Rumex: Review of traditional uses, phytochemistry and pharmacology. J. Ethnopharmacol. 2015. [CrossRef]
- Taveira, M., Guedes de Pinho, P., Gonçalves, R. F., Andrade, P. B., Valentão, P. Determination of eighty-one volatile organic compounds in dietary Rumex induratus leaves by GC/IT-MS, using different extractive techniques. Microchem. J. 2009. [CrossRef]
- Younossi, Z.M., Marchesini, G., Pinto-Cortez, H., Petta, S. Epidemiology of Nonalcoholic Fatty Liver Disease and Nonalcoholic Steatohepatitis: Implications for Liver Transplantation. Transplantation. 2019. [CrossRef]
- Amorim, R., Simões, I.C.M., Veloso, C., Carvalho, A., Simões, R.F., Pereira, F.B., Thiel, T., Normann, A., Morais, C., Jurado, A.S., Wieckowski, M.R., Teixeira, J., Oliveira, P.J. Exploratory data analysis of cell and mitochondrial high-fat, high-sugar toxicity on human HepG2 cells. Nutrients. 2021. [CrossRef]
- Chen, Z., Tian, R., She, Z., Cai, J., Li, H. Role of oxidative stress in the pathogenesis of nonalcoholic fatty liver disease. Free Radic. Biol. Med. 2020. [CrossRef]
- Smirne, C., Croce, E., Benedetto, D. Di, Cantaluppi, V., Sainaghi, P.P., Minisini, R., Grossini, E., Pirisi, M., Comi, C. Oxidative Stress in Non-Alcoholic Fatty Liver Disease. Livers. 2022. [CrossRef]
- Hong, T., Chen, Y., Li, X., Lu, Y. The Role and Mechanism of Oxidative Stress and Nuclear Receptors in the Development of MASLD. Oxid. Med. Cell. Longev. 2021. [CrossRef]
- Amorim, R., Magalhães, C.C., Borges, F., Oliveira, P.J., Teixeira, J. From Non-Alcoholic Fatty Liver to Hepatocellular Carcinoma: A Story of (Mal)Adapted Mitochondria. Biology. 2023. [CrossRef]
- Ma, Y., Lee, G., Heo, S.Y., Roh, Y.S. Oxidative stress is a key modulator in the development of nonalcoholic fatty liver disease. Antioxidants. 2022. [CrossRef]
- García-Ruiz, I., Solís-Muñoz, P., Fernández-Moreira, D., Muñoz-Yagüe, T., Solís-Herruzo, J.A. In vitro treatment of HepG2 cells with saturated fatty acids reproduces mitochondrial dysfunction found in nonalcoholic steatohepatitis. Dis. Model Mech. 2015. [CrossRef]
- Gabbia, D., Cannella, L., De Martin, S., Shiri-Sverdlov, R., Squadrito, G. The Role of Oxidative Stress in MASLD-NASH-HCC Transition-Focus on NADPH Oxidases. Biomedicines. 2021. [CrossRef]
- Abenavoli, L., Larussa, T., Corea, A., Procopio, A.C., Boccuto, L., Dallio, M., Federico, A., Luzza, F. Dietary Polyphenols and Non-Alcoholic Fatty Liver Disease. Nutrients. 2021. [CrossRef]
- Li, S., Tan, H.Y., Wang, N., Cheung, F., Hong, M., Feng, Y. The Potential and Action Mechanism of Polyphenols in the Treatment of Liver Diseases. Oxid. Med.Cell. Longev. 2018. [CrossRef]
- Bayram, H.M., Majoo, F.M., Ozturkcan, A. Polyphenols in the prevention and treatment of non-alcoholic fatty liver disease: An update of preclinical and clinical studies. Clin. Nutr. ESPEN. 2021. [CrossRef]
- Bessada, S. M. F., Barreira, J. C. M., Barros, L., Ferreira, I. C. F. R., Oliveira, M. B. P. P. Phenolic profile and antioxidant activity of Coleostephus myconis (L.) Rchb.f.: An underexploited and highly disseminated species. Industrial Crops and Products. 2016. [CrossRef]
- Amorim, R., Simões, I.C.M., Teixeira, J., Cagide, F., Potes, Y., Soares, P., Carvalho, A., Tavares, L.C., Benfeito, S., Pereira, S.P., Simões, R.F., Karkucinska-Wieckowska, A., Viegas, I., Szymanska, S., Dąbrowski, M., Janikiewicz, J., Cunha-Oliveira, T., Dobrzyń, A., Jones, J.G., Borges, F., Wieckowski, M.R., Oliveira, P. J. Mitochondria-targeted anti-oxidant AntiOxCIN4 improved liver steatosis in Western diet-fed mice by preventing lipid accumulation due to upregulation of fatty acid oxidation, quality control mechanism and antioxidant defense systems. Redox Biol. 2022a. [CrossRef]
- Amorim, R., Cagide, F., Tavares, L.C., Simões, R.F., Soares, P., Benfeito, S., Baldeiras, I., Jones, J.G., Borges, F., Oliveira, P.J., Teixeira, J. Mitochondriotropic antioxidant based on caffeic acid AntiOxCIN4 activates Nrf2-dependent antioxidant defenses and quality control mechanisms to antagonize oxidative stress-induced cell damage. Free Radic. Biol. Med. 2022b. [CrossRef]
- Silva, F.S.G., Starostina, I.G., Ivanova, V.V., Rizvanov, A.A., Oliveira, P.J., Pereira, S.P. Determination of metabolic viability and cell mass using a tandem resazurin/sulforhodamine B assay. Curr. Protoc. Toxicol. 2016. [CrossRef]
- Vichai, V., Kirtikara, K. Sulforhodamine B colorimetric assay for cytotoxicity screening. Nat. Protoc. 2006. [CrossRef]
- McMillian, M.K., Grant, E.R., Zhong, Z., Parker, J.B., Li, L., Zivin, R.A., Burczynski, M.E., Johnson, M.D. Nile red binding to HepG2 cells: An improved assay for in vitro studies of hepatosteatosis. In Vitro and Molecular Toxicology: J. Basic Appl. Res. 2001. [CrossRef]
- Salomone, F., Ivancovsky-Wajcman, D., Fliss-Isakov, N., Webb, M., Grosso, G., Godos, J., Galvano, F., Shibolet, O., Kariv, R., & Zelber-Sagi, S. Higher phenolic acid intake independently associates with lower prevalence of insulin resistance and non-alcoholic fatty liver disease. JHEP Rep. 2020. [CrossRef]
- Rashmi, H.B., Negi, P.S. Phenolic acids from vegetables: A review on processing stability and health benefits. Food Res. Int. 2020. [CrossRef]
- Graça, V.C., Barros, L., Calhelha, R.C., Dias, M.I., Ferreira, I.C.F.R., Santos, P.F. Bio-guided fractionation of extracts of Geranium robertianum L.: Relationship between phenolic profile and biological activity. Ind. Crops Prod. 2017. [CrossRef]
- Graça, V.C., Dias, M.I., Barros, L., Calhelha, R.C., Santos, P.F., Ferreira, I.C.F.R. Fractionation of the more active extracts of: Geranium molle L.: A relationship between their phenolic profile and biological activity. Food Funct. 2018. [CrossRef]
- de Queiroz, L.N., Da Fonseca, A.C.C., Wermelinger, G.F., da Silva, D.P.D., Pascoal, A.C.R.F., Sawaya, A.C.H.F., de Almeida, E.C.P., do Amaral, B.S., de Lima Moreira, D., Robbs, B.K. New substances of Equisetum hyemale L. extracts and their in vivo antitumoral effect against oral squamous cell carcinoma. J. Ethnopharmacol. 2023. [CrossRef]
- Jaiswal, R., Sovdat, T., Vivan, F., Kuhnert, N. Profiling and characterization by LC-MSn of the chlorogenic acids and hydroxycinnamoylshikimate esters in maté (Ilex paraguariensis). J. Agric. Food Chem. 2010. [CrossRef]
- Graça, V.C., Barros, L., Calhelha, R.C., Dias, M.I., Carvalho, A.M., Santos-Buelga, C., Santos, P.F., Ferreira, I.C.F.R. Chemical characterization and bioactive properties of aqueous and organic extracts of Geranium robertianum L. Food Funct. 2016. [CrossRef]
- Cheng, H.S., Ton, S.H., Abdul Kadir, K. Ellagitannin geraniin: a review of the natural sources, biosynthesis, pharmacokinetics and biological effects. Phytochem. Rev. 2017. [CrossRef]
- Elendran, S., Muniyandy, S., Lee, W.W., Palanisamy, U.D. Permeability of the ellagitannin geraniin and its metabolites in a human colon adenocarcinoma Caco-2 cell culture model. Food Funct. 2019. [CrossRef]
- Llorach, R., Gil-Izquierdo, A., Ferreres, F., Tomás-Barberán, F.A. HPLC-DAD-MS/MS ESI characterization of unusual highly glycosylated acylated flavonoids from cauliflower (Brassica oleracea L. var. botrytis) agroindustrial byproducts. J. Agric. Food Chem. 2003. [CrossRef]
- Mattera, M.G., Langenheim, M.E., Reiner, G., Peri, P.L., Moreno, D.A. Patagonian ñire (Nothofagus antarctica) combined with green tea - Novel beverage enriched in bioactive phytochemicals as health promoters. JSFA Rep. 2022. [CrossRef]
- Truchado, P., Vit, P., Ferreres, F., Tomas-Barberan, F. Liquid chromatography-tandem mass spectrometry analysis allows the simultaneous characterization of C-glycosyl and O-glycosyl flavonoids in stingless bee honeys. J. Chromatogr. 2011. [CrossRef]
- Llorent-Martinez, E.J., Spinola, V., Gouveia, S., Castilho, P.C. HPLC-ESI-MSn characterization of phenolic compounds, terpenoid saponins, and other minor compounds in Bituminaria bituminosa. Ind. Crops Prod. 2015. [CrossRef]
- Ferreres, F., Gonçalves, R.F., Gil-Izquierdo, A., Valentão, P., Silva, A.M.S., Silva, J.B., Santos, D., Andrade, P.B. Further Knowledge on the Phenolic Profile of Colocasia esculenta (L.) Shott. J. Agric. Food Chem. 2012. [CrossRef]
- Dou, J., Lee, V.S.Y., Tzen, J.T.C., Lee, M.R. Identification and comparison of phenolic compounds in the preparation of oolong tea manufactured by semifermentation and drying processes. J. Agric. Food Chem. 2007. [CrossRef]
- Romani, A., Galardi, C., Pinelli, P., Mulinacci, N., Heimler, D. HPLC quantification of flavonoids and biflavonoids in Cupressaceae leaves. Chromatographia. 2002. [CrossRef]
- Xiao, J., Muzashvili, T.S., Georgiev, M.I. Advances in the biotechnological glycosylation of valuable flavonoids. Biotechnol. Adv. 2014. [CrossRef]
- Hofer, B. Recent developments in the enzymatic O-glycosylation of flavonoids. Appl. Microbiol. Biotechnol. 2016. [CrossRef]
- Vasudevan, U.M., Lee, E.Y. Flavonoids, terpenoids, and polyketide antibiotics: Role of glycosylation and biocatalytic tactics in engineering glycosylation. Biotechnol. Adv. 2020. [CrossRef]
- Sordon, S., Popłoński, J., Huszcza, E. Microbial glycosylation of flavonoids. Pol. J. Microbiol. 2016. [CrossRef]
- Busch, S.J., Barnhart, R.L., Martin, G.A., Flanagan, M.A., Jackson, R.L. Differential regulation of hepatic triglyceride lipase and 3-hydroxy-3-methylglutaryl-CoA reductase gene expression in a human hepatoma cell line, HepG2. J. Biol. Chem. 1990. [CrossRef]
- Ramos, M.J., Bandiera, L., Menolascina, F., Fallowfield, J.A. In vitro models for non-alcoholic fatty liver disease: Emerging platforms and their applications. IScience. 2022. [CrossRef]
- de Sousa, I.F., Migliaccio, V., Lepretti, M., Paolella, G., Di Gregorio, I., Caputo, I., Ribeiro, E.B., Lionetti, L. Dose-and time-dependent effects of oleate on mitochondrial fusion/fission proteins and cell viability in HepG2 cells: Comparison with palmitate effects. Int. J. Mol. Sci. 2021. [CrossRef]
- Nissar, A.U., Sharma, L., Tasduq, S.A. Palmitic acid induced lipotoxicity is associated with altered lipid metabolism, enhanced CYP450 2E1 and intracellular calcium mediated ER stress in human hepatoma cells. Toxicol. Res. 2015. [CrossRef]
- Zang, Y., Fan, L., Chen, J., Huang, R., Qin, H. Improvement of Lipid and Glucose Metabolism by Capsiate in Palmitic Acid-Treated HepG2 Cells via Activation of the AMPK/SIRT1 Signaling Pathway. J. Agric. Food Chem. 2018. [CrossRef]
- Sergazy, S., Vetrova, A., Orhan, I.E., Senol Deniz, F.S., Kahraman, A., Zhang, J.Y., Aljofan, M. Antiproliferative and cytotoxic activity of Geraniaceae plant extracts against five tumor cell lines. Future Sci. AO. 2022. [CrossRef]
- Xiang, H., Shao, M., Lu, Y., Wang, J., Wu, T., Ji, G. Kaempferol Alleviates Steatosis and Inflammation During Early Non-Alcoholic Steatohepatitis Associated With Liver X Receptor α-Lysophosphatidylcholine Acyltransferase 3 Signaling Pathway. Front. Pharmacol. 2021. [CrossRef]
- Alnahdi, A., John, A., Raza, H. Augmentation of Glucotoxicity, Oxidative Stress, Apoptosis and Mitochondrial Dysfunction in HepG2 Cells by Palmitic Acid. Nutrients. 2019. [CrossRef]
- Eynaudi, A., Díaz-Castro, F., Bórquez, J.C., Bravo-Sagua, R., Parra, V., Troncoso, R. Differential Effects of Oleic and Palmitic Acids on Lipid Droplet-Mitochondria Interaction in the Hepatic Cell Line HepG2. Front. Nutr. 2021. [CrossRef]
- Milovanović, V., Radulović, N., Todorović, Z., Stanković, M., Stojanović, G. Antioxidant, antimicrobial and genotoxicity screening of hydro-alcoholic extracts of five Serbian Equisetum species. Plant Foods Hum. Nutr. 2007. [CrossRef]
- Hoang, M.H., Jia, Y., Lee, J.H., Kim, Y., Lee, S.J. Kaempferol reduces hepatic triglyceride accumulation by inhibiting Akt. J. Food Biochem. 2019. [CrossRef]
- Tie, F., Ding, J., Hu, N., Dong, Q., Chen, Z., Wang, H. Kaempferol and kaempferide attenuate oleic acid-induced lipid accumulation and oxidative stress in HepG2 cells. Int. J. Mol. Sci. 2021. [CrossRef]
- Zhao, L., Yang, L., Ahmad, K. Kaempferol ameliorates palmitate-induced lipid accumulation in HepG2 cells through activation of the Nrf2 signaling pathway. Hum. Exp. Toxicol. 2023. [CrossRef]
- Liu, P., Wu, P., Yang, B., Wang, T., Li, J., Song, X., Sun, W. Kaempferol prevents the progression from simple steatosis to non-alcoholic steatohepatitis by inhibiting the NF-κB pathway in oleic acid-induced HepG2 cells and high-fat diet-induced rats. J. Funct. Foods. 2021. [CrossRef]
Figure 1.
General aspect (A) and strobilus, cone-like structure that produce spores at the tips of a stem (B) of E. ramosissimum. Edible leaves (C) and pink-colored fruits (D) of R. induratus. Close-up on the flower, leaves (E), and ripen fruits (F) of G. purpureum. Flowers, leaves (G), and immature fruits of G. lucidum (H). Images (A), (B), (C), (D), (G) and (H) were obtained and adapted from the website Jardim Botânico da UTAD (https://jb.utad.pt/ accessed on 9th January 2024). Images (E) and (F) were obtained and adapted from the website the website Plants of the World Online (http://www.plantsoftheworldonline.org/ accessed on 9th January 2024). (I) Chemical structures of the most relevant phenolic compounds identified through HPLC–DAD–ESI/MS in E. ramosissimum, Geranium spp., and R. induratus from Côa Valley (Portugal). Chemical structures were designed in ChemDraw Software.
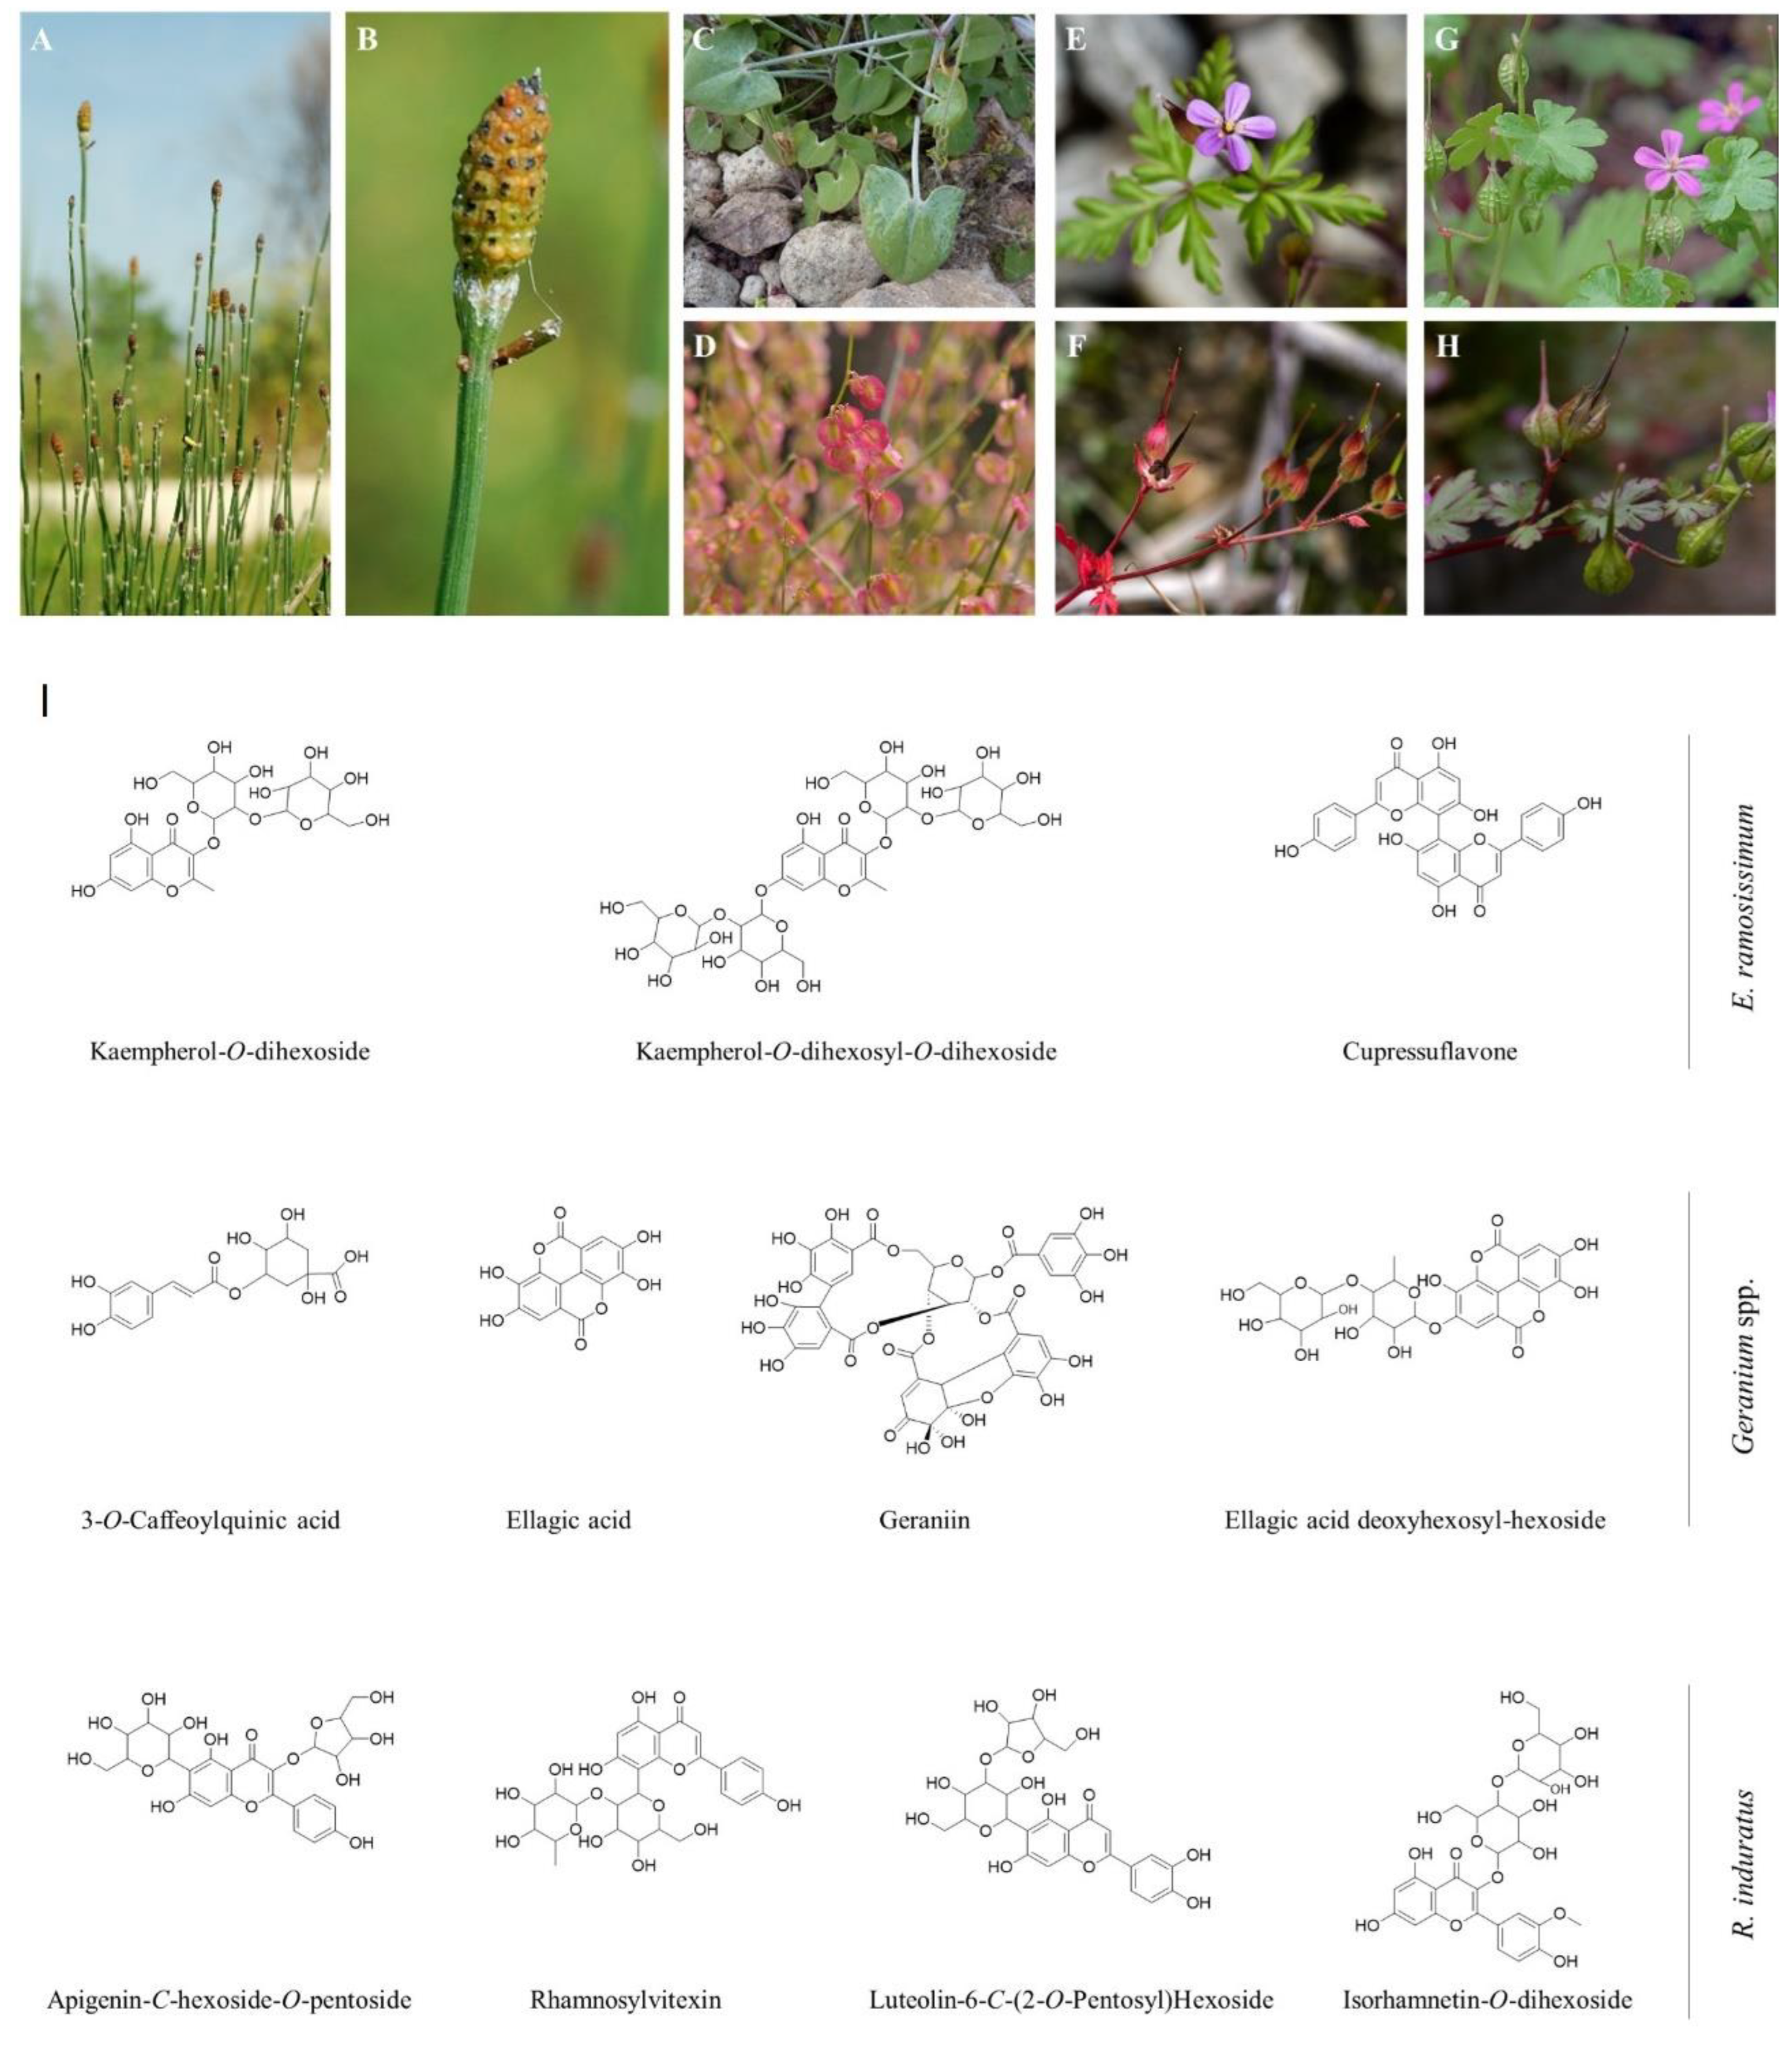
Figure 2.
Effects of EtOH80% and decoction extracts of plants originated from the Côa Valley on cell metabolic activity. (A) Human cells study experimental timeline. The metabolic activity of HepG2 cells, in percentage of control, following extract incubation in three different concentrations (25, 50 and 100 µg/mL). Each graph contains the results for extract incubation (white bars) and for PA following extract preincubation (grey bars). The black bar represents PA at 100 µM without extract preincubation, for comparison purposes. (B) EtOH80% and (C) D extract of G. purpureum, (D) EtOH80% and (E) D extract of G. lucidum, (F) EtOH80% and (G) D extract of E. ramosissimum, (H) EtOH80% and (I) D extract of R. induratus. Statistical significance was compared using two-way ANOVA followed by Tukey post hoc test for multiple comparisons (*p< 0.05, **p< 0.01, ***p< 0.0005, vs untreated cells); (#p<0.05, ##p<0.01, ###0.0005 vs PA-treated cells).
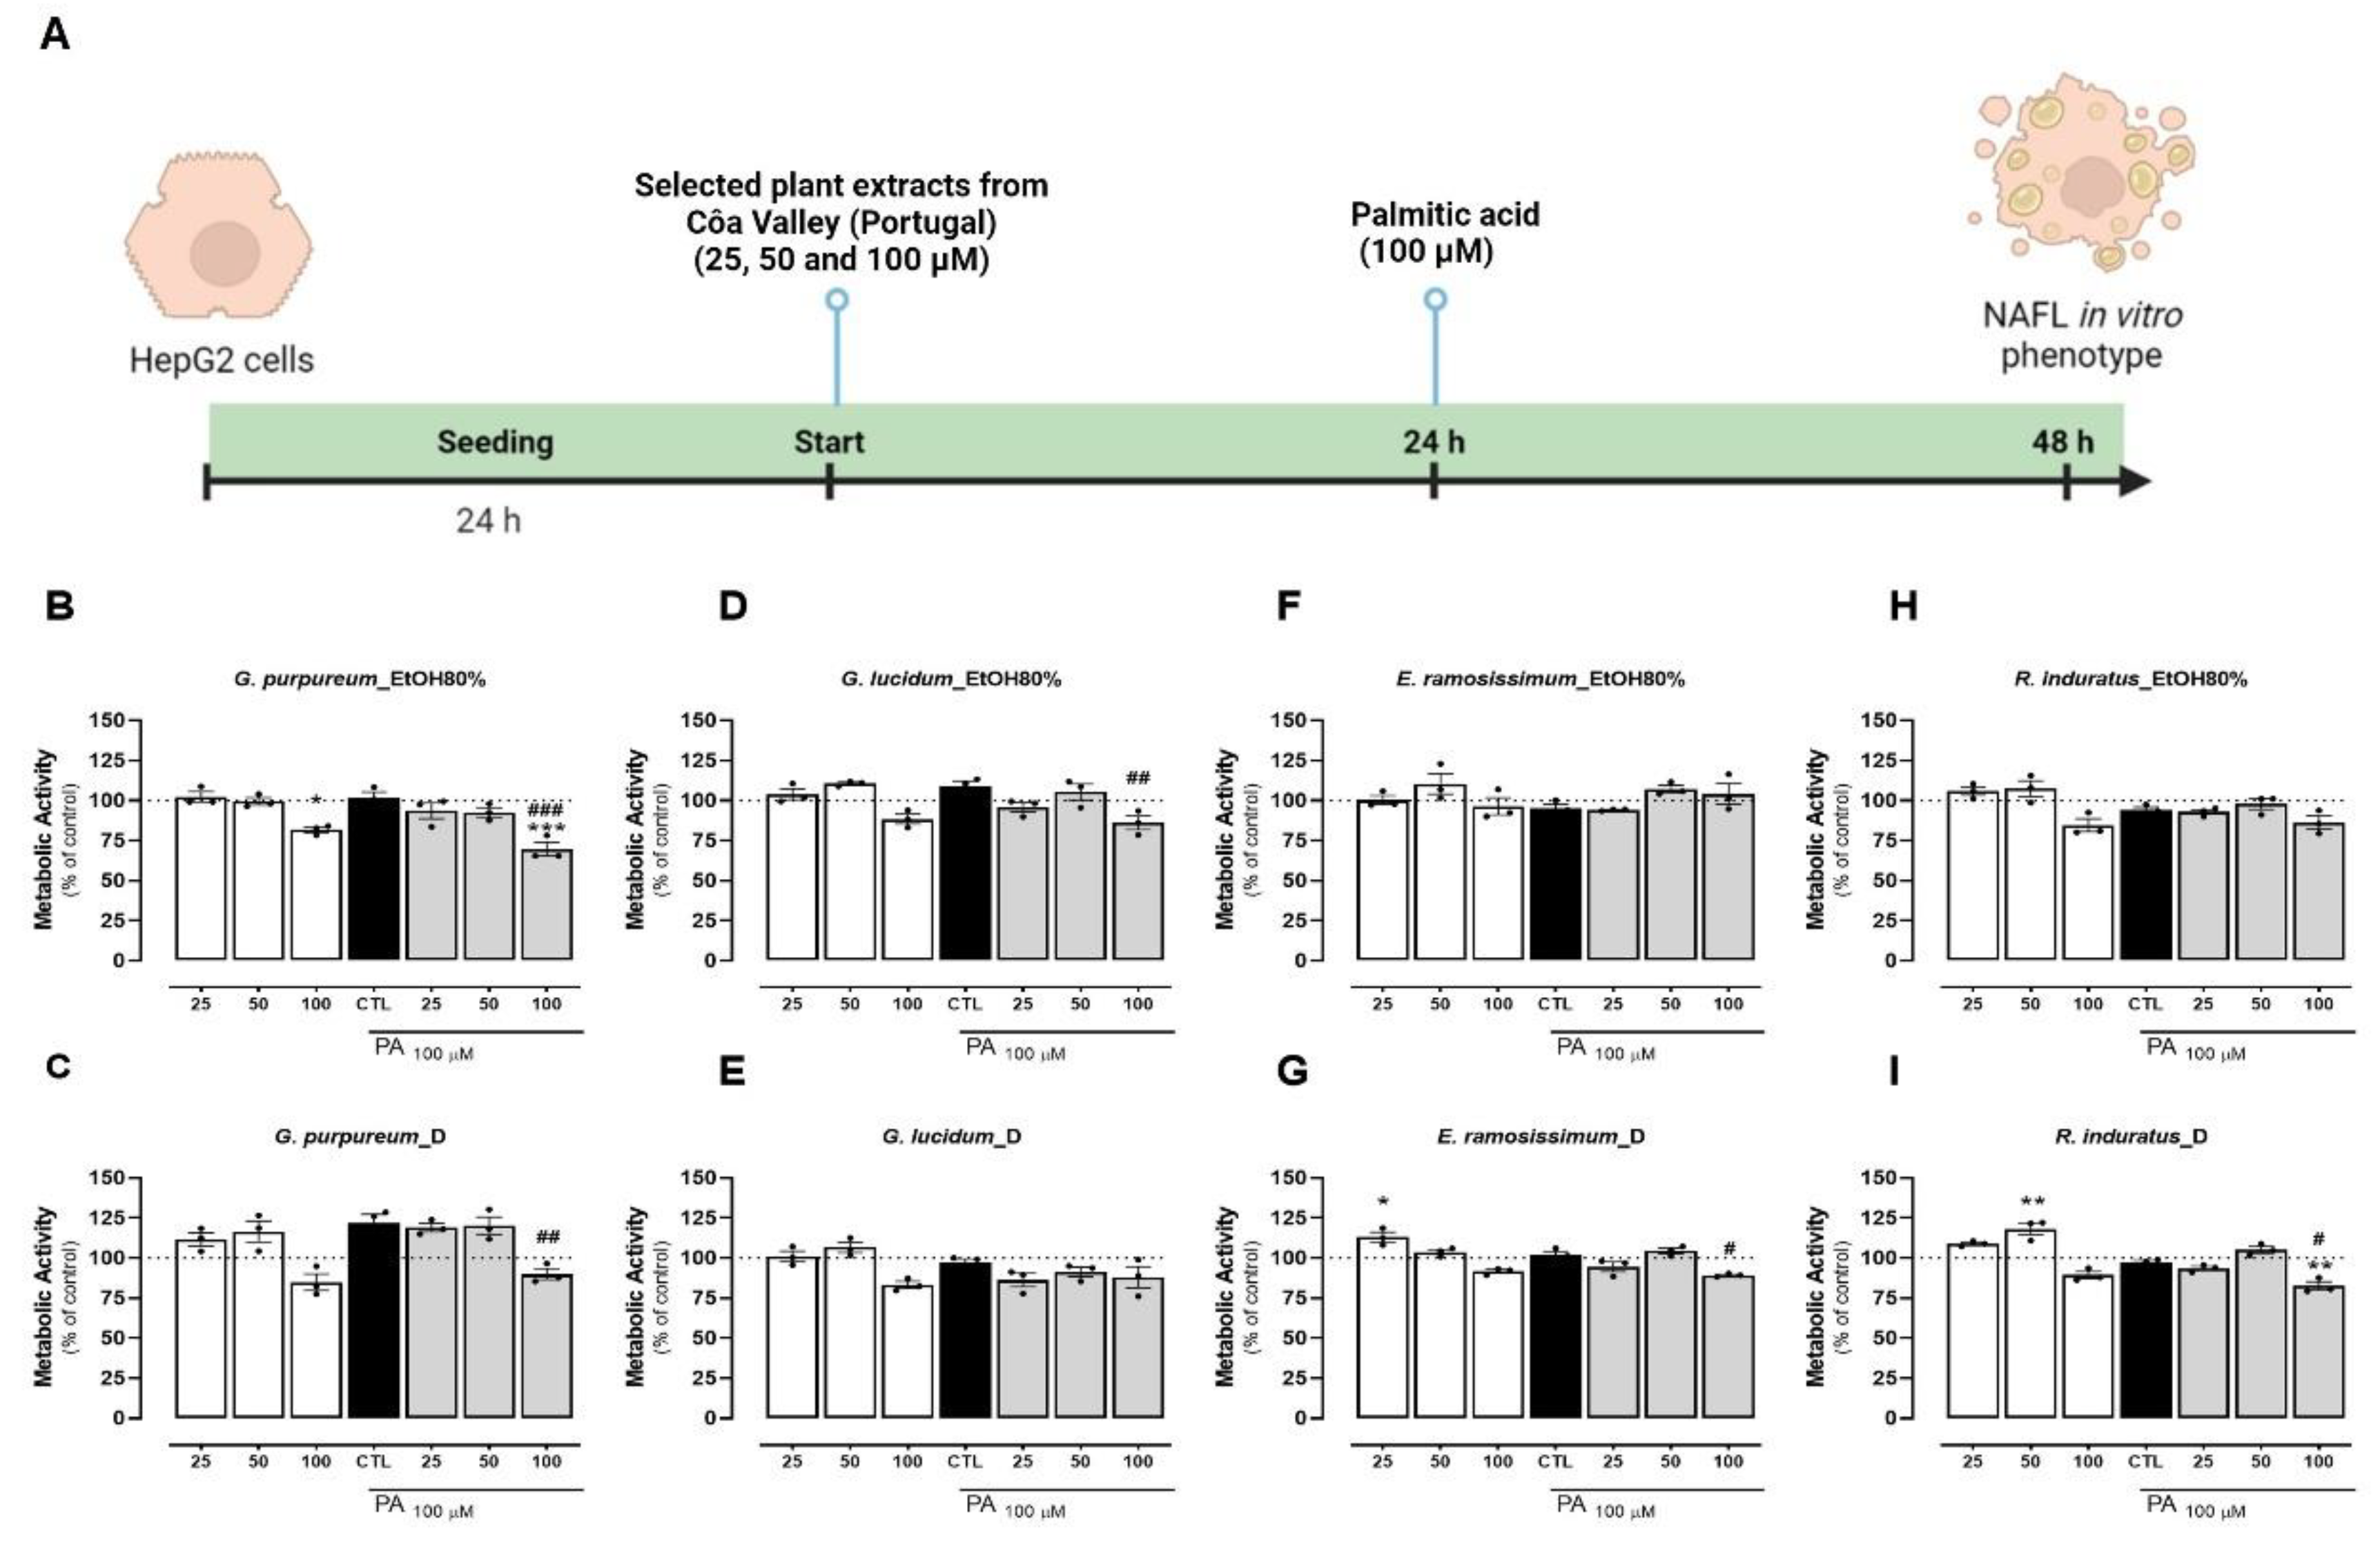
Figure 3.
Effects of EtOH80% and decoction (D) extracts of plants originated from the Côa Valley on cell mass. The cell mas of HepG2 cells, in percentage of control, following extract incubation in three different concentrations (25, 50 and 100 µg/mL). Each graph contains the results for extract incubation (white bars) and for PA following extract preincubation (grey bars). The black bar represents PA at 100 µM without extract preincubation, for comparison purposes. (A) EtOH80% and (B) D extract of G. purpureum, (C) EtOH80% and (D) D extract of G. lucidum, (E) EtOH80% and (F) D extract of E. ramosissimum, (G) EtOH80% and (H) D extract of R. induratus. Statistical significance was compared using two-way ANOVA followed by Tukey post hoc test for multiple comparisons (*p<0.05, **p<0.01, ***p<0.0005, vs untreated cells); (#p<0.05, ##p<0.01, ####p<0.0001 vs PA-treated cells).
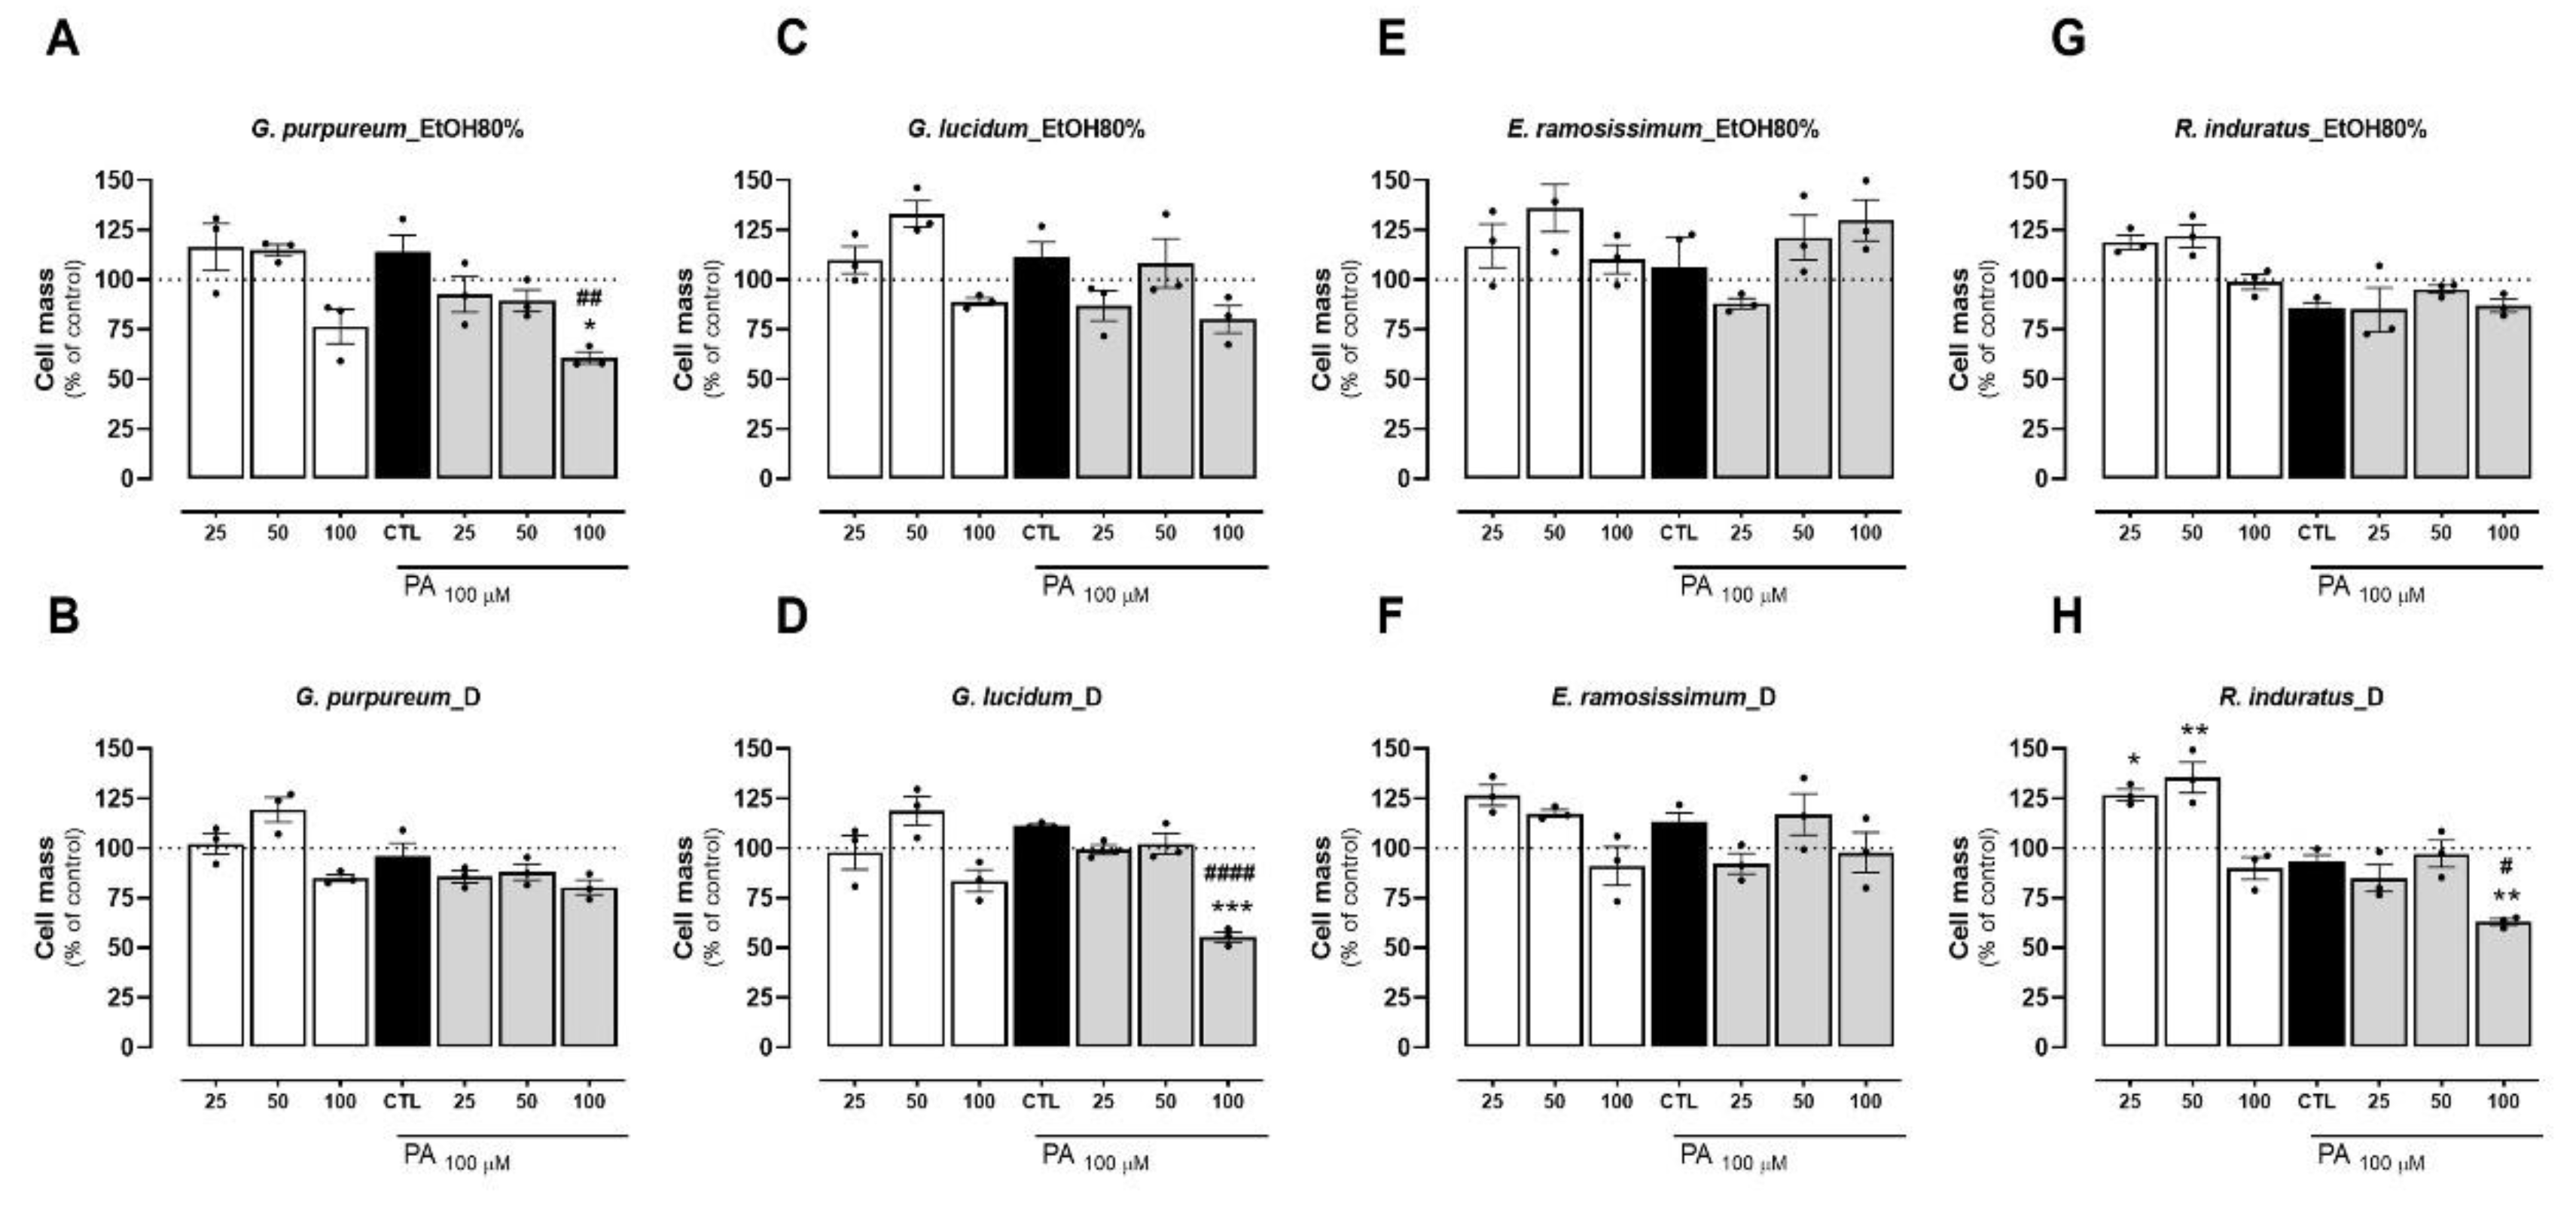
Figure 4.
Effects of EtOH80% and decoction extracts of plants originated from the Côa Valley on cell lipid accumulation. The neutral lipid accumulation of HepG2 cells, in percentage of control and normalized for cell mass results, following extract incubation in three different concentrations (25, 50 and 100 µg/mL). Each graph contains the results for extract incubation (white bars) and for PA following extract preincubation (grey bars). The black bar represents PA at 100 µM without extract preincubation, for comparison purposes. (A) EtOH80% and (B) D extract of G. purpureum, (C) EtOH80% and (D) D extract of G. lucidum, (E) EtOH80% and (F) D extract of E. ramosissimum, (G) EtOH80% and (H) D extract of R. induratus. Statistical significance was compared using two-way ANOVA followed by Tukey post hoc test for multiple comparisons (*p<0.05, **p<0.01, ***p<0.0005, vs untreated cells); (#p<0.05, ##p<0.01vs PA-treated cells).
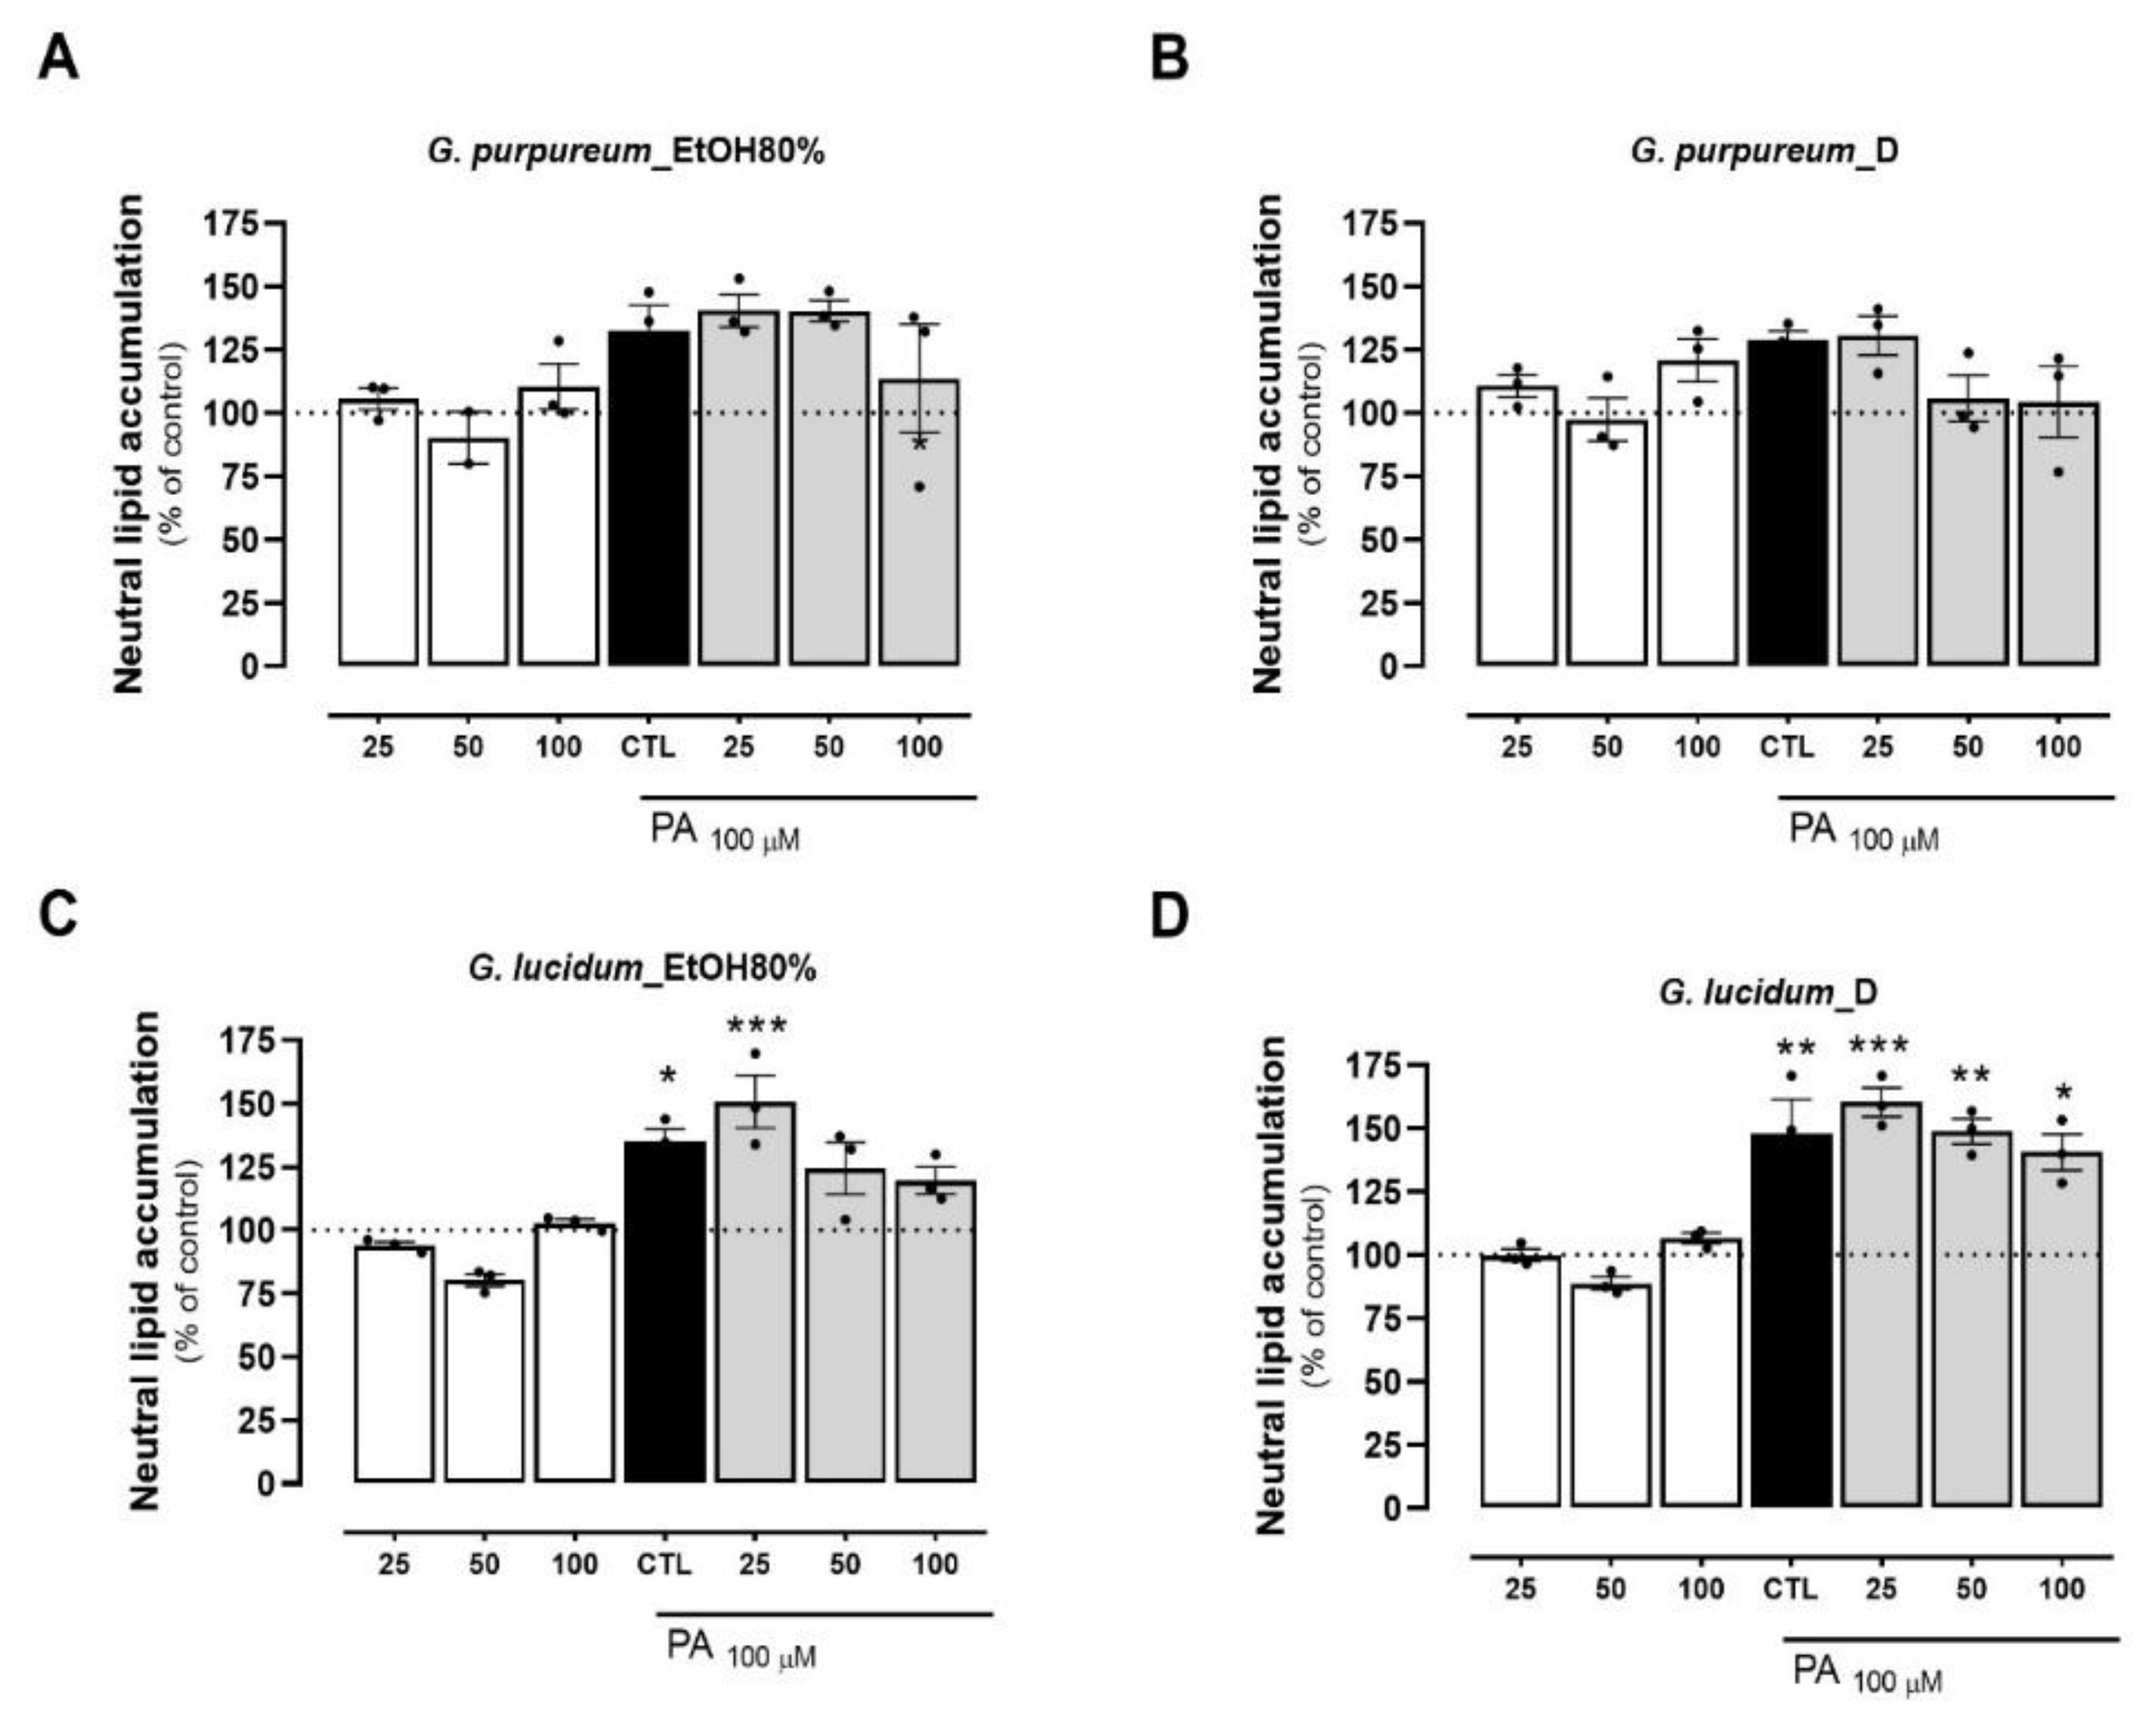

Table 1.
Peaks, retention times (RT), wavelengths of maximum absorption (λmax), mass spectral data, tentative identification, and quantification (mg/g extract) of the phenolic compounds present in the hydroalcoholic (EtOH 80%) and decoction extracts of G. purpureum and G. purpureum (Mean±SD).
Table 1.
Peaks, retention times (RT), wavelengths of maximum absorption (λmax), mass spectral data, tentative identification, and quantification (mg/g extract) of the phenolic compounds present in the hydroalcoholic (EtOH 80%) and decoction extracts of G. purpureum and G. purpureum (Mean±SD).
| Peak | RT (min) | λmax (nm) | [M-H]- (m/z) | MSn (m/z) | Tentative identification | Quantification (mg/g) | |||
|---|---|---|---|---|---|---|---|---|---|
| G. lucidum | G. purpureum | ||||||||
| EtOH 80% | Decoction | EtOH 80% | Decoction | ||||||
| 1g | 4.94 | 321.00 | 353 | MS2:191(100),179(82),135(12) | 3-O-Caffeoylquinic acid | 10.14±0.04a | 9.66±0.01c | 2.33±0.03d | 9.97±0.02b |
| 2g | 5.75 | 270 | 799 | MS2:301(100) | Ellagitannin | 2.21±0.02d | 3.09±0.03a | 1.933±0.004b | 2.87±0.01c |
| 3g | 6.59 | 324 | 337 | MS2:191(12),163(100),119(23) | 3-O-p-Coumaroylquinic acid | 0.703±0.002d | 0.84±0.02c | 1.45±0.03a | 1.29±0.02b |
| 4g | 7.63 | 326 | 367 | MS2:193(100),191(16),173(14),149(25) | 3-O-Feruloylquinic acid | 0.52±0.01c | 0.646±0.003b | 0.205±0.001d | 0.73±0,01a |
| 5g | 11.06 | 277 | 951 | MS2:933(100),613(4),462(6),301(8) | Geraniin isomer I | 14.32±0.01b | 4.2±0.07d | 7.47±0.04c | 39.89±0.04a |
| 6g | 12.15 | 277 | 951 | MS2:933(100),613(4),462(6),301(8) | Geraniin isomer II | n.d. | n.d. | n.d. | 4.22±0.01 |
| 7g | 14.55 | 281 | 755 | MS2:301(100) | Ellagic acid dideoxyhexosyl-hexoside | 1.48±0.01* | 1.504±0.003* | n.d. | n.d. |
| 8g | 15.84 | 280 | 609 | MS2:301(100) | Ellagic acid deoxyhexosyl-hexoside isomer I | 1.75±0.005b | 1.358±0.001c | 1.291±0.001d | 1.94±0.01b |
| 9g | 16.17 | 280 | 609 | MS2:301(100) | Ellagic acid deoxyhexosyl-hexoside isomer II | 2.33±0.05a | 1.646±0.002c | 1.285±0.001d | 1.9004±0.0002b |
| 10g | 16.54 | 280 | 609 | MS2:301(100) | Ellagic acid deoxyhexosyl-hexoside isomer III | 2.23±0.02b | 1.68±0.01c | 1.337±0.002d | 3.091±0.002a |
| 11g | 17.06 | 281 | 433 | MS2:301(100) | Ellagic acid pentoside | 2.12±0.004b | 1.79±0.01c | 1.66±0.01d | 4.02±0.09a |
| 12g | 17.76 | 279 | 609 | MS2:301(100) | Ellagic acid deoxyhexosyl-hexoside isomer IV | 1.81±0.02a | 1.59±0.01b | 0.537±0.004d | 0.79±0.01c |
| 13g | 18.56 | 348 | 593 | MS2:285(100) | Luteolin-O-deoxyhexosyl-hexoside isomer I | 1.63±0.02b | 0.95±0.01c | n.d. | 2.399±0.004a |
| 14g | 19.04 | 280 | 301 | - | Ellagic acid | 3.4196±0.0003b | 7.987±0.004a | 1.337±0.002d | 3.091±0.002c |
| 15g | 19.83 | 361 | 761 | MS2:609(12),301(100),151(12) | Quercetin galloyl O-deoxyhexosyl-hexoside | 0.84±0.01** | 1.115±0.001** | n.d. | n.d. |
| 16g | 20.33 | 357 | 615 | MS2:463(12),301(100) | Quercetin galloyl O-hexoside | 0.74±0.01* | 0.74±0.01* | n.d. | n.d. |
| 17g | 21.08 | 349 | 593 | MS2:285(100) | Luteolin-O-deoxyhexosyl-hexoside isomer II | 0.81±0.01a | 0.732±0.004c | 0.52±0.001d | 0.76±0.01a |
| 18g | 21.38 | 348 | 447 | MS2:285(100) | Luteolin-O-hexoside isomer I | 0.96±0.01b | 0.71±0.01c | 1.01±0.01a | n.d. |
| 19g | 22.03 | 353 | 623 | MS2:315(100) | Isorhamnetin O-deoxyhexosyl-hexoside | 0.63±0.01** | 0.59±0.01** | n.d. | n.d. |
| 20g | 22.59 | 348 | 447 | MS2:285(100) | Luteolin-O-hexoside isomer II | 1.23±0.01** | 0.697±0.004** | n.d. | n.d. |
| 21g | 23.11 | 353 | 745 | MS2:593(12),459(89),285(100) | Luteolin galloyl O-deoxyhexosyl-hexoside | 0.9±0.01a | 0.61±0.01b | 0.91±0.01a | n.d. |
| 22g | 23.5 | 353 | 591 | MS2:301(100) | Quercetin derivative | 0.83±0.01a | 0.539±0.002b | 0.83±0,01a | n.d. |
| 23g | 24.27 | 351 | 599 | MS2:285(100) | Luteolin galloyl O-hexoside | 0.97±0.01a | 0.583±0.003b | 0.97±0.01a | n.d. |
| 24g | 26.79 | 349 | 575 | MS2:285(100) | Luteolin derivative | 1.04±0.01a | 0.589±0.003b | 1.04±0.01a | n.d. |
| Total phenolic acids | 11.36±0.04b | 11.144±0.004c | 3.99±0.06d | 11.99±0.01a | |||||
| Total ellagic derivatives | 31.67±0.09b | 24.86±0.09c | 18.44±0.03d | 65.13±0.13a | |||||
| Total flavonoids | 10.35±0.01a | 7.85±0.01b | 5.8±0.01c | 1.558±0.002d | |||||
| Total phenolic compounds | 53.38±0.12b | 43.85±0.08c | 28.22±0.02d | 78.69±0.14a | |||||
Rt: Retention time in minutes; λmax: wavelength (nm) of maximum absorption in the UV–visible region; [M-H]-: deprotonated ion (negative ion mode) (m/z); MSn fragment ions generated in MS2 and/or MS3 spectra (m/z) and relative abundance in brackets, n.d.: not detected. Standard calibration curves used for quantification: Chlorogenic acid (y = 168.823x – 161.172, R2 = 0.999, LOD (limit of detection) = 0.20 µg/mL; LOQ (limit of quantification) = 0.68 µg/mL, peak 1); ferulic acid (y = 633.126x – 185.462, R2 = 0.999, LOD = 0.20 μg/mL; 1.01 μg/mL, peak 4); p-coumaric acid (y = 301.950x + 6966.7, R2 = 0.9999, LOD = 0.68 μg/mL and LOQ = 1.61 μg/mL, peak 3); ellagic acid (y = 26.719x – 317.255, R2 = 0.999, LOD = 41.20 µg/mL; LOQ = 124.84 µg/mL, peaks 2, 5, 6, 7, 8, 9, 10, 11, 12, and 12); and quercetin-3-O-glucoside (y = 34.843x – 160.173, R2 = 0.999, LOD = 0.21 µg/mL; LOQ = 0.71 µg/mL, peaks 13, 15, 16, 17, 18, 19, 20, 21, 22, 23, and 24). In each row, different superscript letters (a-c) mean significant differences between extracts (p < 0.05). *—Student’s t-test p-value < 0.001: **—Student’s t-test p-value 0.043 (peak 16), 0.200 (peak 19), and 0.015 (peak 20).
Table 2.
Peaks, retention times (RT), wavelengths of maximum absorption in the visible region (λmax), mass spectral data, tentative identification, and quantification (mg/g extract) of the phenolic compounds present in the hydroalcoholic (EtOH 80%) and decoction extracts of E. ramosissimum (Mean±SD).
| Peak | RT (min) | λmax (nm) | [M-H]- (m/z) | MSn (m/z) | Tentative identification | ||
|---|---|---|---|---|---|---|---|
| Quantification (mg/g extract) | |||||||
| EtOH 80% | Decoction | ||||||
| 1e | 5.08 | 246,271sh,352 | 771 |
MS2:609(100). MS3:429(100),285(53) |
Kaempherol-O-dihexosyl-O-dihexoside isomer I | 5.6355±0.0049* | 4.08±0.01* |
| 2e | 5.93 | 246,271sh,352 | 771 | MS2:609(100). MS3:429(100),285(35) |
Kaempherol-O-dihexosyl-O-dihexoside isomer II | 1.245±0.01* | 0.934±0.001* |
| 3e | 6.36 | 264,301,328 | 787 | MS2:625(100). MS3:463(100),301(79) |
Quercetin-O-dihexosyl-O-dihexoside | 0.756±0.01* | 0.762±0.001* |
| 4e | 6.70 | 284.00 | 355 | MS2:193(100),178(18) | Ferulic acid hexoside isomer I | 0.313±0.005* | 0.221±0.004* |
| 5e | 7.83 | 266,248 | 813 | MS2:651(100),285(34) | Kaempherol-O-hexosyl-O-acetyl-dihexoside | 0.659±0.0037* | 0.595±0.001* |
| 6e | 8.25 | 284.00 | 355 | MS2:193(100),178(23) | Ferulic acid hexoside isomer II | 0.59±0.01* | 0.41±0.01* |
| 7e | 10.68 | 266,307,327 | 537 | MS2:375(100),195(34) | Cupressuflavone | 2.205±0.01* | 2.003±0.004* |
| 8e | 15.11 | 246,271sh,352 | 771 | MS2:609(100). MS3:429(100),285(98) |
Kaempherol-O-dihexosyl-O-dihexoside isomer III | 0.973±0.01* | 0.75±0.01* |
| 9e | 16.57 | 347.00 | 609 | MS2:285(100) | Kaempherol-O-dihexoside | 1.718±0.003** | 1.718±0.003** |
| 10e | 17.29 | 324.00 | 193 | MS2:178(34),134(100) | Ferulic acid | 0.142±0.001* | 0.164±0.003* |
| 11e | 20.99 | 345.00 | 651 | MS2:609(65),285(100) | Kaempherol-O-acetyl-dihexoside | 0.5291±0.0004 | n.d. |
| Total phenolic acids | 1.044±0.01* | 0.793±0.005* | |||||
| Total flavonoids | 13.721±0.02* | 10.848±0.004* | |||||
| Total phenolic compounds | 14.765±0.01* | 11.64±0.01* | |||||
Rt: Retention time in minutes; λmax: wavelength (nm) of maximum absorption in the UV–visible region; [M-H]-: deprotonated ion (negative ion mode) (m/z); MSn fragment ions generated in MS2 and/or MS3 spectra (m/z) and relative abundance in brackets, n.d.: not detected. Standard calibration curves used for quantification: Apigenin-7-O-glucoside (y = 10.683x – 45.794; R2 = 0.999, LOD (limit of detection) = 0.10 μg/mL; and LOQ (limit of quantification) = 0.53 μg/mL, peak 7); ferulic acid (y = 633.126x – 185.462, R2 = 0.999, LOD = 0.20 μg/mL; and LOQ = 1.01 μg/mL, peak 4, 6 and 10); and quercetin-3-O-glucoside (y = 34.843x – 160.173, R2 = 0.9998, LOD = 0.21 µg/mL; LOQ = 0.71 µg/mL, peaks 1, 2, 3, 5, 8, 9, and 11). *—Student’s t-test p-value < 0.001.
Table 3.
Peaks, retention times (RT), wavelengths of maximum absorption in the visible region (λmax), mass spectral data, tentative identification, and quantification (mg/g extract) of the phenolic compounds present in the hydroalcoholic (EtOH 80%) and decoction (D) extracts of R. induratus.
Table 3.
Peaks, retention times (RT), wavelengths of maximum absorption in the visible region (λmax), mass spectral data, tentative identification, and quantification (mg/g extract) of the phenolic compounds present in the hydroalcoholic (EtOH 80%) and decoction (D) extracts of R. induratus.
| Peak | RT (min) | λmax (nm) | [M-H]- (m/z) | MSn (m/z) | Tentative identification | ||
|---|---|---|---|---|---|---|---|
| Quantification (mg/g extract)* | |||||||
| EtOH 80% | Decoction | ||||||
| 1r | 5.51 | 324.00 | 341 | MS2:179(100),135(18) | Caffeic acid hexoside | 0.33±0.007 | 0.175±0.006 |
| 2r | 5.73 | 345 | 577 | MS2:413(100),293(32) | Rhamnosylvitexin | 1.221±0.019 | 0.833±0.017 |
| 3r | 6.49 | 264,329 | 947 | MS2:785(100). MS3:639(100),315(78) |
Isorhamnetin-O-caffeoyl-O-deoxyhexosyl-dihexoside isomer I | 0.6233±0.0002 | 0.5534±0.0005 |
| 4r | 6.72 | 264,311 | 947 | MS2:785(100). MS3:639(100),315(78) |
Isorhamnetin-O-caffeoyl-O-deoxyhexosyl-dihexoside isomer II | 0.626±0.006 | 0.587±0.001 |
| 5r | 7.87 | 311 | 325 | MS2: 163(29),145(100),119(17) | cis p-Coumaric acid hexoside | 0.164±0.004 | 0.11±0.002 |
| 6r | 8.32 | 311 | 325 | MS2: 163(29),145(100),119(17) | trans p-Coumaric acid hexoside | 0.162±0.003 | 0.092±0.001 |
| 7r | 9.37 | 312 | 355 | MS2: 193(100),179(11),149(78) | Ferulic acid hexoside isomer I | 0.7115±0.0004 | 0.464±0.001 |
| 8r | 9.88 | 312 | 355 | MS2: 193(100),179(16),149(61) | Ferulic acid hexoside isomer II | 0.225±0.008 | 0.147±0.004 |
| 9r | 14 | 340 | 563 | MS2: 545(5),503(6),473(78),443(100) | Apigenin 6-C-hexosyl-8-C-pentoside | 0.201±0.008 | 0.087±0.017 |
| 10r | 14.71 | 348 | 579 | MS2: 459(5),429(71),357(54),327(100),285(5) | Luteolin-6-C-(2-O-Pentosyl)Hexoside isomer I | 4.147±0.053 | 2.645±0.029 |
| 11r | 15 | 345 | 579 | MS2: 459(5),429(65),357(56),327(100),285(5) | Luteolin-6-C-(2-O-Pentosyl)Hexoside isomer II | 1.685±0.04 | 0.958±0.047 |
| 12r | 16.55 | 336 | 563 | MS2: 443(5),413(100),293(13) | Apigenin-C-hexoside-O-pentoside isomer I | 1.209±0.002 | 0.718±0.007 |
| 13r | 17.33 | 336 | 563 | MS2: 443(5),413(100),293(13) | Apigenin-C-hexoside-O-pentoside isomer II | 0.184±0.005 | 0.103±0.007 |
| 14r | 17.95 | 351 | 609 | MS2:301(100) | Quercetin-3-O-rutinoside | 0.529±0.002 | 0.499±0.001 |
| 15r | 18.56 | 335 | 431 | MS2:341(22),311(100). MS3:283(100) |
Apigenin-C-hexoside | 0.144±0.009 | 0.071±0.004 |
| 16r | 18.87 | 355 | 639 | MS2:315(100) | Isorhamnetin-O-dihexoside isomer I | 0.499±0.001 | 0.4826±0.0005 |
| 17r | 22.21 | 354 | 623 | MS2:315(100) | Isorhamnetin-O-dihexoside isomer II | 0.5159±0.0002 | 0.496±0.001 |
| Total phenolic acids | 1.593±0.007 | 0.989±0.005 | |||||
| Total flavonoids | 11.584±0.123 | 8.033±0.107 | |||||
| Total phenolic compounds | 13.177±0.116 | 9.023±0.112 | |||||
Rt: Retention time in minutes; λmax: wavelength (nm) of maximum absorption in the UV–visible region; [M-H]-: deprotonated ion (negative ion mode) (m/z); MSn fragment ions generated in MS2 and/or MS3 spectra (m/z) and relative abundance in brackets. Standard calibration curves used for quantification: Apigenin-7-O-glucoside (y = 10.683x – 45.794; R2 = 0.999, LOD (limit of detection) = 0.10 μg/mL; and LOQ (limit of quantification) = 0.53 μg/mL, peak 2); apigenin-6-C-glucoside (y = 107.025x + 61.531, R2 = 0.999, LOD = 0.19 µg/mL; LOQ = 0.63 µg/mL, 9, 10, 11, 12, 13, and 15); caffeic acid (y = 388.345x + 406.369, R2 = 0.994, LOD = 0.78 μg/mL; LOQ =1.97 μg/mL, peak 1); ferulic acid (y = 633.126x – 185.462, R2 = 0.999, LOD = 0.20 μg/mL; and LOQ = 1.01 μg/mL, peak 7 and 8); p-coumaric acid (y = 301.950x + 6966.7, R2 = 0.999, LOD = 0.68 μg/mL and LOQ = 1.61 μg/mL, peaks 5 and 6); and quercetin-3-O-glucoside (y = 34.843x – 160.173, R2 = 0.999, LOD = 0.21 µg/mL; LOQ = 0.71 µg/mL, peaks 3, 4, 14, 16, and 17). *—Student’s t-test p-value < 0.001: **—Student’s t-test p-value < 0.0001 (peak 9).
Disclaimer/Publisher’s Note: The statements, opinions and data contained in all publications are solely those of the individual author(s) and contributor(s) and not of MDPI and/or the editor(s). MDPI and/or the editor(s) disclaim responsibility for any injury to people or property resulting from any ideas, methods, instructions or products referred to in the content. |
© 2024 by the authors. Licensee MDPI, Basel, Switzerland. This article is an open access article distributed under the terms and conditions of the Creative Commons Attribution (CC BY) license (http://creativecommons.org/licenses/by/4.0/).
Copyright: This open access article is published under a Creative Commons CC BY 4.0 license, which permit the free download, distribution, and reuse, provided that the author and preprint are cited in any reuse.


