Submitted:
09 December 2024
Posted:
10 December 2024
You are already at the latest version
Abstract
The resilience of earth-filled embankments against flooding is experimentally investigated using a scaled laboratory model. The project aims to evaluate the effectiveness of low-cost strengthening methods and materials which can be easily implemented especially in developing countries. Investigating locally available materials like waste tyres and jute bags reveals promising options for strengthening embankments in these regions. The performance of waste tyres as reinforcement material connected using jute string was evaluated by conducting tests using four flow rates under two different scenarios: steady peak flow scenario with reinforcement and without reinforcement. Measurements of the embankment height along the cross-sectional width were recorded and the erosion level was analysed by quantifying sediment volume loss. Three successive modes of failure were determined: toe scouring, sliding, toppling. Direct correlation was observed between increasing discharge and water depth. Reinforcing the embankment significantly decreased erosion in the range of 30% - 50% under different flooding scenarios, therefore, highlighting its effectiveness in reducing failure risks and contributing to UN Sustainable Development Goals 9, 11 and 13.
Keywords:
earth-filled embankments
; flooding
; waste tyre
; geocell reinforcement
; scour
; erosion
; material loss
; sentiment transfer
1. Introduction
The increase in magnitude and frequency of flash floods across the globe [1,2] underscores the intensifying impact of extreme weather events driven by climate change. These events pose an increasing threat worldwide, with developing countries being especially vulnerable. In Bangladesh, catastrophic floods caused by cyclonic storm surges have repeatedly struck low-lying regions [3] with the most recent example in August 2024 with 502,501 people displaced [4]. About 30-40% of the country’s population who live closer to rivers are facing environmental and social problems due to river erosion [5]. The lack of effective reinforcements along the riverbanks and coastal areas as well as robust infrastructure, makes these regions vulnerable to catastrophic disasters following flood occurrences which disproportionately impact low-income communities [6,7].
To mitigate the erosion of banks caused by the extreme flood events and protect the land along the Brahmaputra-Jamuna River in Bangladesh, structures such as groynes and revetments were constructed between the years 1980 and 2015 proving to be a practical solution [8]. However, the combined effects of climate change and the intensifying impact of extreme rainfall during the monsoon season has increased the intensity of flooding, soil erosion and scouring as illustrated in Figure 1. Further flooding results in many traditional embankments to become ineffective and insufficient [3]. Since many embankments in developing nations, such as in Bangladesh, are composed of merely natural soil, the land near the embankments is extremely vulnerable. Excessive rainfall or increased water can remove the uppermost soil; a phenomenon known as sheet erosion [9]. Saturation of the submerged soil slope weakens the material strength, which in combination with scouring at the base, fluvial erosion and sentiment transfer by the river, triggers a successive slumping process, resulting in severe retreat of riverbanks, further exposure to flooding, loss of land, habitats and infrastructure. Geotechnical failures, primarily flow slides caused by scouring, along with retrogressive erosion or breaching process during floods have severely damaged the embankments of the Brahmaputra-Jamuna River planform [8].
According to the World Meteorological Organization (WMO), Asia was the world’s most disaster-prone region in 2023, experiencing 79 extreme weather and climate-related events. Floods and storms accounted for 80% of these disasters, resulting in over 2,000 fatalities and directly affecting more than 9 million people [10]. But climate change-driven natural disasters have started significantly impacting other areas of the planet, such as the Mediterranean countries in Europe. Greece, for instance, has experienced two lifetime-category cyclones within three years: Cyclone Ianos in 2020 and Storm Daniel in 2023. Both events caused catastrophic flooding, landslides, and widespread infrastructure collapse, as illustrated in Figure 2 [11,12,13]. Storm Daniel, the most intense storm recorded in Greece since 1930, had an estimated annual occurrence probability of just 0.4–1.25%, highlighting its rarity and the increasing risks posed by climate change [14].
The year 2024 is projected to become the warmest on record, accelerating glacier ice loss and sea-level rise. In addition, central Europe experienced unusually high precipitation between September and October 2024, leading to severe flash floods. Spain alone reported 219 fatalities due to the recent flash floods being recorded as the deadliest flood phenomenon to affect Europe since 1970 [14,15].
Studying failure mechanisms and erosion patterns on natural soil riverbanks and earth embankments is critical for proposing and designing suitable mitigation measures. The most reliable source of information are real-life case studies and field observations after flooding events [5,16,17]. Physical modelling in scaled flume experiments has been extensively used, combined with numerical modelling to simulate erosion/scouring related slope stability problems, and assess the performance of different structural systems and erosion control systems [18,19,20]. The slope geometry, the soil material properties, the water level and the stream velocity, are commonly highlighted as the main parameters affecting the behaviour of the slope. The most common failure pattern in natural slopes consisting of apparently “cohesive” soil material, is triggered by the weakening and sliding flow of the material in the submerged part causing scouring at the base, which is followed by the development of tensile cracks and a “blocky” toppling failure of the overhanging slope part above the cavity, also mentioned as "cantilever failure” [18,19,20]. Following the slope collapse, the next important aspects highlighted in the literature are: a) the sediment material added on the river bed, driving a further increase of the water level and its effect on erosion, and b) the sediment transport and deposition mechanisms that tend to create new bedforms along the channel bed, which can affect the route and the erosion potential of the river [21,22,23]. From the latter, it is evident that a critical intervention for erosion protection on riverbanks and embankments should aim to enhance stability but also to reduce the material loss from the slope into bedload.
Improving the geotechnical properties of soil embankments is necessary to reduce mass failures [24], a task however that can be exceedingly costly to accomplish especially in developing countries, where efficient and affordable soil reinforcement techniques for earth embankments are crucial, to reduce the impact of flood imposed disasters. The use of natural and synthetic fibre such as wool, leaf fibres [25], coconut (coir) fibre, palm fibres, jute, bamboo, cane [26] have been studied as low-cost and efficient methods for stabilising soil [27]. Reuse of waste car tyres in various forms (e.g. shredded, tyre bales, individual tyre, “8”-shaped geocells etc) has been proposed in the literature as a low-cost alternative for soil stabilisation and reinforcement (e.g. compared to geosynthetic geogrids and geocells), which also addresses the massive tyre waste management problem [28,29]. Tyre reinforcement has been used as retaining walls to protect embankment slopes [30] and forest roads [31] and has been shown to produce satisfactory results in frictional and cohesive soil [32]. Past research in the UK, funded by the Department of Trade and Industry and the Environmental Agency, has investigated the use of waste tyres as bales or individual tyres in geocell grids in coastal and river engineering applications [33]. Further research has looked more specifically on their use in slope stabilisation and erosion control structures [34]. Potential applications and limitations on the use of the technique have been embedded in the more recent CIRIA C713 international levee handbook [35].
It is estimated that Bangladesh produces around 150,000 tons of waste tyres per year [36]. Of the 1.1-1.2 million tonnes of jute produced annually in Bangladesh, approximately 200k tonnes are used locally [37]. Other locally available materials such as waste fishing nets [25] can also be recycled as reinforcement in river embankments. This paper investigates through laboratory experiments the effectiveness of affordable reinforcement in earth-filled embankments to prevent failures from extreme flood events in developing countries due to climate change. This research aligns with the UN Sustainable Development Goals 9 (Industry, Innovation, and Infrastructure), 11 (Sustainable Cities and Communities), and 13 (Climate Action), contributing to resilient infrastructure, sustainable urban development and climate change mitigation [38].
This paper consists of 4 sections: the introduction summarises the impact of flooding and reviews literature on using low-cost reinforcement materials to improve flood defence and slope stability. The second part presents the laboratory work outlining the experimental flood simulations with and without reinforcement, and the methodology for testing embankment stability under varied flows. Section three demonstrates how reinforcement reduces embankment erosion at various flow rates and discusses its effectiveness. The final part presents the study's conclusions.
2. Research Methodology
This section presents the experimental flood simulations on the scaled embankment models, with and without reinforcement, and the methodology used to prepare and test the specimens and record the erosion and the final shape of each one of the models, under varying flow conditions.
2.1. Flume and Experimental Set-Up
The experiments were conducted in the Hawke Building in the School of Engineering at the University of Greenwich using an EN6SP Armfield sand flume. The horizontal sand bed flume is 190 cm long, with a cross-section width of 60 cm and a height of 15 cm. The flume provides a range of flow rates from 0.1 L/s to 9L/s. Figure 3 illustrates the apparatus used in the experiments, including a plan (Figure 3a), a section (Figure 3b) and a 3D view (Figure 3c) of the wooden model.
The apparatus consists of two main sections that form the channel and embankments. A fixed wooden plank represents the riverbed, with embankments on either side. A segment of 1 metre of the wooden embankments (one on each side, shown in red in Figure 3) was removable, to be replaced with soil material for the purpose of this experiment. The selected slope angle of 57° is representative of a typical case of “cohesive” natural soil that can exhibit a general failure mechanism, including rotational slumping and tensile cracks [39]. Steady state laminar flow into the channel was secured by a segment of 0.6m upstream, consisting of fixed wooden model slopes, and a similar segment of 0.3m downstream, was used to contain the earthen central segment (red in Figure 3) and prevent it from being completely washed away into the flume’s outflow tank.
2.2. Reinforcement Material
Clear PVC hose with synthetic material was used to represent the tyres in the model. The experiment was scaled to a 1:50 ratio using a Froude scaling, enabling accurate representation of the reinforcement and its potential behaviour under real-life conditions as shown in Figure 4. Furthermore, the flow rate was also proportionally scaled to replicate the peak flow conditions of a flash flood event.
The model tyres were arranged in rows secured together using 2mm jute strings as illustrated in Figure 5. The rows of tyres were then connected together to form a continuous “geocell” grid along the one-metre length of the embankment, to enhance the stability by securely holding the tyres in place. This decision was informed by the findings of preliminary reinforcement trials on the slope facade, with use of single or double skin loose tyre walls, which revealed the possibility for the latter to be displaced and washed away at high flow rates.
2.3. Measuring Equipment
A level gauge was used to measure the cross-sectional height of the embankment slope from the channel bed, which was set as the reference ground level. The flow rate was controlled using a flow control valve with the flow rate displayed on a digital RTB Rate Totaliser.
2.4. Sand
The soil material used to construct the embankment is typical laboratory-grade clean silica sand with rounded particles, having a uniform particle size distribution, ranging from 0.3 to 0.6 mm, and an average diameter of 0.45 mm.
2.5. Test Program
The test program was designed to investigate failure mechanisms and evaluate the effectiveness of cost-effective reinforcement in earth-filled embankments.
Research from Alam et al. [41] illustrates hydrographs depicting the favourable morphometric conditions in Southeastern Bangladesh, which were used to determine the extreme scenarios a channel might be exposed to. The embankments were tested under steady peak flow scenarios. The flow rate was scaled to provide a realistic representation of the prototype flow rates tested. The scaling also accounted for the maximum discharge limitations of the apparatus. The scaled flow rates ranging from 1 L/s to 9 L/s are presented in Table 1.
To evaluate the significance of using reinforcement in the earth-filled embankment, two sets of tests were conducted where the embankments were tested under steady conditions with and without reinforcement as illustrated in Table 2.
2.6. Experimental Procedure
The first step in the experimental procedure involved the preparation of the physical model. The wooden model form was placed into the sand flume apparatus, and weights were added to the horizontal top layers of the model to prevent it from floating, ensuring stability during the experiment. For the construction of the non-reinforced embankments (Tests 1-4), the sand was compacted in layers of 2cm thickness until it reached the horizontal top surface of the embankment ensuring uniform compaction throughout (Figure 5). A wooden shaper was then used to finalise the shape of the embankment (Figure 6). The sand material was wet and partially saturated during the compaction, in order to exhibit a “pseudo-cohesive” behaviour, due to negative pore water pressures and pre-consolidation [42]. In that way, a sand material can be used in the context of this experiment to simulate a natural slope with apparent cohesion.
The construction process was repeated for each side of the embankment, taking approximately 40 minutes per side. For the reinforced embankments (Tests 5-8), the first layer of reinforcement was inserted as shown in Figure 7a. Sand was then compacted on top to ensure filling of gaps within the reinforcement. Additional layers of reinforcement were added on top of the compacted sand (Figure 7b) until the horizontal top surface of the embankment was reached (Figure 7c). The construction process for the reinforced embankments took approximately one hour per side.
Following the construction phase, the flow rate was set according to the experimental requirements, and the experiments were initiated. All tests were conducted for a duration of 3 minutes, during which any failure of the embankment was closely monitored. Measurements of the embankment height were taken using a level gauge along the cross-sectional width of the flume at specified points: 30 cm, 50 cm, and 70 cm along the one-metre length of the earthen embankment. The monitoring of the collapse and the analysis focuses solely on this central section of this section, so that it can be considered free from boundary effects, arising from the turbulence of the flow in the transition zone between the hard wooden slope and the soil.
3. Results and Discussion
As part of this research two sets of tests were conducted as shown in Table 2. For the scope of this paper, tests 1, 2, 5 and 6 will be presented analytically in Section 3.1 and the remaining tests will be summarised in Section 3.2. Full analytical graphs of all tests are available in Appendix A.
3.1. Experimental Results
3.1.1. Non-Reinforced (Test 1-2)
Tests 1 and 2, conducted on non-reinforced embankments at flow rates of 9 L/s and 7 L/s respectively, are detailed in Table 2. Figure 8 and Figure 9 show photos of the collapsed embankments taken after the three-minute test period.
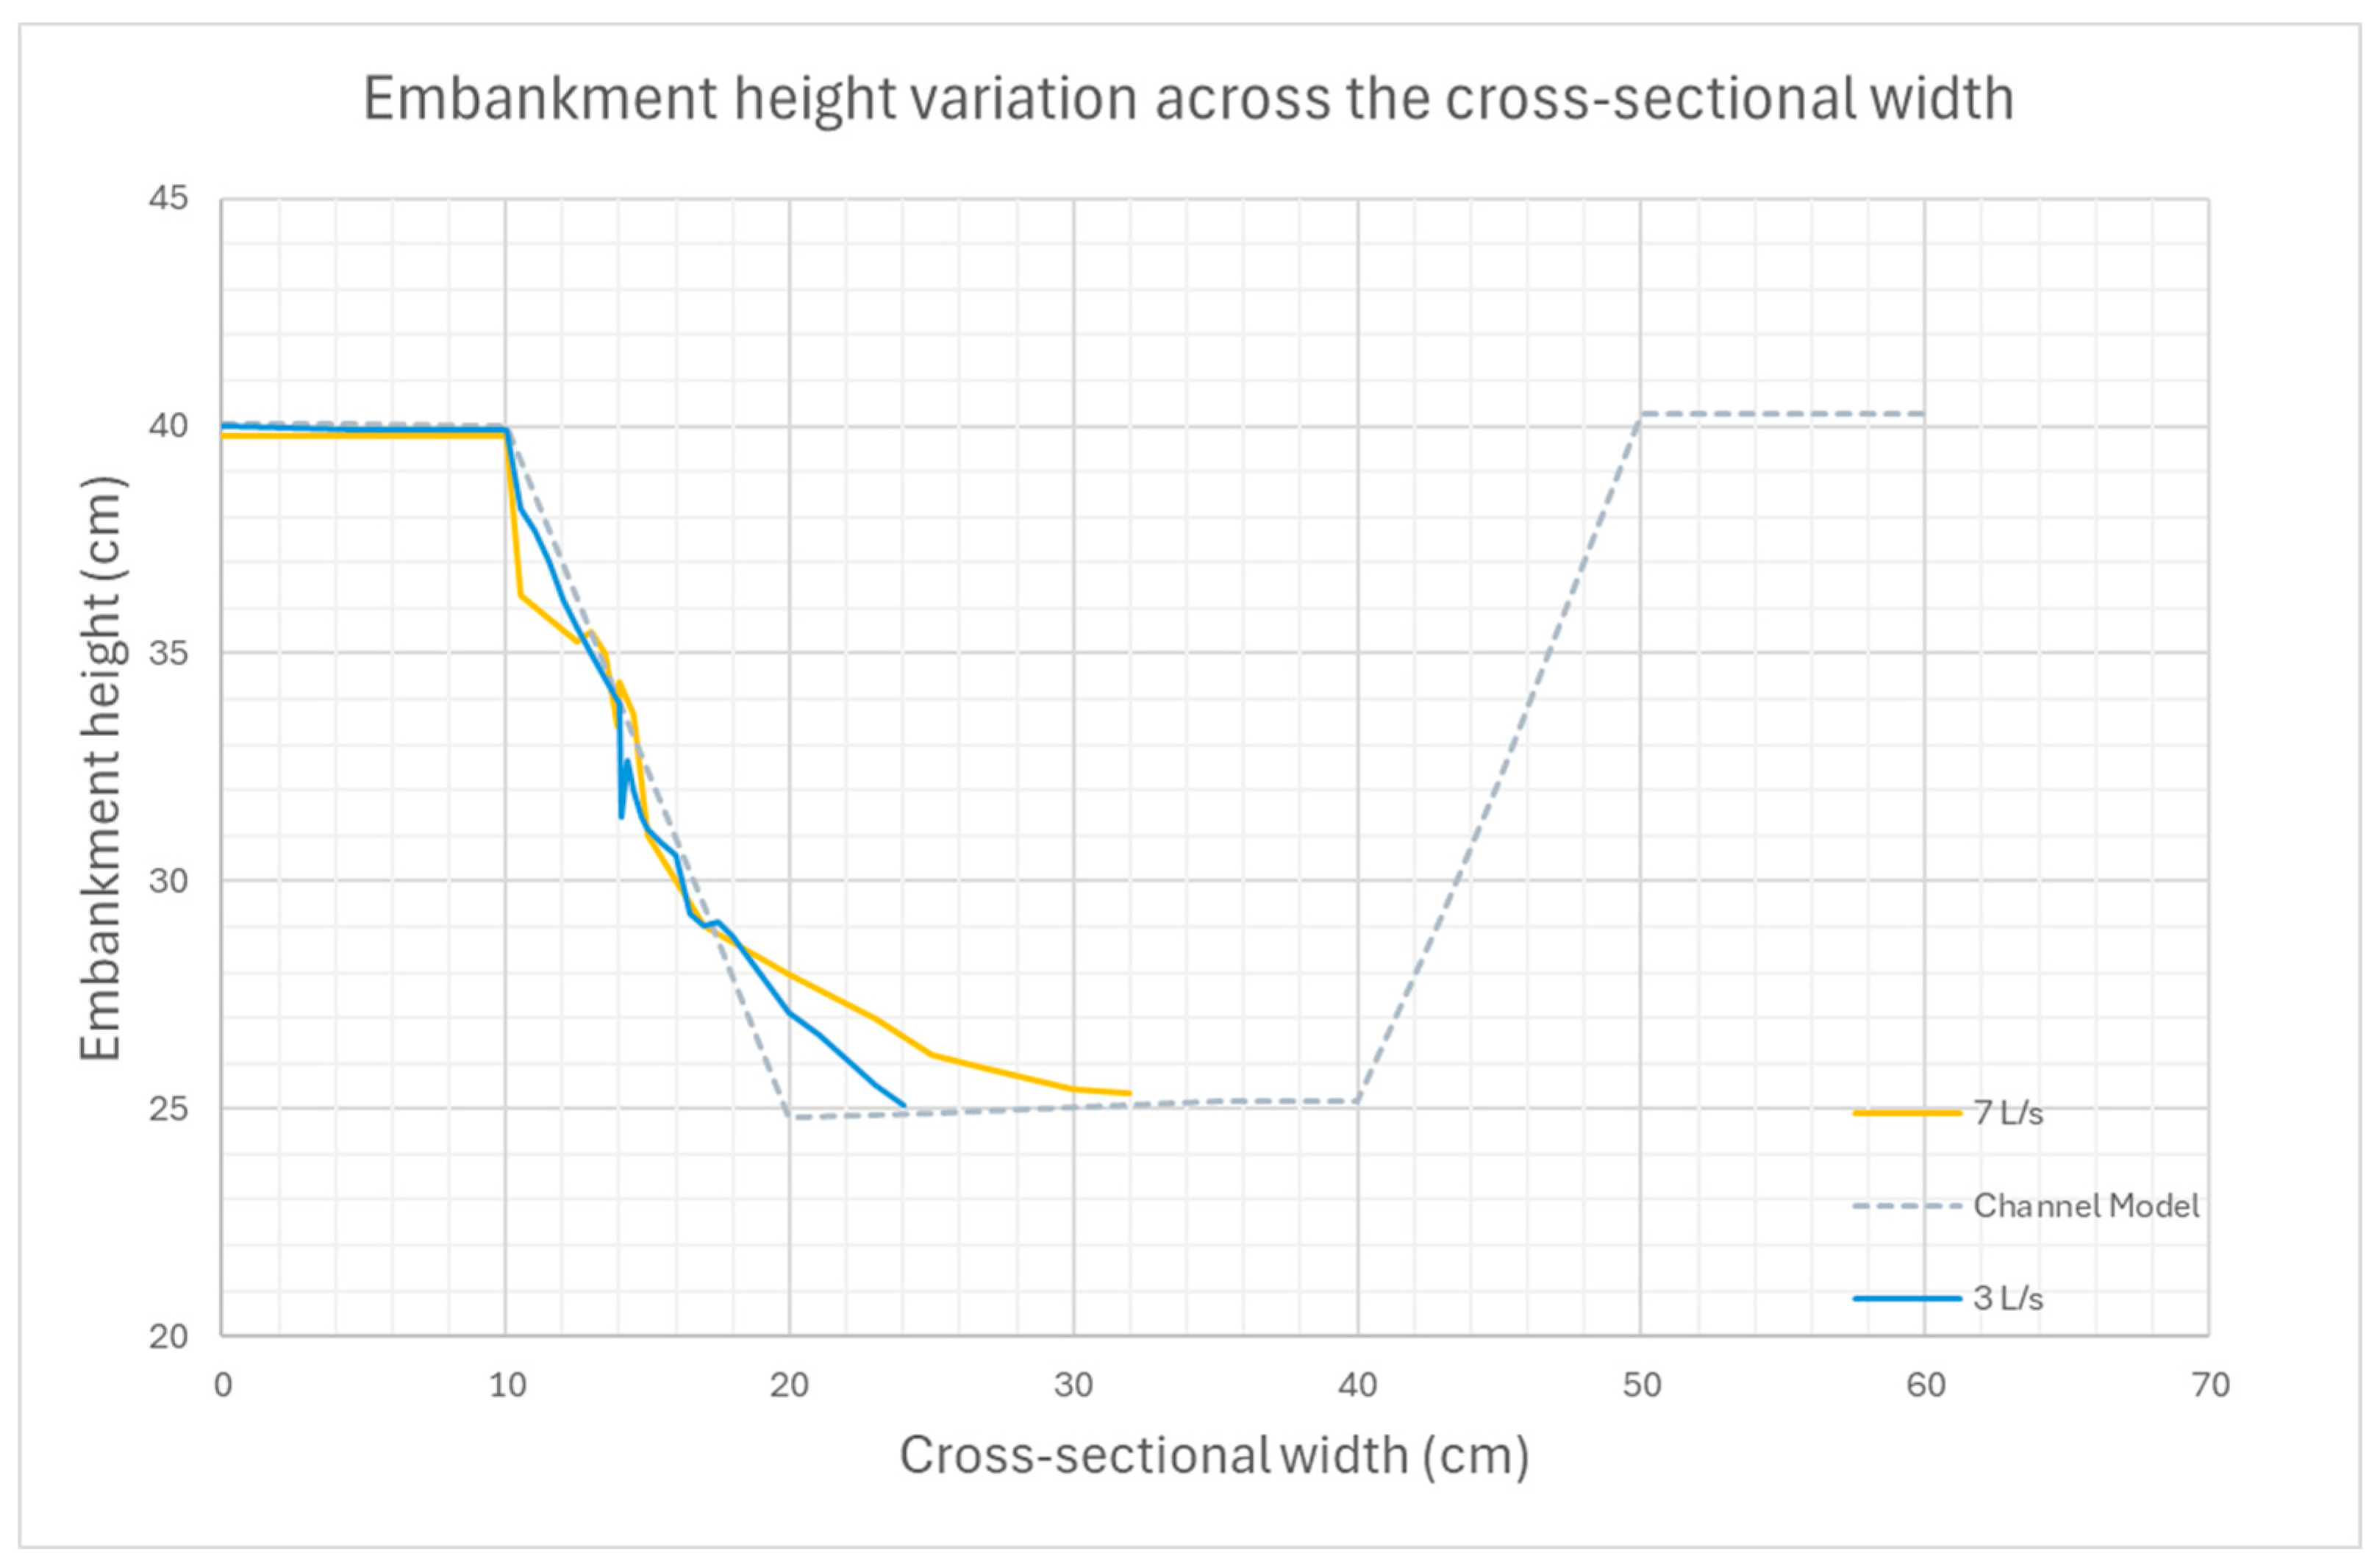
In both cases the soil material in the embankment began to slide immediately after the initiation of the flow, in the submerged part under the water surface, due to the saturation. The behaviour is consistent between flow rates of 9 L/s and 7 L/s, where within the first 30 seconds, the submerged part of the slope (approximately 60% of the embankment's height) exhibited sliding and flow of sand particles along a less steep slope, equal to the “angle of repose” of the sand [20]. This triggered instability in the material above and within the subsequent 5 seconds, approximately 30% of the horizontal top surface of the embankment developed tensile cracks and toppled forward. The collapse of the embankments persisted throughout the duration of the test. Most of the eroded sediment had been deposited in the model's river bed, resulting in a rise of 1.5 cm for 9 L/s and 2.55 cm for 7 L/s at the centreline of the bed. The height of the deposited material for a flow rate of 7 L/s surpasses that of 9L/s. This difference is attributed to testing both sides of the embankment for the 7 L/s scenario (yellow line in Figure 10), whereas only one side was tested for 9 L/s scenario (blue line in Figure 10). The decision to model only one side was made to prevent interference from sediments originating on the opposite side and to reduce the duration of each testing cycle.
Figure 10 displays the average cross-sectional embankment height obtained for flow rates of 7 L/s and 9 L/s. The graph's left side illustrates that the embankment slope for 9 L/s is slightly less steep than that of 7 L/s and that the embankment experienced greater erosion under 9 L/s than 7 L/s. The analysis of the volumes of sediment transferred from the embankment to the riverbed, showed that within three minutes, of sediment from the embankment eroded at a flow rate of 9 L/s, compared to at a flow rate of 7 L/s. Furthermore, this demonstrates that 17.3% of the embankment's total volume was eroded at a flow rate of 9 L/s, while 7 L/s resulted in 16.4% erosion of the embankment's total volume. A set of example calculations for the dissipated volume under a flow rate of 9 L/s are outlined in detail in Appendix B.
3.1.2. Reinforced (Tests 5-6)
Figure 11 and Figure 12 show the performance of the reinforced embankment after a three-minute test under flow rates of 9 L/s and 7 L/s respectively.
The experiment revealed notable differences in the impact of flow rates on the reinforced embankment. With a flow rate of 9 L/s, the embankment exhibited greater susceptibility to erosion compared to 7 L/s.
In the case of 9 L/s, significant erosion occurred within the initial minute of testing. In contrast, the majority of the erosion for 7 L/s occurred within the first two minutes. Erosion initially affected the base surface of the slope, followed by the erosion of sand within and around the tyres, leading to tensile cracks on the slope surface and collapse of sediments in layers. This layered collapse phenomenon may be attributed to the horizontal layering of reinforcements. Despite the erosion, smaller sections of the embankment's surface experienced sediment falls and deposition near the base of slope until the end of testing.
Figure 11 illustrates that by the test's completion, minor tensile cracks were visible on the upper surface of the embankment for 9 L/s, as only the sand on the slope surface was transferred during the test, but the under digging did not progress further inwards. Similarly, Figure 12 shows tensile cracks and soil particle flow throughout the length of the embankment’s slope only on the slope surface, but the top flat surface of the embankment was not affected. This suggests that reinforcement enhanced the slope stability, by effectively slowing down the erosion process and retaining soil particles and interrupting their downslope motion and prevent severe under-digging.
From Figure 11, it can be observed that the erosion of the sand on the slope face has exposed the tyre geocells, which have also shifted from their original position. However, for 7 L/s, the effect was reduced as seen in Figure 12. Overall it can be noted that the reinforcements are efficient in holding sediments eroded from above and prevent complete collapse of the slope, and also that the reinforcement grids remain overall in place despite the damage patterns on the surface, as the buried part under the intact area of the slope provides sufficient anchorage. Figure 13a shows that there is the degree of erosion on the slope surface and the material deposition in the river bed is increased for the higher flow rate of 9 L/s compared to the 7L/s in Figure 13b, but in both cases the damage is limited on the slope surface and has not moved much deeper in the embankment.
The most important finding is that the layered reinforcement structure for both flow rates remained intact, owing to the interconnection of tyres using strands of jute. This mechanism effectively prevented the displacement of tyres by the water flow, but also kept the upper surface of the embankment intact for both cases, preventing any toppling failure, thus emphasising the enhanced structural integrity due to the reinforcement. Minor tensile cracking was observed for 9 L/s, as indicated in Figure 11 (red box), however, overall integrity was unaffected during the test time.
Figure 14 displays the plotted cross-sectional results obtained from the embankment's length for a flow rate of 7 L/s and 9 L/s. The plot clearly demonstrates that for 9 L/s, a higher amount of sediment was deposited at the bed of the channel compared to the 7 L/s, hence, illustrating higher erosion. The volume of eroded sediments was derived from the plots to allow quantitative comparison. The analysis shows that for a flow of 9L/s, of sediments were deposited on the bank after the end of the test time, whereas for 7 L/s, were deposited. Furthermore, this also reveals that 12.4% of the sand volume was removed from the embankment’s total volume (volume of reinforcement and sand) for 9 L/s. Whereas, for 7 L/s, 8.0% was removed. Therefore, confirming even with reinforcements present, higher flow leads to higher erosion.
3.2. Discussion and Failure Mechanisms
Figure 15 illustrates the cross-sectional variation for 9 L/s, 7 L/s and 3 L/s of the collapsed embankment under both non-reinforced and reinforced scenarios. Analysing the graph further, it indicates that the incorporation of reinforcements contributed to a clear reduction in embankment erosion under all cases.
A consistent trend was observed across tests 1-8 and a direct correlation between increasing flow rates and water depth, and vice versa. One of the reasons for this is that the sediments that are washed away under the different flow rates, are deposited on the channel bed, which causes the channel bed to rise, hence, the water level increases. This condition in real life scenario means the water level during flood events may increase over time leading to damages in the surrounding areas, which is consistent with findings from field observations [21]. It was also confirmed that the transport and deposition of the sand led to the formation of bedforms along the channel bed [22].
The observed failure characteristics on the unreinforced slopes are consistent with the mechanism described from the findings of past research on “cohesive” soils slopes [18,19,20]. In both the case of the model sand used in this experiment and the case of a natural slope with “cohesive” material with significant clay and silt cluster, the same three mechanisms are mobilised:
First, the saturation from the elevated water surface in the sand, immediately balanced out the negative pore water pressures in the previously partially saturated sand and cancelled out the “pseudo-cohesion”. This is exactly what is happening also in the case of silty or clayey natural slopes, with the only difference being the time required for full saturation to develop, due to the reduced permeability.
Second, the soil particles free from their temporary bonding, were free to slide downslope pushed by fluvial erosion and re-arrange themselves underwater, along a shallower slope line, equal to the sand’s repose angle (or alternatively the “infinite slope” stability concept), which is around 35 degrees, in the case of the particular sand, as shown from the measured profiles. This under digging action is creating a cavity (scouring effect) underneath the still standing, partially saturated, and still “cohesive” slope [19,20].
Third, gravity pulls the overhanging slopes downslope, by opening up tensile cracks and by forming blocks that can slide or topple. The final shape of the collapsed slope profile can be roughly described by only two lines: the repose slope angle, ending up to the tensile crack face, which still stands vertical as this part of the slope was kept above the water level and remained partially saturated, thus the soil material never lost its apparent cohesion.
While the above behaviour has been observed in past research, the special focus in this analysis is of course on the performance of the reinforcement. It needs to be noted that the addition of the waste car tyre geocell reinforcement cannot prevent the first stage of the mechanism mentioned above i.e. saturation and loss of the apparent cohesion. Still, soil particles become loose and tend to slide along the slope. In this case, the presence of the geocells interrupted their sliding route, and despite the fact that particles were still washed away from the fluvial erosion effect and managed to escape into the stream, the geocells provided better retention of soil particles. Furthermore, toppling from blocks of the soil from above, led to the formation of debris cones on top of the geocell reinforcements, as shown in Figure 13.
In order to quantify the effect of the reinforcement on the reduction of material loss, the measured volumes of sediments deposited into the river are plotted in Figure 16 against the flow discharge. The data points reveal first that the volume dissipated increases proportionally with discharge, which is naturally expected. Looking at the specific flow rates, reinforcing the embankment significantly decreased erosion by 34.5% at 3L/s, 51.2% at 7L/s, and 28.3% at 9L/s. It must be noted that the calculated volume loss for the 7L/s run on the unreinforced slope, might be overestimated, due to modelling of both banks of the river, as explained earlier. Nevertheless, the important finding is that the trendline for the non-reinforced scenario is around 50% steeper than the trendline of the reinforced one. Even if the case of the 7L/s is disregarded, the reduction will still be within 30% and 50%. Moreover, it must be noted that this calculation is still not the complete picture; the cycle of scouring, collapse erosion in the case of an unprotected slope, can be triggered again as sediment transfer can remove material and scour the base again, resulting in retreating riverbanks. In the case of reinforced slopes, the prevention of a complete collapse, allows us to assume that further erosion and retreating riverbanks phenomena can be avoided, provided that adequate maintenance will follow after every severe flooding and damage event.
The above experimental findings underscore the efficiency of applying this low-cost, waste car tyre geocell reinforcement in reducing erosion. This experimental work provides supporting evidence at a proof-of-concept stage, since the experiments were conducted only once, allowing for potential human errors and variations in sand properties and behaviour (e.g. compaction, saturation etc). A more robust analysis should be based on a larger scale experimental programme, where repeatability of the results can be proven, and the measured behaviour and the effect of variations can be determined based on a statistically significant dataset. Similarly, the application of the reinforcement proposal itself can be refined further, trying to optimise the layout of the geocells or investigate its use, in combination with other materials or techniques.
Last, it must be noted that this project, aligned with other previous research efforts, has looked at the behaviour and performance of the waste car tyres as a structural material, from the mechanical behaviour point of view. Equally important to consider are the environmental concerns around the discard or storage of waste car tyres in the environment and the contamination of land and water resources with microplastics [35,43,44]. It is estimated that a quarter of the total amount of microplastics released into the environment is coming from car tyres, even though this is mainly the result of the wear on the roads [45], i.e. before it becomes a waste material. Further degradation happening when discarded tyres are left exposed to direct sunlight and environmental factors [44], might be significantly reduced if the reinforcement is kept carefully buried and protected in the ground, i.e. shielded from sunlight exposure. Nevertheless, further environmental impact assessment studies with respect to microplastic pollution are necessary to fully understand their implications.
4. Conclusions
Climate change has increased intense rainfall and flooding, significantly impacting river embankments and causing slope failure and erosion, particularly in developing countries. Waste tyres tied together in a geocell grid using jute, were chosen as reinforcement material for the embankment, as it can be everywhere a locally available waste material.
Laboratory experiments conducted on a generic flume model under steady state flow conditions, confirmed the known from the literature failure patterns of scouring, sliding and toppling, for the unreinforced “cohesive” soil slopes. The study found direct correlations between rising flow rates, water depth, and sediment deposition, potentially exacerbating flood damage. Also, increasing flow rates directly correlated with higher sediment loss, as quantified by sediment volume measurements.
Reinforcing the embankment with the waste car tyre geocells, significantly decreased erosion by 30% to 50%, therefore, highlighting its effectiveness in reducing failure risks. The resulting damage on the reinforced embankments under the various flow rates reveals that despite the material loss, the slope can retain its shape, preventing complete collapse and remain in a repairable state. With proper maintenance after the flooding damage, the reinforced embankment can subsequently prevent successive failure patterns and retreat of the riverbanks. This is another benefit of building with locally available materials and simple equipment, since implementing this efficient technique for earth-filled embankment construction offers an opportunity to educate local communities on repair methods, ensuring sustained flood protection and building up their resilience.
Looking ahead, the promising results of this study, pave the way for more sustainable and effective flood protection solutions, fostering resilience in future infrastructure development. However, moving further from proof of concept to real life applications, the efficiency and optimisation of the proposed technique must be further investigated, combined with environmental impact assessments regarding the potential environmental pollution hazards from the use of the particular waste material.
Author Contributions
Conceptualization, P.K.; methodology, I.S.; validation, N.C., I.S. and P.K.; formal analysis, N.C.; investigation, N.C.; resources, I.S.; data curation, I.S. and P.K..; writing—original draft preparation, N.C.; writing—review and editing, I.S. and P.K.; visualisation, N.C.; supervision, I.S.; project administration, I.S. and P.K; All authors have read and agreed to the published version of the manuscript.
Funding
This research received no external funding.
Data Availability Statement
This paper is based on the experimental student project and dissertation of the first author, N.C. [46]. All the important data are provided within the paper, but further information and clarifications can be provided on request from the academic supervisors of the work at the University of Greenwich, IS and PK. .
Acknowledgments
The authors would like to thank the students Areeb Ahmad and Quentin Boudier who contributed to the development of the earlier stages of this experimental work, the students: Sabbir Hassan Ahmed, Muhammad Hamzah Fiaz, Yashyog Manjarekar, and Afaaq Ahmed for assisting with the experimental work and the lab technicians Colin Gordon and Ben King who built the experimental model and helped operate and maintain the flume.
Conflicts of Interest
The authors declare no conflicts of interest.
Appendix A. Full Analytical Results
Appendix A.1. Unreinforced (Test 3-4)
Figure A1 and Figure A2 show the collapsed sand embankment for a flow rate of 5L/s and 3L/s respectively after a period of 3 minutes (Tests 3-4).
Figure A1.
Photos of the collapsed unreinforced embankment at 5L/s.
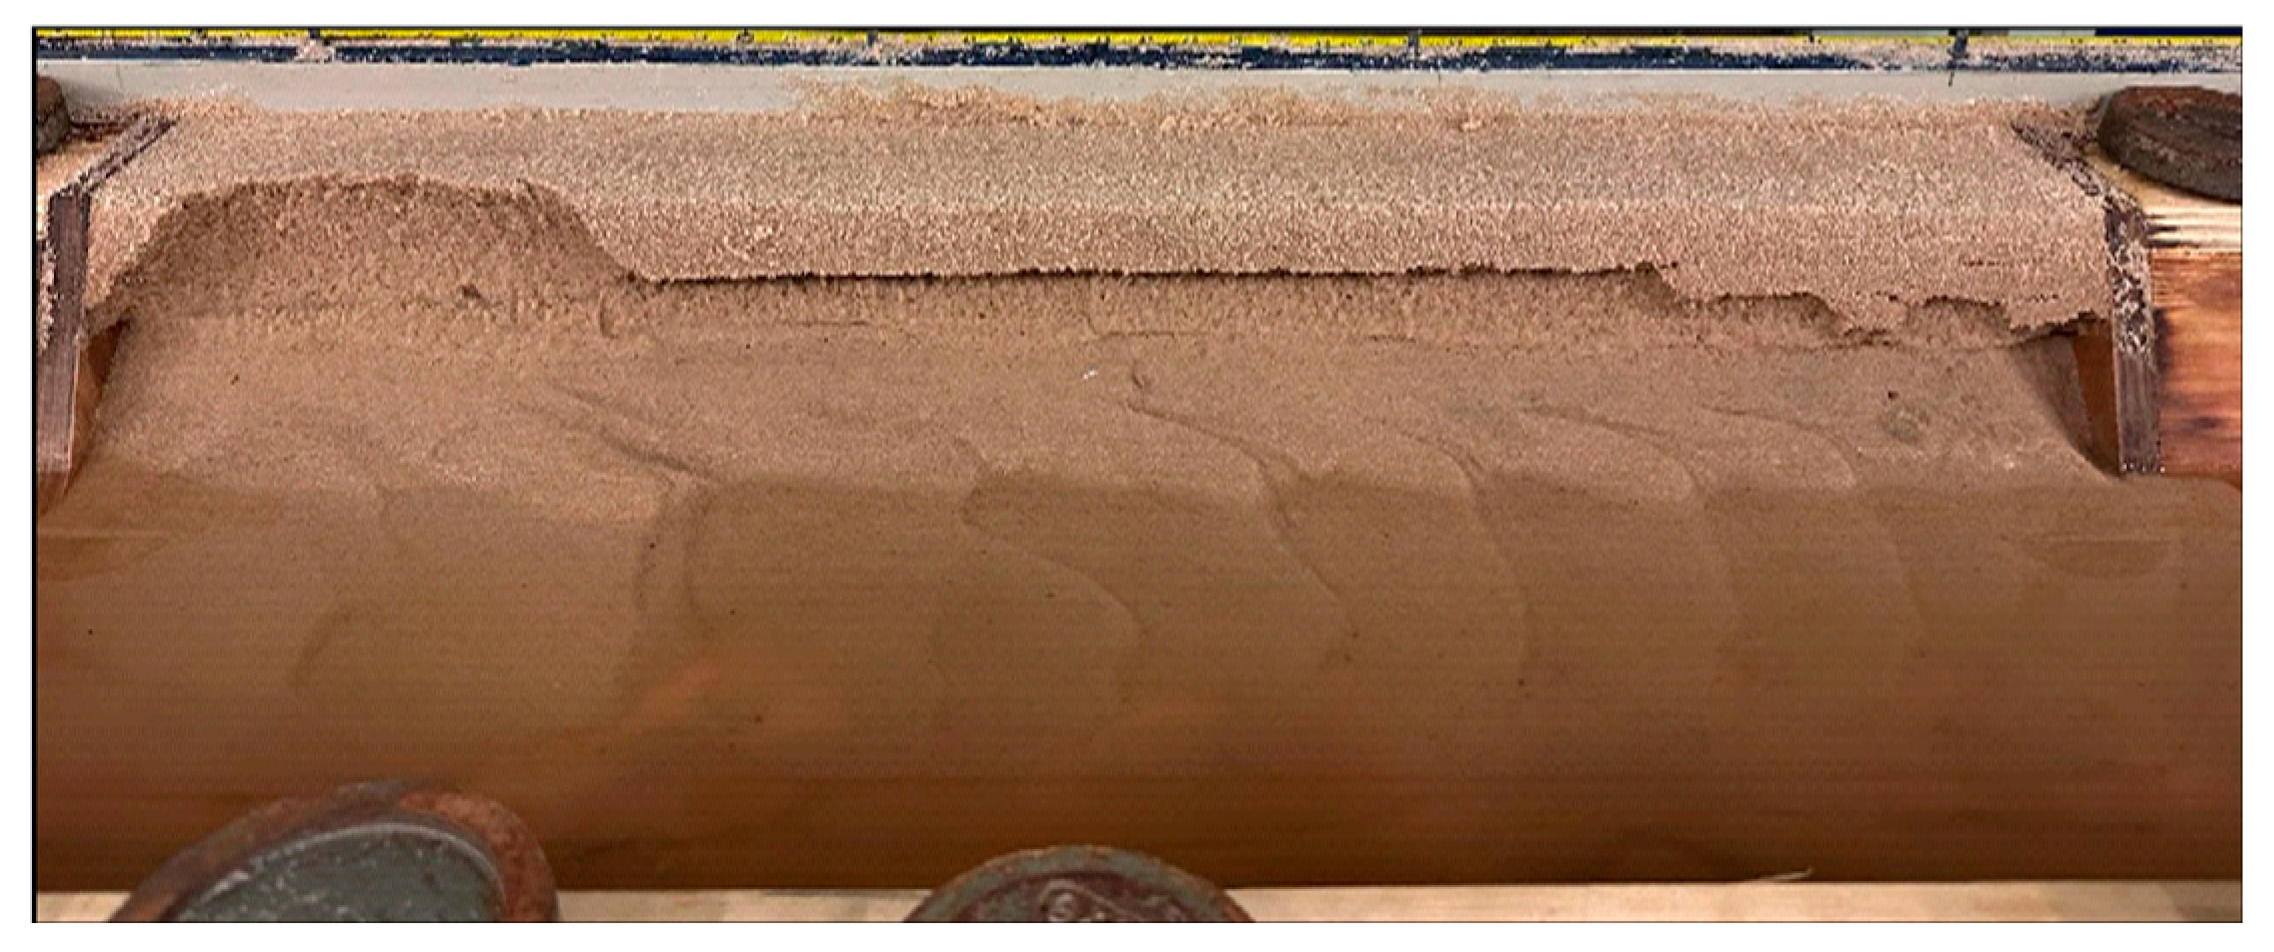
Figure A2.
Photos of the collapsed embankment at 3L/s.
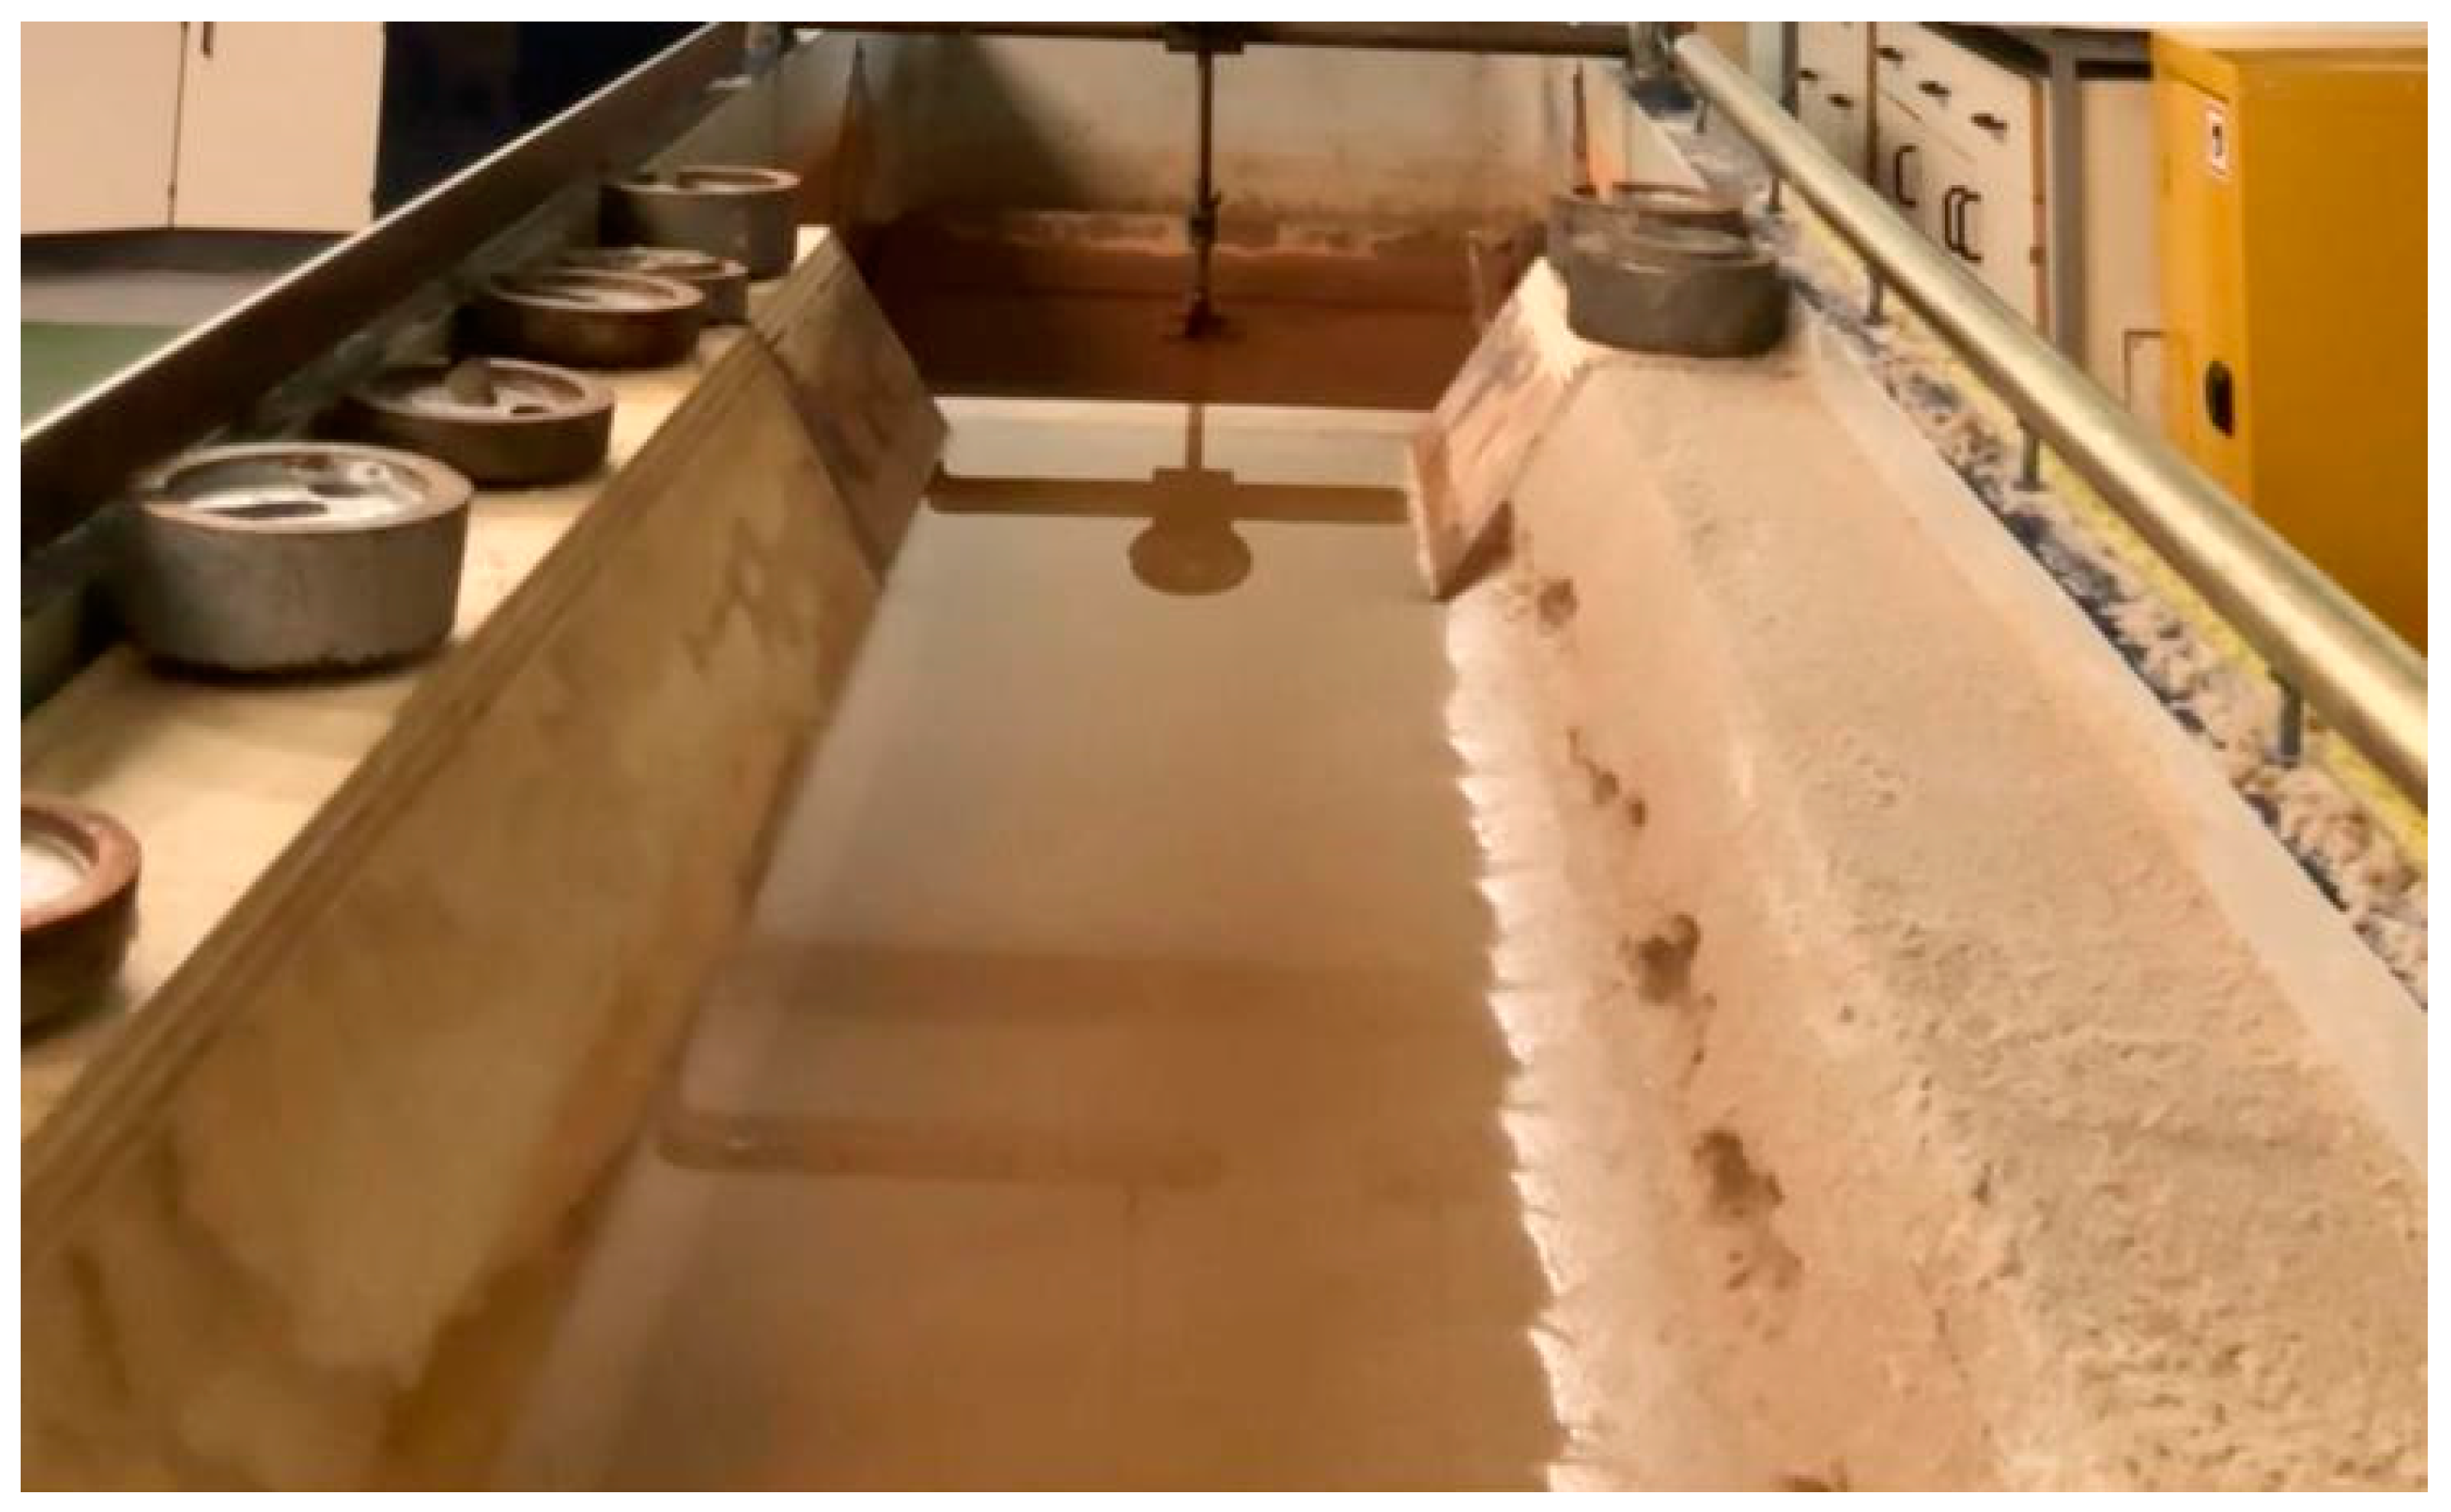
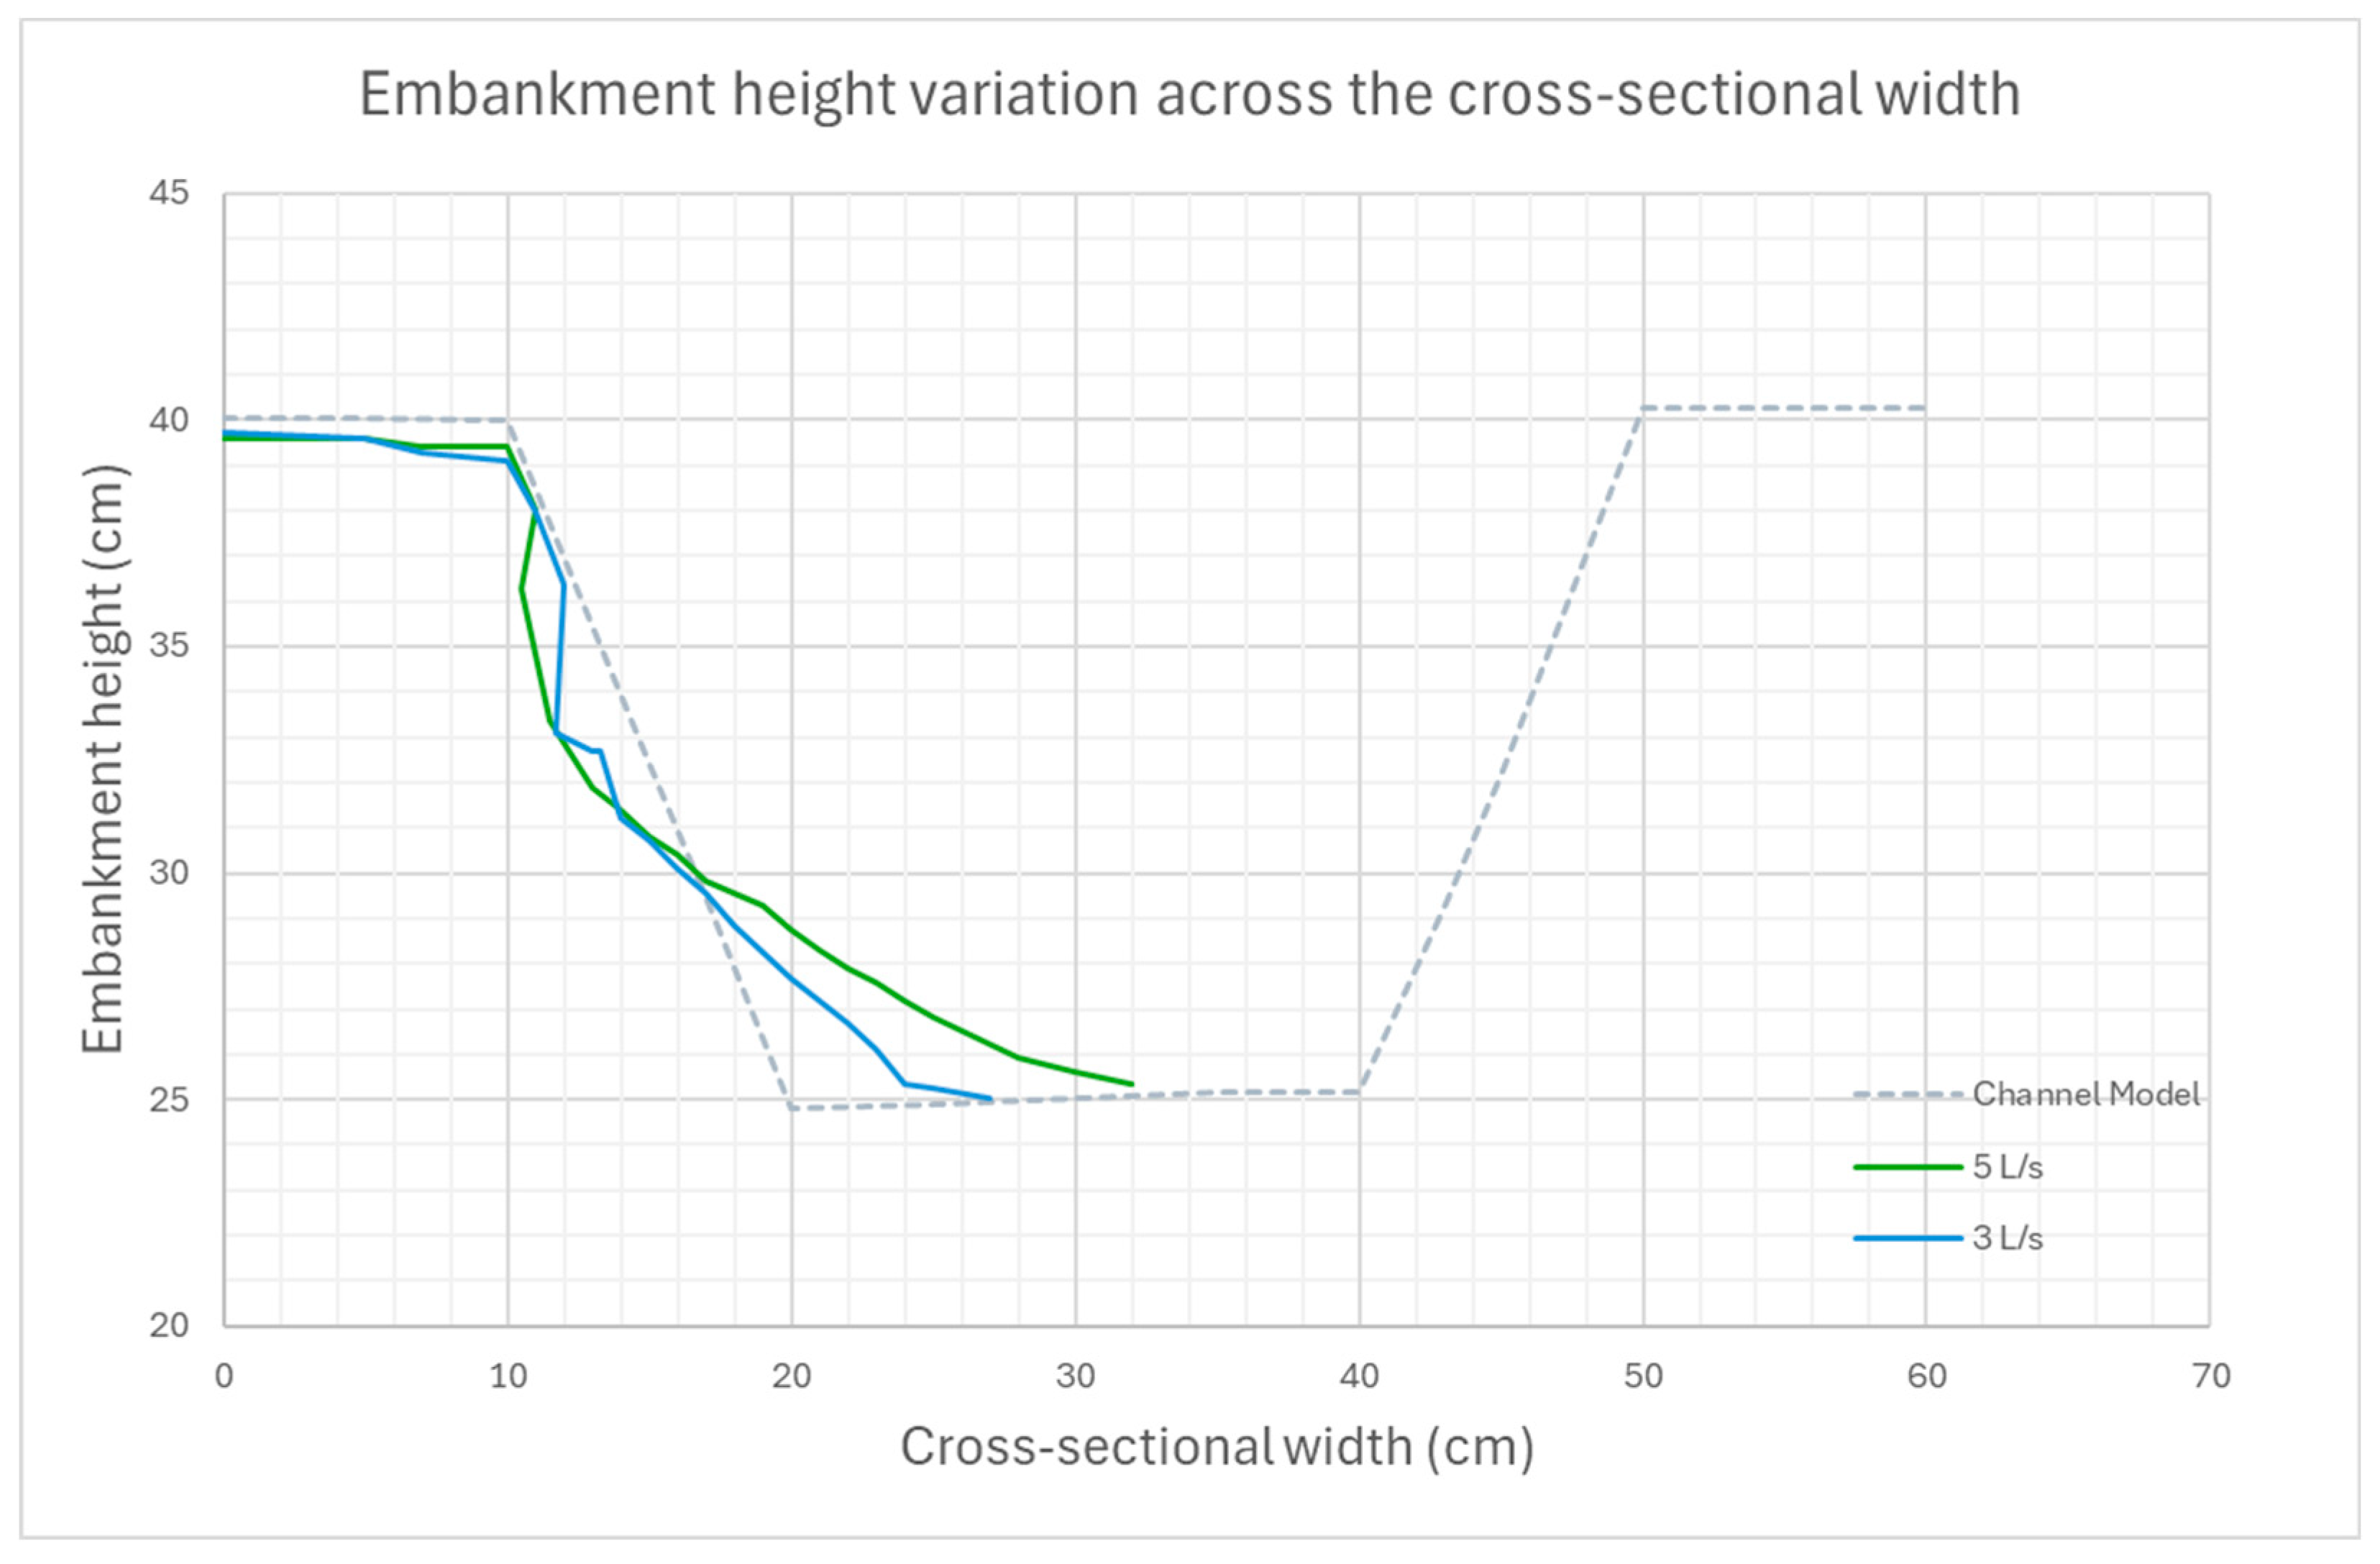
Figure A3 Illustrates the cross-sectional variation under the flow rates of 5L/s and 3L/s. At 5 L/s, the dissipated volume was 2614.1 , whereas at 3 L/s, it was 1241.3 . This further demonstrates that 11.6% of the embankment's total volume was eroded at a flow rate of 5 L/s, while 3 L/s resulted in 5.5% erosion of the embankment's total volume.
Figure A3.
Cross-sectional variation of the collapsed embankment at 5 L/s and 3 L/s.
Appendix A.2. Reinforced (Test 8)
For this section, tests were carried out only with 3 L/s and not for 5 L/s. The experimental apparatus experienced technical issues and for health and safety reasons, the flume was made unavailable.
Figure A4 shows pictures of the collapsed embankment with reinforcement for a flow rate of 3 L/s (Test 8).
Figure A4.
Photos of the reinforced collapsed reinforced embankment at 3L/s.
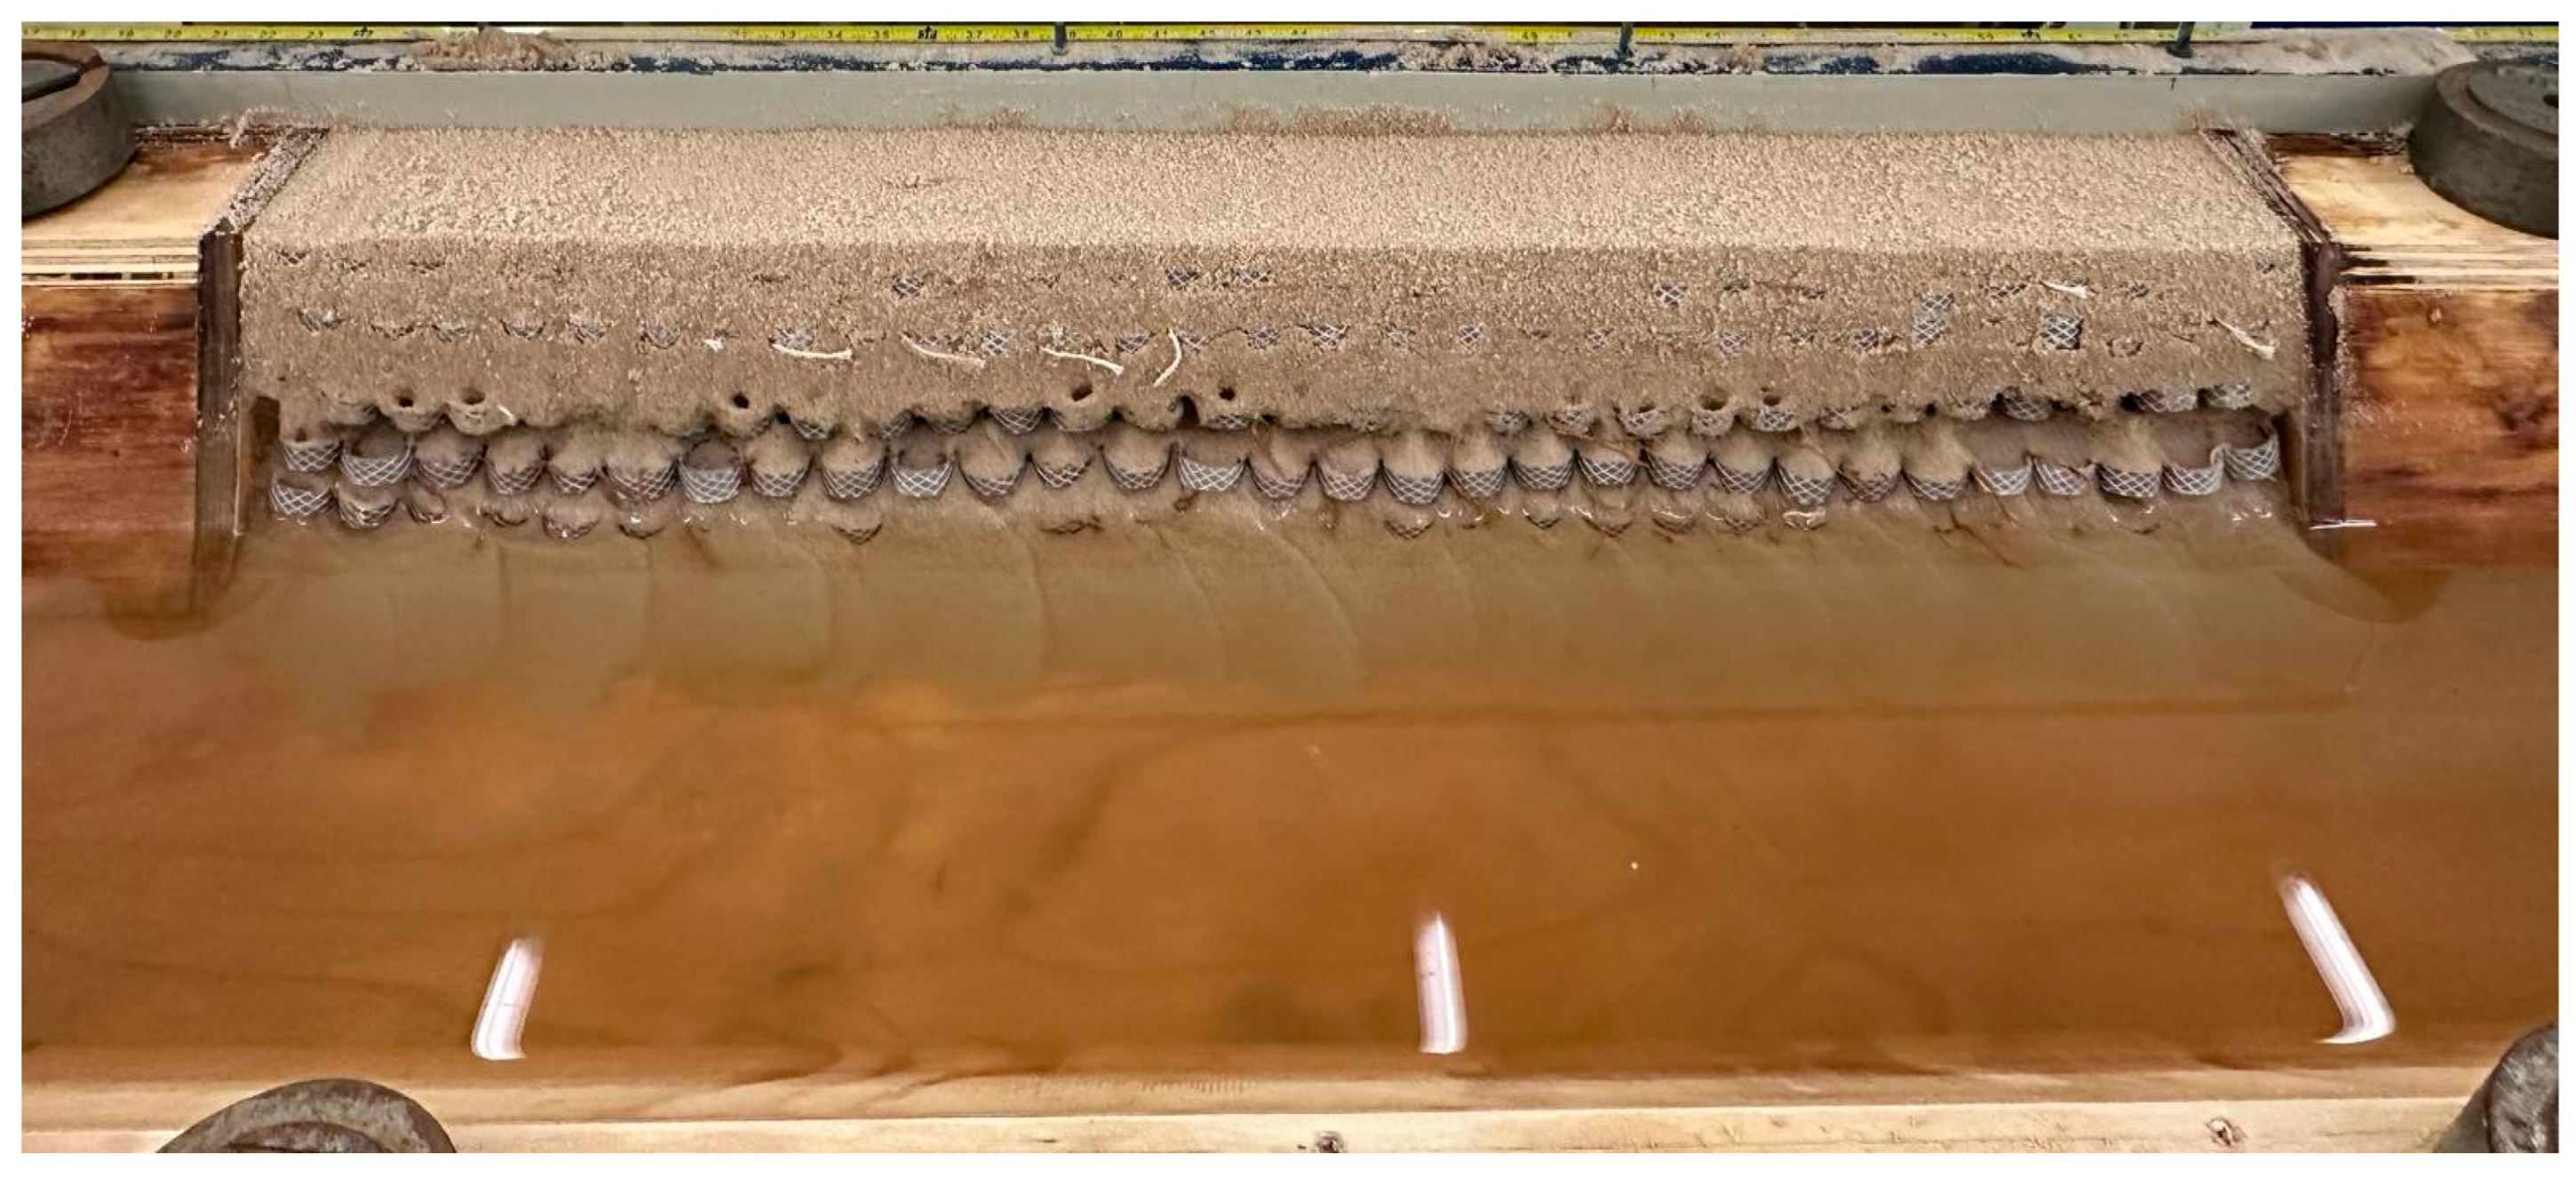
Figure A5 shows the plot for 3 L/s and a comparison with 7L/s. From volume analysis obtained from the graph, quantifies that 3 L/s has 817.8 of sand that has been displaced from the original embankment shape. Therefore, the percentage of sand volume displaced is 3.6% of the total volume of the embankment (volume of sand and volume of reinforcement).
Figure A5.
Cross-sectional variation of the collapsed reinforced embankment at 3 L/s and 7 L/s.
Appendix B. Volume Calculation Scheme
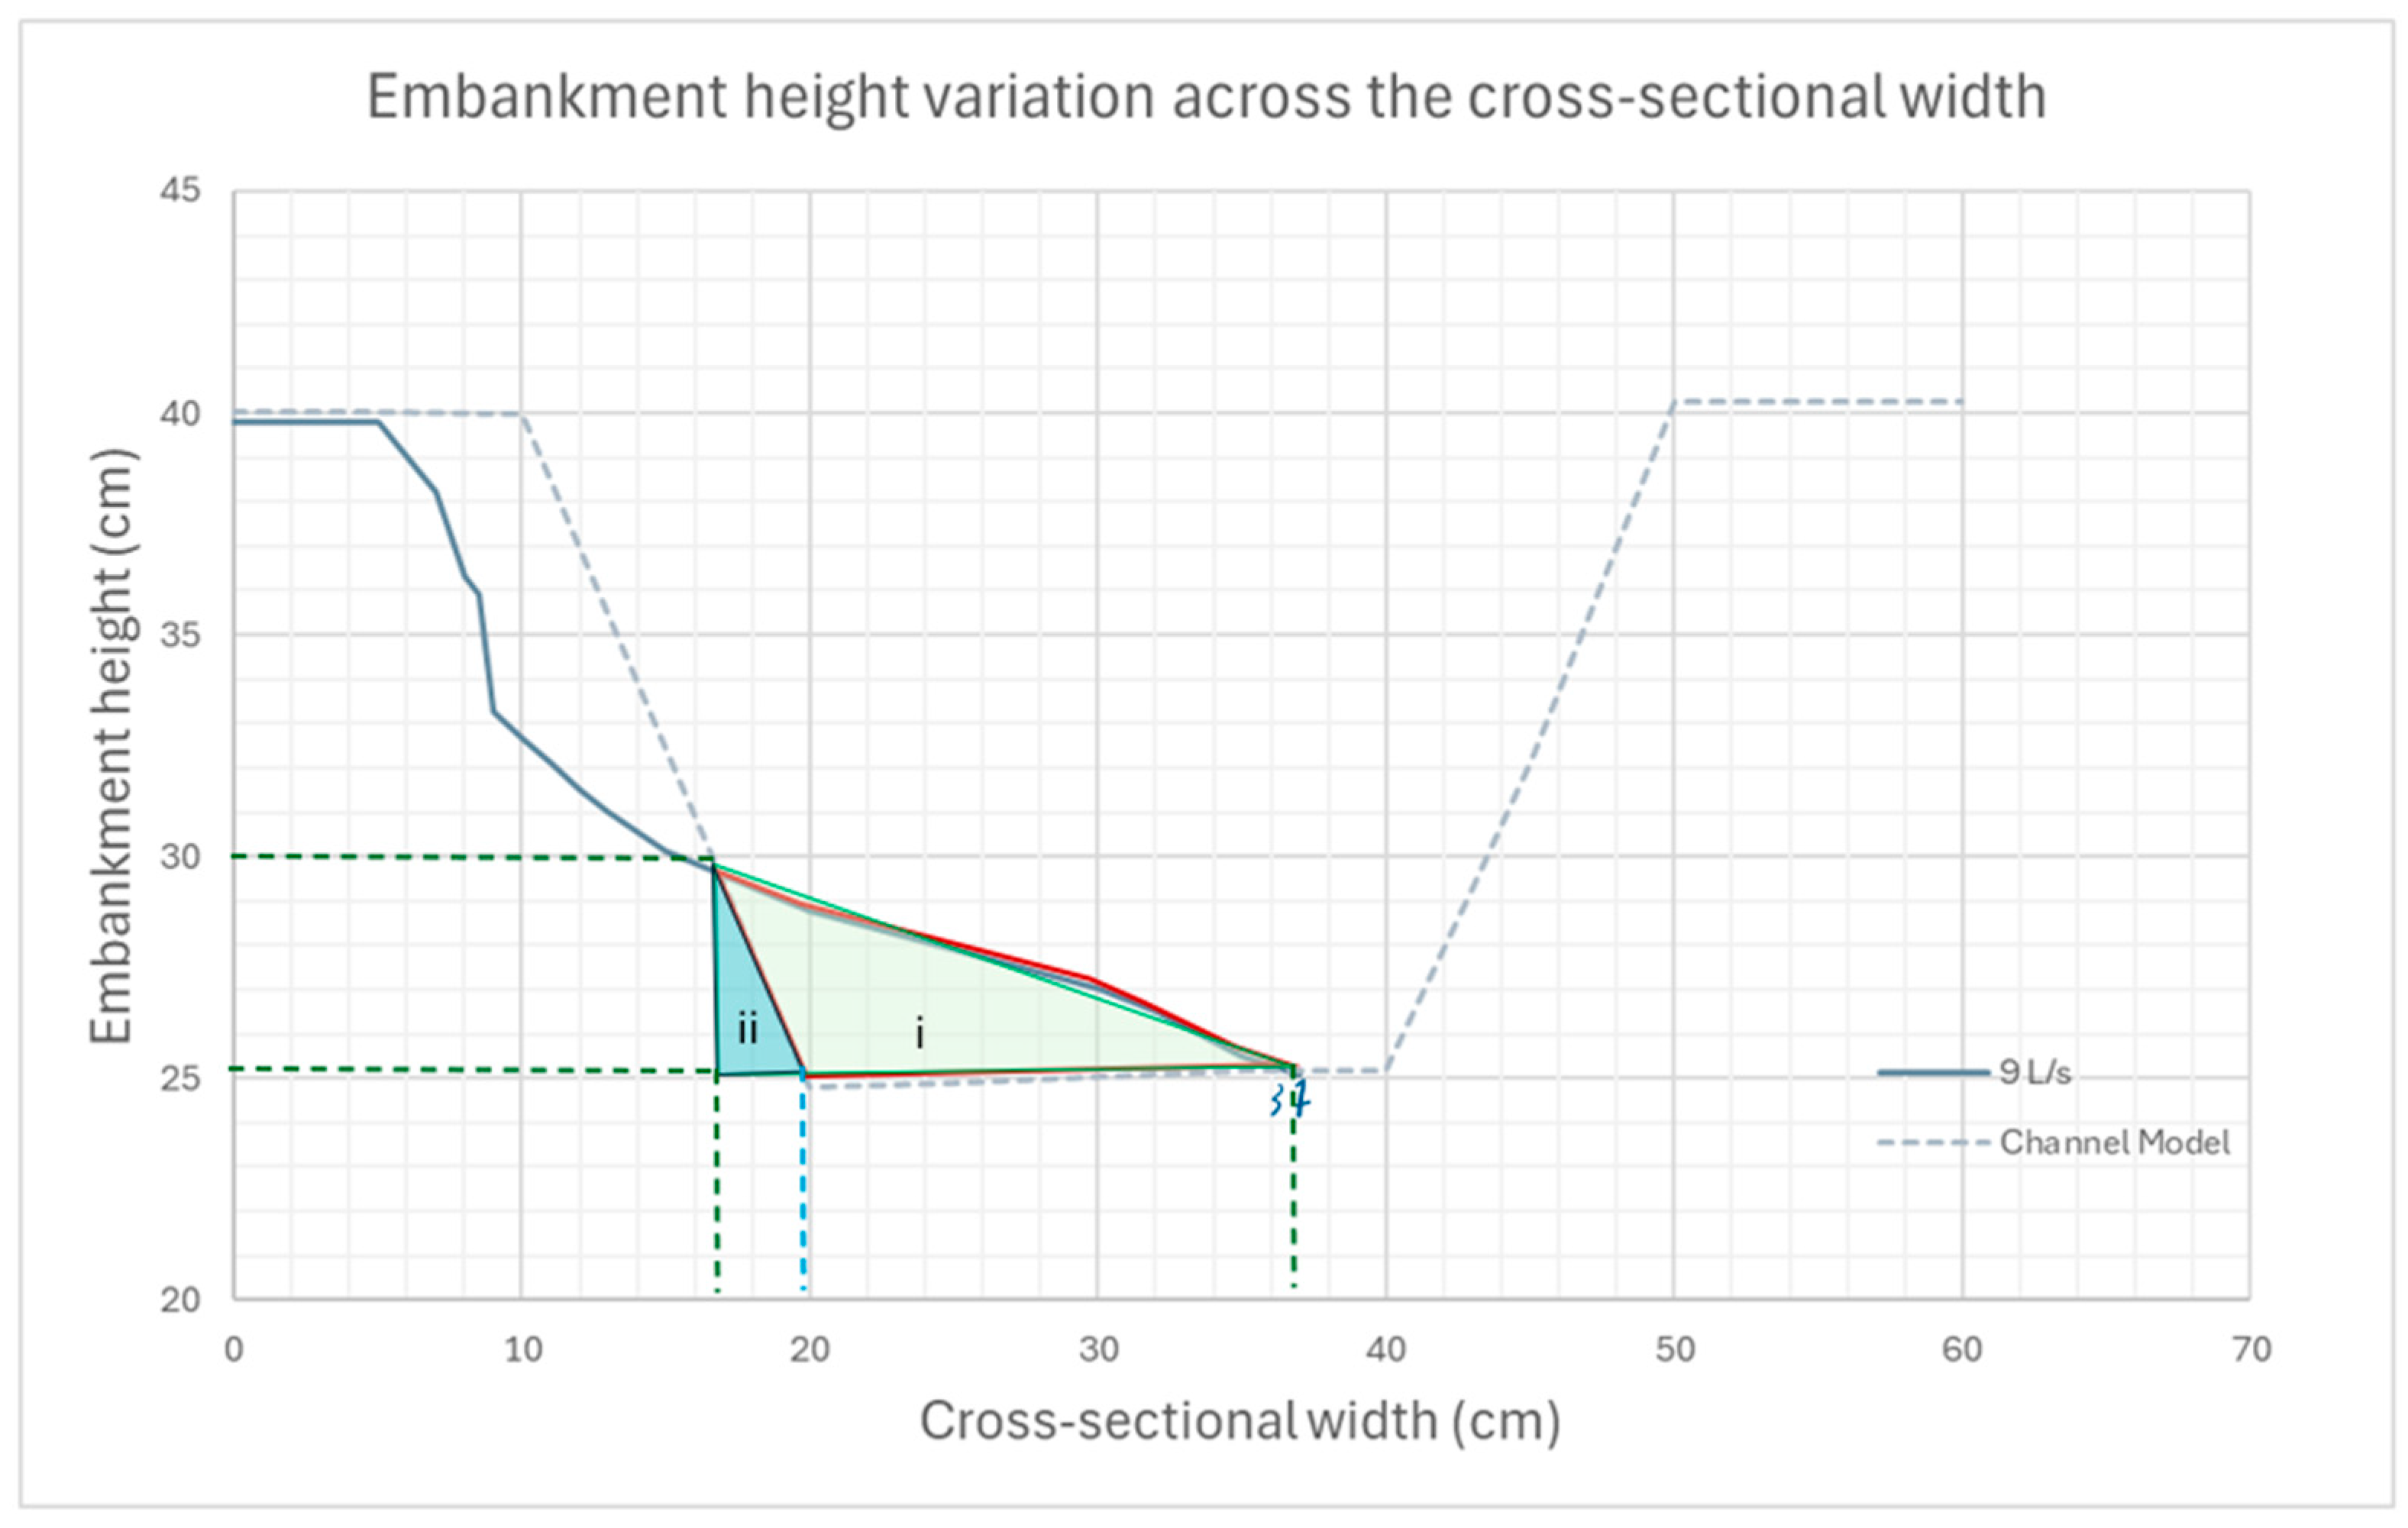
Figure A6 illustrates the graph of the average cross-sectional variation of the collapsed embankment for 9 L/s. The red outlined area represents the area lost. The green outlined shape represents the bigger triangle (i) and the blue highlighted shape represents the smaller triangle (ii). The dashed green and blue lines are to represent the coordinates of the triangles. The area of sediment lost from the embankment is outlined in red. To calculate and estimate the area lost, two triangles have been drawn:
i) Triangle highlighted and outlined in green, ii) Triangle highlighted in blue. The volume dissipated is the difference between the triangles.
Figure A6.
Volume Calculation from the graph for Test 1 and 5 with 9L/s.
References
- Normand, J.C.L.; Heggy, E. Assessing flash flood erosion following storm Daniel in Libya, Nature Communications 2024, 15(1). [CrossRef]
- World Meteorological Organisation, Devastating rainfall hits Spain in yet another flood-related disaster, 2024. Available online: https://wmo.int/media/news/devastating-rainfall-hits-spain-yet-another-flood-related-disaster (Accessed on 03/12/2024).
- Murty, T. S.; Flather, R. A.; Henry, R. F. The storm surge problem in the Bay of Bengal, Progress in Oceonography 2003, 16(4), pp. 195-233. [CrossRef]
- UN Bangladesh, Situation report No2: Eastern Flash Floods 2024. Available online: https://www.unocha.org/publications/report/bangladesh/bangladesh-eastern-flash-floods-2024-situation-report-no-02-30-august-2024 (Accessed 03/12/2024).
- Siddik, M. A. et al., Socio-Economic Impacts of River Bank Erosion: A case study on Coastal Island of Bangladesh. The Journal of NOAMI 2017, 34(2), pp. 73-84.
- DkhakaTribune. Locals panic as riverbank collapses underneath them in Chowhali. Available online: https://www.dhakatribune.com/bangladesh/156791/locals-panic-as-riverbank-collapses-underneath (Accessed on 18/10/2023).
- Auerbach, L. W. et al. Flood risk of natural and embanked landscapes on the Ganges–Brahmaputra tidal delta plain. Nature Clim Change 2015, 5(2), pp. 153-157. [CrossRef]
- van der Wal, M. Bank Protection Structures along the Brahmaputra-Jamuna River, a Study of Flow Slides, Water 2020, 12(9), p. 2588. [CrossRef]
- Zaman, M. W.; Asik, T. Z.; Rumi, M. Y.; Hossain, S. Geotechnical hazard analysis of river embankment of Bangladesh and its protectability. GEOMATE Journal 2016, 10(22), pp. 2050-2057.
- World Meteorological Organization, Climate change and extreme weather impacts hit Asia hard, 2024. Available online: https://wmo.int/news/media-centre/climate-change-and-extreme-weather-impacts-hit-asia-hard (Accessed on 03/12/2024).
- Balkan Insight, Greece Counts Heavy Cost After Deadly Storms Batter Country. Available online: https://balkaninsight.com/2023/09/11/greece-counts-heavy-cost-after-deadly-storms-batter-country/ (Accessed on 3/12/2024).
- Geoengineer.org, Greece struck by powerful Mediterranean hurricane: Floods and destruction across the country, September 2020. Available online: https://www.geoengineer.org/news/greece-struck-by-powerful-mediterranean-hurricane-floods-and-destruction-accross-the-country (Accessed on 03/12/2024).
- Ecopress.gr, The catastrophic floods reveal a stream of mistakes in urban planning (Article in greek). Available online: https://ecopress.gr/oi-katastrofikes-plimmyres-xeskepaz/ (Accessed on 03/12/2024).
- ENA Institute for Alternative Policies, Flash Floods in Valencia signal increasing flood risk in the Mediterranean. Available online: https://enainstitute.org/en/publication/flash-floods-in-valencia-signal-increasing-flood-risk-in-the-mediterranean/ (Accessed on 3 December 2024).
- Independent, Spain’s catastrophic floods by the numbers: At least 219 dead, 93 missing and billions in damage. Available online: https://www.independent.co.uk/news/valencia-ap-spain-madrid-andalusia-b2643313.html (Accessed on 2 December 2024).
- Hossain, Z. M.; Islam, Z. M.; Sakai, T. An Investigation on Failure of Embankments in Bangladesh. In 6th Conference of the International Conference on Case Histories in Geotechnical Engineering, Arlington, Virginia, Missouri University of Science and Technology, (14 August 2008).
- Al-Hadi, S. S.; Albadran, B. N.; Albahili, N. K., The effect of some soil properties on bank stability of Shatt Al-Arab river from Sindibad to Umm Al-Ressass islands. Mesopotamian Journal of Marine Science 2009, 24(1), pp. 51-64.
- Aldefae, A. H.; Alkhadaji, R. A. Experimental and numerical modeling to investigate the riverbank’s stability. SN Applied Sciences 2021, Volume 3, pp. 1-16. [CrossRef]
- Samadi, A.; Amiri-Tokaldany, E.; Davoudi, M. H.; Darby, S. E., Experimental and numerical investigation of the stability of overhanging riverbanks. Geomorphology 2013, Volume 184, pp. 1-19. [CrossRef]
- Patsinghasanee , S.; Kimura, I.; Shimizu, Y.; Nabi , M. Cantilever failure investigations for cohesive riverbanks. In Proceedings of the institution of civil engineers-water management. Thomas Telford Ltd, 2017; Volume 170, pp. 93-108. [CrossRef]
- Hossain, M. Z.; Sakai, T. Severity of Flood Embankments in Bangladesh and Its Remedial Approach. Agricultural Engineering International: CIGR Journal 2008.
- Vázquez-Tarrío, D. et al. Effects of sediment transport on flood hazards: Lessons learned and remaining challenges. Geomorphology 2024, Volume 446, p. 108976. [CrossRef]
- Chen, C.-H.; Hsieh, T.-Y.; Yang, J.-C. Investigating effect of water level variation and surface tension crack on riverbank stability. Journal of Hydro-environment Research 2017, Volume 15, pp. 41-53. [CrossRef]
- Hossain, M. B.; Sakai, T.; Hossain, M. Z. River Embankment and Bank Failure: A Study on Geotechnical characteristics and stability analysis. American Journal of Environmental Sciences 2011, 7(2), p. 102. [CrossRef]
- Leão, A. L. et al. Natural fibres for geotextiles. In Handbook of Natural Fibres; Woodhead Publishing, 2012; Volume 2, pp. 280-311. [CrossRef]
- Onyelowe, K. C. Soil stabilization techniques and procedures in the developing countries-Nigeria. Global Jour. of Engg. & Tech 2012, Volume 5, pp. 65-69.
- Zafar, T.; Ansari, M. A.; Husain, A. Soil stabilization by reinforcing natural and synthetic fibers–A state of the art review. Materials Today: Proceedings 2023. [CrossRef]
- Li, L. et al. Experimental study of embankments with different reinforcement materials and spacing between layers. Geotextiles and Geomembranes 2019, 47(4), pp. 477-482. [CrossRef]
- Yoon, Y. W.; Heo, S. B.; Kin, K. S. Geotechnical performance of waste tires for soil reinforcement from chamber tests. Geotextiles and Geomembranes 2008, 26(1), pp. 100-107. [CrossRef]
- Sayao, A. S. F. J. et al. Briefing: Retaining walls built with scrap tyres. Proceedings of the Institution of Civil Engineers-Geotechnical Engineering 2002, 155(4), pp. 217-219. [CrossRef]
- Gordon, K., Retaining forest roads. Civil Engineering 1990, 60(12), p. 50.
- Garga, V. K.; O'Shaughnessy, V. Tire-reinforced earthfill. Part 1: Construction of a test fill, performance, and retaining wall design. Canadian Geotechnical Journal 2000, 37(1), pp. 75-96. [CrossRef]
- Simm, J D; Wallis, M J; Collins K (eds). Sustainable re-use of tyres in port, coastal and river engineering. Guidance for planning, implementation and maintenance, Report SR 669, HR Wallingford, 2004, UK. ISBN:1-8443-2391-9.
- Slack, D. C. et al. Engineered Conservation Structures using Discarded Tires. In 21st Century Watershed Technology: Improving Water Quality and Environment Conference Proceedings; American Society of Agricultural and Biological Engineers: Concepción, Chile, 2008; p. 28.
- CIRIA C731, The International Levee Handbook, RP957, CIRIA, 2013. ISBN: 978-0-86017-734-0.
- The Financial Express, Turning waste tires into energy. Available online: https://thefinancialexpress.com.bd/views/opinions/turning-waste-tires-into-energy (Accessed on 15 December 2023).
- Ministry of Foreign Affairs, Jute of Bangladesh has a huge export potential to Pakistan and Bangladesh Deputy High Commissioner in Karachi urges importers to Import Jute from Bangladesh. Available online: https://mofa.gov.bd/site/press_release/8c4a819d-51fa-4d5f-bd92-cc793eba6837 (Accessed on 15 December 2023).
- Biermann, F.; Kanie, N.; Kim, R. E. Global governance by goal-setting: the novel approach of the UN Sustainable Development Goals. Current Opinion in Environmental Sustainability 2017, Volume 26, pp. 26-31. [CrossRef]
- Dalmora, C. T.; Dalmora, C. T.; Ota, J. Study of the flow around cofferdams constructed in running water through computational model. RBRH 2018, Volume 23, p. e37. [CrossRef]
- Tire Size Calculator. Available online: https://tiresize.com/calculator/ (Accessed on 10 June 2024).
- Alam, A.; Ahmed, B.; Sammonds, P. Flash flood susceptibility assessment using the parameters of drainage basin morphometry in SE Bangladesh. Quaternary International 2021, Volume 575, pp. 295-307. [CrossRef]
- Wood, D. M. Geotechnical Modelling, 1st ed.; CRC Press: London, England, 2017. ISBN 9780419237303.
- CIRIA, Soil microplastics: New study unveils impact and distribution. Available online: https://www.ciria.org/CIRIA/News/CIRIA_news2/Soil%20microplastics%20New%20study%20unveils%20impact%20and%20distribution.aspx (Accessed 10 June 2024).
- Eco Green Equipment, Environmental Impacts of Waste Tire Disposal. Available online: https://ecogreenequipment.com/environmental-impacts-of-waste-tire-disposal/ (Accessed 10 June 2024).
- Obanya H.; Ford A, The Conversation, Car tyres shed a quarter of all microplastics in the environment – urgent action is needed, 2024. Available online: https://theconversation.com/car-tyres-shed-a-quarter-of-all-microplastics-in-the-environment-urgent-action-is-needed-244132 (Accessed on 02 December 2024).
- Chowdhury N. 2024, Experimental Investigation of Reinforced Earth-fill Embankments, Dissertation for the BEng Civil Eng, University of Greenwich, 2024.
Figure 1.
Flood defence system collapsed a year after construction in Bangladesh, Sirajganj (Image from DhakaTribune [6]).
Figure 1.
Flood defence system collapsed a year after construction in Bangladesh, Sirajganj (Image from DhakaTribune [6]).
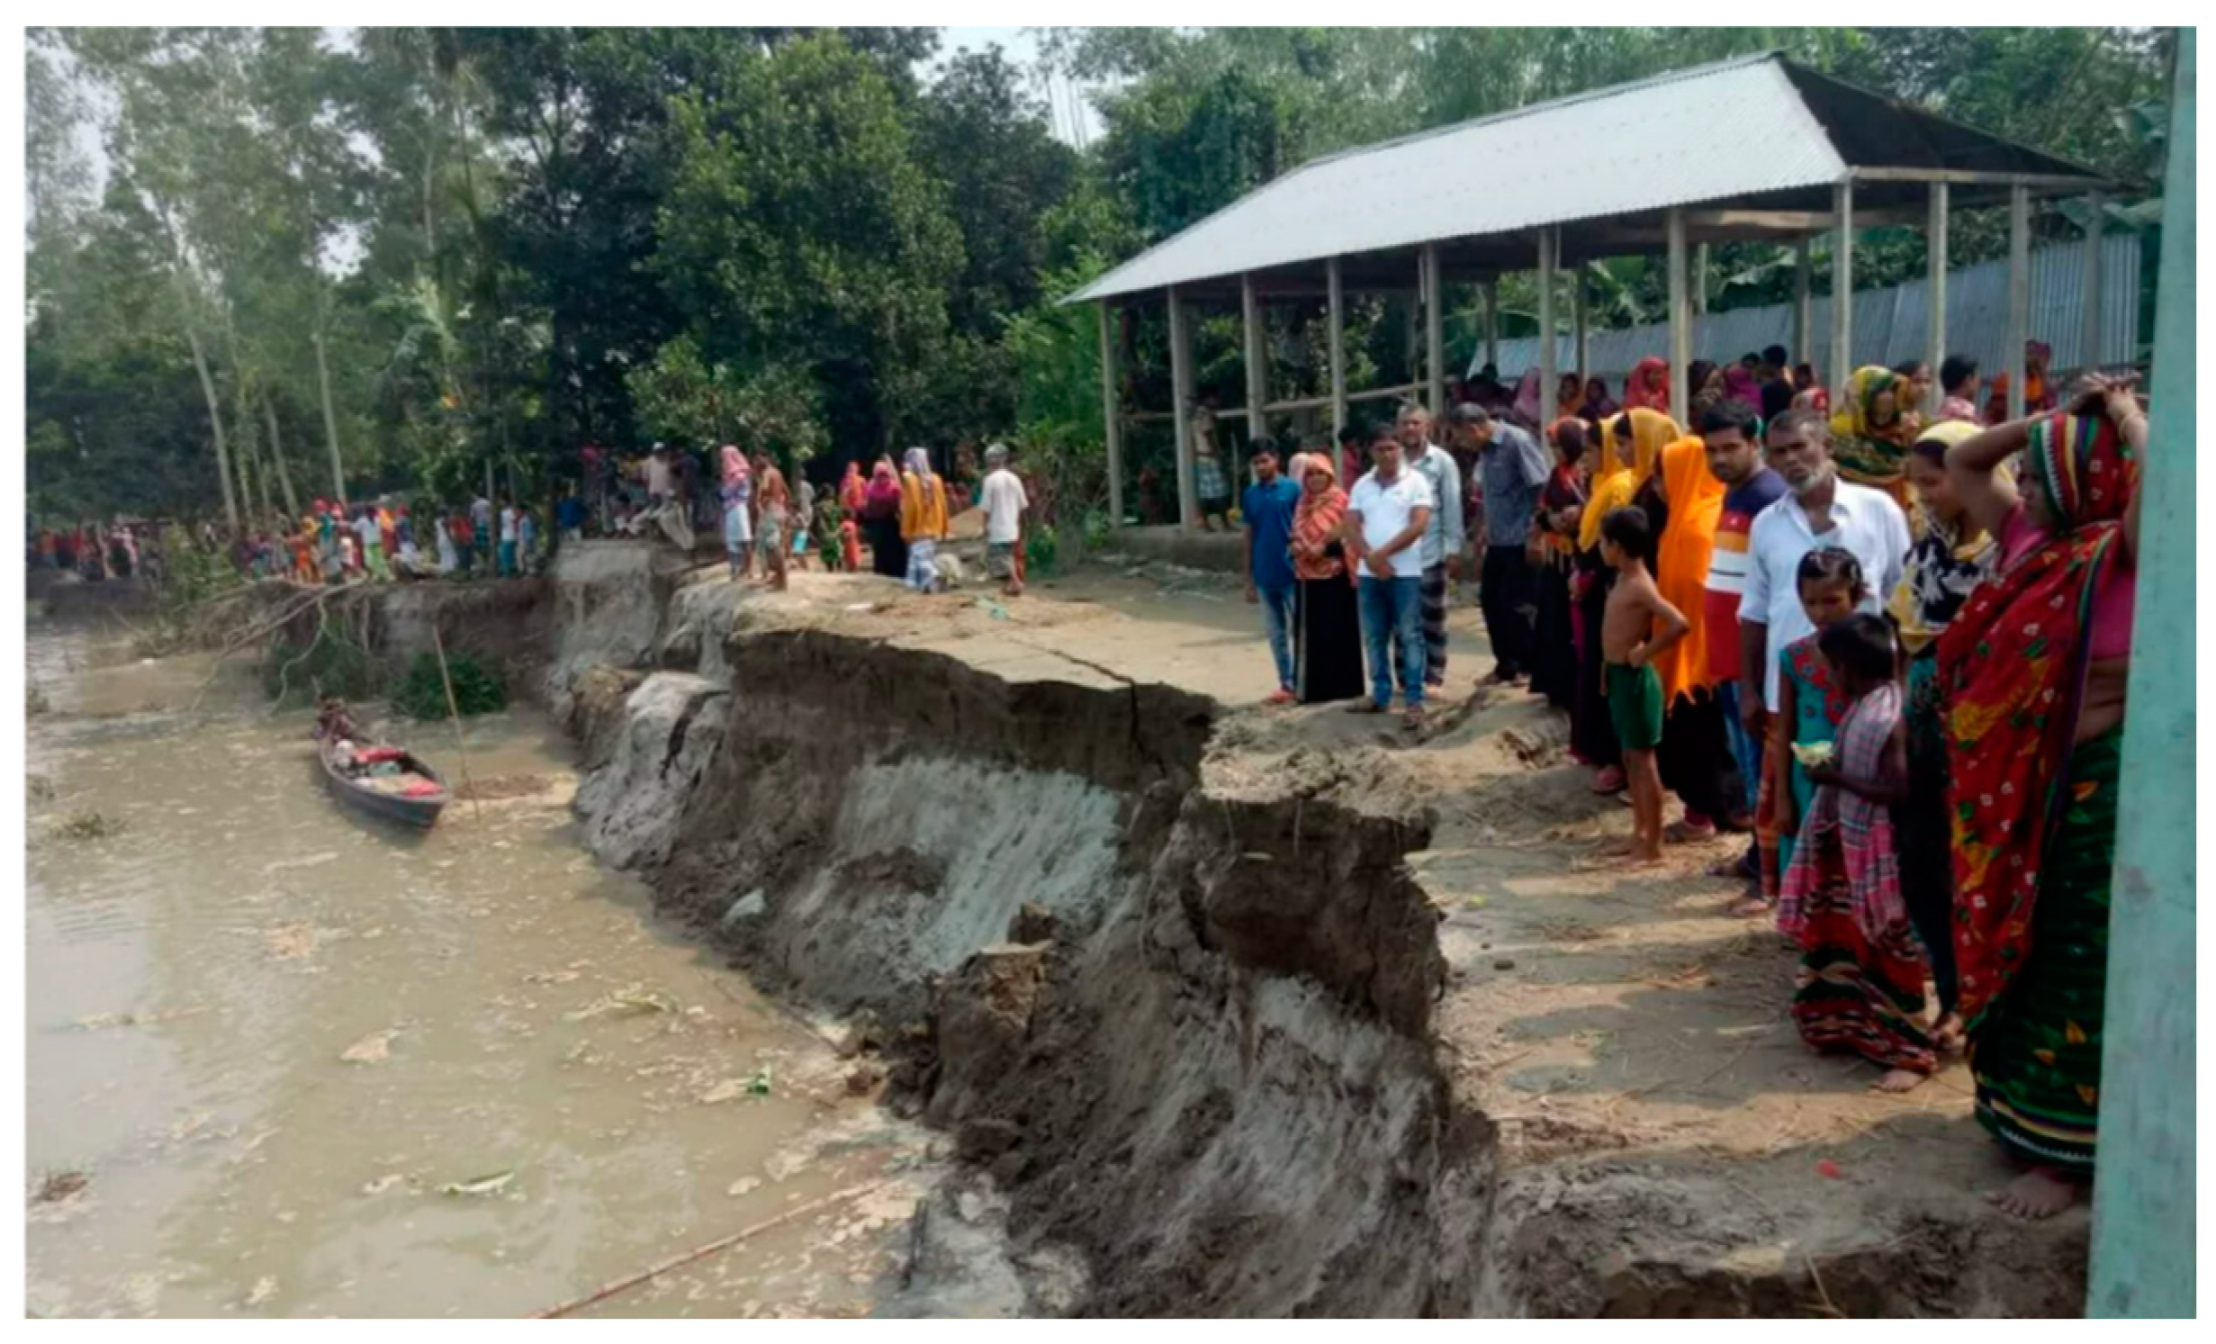
Figure 2.
(a) Damage on river banks and adjacent structures from severe flash flood caused by the cyclone Ianos in Mouzaki, Thessaly, Greece in 2020 (Image from geoengineer.org [11]); (b) Second retreat of the river banks and subsequent structural damage in the same town, caused by Storm Daniel in 2023 (Image from ecopress.gr [13]).
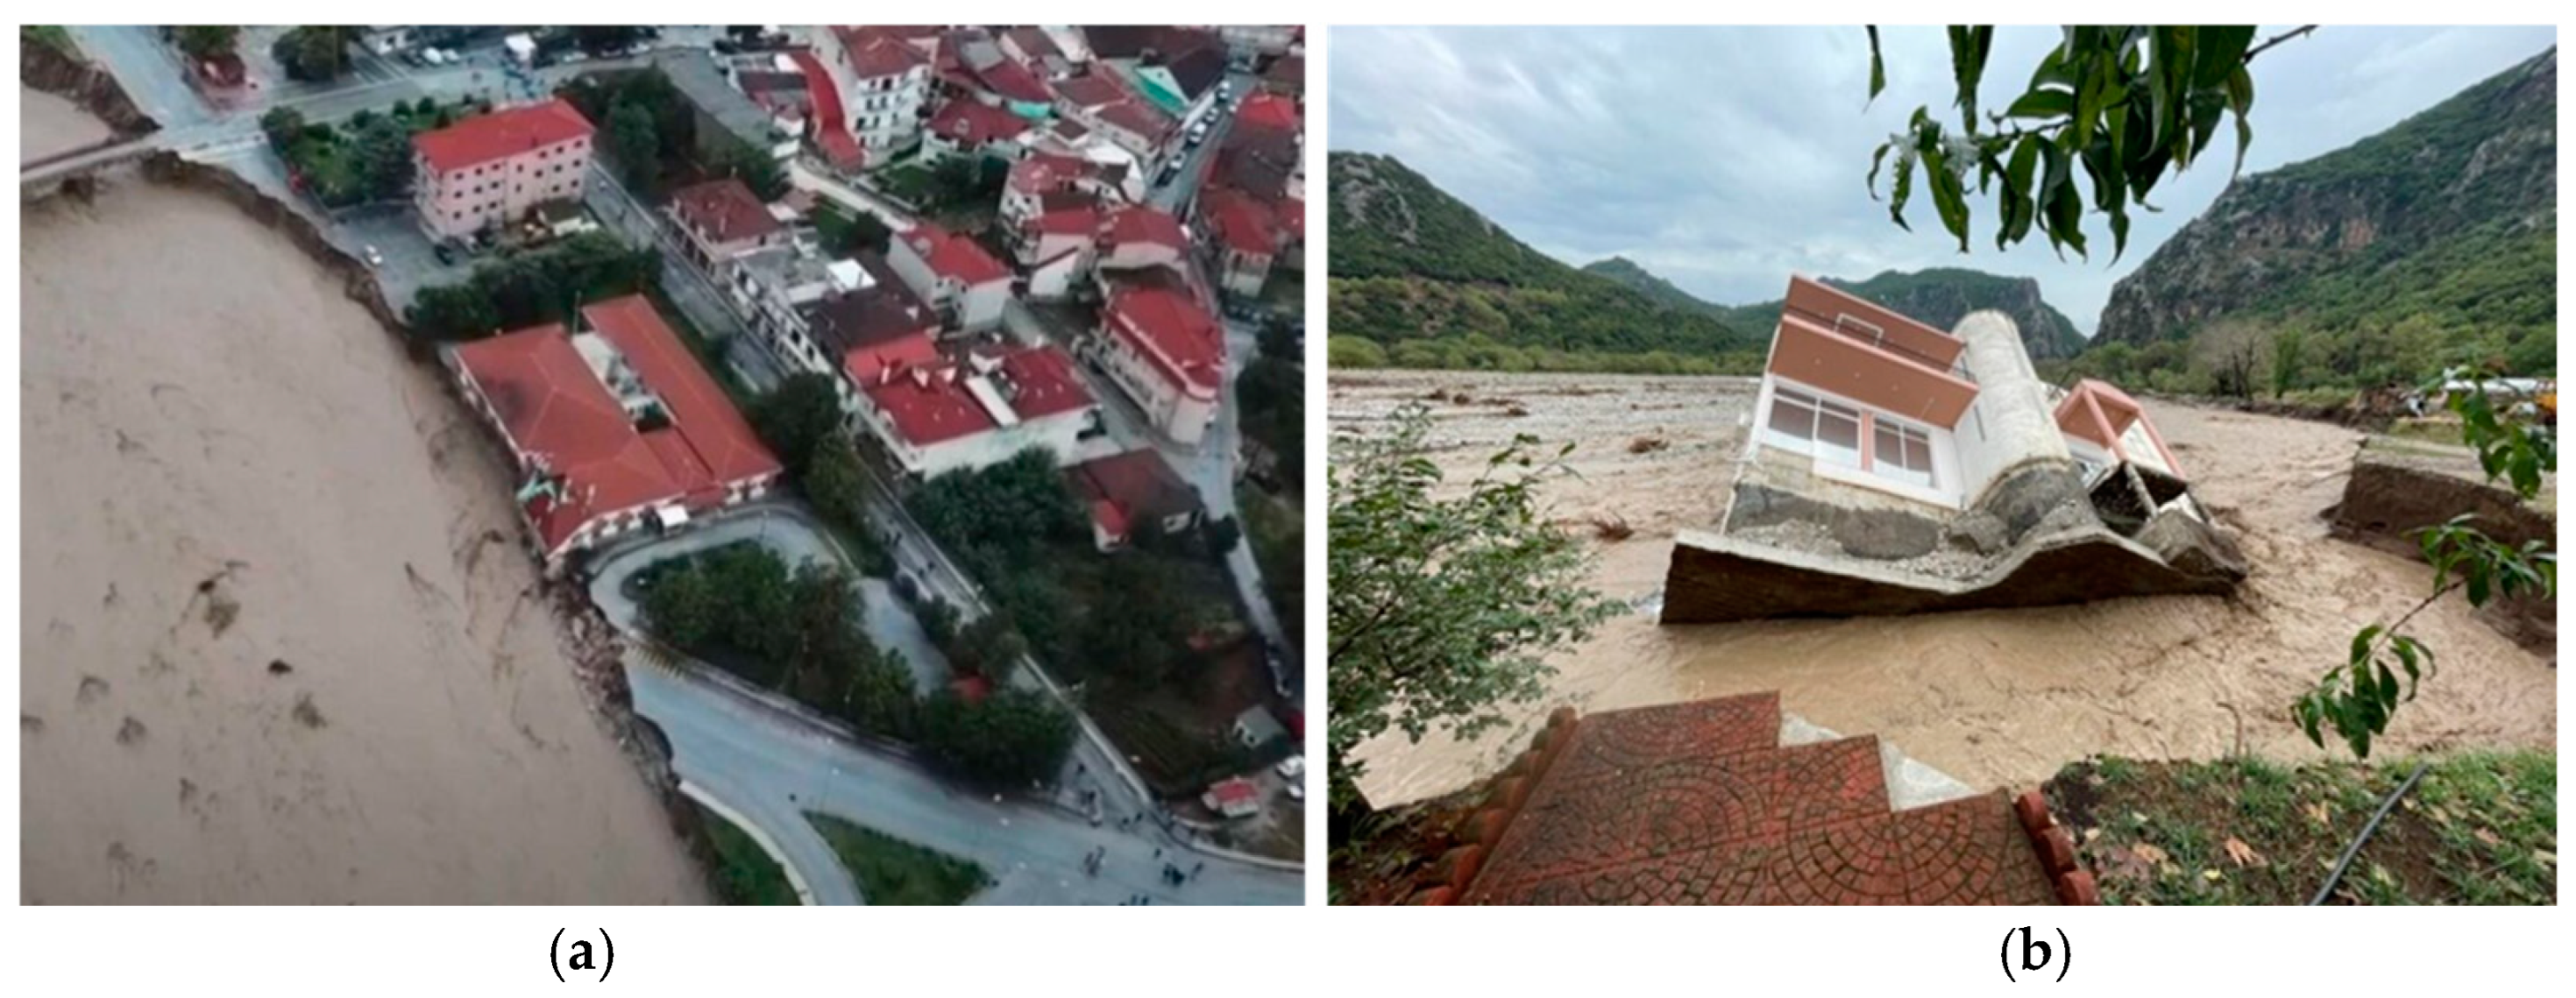
Figure 3.
(a) Plan view of the apparatus with dimensions, (b) Section view with detailed dimensions of the embankment and the removable sections highlighted in red and (c) 3D view of the experimental apparatus, with arrows indicating the flow direction.
Figure 3.
(a) Plan view of the apparatus with dimensions, (b) Section view with detailed dimensions of the embankment and the removable sections highlighted in red and (c) 3D view of the experimental apparatus, with arrows indicating the flow direction.
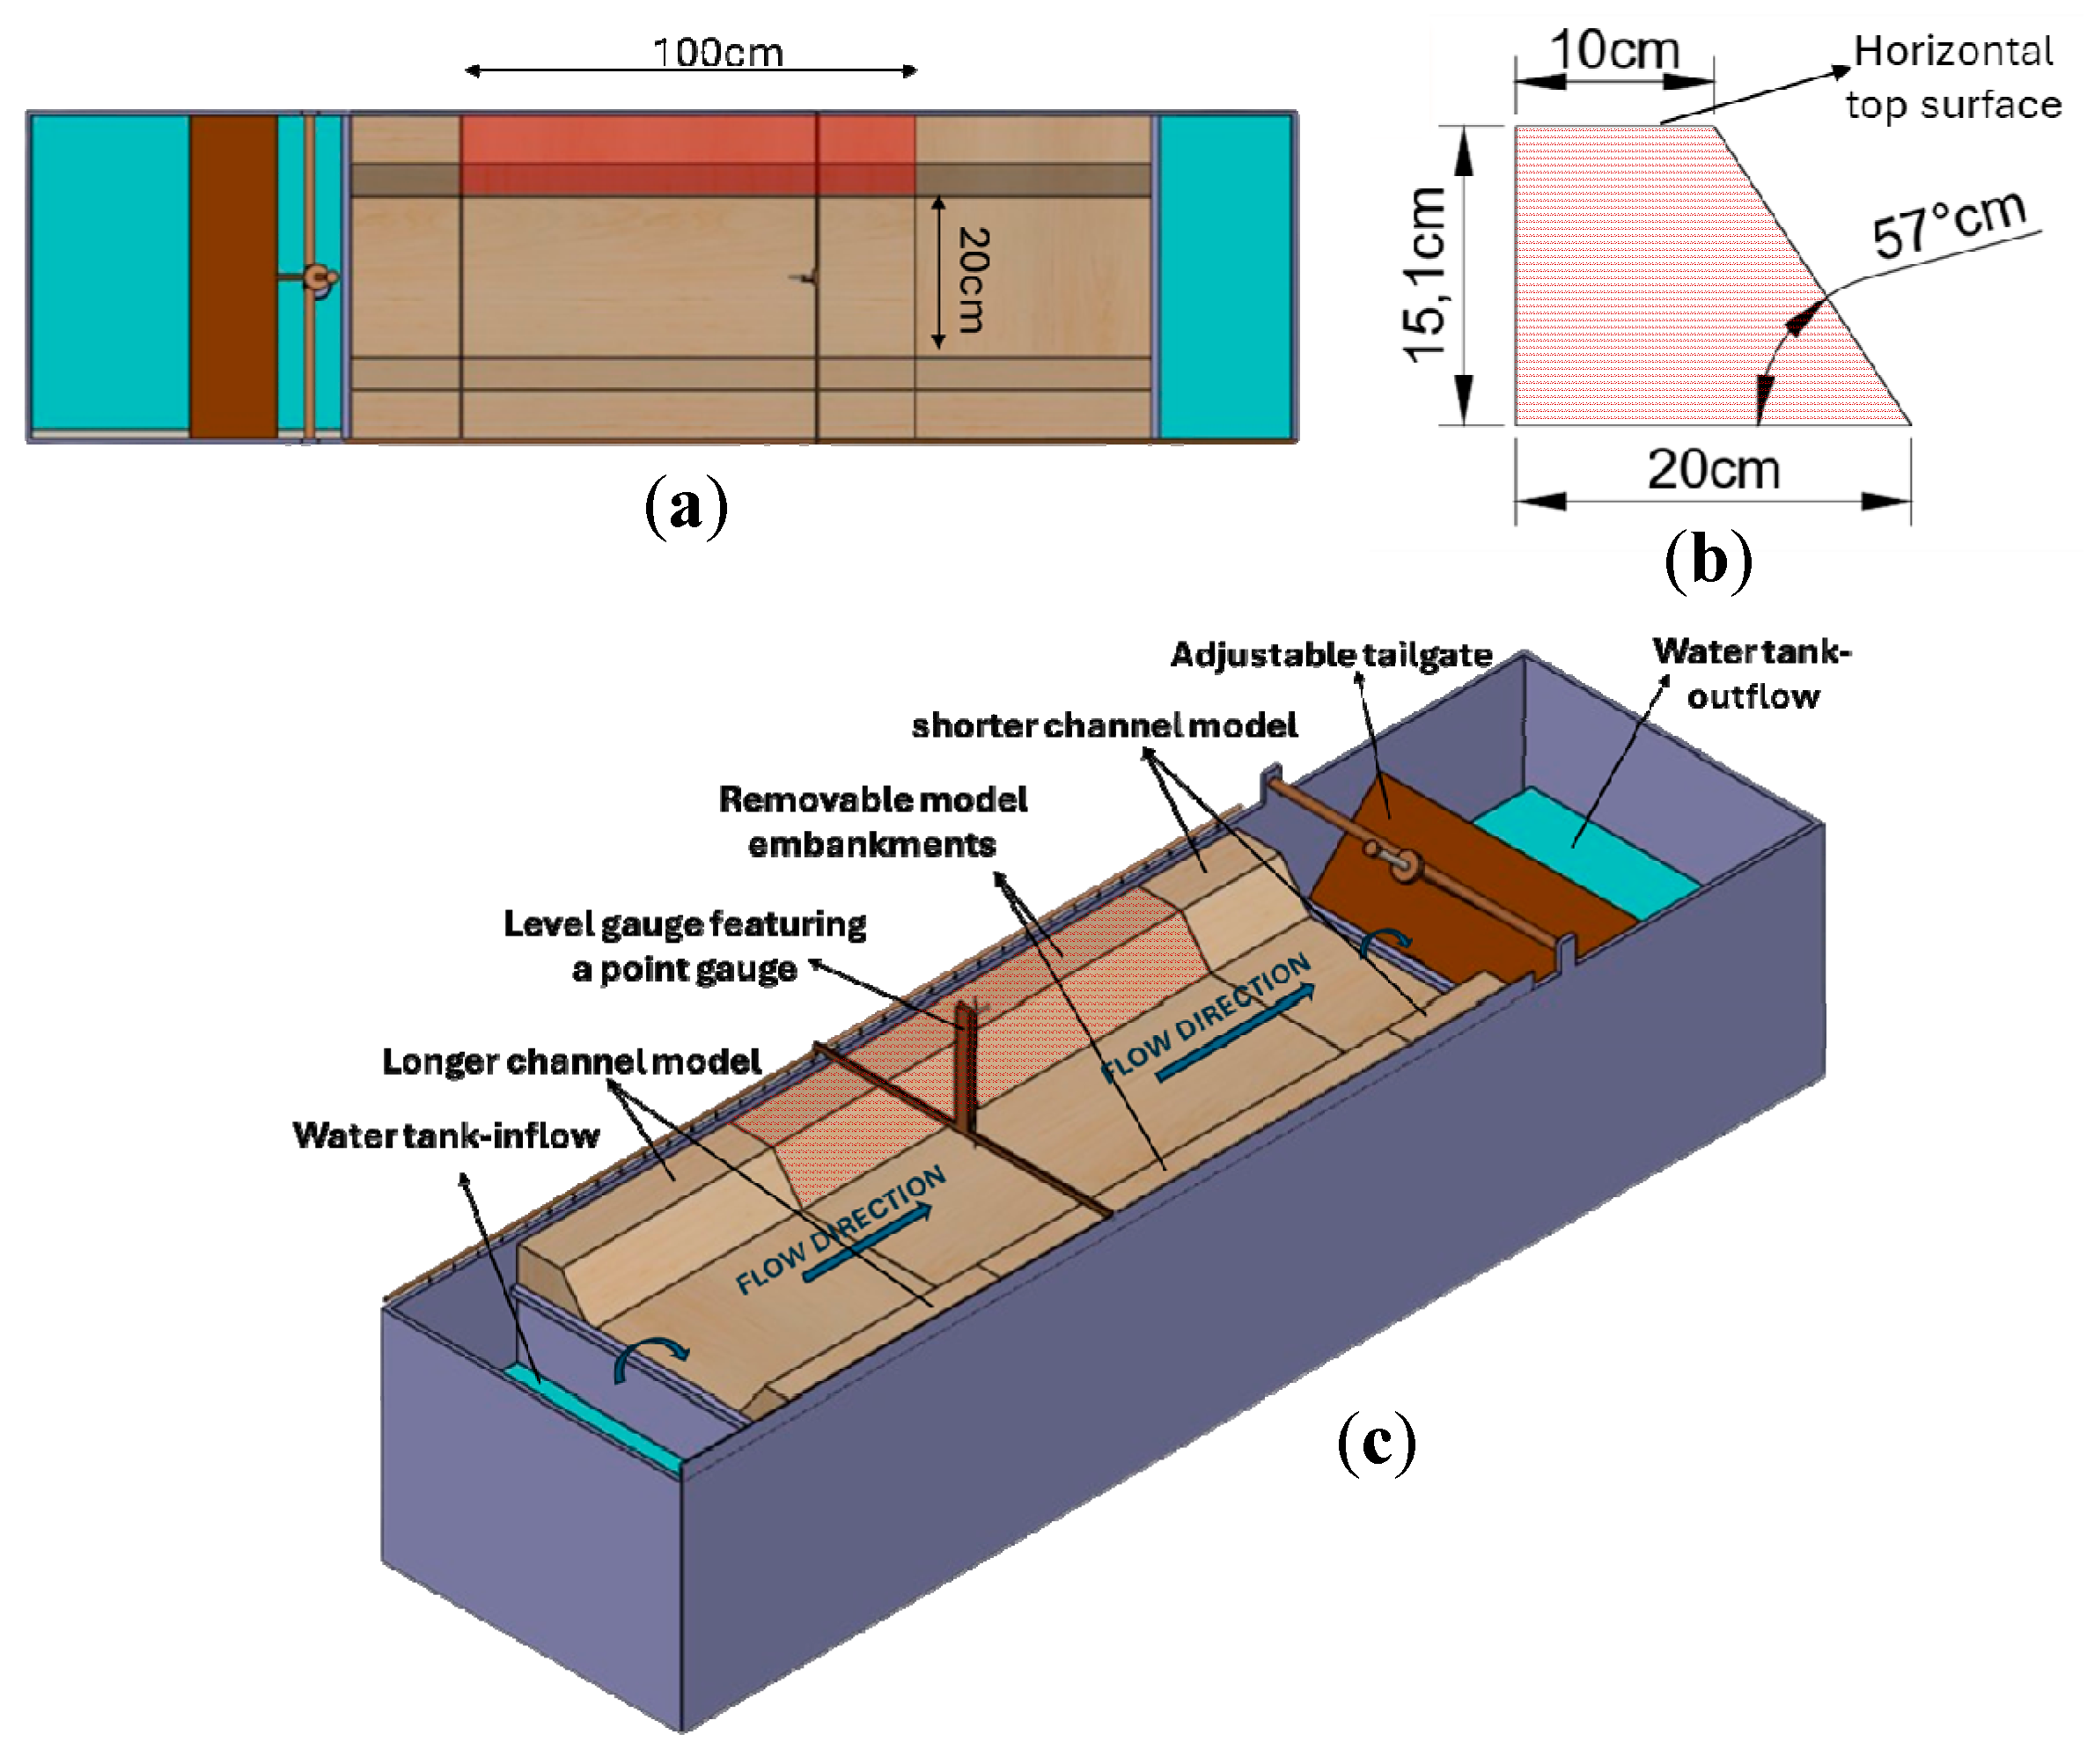
Figure 4.
(a) Dimensions of the prototype tyre (Image and dimensions from Tire Size Calculator [40]); (b) the PVC hose model tyre.
Figure 4.
(a) Dimensions of the prototype tyre (Image and dimensions from Tire Size Calculator [40]); (b) the PVC hose model tyre.
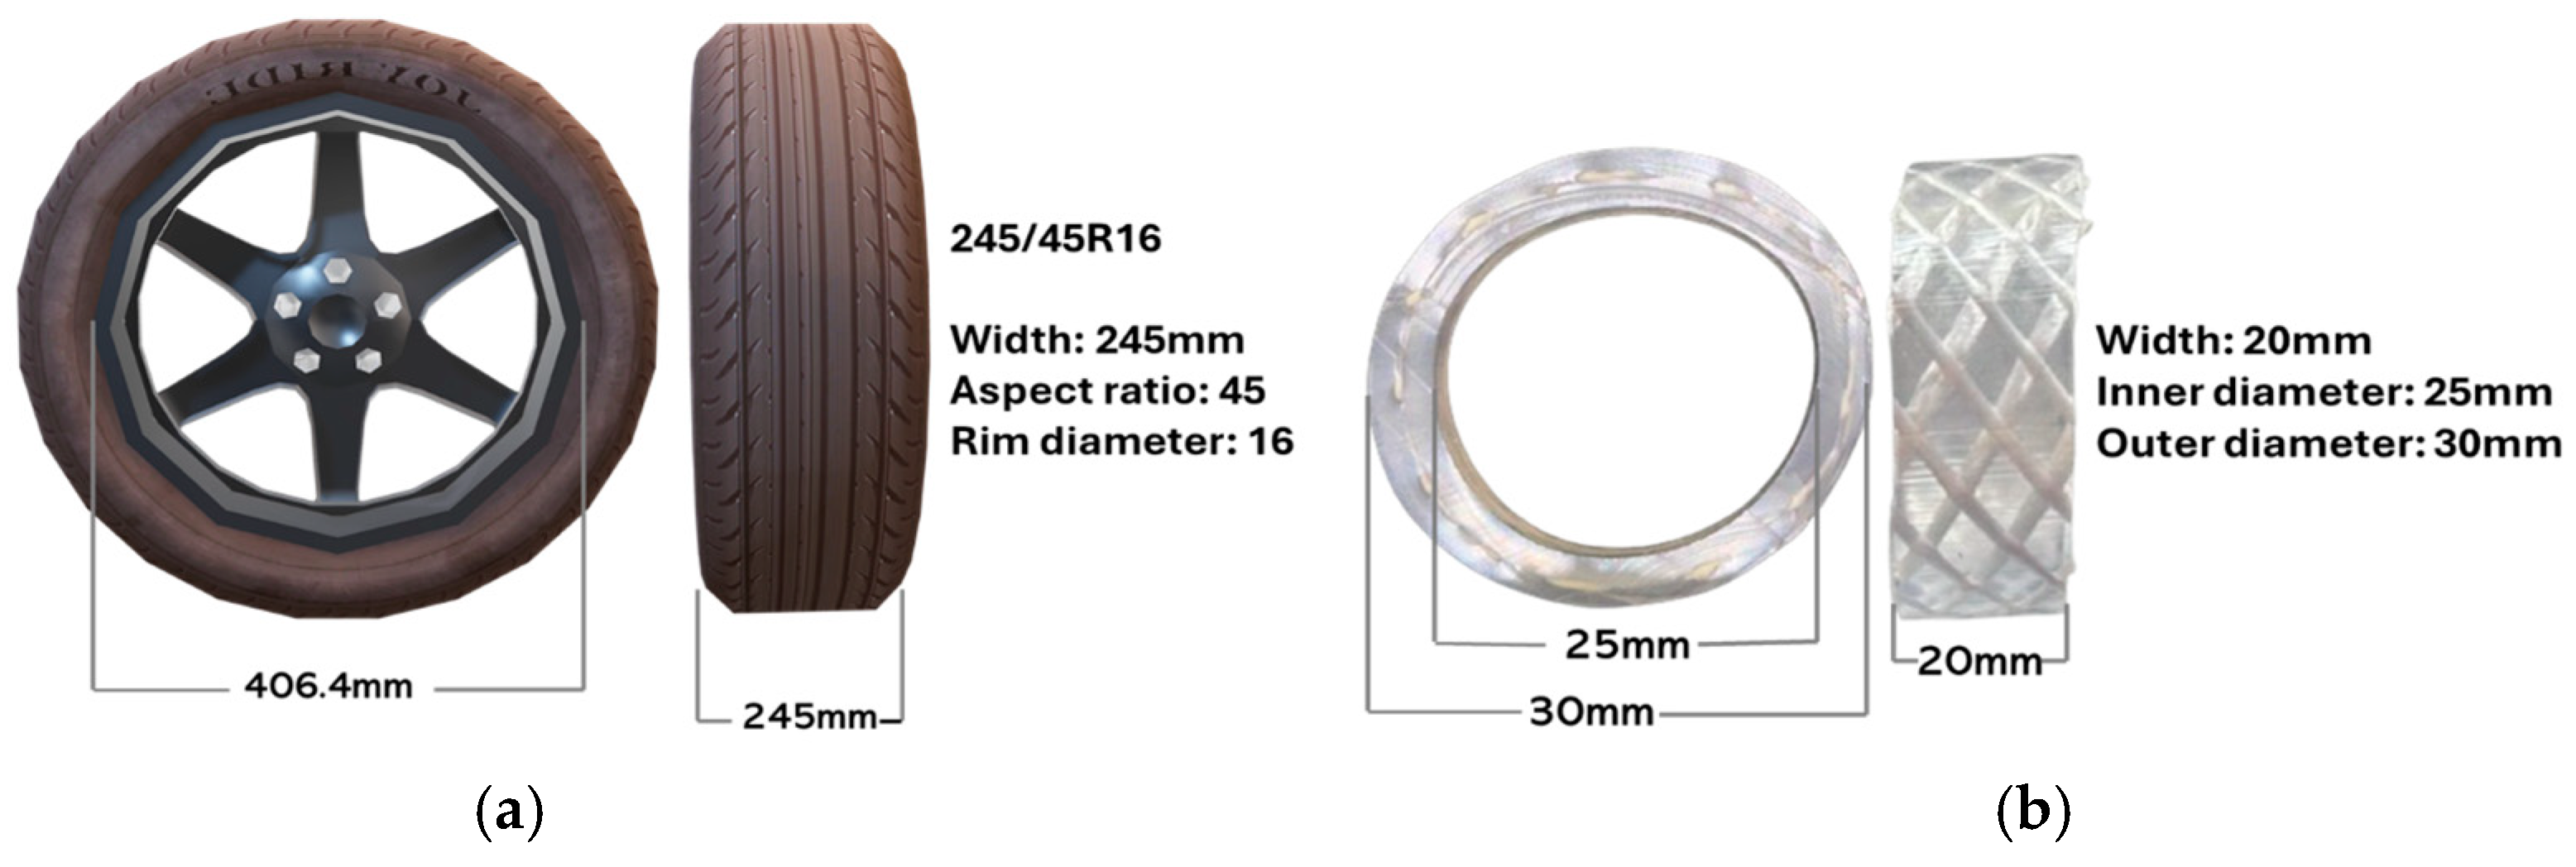
Figure 5.
A row of model tyres made of clear PVC hose and tied together using 2mm jute strings.
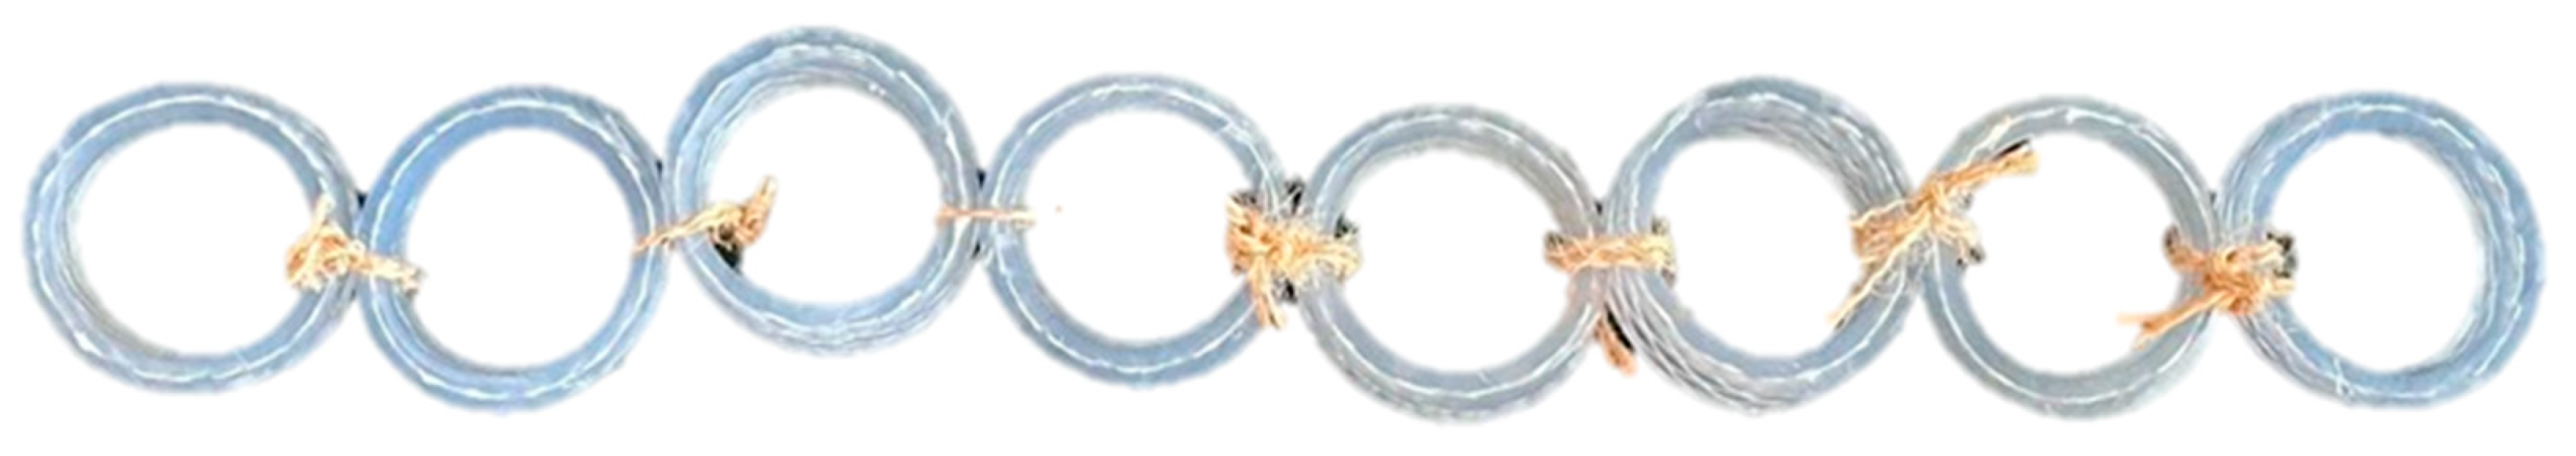
Figure 5.
Compaction process of the sand during the construction of non-reinforced embankment.
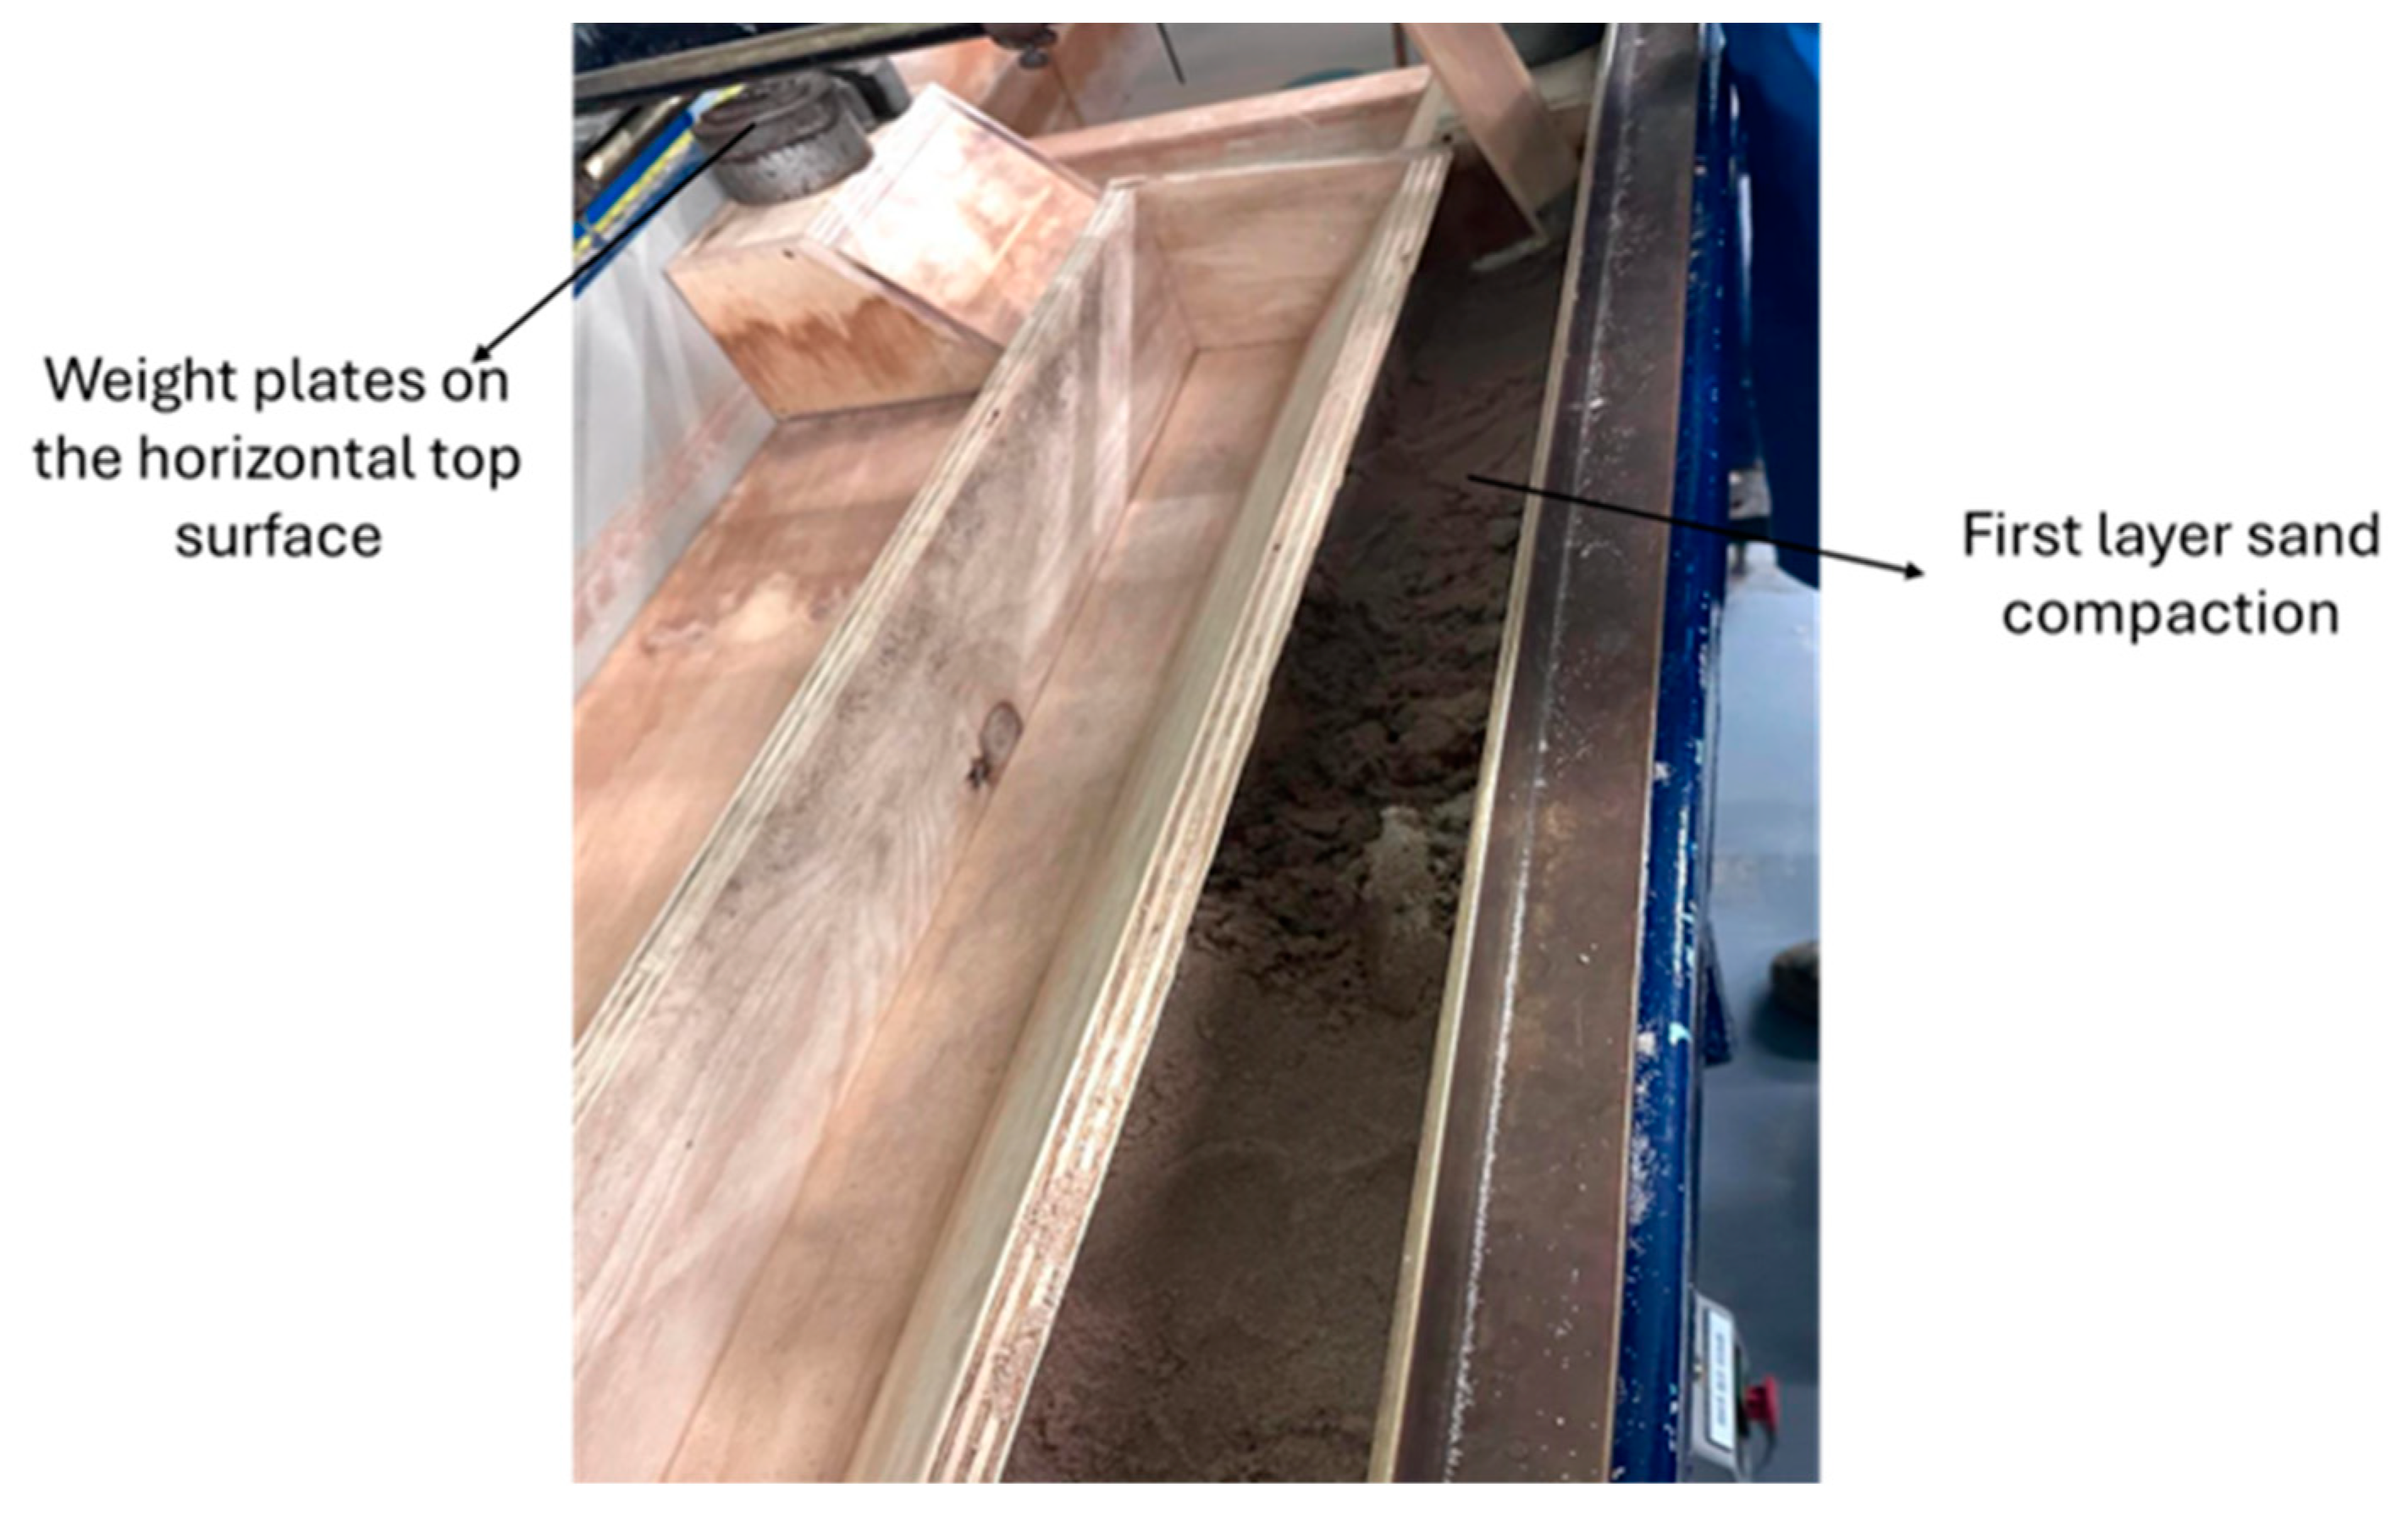
Figure 6.
Application of the wooden shaper to finalise the shape of the embankment.
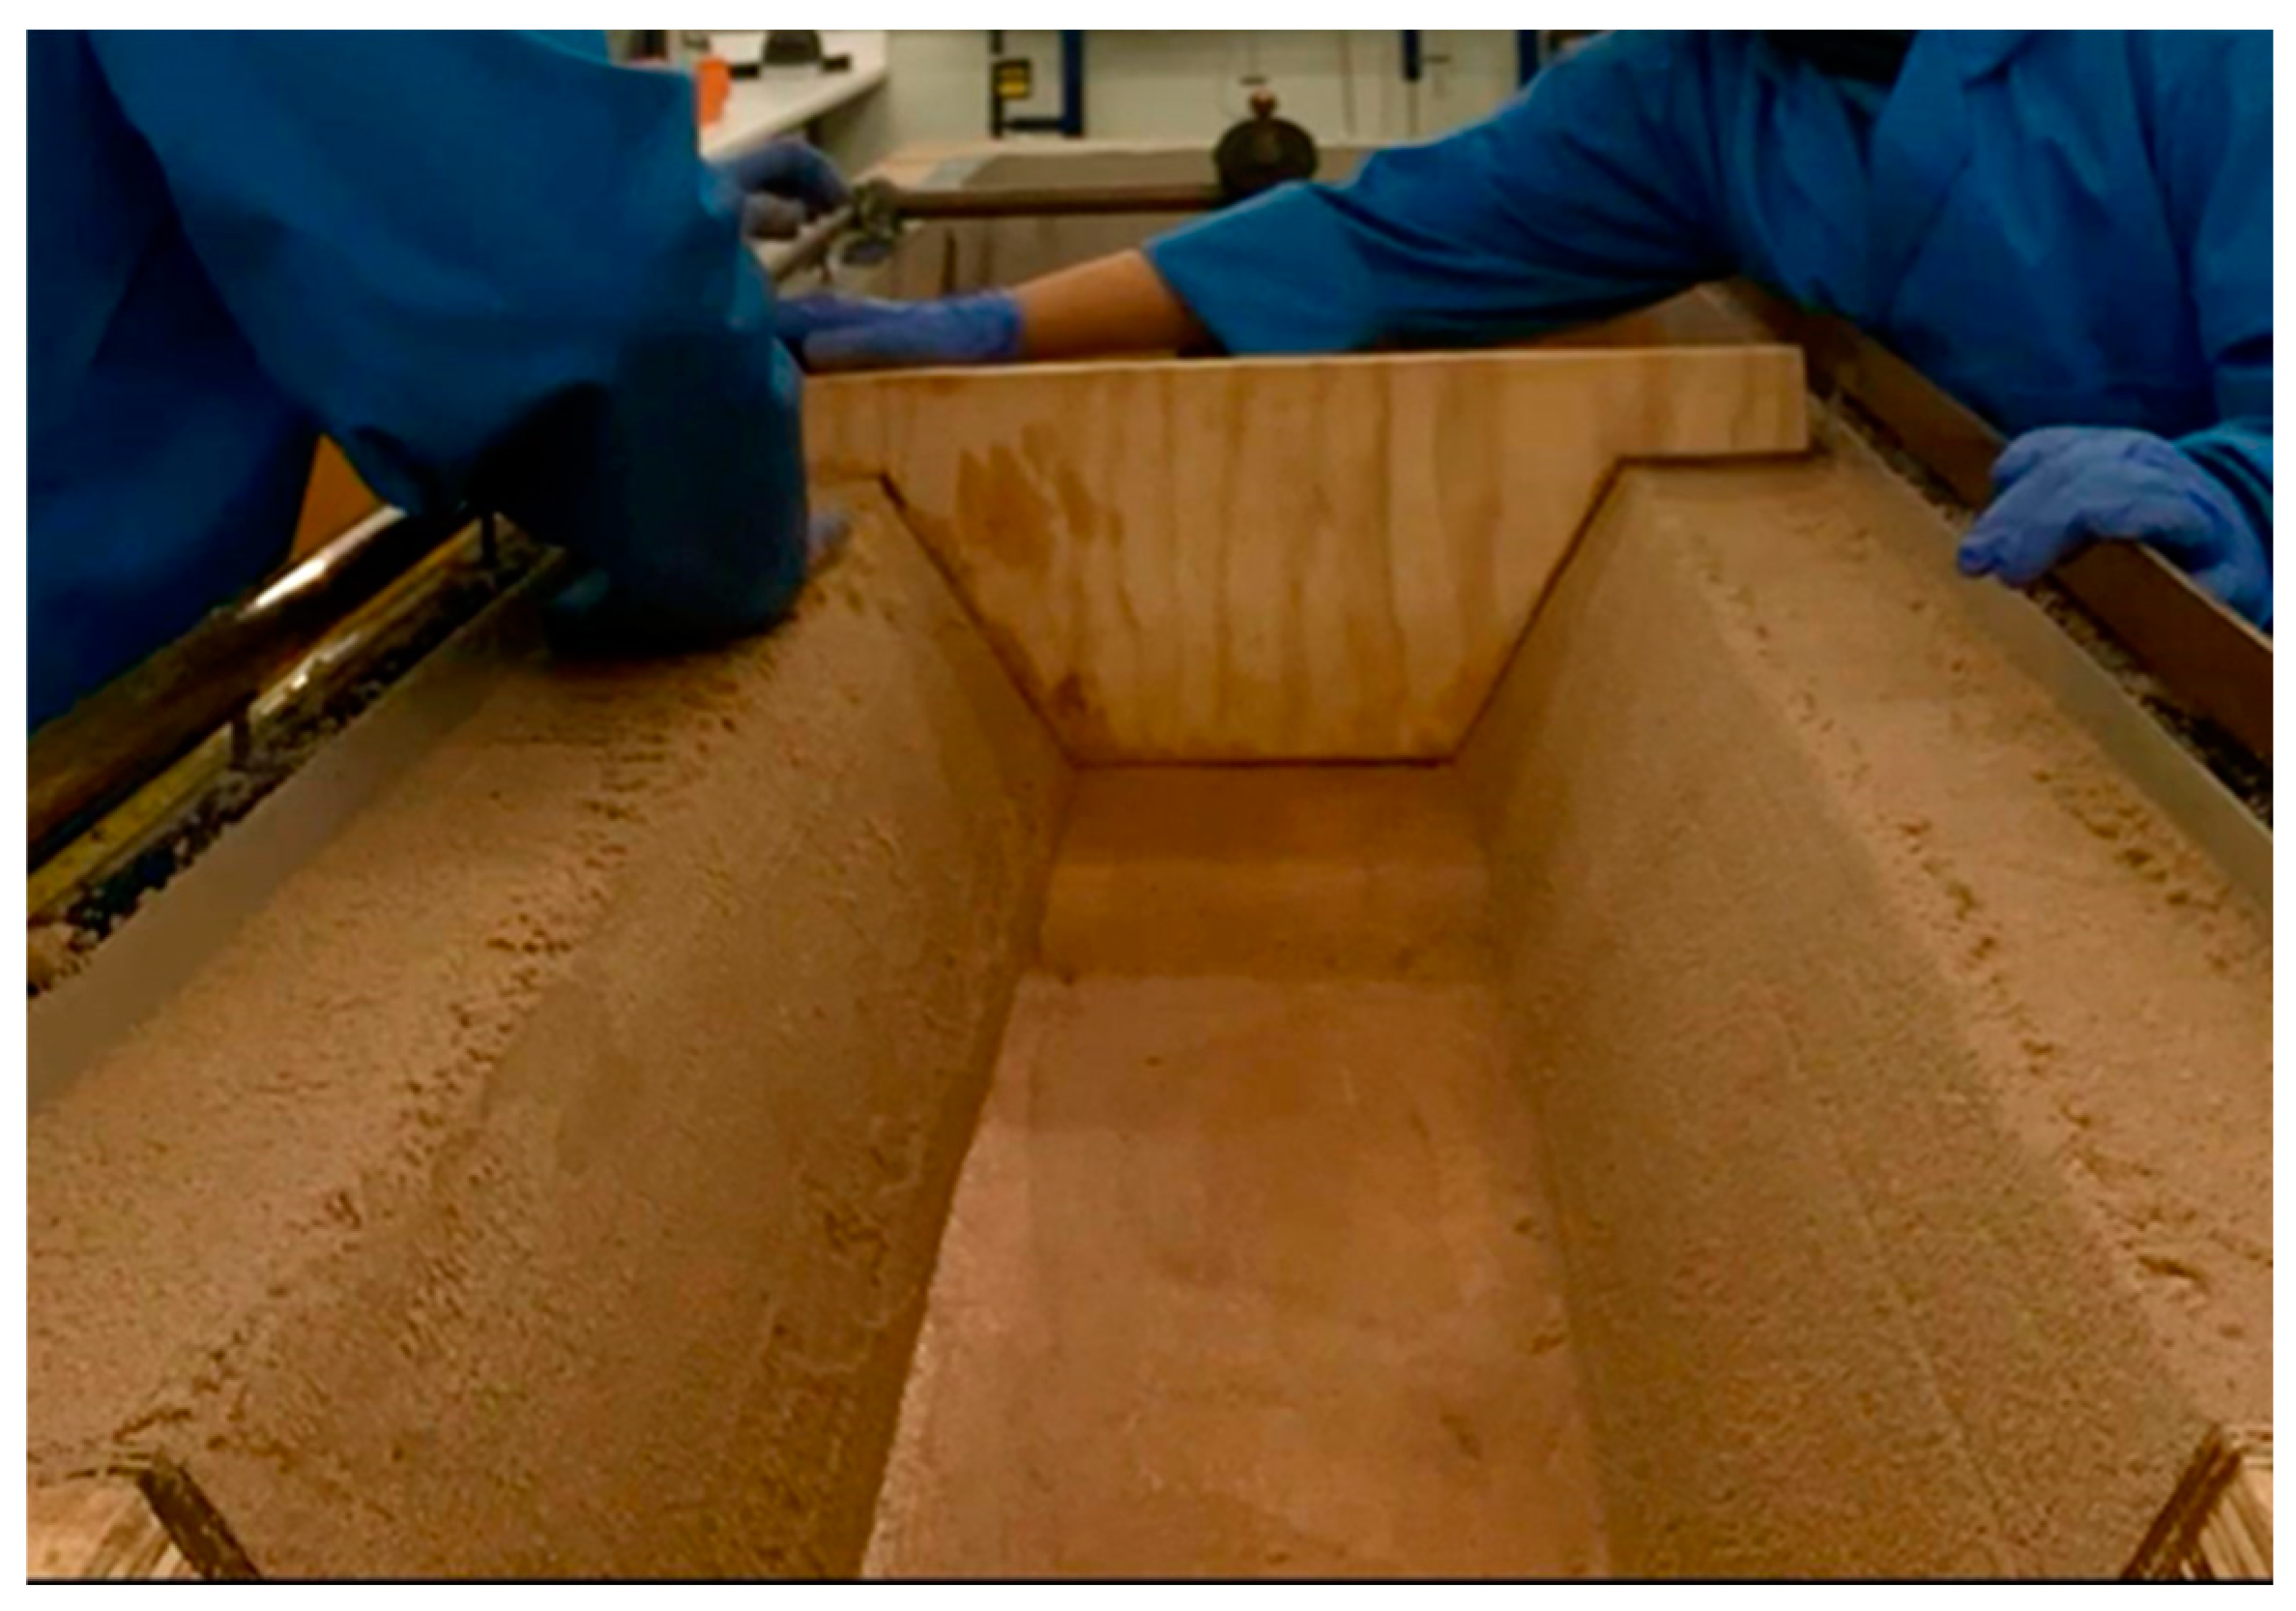
Figure 7.
Construction process of the model used for the reinforced scenarios. (a) First layer of reinforcement; (b) Mid-height layer of reinforcement and (c) Final reinforced embankment.
Figure 7.
Construction process of the model used for the reinforced scenarios. (a) First layer of reinforcement; (b) Mid-height layer of reinforcement and (c) Final reinforced embankment.
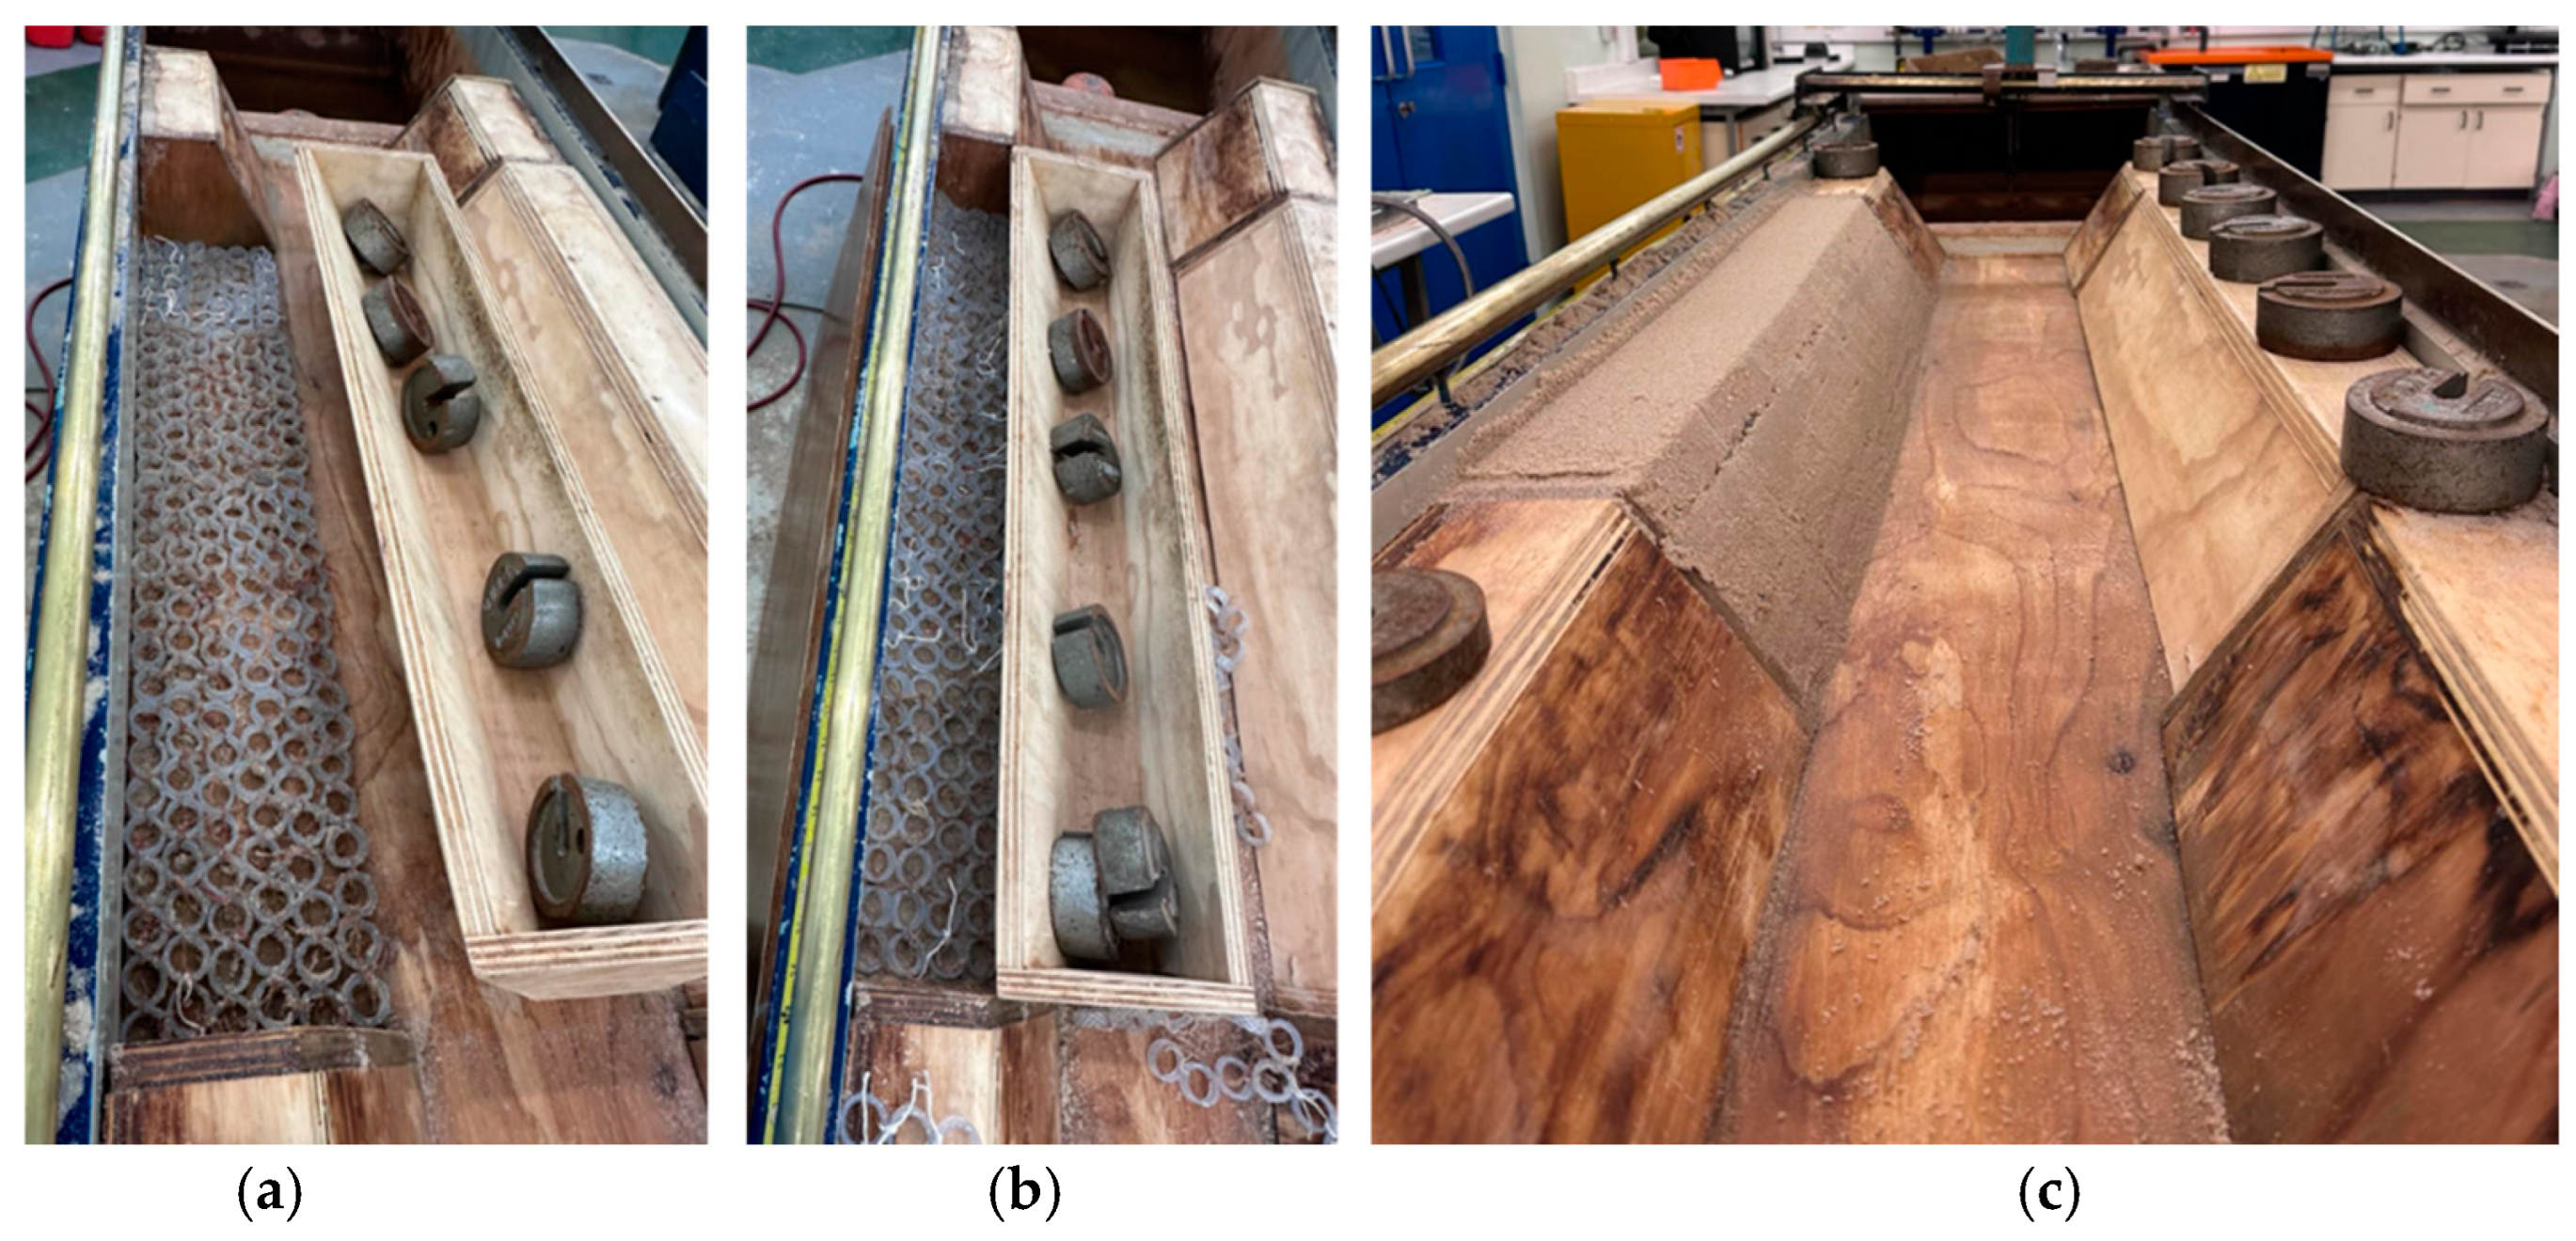
Figure 8.
Collapsed embankment using 9L/s; the arrow represents the direction of flow.
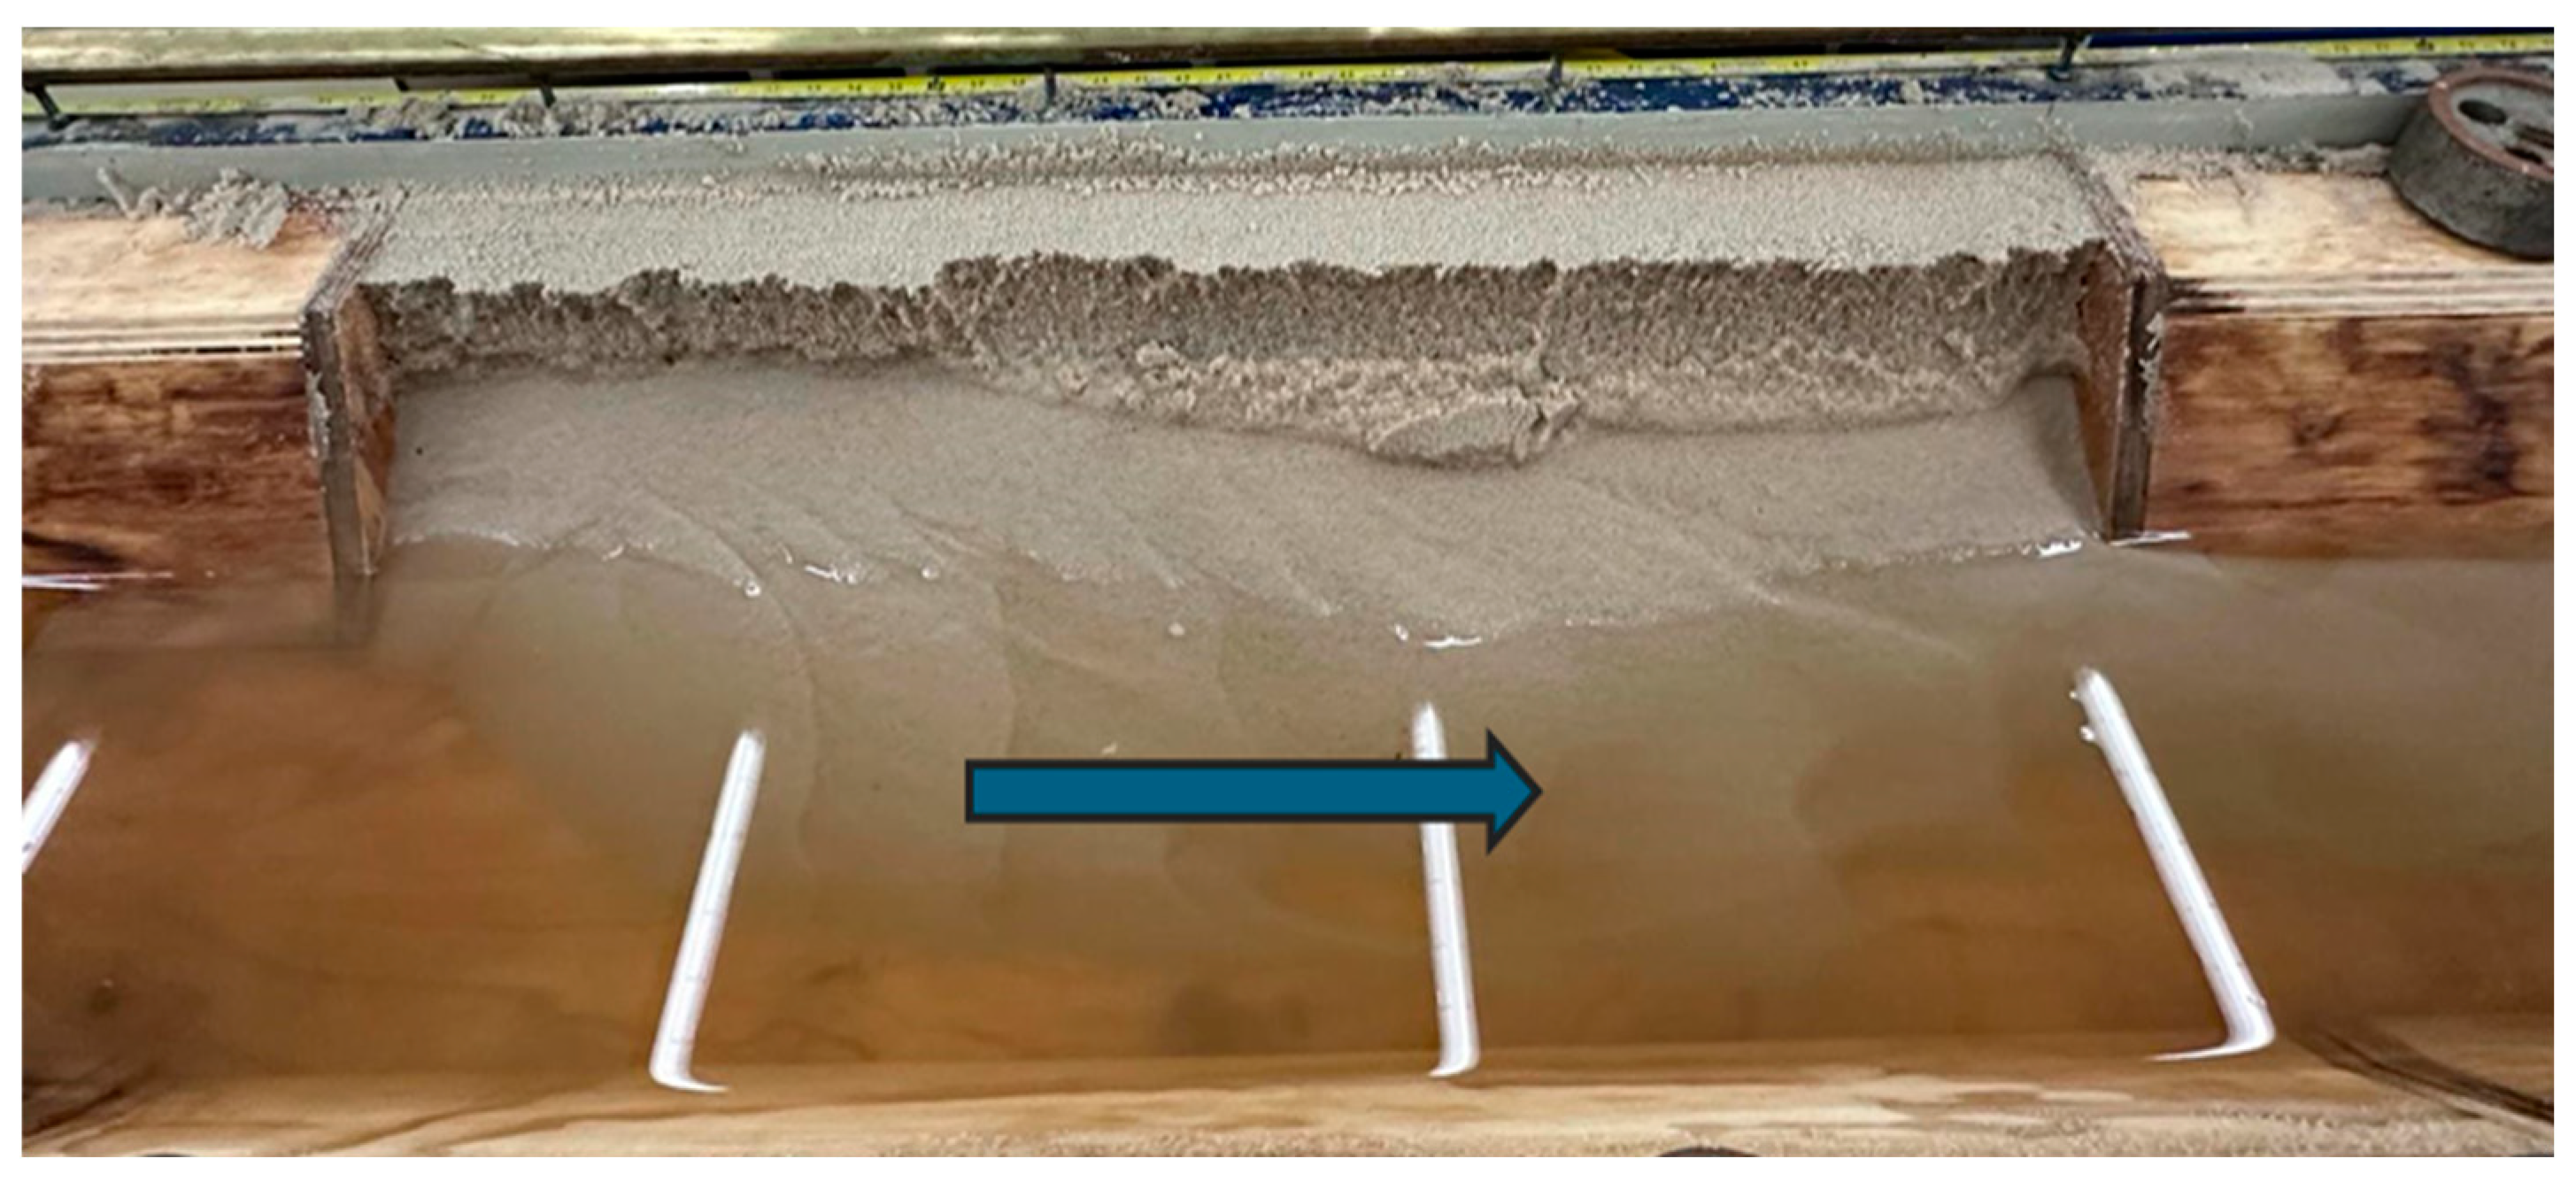
Figure 9.
Collapsed embankments using 7L/s; the arrow represents the direction of flow.
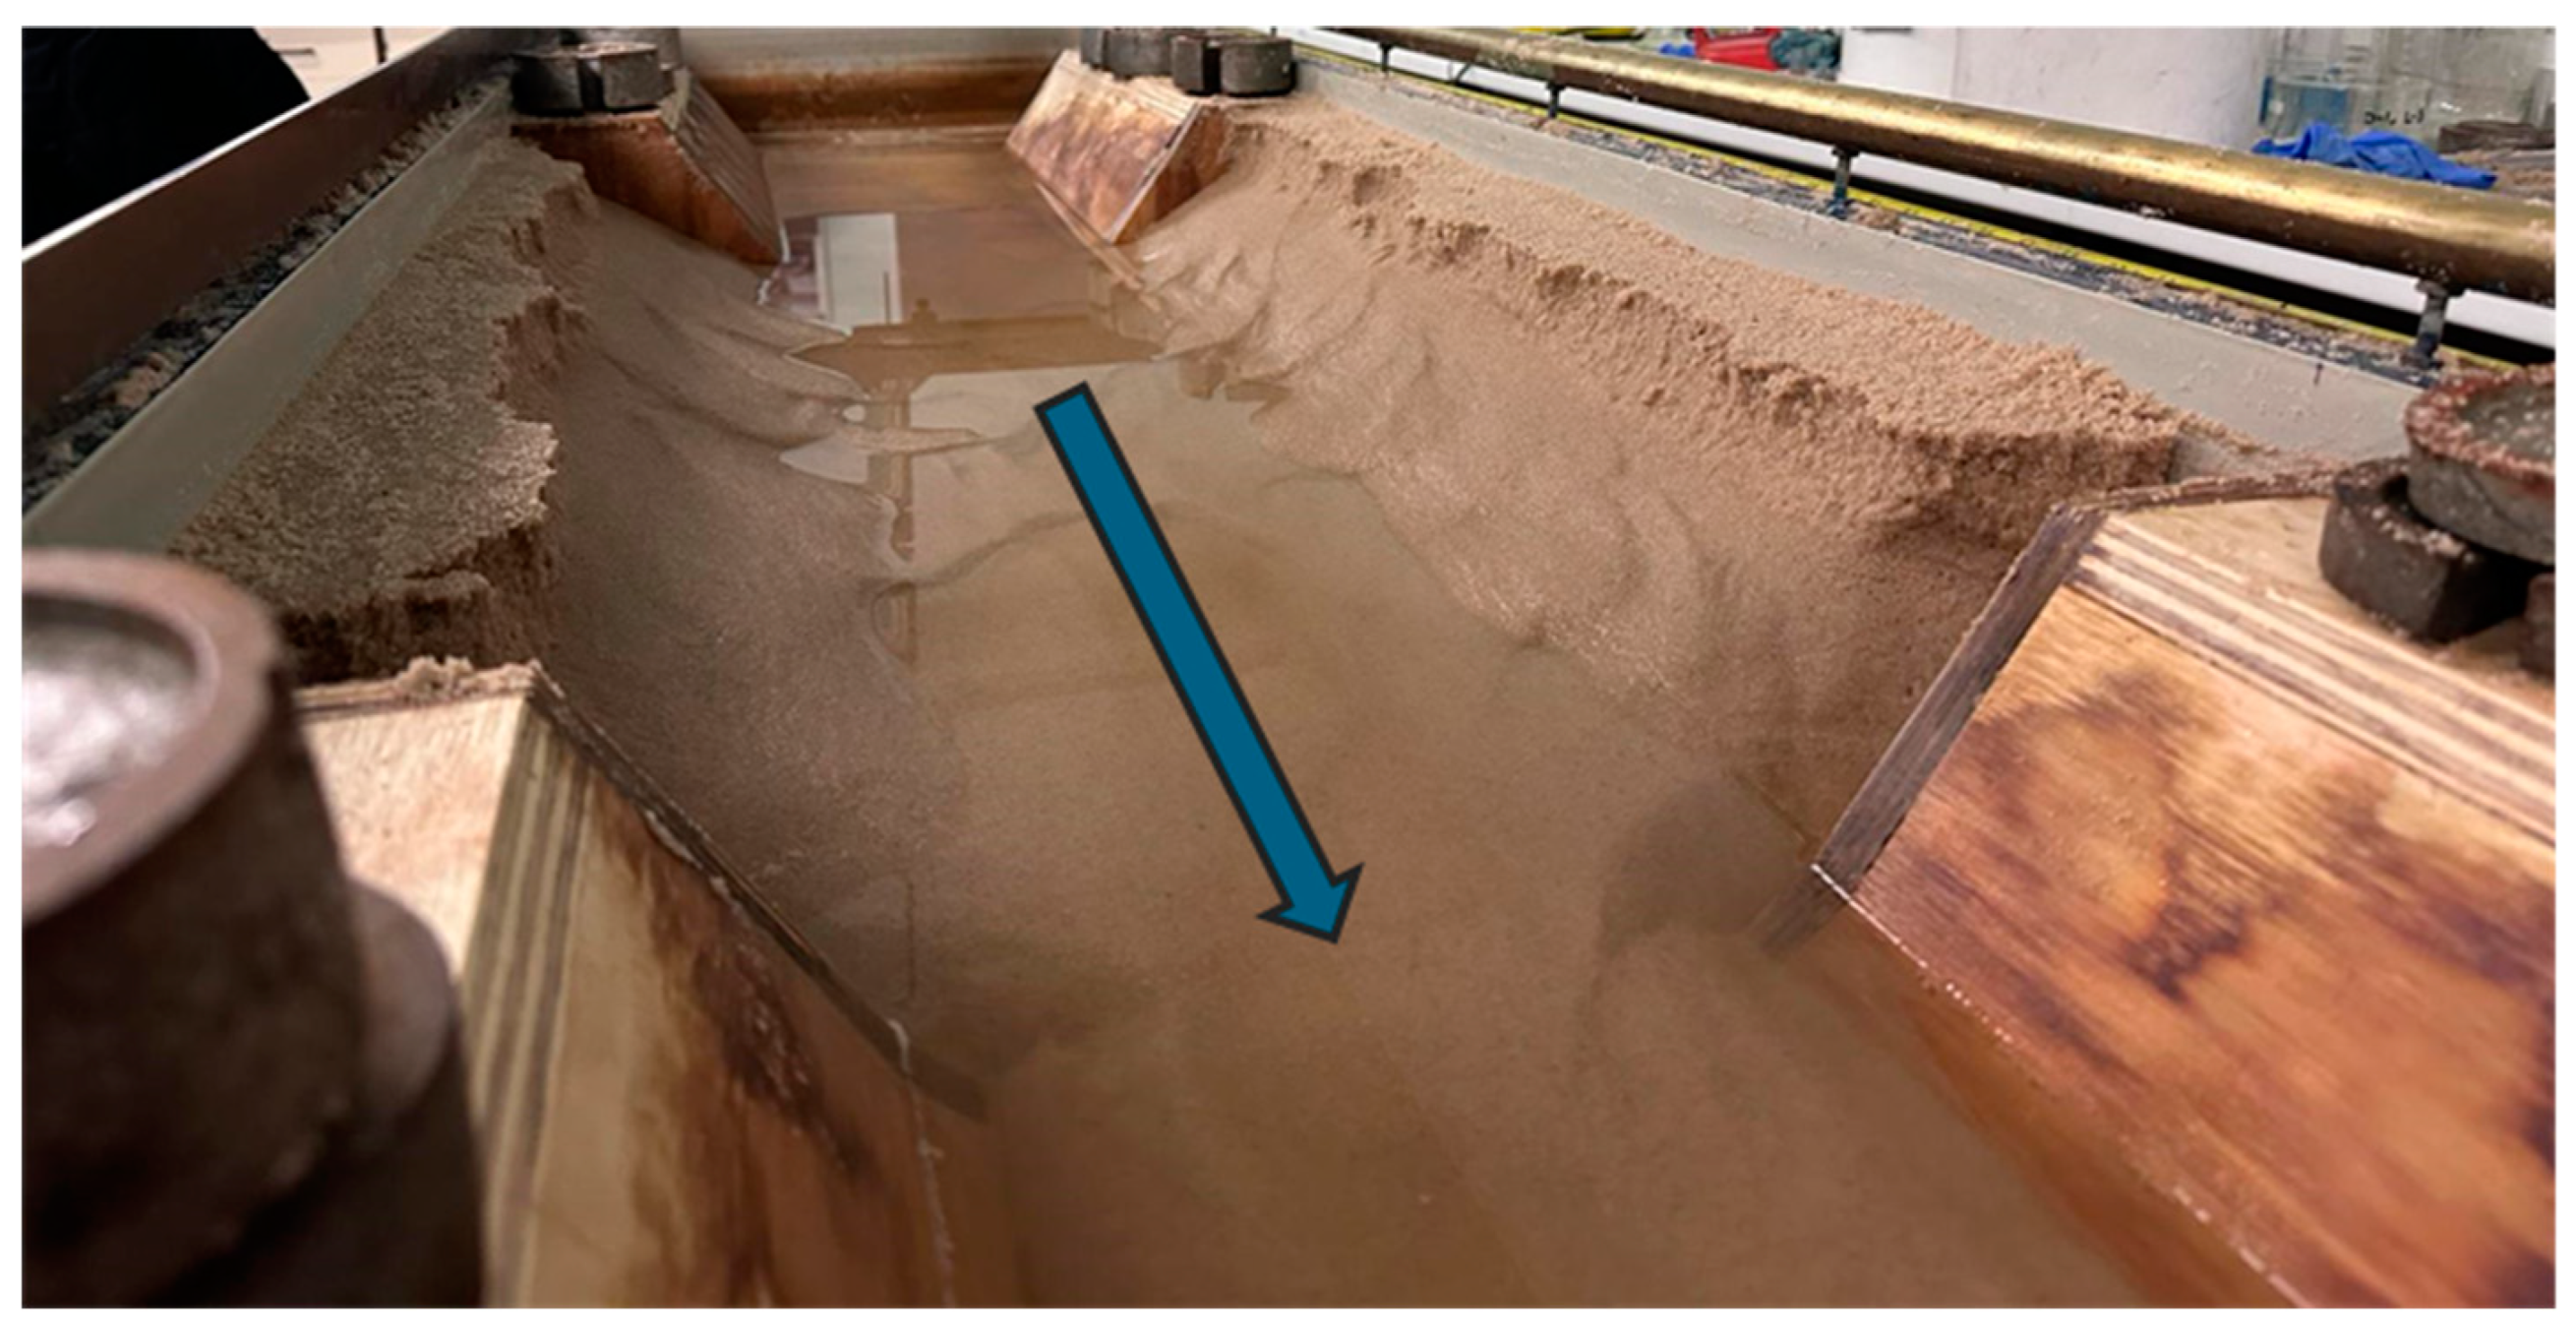
Figure 10.
Average cross-sectional variation of the collapsed embankment for 9 L/s and 7 L/s.
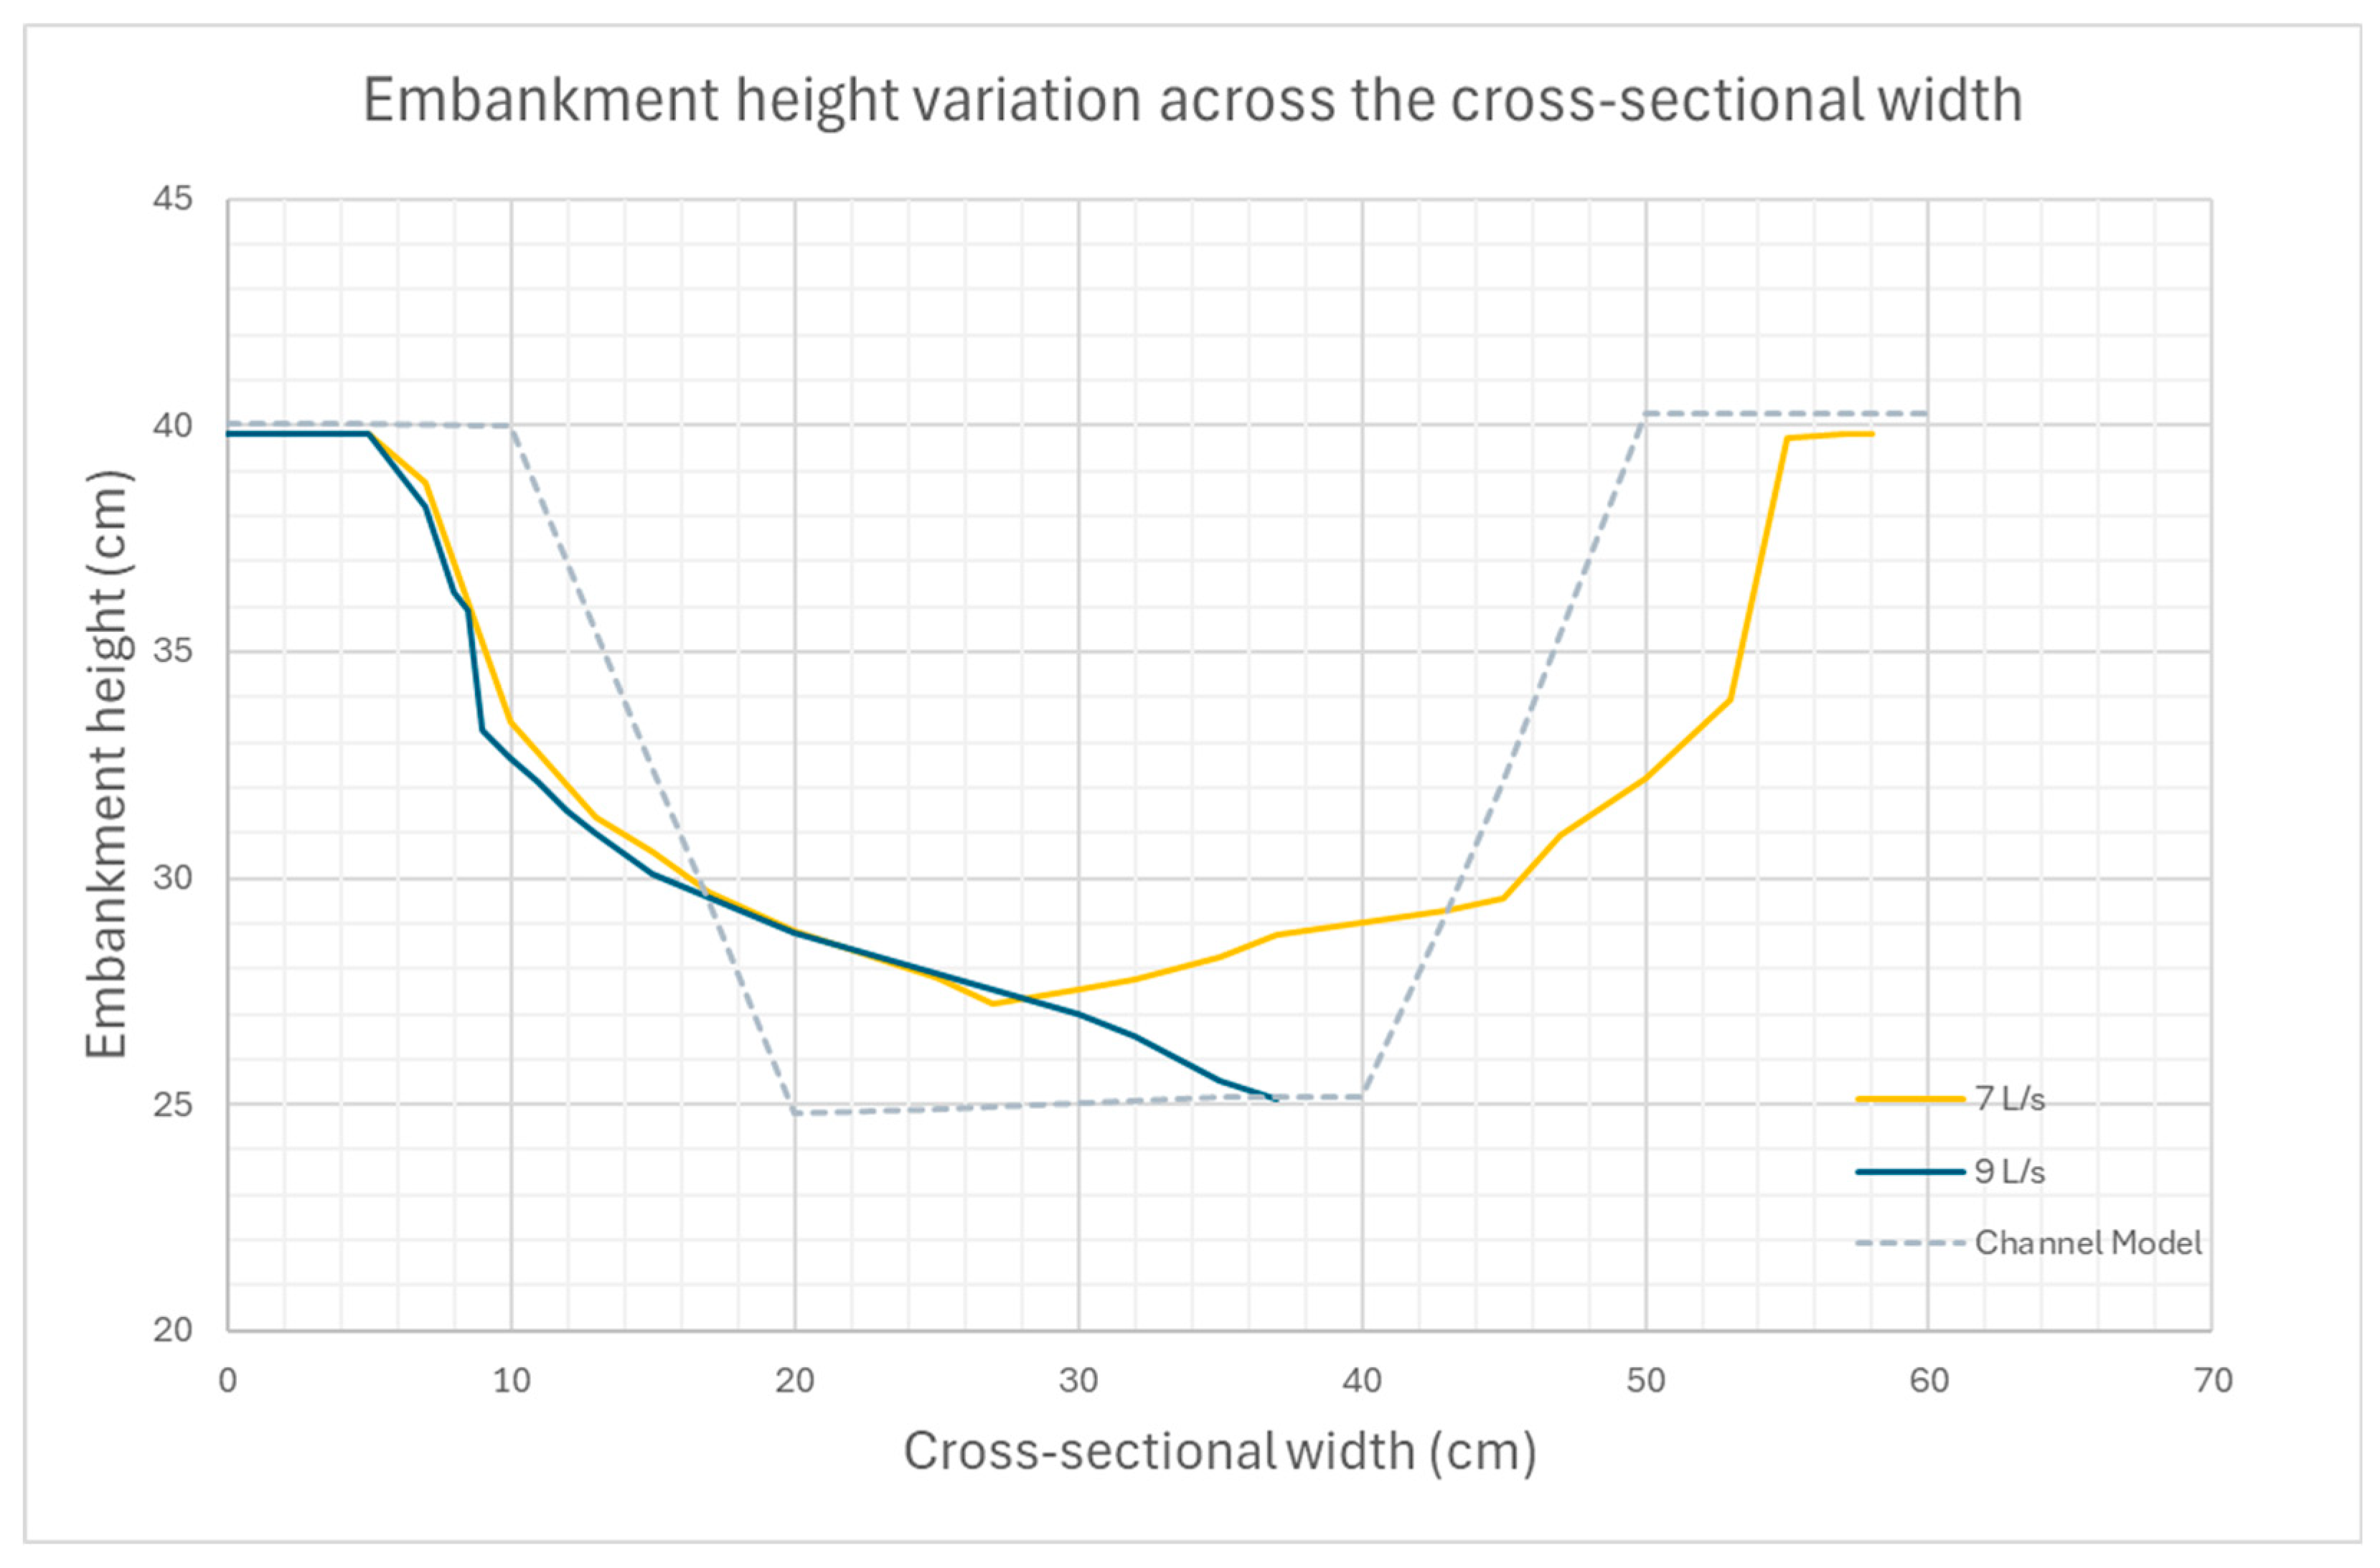
Figure 11.
Collapsed reinforced embankment at 9L/s. A tensile crack on the top surface of the embankment is visible inside the red outlined box; the arrow represents the direction of flow.
Figure 11.
Collapsed reinforced embankment at 9L/s. A tensile crack on the top surface of the embankment is visible inside the red outlined box; the arrow represents the direction of flow.
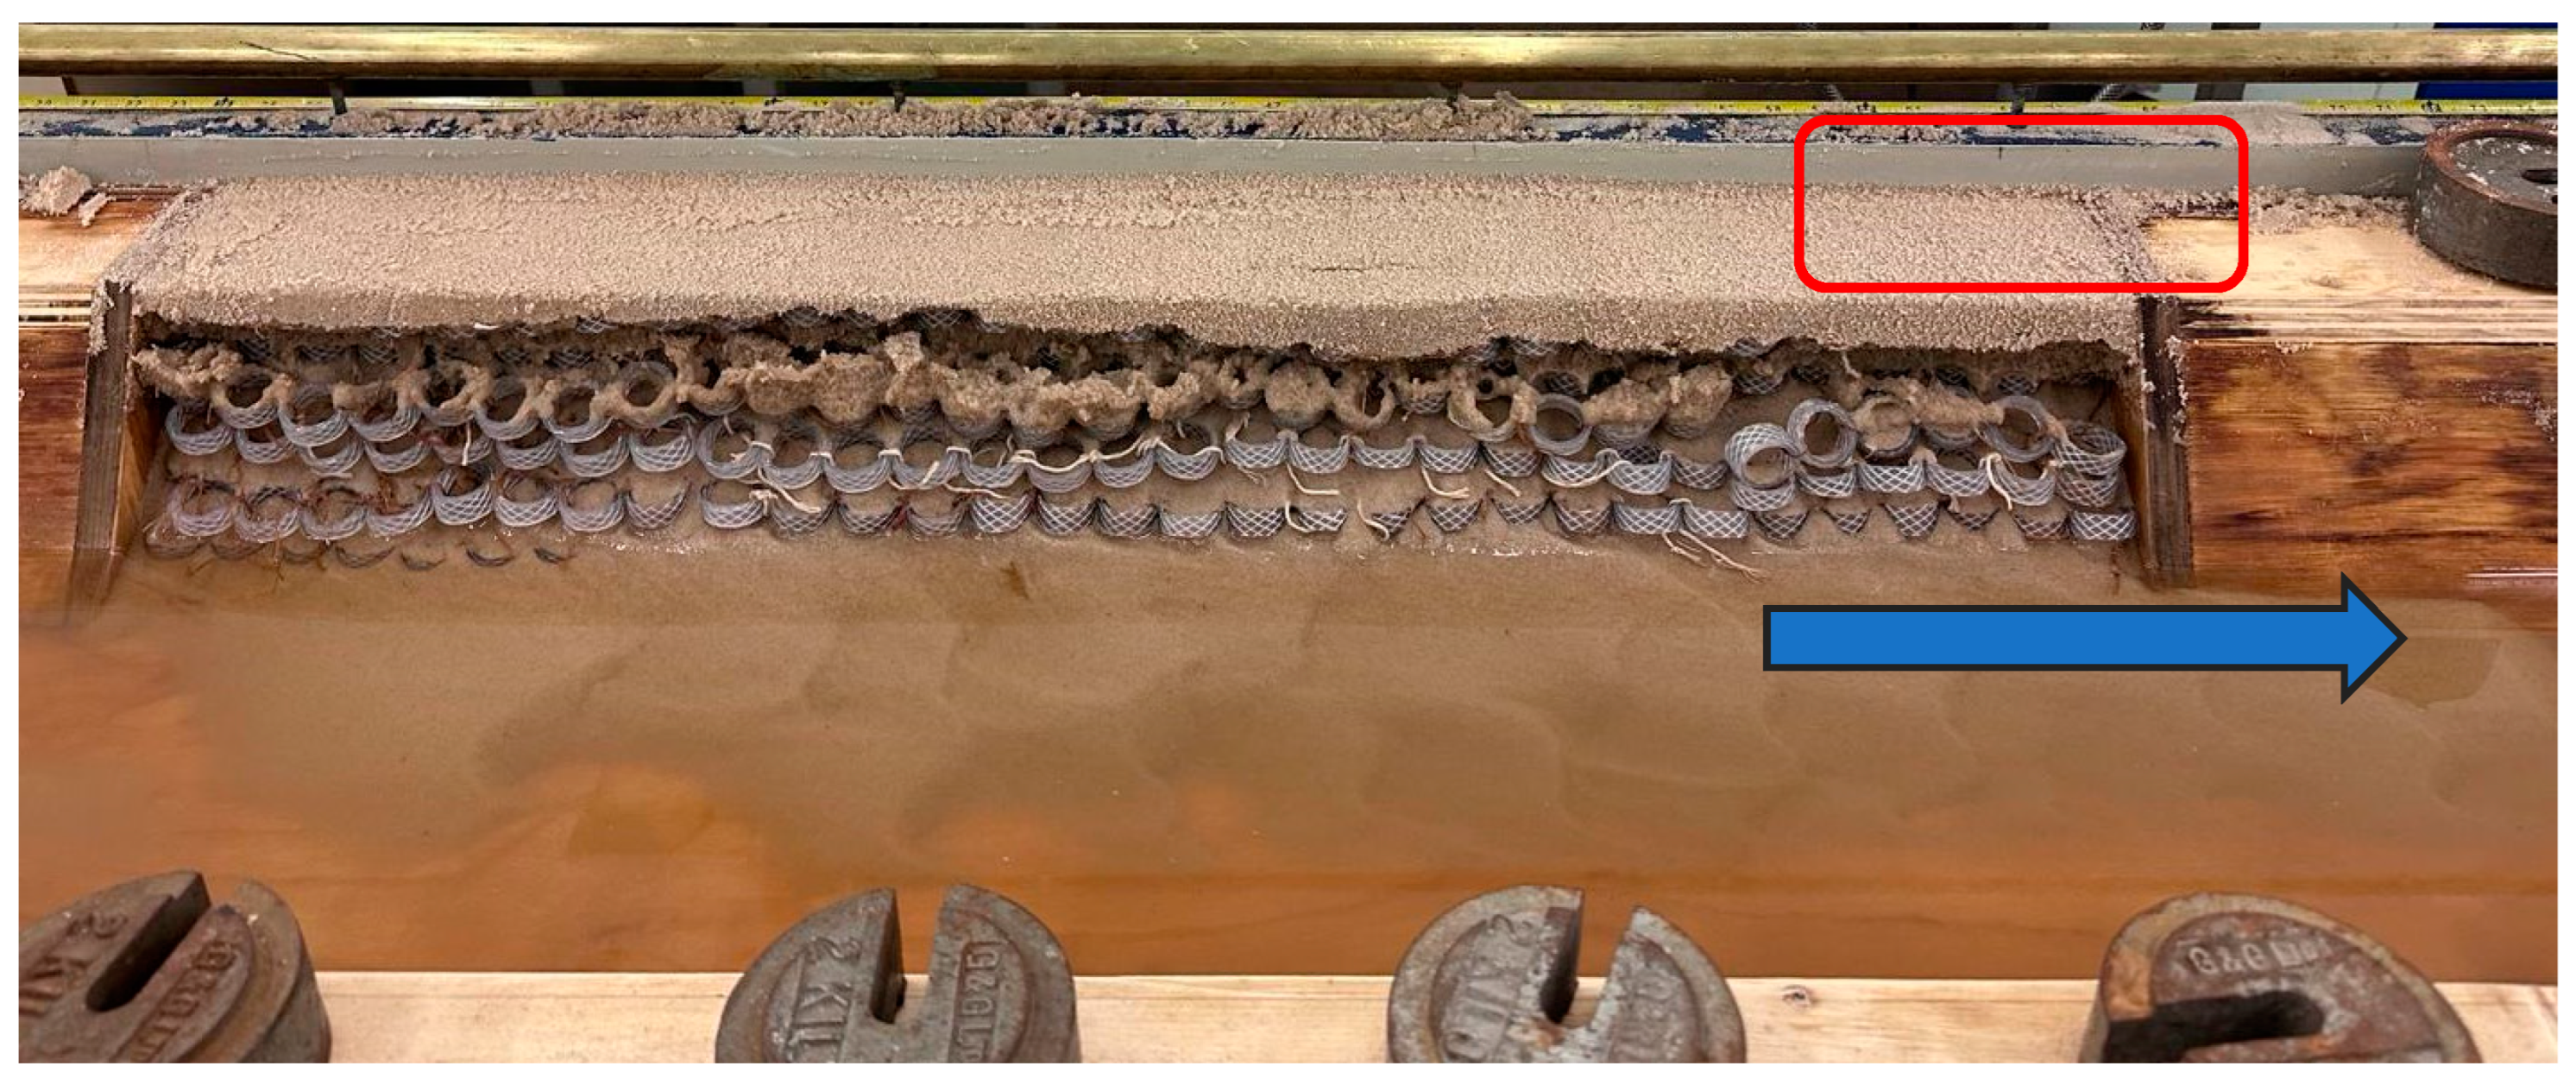
Figure 12.
Collapsed reinforced embankment at 7L/s; the arrow represents the direction of the flow.
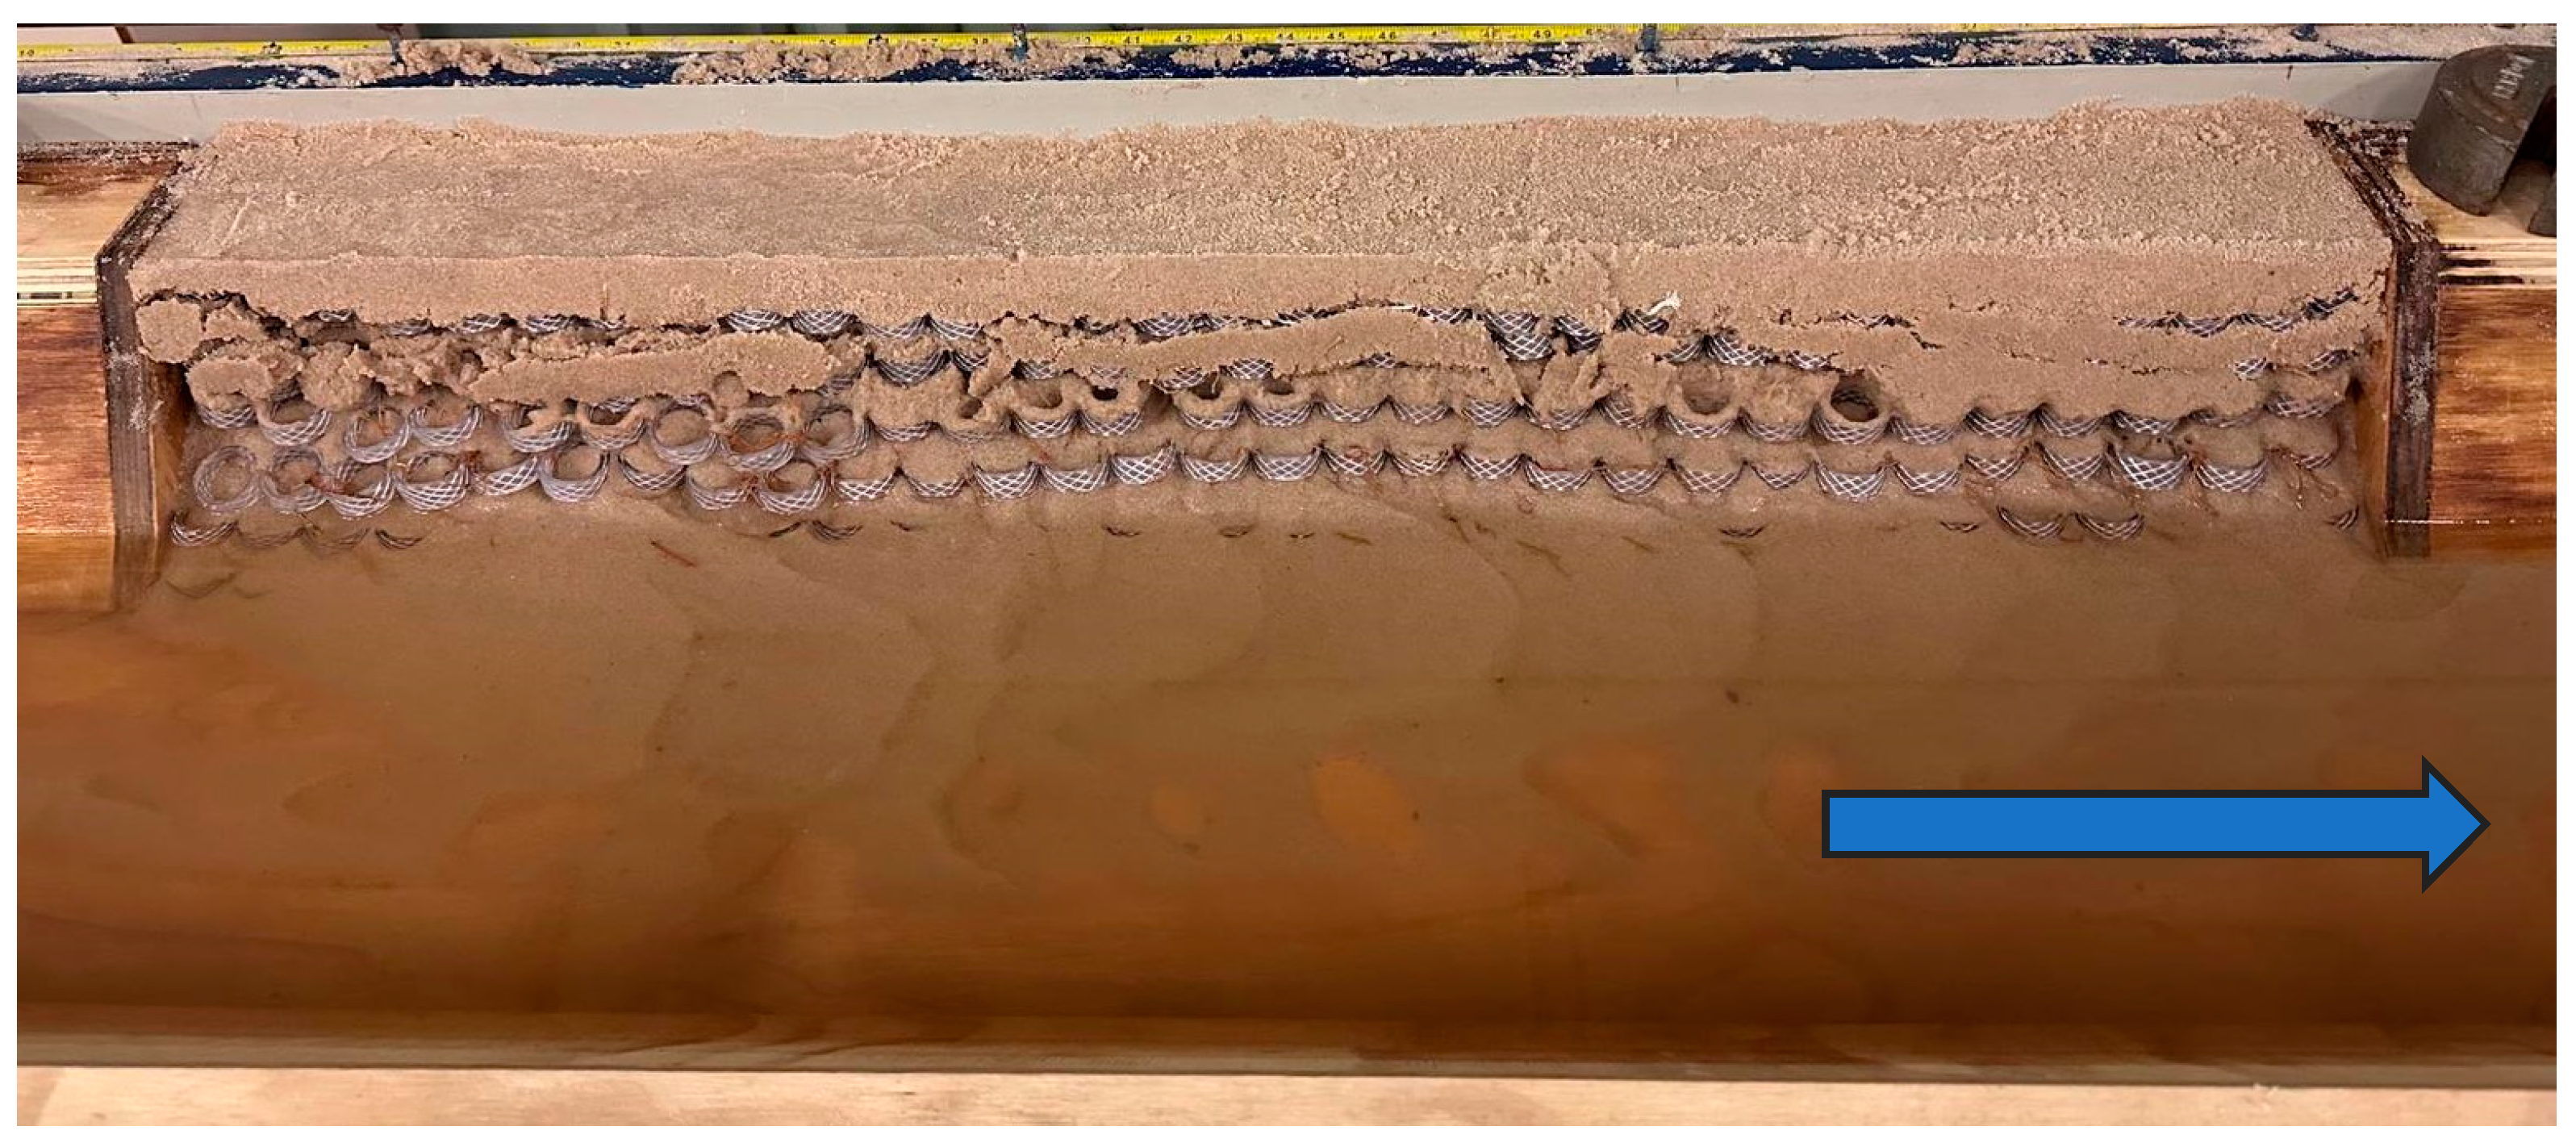
Figure 13.
Deposition (dashed arrow) and erosion (solid arrow) of sediments in the reinforcement for (a) 9 L/s and (b) 7 L/s.
Figure 13.
Deposition (dashed arrow) and erosion (solid arrow) of sediments in the reinforcement for (a) 9 L/s and (b) 7 L/s.
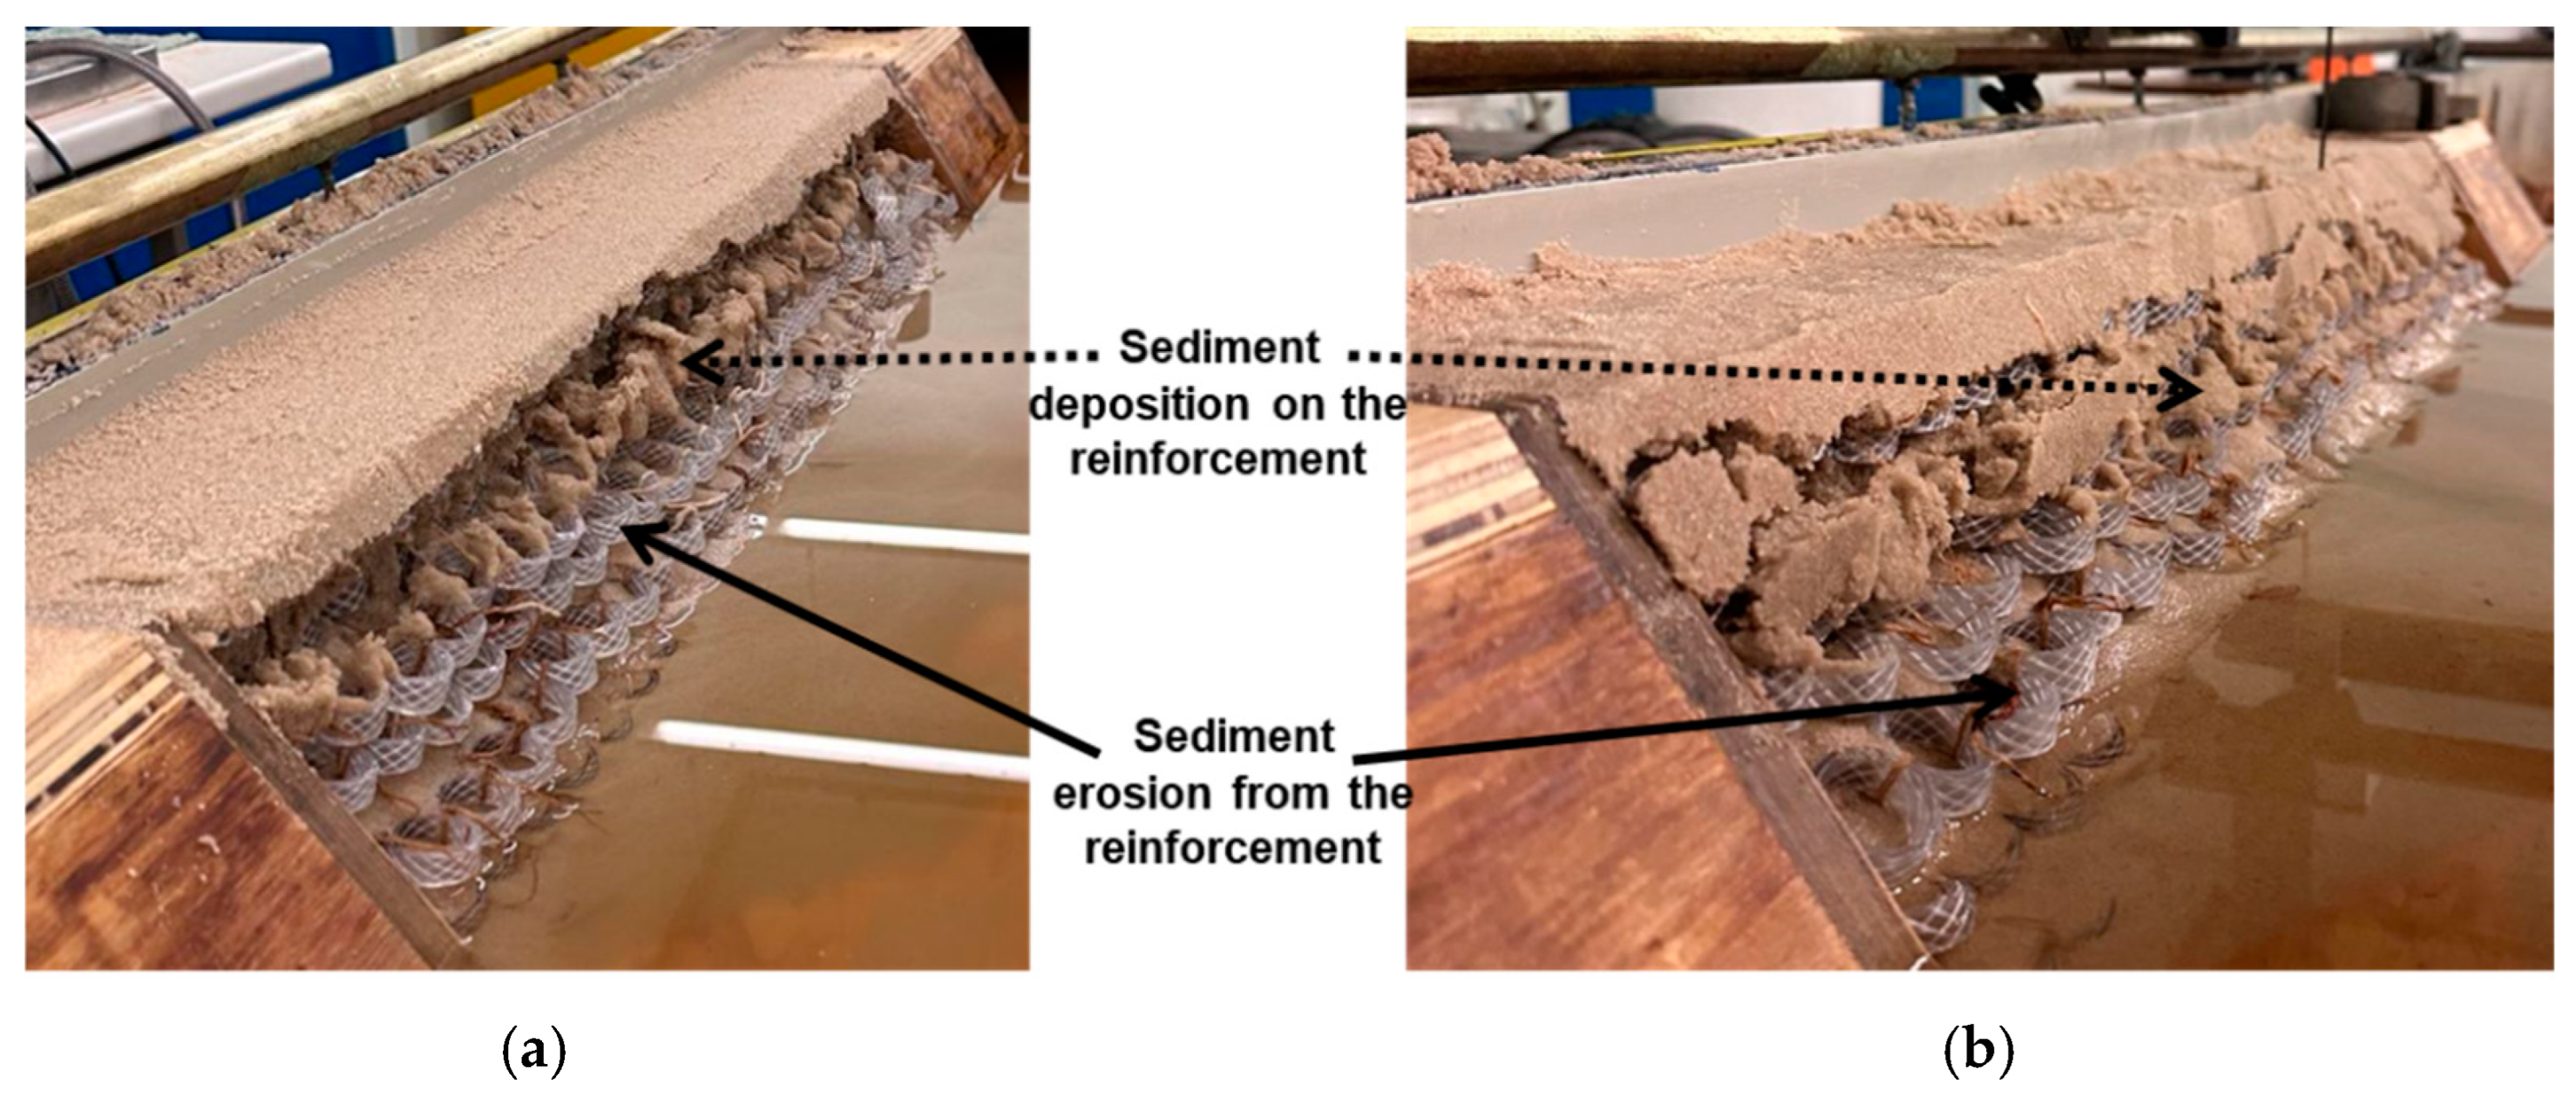
Figure 14.
Cross-sectional variation of the collapsed reinforced embankment for 9 L/s and 7 L/s.
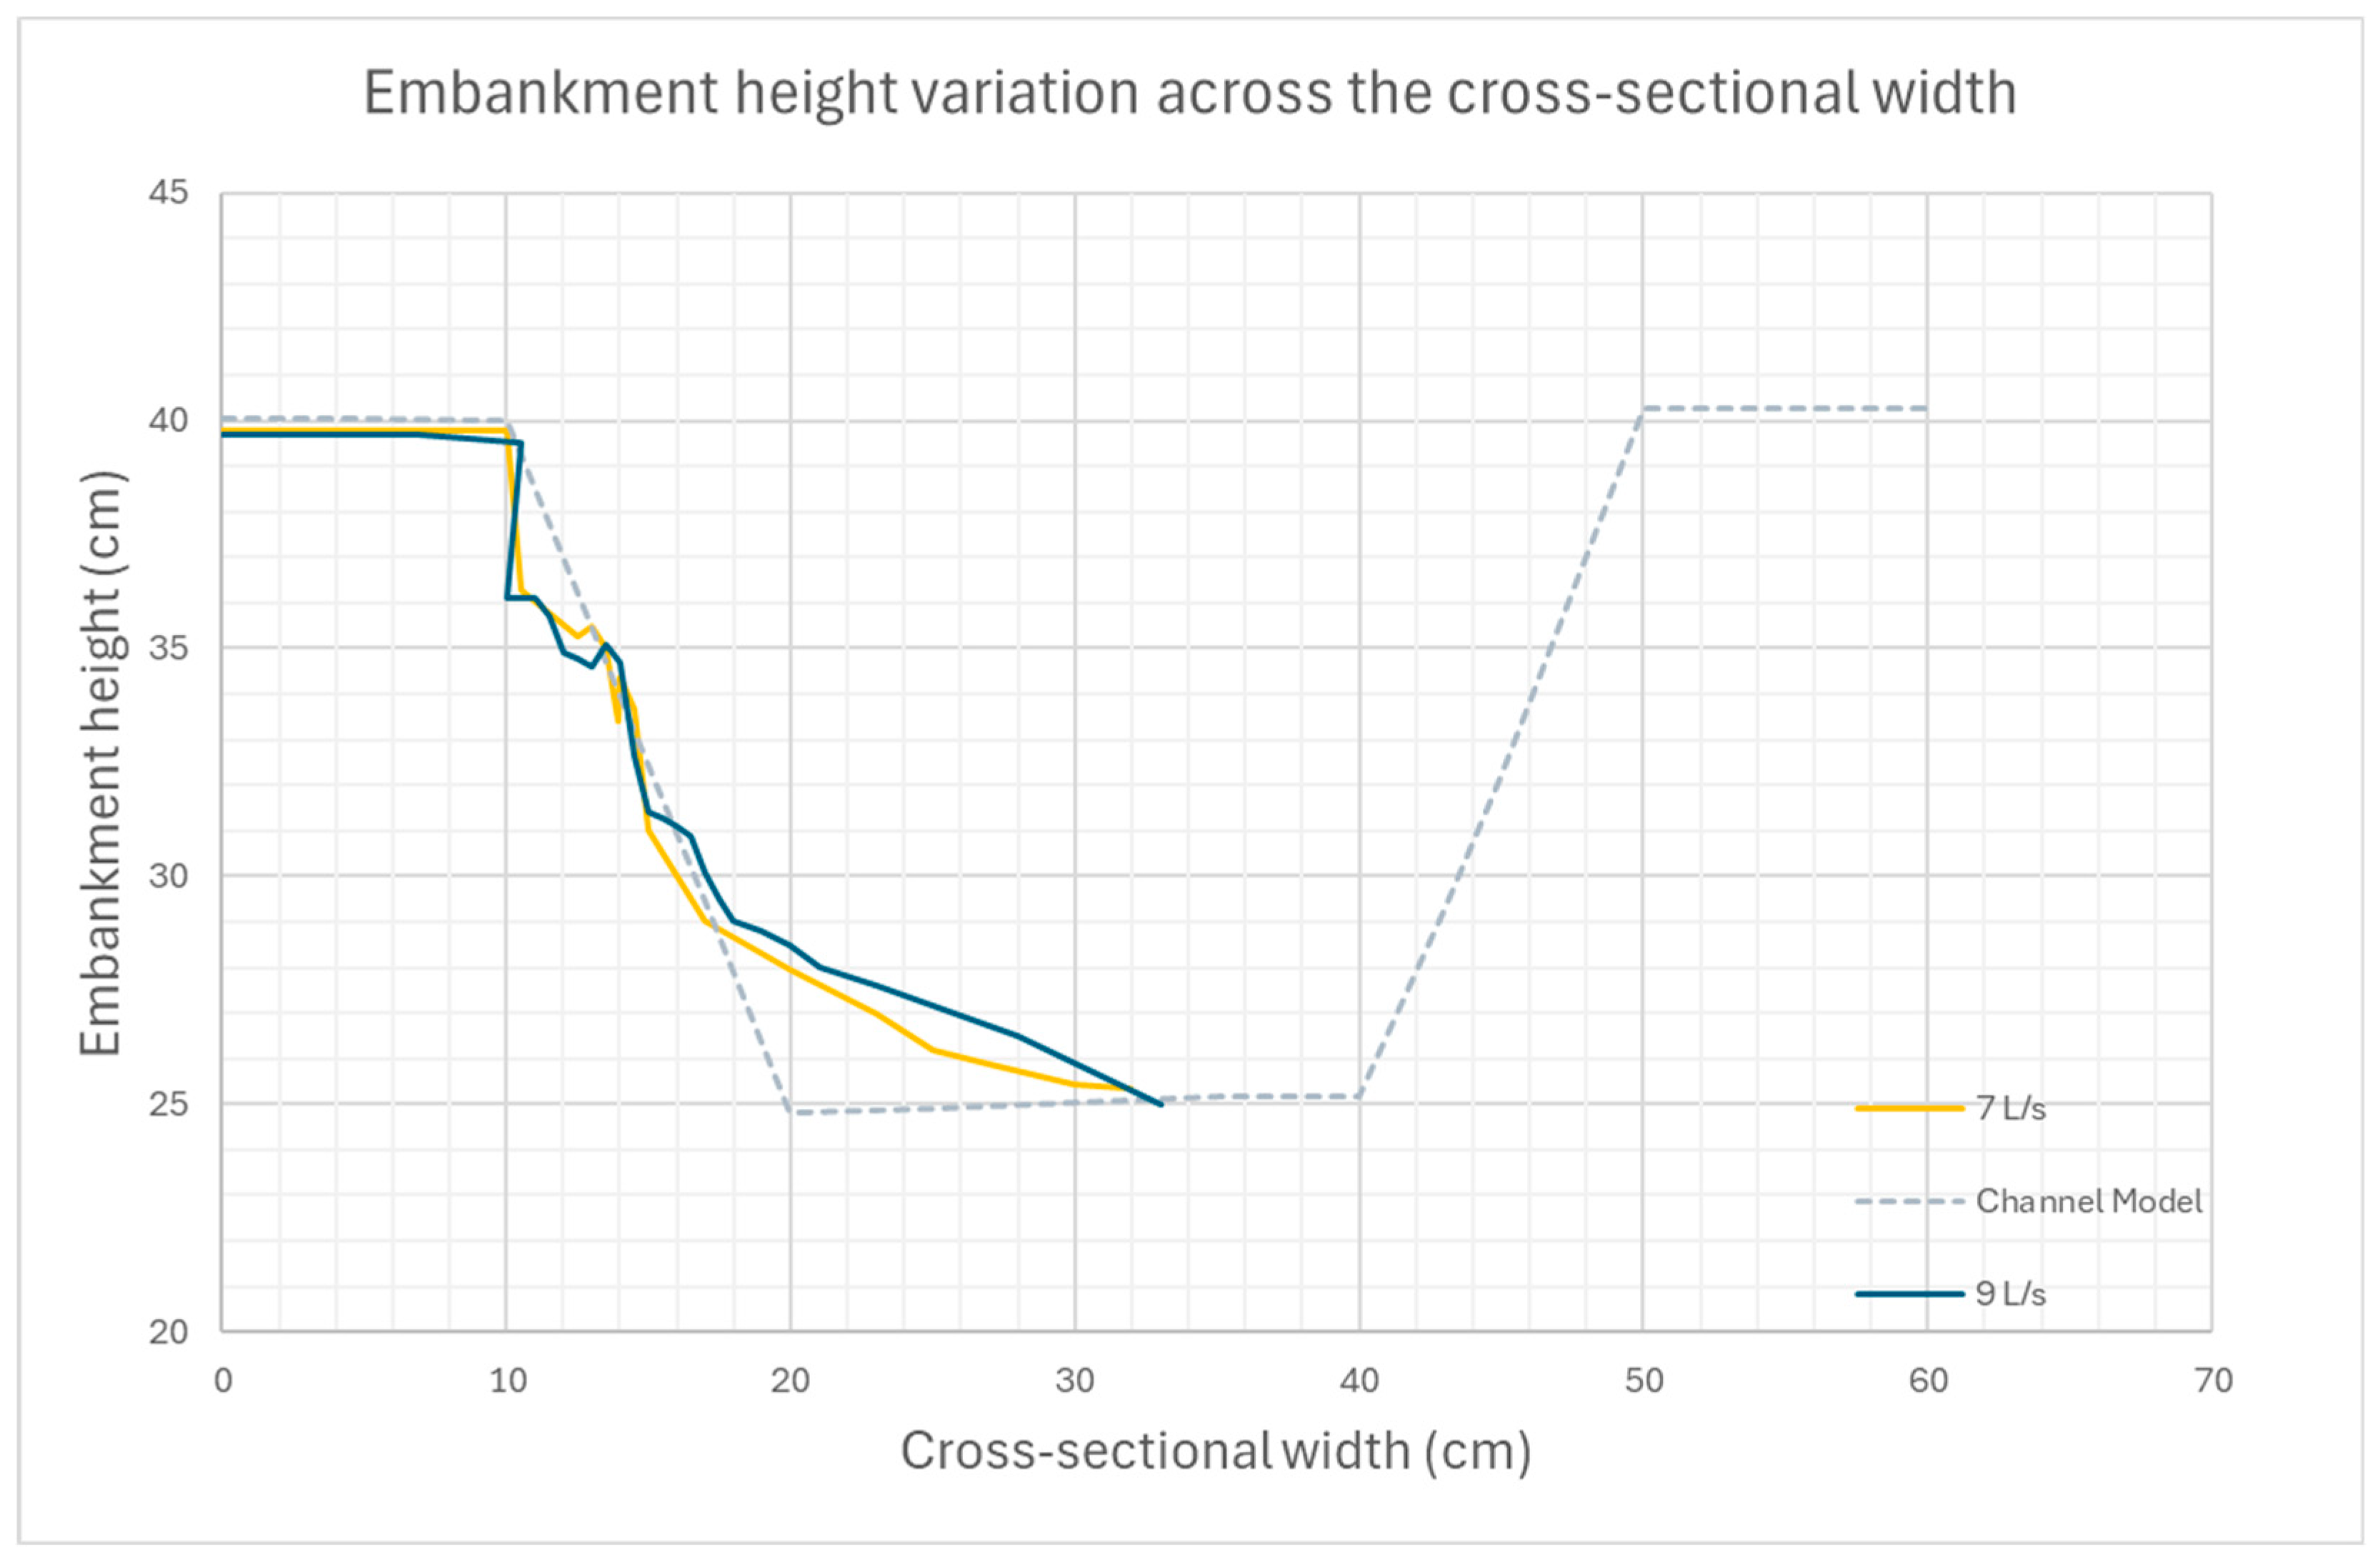
Figure 15.
Cross-sectional variation of the collapsed embankment for the steady flow simulations for non-reinforced and reinforced scenarios.
Figure 15.
Cross-sectional variation of the collapsed embankment for the steady flow simulations for non-reinforced and reinforced scenarios.
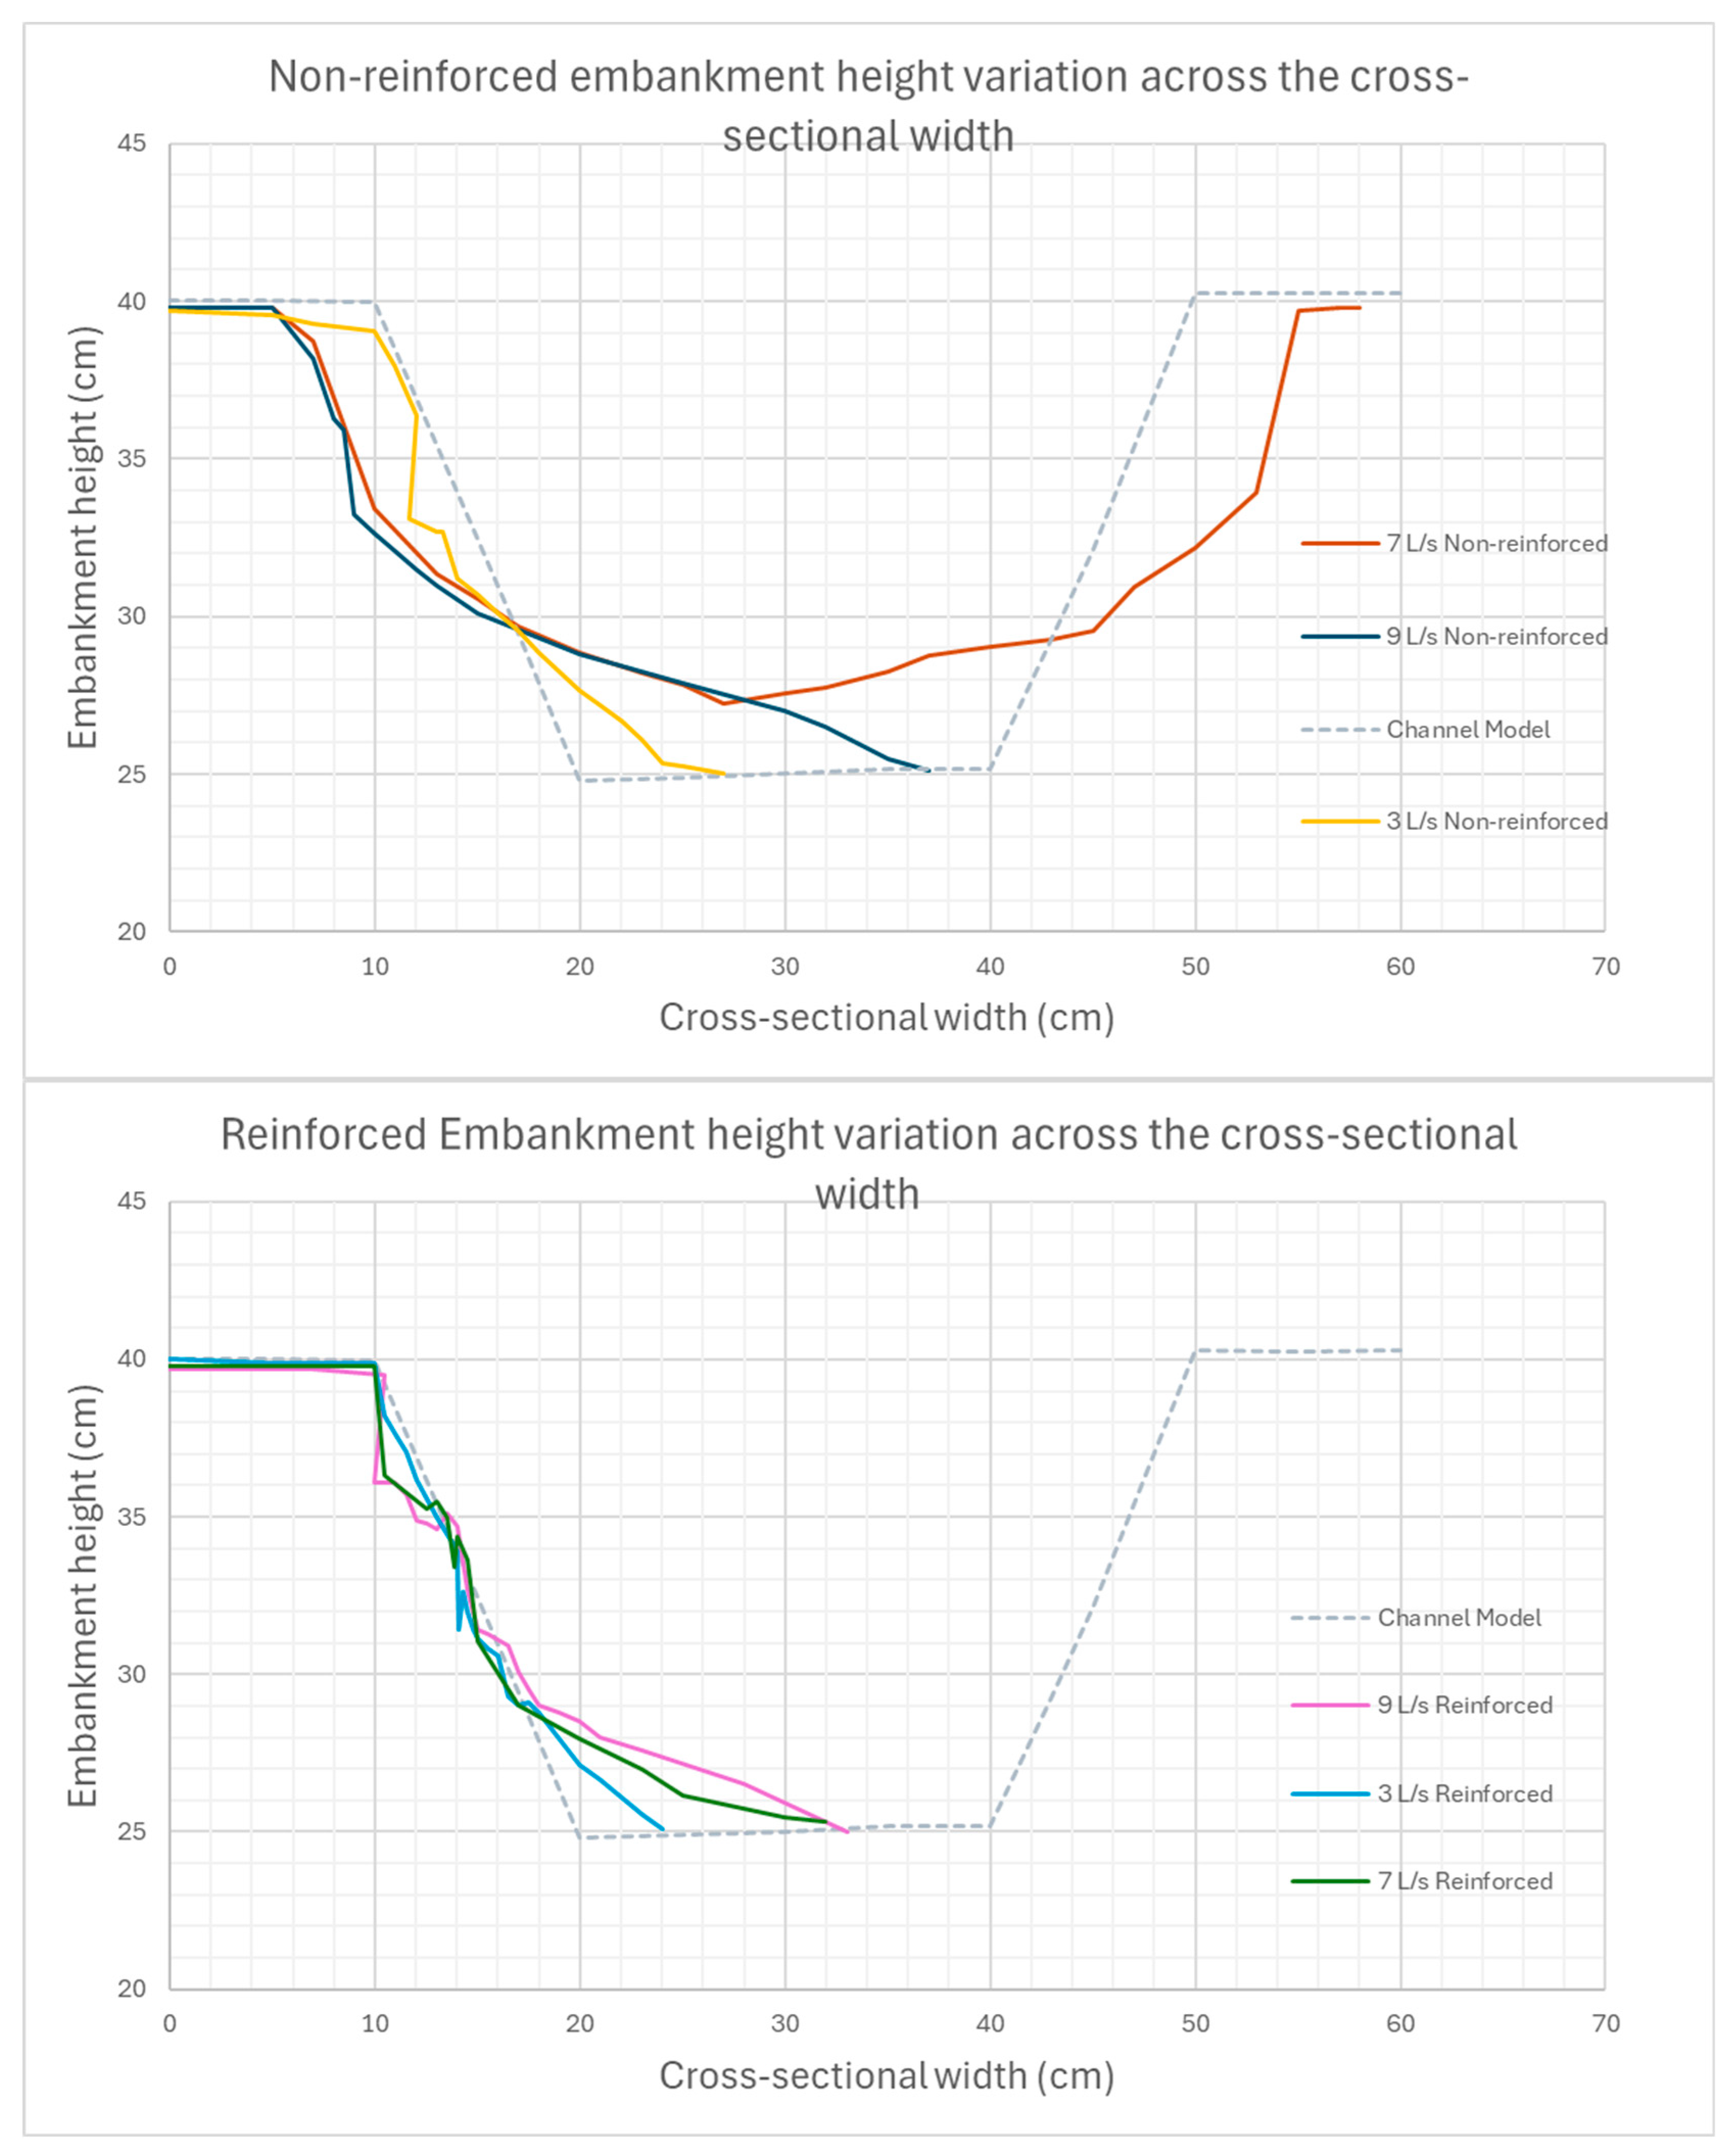
Figure 16.
Graph illustrating the dissipated volume estimated as the flow rate increases.
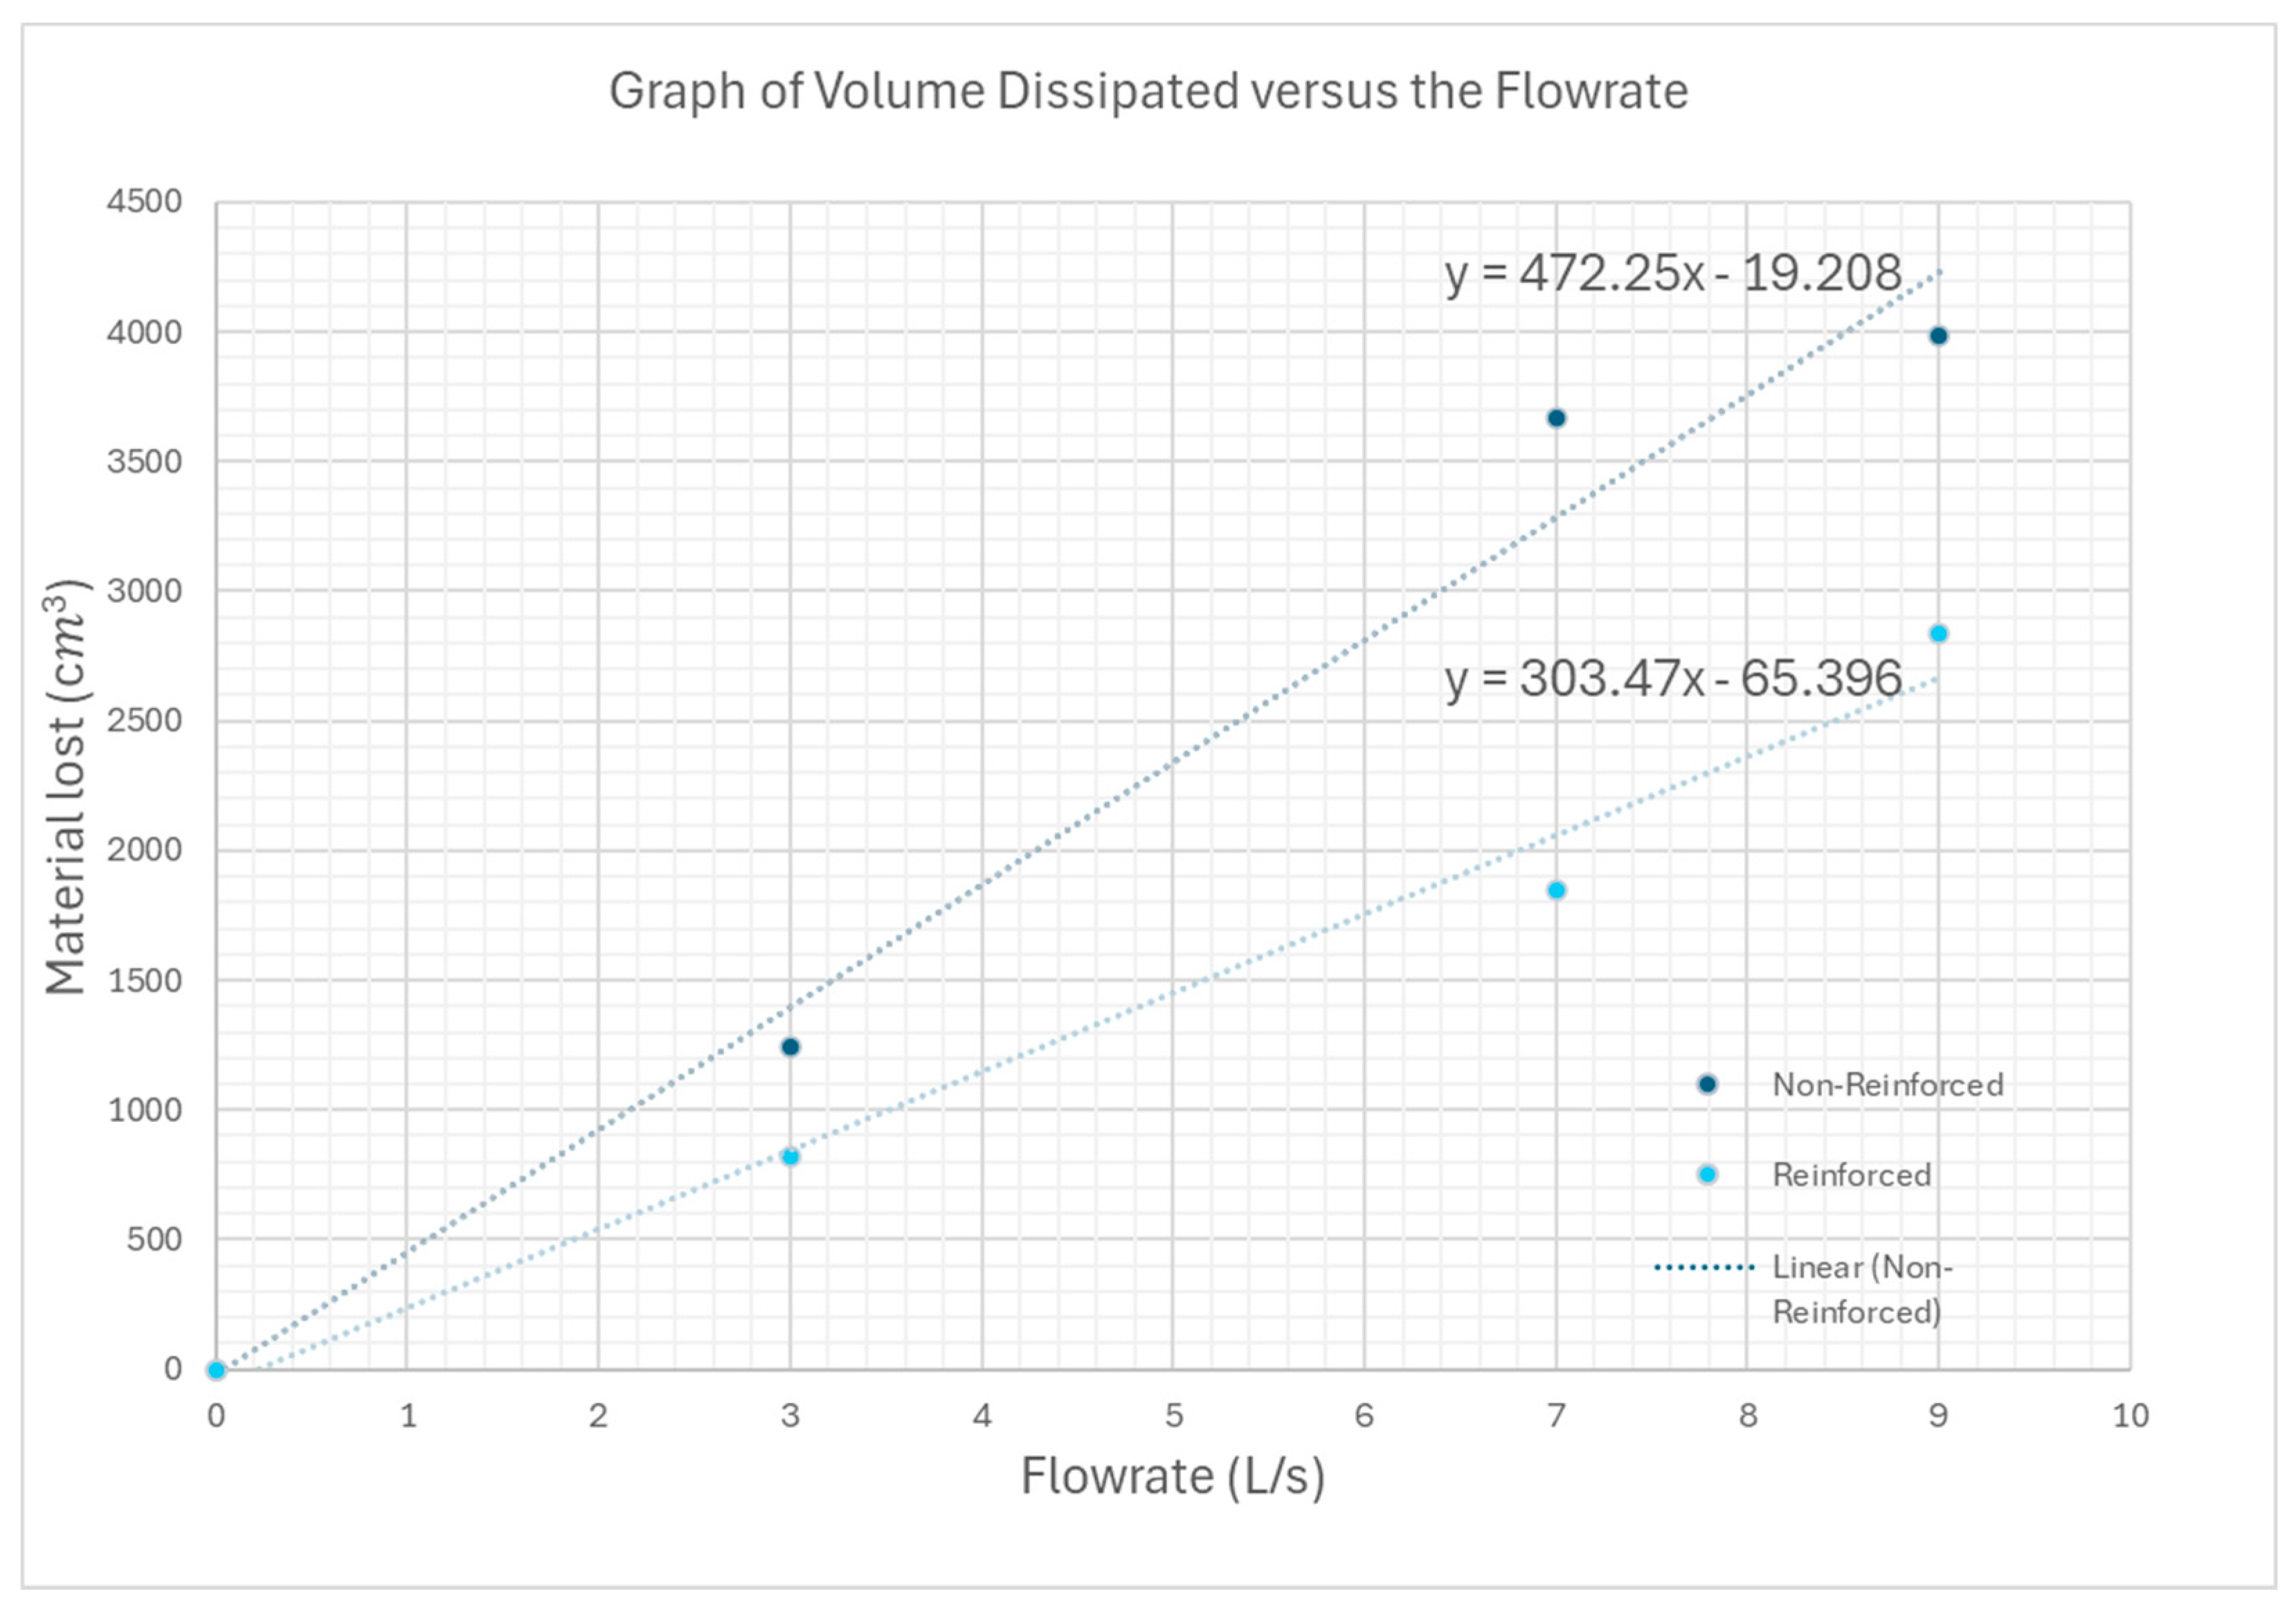

Table 1.
Flow rate scaling for a scale of 1:50.
| Scale: 1:50 | ||
|---|---|---|
| Model | Prototype | |
| Flowrate (l/s) | Flow rate (m3/s) | Flow rate (m3/s) |
| 1 | 0.001 | 17.7 |
| 2 | 0.002 | 35.4 |
| 3 | 0.003 | 53.0 |
| 4 | 0.004 | 70.7 |
| 5 | 0.005 | 88.4 |
| 6 | 0.006 | 106.1 |
| 7 | 0.007 | 123.7 |
| 8 | 0.008 | 141.4 |
| 9 | 0.009 | 159.1 |
Table 2.
Details of the eight experimental test cases considered.
| Test Number |
Set | Reinforcement | Flow Rate (L/s) |
Time (minutes) |
Note |
|---|---|---|---|---|---|
| 1 | 1 | No | 9 | 3 | Peak Flow |
| 2 | 1 | No | 7 | 3 | Peak Flow |
| 3 | 1 | No | 5 | 3 | Peak Flow |
| 4 | 1 | No | 3 | 3 | Peak Flow |
| 5 | 2 | Yes | 9 | 3 | Peak Flow |
| 6 | 2 | Yes | 7 | 3 | Peak Flow |
| 7 | 2 | Yes | 5 | 3 | Peak Flow |
| 8 | 2 | Yes | 3 | 3 | Peak Flow |
Disclaimer/Publisher’s Note: The statements, opinions and data contained in all publications are solely those of the individual author(s) and contributor(s) and not of MDPI and/or the editor(s). MDPI and/or the editor(s) disclaim responsibility for any injury to people or property resulting from any ideas, methods, instructions or products referred to in the content. |
© 2024 by the authors. Licensee MDPI, Basel, Switzerland. This article is an open access article distributed under the terms and conditions of the Creative Commons Attribution (CC BY) license (http://creativecommons.org/licenses/by/4.0/).
Copyright: This open access article is published under a Creative Commons CC BY 4.0 license, which permit the free download, distribution, and reuse, provided that the author and preprint are cited in any reuse.


