Submitted:
09 December 2024
Posted:
10 December 2024
You are already at the latest version
Abstract
Rely on a foundation pit project under covered semi-top-down method with synchronous construction of superstructure and substructure in Beijing, the whole process of construction was simulated by using ABAQUS finite element software. The impact of the whole construction on the surrounding ground, the adjacent building and the retaining structure were studied, and the influence of the existing building, the strength of diaphragm wall and the construction process were carried out. As shown from the results, the foundation pit and the existing building are in a safe state during the whole construction process. The ground settlement shows an obvious groove shape. The deformation of diaphragm wall has obvious spatial effects, which changes from "single peak" to "double peaks". The maximum horizontal displacement of strata behind the diaphragm wall occurs at 22.5m depth, which is 1.4-2.0 times of the top horizontal displacement. The existing buildings reduced the ground settlement between the existing building and the excavation surface. The construction process has little impact on the existing buildings, which can be adjusted appropriately.
Keywords:
covered semi-top-down method
; synchronous construction of superstructure and substructure
; numerical simulation
; Deformation characteristics
0. Introduction
Excavation and construction of underground projects will inevitably cause disturbance to the surrounding ground, which in turn may have a series of adverse effects on adjacent buildings, and it has become a hotspot of concern in the engineering community. To date, many authors have already conducted vast amounts of studies on the issues. A database of 92 case histories with extensive excavation widths in site of soft-soil in China was collected and analyzed by Xiao et al., they found that foundation pits have obvious spatial effects, and the lateral wall deflection, ground movement and basal heave stability are closely related with the excavation width, but the type of retaining structure has little relevance to the excavation width of pit [1]. Finno and Bryson investigated the effects of a three-story school supported by shallow foundations subjected to excavation of an adjacent 12.2m deep soft clay foundation pit, and summarized the inter-relationship between pit deformation and school structural damage [2]. Zheng et al. presented a simple assessment technique using a multivariate adaptive regression splines (MARS) model, which could map the nonlinear interactions between the influencing factors and the maximum horizontal deformation of tunnels [3]. Korff et al. developed an analytical model to determine the pile response to lateral displacements, by relating the axial pile deformation to the vertical soil displacement resulting from the deep excavation [4]. Huang et al. presented a finite-element parametric study of tunnel behavior caused by nearby deep excavation and investigated the effects of several parameters [5]. Palmstrom and Stille found that the main features determining the behavior of the ground surrounding an excavation are the ground conditions (e.g., site stratum distribution, stress and hydrogeological conditions) and the project-related features (e.g., size and shape of the opening and excavation method), which means that the ground deformation is controlled by many factors such as the geological conditions of site, the construction environment, the construction scheme and process [6]. Therefore, using reasonable excavation methods can reduce the impact on the surroundings.
The top-down construction method, originated from the Toronto subway project in Canada in 1951, is one of the safest and most feasible methods in urban environments [7] which has gradually been widely employed in the construction of underground projects [8,9,10,11]. Many scholars have conducted in-depth research on the issues caused by top-down excavation. For example, Ou et al. studied the characteristics of movements of the diaphragm wall and the soil caused by the excavation using top-down construction method [12]. Kung compared the excavation-induced wall deflection caused by the top-down method and the bottom-up method in Taipei silty clay, investigated the key factors affecting wall deflection, and found that the difference in the wall deflection induced by the creep effect between the two construction methods is quite insignificant [13]. Fateh et al. assessed the structural behavior of three casting stages of strut ring slab using finite element simulation [14]. Wang et al. investigated the differential uplift and settlement between inner column and diaphragm wall in top-down excavation [15]. Gui et al. examined the measured excavation responses when the pit was excavated by top-down method, including the deflections of the diaphragm wall, vertical column movement, slab axial force, building settlement caused by ground deformation, and the influence of pit excavation on the adjacent subway tunnel [16]. Tan and Wang investigated the behaviors of the pit under top-down construction in shanghai soft clay [17]. Jamsawang et al. studied the effectiveness of deep cement mixing walls created using top-down construction technique for a deep excavation, and found that the top-down construction method is more effective than the bottom-up construction method in terms of the limitations of lateral wall movement, the bending moment in a deep cement mixing wall, and the thickness of a deep cement mixing wall for various depths because of a larger system stiffness [18]. Wang et al. simulated the construction process of the Zhongshan hospital project in Shanghai, and found that the time effect of foundation pit deformation under top-down construction was particularly significant [19]. Chen et al. found that the top-down excavation can effectively minimize the ground and building settlement, while the excavation may induce uneven displacement of the interior supporting columns [20].
Although the top-down method has many merits, it is difficult to remove the soils below cast ground floors due to the restricted head space and soil removal cannot start until the poured substructure components have cured, which means that the top-down method requires longer time to complete an excavation than the bottom-up method [21]. Meanwhile, due to an excavation under the slab has low efficiency and difficult environment for work, the cost of the top-down method is higher than the bottom-up method. In response to some complex construction conditions and special technical and economic requirements, the covered semi-top-down method, which combines the traditional cover-cut method and semi-top-down method, has gradually become a concern for the engineering community [22]. Huang et al. found that the semi-top-down method has a good effect on controlling the surrounding deformation. Compared with the top-down method, the covered semi-top-down method can save construction space, reduce construction cost, improve efficiency, and better meet safety requirements [23]. Tan et al. investigated the performance characteristics of semi-top-down (STD) excavation for subway station in Shanghai soft ground, and found that spatial corner stiffening behavior was not apparent for this STD excavation because of the combined result of segmented construction procedure and narrow pit width, which is different from Bottom-Up and Top-Down excavations [24]. However, the fruits about the covered semi-top-down construction method are relatively little, the mechanical characteristics of the surroundings under synchronous construction of superstructure and substructure is still unclear, resulting in an in-depth study needed.
In this article, relay on a project in Beijing, a systematic study on the synchronous construction of superstructures and underground structures under a semi-top-down construction method was conducted. The construction process of the project was simulated using the ABAQUS software, the mechanical response of the surroundings during the whole construction process were analyzed, and the interaction between the construction and the surroundings was explored. The results can provide reference for the subsequent construction and similar projects.
1. Project Overview
The project is for a shantytown renovation in Beijing, the surrounding environment is complex, with some existing buildings on the east side of the area and a subway station on the west side. The plots are planned to be 5 floors underground and 23 floors above ground, adopting the method of synchronous construction of superstructure and substructure under the semi-top-down construction method. In this project, the foundation pit is 62.3m east-west and 45.7m north-south, the excavation depth is set to be 25.5m. The diaphragm walls with depth of 36.5m are used as the foundation pit retaining structures, and the vertical supports adopted integrated piles and columns. Figure 1 presents the relationship between the foundation pit and the existing buildings. Meanwhile, the monitoring points used to validate the numerical model in this article are also marked in Figure 1, where DB-1 and DB-2 are the two monitoring points of ground settlement, and JC-1 and JC-2 are used to monitor the building subsidence. For the convenience of analyzing the calculation results, the side walls of pit are numbered clockwise according to I to VII. Correspondingly, the monitoring sections set perpendicular to them in the middle of each wall are numbered as I-I, II-II, III-III, IV-IV, V-V, VI-VI, and VII-VII.
According to the engineering geological survey results, the site strata from top to bottom are artificial fill, sandy silt-clay silt, medium sand, silty clay, pebble layer, silty clay layer, pebble layer, and silty clay layer. Table 1 lists the property parameters of stratum. There are two major groundwaters in the site area, namely phreatic water in the middle sand layer and interstitial water in the pebble layer. The groundwaters do not corrode the concrete structures or the reinforcing steels in the reinforced concrete, and the interstitial water is located about 3 m below the bottom of the foundation pit and has little effect on the project.
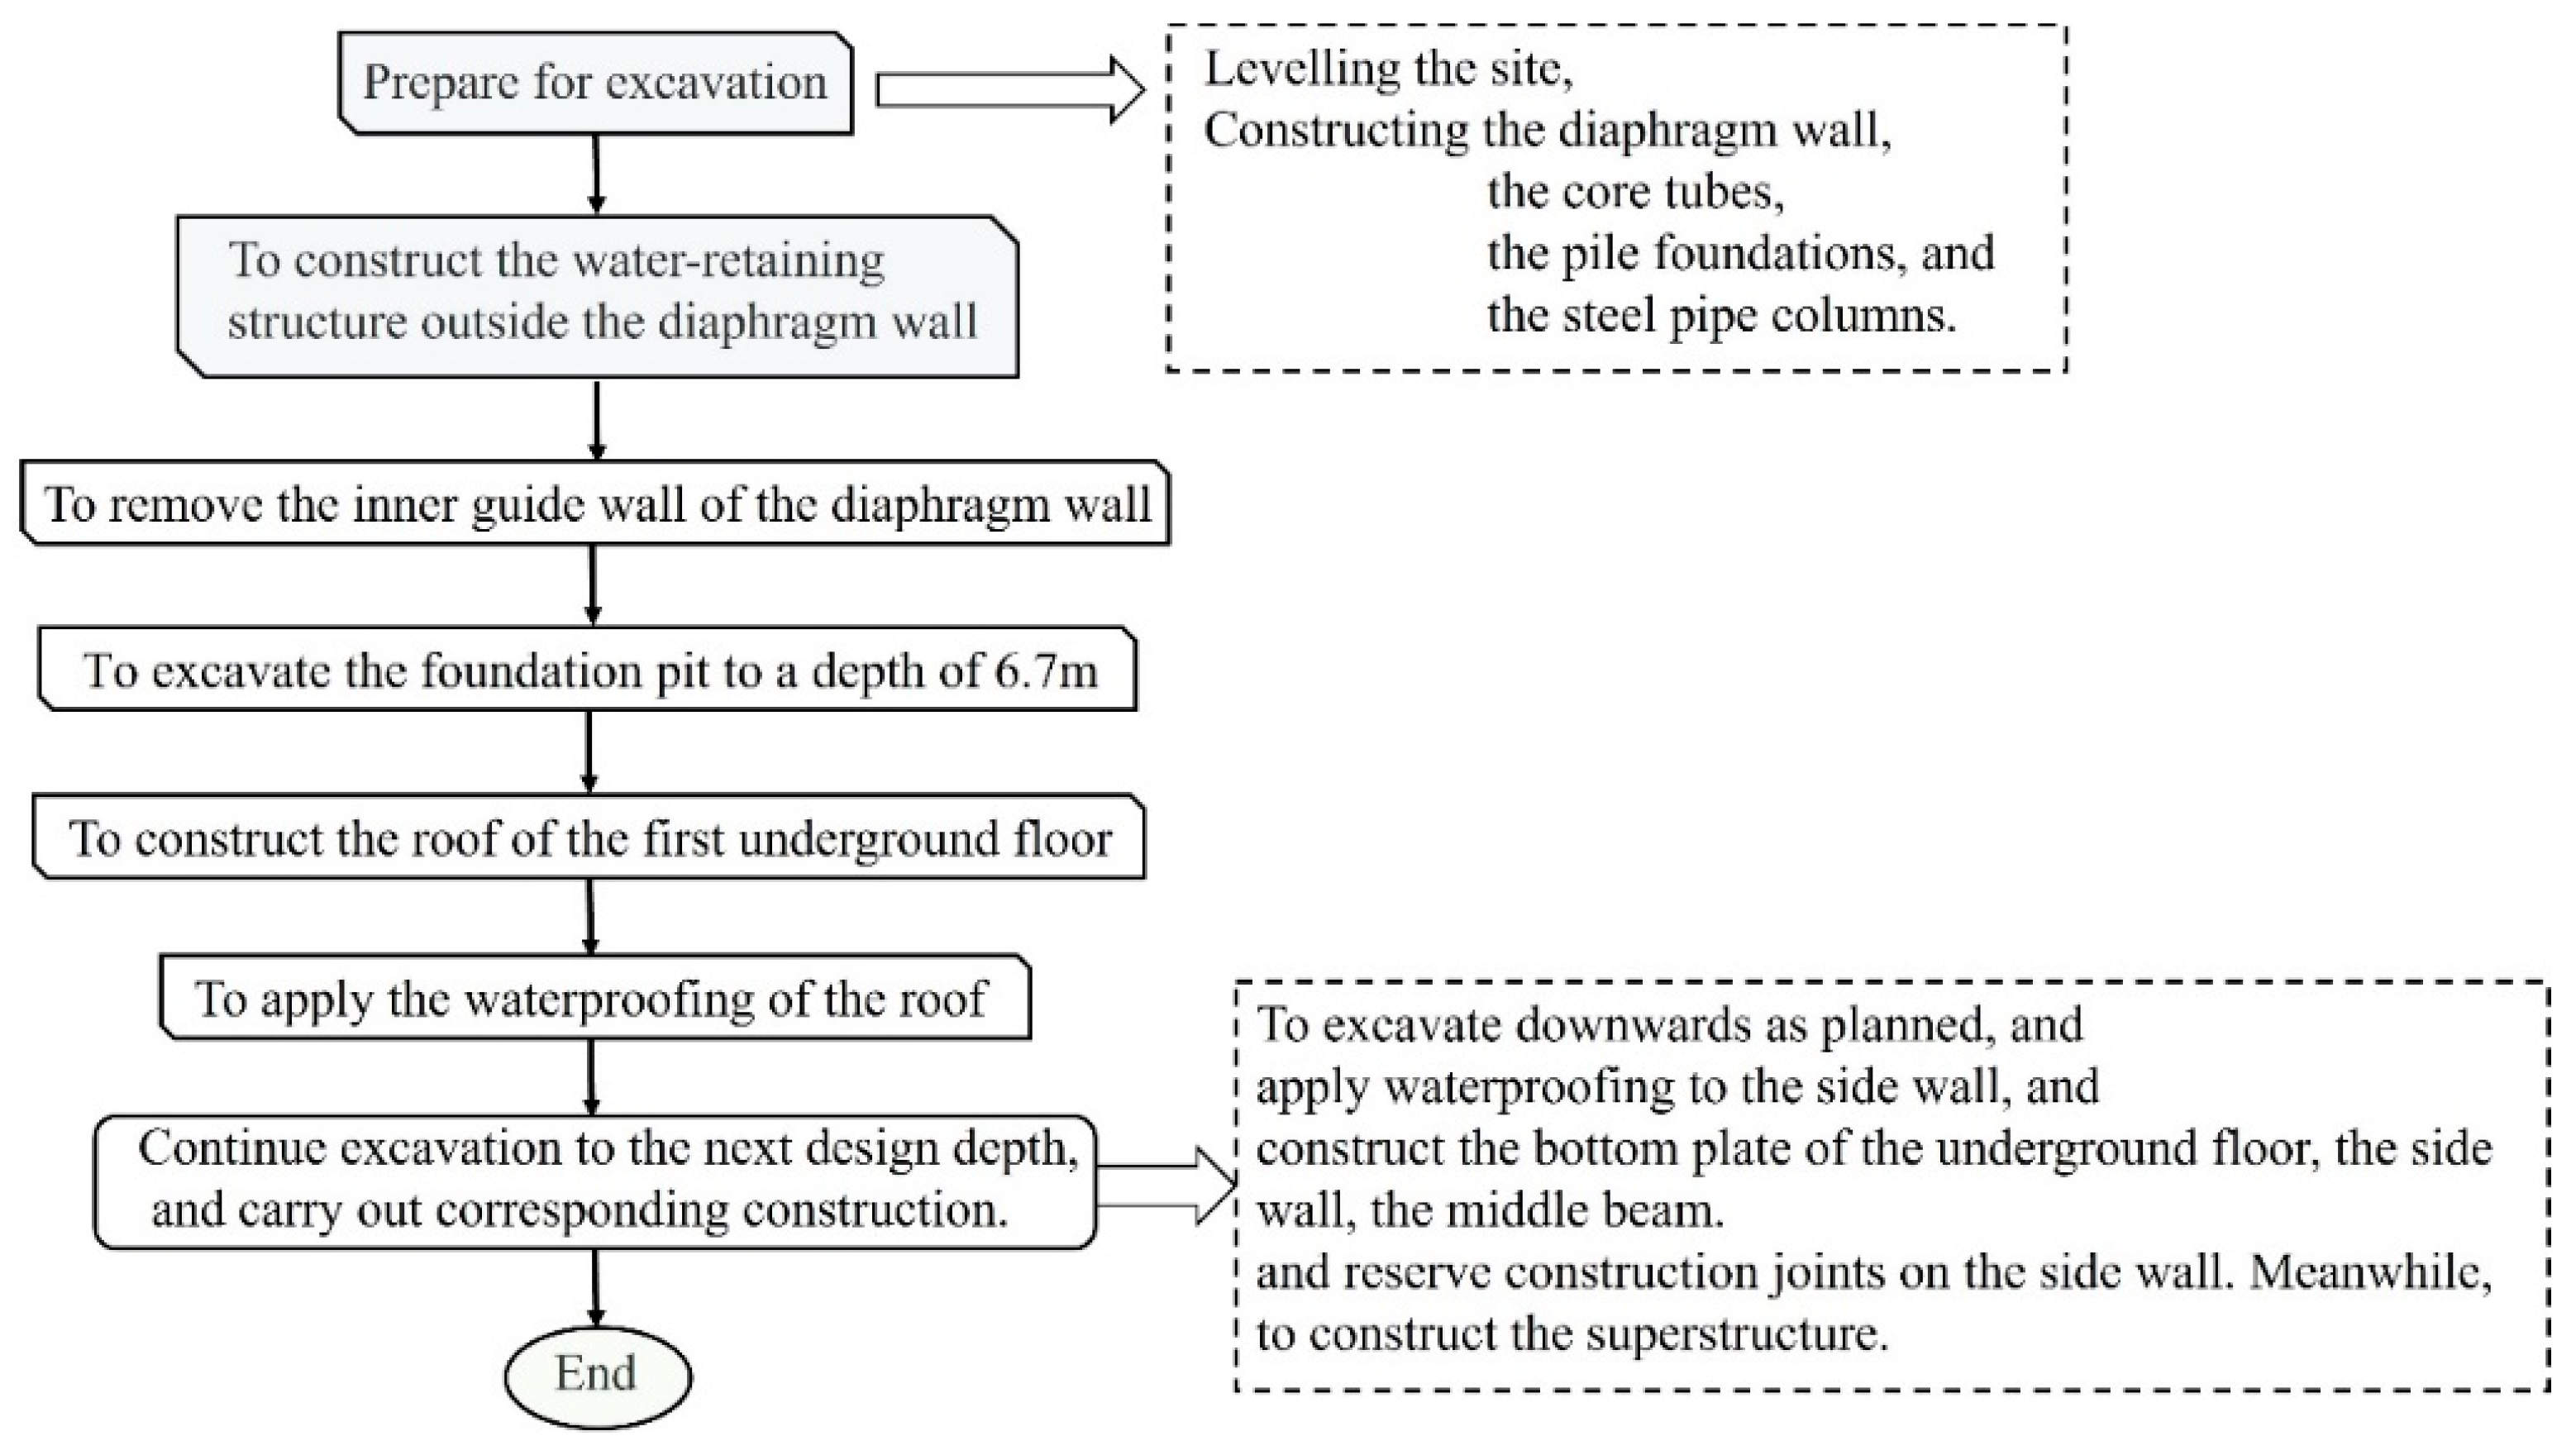
In the project, the method of synchronous construction of superstructure and substructure was adopted, that is, the superstructure was constructed by the traditional bottom-up method, and the substructure was constructed simultaneously using a covered semi-top-down construction method, as shown in Figure 2. The construction processes are detailed as follows.
(1) Prepare for excavation, including levelling the site, constructing the diaphragm wall, the core tubes, the pile foundations, and the steel pipe columns inside the pit.
(2) To construct the water-retaining structure outside the diaphragm wall, remove the inner guide wall of the diaphragm wall, then excavate 6.7 m downwards and construct the roof of the first underground floor.
(3) After the strength of the roof of the first underground floor reaches 80% of the design strength, the waterproofing of the roof will be applied. Then, continue to excavate 2.3 m downwards, apply waterproofing to the side wall, and construct the roof of the second underground floor, the side wall of the first underground floor, the middle beam, following reserve construction joints on the side wall. Meanwhile, the construction of the superstructure will reach the 5th floor.
(4) After the strength of the roof of the second underground floor reaches 75% of the design strength, continue to excavate 4.1m downwards, apply waterproofing for the side wall of the second underground floor, and construct the roof of the third underground floor, the side wall of the second underground floor, the middle beam, following reserve construction joints on the side wall. At the same time, the construction of the superstructure reaches the 8th floor.
(5) After the strength of the roof of the third underground floor reaches 75% of the design strength, continue to excavate 3.6m downward, apply waterproofing for the side wall of the third underground floor, and construct the roof of the fourth underground floor, the side wall of the third underground floor, the middle beam, following reserve construction joints on the side wall. Meanwhile, construct the superstructure to the 10th floor.
(6) After the strength of the roof of the fourth underground floor reaches 75% of the design strength, continue to excavate 4.0m downward, apply waterproofing for the side wall of the fourth underground floor, and construct the roof of the fifth underground floor, the side wall of the fourth underground floor, the middle beam, following reserve construction joints on the side wall. Meanwhile, construct the superstructure to the 15th floor.
(7) After the strength of the roof of the fifth underground floor reaches 70% of the design strength, continue to excavate down to the design elevation of the bottom slab, manual excavation will be adopted when 200-300mm away from the bottom of the pit. Construct the bottom slab, apply waterproofing for the side wall of the fifth underground floor, and construct the side wall of the fifth underground floor, the sill, following reserve construction joints on the side wall. After the completion of the substructure construction, continue to complete the construction of the superstructure from the 16th to the 23rd floors.
Figure 2.
The construction processes of synchronous construction of superstructure and substructure.
Figure 2.
The construction processes of synchronous construction of superstructure and substructure.
2. Methodology
The ABAQUS software was used to simulate the whole construction process. The shape of the foundation pit in this project is complex and irregular, so the size of numerical model was determined based on the maximum size of the foundation pit in each direction, which was 62.3m in the east-west direction, 45.7m in the north-south direction, and 25.5 m in the excavation depth. For eliminating the effects of the model boundaries on the calculation results, the model calculative height (in the z-direction), length (in the x-direction), and width (in the y-direction) were set to be 70.0 m, 170.0 m, and 110.0 m, respectively. The finite-element model for the excavation area and surrounding site is shown in Figure 3(a), and Figure 3(b) presents the structure in excavation area.
The boundary conditions of the model were set as follows: the top surface was free, while the bottom surface was fixed by constraining all the degrees of freedom of the nodes on it. The nodes on the side surface were allowed to have vertical displacement but their normal displacements were frozen.
In the finite-element model, the soil, the diaphragm wall, and the core tubes were modeled using the solid elements. The 2D plate elements were used to simulate the behavior of the slabs and the side walls. The piles and columns were simulated with the 1D beam elements. In this study, the Mohr-Coulomb model was chosen to describe the stress-strain relationship of the soils. The modulus of deformation used was calculated from equation (1) using the parameters in Table 1 according to literature [25].
where β=1-2υK0=(1+υ)(1-2υ)(1-υ), E0 is the modulus of deformation, Es is the compression modulus, and υ is the Poisson ratio.
The diaphragm wall, core tubes, slabs, side walls, piles, and columns were all assumed to be elastic components. According to the engineering design scheme, the material parameters of the structure components during the excavation process are shown in Table 2.
Due to the lack of relevant information of the surrounding buildings, this study only analyzes the influence of loads of the existing buildings, by applying the weight of existing buildings to the corresponding ground surface in the form of loads. The loads of the existing buildings and that of the new superstructure constructed were all taken as 20 kPa per story. Since the project construction zone was far from the subway tunnel, the effect of the subway tunnel was ignored in this study, while the effect of groundwater was also not considered.
Given that it is difficult to achieve ground stress equilibrium when existing buildings and the new superstructures are simulated in the form of loads. In this study, Ground stress equilibrium was performed only for the initial geological condition, and then eliminating the influence of existing buildings by phase subtraction to achieve the zeroing of the initial displacement field of the model before the construction of the foundation pit. According to the actual construction situation, the simulation process is listed in Table 3. The construction process was realized by deactivating and reactivating elements in ABAQUS software.
3. Results
3.1. Validation of the Numerical Model
In order to simplify the work, the correctness of the numerical model is verified only by the measured data from the start of construction to the completion of the excavation of the 2nd underground floor.
Figure 4 show the measured ground settlements and the numerical simulation results at the locations of the monitoring points DB-1 and DB-2. It can be seen that the measured data are consistent with the simulation results. In addition, Figure 5 gives the settlement history curves of existing buildings, indicating that the simulation results also match well the measured data of building settlement. From Figure 4 and Figure 5, it can be concluded that the numerical model is reasonable, and the numerical model will be used to analyze the whole construction process.
3.2. Structural Response Inside the Pit
3.2.1. Diaphragm Wall
Figure 6 depicts the horizontal displacement contour maps of diaphragm wall after construction. As shown in Fig. 6, the diaphragm walls show a deformation pointing into the pit and the deformation distribution has obvious spatial effects. The displacement corresponding to the long side is greater than that corresponding to the short side, and the sudden change in shape of the local position of the foundation pit causes a reduction in the maximum horizontal deformation of the retaining structure. However, since the roof of the first underground floor is built after the excavation of the first underground floor completed, the top of the diaphragm wall shows a large deformation, which is different from the small deformation of the top of the diaphragm wall adopted the covered top-down method [26].
Figure 7 shows the horizontal displacement distribution of the diaphragm wall at the monitoring section III-III at different construction process. It can be found that the top deformation of diaphragm wall is larger than others at the end of process 4, which is different from the deformation trend of the conventional covered top-down method [17]. This may be owing to the fact that the construction of pit is equivalent to a cantilever-supported excavation during process 4, resulting in a large deformation at the top of diaphragm wall, whereas when the subsequent processes are carried out, the top of diaphragm wall is completely constrained and the horizontal displacement is no longer increasing with the completion of the roof of the first underground floor. During the process 5, the position where the maximum deformation occurs shifts to 6.0-7.0 m below the ground level. With the subsequent construction, the floor slab plays a great supporting role, and the deformation value at this portion remains almost unchanged. But the position of maximum deformation gradually move downwards as construction continues, the horizontal deformation distribution along the depth changes from "single peak" to "double peaks", and the peak value of displacement of the lower part appears at a depth of 22.5m below the ground (about 88% of the excavation depth of pit). With the subsequent excavation, the position of the maximum horizontal displacement of diaphragm wall does not change, but its displacement value is increasing. In process 10, only the superstructure was constructed, which has little impact on the horizontal displacement of diaphragm wall, and the maximum horizontal displacement still appears at the depth of 22.5 m after the whole construction. Therefore, more attention should be paid to the deformation of this position of 22.5 m below the ground (about 88% of the excavation depth of pit) during construction to avoid damage to the diaphragm wall, and if necessary, additional support can be adopted to reduce the deformation of this location. Additionally, as the design depth of the diaphragm wall is 36.5 m, the bottom of the diaphragm wall is closer to the bottom slab of the 5th underground floor (only 11.0m). With the progress of construction, the constraint of stratum on the bottom of the diaphragm wall gradually decreases, resulting in a larger deformation at the bottom of the diaphragm wall as well.
Figure 8 summarizes the final monitoring horizontal displacement curves of diaphragm wall at different monitoring sections after construction, from which, it can be seen that all the horizontal deformation of diaphragm wall points to the foundation pit, and the horizontal displacement distribution presents a “double peaks” shape. With the increase of the horizontal extension length of diaphragm wall, the horizontal displacement increases, but the deformation shape of wall is similar, the maximum horizontal displacement occurs at 22.5 m below the ground. The horizontal displacement of the top and that of the bottom are significantly affected by the horizontal extension length of diaphragm wall. When the extension length is short, the horizontal displacement of the top is almost the same as that of the bottom. When the extension length is large, the horizontal displacement of the top is greater than that of the bottom.
Figure 9 presents the variation of the bending moment of diaphragm wall at the monitoring section III-III at different construction process, in which, a positive value indicates the deformation of wall towards the pit due to the compression of the soil mass and a negative value indicates the deformation of wall towards the outside of the pit. From Figure 9, it can be concluded that the bending moment at the top of diaphragm wall changes very little (within 20kN·m) throughout the construction process. The construction process 4 and 5 cause little change in the bending moment of diaphragm wall, but from process 6 onwards, a large negative bending moment occurred at about 26.4m at the bottom. It might be due to the deformation of diaphragm wall pointing to the foundation pit caused by excavation, while the pebble layer at 26.4m below the ground has a certain inhibitory effect on the deformation of diaphragm wall, resulting a large negative bending moment. With the subsequent construction, the maximum positive bending moment of diaphragm wall gradually increases, and its position gradually moves down, finally stabilizing near the middle of diaphragm wall. The maximum positive bending moment of diaphragm wall reaches 102kN·m when the construction finished. The maximum negative bending moment tends to increase then decrease following the construction, which is caused by the floor construction and the roof support, but the position of the maximum negative bending moment does not change with the construction. As shown in Figure 9, the process 10, a process of constructing the superstructure above the pit, which only leads to an increase of about 5.7% in the maximum positive bending moment of diaphragm wall, and has no effect on the maximum negative bending moment. The effect of process 10 on the horizontal deformation of diaphragm wall can be almost negligible.
3.2.2. Core Tubes
Figure 10 show the horizontal displacement contour maps of the twin core tubes in X and Y directions when the construction finished, from which it could be seen that in the X-direction, the deformation of the core tubes mainly concentrates at the depth of the pit bottom. The deformation directions of the twin core tubes are different, with one displacement of about 10mm outward and the other displacement of about 6.2mm inward. In the Y-direction, the deformation mainly concentrates at the bottom corners of the core tubes, with the maximum outward displacement of about 8.9mm and the maximum inward displacement of about 7.9mm. This difference may be explained by the complexity of the construction and the combined effect of the vertical support by piles and columns and the horizontal support by floor slabs. Overall, although the direction and value of deformation are different, the deformation of the twin core tubes is very small, with a maximum deformation only 10.0mm.
3.2.3. Integrated Piles and Columns
Figure 11 gives the vertical displacement contour map of the integrated piles and columns in the pit. It is found that the deformation of columns presents mainly settlement deformation, while the pile has a certain degree of bulge deformation, but the column itself undergoes a certain degree of compression. As we know, the unloading during excavation cause the floating of the integrated piles and columns, but the weight of the superstructure and substructure leads to the settlement of the integrated piles and columns, the combination of two effects results in the sinking of the columns and the floating of the support piles. However, the maximum floating is only 3.3mm and the maximum sinking is only 4.5mm, neither of them reached half of the control value (10mm). Therefore, the integrated piles and columns used as vertical supports in the foundation pit are in a safe condition during the whole construction process.
3.2.4. The Roof of the First Underground Floor
Figure 12 present the stress contour maps of the roof of the first underground floor at the end of each construction process, where positive values represent tensile and negative values represent compressive. From Figure 12, it can be seen that as the construction progresses, the tensile stress distribution of the top roof of the first underground floor only slightly changes, while the compressive stress distribution changes significantly between the 4th and 7th processes, but the change is very small after the 7th process, with most floors in a compressed state. Tensile stress takes on a cross-distribution pattern, and mainly distributes between columns and columns or columns and side walls. Whereas the compressive stress mainly appears at the intersection between the roof of first underground floor and the columns. The tensile stress and the compressive stress increase with the construction process, but the maximum tensile stress and the maximum compressive stress suddenly increase by about 10 times between process 4 and process 5 due to the gravity load of the superstructure during synchronous construction. From process 5 to process 10, the maximum tensile stress and the compressive stress both increased by about 4 times. As the construction progresses, the ratio of maximum compressive stress to maximum tensile stress gradually decreases, but remains around 1.8 times. At the end of construction, the maximum tensile stress reaches 46Mpa, the maximum compressive stress reaches 81Mpa, which all occur on the north side of the pit. These results highlight that it is necessary to strengthen the supervision of the roof of the first underground floor on the north side of the pit during the construction to avoid its cracking and damage affecting the progress of the project.
Figure 13 shows the bending moment contour maps of the roof of the first underground floor in the X and Y directions at the end of construction, from which it can be found that in the X-direction, the maximum positive bending moment is 3.0×10⁶N·m and the maximum negative bending moment is 2.0×10⁶N·m. Namely, the maximum positive bending moment is about 1.5 times of the maximum negative bending moment. In addition, the positive bending moment is mainly distributed at the intersection between the roof of the first underground floor and the columns, and the negative bending moment mainly takes on a parallel distribution to the Y-axis. In the Y-direction, the maximum positive bending moment is 3.2×10⁶N·m and the maximum negative bending moment is 1.4×10⁶N·m, which meant the maximum positive bending moment is about 2.3 times the maximum negative bending moment. The positive bending moment is mainly distributed at the intersection between the roof of the first underground floor and columns and around them, while the negative bending moment is mainly distributed parallel to the X-axis. Therefore, it is particularly important to pay special attention to the parts with significant changes in the bending moment, especially the north side of the roof of the first underground floor and the intersection between the roof of the first underground floor and the columns, to avoid sudden changes in stress direction that may cause cracking and other damages.
3.3. Site Response
Figure 14 shows the surrounding ground settlement after the excavation of 6.7 m. It is obvious that the ground settlement along the foundation pit wall is distributed as a gradual decrease from the middle to the sides with a bulge at the corner of the foundation pit. Thus, the pit wall was divided into 7 different segments and numbered clockwise according to I to VII, then, 7 monitoring sections perpendicular to wall were set in the middle of segments, numbered as I-I, II-II, III-III, IV-IV, V-V, VI-VI, and VII-VII, as shown in Figure 1.
Figure 15 present the ground settlement troughs of 7 monitoring sections during the construction process. As the construction progresses, the settlement continues to increase. From Figure 15, it can be seen that there is uplift deformation near the pit wall, the ground settlement curve shows a clear groove shape, the settlement reaches its maximum at a distance of about 2.0-3.0m from the pit wall. Due to the existing residential buildings on the east of the pit, the settlements of monitoring section III-III and section IV-IV increase as the distance from the pit wall increases after exceeding 11.0m. That of the other monitoring are different, manifested as the ground settlements are basically the same, with a slight decrease after the distance from the pit wall exceeding 10.0m. The construction of process 10 has a relatively minimal impact on the ground settlement, and all the construction processes have no impact on the position of the maximum deformation value of the ground settlement trough. After the completion of construction, the maximum settlement value reaches 13.8mm and the maximum uplift value reaches 4.8mm, both of which are far less than the design control value (30mm), meeting the safety requirements. From Fig. 15, The maximum settlement for all sections are approximately between 0.11‰H-0.54‰H (H is the excavation depth of the pit), and the influence range of excavation is between around 0.88H-1.37H, which indicates that the spatial position of the diaphragm wall, the wall length, and the spatial position of existing buildings have a significant impact on the magnitude and the shape of settlement trough, but have little impact on the location of the maximum settlement in settlement trough. The distribution of the settlement trough indicates that the significant impact range of excavation of the pit in this project is approximately within 10.0m around the pit. Therefore, it is necessary to strengthen the monitoring of the structures and traffic routes within 10.0m around the pit to avoid the adverse impact of construction during excavation.
Figure 16 shows the horizontal displacement of strata behind the wall at different monitoring section after the completion of construction. It is observed that the strata behind the wall have a horizontal displacement towards the pit, and the deformation characteristics are quite similar to that of the diaphragm wall, also showing the shape of "double peaks", and the deformation values are basically the same. With the increase of the extension length of diaphragm wall, the horizontal displacement of strata behind the wall gradually increases, but the maximum displacement always appears around 22.5m below the ground. The maximum horizontal displacement is about 1.4-2.0 times of that of the ground.
3.4. Settlement of Existing Buildings
Figure 17 provides the history curves of the settlement of existing buildings during the whole construction process. As can be seen that the deformation trend of the two points is similar. Both of them gradually increase as construction proceeds, and presents an obvious spatial effect: the settlement rate is fast and the settlement amount is large in the excavation of Sec1, while the settlement rate decreases and the settlement amount is small in the excavation of Sec2 and Sec3. At the beginning of excavation, the settlement of JC-2 is larger than that of JC-1, but as excavation proceed, the settlement of JC-1 gradually exceeds that of JC-2. The final settlement of JC-1 and JC-2 are 5.0mm and 4.8mm respectively, which are all much less than the design control value (15 mm), satisfying the safety requirements.
4. Discussions
4.1. Construction Sequence
The response of existing buildings induced by excavation is a very important issue, Table 4 lists the final settlement of existing buildings under different construction sequences. The data indicate that the impact of the construction sequence on the settlement of existing buildings is so small that it is almost negligible, the construction sequence can be adjusted appropriately to meet the requirements of the construction period under the condition of ensuring safety in the actual project.
4.2. Existing Buildings
Figure 18 show the horizontal displacements of diaphragm wall of section III-III and section VII-VII under four loads of adjacent buildings. It can be found that the impact of existing buildings on the horizontal displacement of diaphragm wall is related to the relative position between the existing buildings and the diaphragm wall. For the diaphragm wall close to the existing buildings, the horizontal displacement gradually decreases with the increase of the weight of existing buildings. Whereas, for the diaphragm wall far away from the existing buildings, the horizontal displacement gradually increases with the increase of the weight of existing buildings. The impact of the existing buildings on the horizontal displacement of diaphragm wall is mainly concentrated in the upper and lower portions of the wall and had little impact on the middle portion of it.
Figure 19 show the settlement history curves of the ground monitoring points behind the pit wall on the monitoring section of III-III and VII-VII under different buildings loads. It is found that the existing buildings have a significant impact on the ground settlement between them and the excavation pit, while the impact on the site on the other side of the pit is very small. As the building load increases, the ground settlement between the building and the excavation pit decreases, the final settlement values under the four building load conditions are 2.5mm, 2.0mm, 1.3mm, and 1.0mm, respectively. However, when the load of existing buildings is 420kPa, here will be a certain degree of heave at the monitoring point during the initial construction stage; as the construction progresses, the heave gradually transforms into settlement deformation, and the overall shape of the ground settlement curve remains unchanged. Comparing the existing building loads of 0kPa and 320 kPa, it is found that ground settlement decreased by approximately 47.1% due to the existence of buildings.
4.3. Strength of the Diaphragm Wall
Figure 20 show the horizontal displacements of the diaphragm wall at the section V-V and the section VII-VII when the wall adopts different strength concrete. From Figure 20, it can be seen that the strength of diaphragm wall only affects the horizontal displacement above the excavation depth, and has no effect on the horizontal displacement below the excavation depth. As the strength of diaphragm wall increases, the horizontal displacement above the excavation depth gradually decreases, but this effect mainly occurs at 22.5m depth. Compared with the strength of 20,000MPa, the horizontal displacement at 22.5m depth of the section V-V decreases by 12.4%, 20.5%, and 26.5% in turn, while that of the section VII-VII decreases by 12.3%, 20.2%, and 25.9% in turn. It could be concluded that the change in the strength of diaphragm wall has similar influence on the maximum horizontal displacement of diaphragm walls, and the influence degree gradually weakens.
Figure 21 show the settlement history curves of existing buildings under different diaphragm wall strengths. As shown in Figure 21, the settlement of existing building decrease with the increase of diaphragm wall strengths. Compared with the strength of 20,000MPa, the final settlement of JC-1 decreases by 8.7%, 15.1%, and 19.9% in turn, while that of JC-2 decreases by 8.8%, 15.3%, and 20.3% in turn. The variation of settlement values is very close, which may be related to the fact that the two monitoring points are at the same distance from the excavation surface of the pit. The change in strength of diaphragm wall will not affect the shape of settlement history curve, except that the response time of different monitoring points affected by the concrete strength of diaphragm wall is different.
5. Conclusions
Based on the Abaqus finite element software platform, a 3D numerical simulation was conducted on the cooperative construction of superstructure and substructure under a covered semi-top-down method, analyzing the mechanical characteristics of the foundation pit itself and the surrounding environments, and exploring the main influencing factors.
(1) During the whole process of cooperative construction of superstructure and substructure under the covered semi-top-down method, the horizontal displacement of the diaphragm wall and of soil behind the wall along the depth direction gradually change from "single peak" to "double peaks" shape of distribution, and the deformation value is related to the horizontal extension length and location of the wall.
(2) The final deformations of the surrounding ground and of the existing buildings are settlements as the construction progress. The ground settlement shows an obvious groove shape, but it would be affected by the existing buildings and the corner effect of the pit. The significant impact range of excavation is approximately within 10.0m around the pit.
(3) The existing buildings have a greater impact on the deformation of the ground and the diaphragm wall between the building and the excavation, with a certain restraining effect.
(4) The strength of diaphragm wall has an obvious impact on its deformation and the settlement of existing buildings. As the strength increase, the horizontal displacement of diaphragm wall and the vertical displacement of existing buildings both tends to decrease, but the degree of decrease is gradually diminished.
(5) The impact of construction sequence on the settlement of existing buildings can be negligible, the construction sequence can be adjusted appropriately to meet the requirements of the construction period under the condition of ensuring safety.
Author Contributions
Conceptualization, L.LY.; methodology, L.LY.; software, J.H.; validation, J.H., L.LY. and L.L.; formal analysis, J.H.; investigation, L.L.; resources, L.LY.; data curation, L.LY. and J.H.; writing—original draft preparation, L.ZY.; writing—review and editing, L.LY., L.ZX., and G.Y.; visualization, L.ZX. and L.ZY.; supervision, L.LY.; project administration, L.L.; funding acquisition, L.LY. All authors have read and agreed to the published version of the manuscript.
Funding
This research was funded by National Key R&D Program of China, grant number 2023YFC3009300, 2023YFC3009302.
Institutional Review Board Statement
Not applicable.
Informed Consent Statement
Not applicable.
Data Availability Statement
All data, models, and code generated or used during the study appear in the submitted article.
Conflicts of Interest
The authors declare no conflicts of interest.
References
- Xiao H, Zhou S, Sun Y. Wall Deflection and Ground Surface Settlement due to Excavation Width and Foundation Pit Classification. KSCE Journal of Civil Engineering, 2019, 23(4): 1537-1547.
- Finno RJ, Bryson LS. Response of Building Adjacent to Stiff Excavation Support System in Soft Clay. Journal of Performance of Constructed Facilities, 2002, 16(1): 10-20. [CrossRef]
- Zheng G, He X, Zhou H, et al. Prediction of the tunnel displacement induced by laterally adjacent excavations using multivariate adaptive regression splines. Acta Geotechnica, 2020, 15(4): 2227-2237. [CrossRef]
- Korff M, Mair RJ, Tol FAFV. Pile-Soil Interaction and Settlement Effects Induced by Deep Excavations. Journal of Geotechnical and Geoenvironmental Engineering, 2016, 142(8): 04016034. [CrossRef]
- Huang X, Schweiger HF, Huang H. Influence of Deep Excavations on Nearby Existing Tunnels. International Journal of Geomechanics, 2013, 13(2): 170-180. [CrossRef]
- Palmstrom A and Stille H. Ground behaviour and rock engineering tools for underground excavations. Tunnel and Underground Space Technology, 2007, 22(4): 363-376. [CrossRef]
- Long M. Database for retaining wall and ground movement due to deep excavation. Journal of Geotechnic and Geoenvironmental Engineering, 2001, 127(03): 203-224. [CrossRef]
- Lu C, Zhang M, Cao S, et al. Preferred Construction Solution for Xidan Station Engineering on Line 4# of Beijing Subway. Journal of Beijing University of Technology, 2007, 33(02): 160-165. (in Chinese). [CrossRef]
- Tao L, Dai X, Huang M, et al. Contrast between cover and cut-top down method and cut-cover method for deformation control. Journal of Liaoning Technical University (Natural Science), 2020, 39(2): 136-144. (in Chinese).
- Ghorbani E. and Khodaparst M. Geodetic Accuracy in Observational Construction of an Excavation Stabilized by Top-Down Method: A Case Study. Geotechnical and Geological Engineering, 2019, 37: 4759-4775. [CrossRef]
- Rojhani M and Bayesteh H. Innovative Top-Down Construction Method with a Sequential Peripheral wall. Geotechnical and Geological Engineering, 2023, 41(3): 1777-1799. [CrossRef]
- Ou CY, Liao JT, and Lin HD. Performance of diaphragm wall constructed using top-down method. Journal of Geotechnical and Geoenvironmental Engineering, 1998, 124(9): 798-808.
- Kung T. Comparison of excavation-induced wall deflection using top-down and bottom-up construction method in Taipei silty clay. Computers and Geotechnics, 2009, 36: 373-385. [CrossRef]
- Fateh A, Hejazi F, Ming YP, et al. Structural behavior in top-down excavation method. Arabian Journal of Geosciences, 2015, 8(9): 7399-7408. [CrossRef]
- Wang L, Zheng G, and Ou R. Differential uplift and settlement between inner column and diaphragm wall in top-down excavation. Journal of Central South University of Technology, 2015, 22: 3578-3590. [CrossRef]
- Gui Y, Zhao Z, Qin X, et al. Study on Deformation Law of Deep Foundation Pit with the Top-Down Method and Its Influence on Adjacent Subway Tunnel. Advance in Civil Engineering, 2020: 8852336. [CrossRef]
- Tan Y and Wang D. Characteristics of a Large-scale Deep Foundation Pit Excavation by the Central-Island Technique in Shanghai Soft Clay. II: Top-Down Construction of the Peripheral Rectangular Pit. Journal of Geotechnical and Geoenvironmental Engineering, 2013, 139(11): 1894-1910. [CrossRef]
- Jamsawang P, Voottipruex P, Tanseng P, et al. Effectiveness of deep cement mixing walls with top-down construction for deep excavations in soft clay: case study and 3D simulation. Acta Geotechnica, 2019, 14: 225-246. [CrossRef]
- Wang G, Liang Z, Wei X. Study of time effect on top-down excavation of Shanghai Zhongshan Hospital. Rock and Soil Mechanics, 2014, 35(S2): 495-500. (in Chinese).
- Chen Y, Jia P, and Ji X. Investigation into the Performance of a Covered Top-Down Pit-in-Pit Deep Excavation in Shenzhen Soil-Rock Mixed Strata. Arabian Journal for Science and Engineering, 2021, 46: 10419-20437. [CrossRef]
- Tan Y, Huang R, Kang Z, et al. Covered Semi-Top-Down Excavation of Subway Station Surrounded by Closely Spaced Buildings in Downtown Shanghai: Building Response. Journal of Performance of Constructed Facilities, 2016, 30(6): 04016040. [CrossRef]
- Zong L, Xu Z, Weng Q, et al. Application of Small Strain Constitutive Model in the Analysis of a Ultra Large and Deep Excavation. Chinese Journal of Underground Space and Engineering, 2019, 15(S1): 231-242. (in Chinese).
- Huang ZH, Zhao XS, Chen JJ, et al. Numerical Analysis and Field Monitoring on Deformation of the Semi-Top-Down Excavation in Shanghai. Geo-shanghai2014, Shanghai China, 26-28 May, 2014: 198-207.
- Tan Y, Zhu H, Peng F, et al. Characterization of semi-top-down excavation for subway station in Shanghai soft ground. Tunnelling and Underground Space Technology, 2017, 68: 244-261. [CrossRef]
- Zhang D. Influence of concrete bracing on ground Road by Cover and dig for concrete support of Subway Station with Fine silty Sand. Master’s Thesis of Anhui Jianzhu University, Hefei China, 2018. (in Chinese).
- Gu Z, Lou W, Cheng Y, et al. Analysis on Deformation Behaviors of Diaphragm Walls of an Extra-long Special-shaped Deep Foundation Pit in Nanjing Soft Soil Area. Modern Tunnelling Technology, 2021, 58(01): 182-189. (in Chinese).
Figure 1.
Excavation site and the monitoring points. In which, the excavation sequence for each depth of foundation pit is to excavate Sec1 first, then Sec2, and finally Sec 3.
Figure 1.
Excavation site and the monitoring points. In which, the excavation sequence for each depth of foundation pit is to excavate Sec1 first, then Sec2, and finally Sec 3.
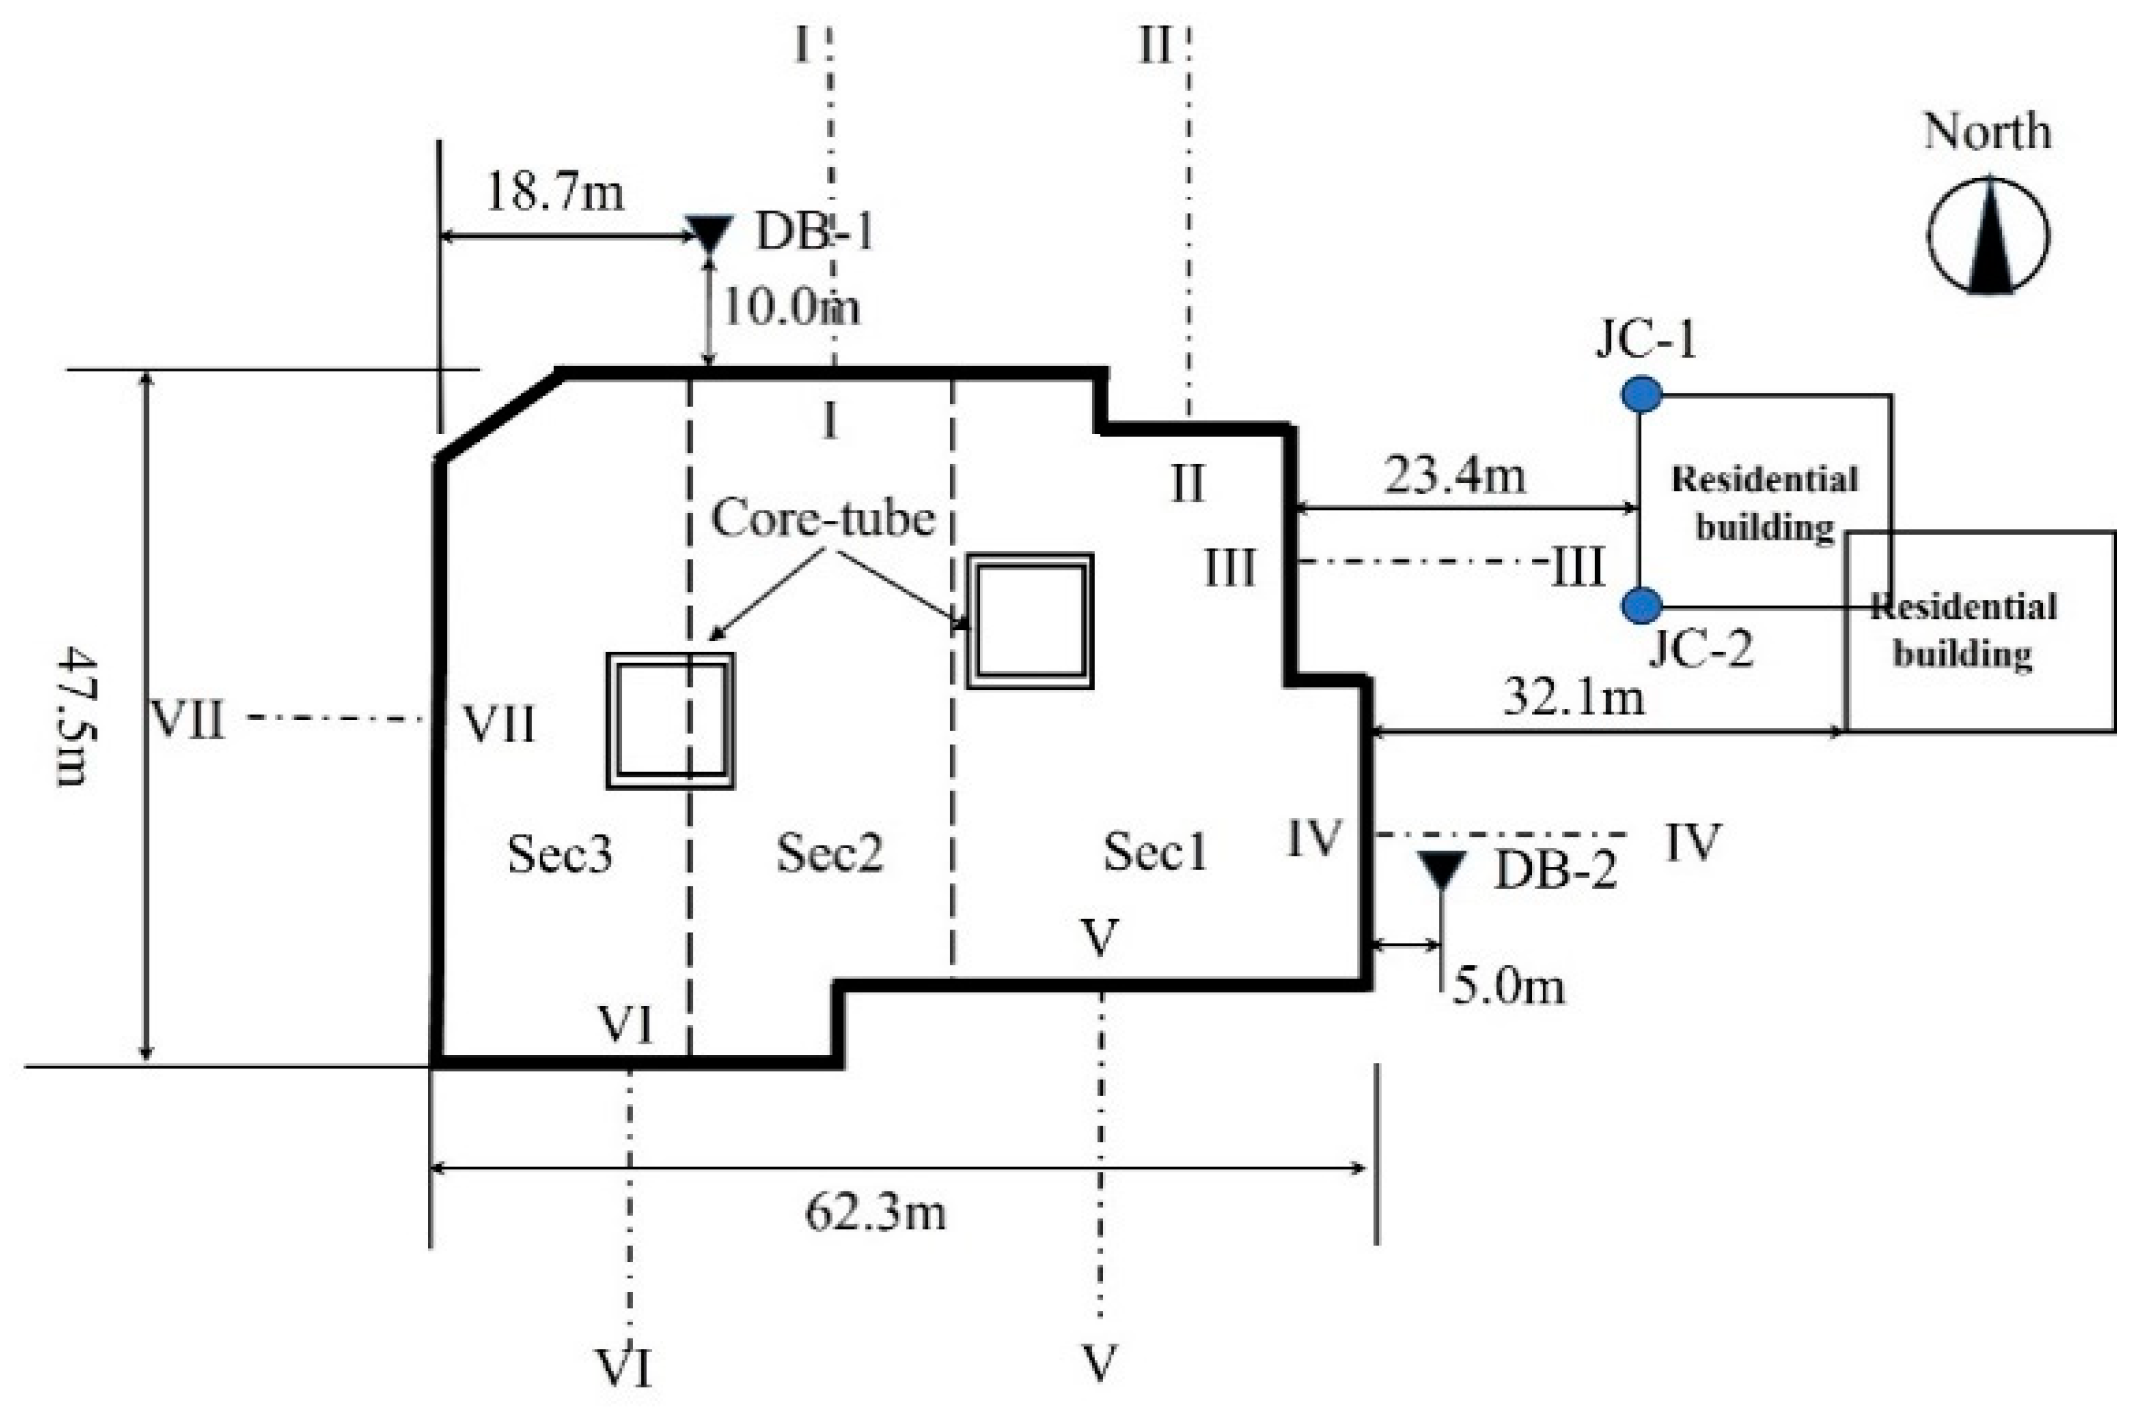
Figure 3.
The FEM model. (a) Excavation and surrounding site; (b) Structure in excavation area.
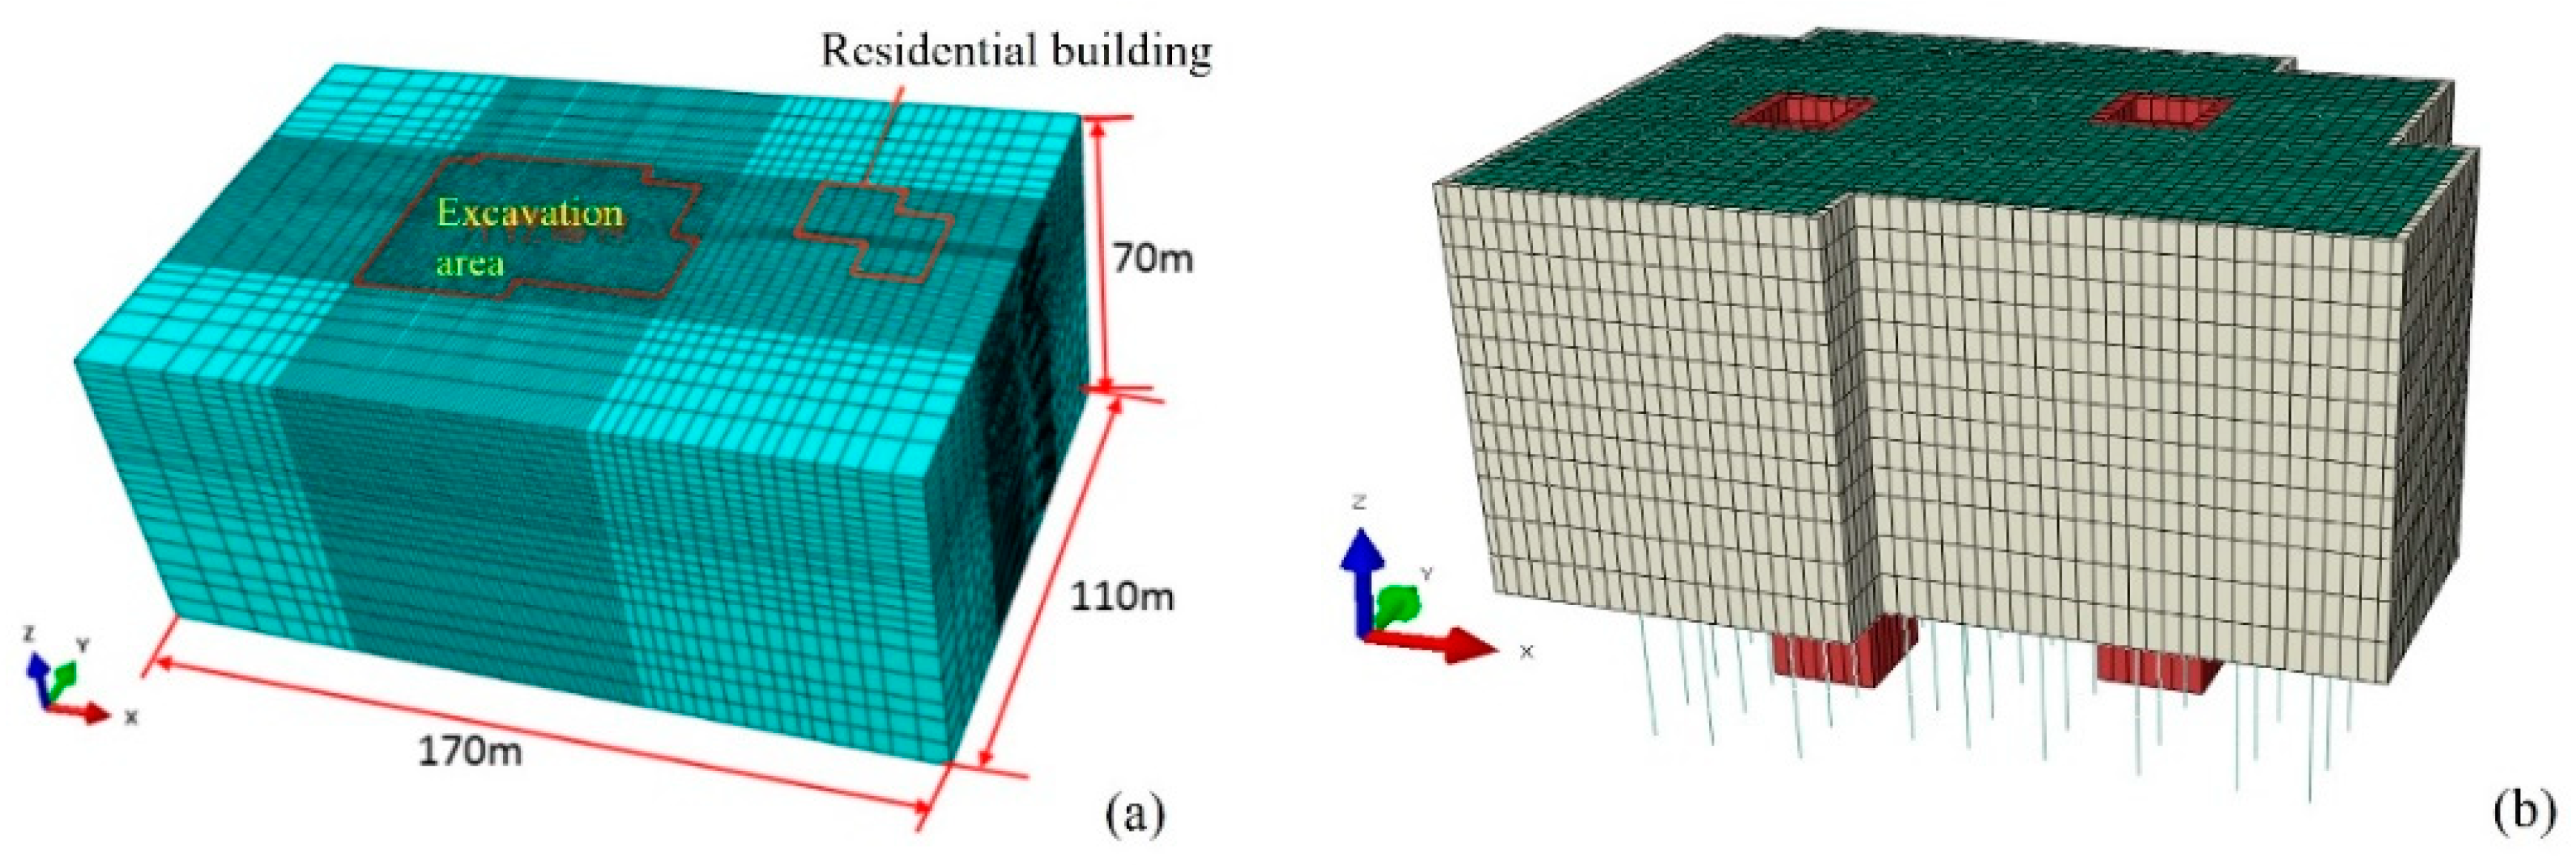
Figure 4.
Results of monitoring data and numerical simulation of ground settlement. (a) DB-1; (b) DB-2.
Figure 4.
Results of monitoring data and numerical simulation of ground settlement. (a) DB-1; (b) DB-2.
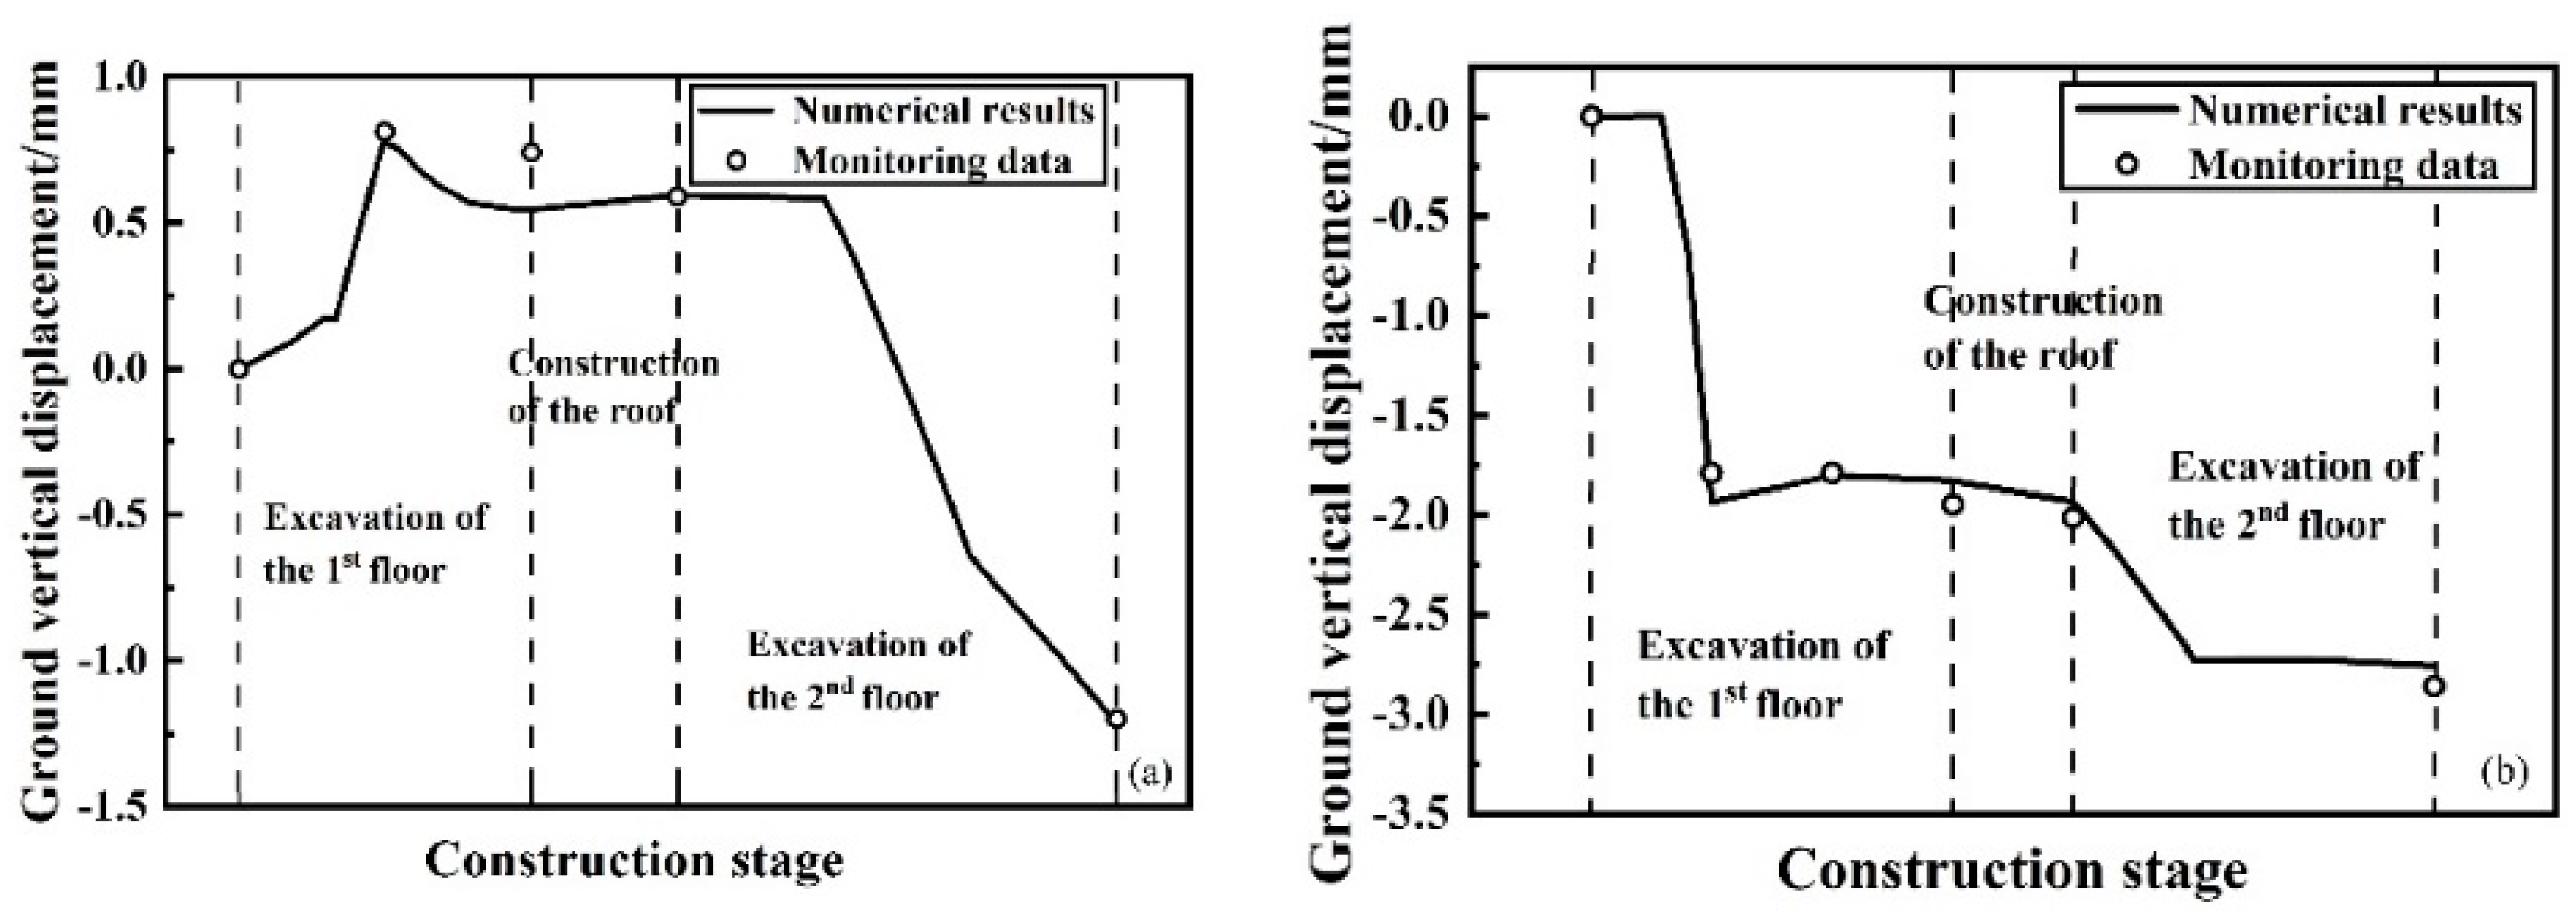
Figure 5.
History curves of the settlement of surrounding buildings. (a) JC-1; (b) JC-2.
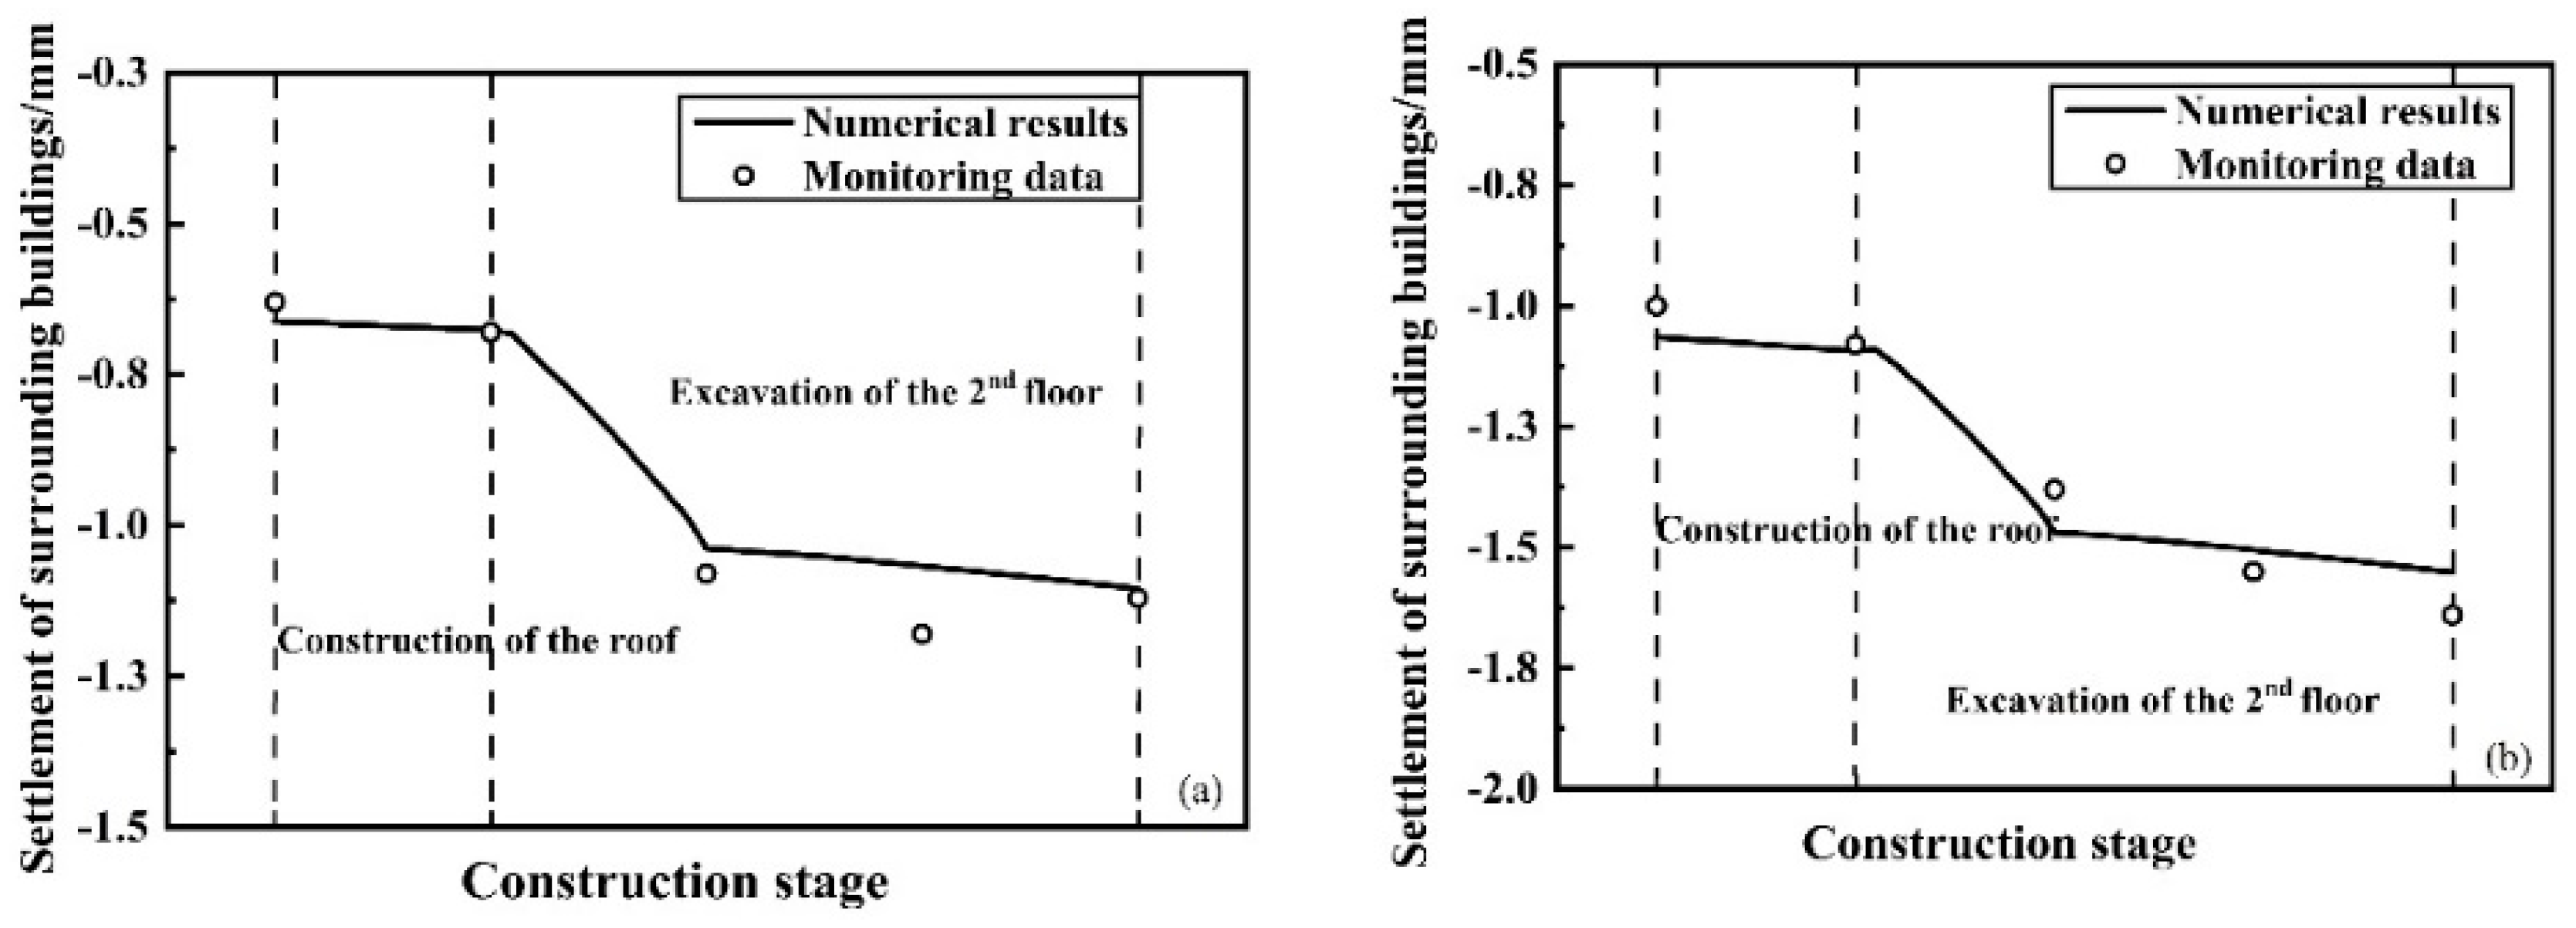
Figure 6.
Displacement contour maps of diaphragm wall. (a) the X-direction; (b) the Y-direction.
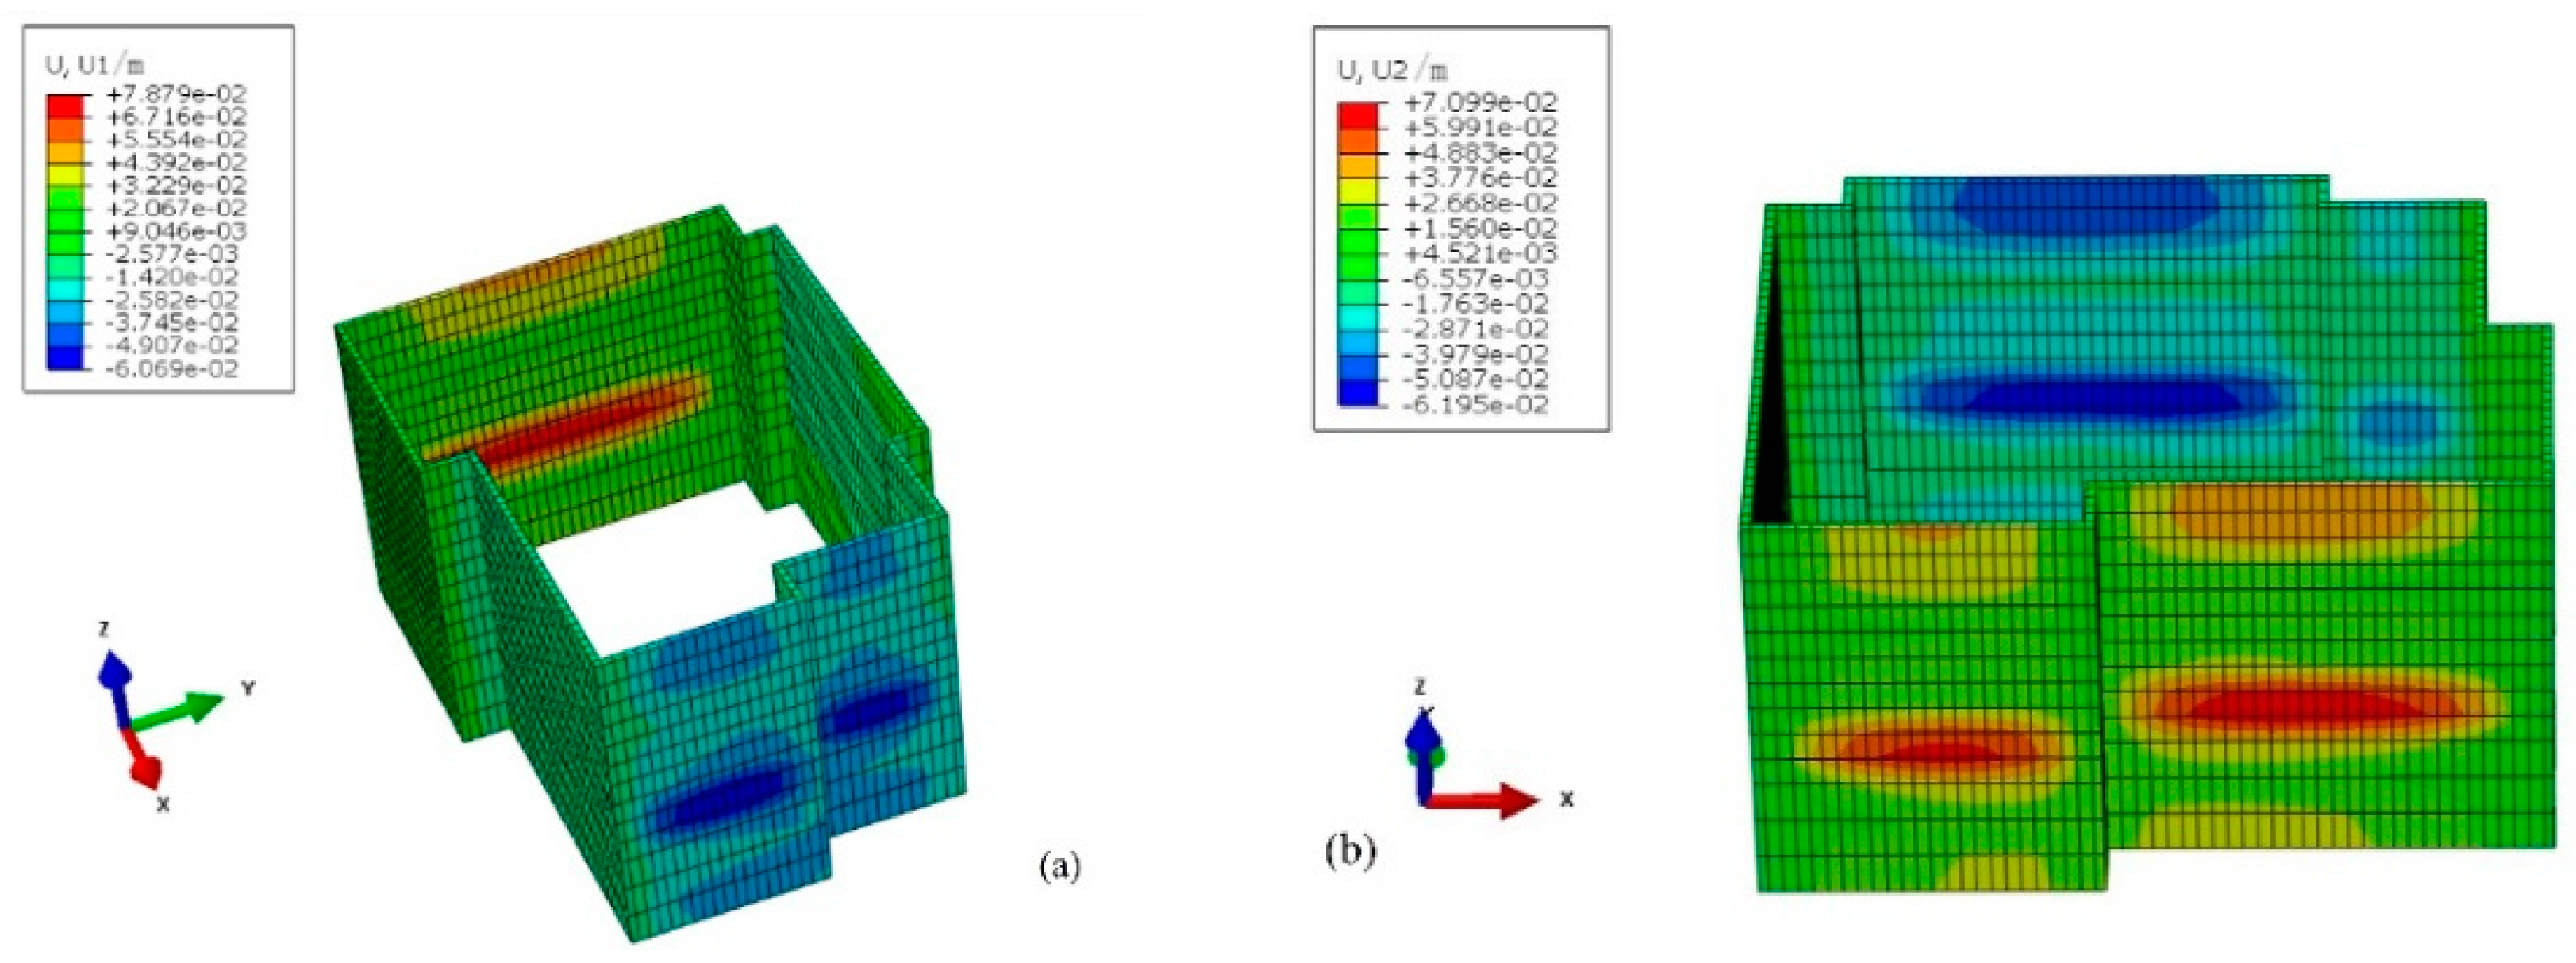
Figure 7.
Horizontal displacement of diaphragm wall at section III-III.
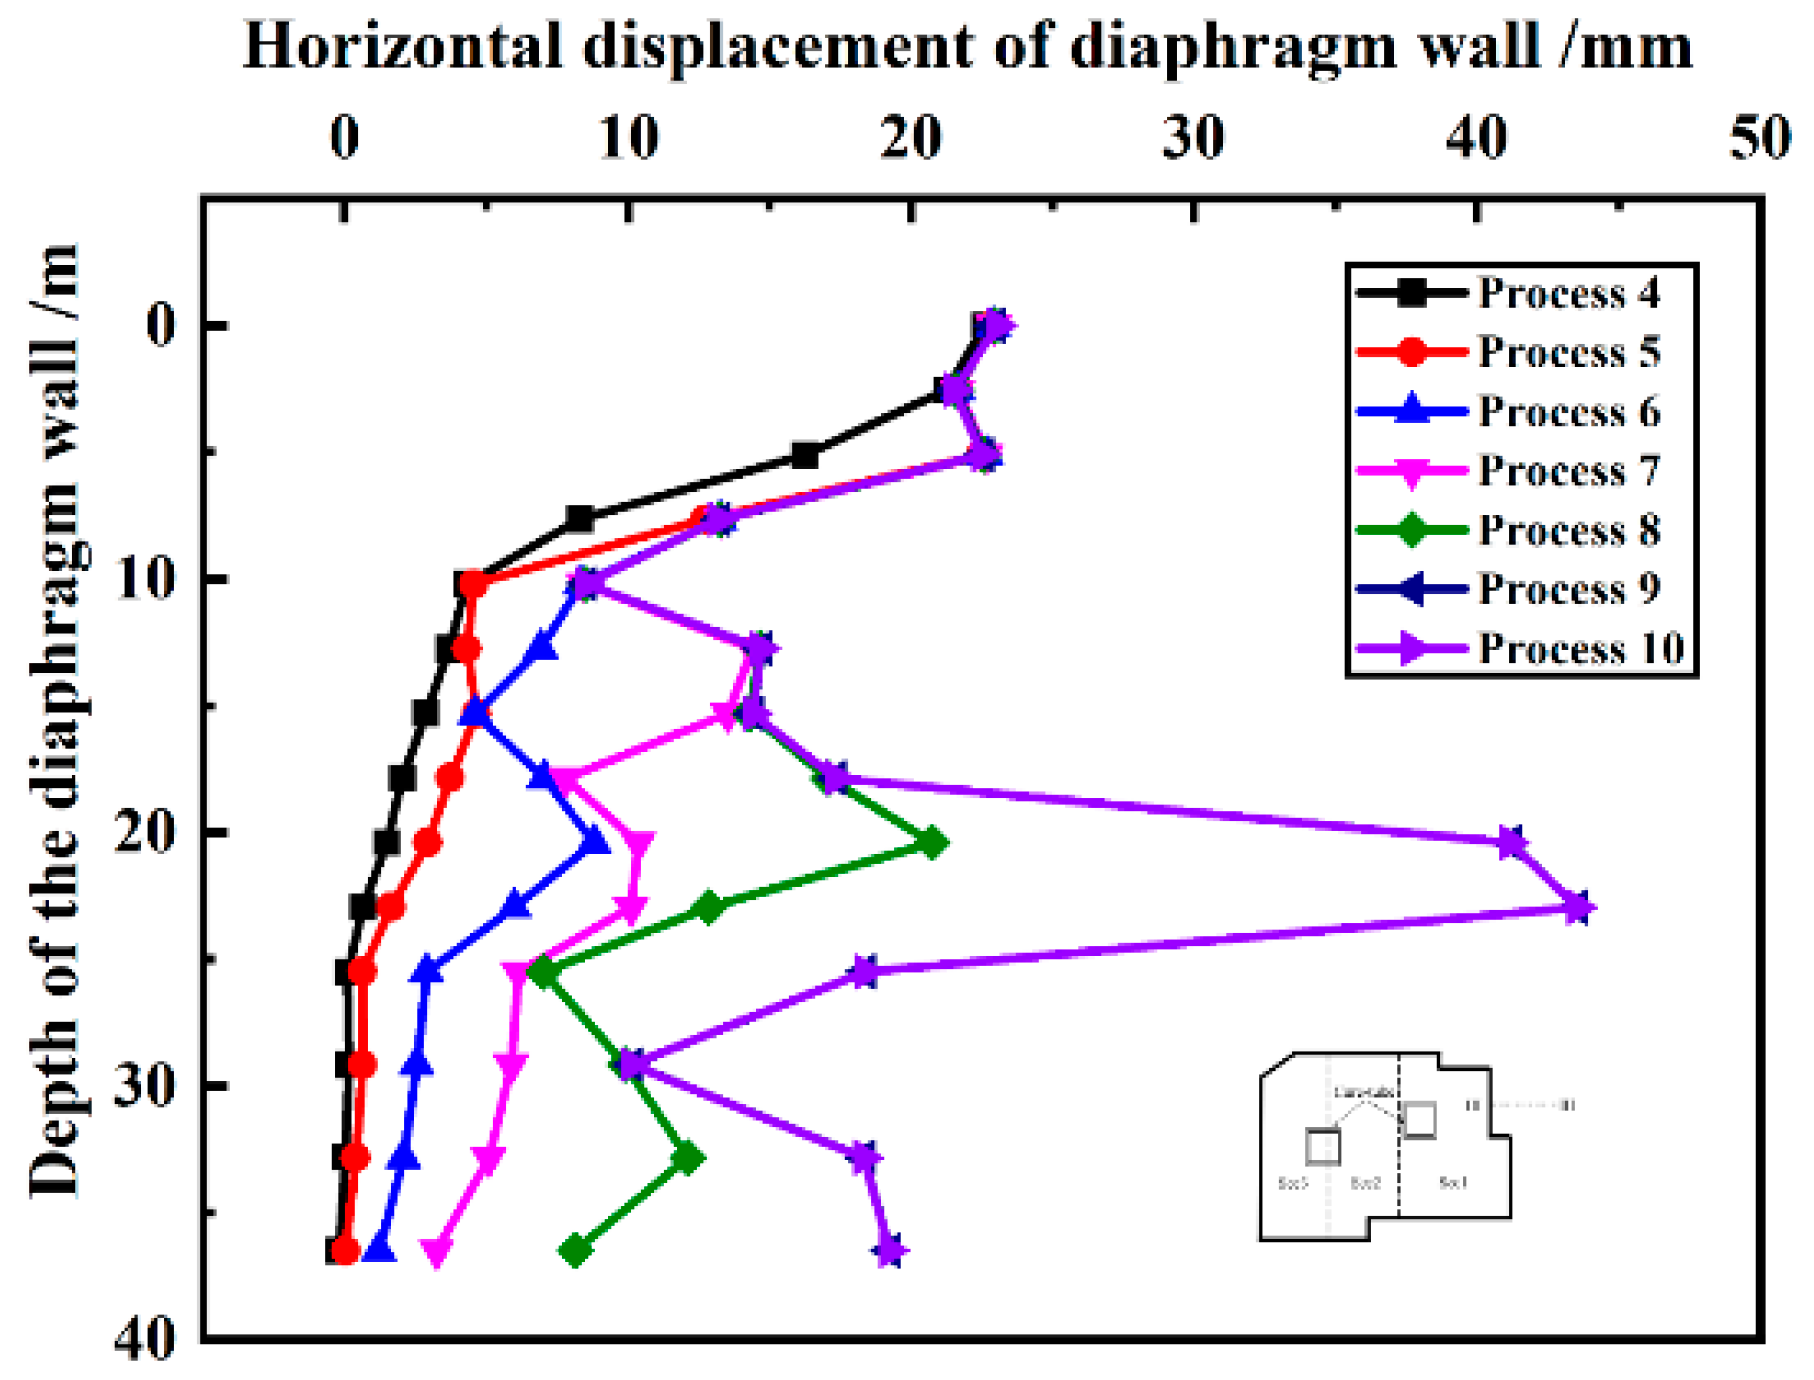
Figure 8.
Horizontal displacement of diaphragm wall at different monitoring section.
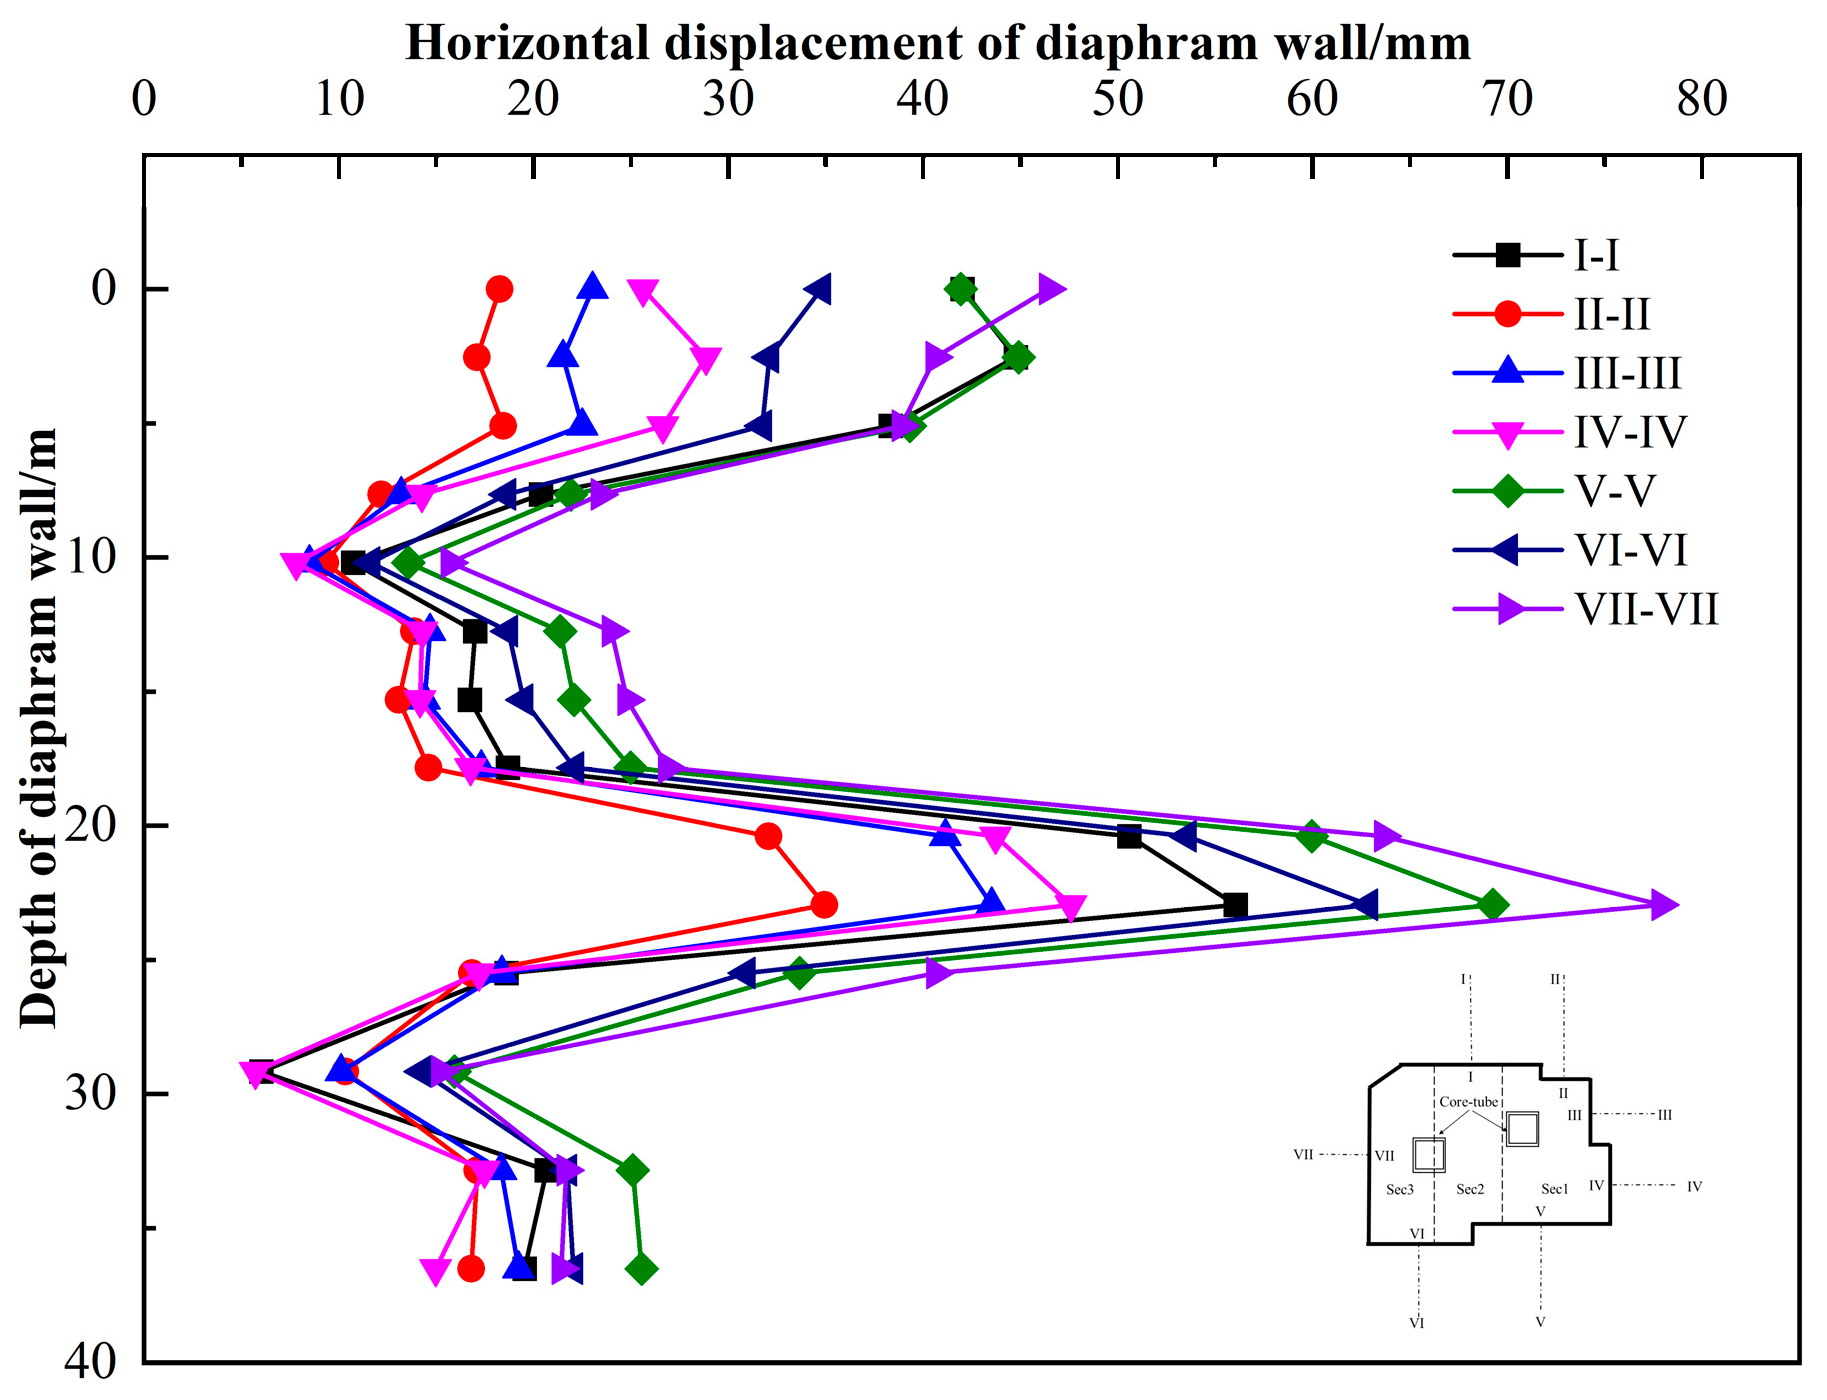
Figure 9.
Bending moment of diaphragm wall at section III-III.
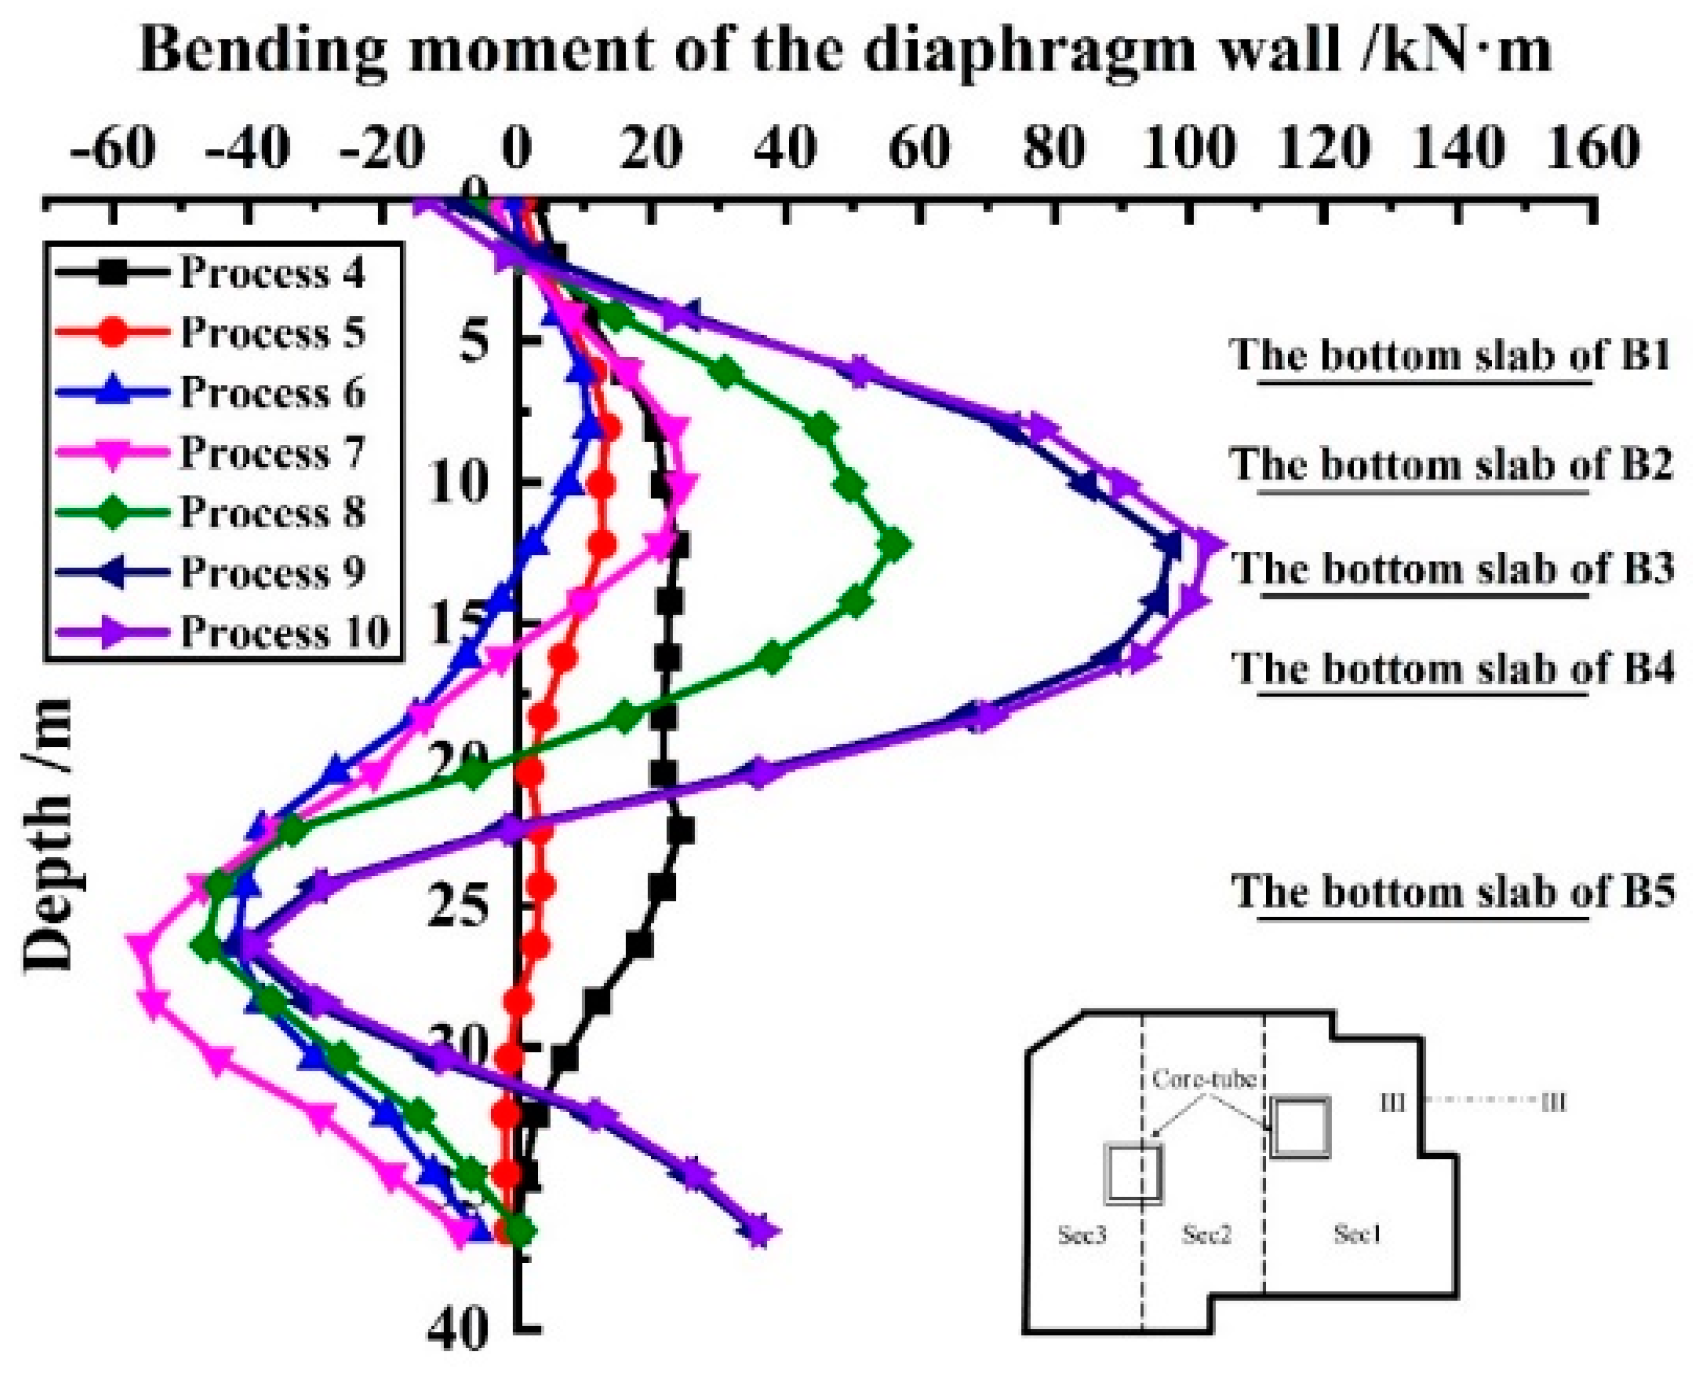
Figure 10.
Horizontal displacement contour maps of the core tubes. (a) the X-direction; (b) the Y-direction.
Figure 10.
Horizontal displacement contour maps of the core tubes. (a) the X-direction; (b) the Y-direction.
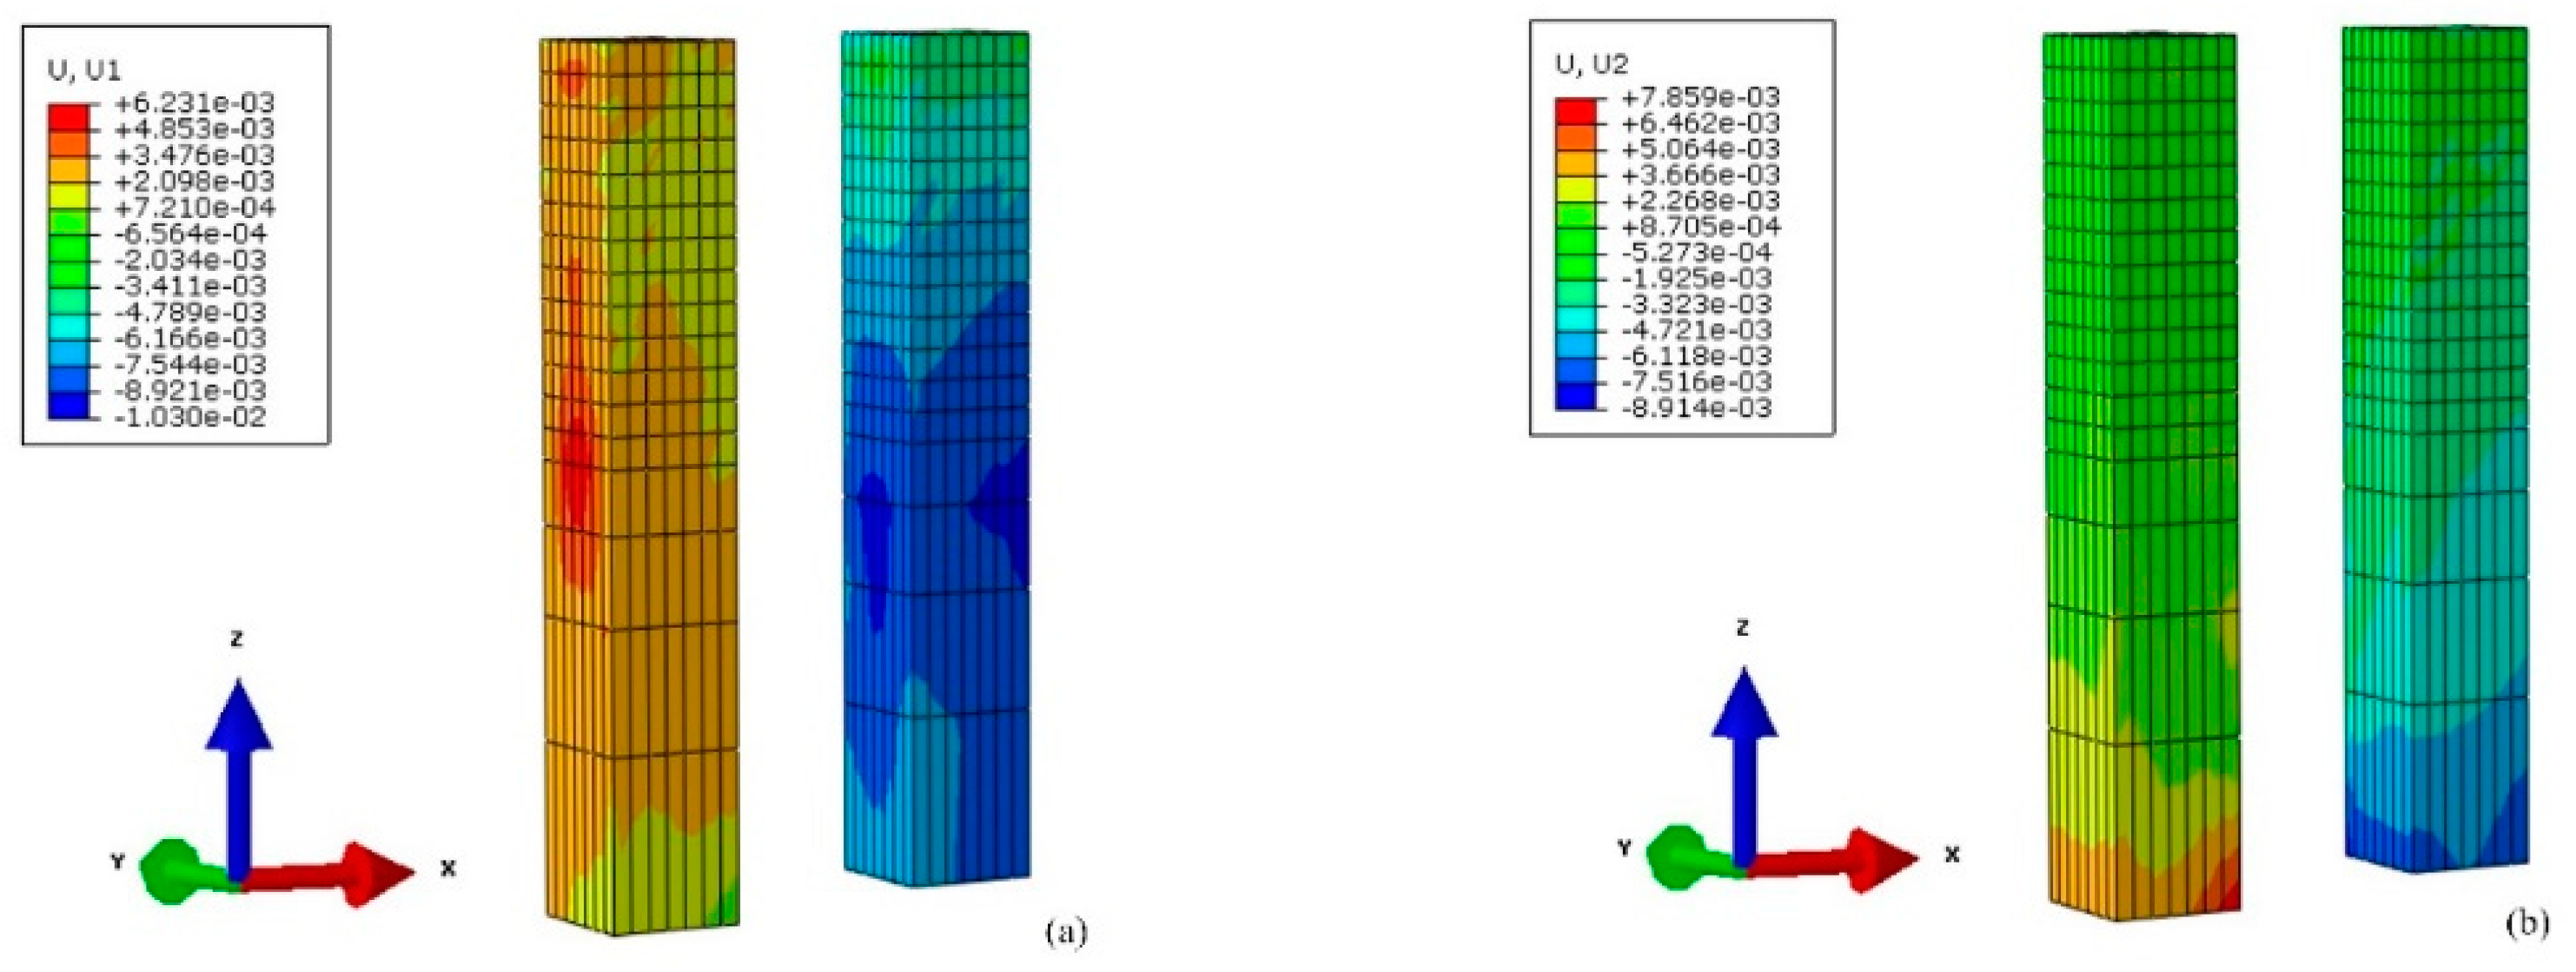
Figure 11.
Displacement contour map of the integrated piles and columns.

Figure 12.
Stress contour maps of the roof of the first underground floor. (a) Process 4; (b) Process 5; (c) Process 6; (d) Process 7; (e) Process 8; (f) Process 9; (g) Process 10.
Figure 12.
Stress contour maps of the roof of the first underground floor. (a) Process 4; (b) Process 5; (c) Process 6; (d) Process 7; (e) Process 8; (f) Process 9; (g) Process 10.
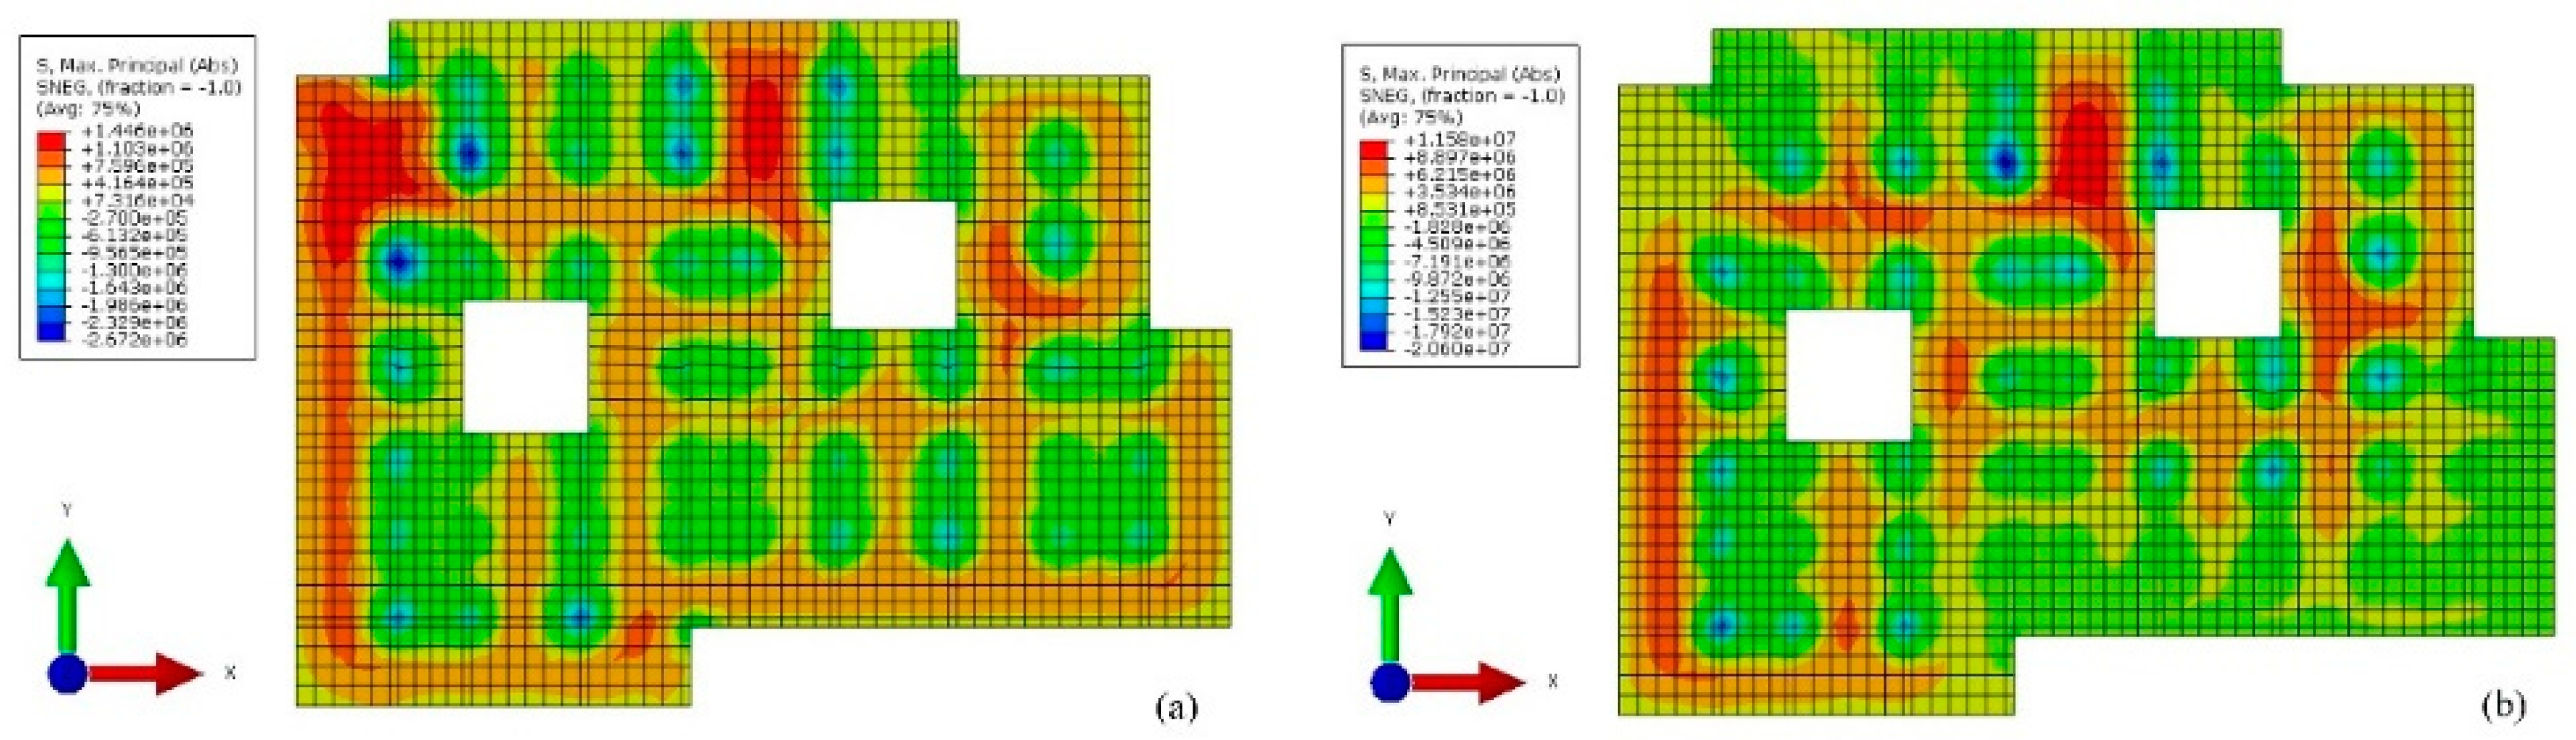
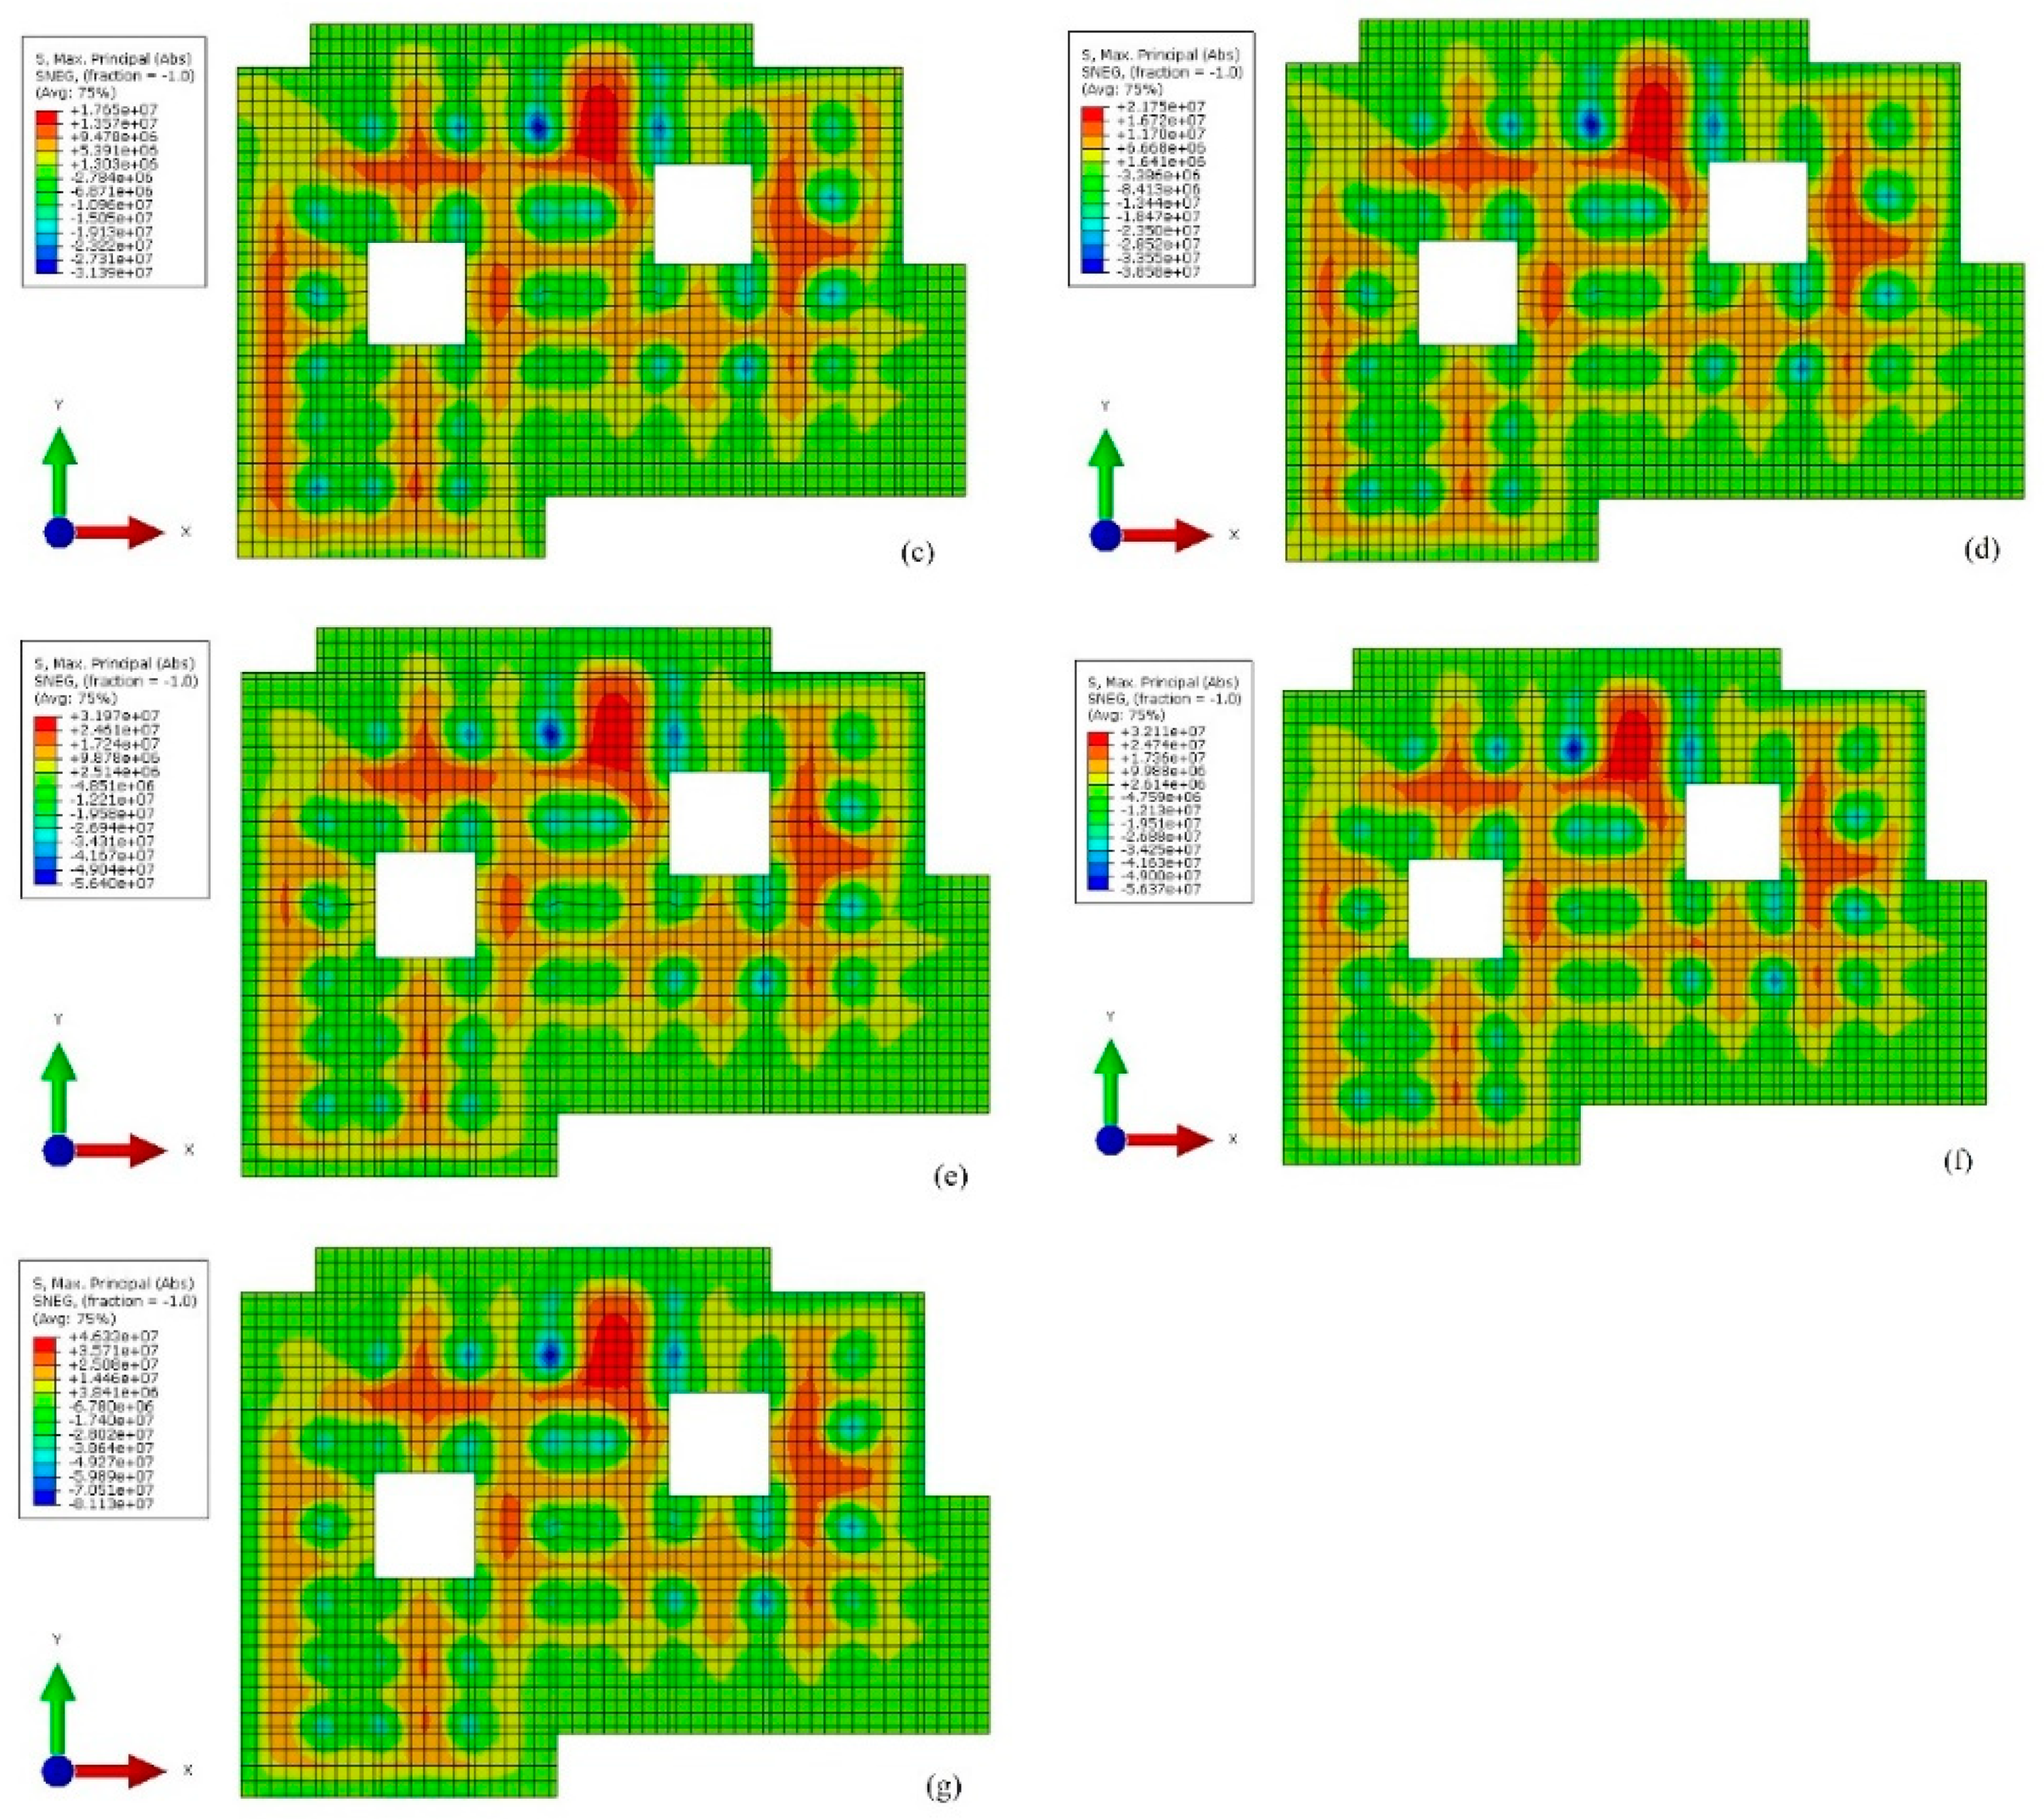
Figure 13.
Bending moment contour maps of the roof of the first underground floor. (a) the X-direction; (b) the Y-direction.
Figure 13.
Bending moment contour maps of the roof of the first underground floor. (a) the X-direction; (b) the Y-direction.
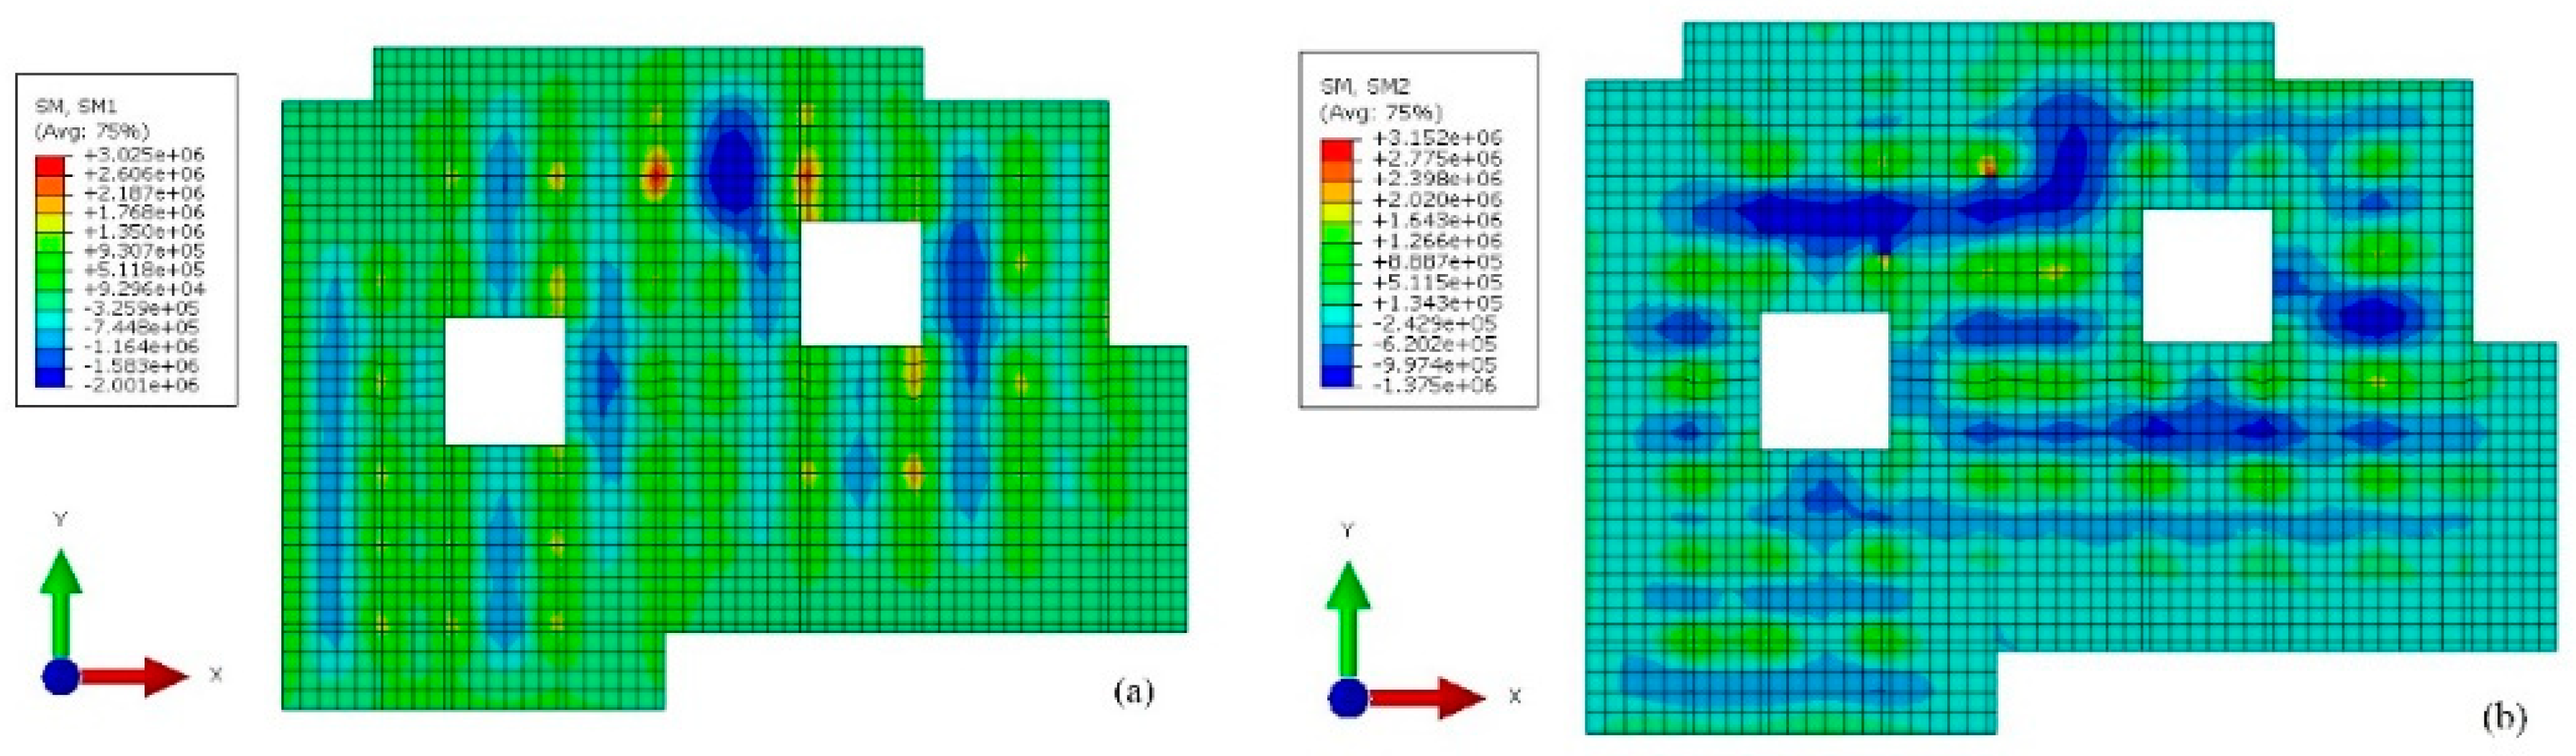
Figure 14.
Cloud map of surrounding ground settlement when the excavated depth is 6.7m.
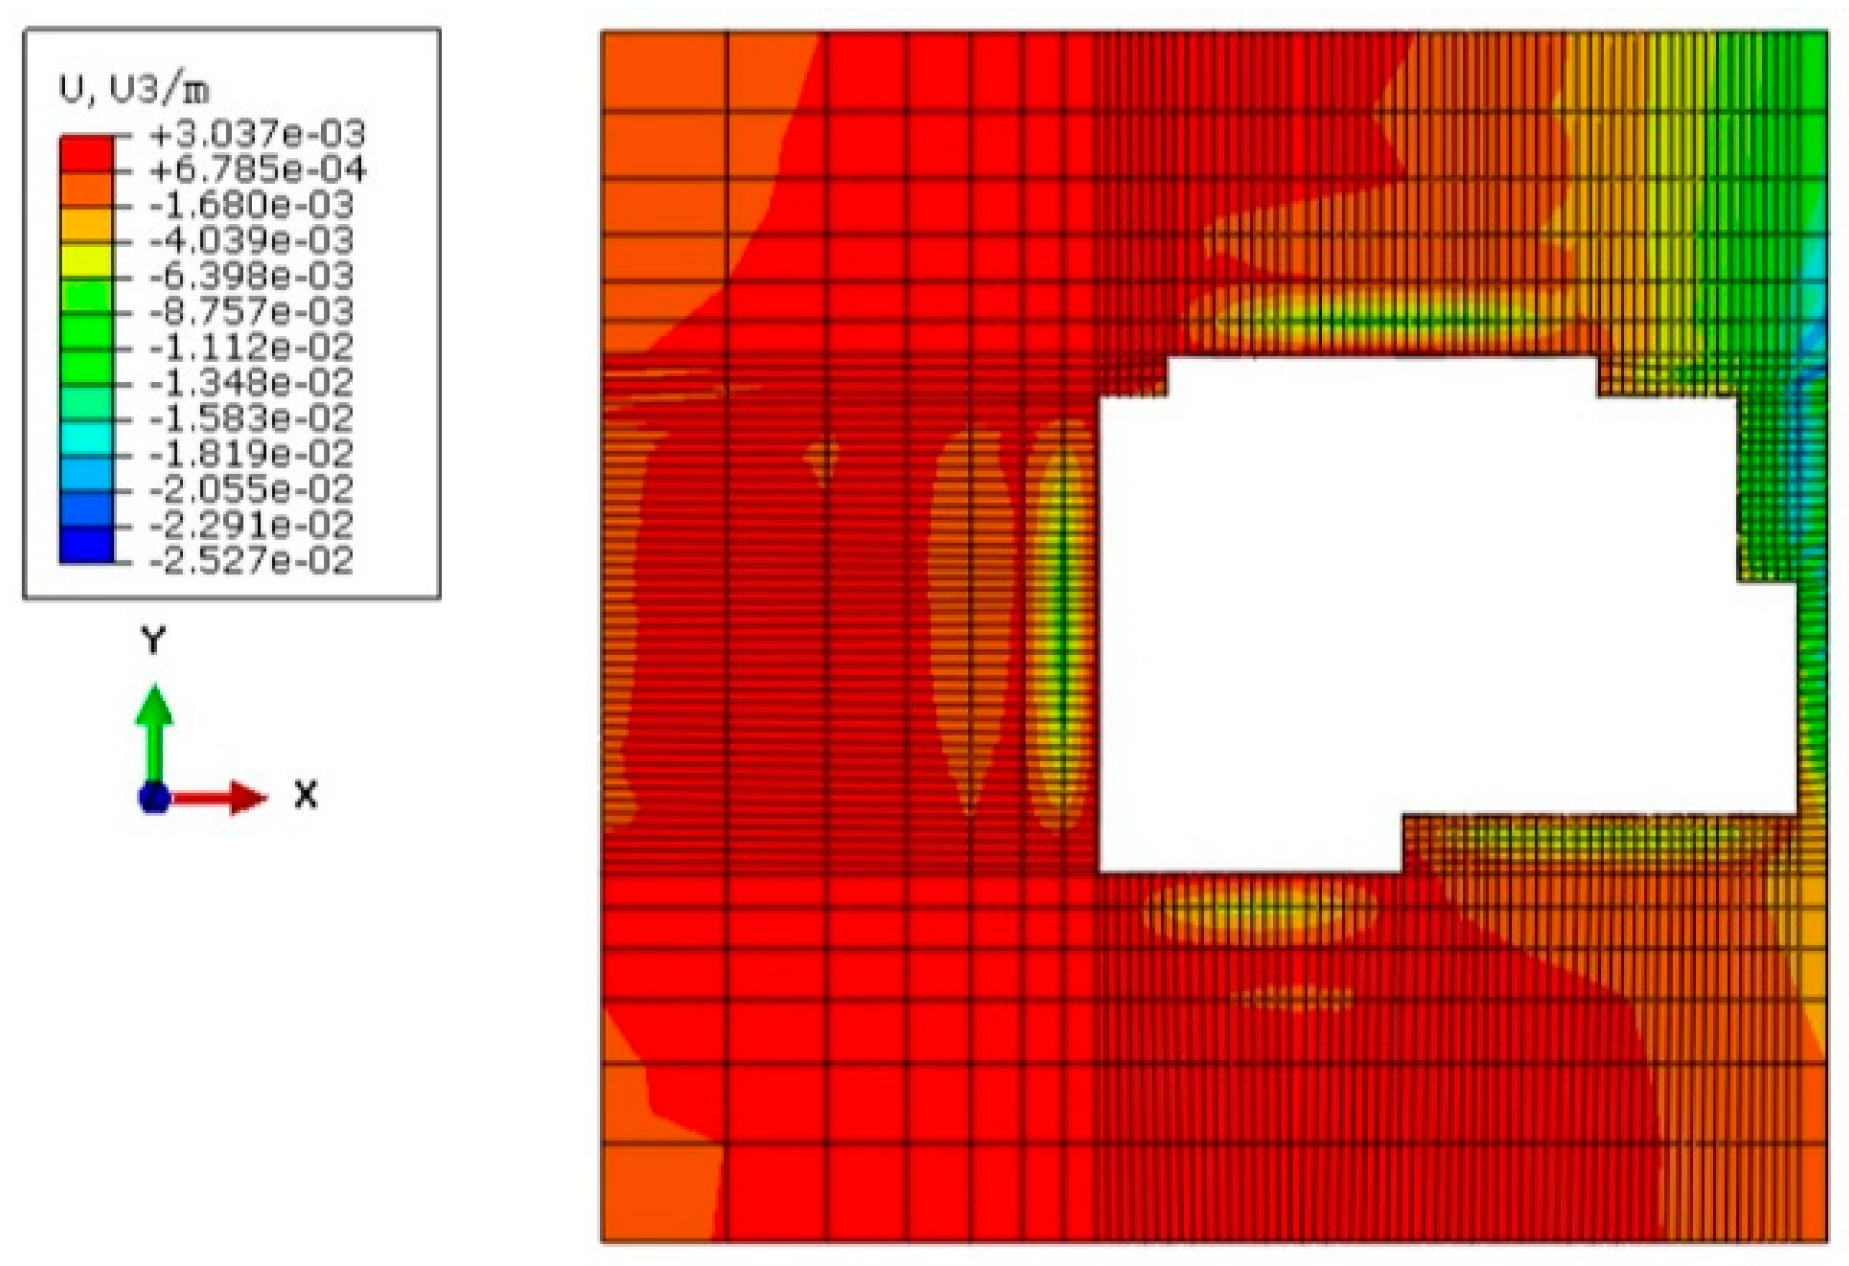
Figure 15.
Ground settlement trough curves. (a)Section I-I; (b) Section II-II; (c) Section III-III; (d) Section IV-IV; (e) Section V-V; (f) Section VI-VI; (g) Section VII-VII; (h) Monitoring sections.
Figure 15.
Ground settlement trough curves. (a)Section I-I; (b) Section II-II; (c) Section III-III; (d) Section IV-IV; (e) Section V-V; (f) Section VI-VI; (g) Section VII-VII; (h) Monitoring sections.
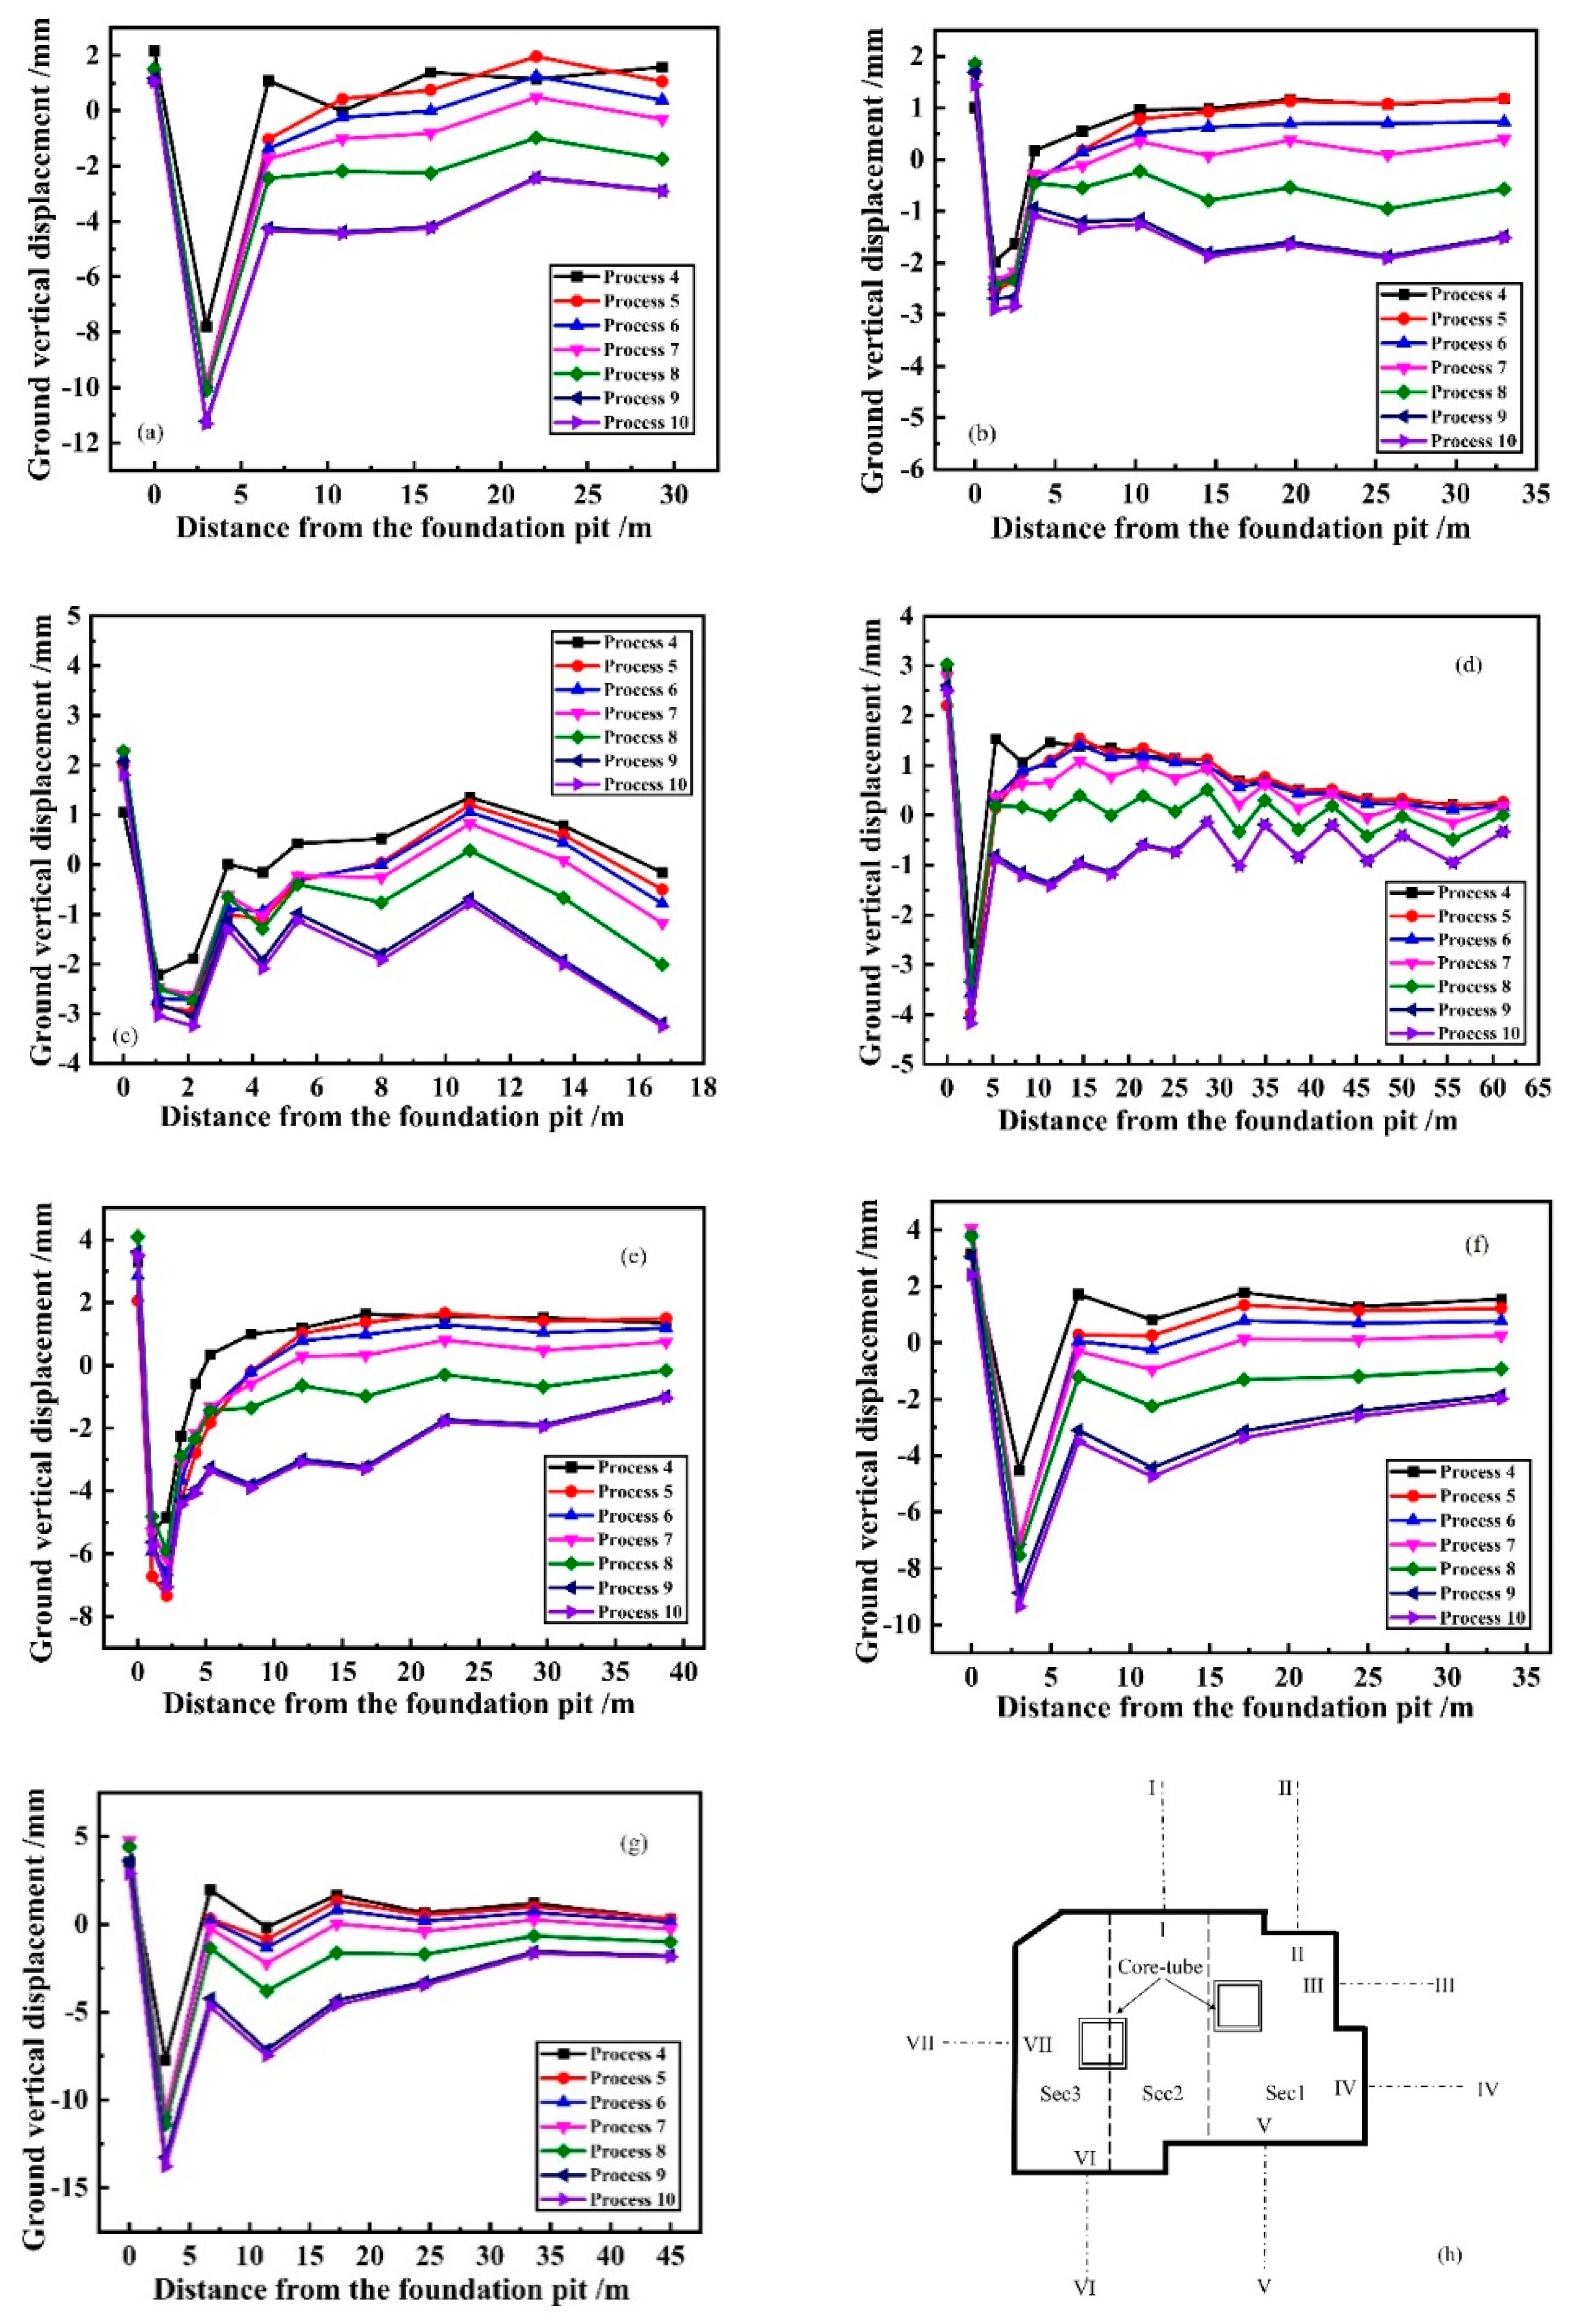
Figure 16.
The horizontal displacement of strata behind the wall.
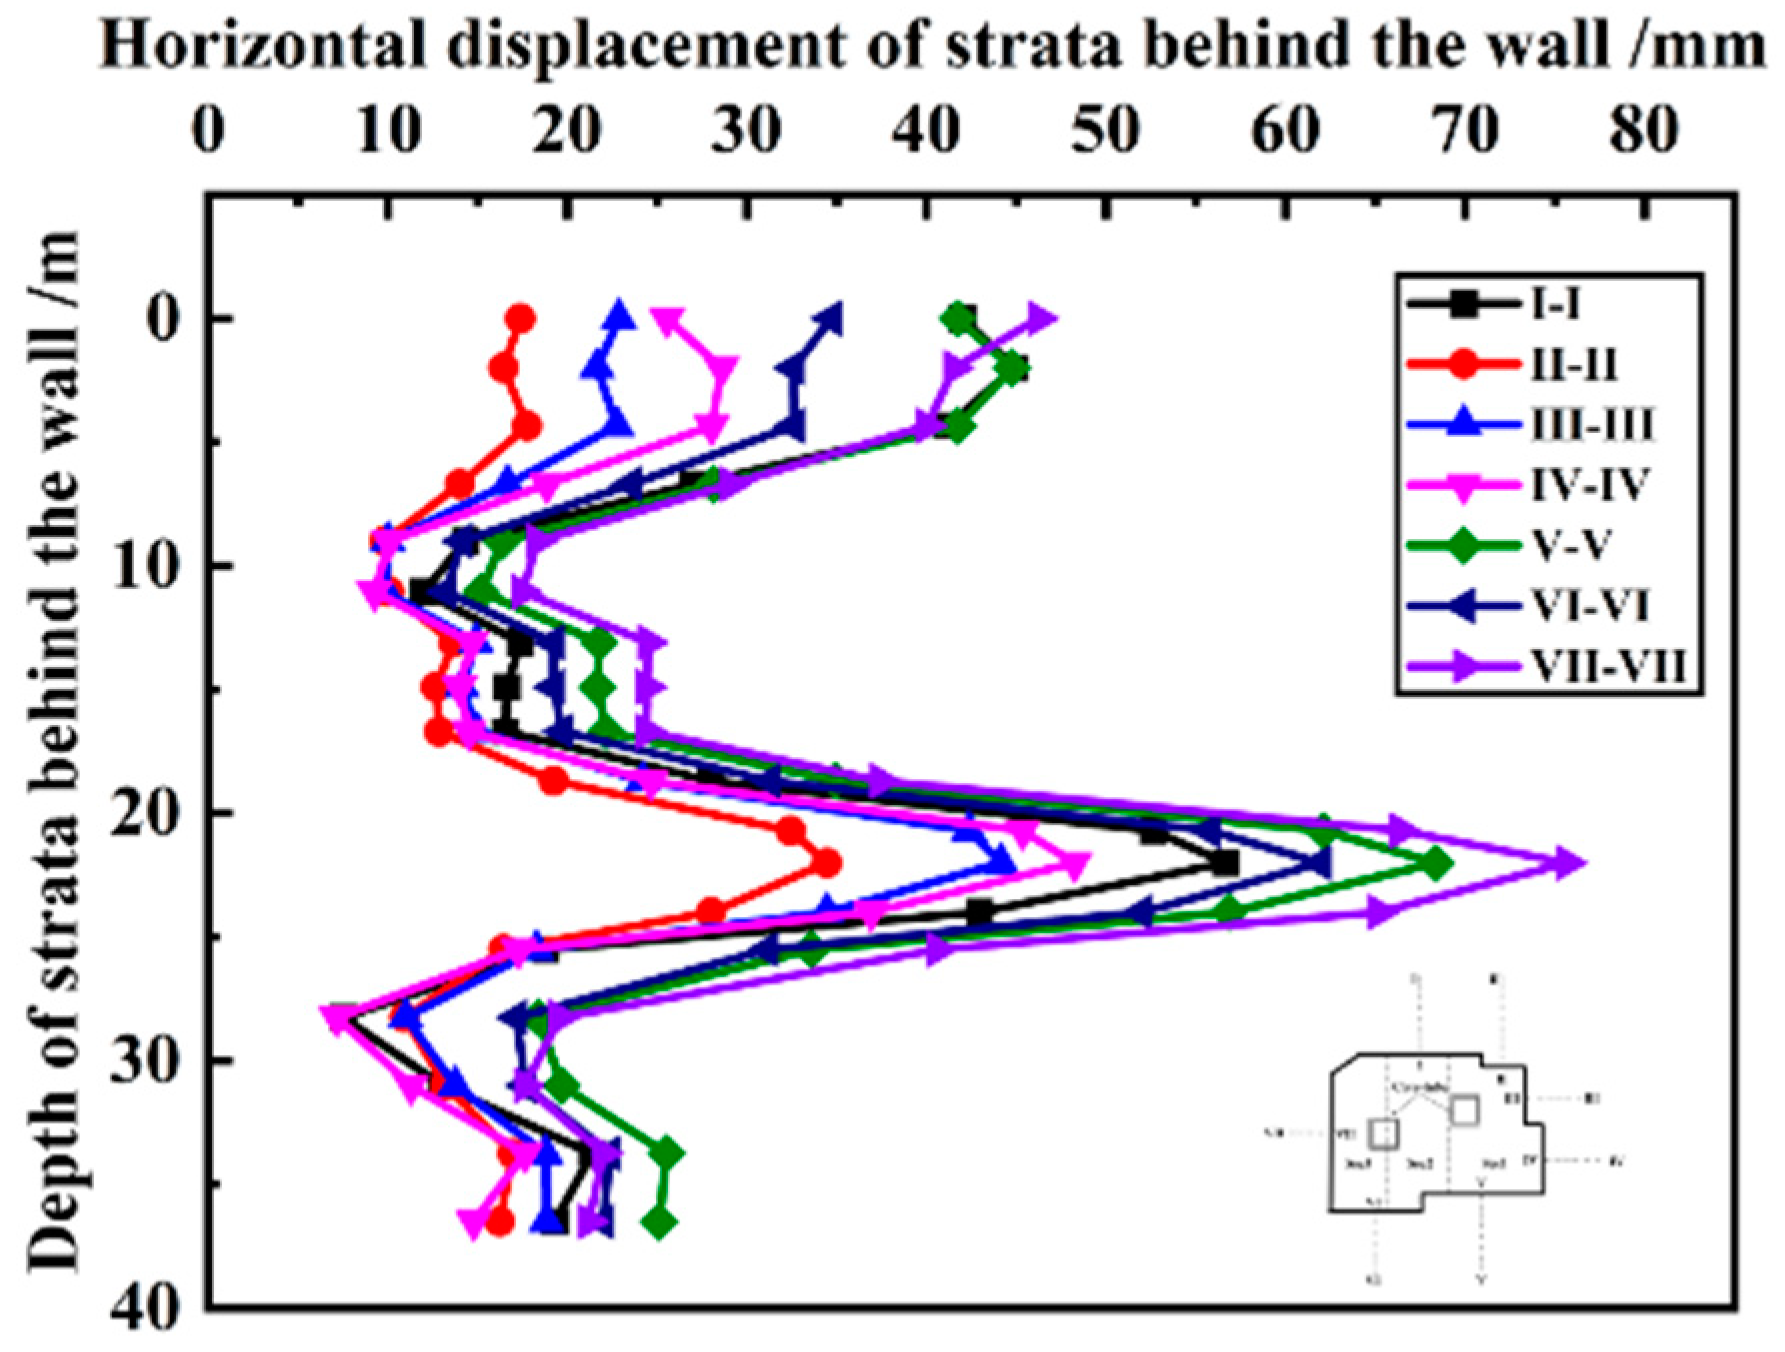
Figure 17.
History curves of the settlement of existing buildings.
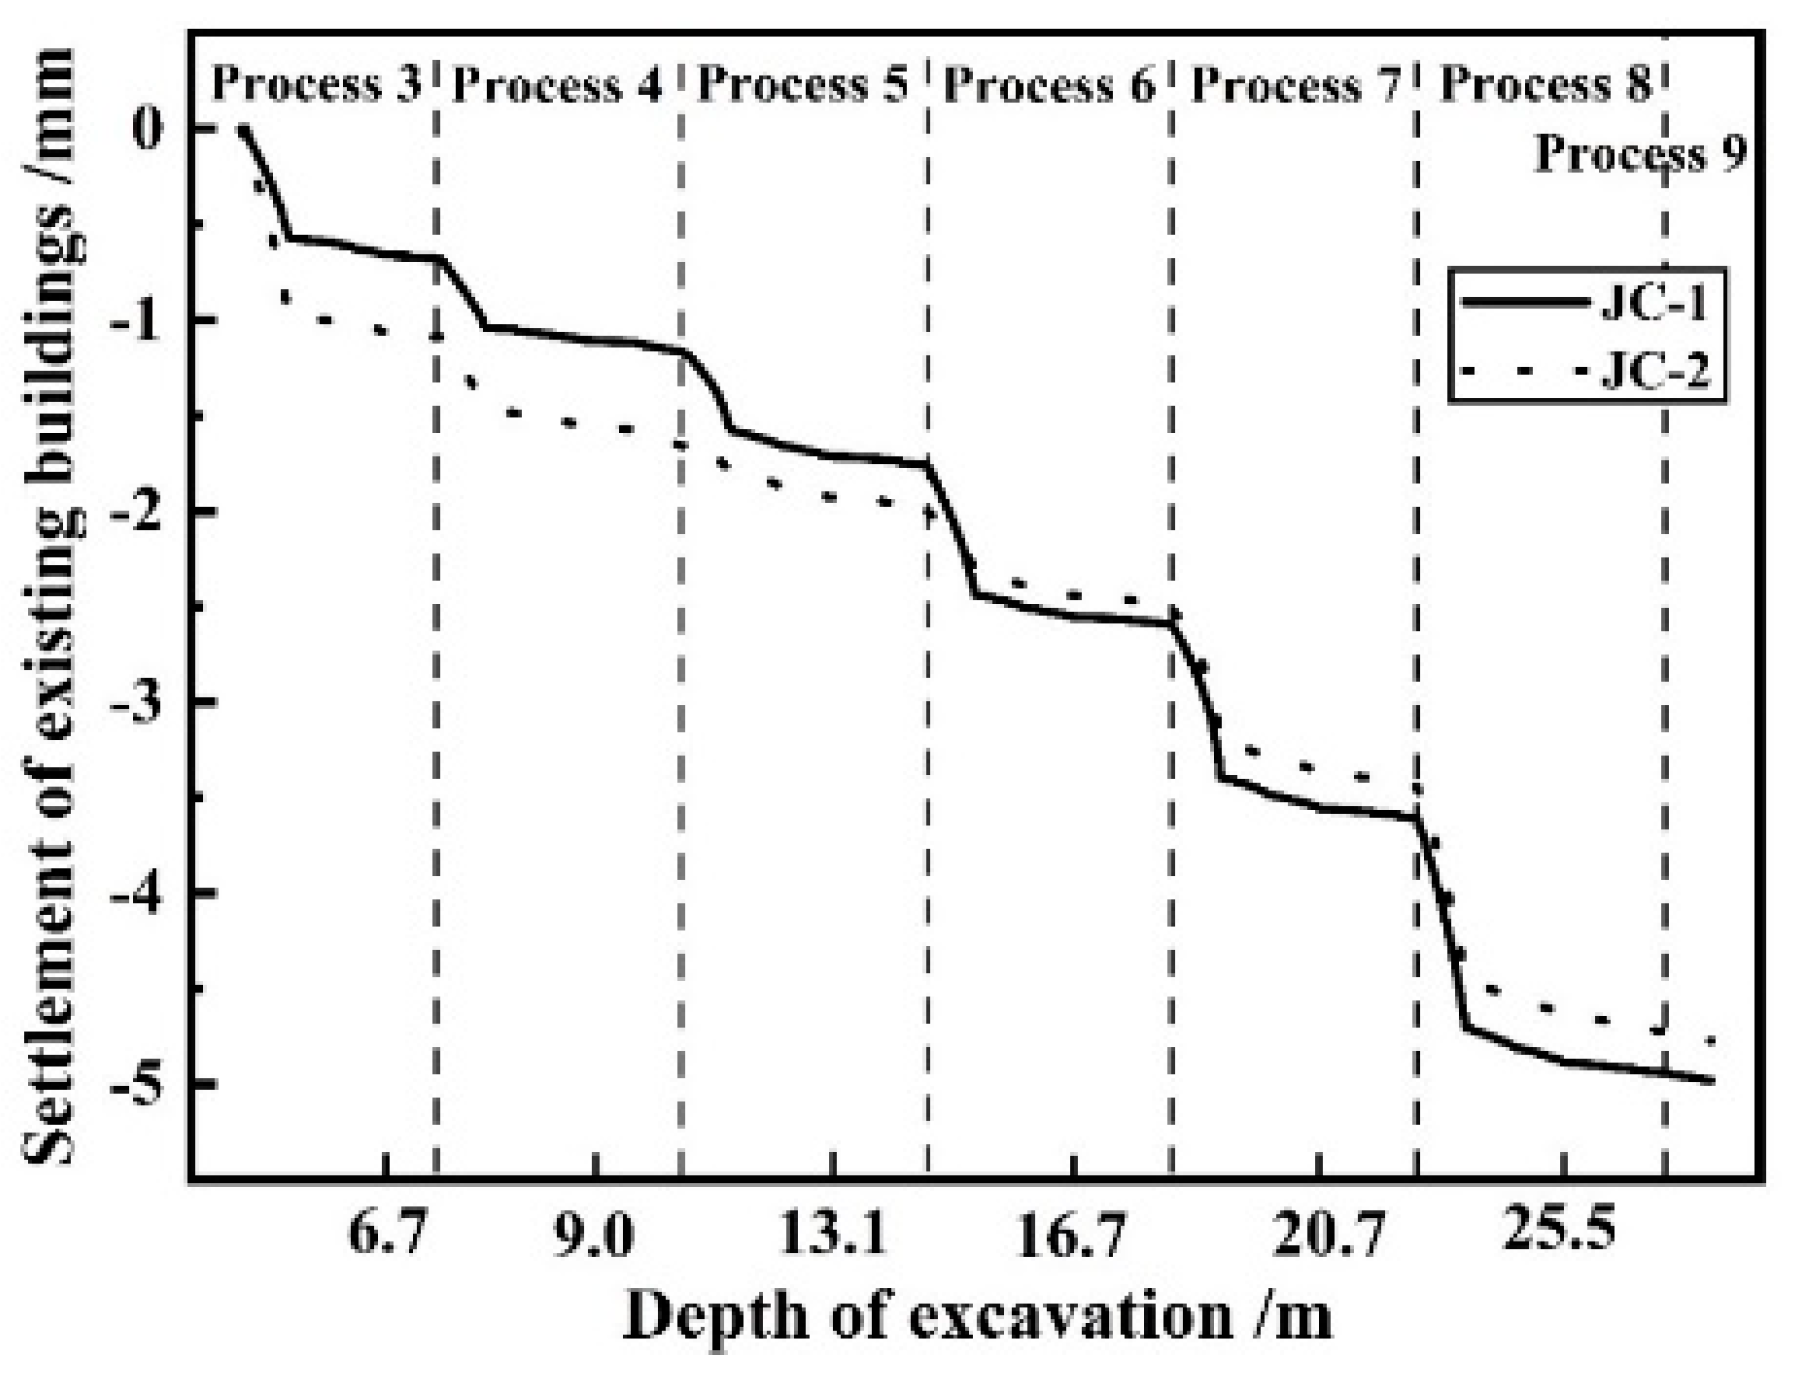
Figure 18.
Horizontal displacement of diaphragm wall. (a) Section III-III; (b) Section VII-VII.
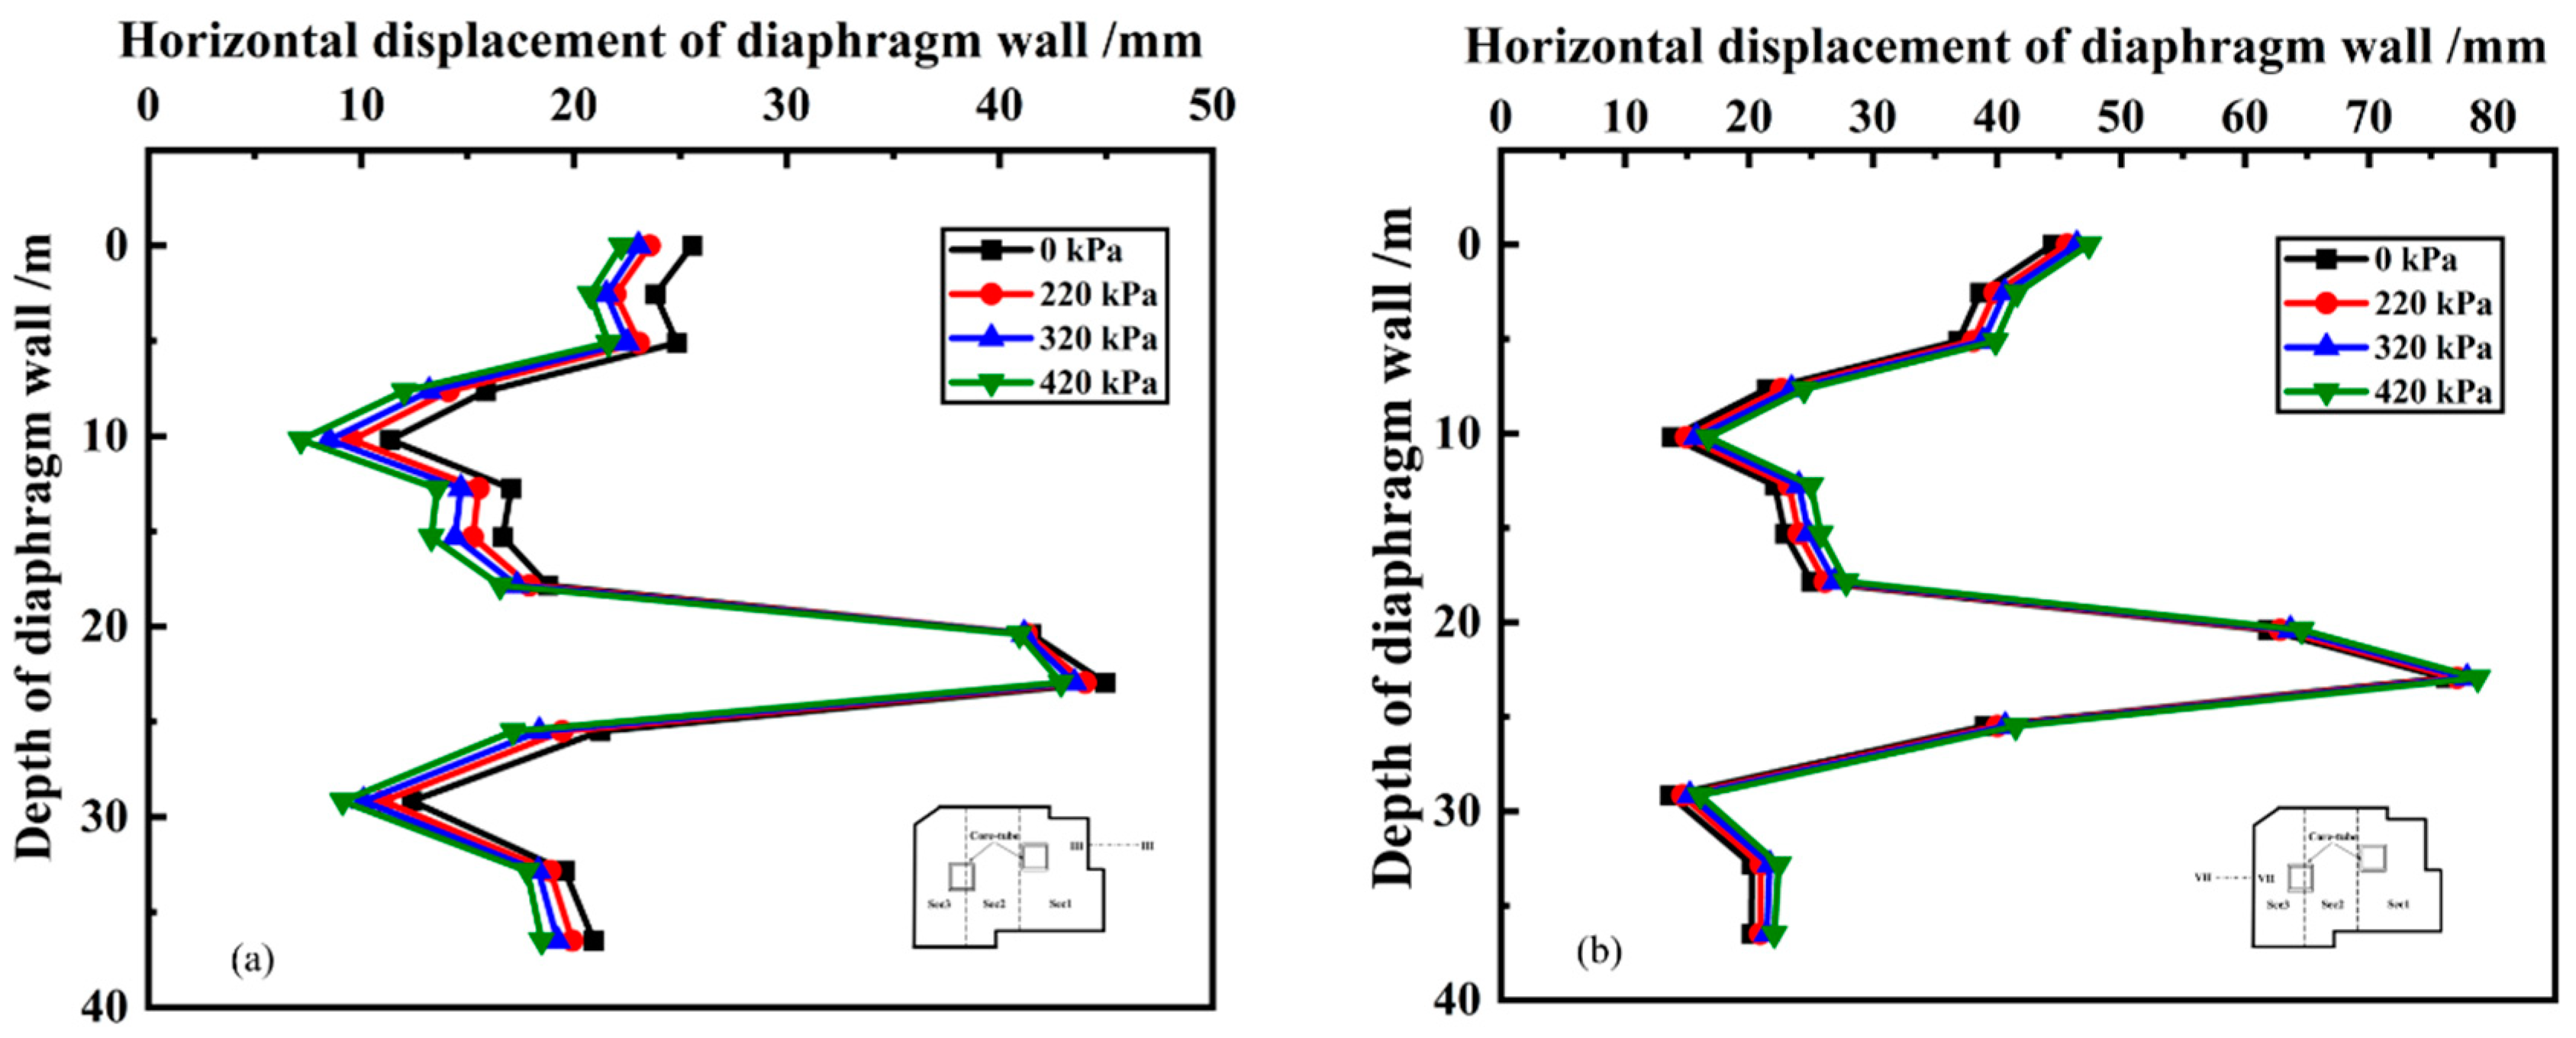
Figure 19.
Ground settlement under different building load. (a) Section III-III; (b) Section VII-VII.
Figure 19.
Ground settlement under different building load. (a) Section III-III; (b) Section VII-VII.
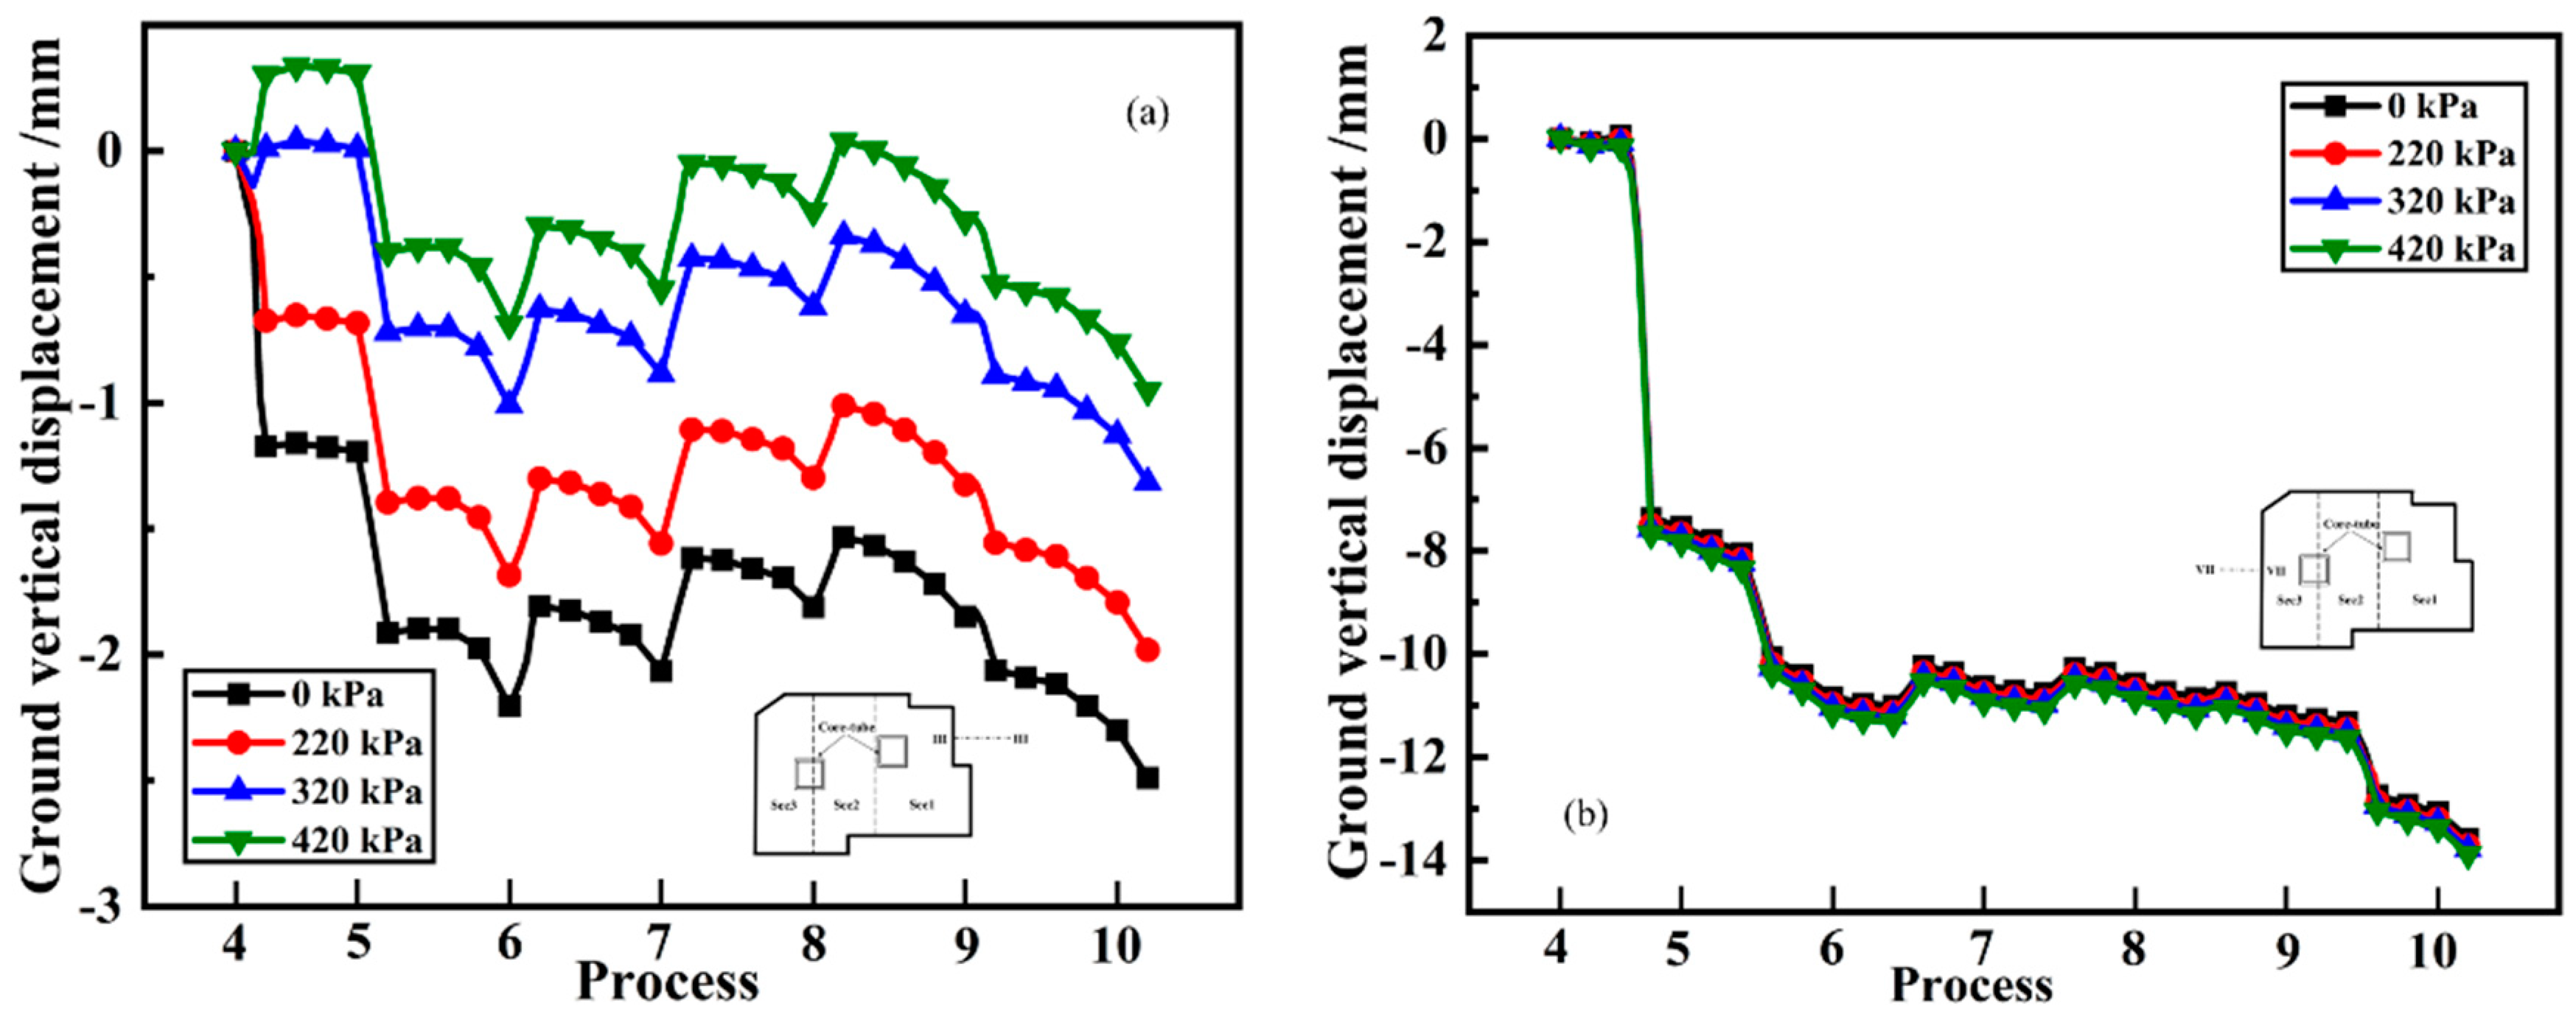
Figure 20.
Horizontal displacement of the diaphragm wall for different conditions. (a) Section V-V; (b) Section VII-VII.
Figure 20.
Horizontal displacement of the diaphragm wall for different conditions. (a) Section V-V; (b) Section VII-VII.
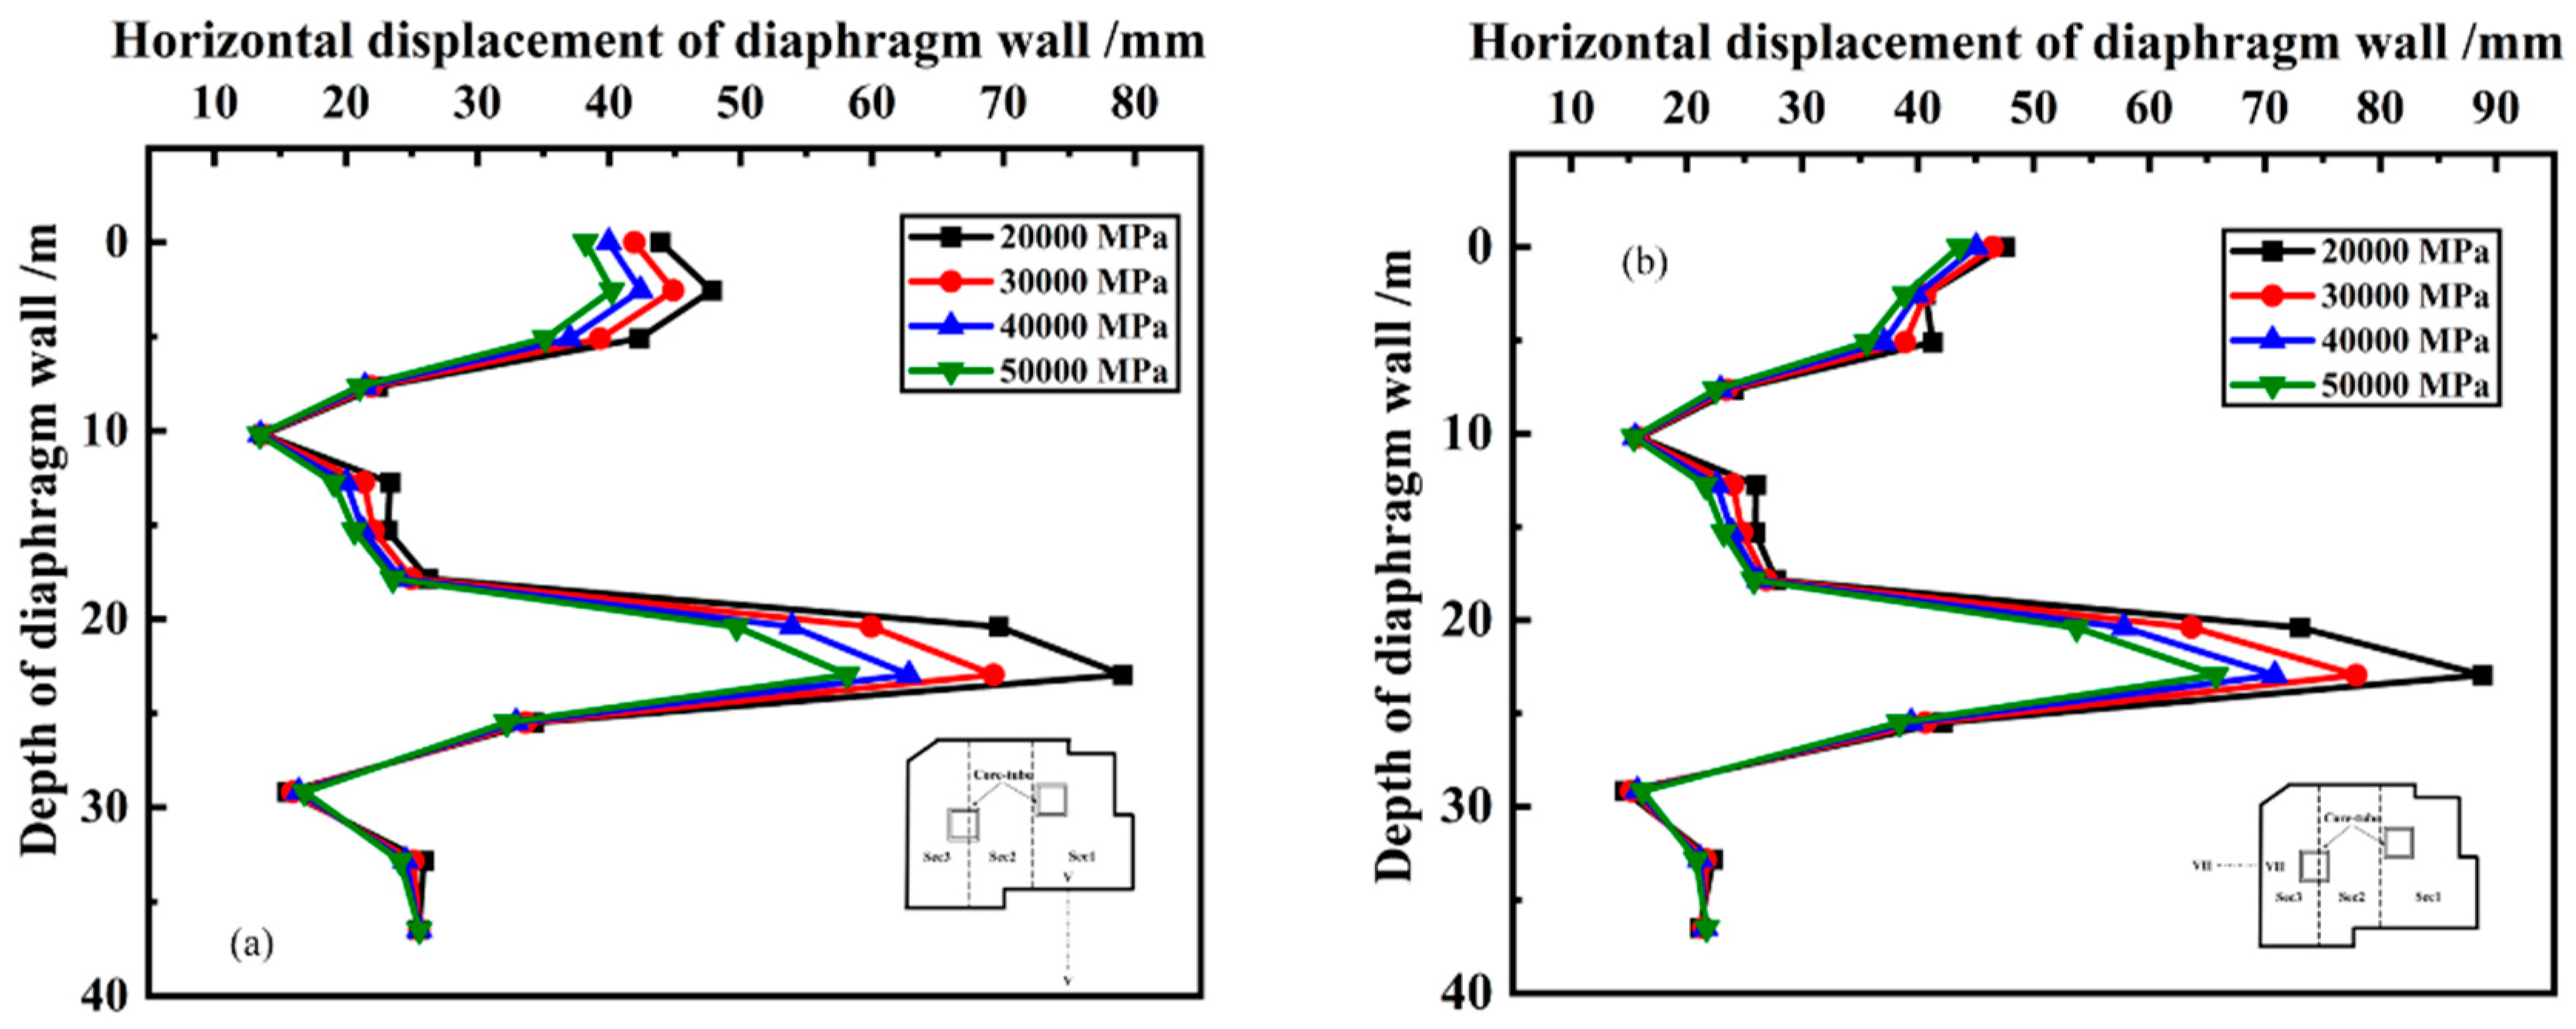
Figure 21.
Settlement of existing buildings for different conditions. (a) JC-1; (b) JC-2.
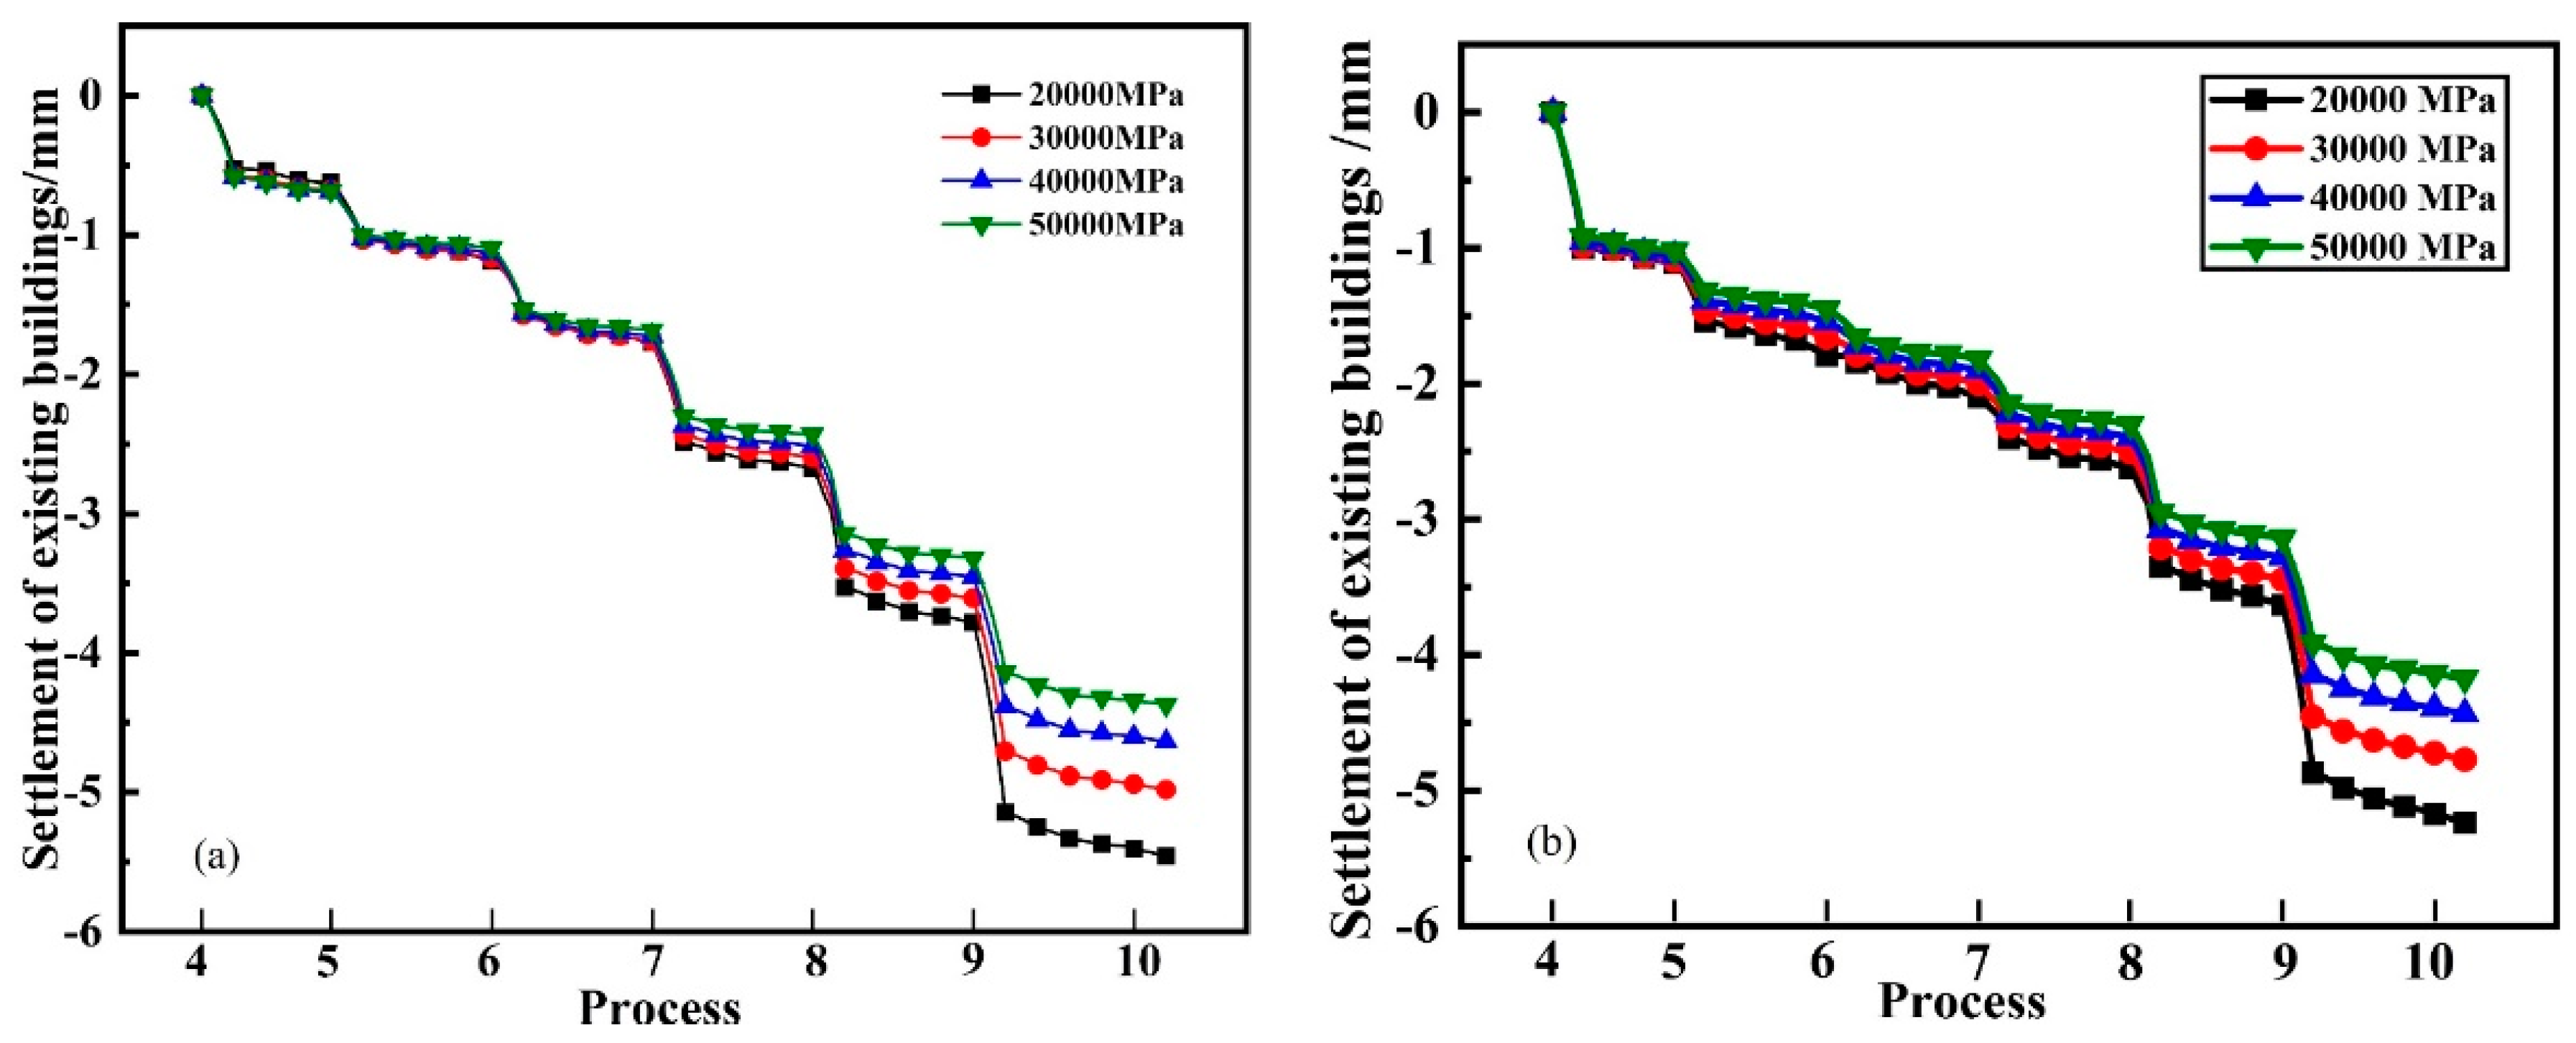

Table 1.
Mechanical properties of soil layers.
| Soil | Thickness H (m) | Unit weight γ (kN/m3) |
Compression modulus Es (MPa) |
Poisson ratio ν |
Cohesive force c (kPa) |
Internal friction angle ϕ (°) |
|---|---|---|---|---|---|---|
| Artificial fill | 2 | 17.9 | 3.7 | 0.30 | 5.0 | 10.0 |
| Silt | 7 | 19.1 | 8.5 | 0.30 | 31.6 | 14.3 |
| Medium sand | 13 | 20.7 | 40.0 | 0.24 | 0 | 40.0 |
| Silty clay | 2 | 19.9 | 15.7 | 0.30 | 31.2 | 14.7 |
| Pebble | 7 | 22.0 | 65.0 | 0.20 | 0 | 42.0 |
| Silty clay | 10 | 20.1 | 31.7 | 0.30 | 14.5 | 26.0 |
| Pebble | 17 | 22.0 | 75.0 | 0.20 | 0 | 42.0 |
| Silty clay | 12 | 19.8 | 35.4 | 0.30 | 15.4 | 26.7 |
Table 2.
Material parameters of structure components.
| Type | Thickness or Diameter t or d (m) |
Elastic modulus E (MPa) |
Poisson ratio ν |
Unit weight γ (kN/m3) |
|---|---|---|---|---|
| Piles | 1.50 | 32500 | 0.2 | 23.4 |
| Columns | 0.80 | 45000 | 0.2 | 24.5 |
| The diaphragm wall | 0.80 | 30000 | 0.3 | 23.4 |
| Core tubes | 0.80 | 37000 | 0.2 | 24.0 |
| The roof of the 1st underground floor | 0.50 | 34500 | 0.2 | 23.7 |
| The roof of the 2nd to the 4th underground floor | 0.25 | 32500 | 0.2 | 23.5 |
| The roof of the 5th underground floor | 0.60 | 32500 | 0.2 | 23.5 |
| The bottom slab of the 5th underground floor | 1.50 | 32500 | 0.2 | 23.5 |
| The side wall | 0.70 | 37000 | 0.2 | 24.0 |
Table 3.
Simulation of cooperative construction processes.
| Process | Clarification of the status |
|---|---|
| 1 | Initial ground stress equilibrium |
| 2 | Apply the existing buildings loads |
| 3 | Construct the diaphragm wall, the core tubes, the pile foundations, and the steel pipe columns |
| 4 | Excavate 6.7m downwards and construct the roof of the 1st underground floor |
| 5 | Excavate 2.3m downwards, construct the bottom slab and the side wall of the 1st underground floor, and construct the superstructure to the 5th floor |
| 6 | Excavate 4.1 m downwards, construct the bottom slab and the side wall of the 2nd underground floor, and construct the superstructure to the 8th floor |
| 7 | Excavate 3.6m downwards, construct the bottom slab and the side wall of the 3rd underground floor, and construct the superstructure to the 10th floor |
| 8 | Excavate 4.0m downwards, construct the bottom slab and the side wall of the 4th underground floor, and construct the superstructure to the 15th floor |
| 9 | Excavate 4.8 m downwards, construct the bottom slab and the side wall of the 5th underground floor |
| 10 | Construct the superstructure from the 16th to the 23rd floor |
Table 4.
The final settlement of existing buildings under different construction sequences.
| The cooperative construction sequence | Settlement of existing buildings (mm) | |
|---|---|---|
| JC-1 | JC-2 | |
| Actual construction sequence | 4.981 | 4.772 |
| Excavate after the construction of the roof of the first underground floor and the superstructure | 4.523 | 4.573 |
| Construct the superstructure after all the substructure are completed | 5.029 | 4.780 |
| Construct the superstructure of the 16th to the 23rd floors during the excavation of the last layer of pit | 4.992 | 4.783 |
| Construct the superstructure during excavation of the 2nd layer of pit | 5.005 | 4.777 |
| Construct the superstructure during excavation of the 3rd layer of pit | 5.089 | 4.795 |
Disclaimer/Publisher’s Note: The statements, opinions and data contained in all publications are solely those of the individual author(s) and contributor(s) and not of MDPI and/or the editor(s). MDPI and/or the editor(s) disclaim responsibility for any injury to people or property resulting from any ideas, methods, instructions or products referred to in the content. |
© 2024 by the authors. Licensee MDPI, Basel, Switzerland. This article is an open access article distributed under the terms and conditions of the Creative Commons Attribution (CC BY) license (http://creativecommons.org/licenses/by/4.0/).
Copyright: This open access article is published under a Creative Commons CC BY 4.0 license, which permit the free download, distribution, and reuse, provided that the author and preprint are cited in any reuse.


