
Submitted:
03 December 2024
Posted:
04 December 2024
You are already at the latest version
Abstract
In this study, polyethylene terephthalate (PET) was substituted for concrete at 10%, 20%, and 30% of the sand volume. Compressive, splitting tensile and flexural strength tests were applied to concrete samples and stress-strain graphs were obtained. It was observed that PET substitution caused a decrease in the mechanical properties of the concrete. For this reason, the concrete with the best PET substitution rate was reinforced by wrapping it with carbon fiber reinforced polymer (CFRP) and glass fiber reinforced polymer (GFRP), and the same experiments were repeated. It was observed that the damage caused by PET substitution could be compensated by the wrapping. In addition, this study provides a comprehensive database by bringing together experimental data from studies in which PET was substituted by volume or weight instead of fine aggregate in concrete. Based on the experimental results and literature data, model suggestions for PET-substituted concrete were made. The models proposed in this study, along with previous models, were tested for applicability. Similarly, the model suggestions in the literature for fiber reinforced polymer (FRP)-confined concrete were tested with the experimental data in this study, and their suitability for PET-substituted concrete was discussed.
Keywords:
PET granules
; Recycle
; FRP wrapping
; Experimental database
; Model suggestion
1. Introduction
Polyethylene terephthalate (PET) is a polymer of great importance among the world's plastics. Thermoplastic recyclability makes it the first choice for various applications [1]. PET, a polyester plastic, is one of the most used packaging materials in beverages. Due to its excellent transparency, light weight, gas and water barrier properties, impact resistance, UV resistance and unbreakability, the production and use of PET bottles for beverage packaging has continuously increased worldwide [2]. With this increase in production and use, recycling solutions for PET began to be produced. PET is seen as one of the plastic types with the highest recycling rate today [3,4,5,6,7].
PET can be recycled in the construction industry as well as in the plastics industry. Reusing plastics such as PET instead of aggregates in concrete is seen as an event that can contribute to environmental protection and sustainable development [8]. It is thought that the use of PET in concrete as a partial or complete replacement for natural aggregates can protect natural aggregate resources [9]. For this purpose, there are many studies examining various properties of concrete by using PET as a fine aggregate replacement in concrete [10,11,12,13,14,15,16,17,18,19,20,21,22,23,24,25,26,27,28,29,30,31,32,33,34]. When the study results were examined, it was seen that the use of PET generally caused a decrease in the mechanical properties of concrete. It is thought that strengthening methods can be used to compensate for the possible decrease in mechanical properties due to the use of PET. In a study [35], it was stated that wrapping PET substituted concrete with carbon fiber reinforced polymer (CFRP) could be one of these methods.
A frequently used technique to strengthen existing reinforced concrete structures is the use of fiber reinforced polymer (FRP) systems. It is clearly understood that lateral confinement of concrete can significantly increase its strength and ductility. With the introduction of FRP composites into the construction industry, the use of FRP as a wrapping material has attracted great attention [36]. The main advantage of FRP systems is that FRP materials have low mass and high tensile capacity and can provide greater durability when installed properly [37]. FRP is widely used in the construction of new structures and rehabilitation of old structures due to its non-corrosive properties and high strength/weight ratios [38]. The majority of concrete wrapping studies with FRP to date have been done on CFRP and GFRP [39].
In this study, sand in concrete was partially replaced with PET in order to protect natural resources and recycle PET. The results and models of similar studies in literature were brought together and the connections between the experimental results were interpreted. The mechanical properties of concrete have been tried to be increased by using CFRP and GFRP. Similarly, an evaluation was made with studies in literature.
2. Experimental Study
2.1. Materials
CEM I 42.5 R Portland cement, produced in accordance with the EN 197-1 standard of the Marmara Cimento brand, was used in concrete production. Chemical and physical properties of cement are given in Table 1.
Sieve analysis was carried out separately for coarse aggregate (Gravel) and fine aggregate (Sand) in accordance with EN 933-1 standard. Grading curves obtained from sieve analysis are given in Figure 1.
PET granules used in the study were supplied from a plastic recycling company in Turkey. The image of PET granules is given in Figure 2. The properties of PET granules and aggregates are given in Table 2.
CFRP and GFRP were supplied for wrapping around concrete samples. FRP properties are given in Table 3 and visuals are given in Figure 3.
Epoxy was used to bond FRP and concrete together. Epoxy properties are given in Table 4.
2.2. Concrete Samples Mix Design and Naming
Concrete production was carried out with the help of a concrete mixing machine. In all samples, the amounts of water, cement and coarse aggregate were kept constant. The water/cement ratio was determined as 0.5. In samples using PET material, the substitution process was carried out as 10%, 20% and 30% of the sand by volume. In the samples with FRP wrapping, after the 28-day curing pool process, epoxy was applied around the concrete and the FRP wrapping process was carried out.
The sample names for the tests followed specific conventions: "CS" for compressive strength, "STS" for splitting tensile, and "FS" for flexural strength. Samples containing PET granules included "PET" in their names, while reference samples without PET were labeled with "R." The substitution percentages were also included. Samples wrapped in carbon FRP were named with "CFRP," and those with glass FRP were labeled "GFRP." Table 5 lists the characteristics and naming details of the samples.
2.3. Methods
The concrete was mixed in a concrete mixing machine, then transferred to the test funnel for a slump test. The concrete was transferred in two stages. After filling half of the funnel, the filling process was paused, and the test rod was dipped into the concrete 25 times. Once this was done, the funnel was completely filled with concrete. After filling was completed, the test rod was dipped into the concrete 25 more times. The upper level of the funnel was leveled off, and the funnel was lifted to release the concrete. The released concrete collapsed at varying heights. The difference between the upper level of the funnel and the upper level of the concrete determined the slump value.
Cylindrical samples, each 10 cm in diameter and 20 cm in height, were created for the compressive strength and splitting tensile tests. Samples with 10x10 cm cross-sectional dimensions and 40 cm in length were produced for the flexural strength tests. While creating the reference concrete samples, 25 Mpa was determined as the target strength. All samples were kept in the curing pool for 28 days after they were produced. The samples coming out of the curing pool were dried and weighed and their densities were found. Compressive strength and splitting tensile strength tests were carried out using the laboratory facilities of Sakarya University, while flexural strength tests were carried out using the laboratory facilities of Sakarya University of Applied Sciences.
In the compressive strength test, cylindrical samples were placed in compressometers with potentiometers that can measure displacements in axial and horizontal directions. Strain gauges were placed on the samples in axial and horizontal directions. The displacement values were found by taking the average of the values in the strain gauges and potentiometers. The samples were taken to the hydraulic pressure machine with the compressometers and loaded in the axial direction at a speed of 0.5 MPa. In the splitting tensile test, a cage mechanism was created so that the cylindrical samples would be subjected to tensile force. The samples were placed horizontally in the pressure machine and loaded at a speed of 0.5 MPa. In the flexural strength test, prismatic samples were subjected to a 3-point bending test and the loading speed was determined as 5 mm/min. Visuals related to the experimental setups are given in Figure 4.
2.4. Experimental Results
2.4.1. Slump
The results of the slump tests are given in Figure 5. The slump value was measured as 48 mm in the reference concrete. Gradual decreases were observed in the slump value as the PET substitution rate increased. The slump value decreased by 6.25% to 45 mm in the case of 10% PET substitution, by 16.67% to 40 mm in the case of 20% PET substitution, and by 20.83% to 38 mm in the case of 30% PET substitution.
2.4.2. Density
The results of the density tests are given in Figure 6. The density value in the reference concrete was measured as 2307.88 kg/m3. As the PET substitution rate increased, gradual decreases were observed in the density value. The density value decreased by 1.57% to 2271.66 kg/m3 in the case of 10% PET substitution, decreased by 3.18% to 2234.49 kg/m3 in the case of 20% PET substitution, and decreased by 5.63% to 2177.94 kg/m3 in the case of 30% PET substitution.
2.4.3. Compressive Strength
The stress-strain graphs obtained as a result of the compressive strength tests performed on samples without FRP are given in Figure 7. The maximum compressive strengths of the samples (), axial strain () and lateral strain () values at maximum compressive strength are given in Table 6. Compressive strength in the reference concrete was measured as 26.91 MPa. As the PET substitution ratio increased, the compressive strength decreased. Compressive strength decreased by 6.68% to 25.11 MPa in case of 10% PET substitution, by 13.36% to 23.31 MPa in case of 20% PET substitution, and by 18.99% to 21.80 MPa in case of 30% PET substitution. Axial and lateral strain values increased with the increase of PET substitution ratio, contrary to the trend in compressive strength. Axial strain values increased by 2.83%, 7.58% and 7.92% for 10%, 20% and 30% substitution, respectively. These rates were 2.95%, 14.71% and 21.50% for lateral strain values.
Stress-strain graphs of samples using FRP and the sample with 10% PET substitution are given in Figure 8. Maximum compressive strengths (), axial strain () and lateral strain () values at maximum compressive strength of samples using FRP are given in Table 7. The FRP wrapped around the 10% PET substituted sample had a significant effect on the compressive strength and strain values. Although the strength value of the 10% PET substituted sample was lower than the reference sample, it exceeded the strength value of the reference sample thanks to the CFRP and GFRP wrapped around it. The strength value of the 10% PET substituted sample increased by 1.91 times from 25.11 to 47.86 when it was wrapped with CFRP. It increased by 1.54 times to 38.66 when it was wrapped with GFRP. The axial strain values increased by 6.83 times in the CFRP wrapping case and 7.15 times in the GFRP wrapping case. The lateral strain values increased by 11.10 and 13.04 times for CFRP and GFRP, respectively.
2.4.4. Splitting Tensile Strength
The results of the splitting tensile strength test are given in Table 8. The splitting tensile strength of the reference concrete was found to be 2.46 MPa. The increase in PET substitution rate caused decreases in splitting tensile strength values. The splitting tensile strength decreased by 4.47% to 2.35 MPa in the case of 10% PET substitution, by 8.93% to 2.24 MPa in the case of 20% PET substitution, and by 12.11% to 2.16 MPa in the case of 30% PET substitution. The positive effect of FRP was observed in the splitting tensile strength tests as well as in the compressive strength tests. The splitting tensile strengths of the samples with 10% PET substitution reached 3.45 MPa thanks to the use of CFRP and 3.04 MPa thanks to the use of GFRP.
2.4.5. Flexural Strength
Figure 9 shows the graphs obtained as a result of the flexural strength tests of samples without FRP. Table 9 shows the flexural strength and maximum strain values of the samples. The flexural strength of the reference concrete was measured as 3.37 MPa. As the PET substitution rate increased, there were decreases in the flexural strength. The flexural strength decreased by 4.18% to 3.23 MPa in the case of 10% PET substitution, by 7.98% to 3.10 MPa in the case of 20% PET substitution, and by 11.17% to 3.00 MPa in the case of 30% PET substitution. The maximum strain values increased with the increase in the PET substitution rate. The maximum strain increased by 9.36%, 16.16% and 21.90% for the 10%, 20% and 30% substitution cases, respectively.
In Figure 10, flexural stress-flexural strain graphs of samples using FRP and 10% PET substituted sample are given. Table 10 shows the maximum flexural strengths and maximum strain values of samples using FRP. The 10% PET substituted sample managed to exceed the reference sample in terms of compressive and splitting tensile strength as well as flexural strength thanks to the CFRP and GFRP wrapped around it. The flexural strength value of the 10% PET substituted sample increased by 1.42 times when CFRP was wrapped around it, reaching 4.59 MPa. In the case of GFRP wrapping, it increased by 1.27 times and reached 4.09 MPa. The maximum strain values increased by 5.40 times when CFRP was wrapped, and by 5.84 times when GFRP was wrapped.
2.4.6. Modulus of Elasticity
Table 11 shows the elasticity modulus of the samples obtained from the graphs of the compressive strength test. The elasticity modulus of the reference concrete was found to be 30574.17 MPa. Increasing the PET substitution rate decreased the elasticity modulus. The elasticity modulus decreased by 10.96% to 27221.85 MPa in the case of 10% PET substitution, decreased by 18.03% to 25061.49 MPa in the case of 20% PET substitution, and decreased by 30.27% to 21320.87 MPa in the case of 30% PET substitution. The use of FRP increased the elasticity modulus of the 10% PET substitution sample very little, but the value of the reference sample could not be achieved. The elasticity modulus of the 10% PET substitution sample reached 27512.26 MPa with the use of CFRP and 27465.83 MPa with the use of GFRP. The slopes in the second part of the graph were 1704.56 in case of using CFRP and 988.90 in case of using GFRP.
3. Experimental Database and Model Development
In this section, experimental databases were collected separately for PET-substituted concrete and FRP-confined concrete from the literature, and the results of this study were added to these databases. Model proposals were made for various properties of PET-substituted concrete based on the collected database. The applicability of the proposed models and previously proposed models was checked.
Table 12 provides statistical metrics and their explanations for calculating how the results suggested by the models align with the experimental results. In Table 12, while calculating R2 (Coefficient of determination), MABE (Mean absolute bias error) and MAPE (Mean absolute percentage error) values, represents the experimental results, represents the model prediction, represents the average of the experimental results, represents the average of the model predictions.
3.1. PET Substituted Concrete
The results obtained for PET substituted concrete in the study were combined with previous experimental data in the literature and are given in Table 13. While creating Table 13, the following details were considered:
- Only studies in which fine aggregate substitution was performed were considered, coarse aggregate substitution was not considered;
- Only granular substitution was used, fiber substitution was not used;
- Only concrete samples were added to the table, mortar samples and self-compacting concrete samples were not added;
- Only PET substituted samples were used and no other type of plastic was used;
- For the compressive strength (CS), tensile strength (TS) and flexural strength (FS) tests, only 28-day data were collected and added to the table;
- If cube samples were used for the compressive and tensile strengths, the cylinder strengths were found by multiplying by 0.8 and written in a separate column in the table;
- Modulus of elasticity (MoE) values of the samples are in the table;
- Substitutions made were divided into two as volume (Vol) and weight (Wei);
- Sample dimensions used during the experiments are given in the table. If sample dimensions are not mentioned and the standard complied with is mentioned, the standard complied with is added to the table;
- Specific gravity and bulk density of PET material are given in the table;
- Sizes of PET material are added to the table;
- PET substitution percentage is given in the table;
- Concrete density values are given in the table. If fresh and dry densities are given together in the study, only dry density is taken;
- Water/cement (W/C) ratio used in the formation of concrete is given in the table;
- The slump test results are in the table.
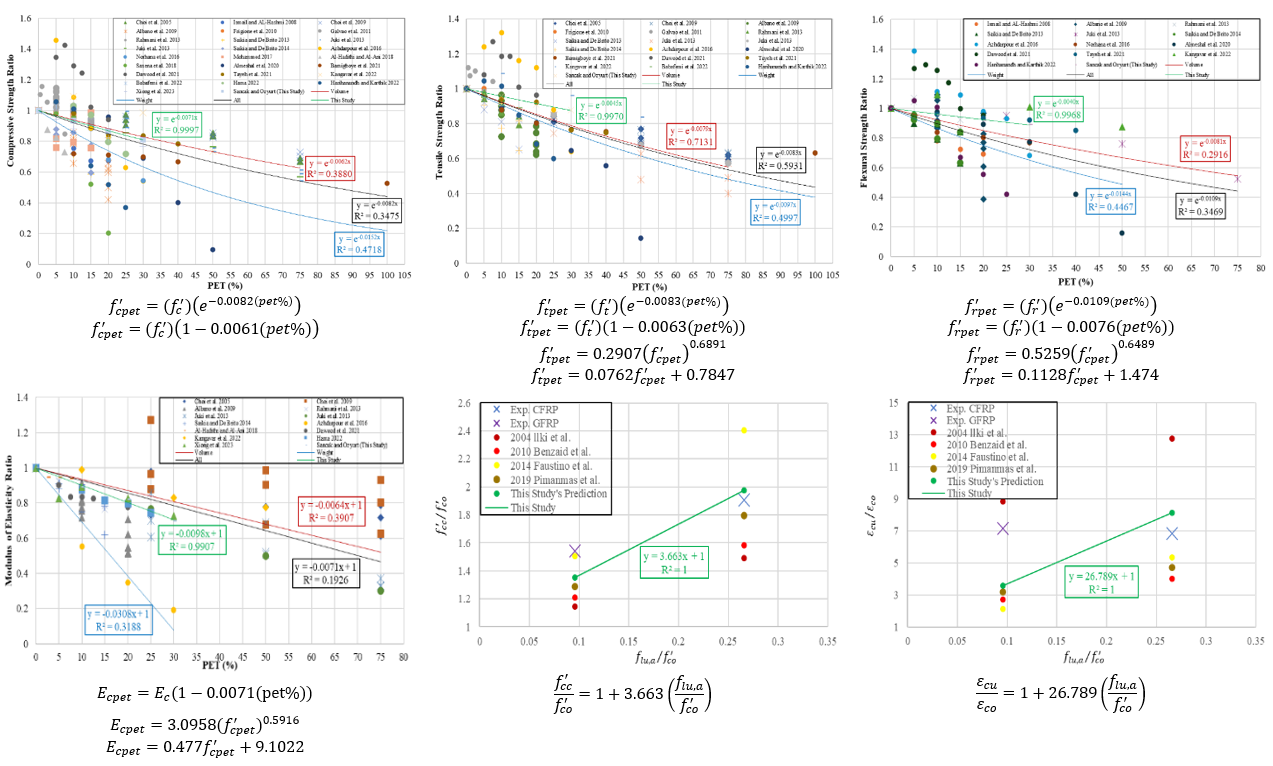
In the literature, some previous studies on PET substitution in concrete have proposed models for the mechanical properties of concrete. The values in the experimental database have been transformed into graphs based on the models proposed for various properties of concrete. Various equations have been obtained from the graphs through trend lines, and newly developed models have been proposed. The proposed models have been analyzed alongside those in the literature, and their applicability has been assessed.
3.1.1. Compressive Strength Model Development
Table 13 shows the compressive strength values obtained from experimental studies in the literature. To better illustrate the effect of PET substitution on compressive strength, the compressive strengths of PET-substituted samples were divided by the compressive strength of the reference sample. The compressive strength graph was created by using the compressive strength ratios as the vertical axis and the PET substitution percentages as the horizontal axis. This graph is shown in Figure 11. With the help of the trendline in the graph, model suggestions were made for volume substitution, weight substitution, the experimental data from this study, and all data. It was found that more accurate results could be obtained if the trendline were drawn exponentially. In the models proposed in previous studies, linear equations were mostly used. Given this, all results were calculated both linearly and exponentially, and the developed models were proposed. The equations obtained and the developed models are presented in Table 14. In Table 14, represents the compressive strength of PET-substituted concrete, represents the compressive strength of unsubstituted concrete, and represents the PET substitution percentage.
The proposed improved models were subjected to applicability control, along with other models suggested in the literature for estimating the compressive strength of PET-substituted concrete. The control was carried out using statistical metrics with the data from the experimental database. The calculated values and models are provided in Table 15. In Table 15, represents the density of PET-substituted concrete.
In some models proposed in the literature, PET substitution was carried out in fiber form instead of granules. In other models, coarse aggregate was substituted instead of fine aggregate. These models are marked and shown in Table 15. Some models used the density value of PET-substituted concrete in their estimations. Since some studies in the dataset did not specify the value, the data points in these models were fewer than in the others. Similarly, since Meena and Ramana [45] proposed a model valid only for samples with up to 15% substitution, the data point in this model was also lower than in the others.
As a result of the metric analyses performed, it was found that the exponential and linear models proposed in this study were the most successful, with R2 values of 0.741 and 0.733, respectively. Following these two models, the model by Mohammed [43] came next, with an R2 value of 0.716. It was observed that the Saikia and De Brito [17] model had an R2 value of 0.256 and provided low accuracy results. Figure 12 shows the graph of the R2 and MABE values for the proposed models.
3.1.2. Tensile Strength Model Development
While creating the tensile strength graph of the data, a process similar to that used for the compressive strength graph was followed. A graph was created with one axis representing the tensile strength ratio and the other axis representing the PET substitution percentages. The resulting graph is shown in Figure 13. With the help of the trendline in the graph, model suggestions were made for volume substitution, weight substitution, the experimental data from this study, and all data. The equations obtained and the developed models are provided in Table 16. In Table 16, represents the tensile strength of PET-substituted concrete, represents the tensile strength of unsubstituted concrete, and represents the PET substitution percentage.
The proposed improved models were subjected to an applicability check, along with other models in the literature that estimate the connection between PET substitution rate and the tensile strength of concrete. The check was performed using statistical metrics with data from the experimental database. The calculated values and models are provided in Table 17.
As a result of the metric analyses, it was found that among the models that included all tensile strength data, Models I and II proposed by this study were the most successful, with R2 values of 0.823 and 0.811, respectively. It was determined that the models of Bamigboye et al. [27] and Bamigboye et al. [44] I had an R2 value of 0.255 and provided low accuracy results. Since Meena and Ramana [45] proposed a model valid only for samples with up to 15% substitution, substitutions greater than 15% were not evaluated. Therefore, the data point in this model is lower than the others. Although a successful model was proposed with an R2 value of 0.809 for samples with a substitution rate of up to 15%, large errors were observed in the model's predictions as the substitution percentage increased. Figure 14 shows the graph of the R2 and MABE values for the proposed models.
3.1.2.1. The Connection Between Tensile Strength and Compressive Strength
There are studies in the literature that examine the connection between the compressive strength and tensile strength of PET-substituted concrete samples and propose model suggestions in this regard. These suggestions were considered in this study, and a graph was created with tensile strength on one axis and compressive strength on the other. While creating this graph, the cube-shaped sample results were converted to the equivalent cylinder strength to avoid differences between compressive and tensile strengths. All results were processed in the graph to reflect the equivalent cylinder sample strength. The graph is shown in Figure 15. Model suggestions were generated using a trendline in the graph. The equations obtained and the models developed are given in Table 18.
The proposed developed models were subjected to an applicability check, along with other models in the literature that predict the connection between tensile strength and compressive strength of PET-substituted concrete. The checks were performed using statistical metrics based on data from the experimental database. The calculated values and models are given in Table 19.
As a result of the metric analyses, it was found that Models II and I proposed in this study were the most successful, with R² values of 0.545 and 0.540, respectively. It was determined that the Tayeh [29] model had an R² value of 0.038 and provided low accuracy results. Figure 16 shows the graph of the R² and MABE values of the proposed models.
3.1.3. Flexural Strength Model Development
When creating the flexural strength graph from the data, a graph was plotted with the flexural strength ratio on one axis and PET substitution percentages on the other. The resulting graph is shown in Figure 17. Model suggestions were made for volume substitution, weight substitution, experimental data from this study, and all data, with the help of a trendline in the graph. The equations obtained and the developed models are given in Table 20. In Table 20, represents the flexural strength of PET-substituted concrete, represents the flexural strength of unsubstituted concrete, and represents the PET substitution percentage.
No other model has been found in the literature that estimates the connection between the PET substitution percentage and the flexural strength of concrete. The control was carried out using statistical metrics based on the experimental database. The calculated values are given in Table 20.
3.1.3.1. The Connection Between Flexural Strength and Compressive Strength
Some studies involving PET-substituted concrete samples have suggested a connection between compressive strength and flexural strength and have proposed models for this connection. In this study, these suggestions were considered, and a graph was created with flexural strength on one axis and compressive strength on the other. While creating this graph, the compressive strengths were converted to cylinder sample strength. The resulting graph is shown in Figure 18. Model suggestions were made using a trendline within the graph. The equations obtained and the models developed are given in Table 21.
The proposed developed models were subjected to an applicability check, along with other models in the literature that predict the relationship between the flexural strength and compressive strength of PET-substituted concrete. The checks were carried out using statistical metrics based on the experimental database. The calculated values and models are given in Table 22.
As a result of the metric analysis, it was found that Model I proposed in this study was the most successful, with an R² value of 0.480. It was determined that the Tayeh [29] model had an R² value of 0.280 and provided low accuracy results. Figure 19 shows the graph of the R² and MABE values of the proposed models.
3.1.4. Modulus of Elasticity Model Development
While creating the elasticity modulus graph from the data, a graph was plotted with the elasticity modulus ratio on one axis and PET substitution percentages on the other. The resulting graph is shown in Figure 20. Model suggestions were made for volume substitution, weight substitution, experimental data from this study, and all data, with the help of a trendline in the graph. The equations obtained and the developed models are given in Table 23. In Table 23, represents the elasticity modulus of PET-substituted concrete, represents the elasticity modulus of unsubstituted concrete, and represents the PET substitution percentage.
Among the previous studies, only Aocharoen and Chotickai [46] proposed a model that estimates the relationship between the PET substitution rate and the elasticity modulus of concrete. This model was subjected to applicability control together with the model obtained from this study. Control was carried out through statistical metrics using the data in the experimental database. The calculated values and models are given in Table 24.
3.1.4.1. The Connection Between Modulus of Elasticity and Compressive Strength
To examine the connection between compressive strength and modulus of elasticity, a graph was created with compressive strength on one axis and modulus of elasticity on the other. The resulting graph is shown in Figure 21. Model suggestions were made using a trendline in the graph. The equations obtained and the developed models are given in Table 25.
Models estimating the connection between the elasticity modulus and compressive strength of PET-substituted concrete were subjected to applicability checks, along with other models from the literature. The checks were performed using statistical metrics based on an experimental database. The calculated values and models are presented in Table 26.
As a result of the metric analysis, it was found that Model I, proposed in this study, was the most successful, with an R² value of 0.431. The Alqahtani [47] model was found to have an R² value of 0.297, indicating low accuracy. Figure 22 shows the graph of R² and MABE values for the proposed models.
3.2. FRP Wrapping Effect
Previous researchers have considered the ultimate lateral confining pressure () of the FRP material, as defined in Equation 1. In Equation 1, represents the elasticity modulus of the FRP material, the thickness, and the ultimate tensile strain value. D represents the diameter of the concrete sample.
In later studies, researchers found that the FRP material ruptured at a lower strain value than expected during the experiment. Therefore, they suggested that using the FRP hoop rupture strain (), obtained by multiplying the FRP ultimate tensile strain () by the strain reduction factor (), would be useful. This value is calculated as shown in Equation 2. The equation for the actual ultimate lateral confining pressure (), obtained using the FRP hoop rupture strain (), is given in Equation 3.
In the study, samples with 10% PET substitution were wrapped in CFRP and GFRP, leading to increased compressive strength and strain value. The data from the experimental study, along with sample and FRP properties, are given in Table 27.
There are many model proposals in the literature that estimate the increase in compressive strength and strain values of concrete samples when FRP is used. The predictions of some old and new models were compared with experimental data. A graph was created to compare compressive strength, with one axis representing and the other representing . The graph is shown in Figure 23.
Even though the experimental data are limited, a model was proposed for the compressive strength of PET-substituted concrete wrapped in FRP, using the trendline on the graph. The estimates from previous models were shown on the graph, and the MABE and MAPE values were calculated and presented in Table 28.
As a result of the metric analysis, it was found that the compressive strength model for PET-substituted concrete proposed in this study was the most successful, with a MABE value of 3.220. In general, all models produced consistent and similar results, and the more recent models were found to be more accurate. The graph showing the MABE and MAPE values of the proposed models is given in Figure 24.
To compare the ultimate axial strain () values, a graph was created with one axis representing and the other representing . The graph is shown in Figure 25.
Even though the experimental data are limited, a model was proposed for the ultimate axial strain value of PET-substituted concrete wrapped in FRP, using the trendline on the graph. The estimates from previous models were shown on the graph, and the MABE and MAPE values were calculated and presented in Table 29.
As a result of the statistical analysis, it was found that the ultimate axial strain model for PET-substituted concrete proposed in this study was the most successful, with a MABE value of 0.493. It was observed that the predictions of the Ilki et al. [49] model overestimated the experimental data, while the predictions of the other models were lower. The predictions of the more recent models were found to be more accurate. The graph showing the MABE and MAPE values of the proposed models is given in Figure 26.
4. Conclusions
In this study, the effect of using PET as a fine aggregate substitute in concrete on various concrete properties was investigated. Additionally, the effects of using CFRP and GFRP in PET-substituted concrete were examined. A comprehensive experimental database was created for this study. Using this database, model proposals were made, and the prediction accuracy of previously proposed models was evaluated. As a result of the experiments and analyses, the following results emerged:
- For 30% PET substitution, the slump value decreased by approximately 20%. It was anticipated that further increasing the substitution rate could be disadvantageous for the workability of fresh concrete.
- Increasing the PET substitution rate decreased the density of concrete. It was concluded that PET substitution in concrete could contribute to reducing the weight of the structure or obtaining lightweight concrete if the concrete is used structurally.
- PET substitution in concrete decreased the elastic modulus, compressive strength, splitting tensile strength, and flexural strength, while increasing the ultimate strain values. PET substitution can be used in cases where displacement is required, but it cannot be used to increase strength.
- The decrease in compressive, splitting tensile, and flexural strengths due to PET substitution was compensated for by using FRP, which even exceeded the reference strength. Using PET inside the concrete and FRP outside is an effective method to obtain concrete that is both lighter and has more strength.
- The models proposed in this study were compatible with previous models and experimental data. They were found to provide the most accurate predictions and were applicable based on the experimental database.
The reliability of the proposed models is related to the quantity and quality of the data in the database. In this study, efforts were made to collect data from studies conducted on the subject so far. The presence of studies with vastly different results or insufficient experimental data may undermine the reliability of the models. It is important to note that the models may be revised as the content of the database evolves and the amount of data increases.
Author Contributions
Conceptualization, O.F.S. and M.Z.O.; methodology, O.F.S. and M.Z.O.; software, O.F.S.; validation, O.F.S. and M.Z.O.; formal analysis, O.F.S.; investigation, O.F.S.; resources, O.F.S. and M.Z.O.; data curation, O.F.S.; writing—original draft preparation, O.F.S.; writing—review and editing, O.F.S. and M.Z.O.; visualization, O.F.S.; supervision, O.F.S. and M.Z.O.; project administration, M.Z.O.; funding acquisition, O.F.S. and M.Z.O. All authors have read and agreed to the published version of the manuscript.
Funding
This research was funded by Sakarya University Scientific Research Projects Unit, grant number 2024-26-61-21.
Data Availability Statement
Data available on request from the authors.
Conflicts of Interest
The authors declare no conflicts of interest.
References
- Raheem, A. B., Noor, Z. Z., Hassan, A., Abd Hamid, M. K., Samsudin, S. A., & Sabeen, A. H. (2019). Current developments in chemical recycling of post-consumer polyethylene terephthalate wastes for new materials production: A review. Journal of cleaner production, 225, 1052-1064. [CrossRef]
- Benyathiar, P., Kumar, P., Carpenter, G., Brace, J., & Mishra, D. K. (2022). Polyethylene terephthalate (PET) bottle-to-bottle recycling for the beverage industry: A Review. Polymers, 14(12), 2366. [CrossRef]
- Merrington, A. (2017). Recycling of plastics. In Applied plastics engineering handbook (pp. 167-189). William Andrew Publishing. [CrossRef]
- Rahimi, A., & García, J. M. (2017). Chemical recycling of waste plastics for new materials production. Nature Reviews Chemistry, 1(6), 0046. [CrossRef]
- Kawecki, D., Wu, Q., Gonçalves, J. S., & Nowack, B. (2021). Polymer-specific dynamic probabilistic material flow analysis of seven polymers in Europe from 1950 to 2016. Resources, Conservation and Recycling, 173, 105733. [CrossRef]
- Gandhi, N., Farfaras, N., Wang, N. H. L., & Chen, W. T. (2021). Life cycle assessment of recycling high-density polyethylene plastic waste. Journal of Renewable Materials, 9(8), 1463-1483. [CrossRef]
- Burrows, S. D., Ribeiro, F., O’brien, S., Okoffo, E., Toapanta, T., Charlton, N., ... & Thomas, K. V. (2022). The message on the bottle: Rethinking plastic labelling to better encourage sustainable use. Environmental Science & Policy, 132, 109-118. [CrossRef]
- Belmokaddem, M., Mahi, A., Senhadji, Y., & Pekmezci, B. Y. (2020). Mechanical and physical properties and morphology of concrete containing plastic waste as aggregate. Construction and Building Materials, 257, 119559. [CrossRef]
- Basha, S. I., Ali, M. R., Al-Dulaijan, S. U., & Maslehuddin, M. (2020). Mechanical and thermal properties of lightweight recycled plastic aggregate concrete. Journal of Building Engineering, 32, 101710. [CrossRef]
- Choi, Y. W., Moon, D. J., Chung, J. S., & Cho, S. K. (2005). Effects of waste PET bottles aggregate on the properties of concrete. Cement and concrete research, 35(4), 776-781. [CrossRef]
- Choi, Y. W., Moon, D. J., Kim, Y. J., & Lachemi, M. (2009). Characteristics of mortar and concrete containing fine aggregate manufactured from recycled waste polyethylene terephthalate bottles. Construction and Building Materials, 23(8), 2829-2835. [CrossRef]
- Albano, C., Camacho, N., Hernández, M., Matheus, A., & Gutierrez, A. J. W. M. (2009). Influence of content and particle size of waste pet bottles on concrete behavior at different w/c ratios. Waste management, 29(10), 2707-2716. [CrossRef]
- Rahmani, E., Dehestani, M., Beygi, M. H. A., Allahyari, H., & Nikbin, I. M. (2013). On the mechanical properties of concrete containing waste PET particles. Construction and Building Materials, 47, 1302-1308. [CrossRef]
- Saikia, N., & Brito, J. D. (2013). Waste polyethylene terephthalate as an aggregate in concrete. Materials Research, 16, 341-350. [CrossRef]
- Juki, M. I., Muhamad, K., Annas, M. M. K., Boon, K. H., Othman, N., binti Abdul Kadir, A., ... & Khalid, F. S. (2013). Development of concrete mix design nomograph containing polyethylene terephtalate (PET) as fine aggregate. Advanced Materials Research, 701, 12-16. [CrossRef]
- Juki, M. I., Awang, M., Annas, M. M. K., Boon, K. H., Othman, N., binti Abdul Kadir, A., ... & Khalid, F. S. (2013). Relationship between compressive, splitting tensile and flexural strength of concrete containing granulated waste polyethylene terephthalate (PET) bottles as fine aggregate. Advanced materials research, 795, 356-359. [CrossRef]
- Saikia, N., & De Brito, J. (2014). Mechanical properties and abrasion behaviour of concrete containing shredded PET bottle waste as a partial substitution of natural aggregate. Construction and building materials, 52, 236-244. [CrossRef]
- Mohammed, A. A. (2017). Flexural behavior and analysis of reinforced concrete beams made of recycled PET waste concrete. Construction and Building Materials, 155, 593-604. [CrossRef]
- Al-Hadithi, A. I., & Al-Ani, M. F. (2018, September). Effects of adding waste plastics on some properties of high performance concrete. In 2018 11th International Conference on Developments in eSystems Engineering (DeSE) (pp. 273-279). IEEE. [CrossRef]
- Kangavar, M. E., Lokuge, W., Manalo, A., Karunasena, W., & Frigione, M. (2022). Investigation on the properties of concrete with recycled polyethylene terephthalate (PET) granules as fine aggregate replacement. Case Studies in Construction Materials, 16, e00934. [CrossRef]
- Babafemi, A. J., Sirba, N., Paul, S. C., & Miah, M. J. (2022). Mechanical and durability assessment of recycled waste plastic (Resin8 & PET) eco-aggregate concrete. Sustainability, 14(9), 5725. [CrossRef]
- Hama, S. M. (2022). Behavior of concrete incorporating waste plastic as fine aggregate subjected to compression, impact load and bond resistance. European Journal of Environmental and Civil Engineering, 26(8), 3372-3386. [CrossRef]
- Xiong, B., Falliano, D., Restuccia, L., Di Trapani, F., Demartino, C., & Marano, G. C. (2023). High-strain rate compressive behavior of concrete with two different substituted recycled plastic aggregates: Experimental characterization and probabilistic modeling. Construction and Building Materials, 368, 130279. [CrossRef]
- Ismail, Z. Z., & Al-Hashmi, E. A. (2008). Use of waste plastic in concrete mixture as aggregate replacement. Waste management, 28(11), 2041-2047. [CrossRef]
- Frigione, M. (2010). Recycling of PET bottles as fine aggregate in concrete. Waste management, 30(6), 1101-1106. [CrossRef]
- Galvão, J. C. A., Portella, K. F., Joukoski, A., Mendes, R., & Ferreira, E. S. (2011). Use of waste polymers in concrete for repair of dam hydraulic surfaces. Construction and Building Materials, 25(2), 1049-1055. [CrossRef]
- Azhdarpour, A. M., Nikoudel, M. R., & Taheri, M. (2016). The effect of using polyethylene terephthalate particles on physical and strength-related properties of concrete; a laboratory evaluation. Construction and Building Materials, 109, 55-62. [CrossRef]
- Norhana, A. R., Kartini, K., & Hamidah, M. S. (2016, October). Recycled polyethylene terephthalate (PET) and rubber crumb as replacement to fine aggregate. In AIP Conference Proceedings (Vol. 1774, No. 1). AIP Publishing. [CrossRef]
- Saxena, R., Siddique, S., Gupta, T., Sharma, R. K., & Chaudhary, S. (2018). Impact resistance and energy absorption capacity of concrete containing plastic waste. Construction and Building Materials, 176, 415-421. [CrossRef]
- Almeshal, I., Tayeh, B. A., Alyousef, R., Alabduljabbar, H., & Mohamed, A. M. (2020). Eco-friendly concrete containing recycled plastic as partial replacement for sand. Journal of Materials Research and Technology, 9(3), 4631-4643. [CrossRef]
- Bamigboye, G. O., Tarverdi, K., Umoren, A., Bassey, D. E., Okorie, U., & Adediran, J. (2021). Evaluation of eco-friendly concrete having waste PET as fine aggregates. Cleaner Materials, 2, 100026. [CrossRef]
- Dawood, A. O., Hayder, A. K., & Falih, R. S. (2021). Physical and mechanical properties of concrete containing PET wastes as a partial replacement for fine aggregates. Case Studies in Construction Materials, 14, e00482. [CrossRef]
- Tayeh, B. A., Almeshal, I., Magbool, H. M., Alabduljabbar, H., & Alyousef, R. (2021). Performance of sustainable concrete containing different types of recycled plastic. Journal of Cleaner Production, 328, 129517. [CrossRef]
- Harihanandh, M., & Karthik, P. (2022). Feasibility study of recycled plastic waste as fine aggregates in concrete. Materials Today: Proceedings, 52, 1807-1811. [CrossRef]
- Qaidi, S., Al-Kamaki, Y. S., Al-Mahaidi, R., Mohammed, A. S., Ahmed, H. U., Zaid, O., ... & Bennetts, I. (2022). Investigation of the effectiveness of CFRP strengthening of concrete made with recycled waste PET fine plastic aggregate. PloS one, 17(7), e0269664. [CrossRef]
- Ozbakkaloglu, T., Lim, J. C., & Vincent, T. (2013). FRP-confined concrete in circular sections: Review and assessment of stress–strain models. Engineering Structures, 49, 1068-1088. [CrossRef]
- del Rey Castillo, E., Griffith, M., & Ingham, J. (2018). Seismic behavior of RC columns flexurally strengthened with FRP sheets and FRP anchors. Composite Structures, 203, 382-395. [CrossRef]
- Yuan, F., Chen, M., & Pan, J. (2019). Experimental study on seismic behaviours of hybrid FRP–steel-reinforced ECC–concrete composite columns. Composites Part B: Engineering, 176, 107272. [CrossRef]
- Valasaki, M. K., & Papakonstantinou, C. G. (2023). Fiber reinforced polymer (FRP) confined circular concrete columns: An experimental overview. Buildings, 13(5), 1248. [CrossRef]
- Ağbulut, Ü., Gürel, A. E., & Biçen, Y. (2021). Prediction of daily global solar radiation using different machine learning algorithms: Evaluation and comparison. Renewable and Sustainable Energy Reviews, 135, 110114. [CrossRef]
- Bakır, H., Ağbulut, Ü., Gürel, A. E., Yıldız, G., Güvenç, U., Soudagar, M. E. M., ... & Afzal, A. (2022). Forecasting of future greenhouse gas emission trajectory for India using energy and economic indexes with various metaheuristic algorithms. Journal of Cleaner Production, 360, 131946. [CrossRef]
- Nibudey, R. N., Nagarnaik, P. B., Parbat, D. K., & Pande, A. M. (2013). Strengths prediction of plastic fiber reinforced concrete (M30). Int. J. Eng. Res. Appl, 3(1), 1818-1825.
- Bamigboye, G., Tarverdi, K., Adigun, D., Daniel, B., Okorie, U., & Adediran, J. (2022). An appraisal of the mechanical, microstructural, and thermal characteristics of concrete containing waste PET as coarse aggregate. Cleaner Waste Systems, 1, 100001. [CrossRef]
- Meena, A., & Ramana, P. V. (2022). Mathematical model valuation for recycled material mechanical strengths. Materials Today: Proceedings, 60, 753-759. [CrossRef]
- Aocharoen, Y., & Chotickai, P. (2023). Compressive mechanical and durability properties of concrete with polyethylene terephthalate and high-density polyethylene aggregates. Cleaner Engineering and Technology, 12, 100600. [CrossRef]
- Mohammed, A. A. (2017). Modelling the mechanical properties of concrete containing PET waste aggregate. Construction and Building Materials, 150, 595-605. [CrossRef]
- Alqahtani, F. K. (2022). Development of composite PET plastic-based aggregate and its utilization in green lightweight concrete. Arabian Journal for Science and Engineering, 47(10), 13397-13406. [CrossRef]
- Hannawi, K., Kamali-Bernard, S., & Prince, W. (2010). Physical and mechanical properties of mortars containing PET and PC waste aggregates. Waste management, 30(11), 2312-2320. [CrossRef]
- Ilki, A., Kumbasar, N., & Koc, V. (2004). Low strength concrete members externally confined with FRP sheets. Structural Engineering and Mechanics, 18(2), 167-194. [CrossRef]
- Benzaid, R., Mesbah, H., & Chikh, N. E. (2010). FRP-confined concrete cylinders: axial compression experiments and strength model. Journal of Reinforced plastics and composites, 29(16), 2469-2488. [CrossRef]
- Faustino, P., Chastre, C., & Paula, R. (2014). Design model for square RC columns under compression confined with CFRP. Composites Part B: Engineering, 57, 187-198. [CrossRef]
- Pimanmas, A., & Saleem, S. (2019). Evaluation of existing stress–strain models and modeling of PET FRP–confined concrete. Journal of Materials in Civil Engineering, 31(12), 04019303. [CrossRef]
Figure 1.
Grading curves of aggregates.
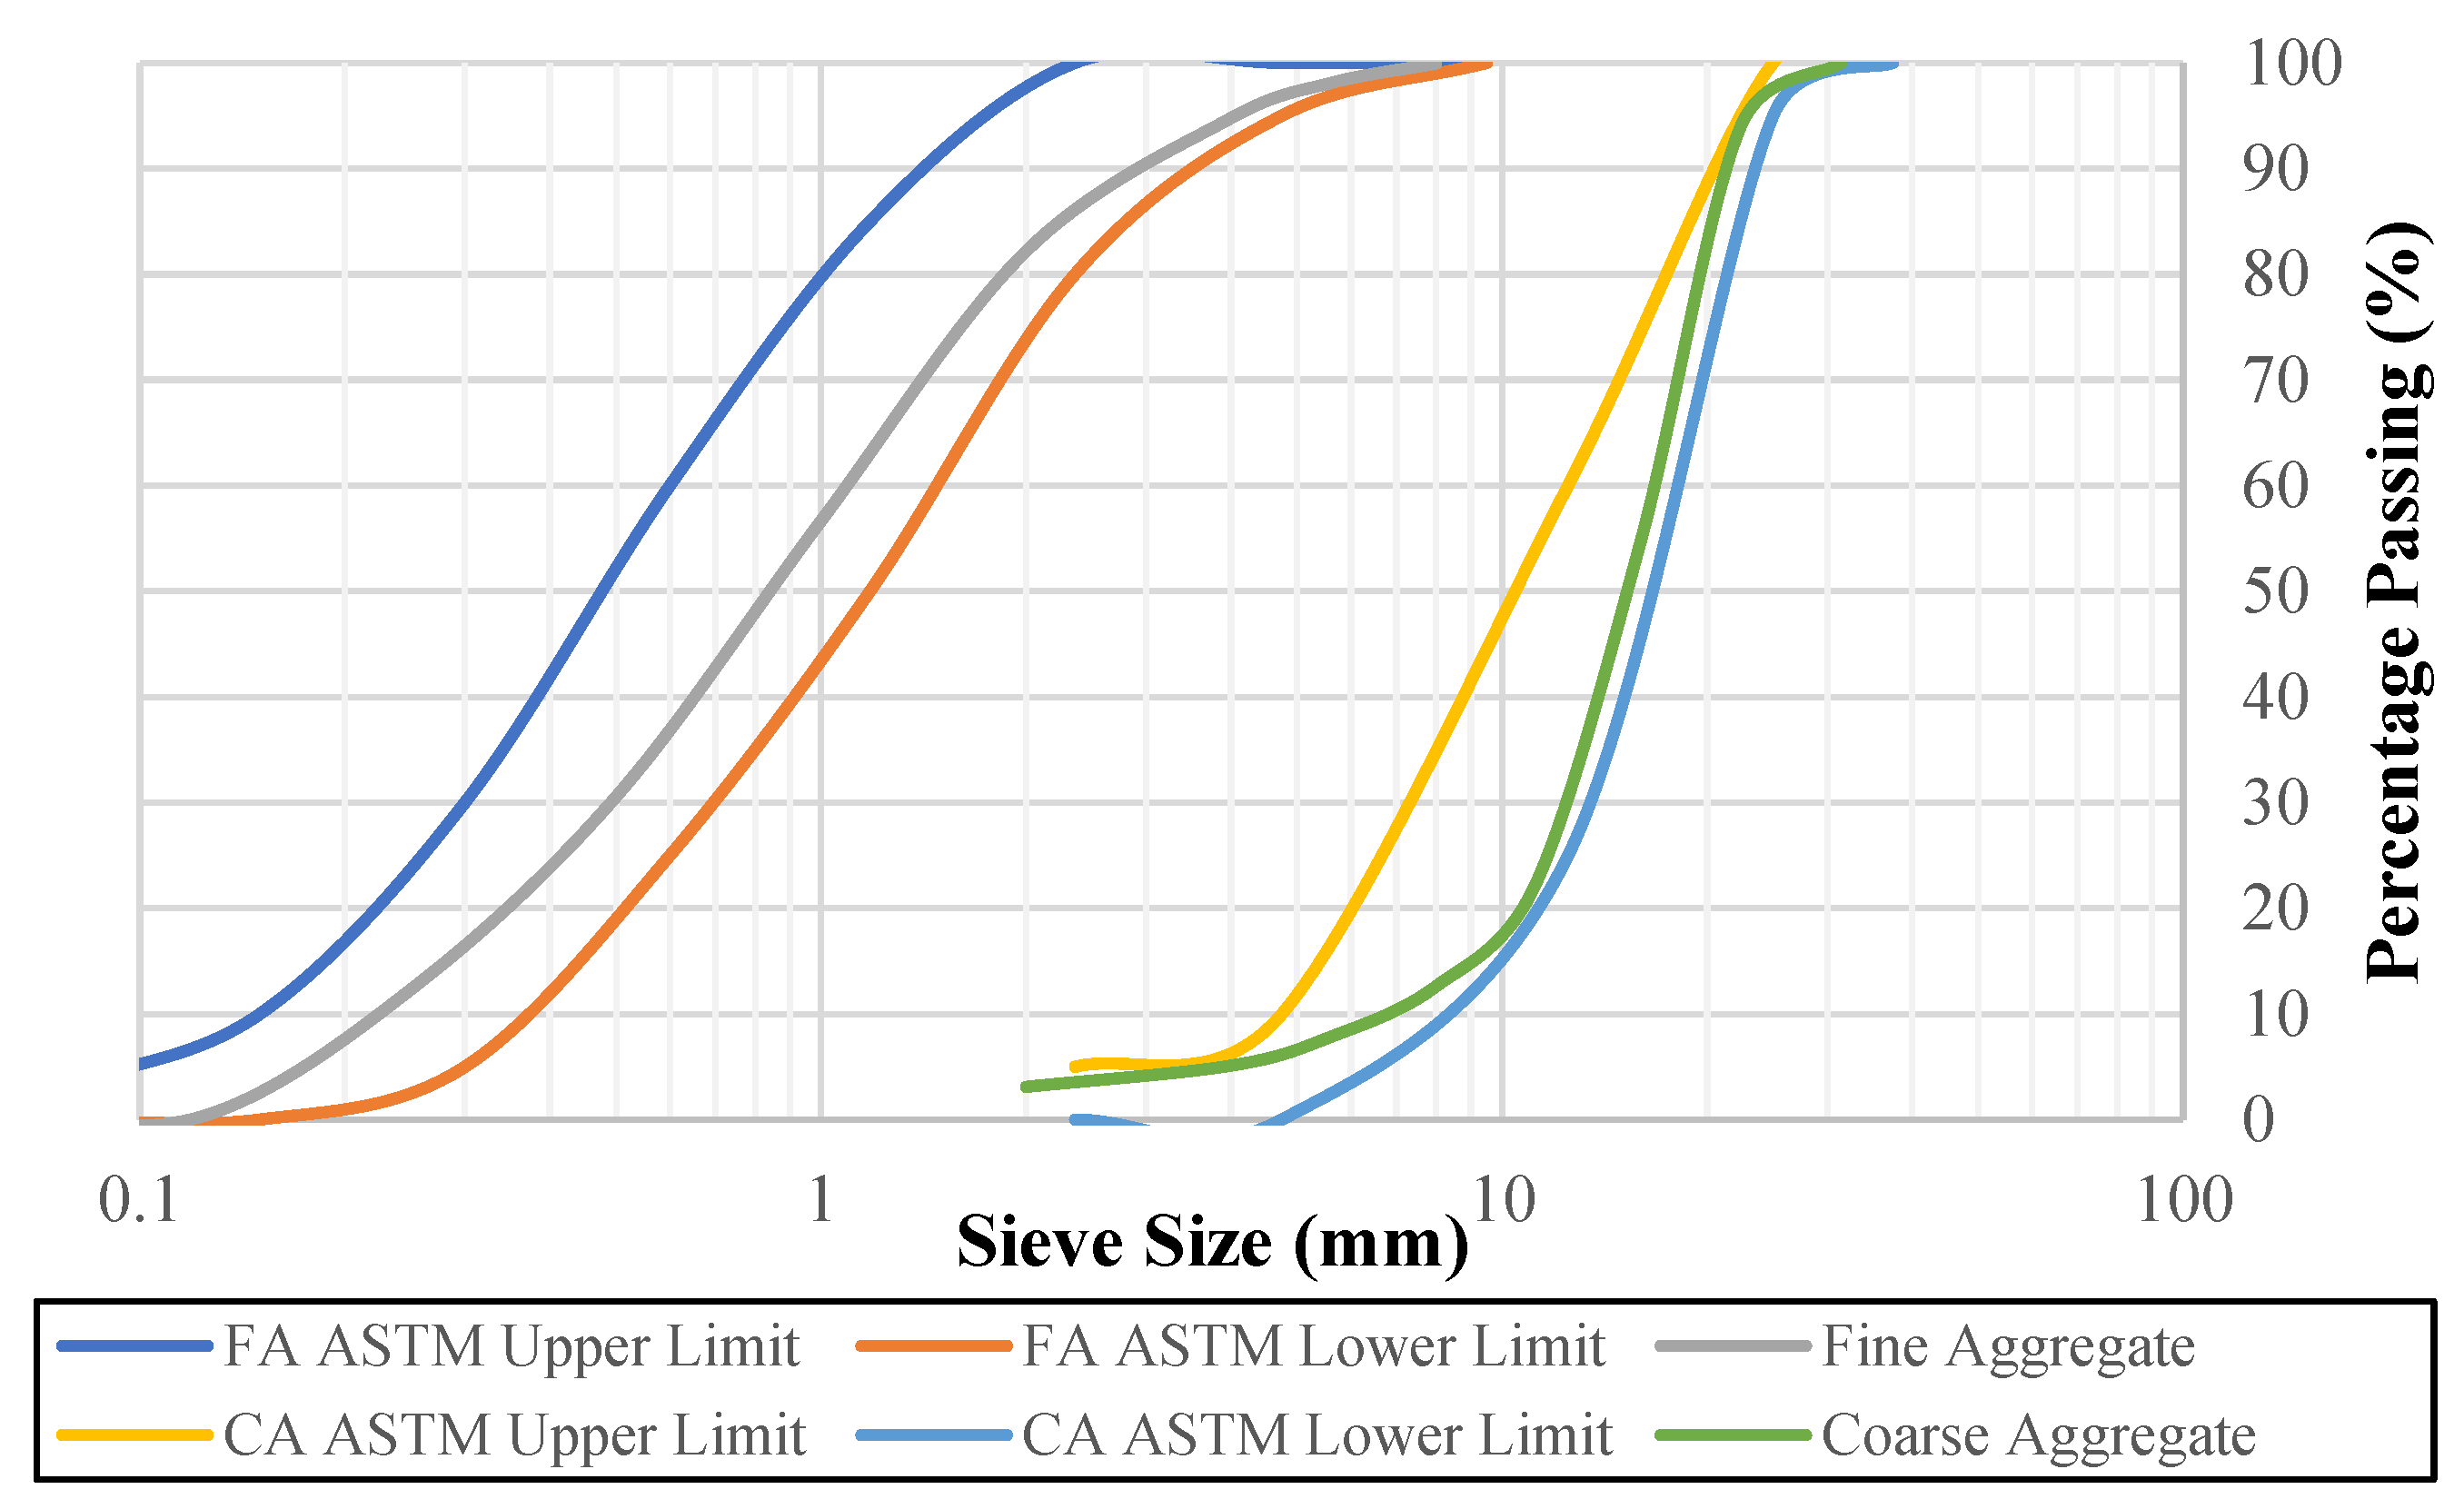
Figure 2.
PET granules.
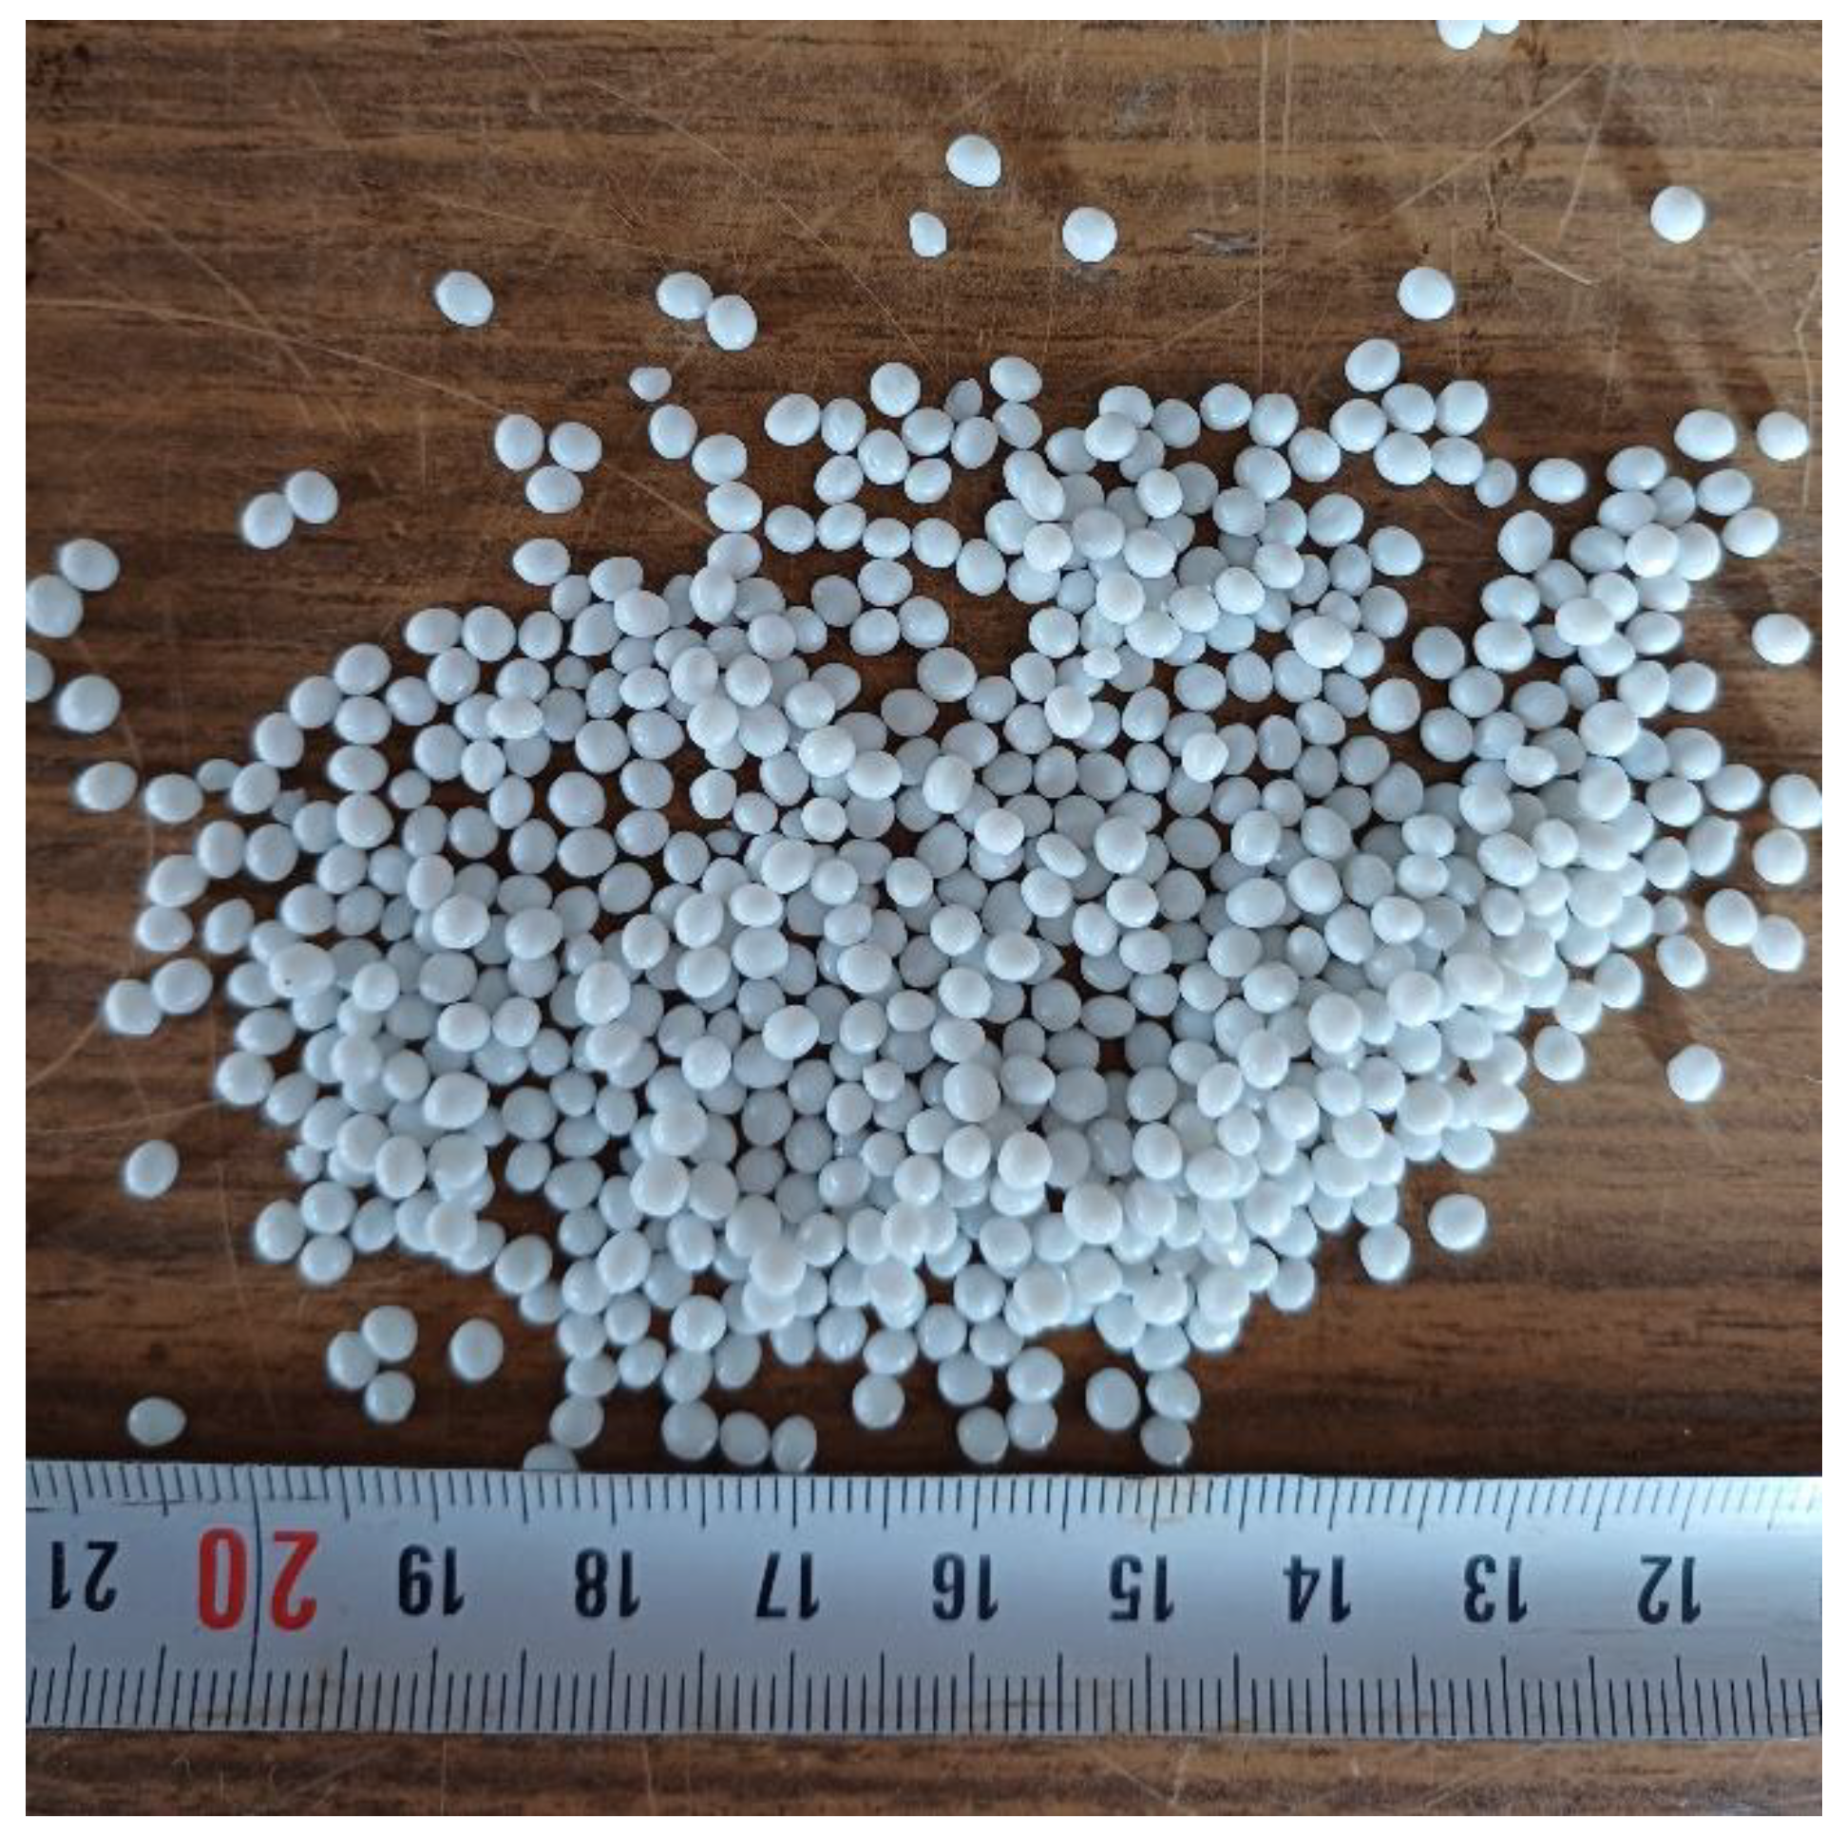
Figure 3.
FRP types: (a) CFRP, (b) GFRP.
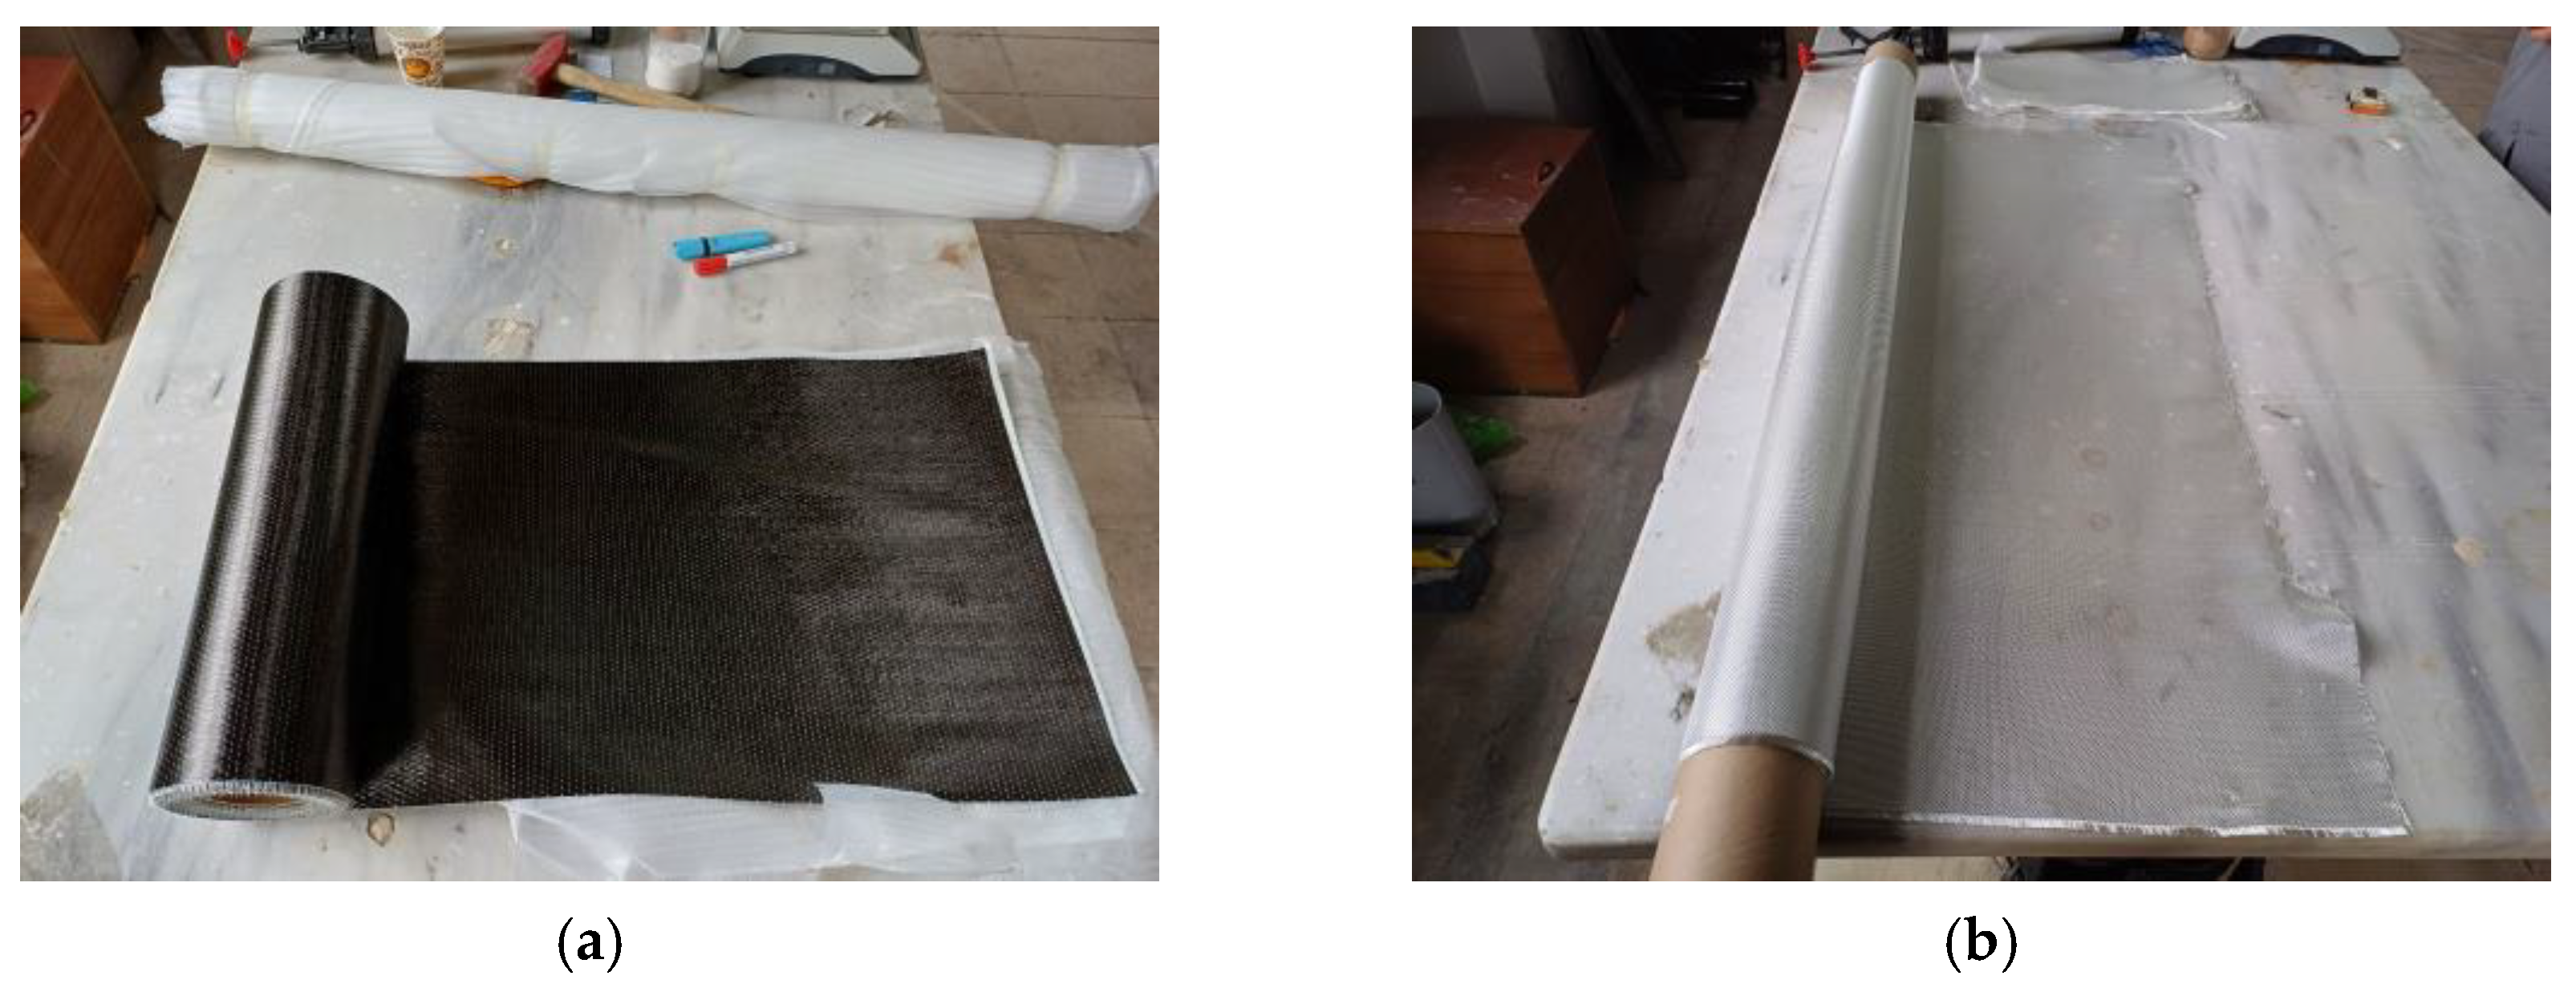
Figure 4.
Experimental setups: (a) Compressive, (b) Splitting tensile, (c) Flexural.
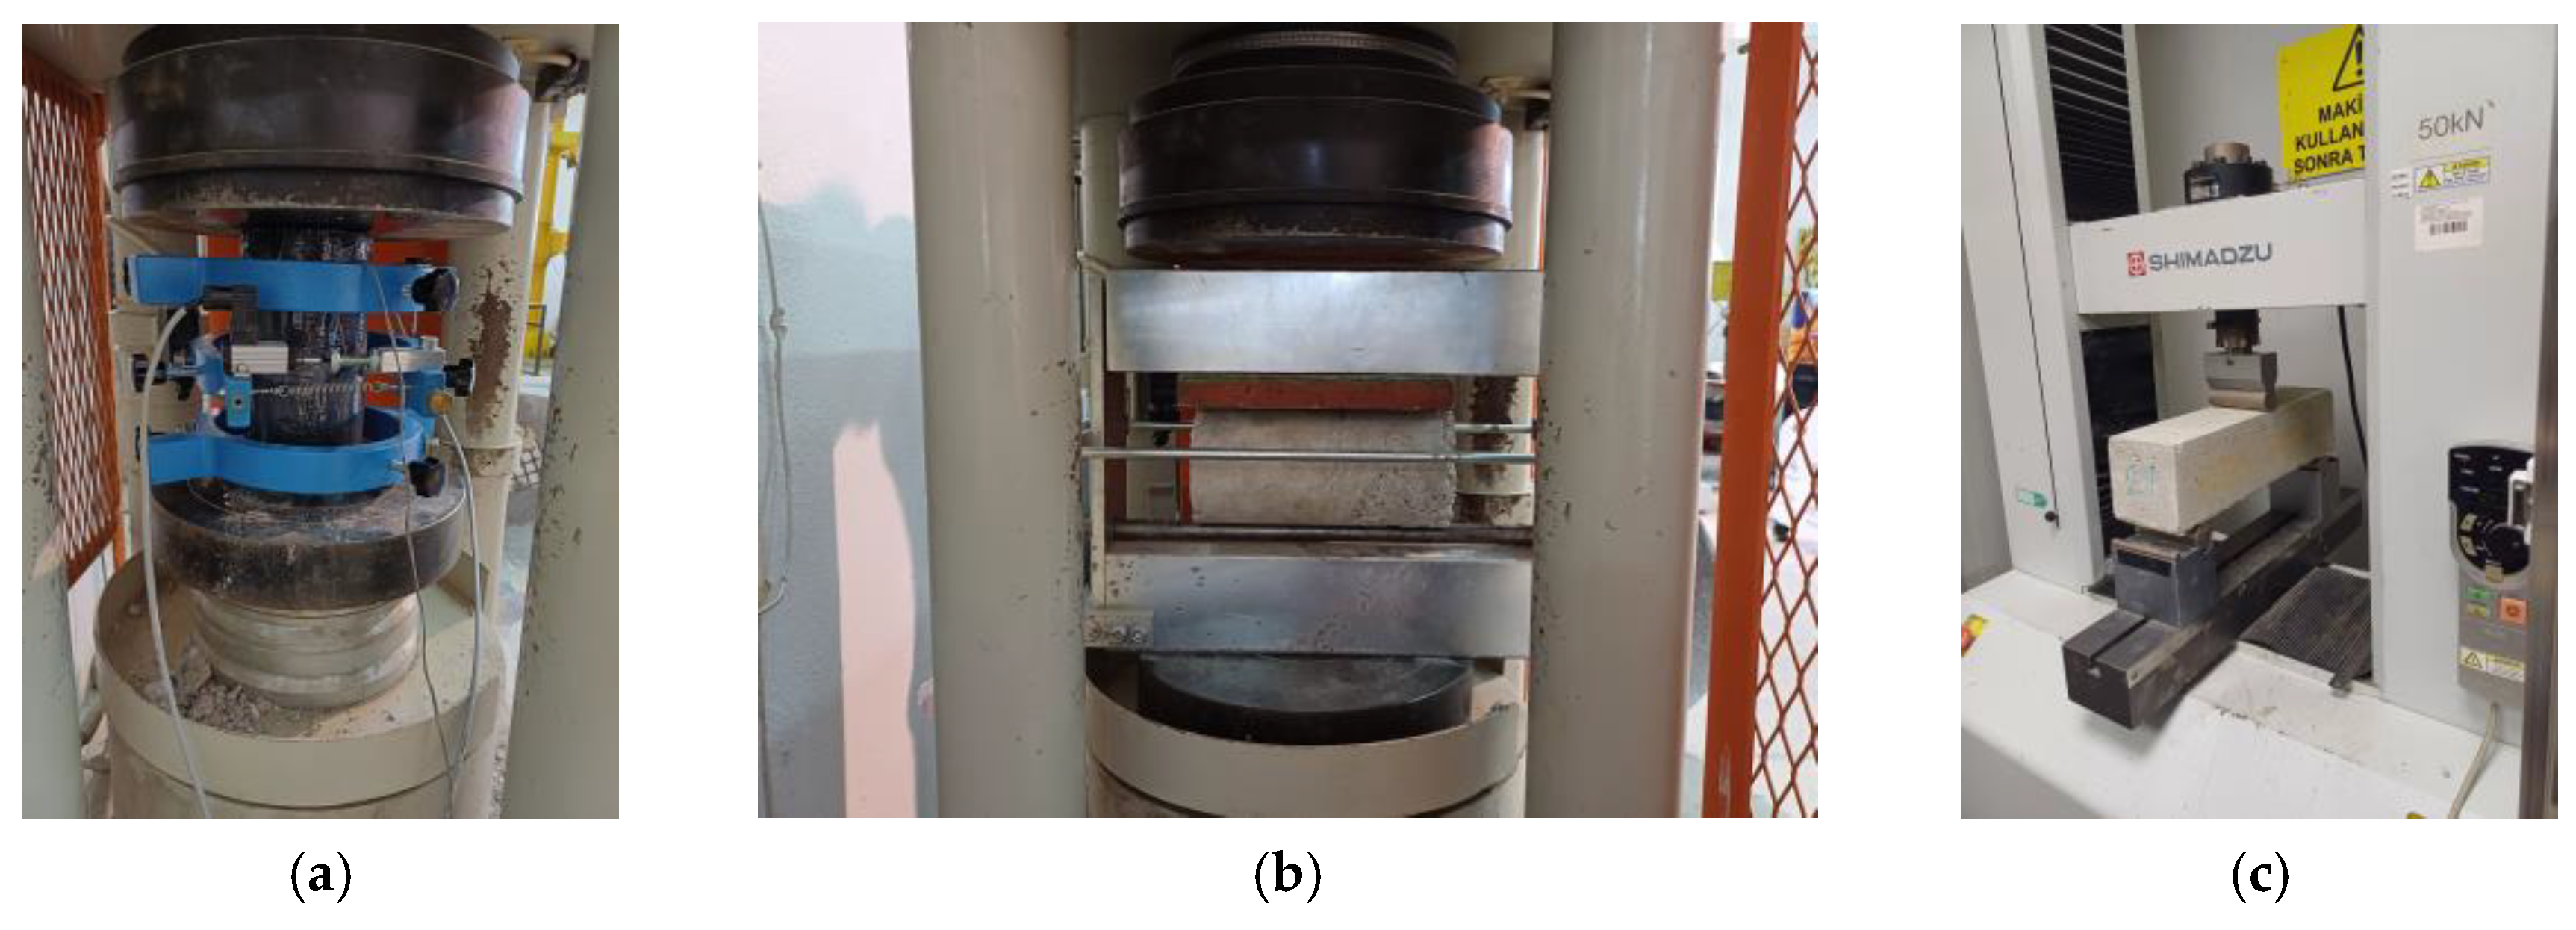
Figure 5.
Slump–percentage of PET graph.
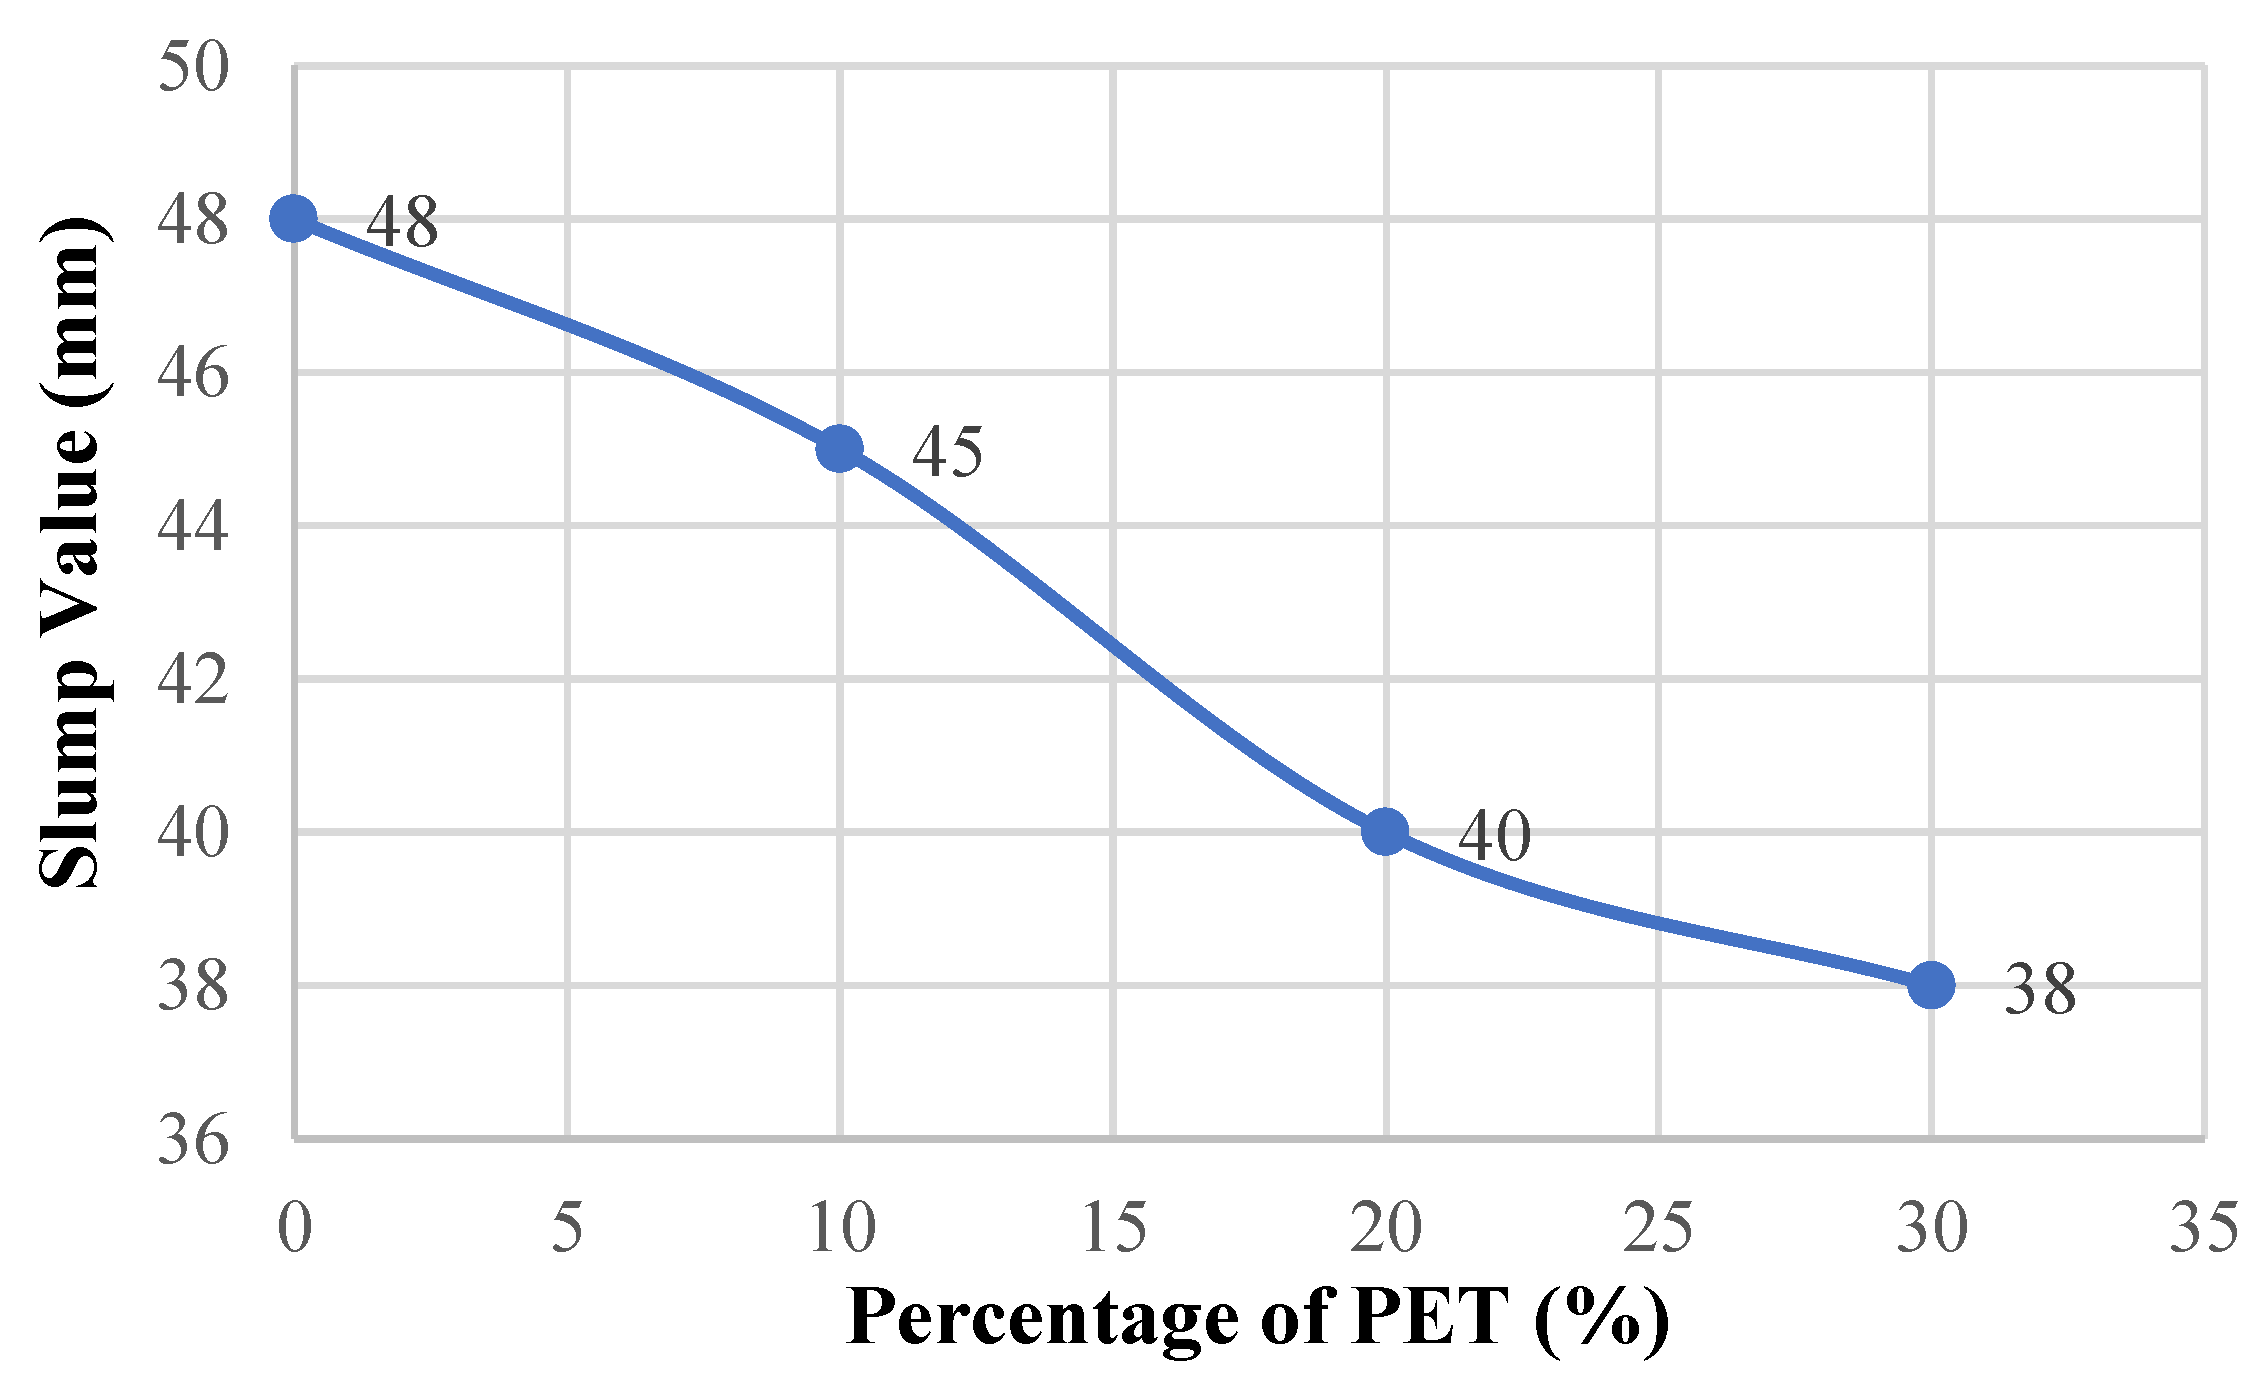
Figure 6.
Density–percentage of PET graph.
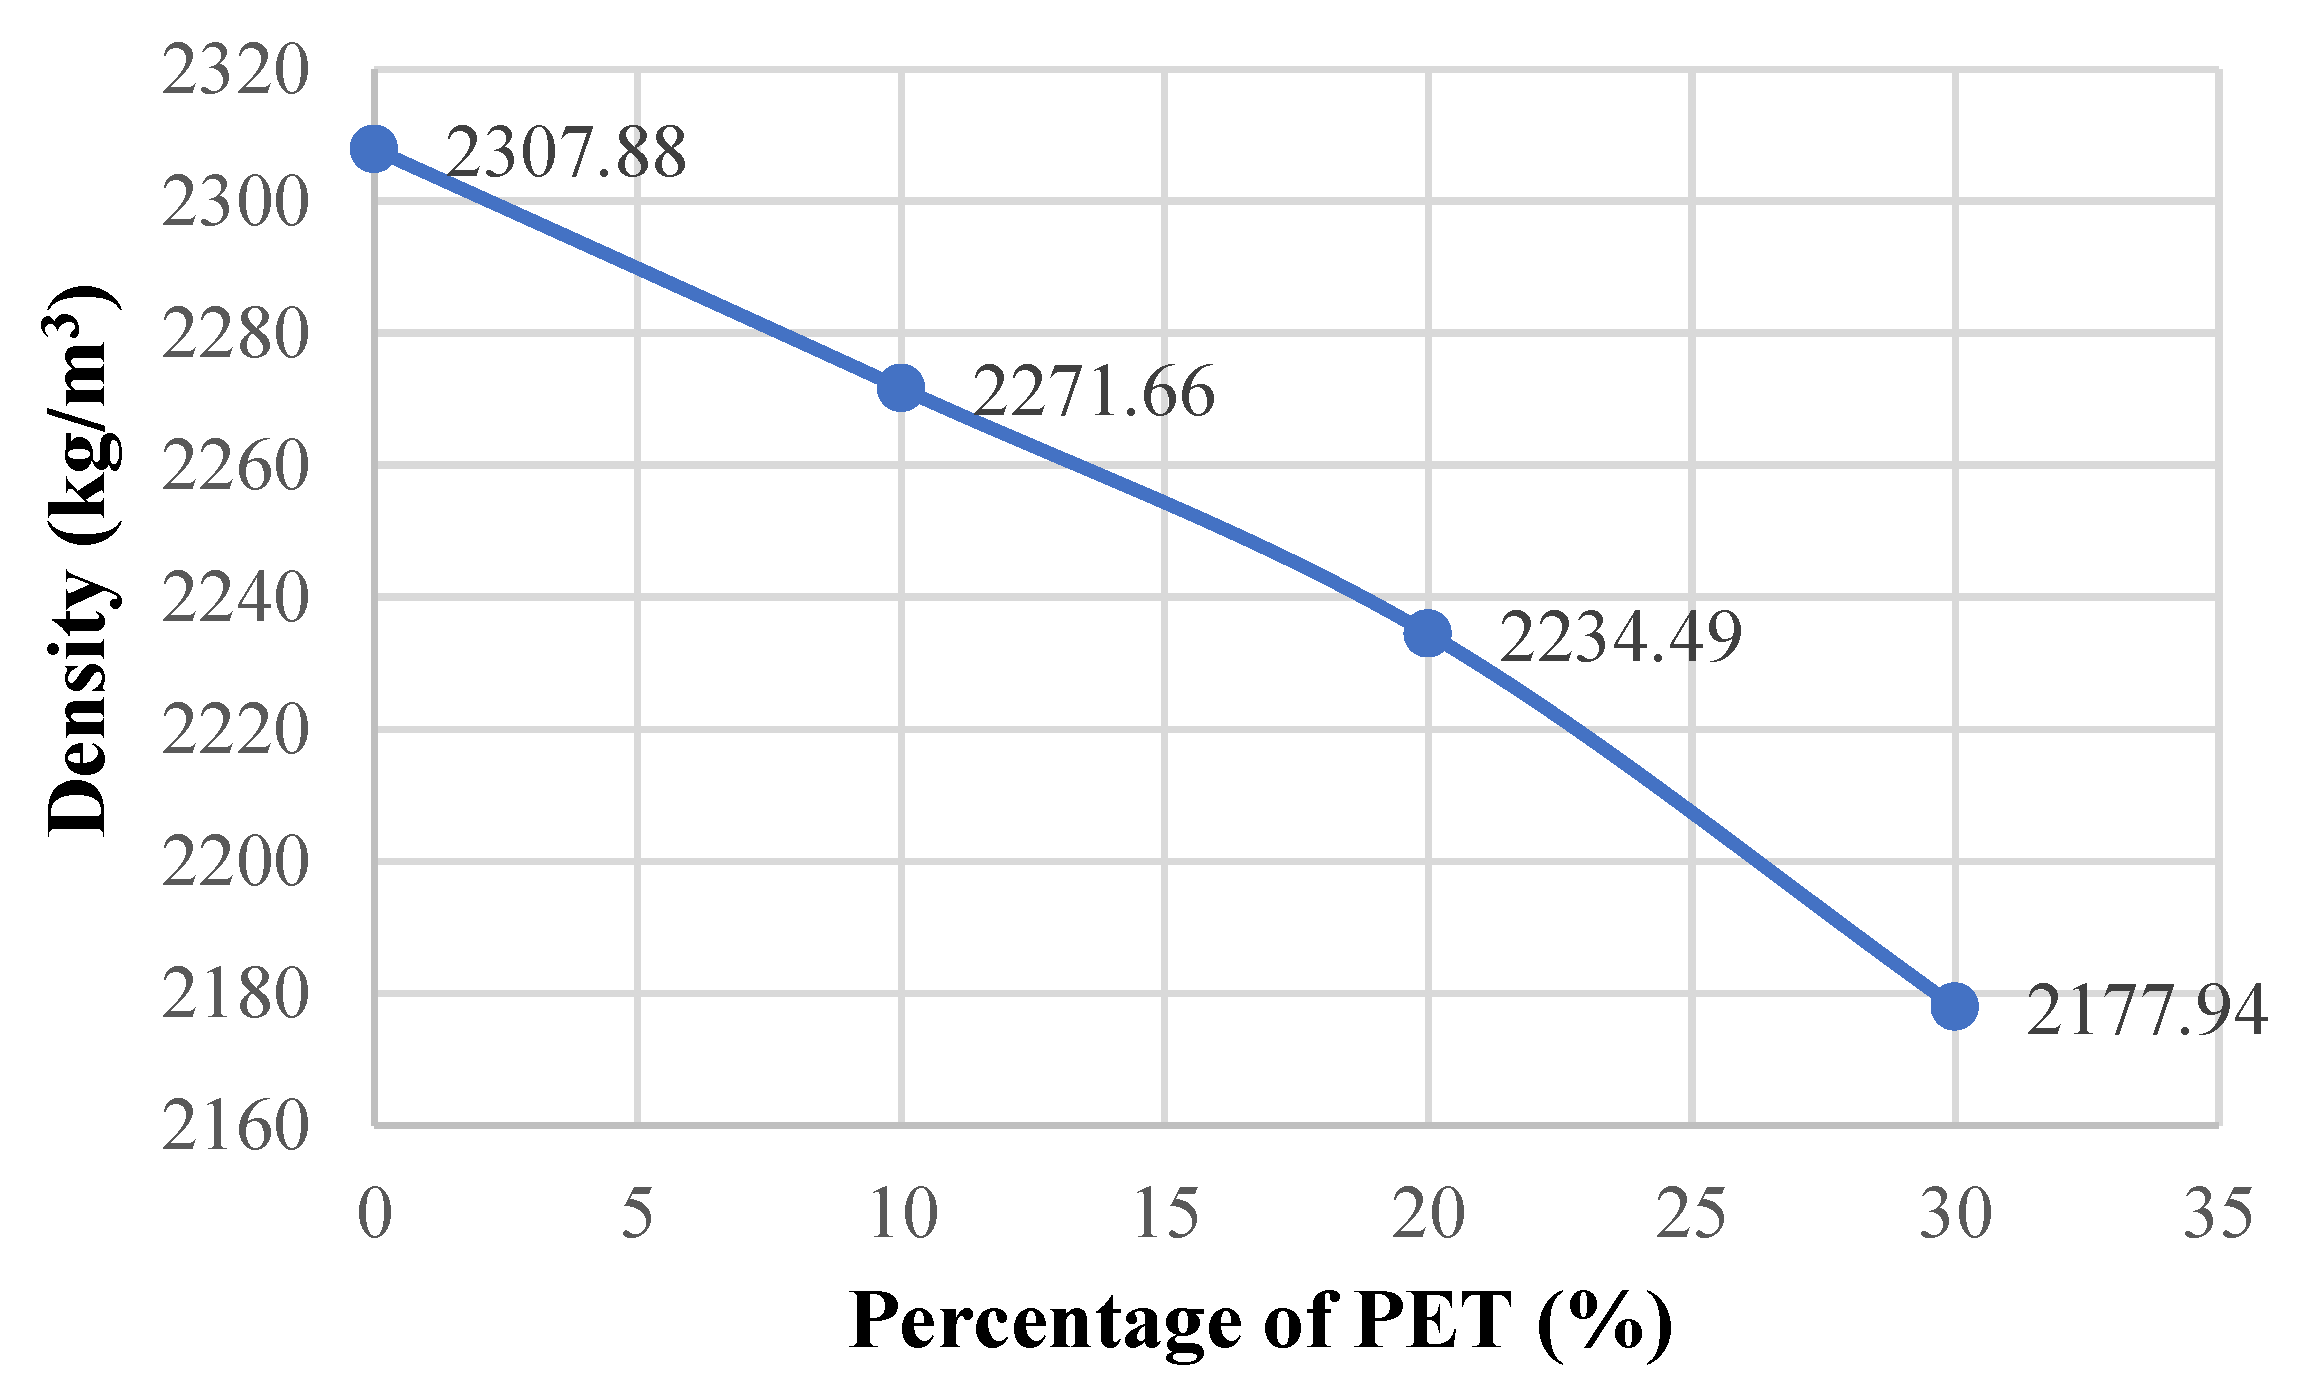
Figure 7.
Stress-strain graphs of samples without FRP.
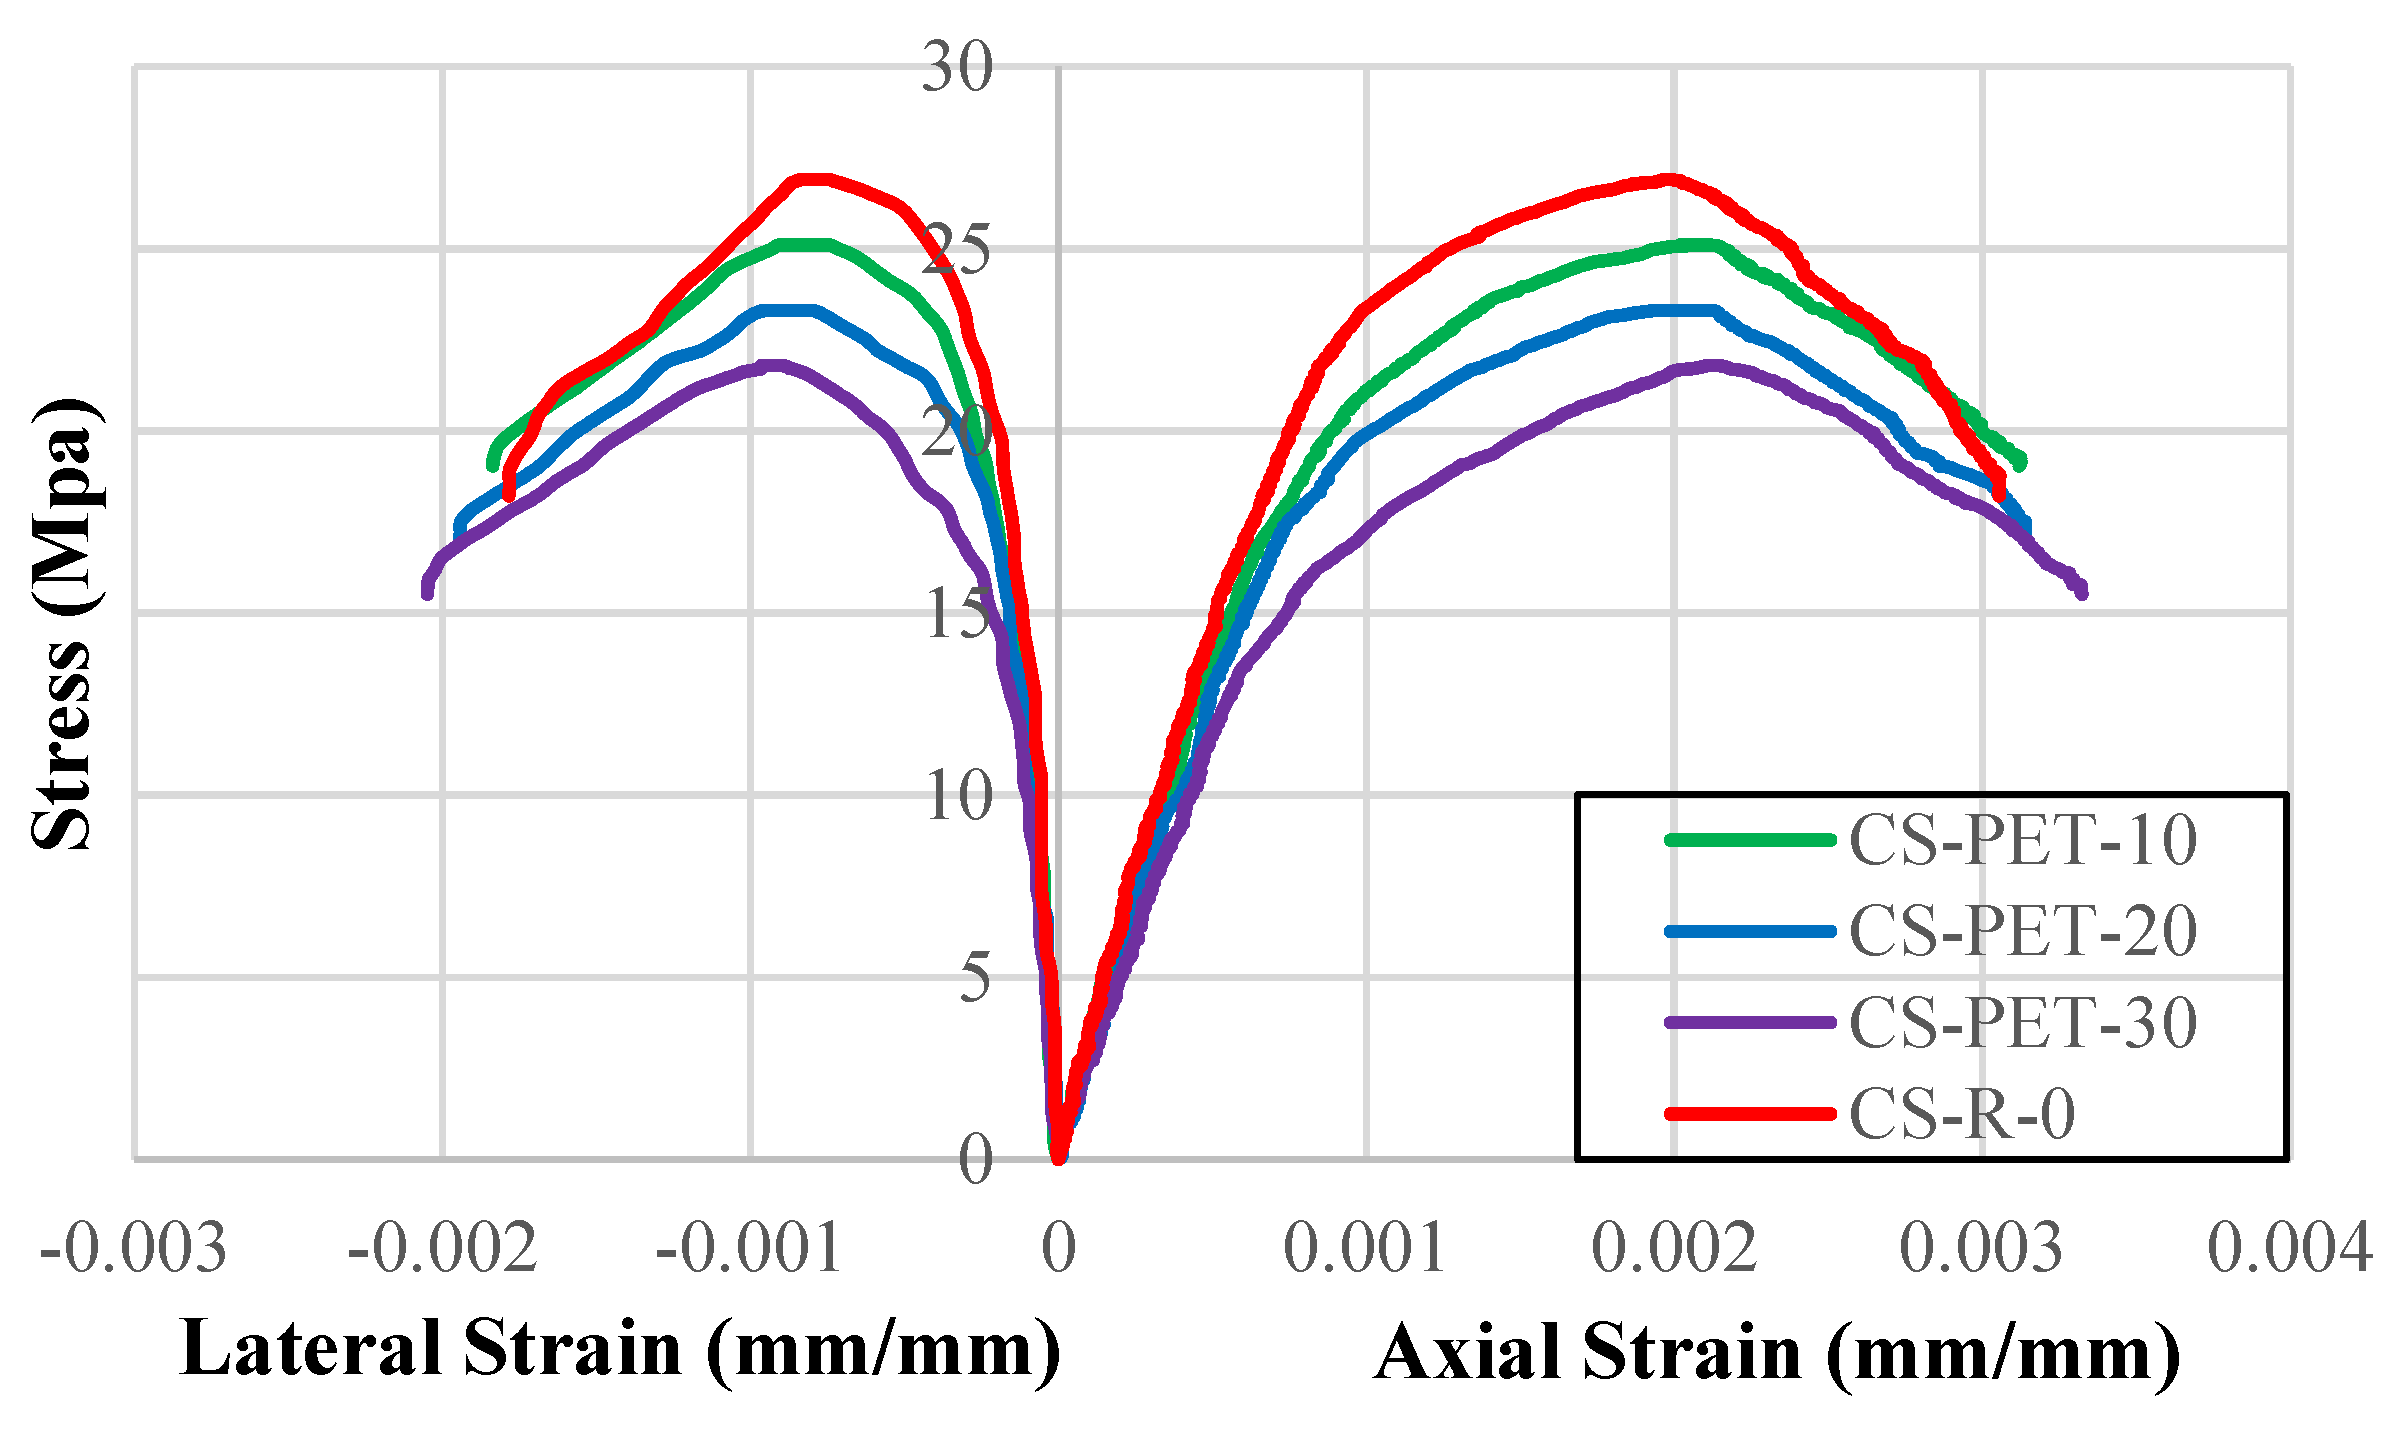
Figure 8.
Stress-strain graphs of samples with FRP.
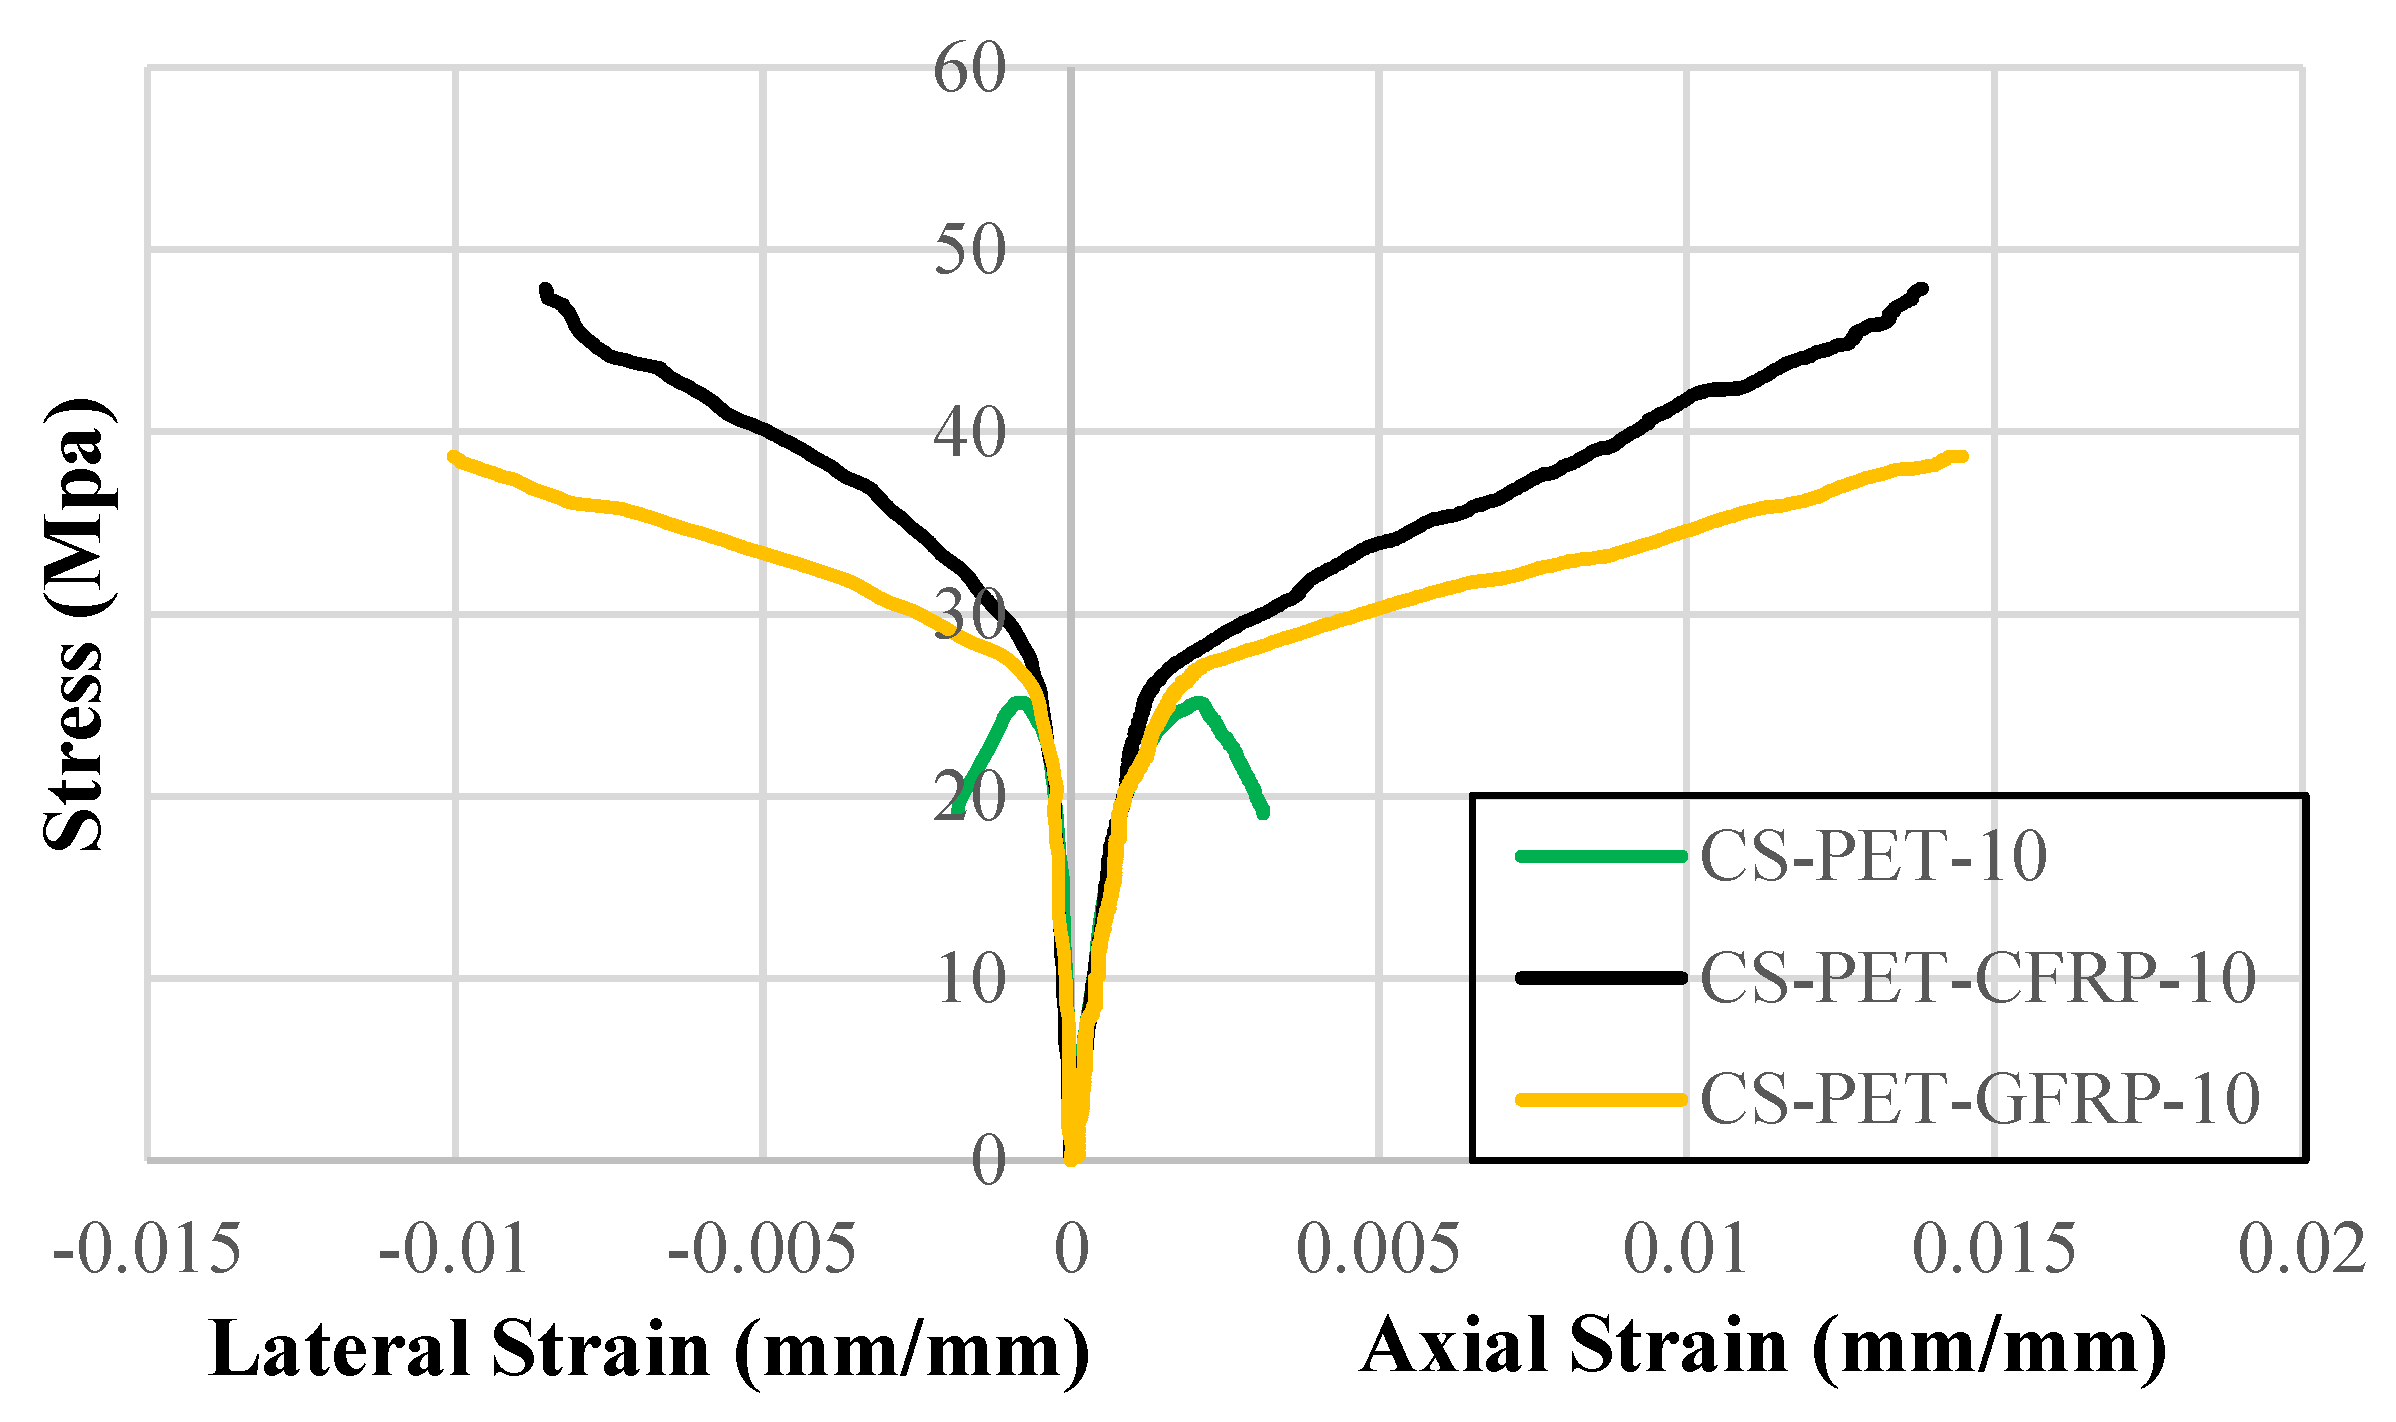
Figure 9.
Flexural stress-flexural strain graphs of samples without FRP.
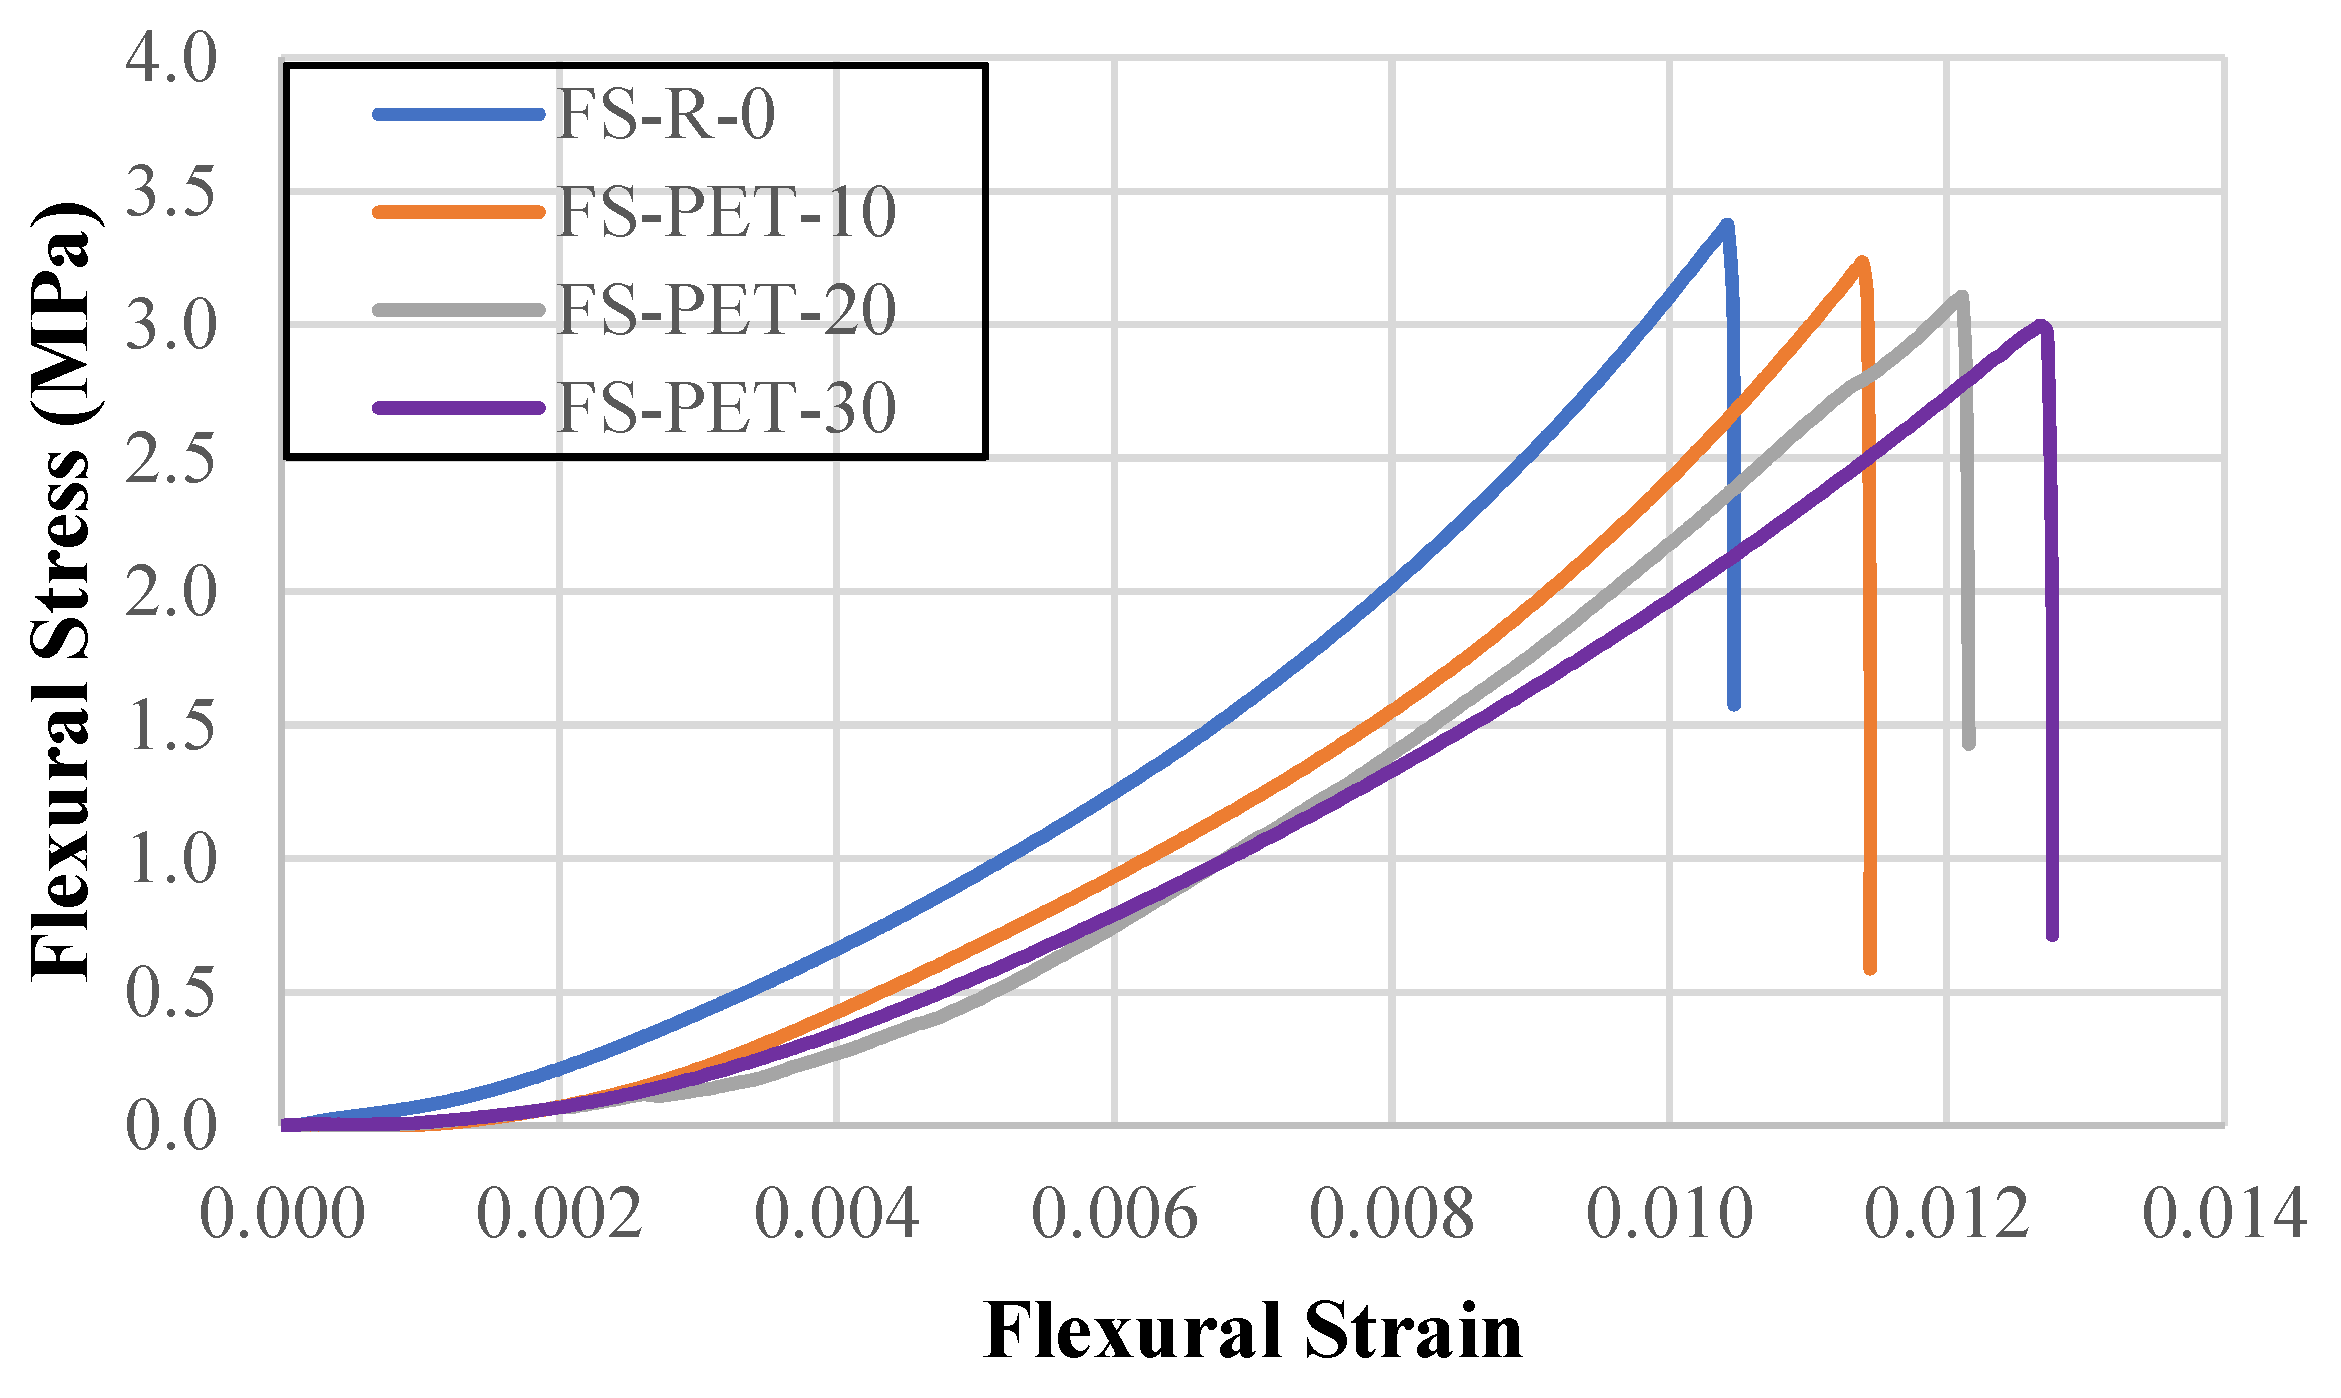
Figure 10.
Flexural stress-flexural strain graphs of samples with FRP.
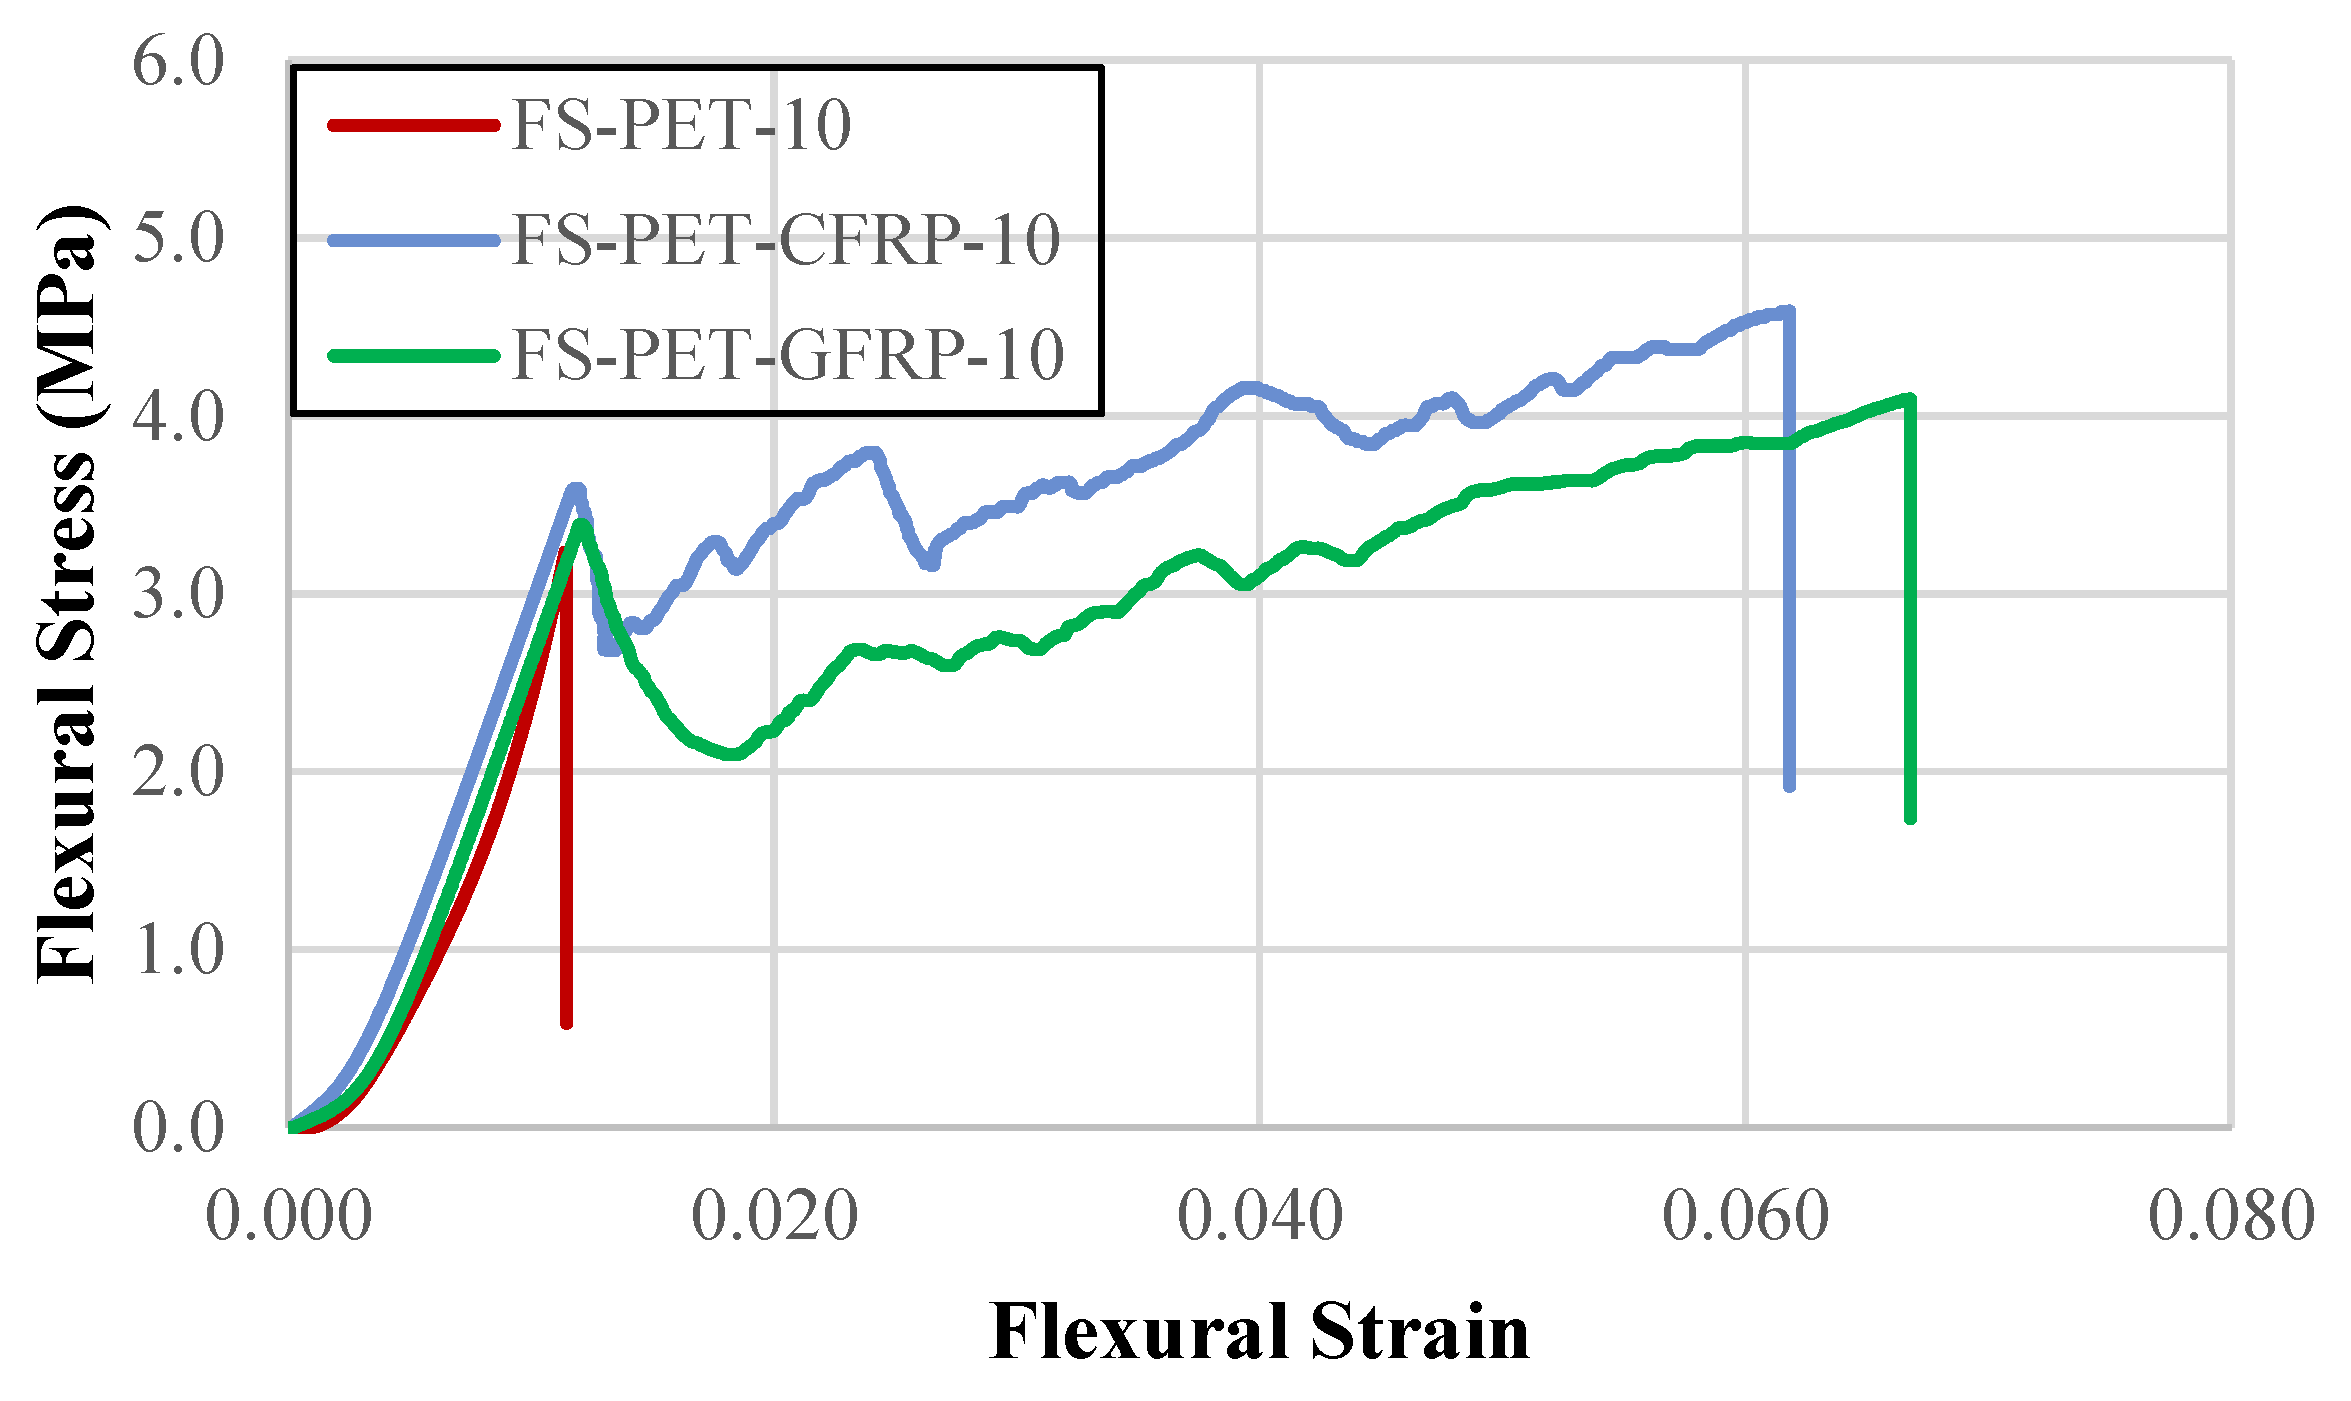
Figure 11.
Compressive strength ratio-PET (%) graph.
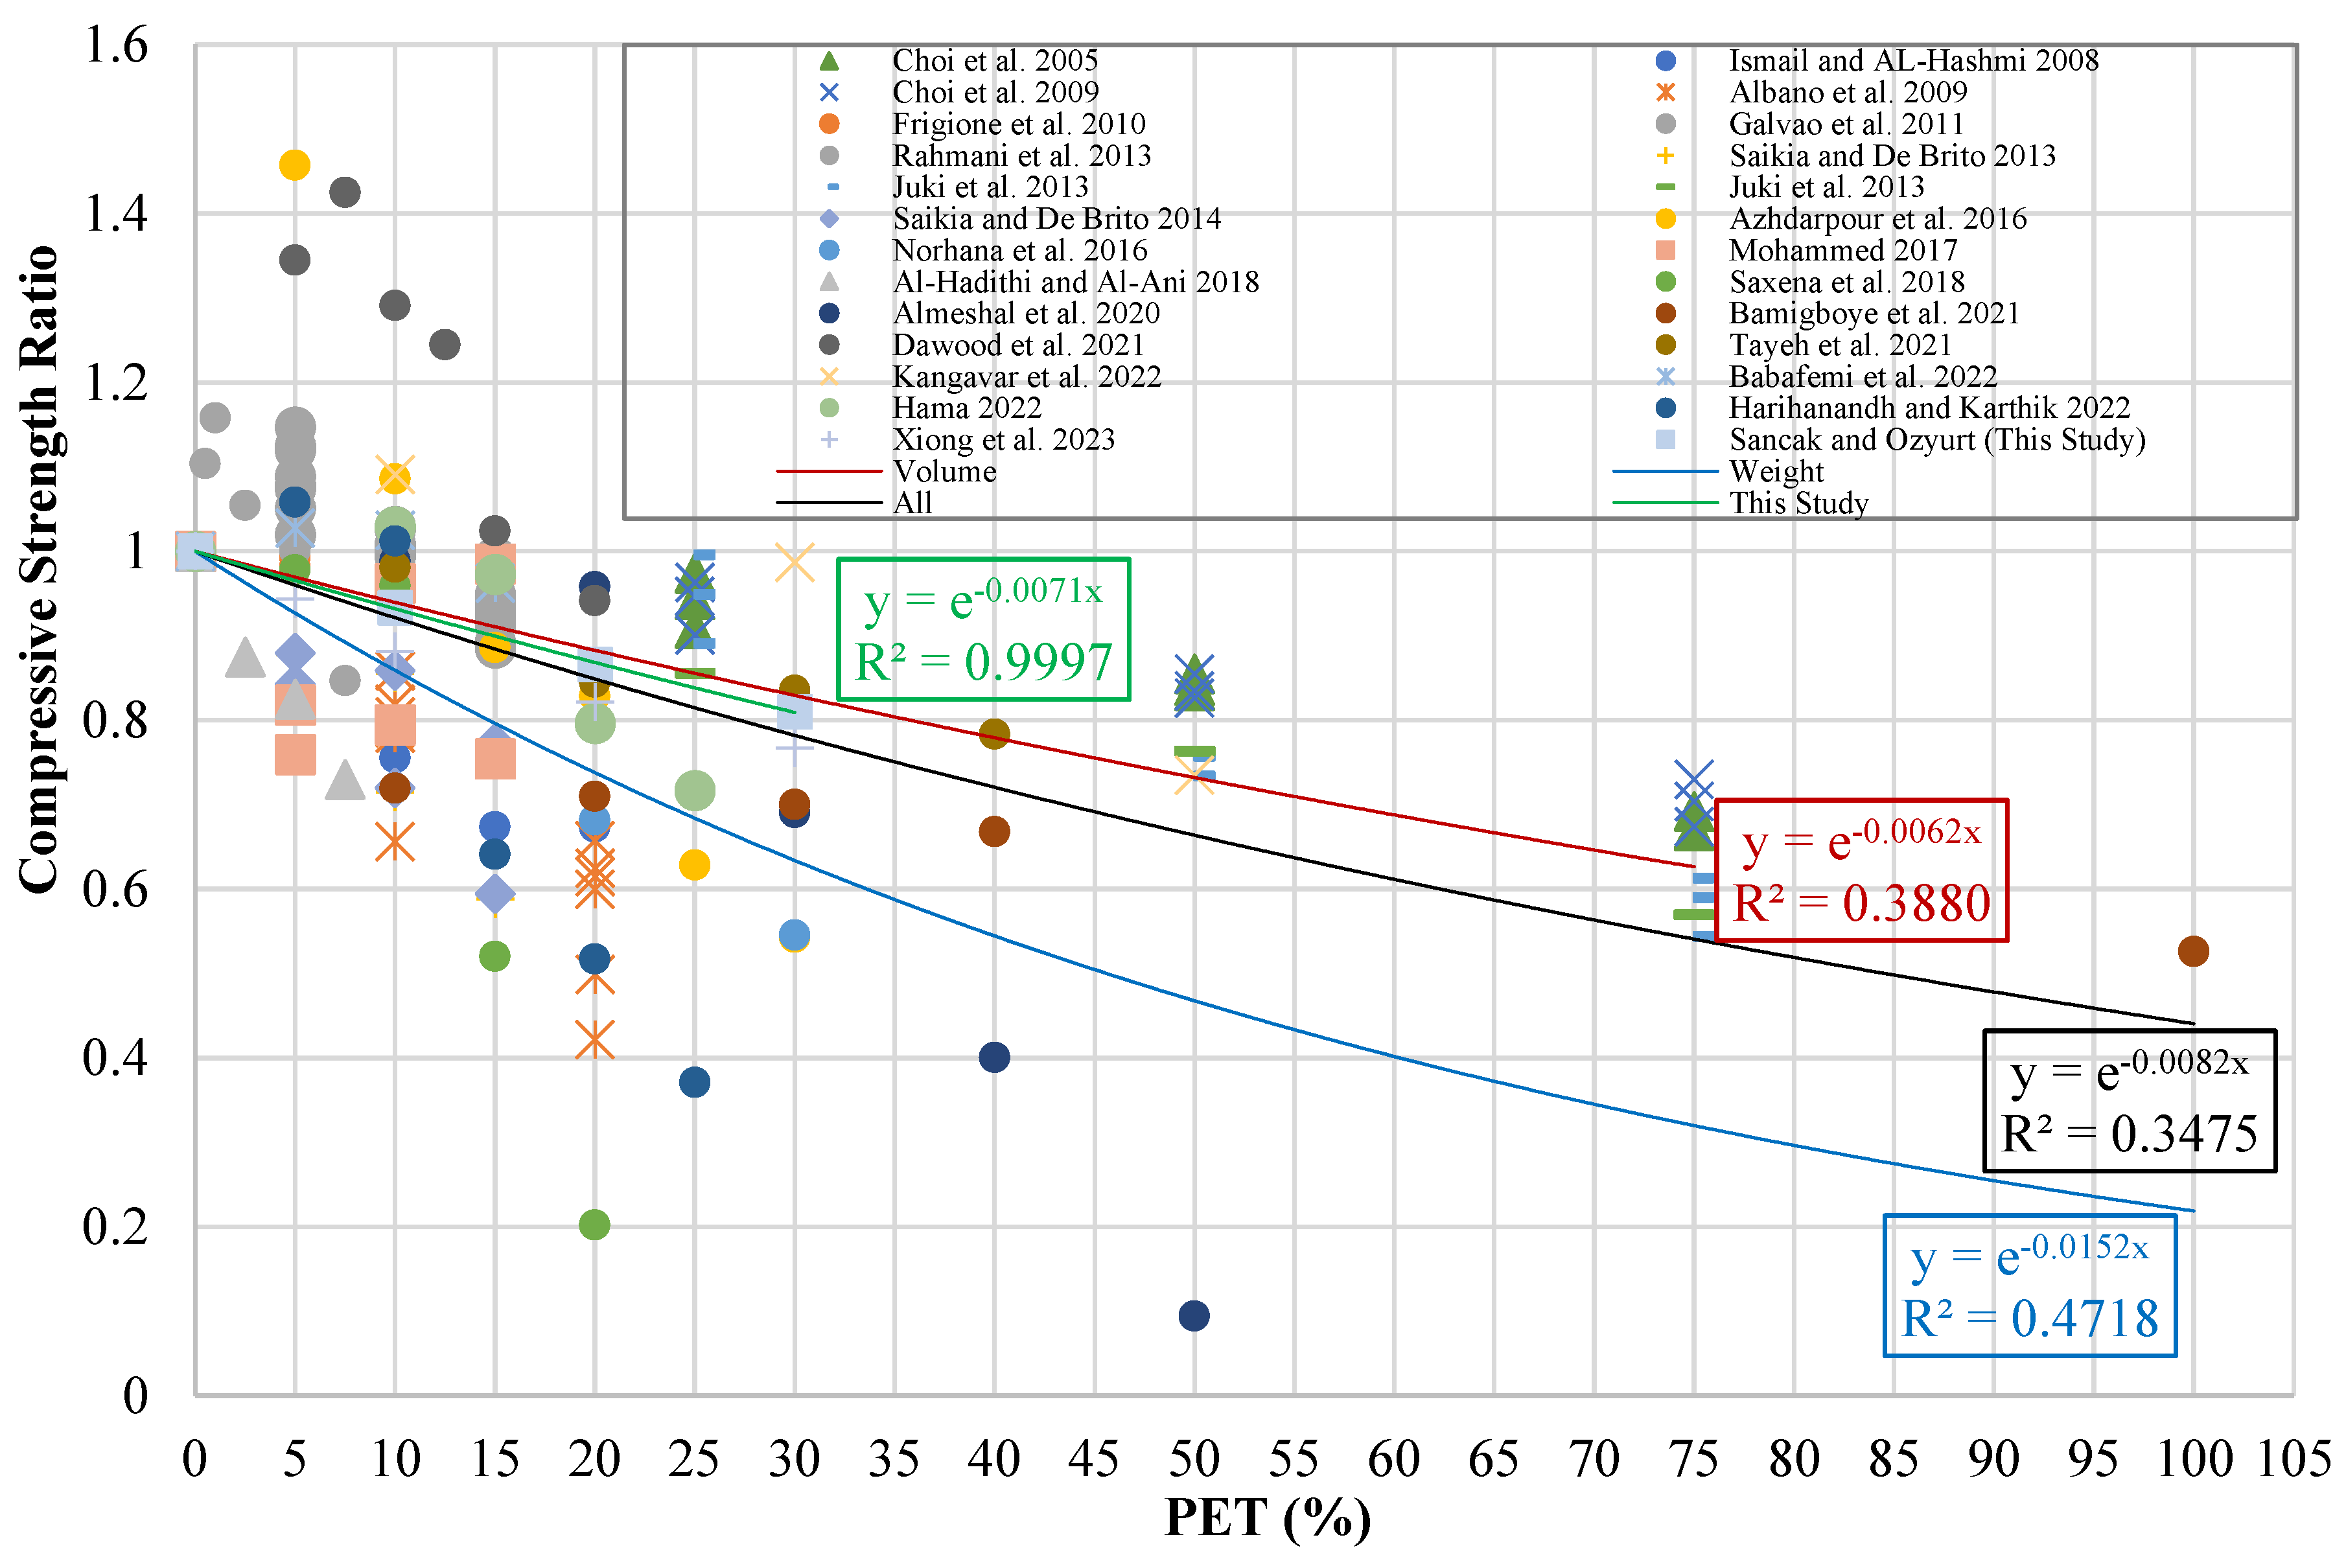
Figure 12.
Comparison of R2 and MABE for compressive strength models.
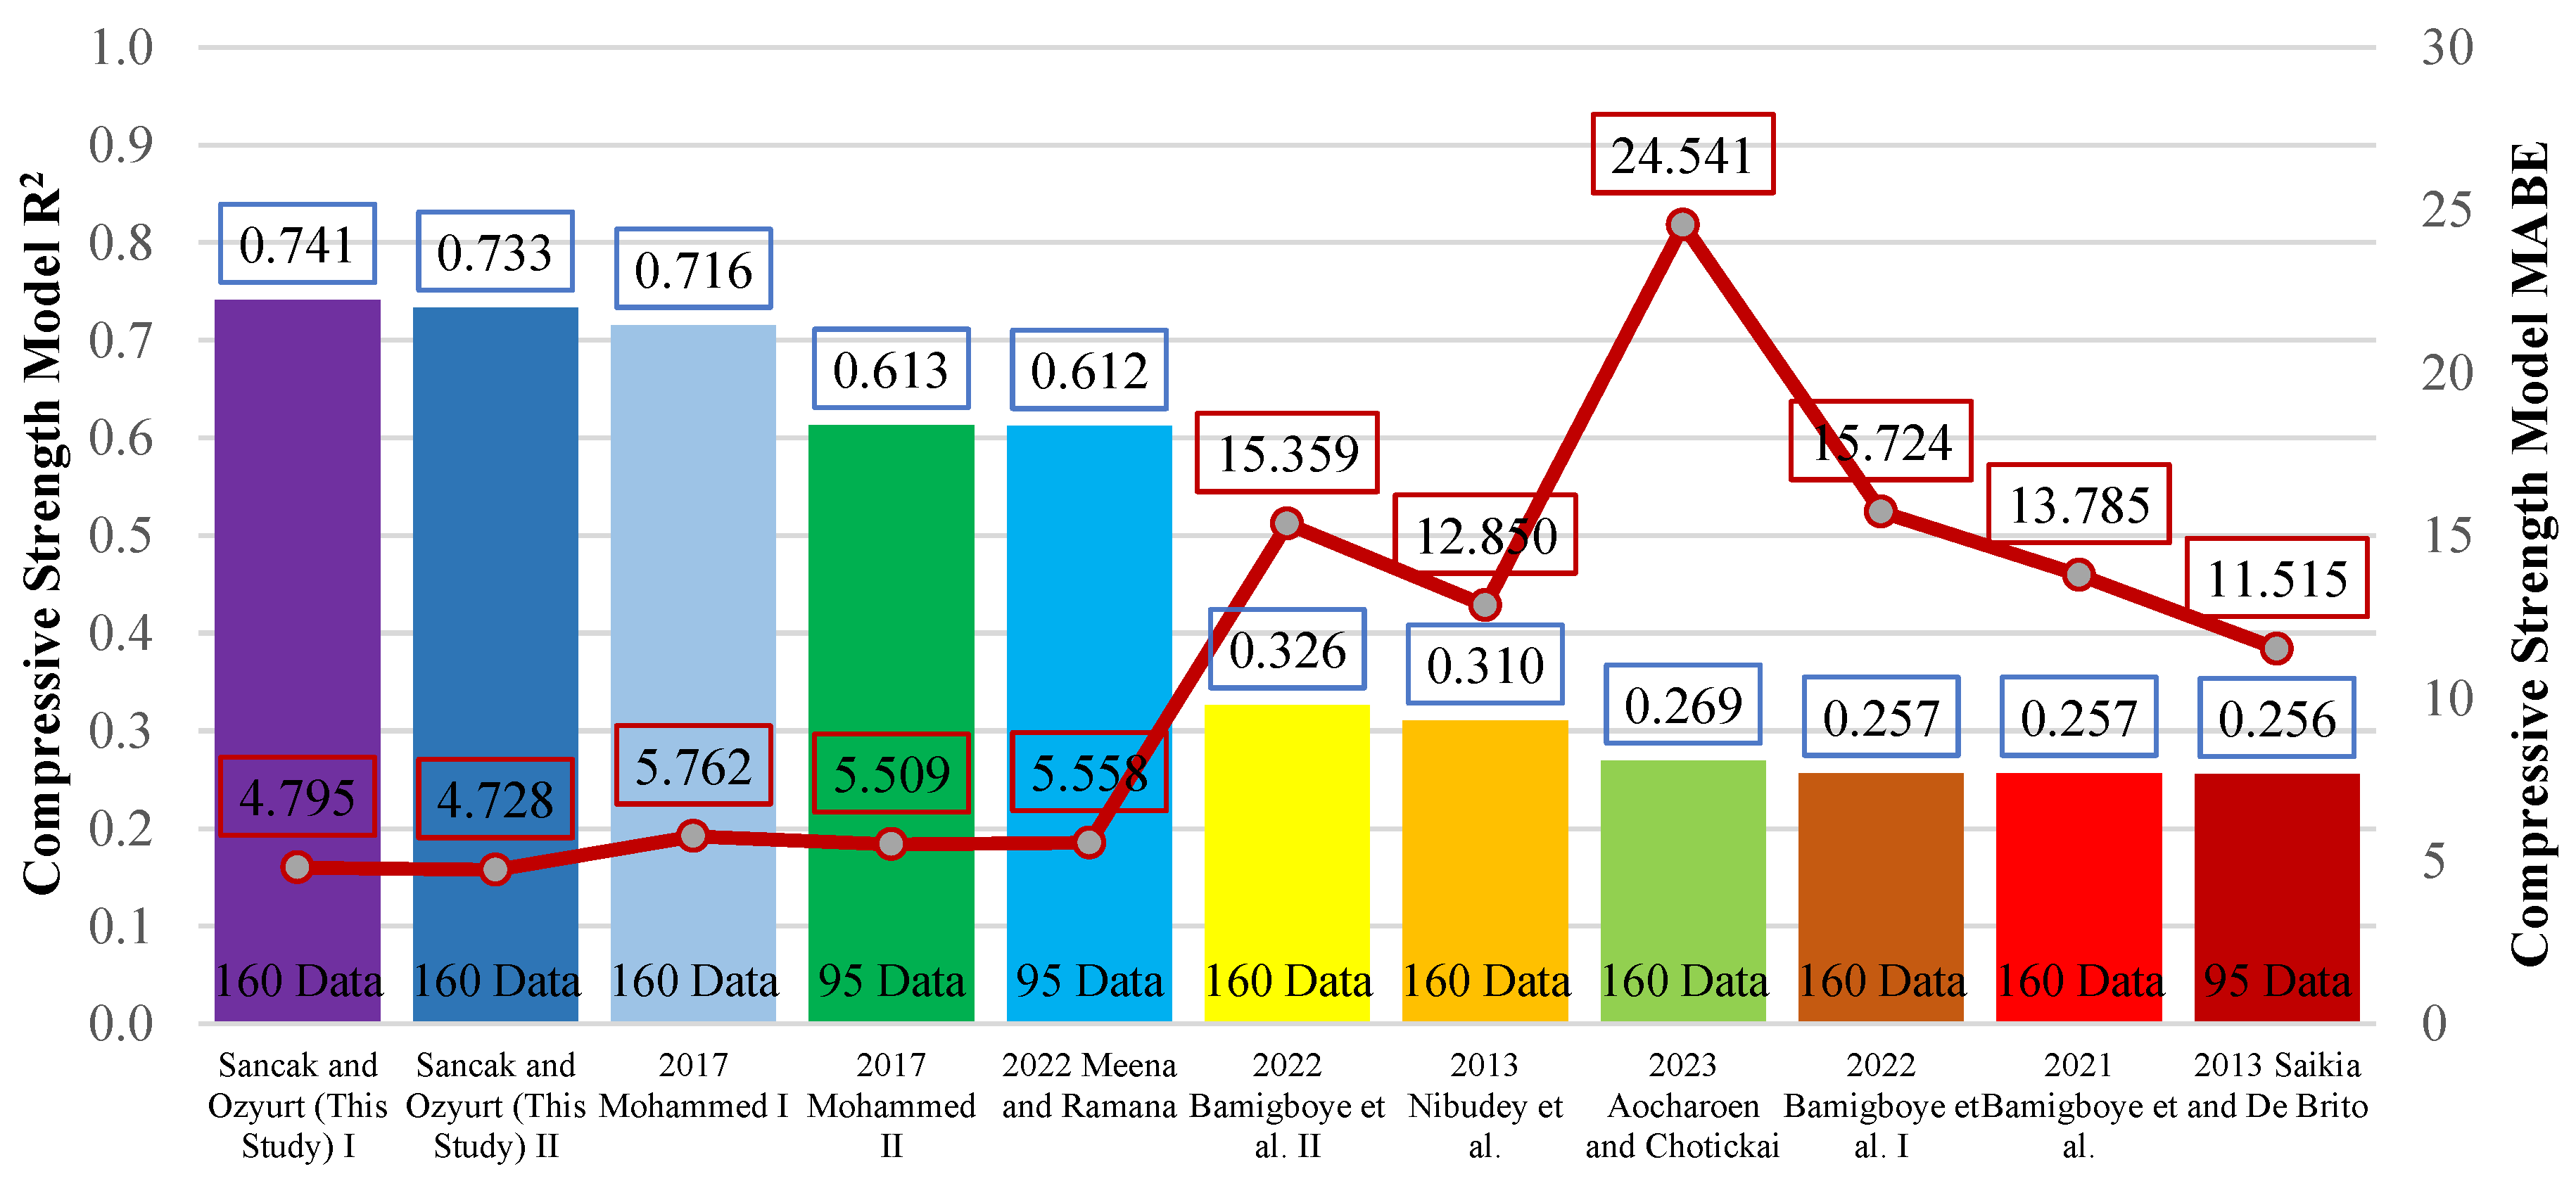
Figure 13.
Tensile strength ratio-PET (%) graph.
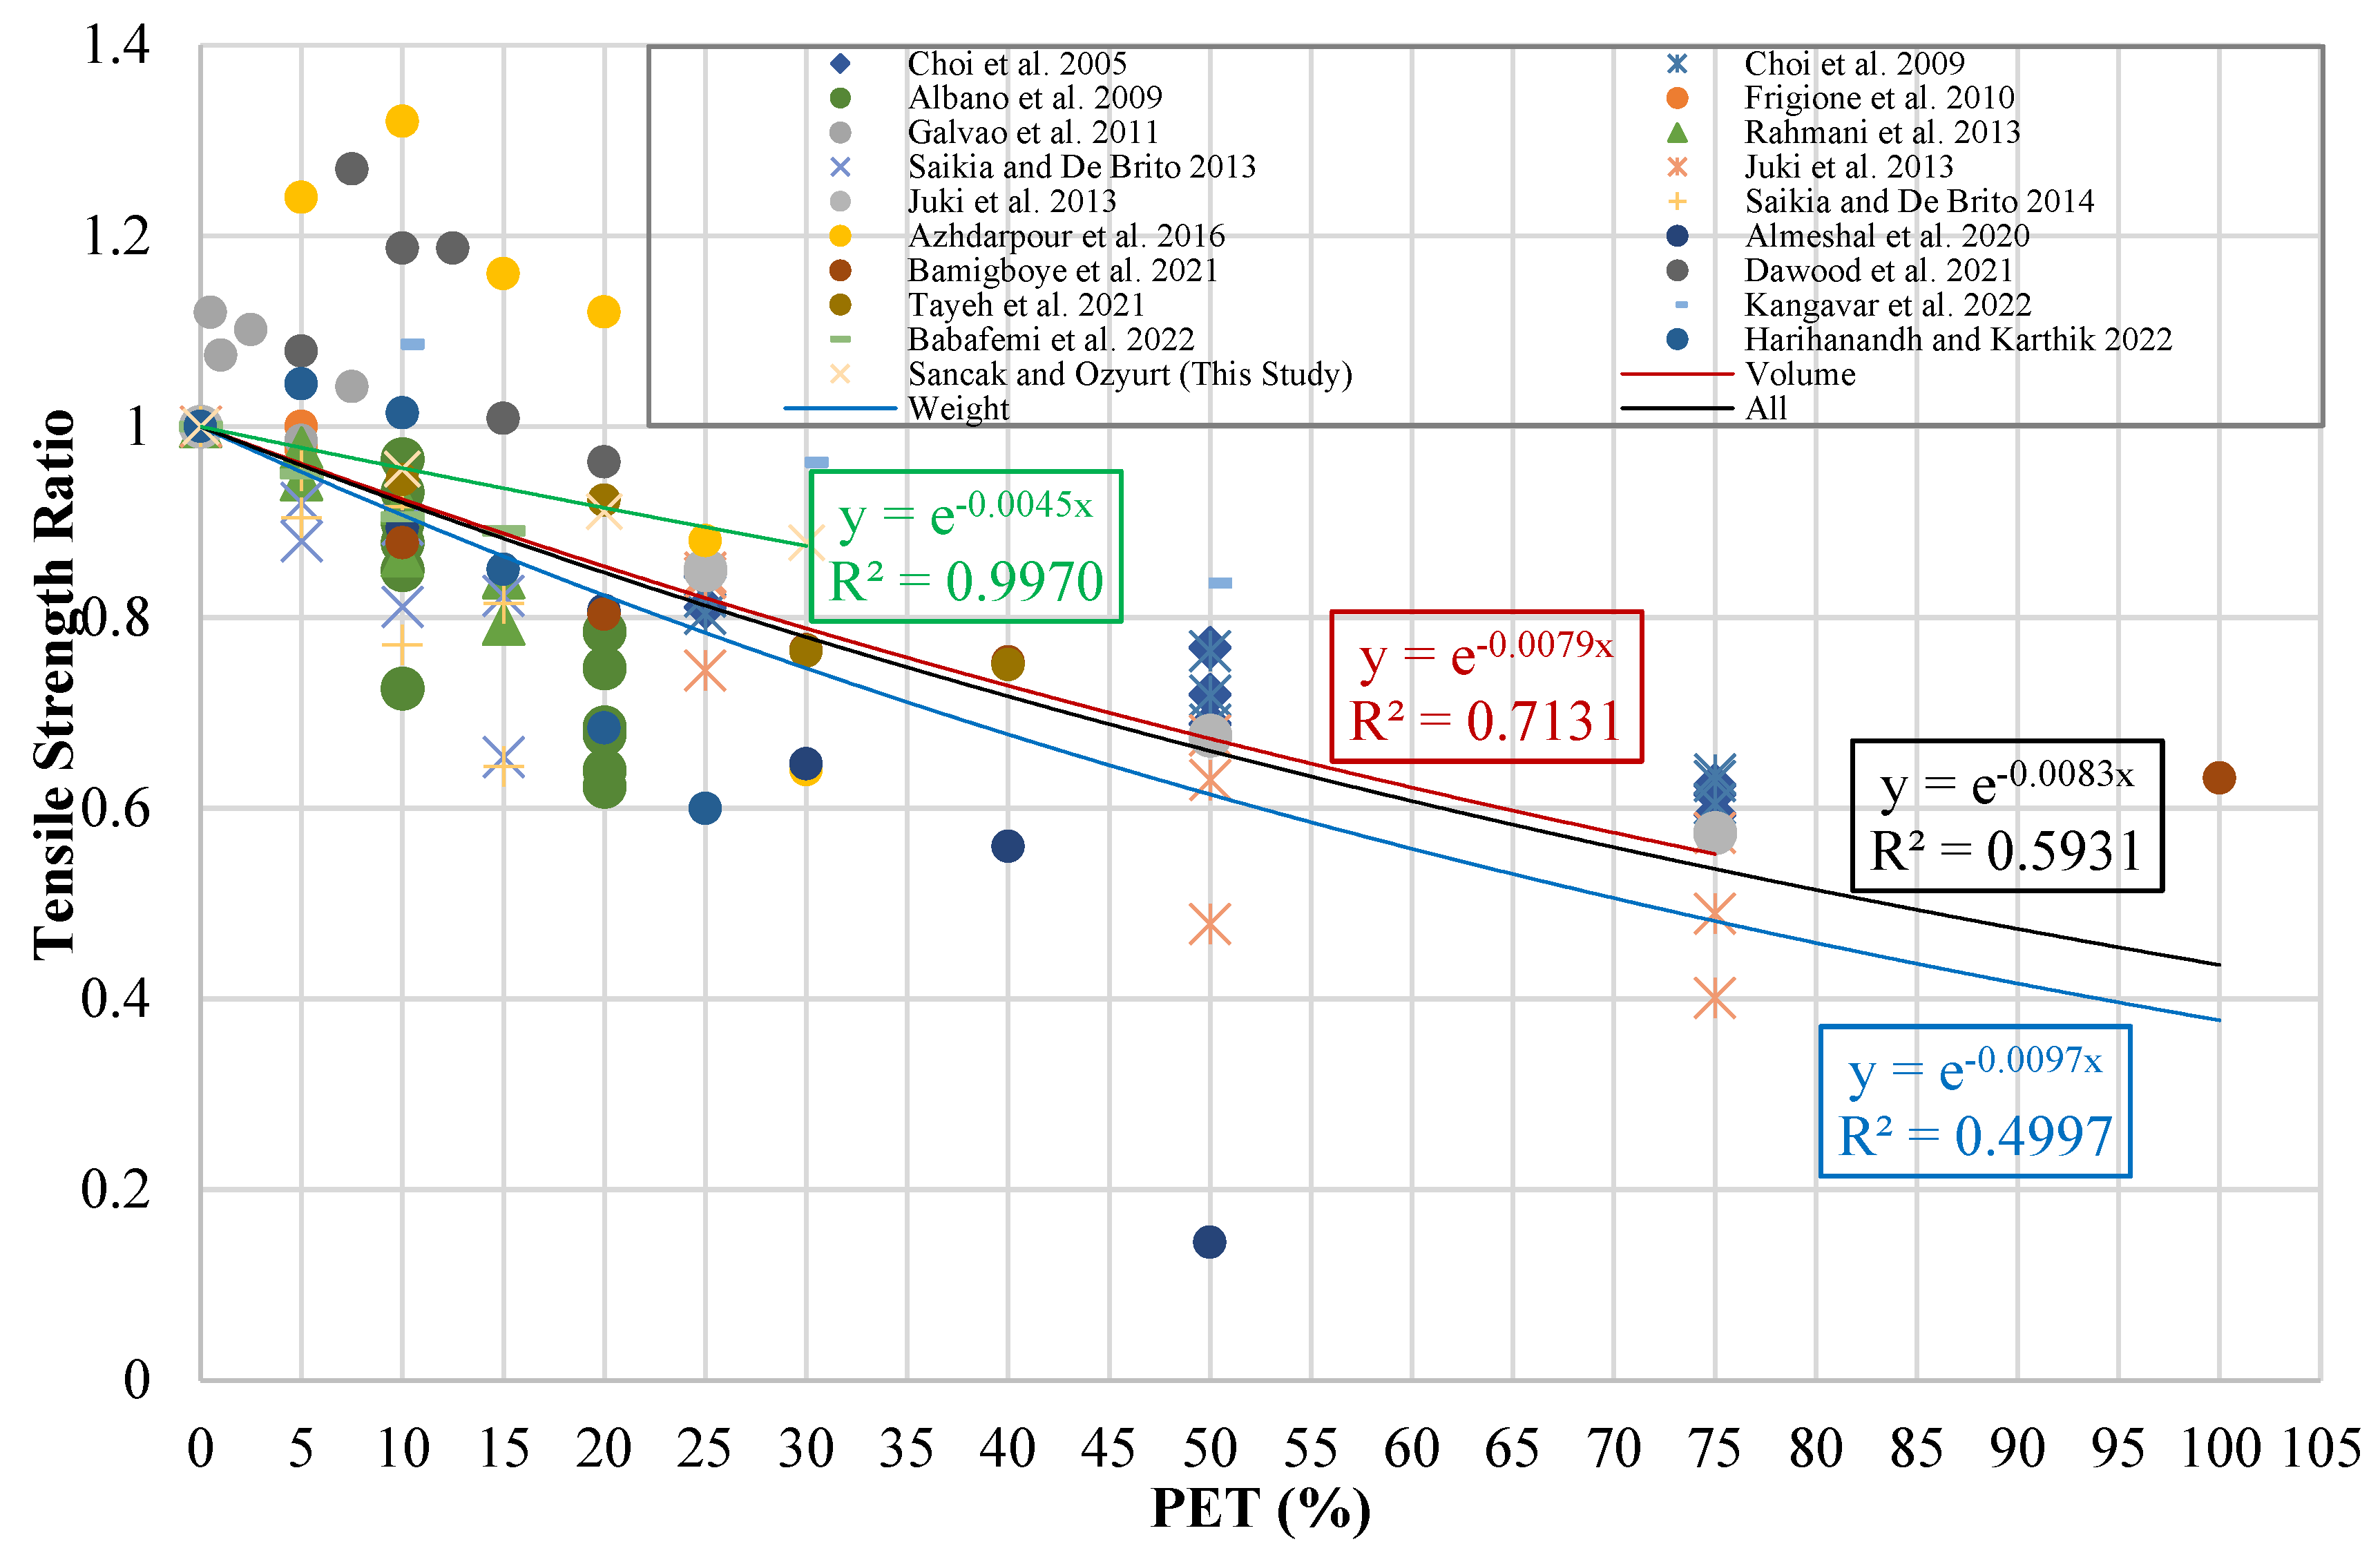
Figure 14.
Comparison of R2 and MABE for models of the connection between tensile strength and PET (%).
Figure 14.
Comparison of R2 and MABE for models of the connection between tensile strength and PET (%).
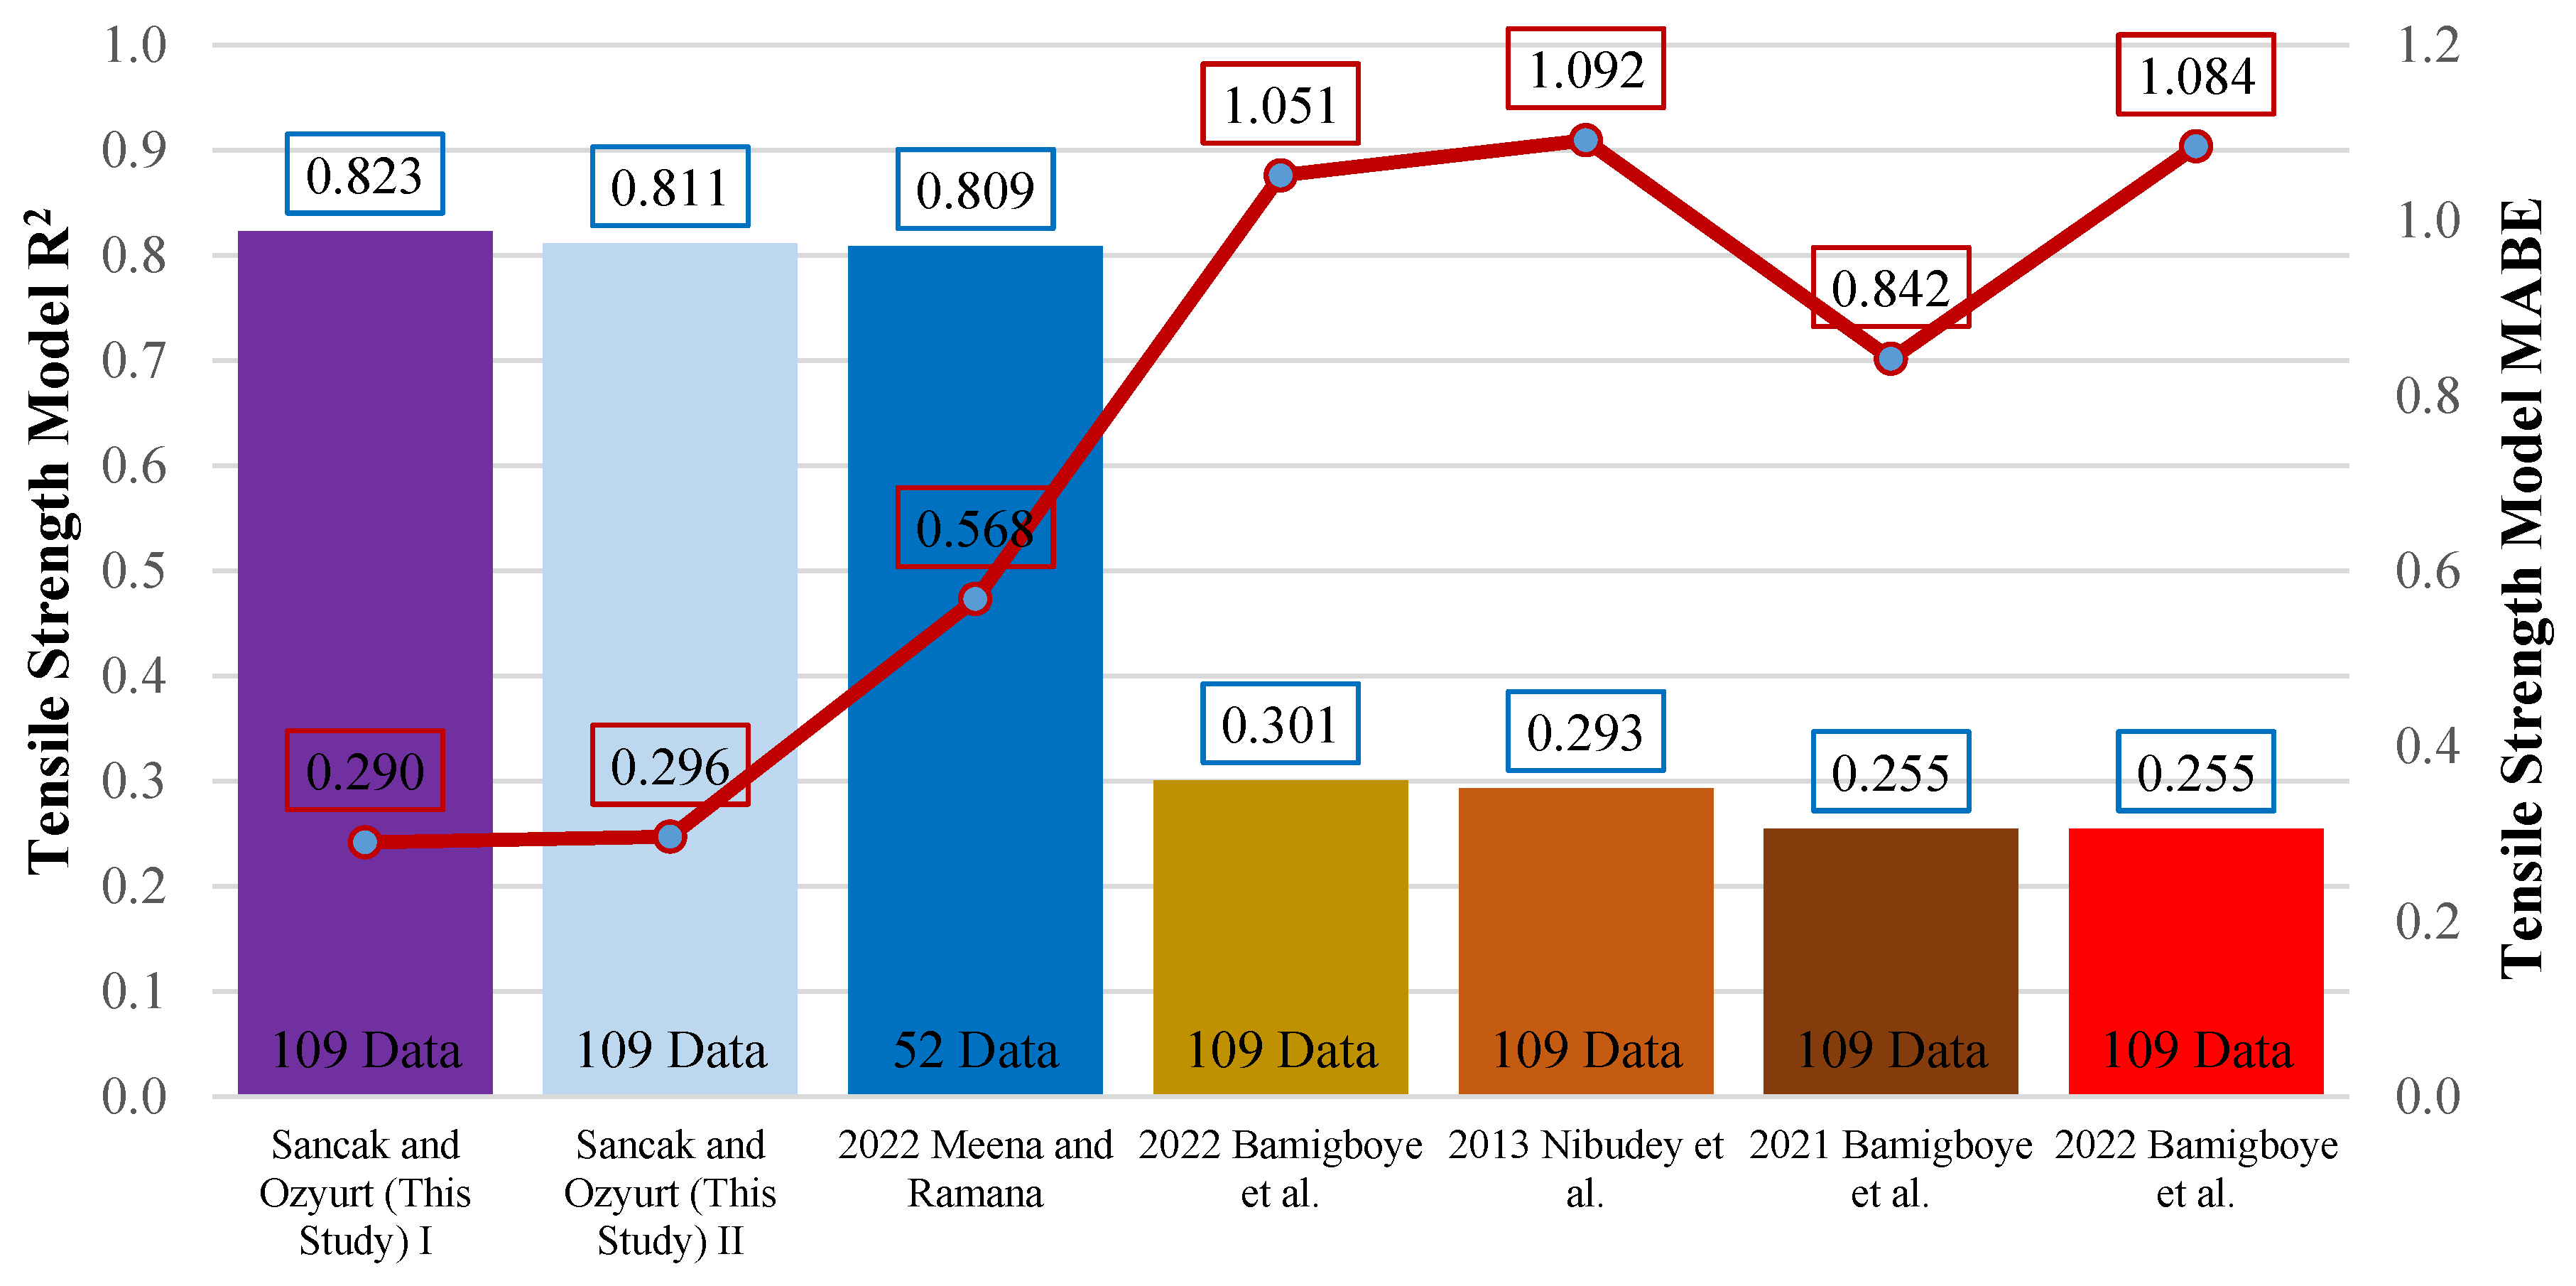
Figure 15.
Tensile strength-compressive strength graph.
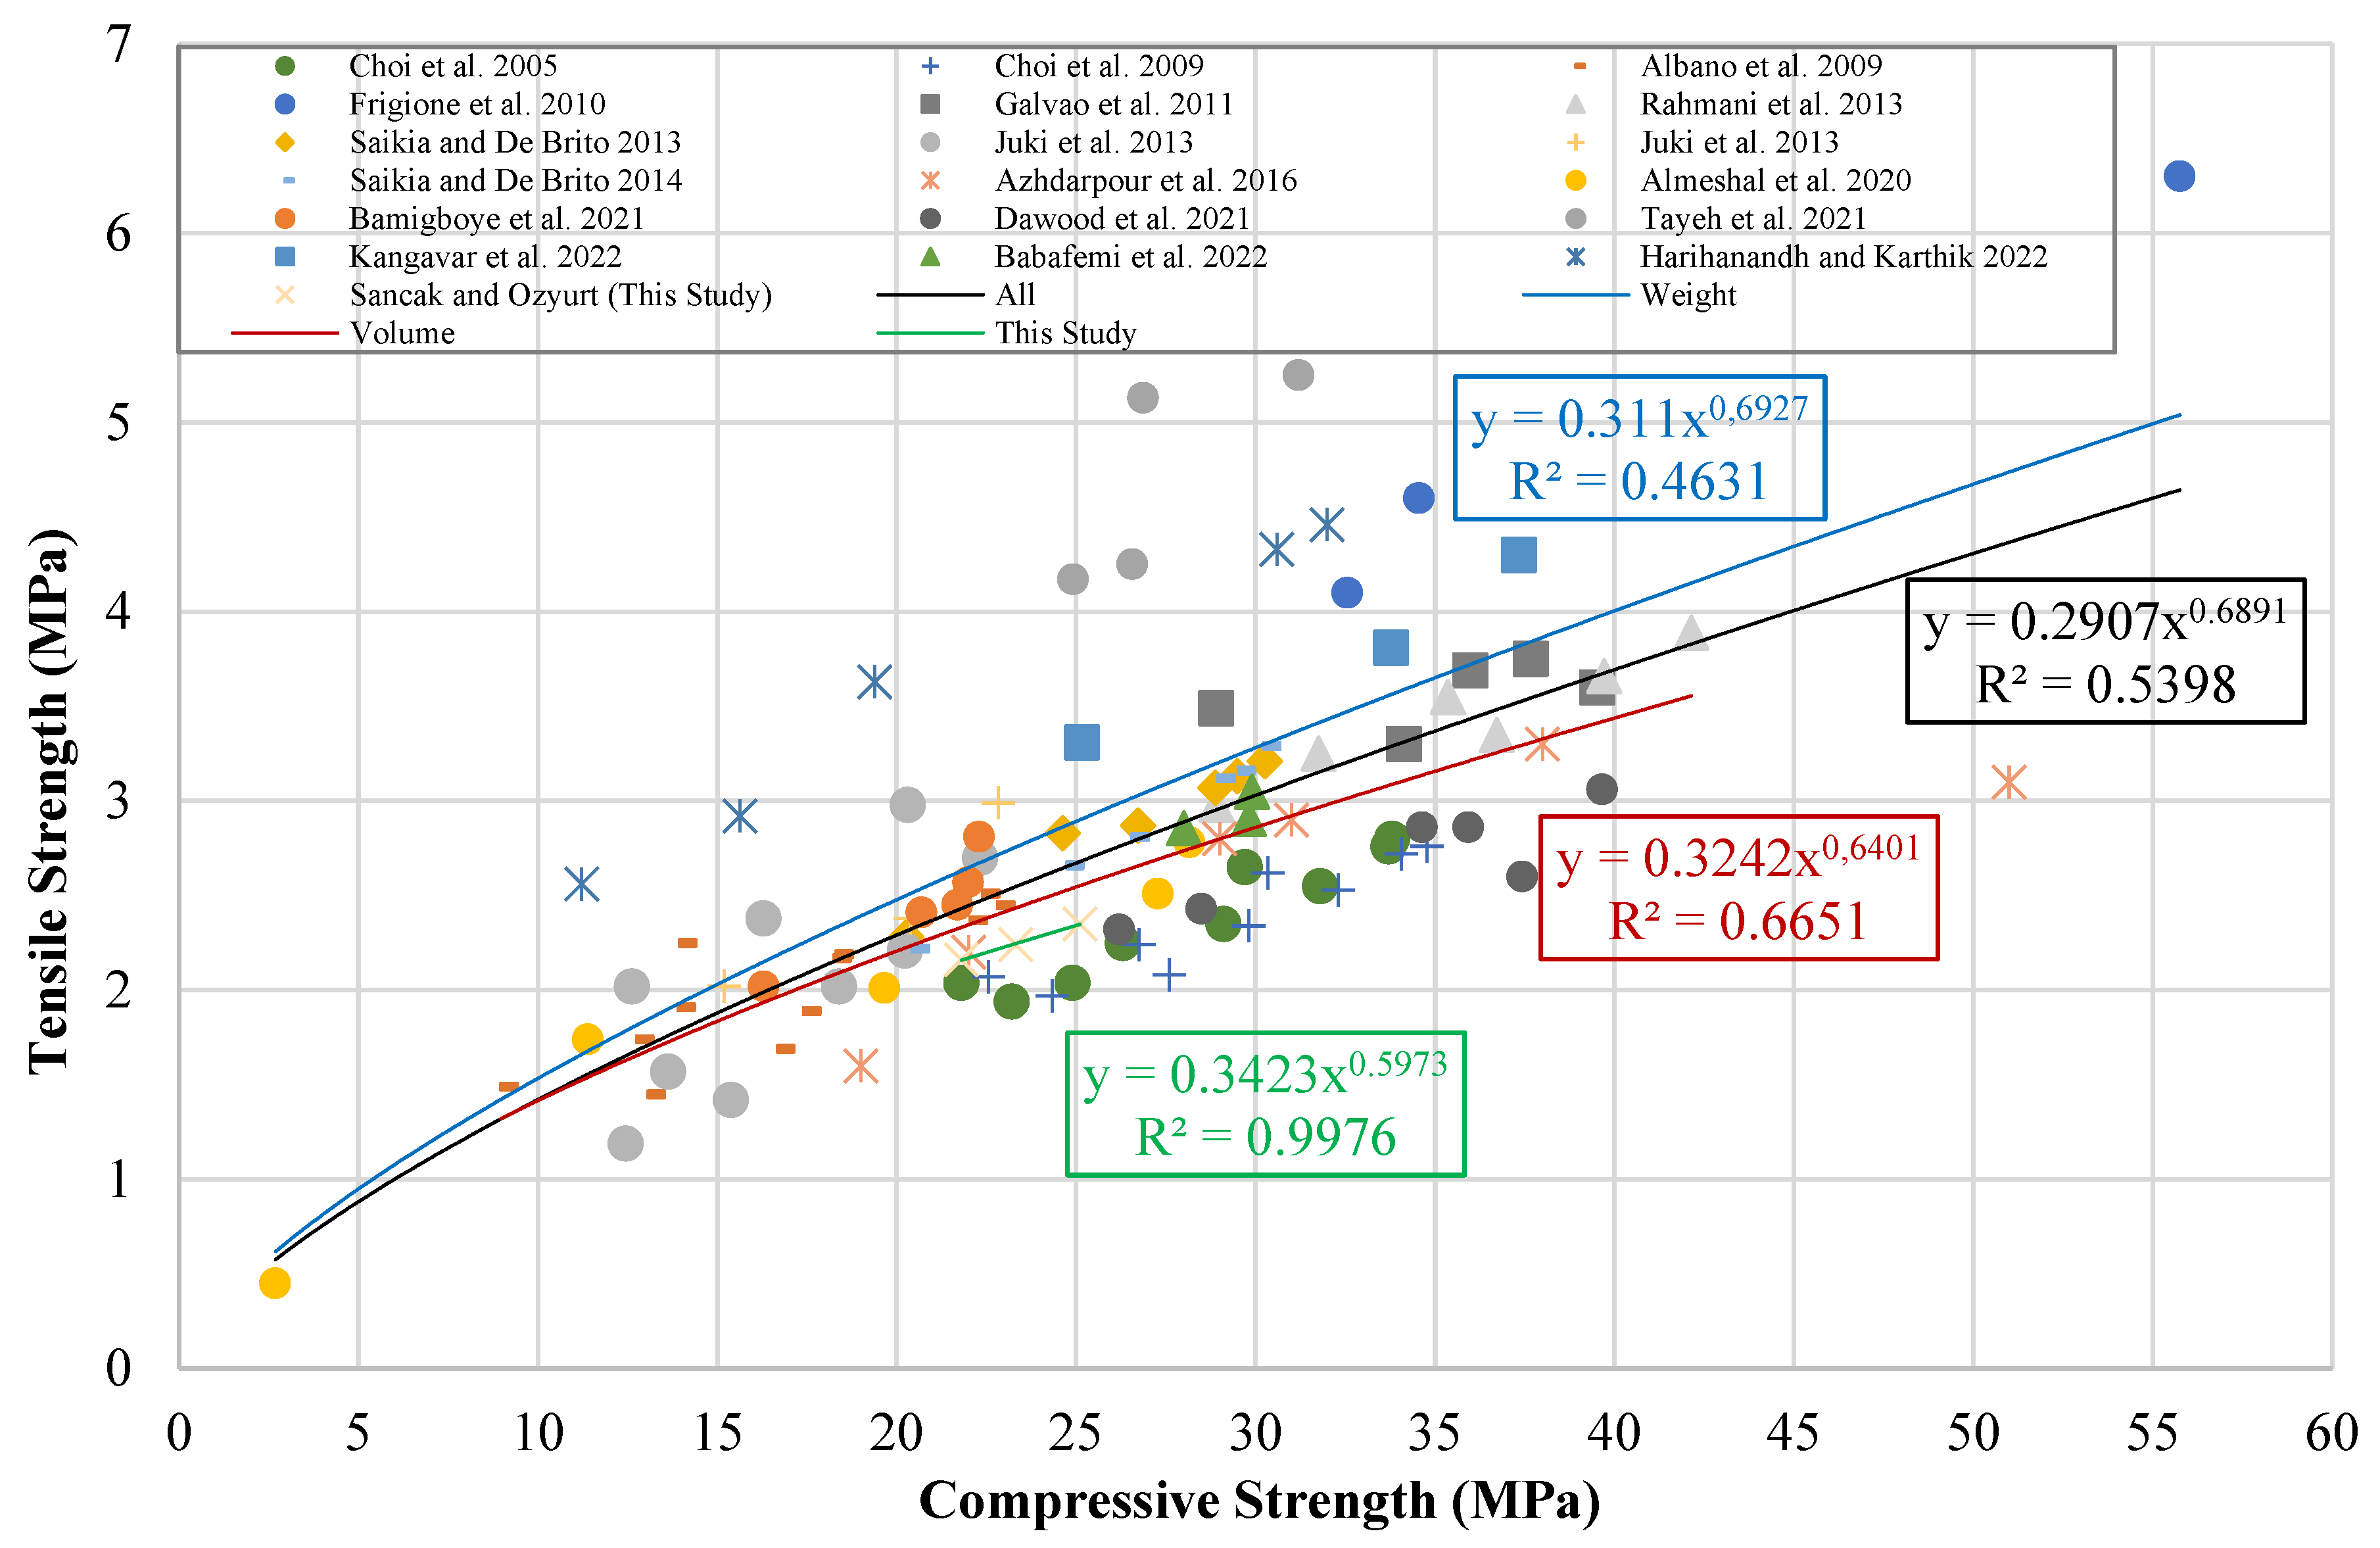
Figure 16.
Comparison of R2 and MABE for models of the connection between tensile strength and compressive strength.
Figure 16.
Comparison of R2 and MABE for models of the connection between tensile strength and compressive strength.
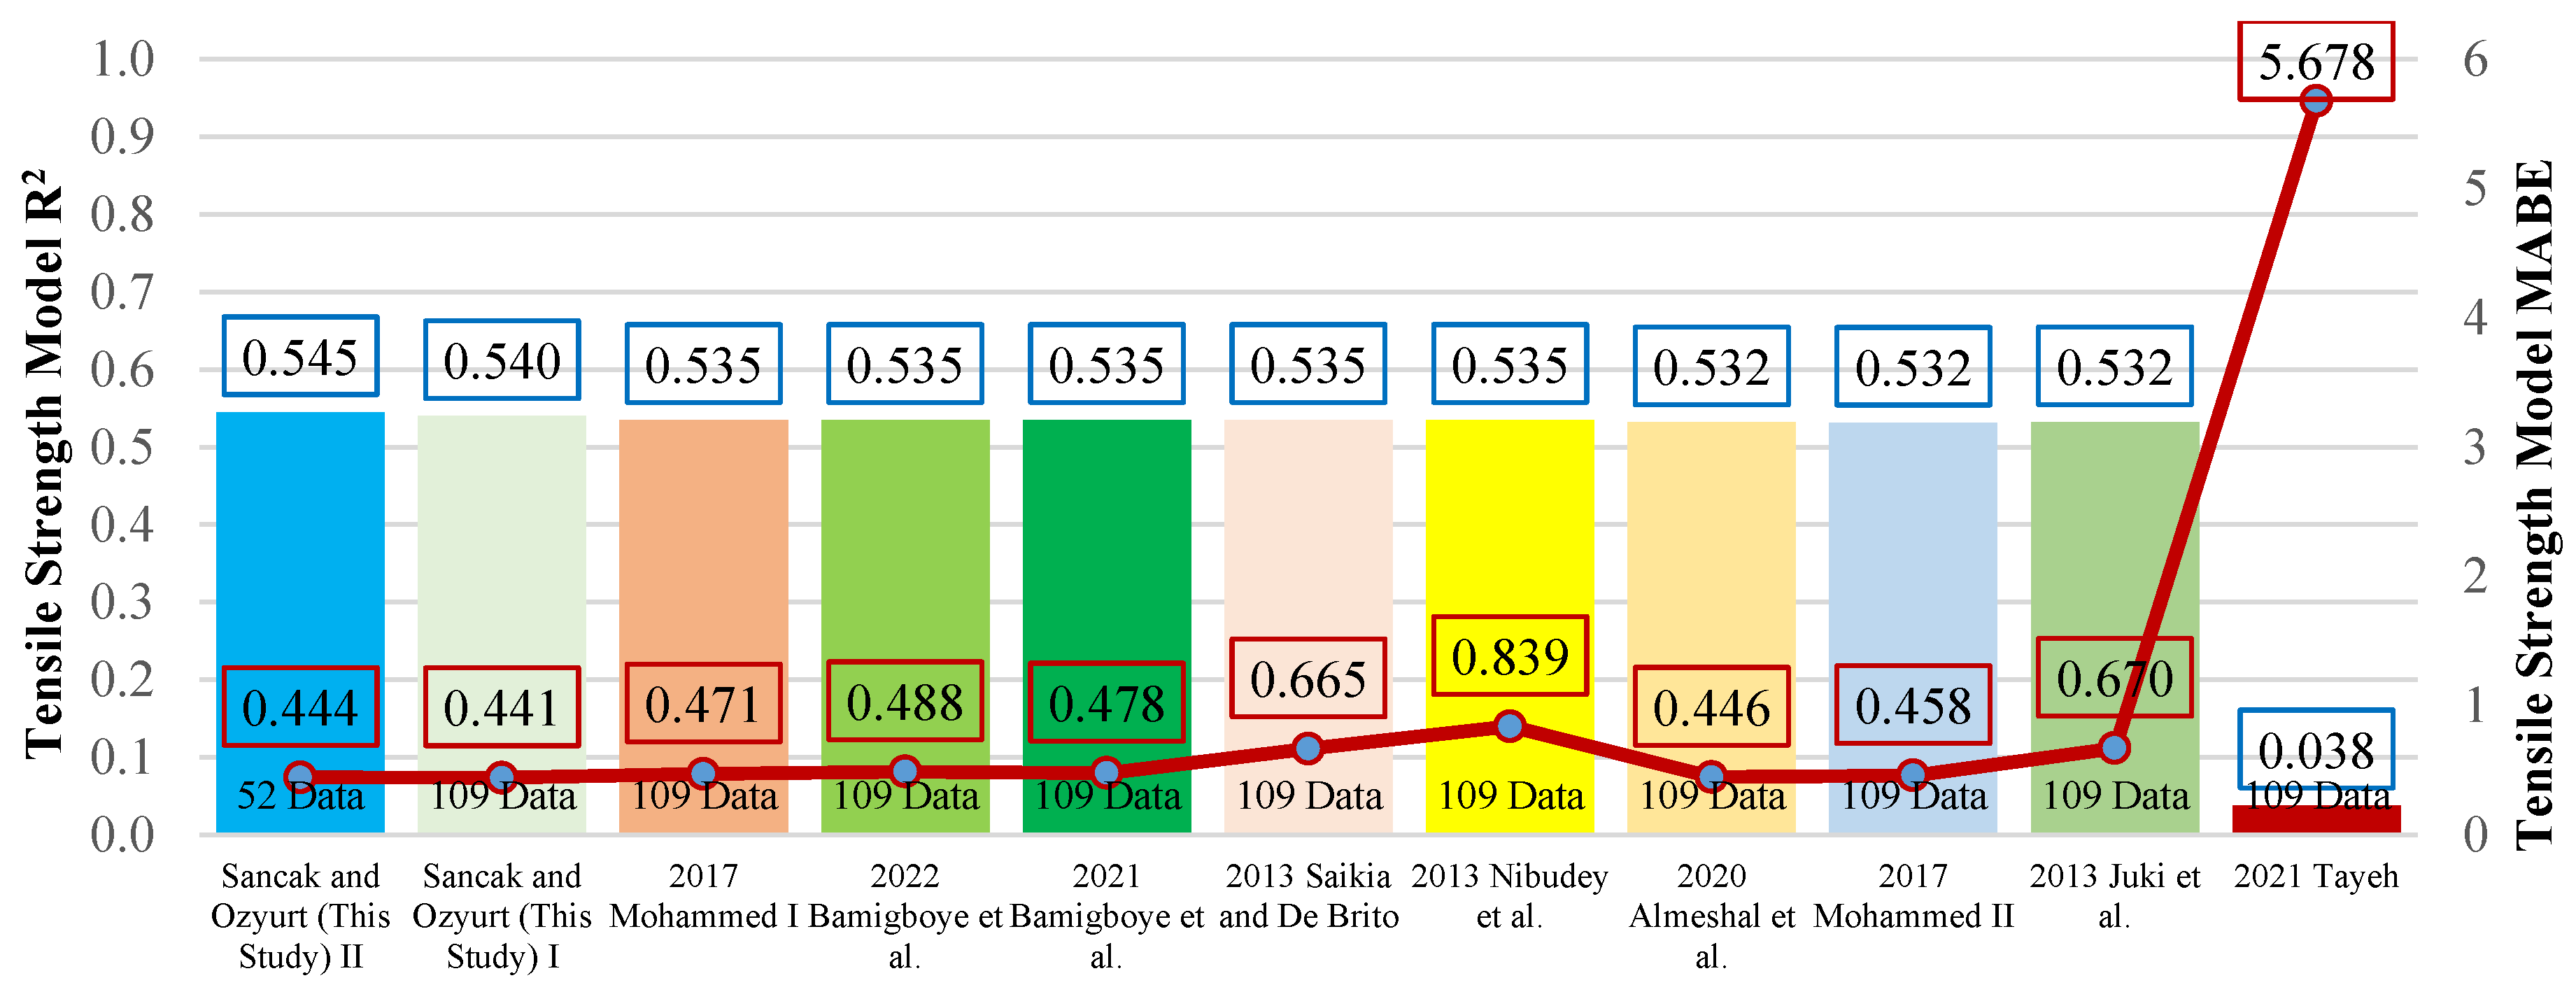
Figure 17.
Flexural strength ratio-PET (%) graph.
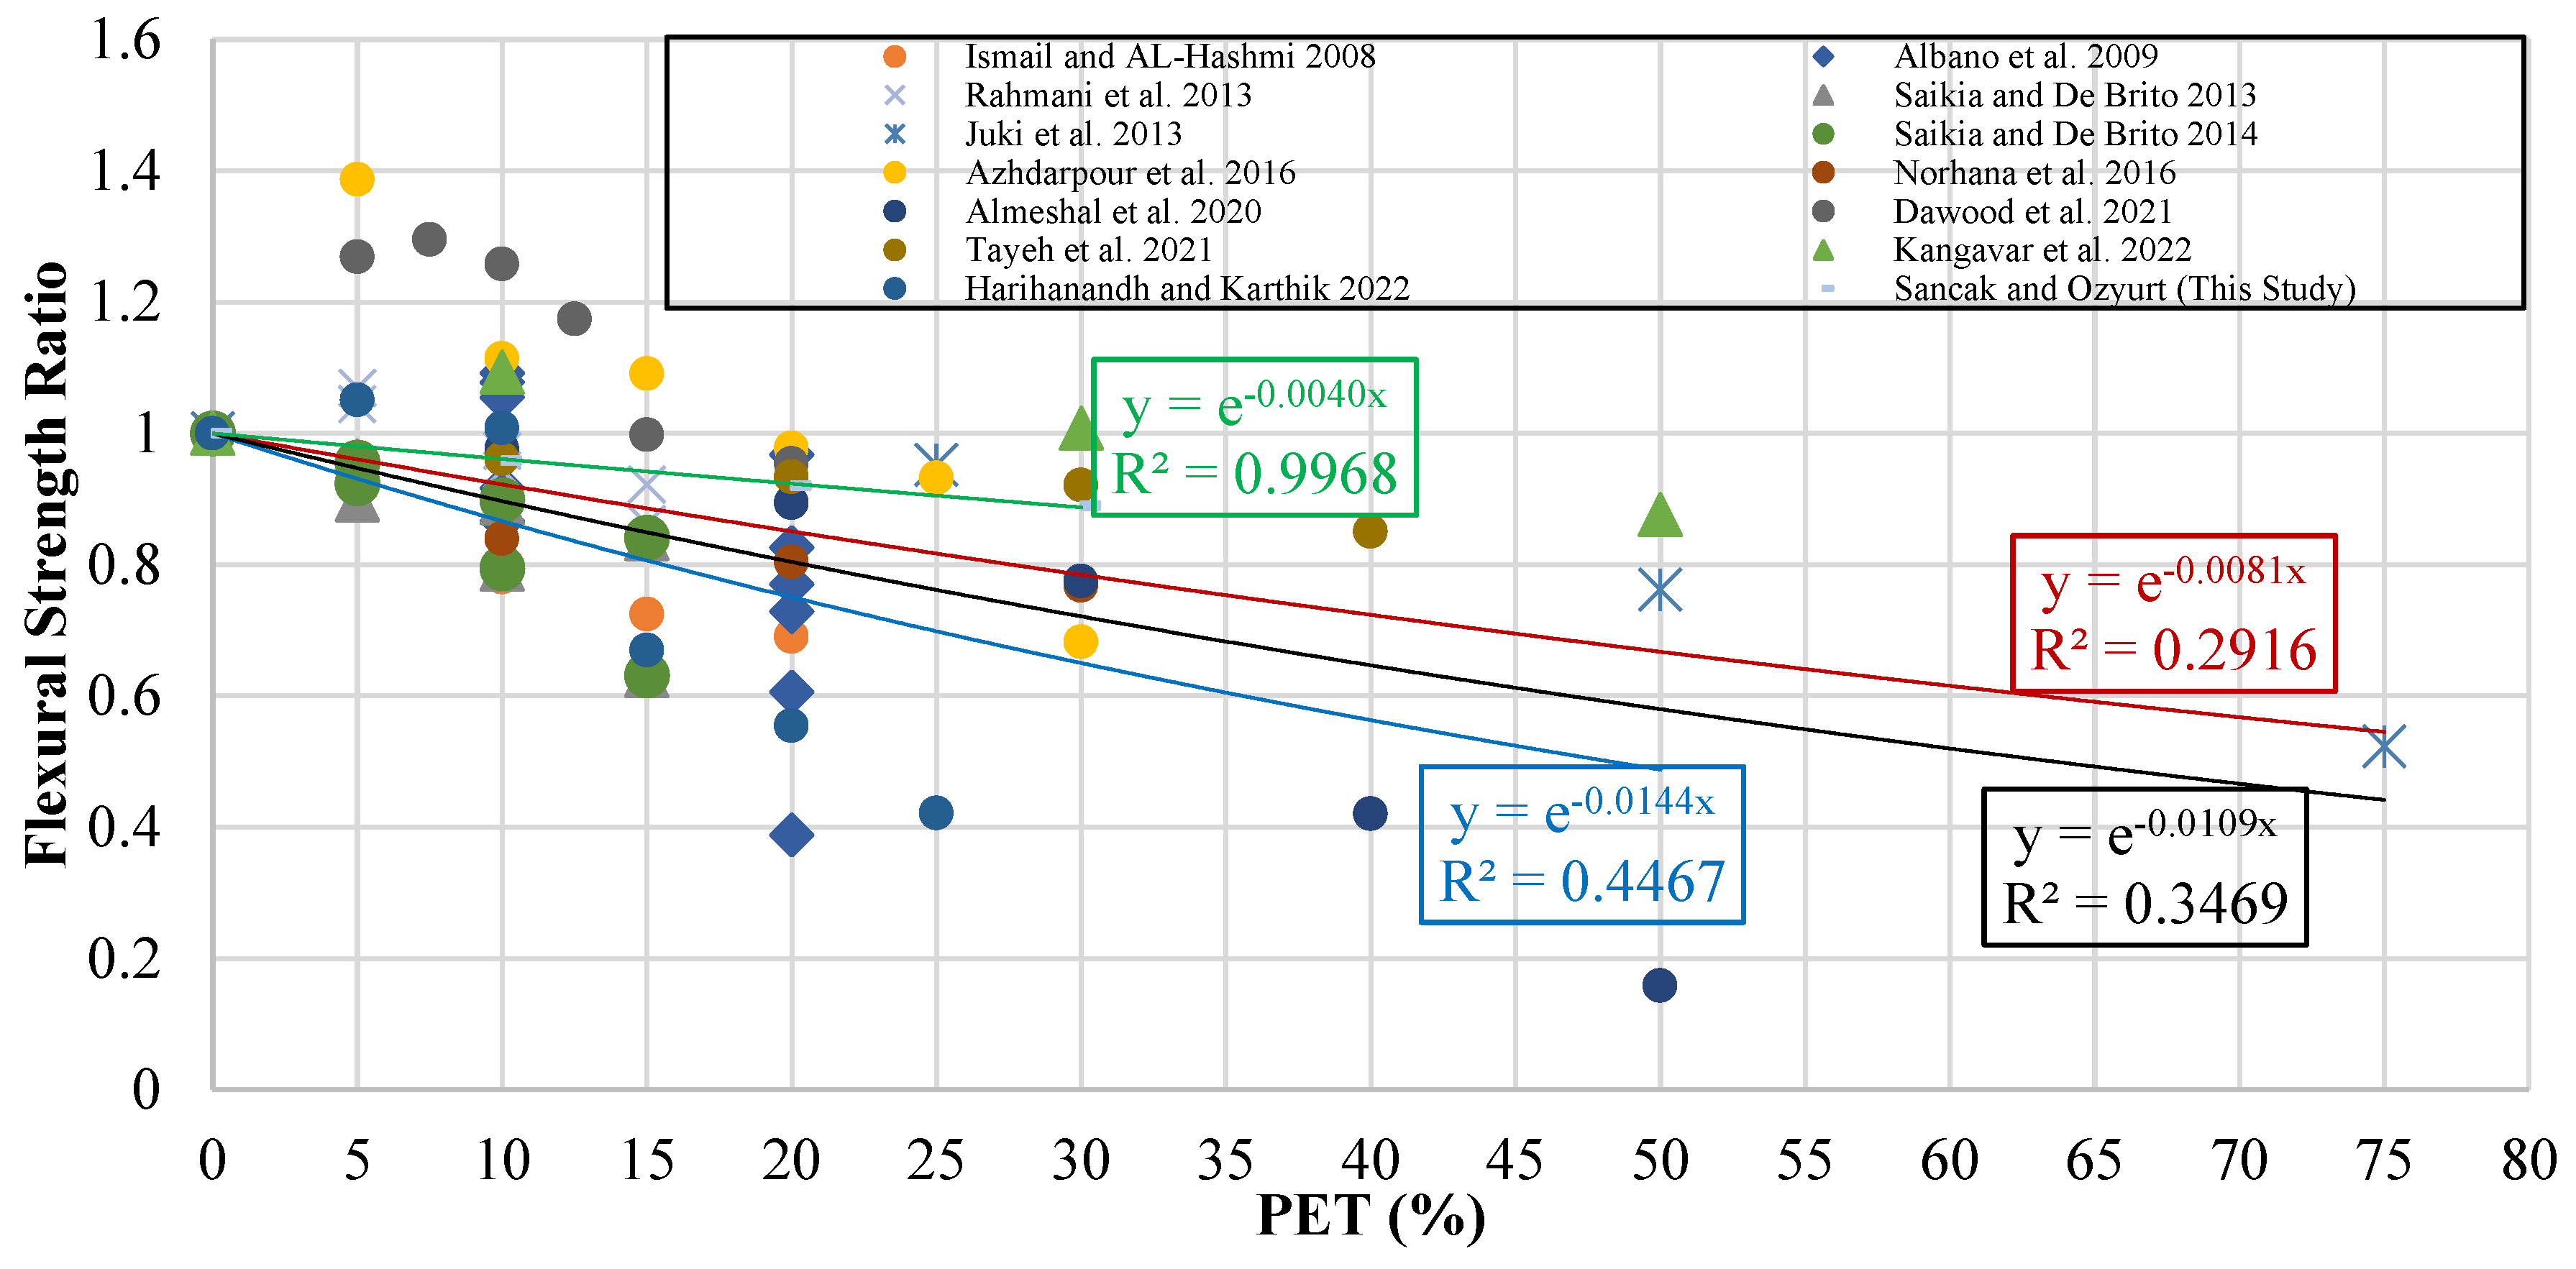
Figure 18.
Flexural strength-compressive strength graph.
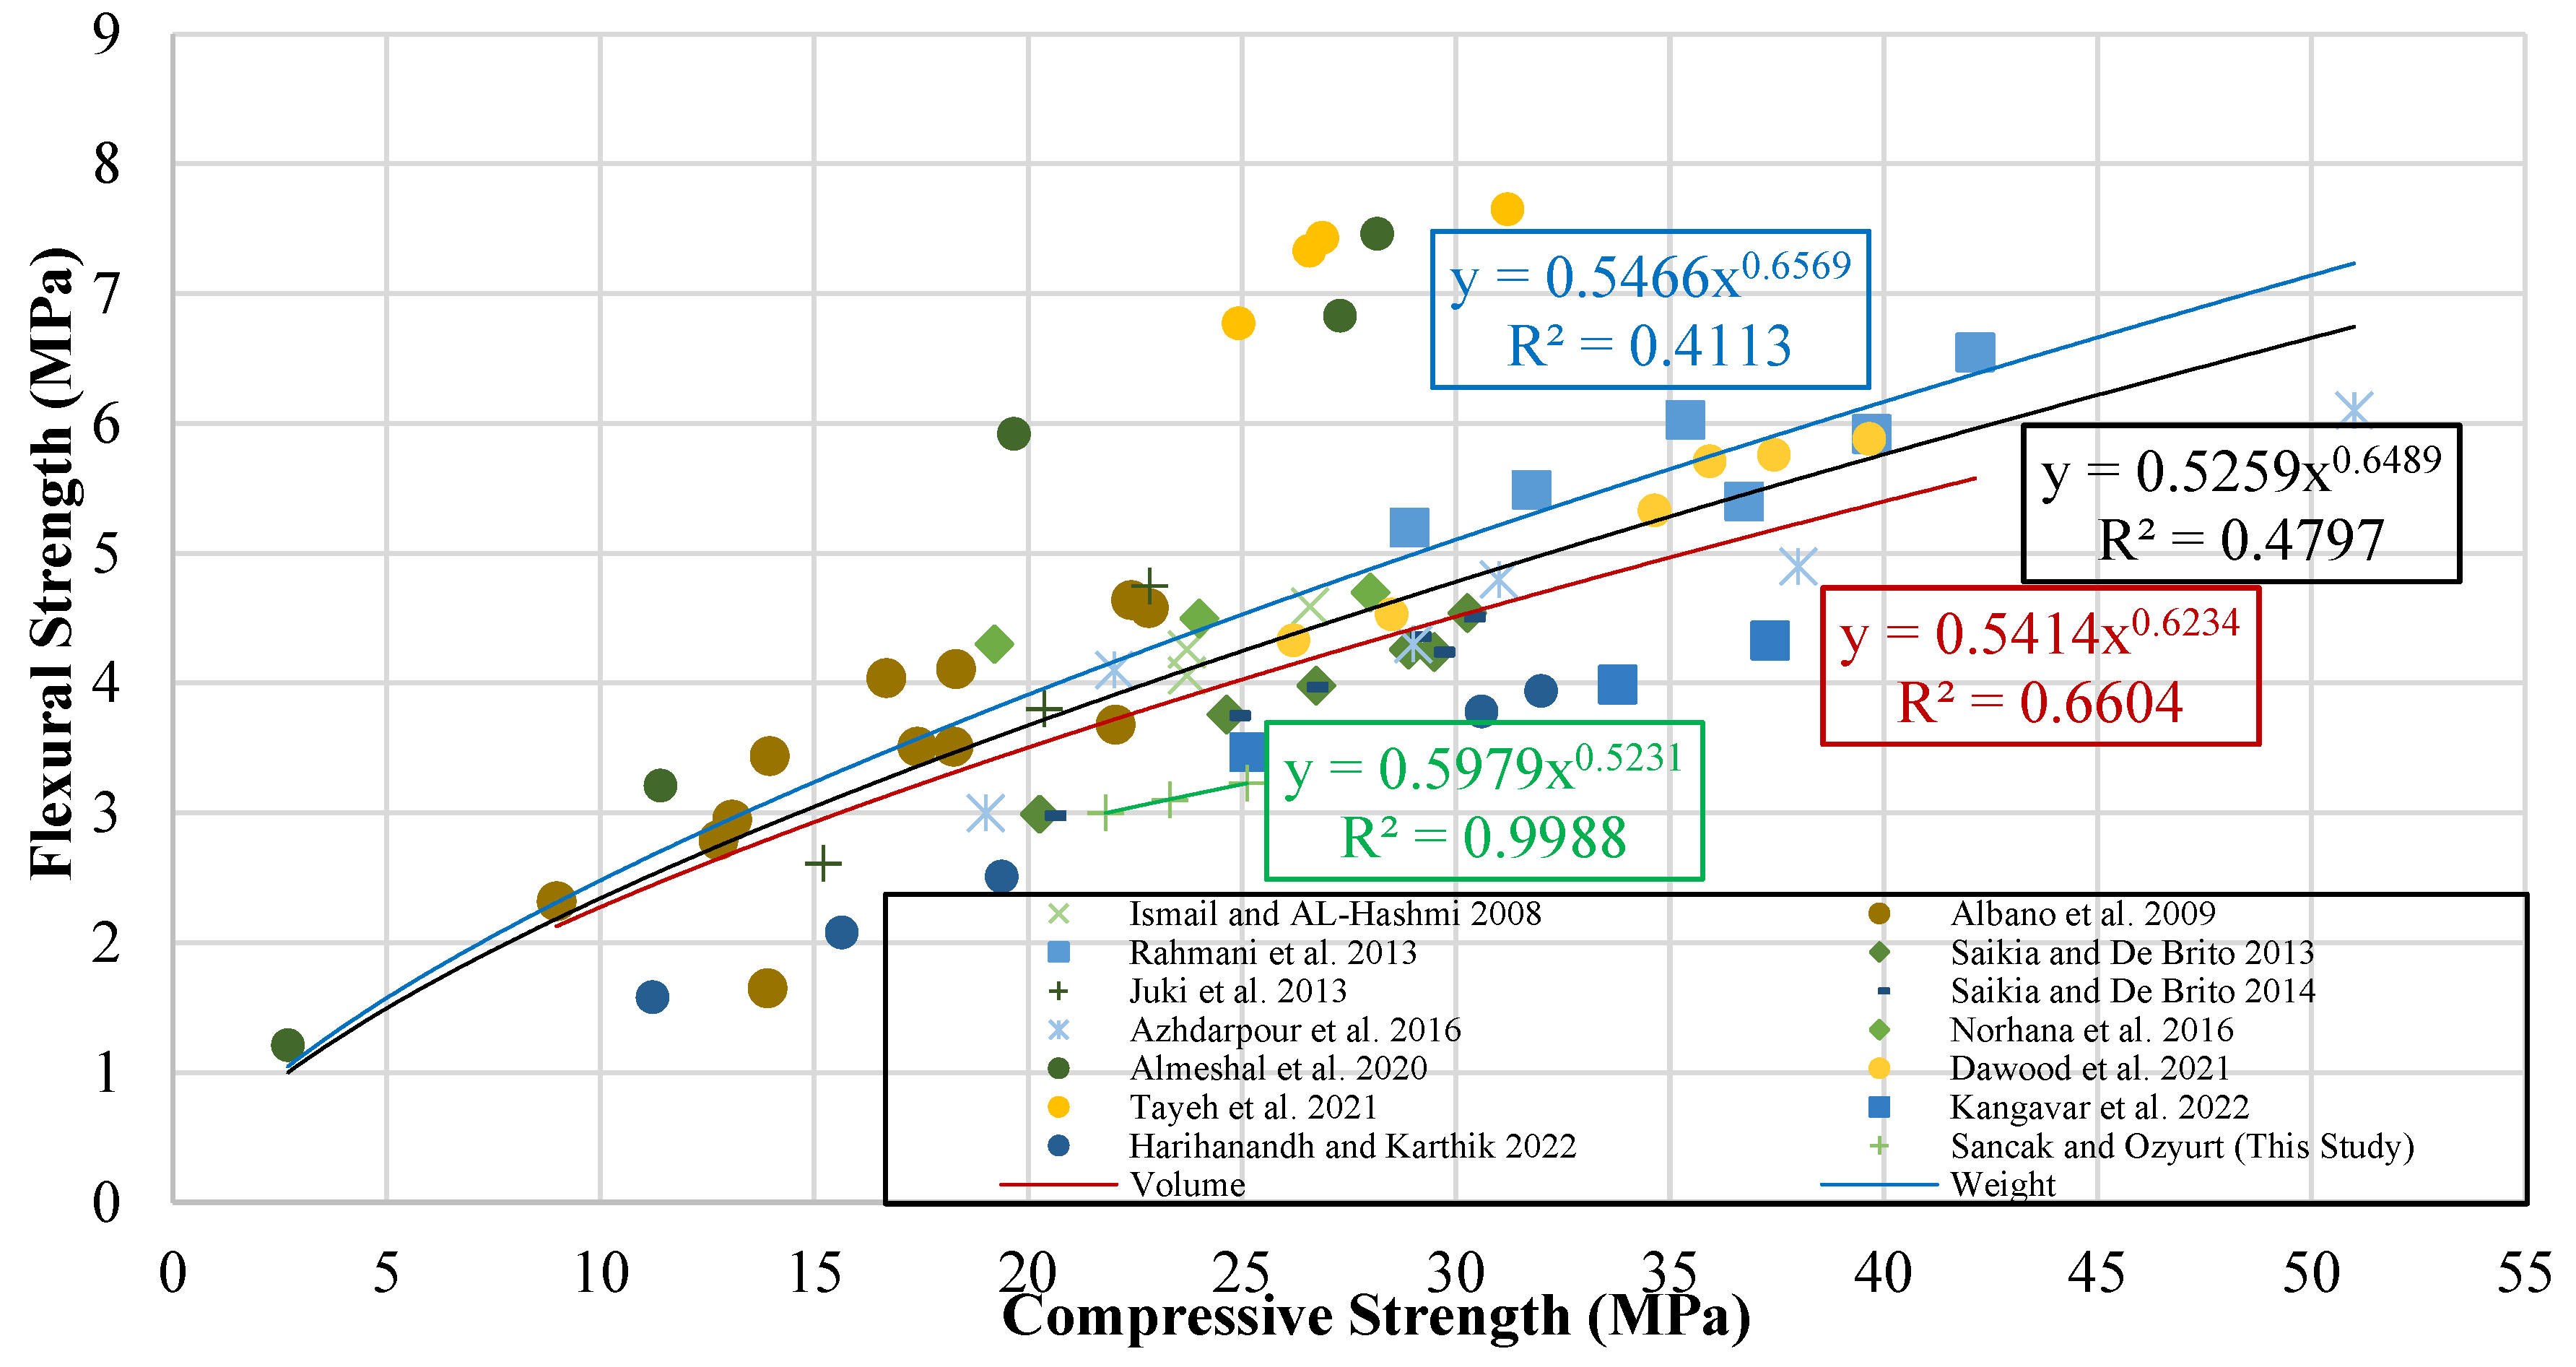
Figure 19.
Comparison of R2 and MABE for models of the connection between flexural strength and compressive strength.
Figure 19.
Comparison of R2 and MABE for models of the connection between flexural strength and compressive strength.
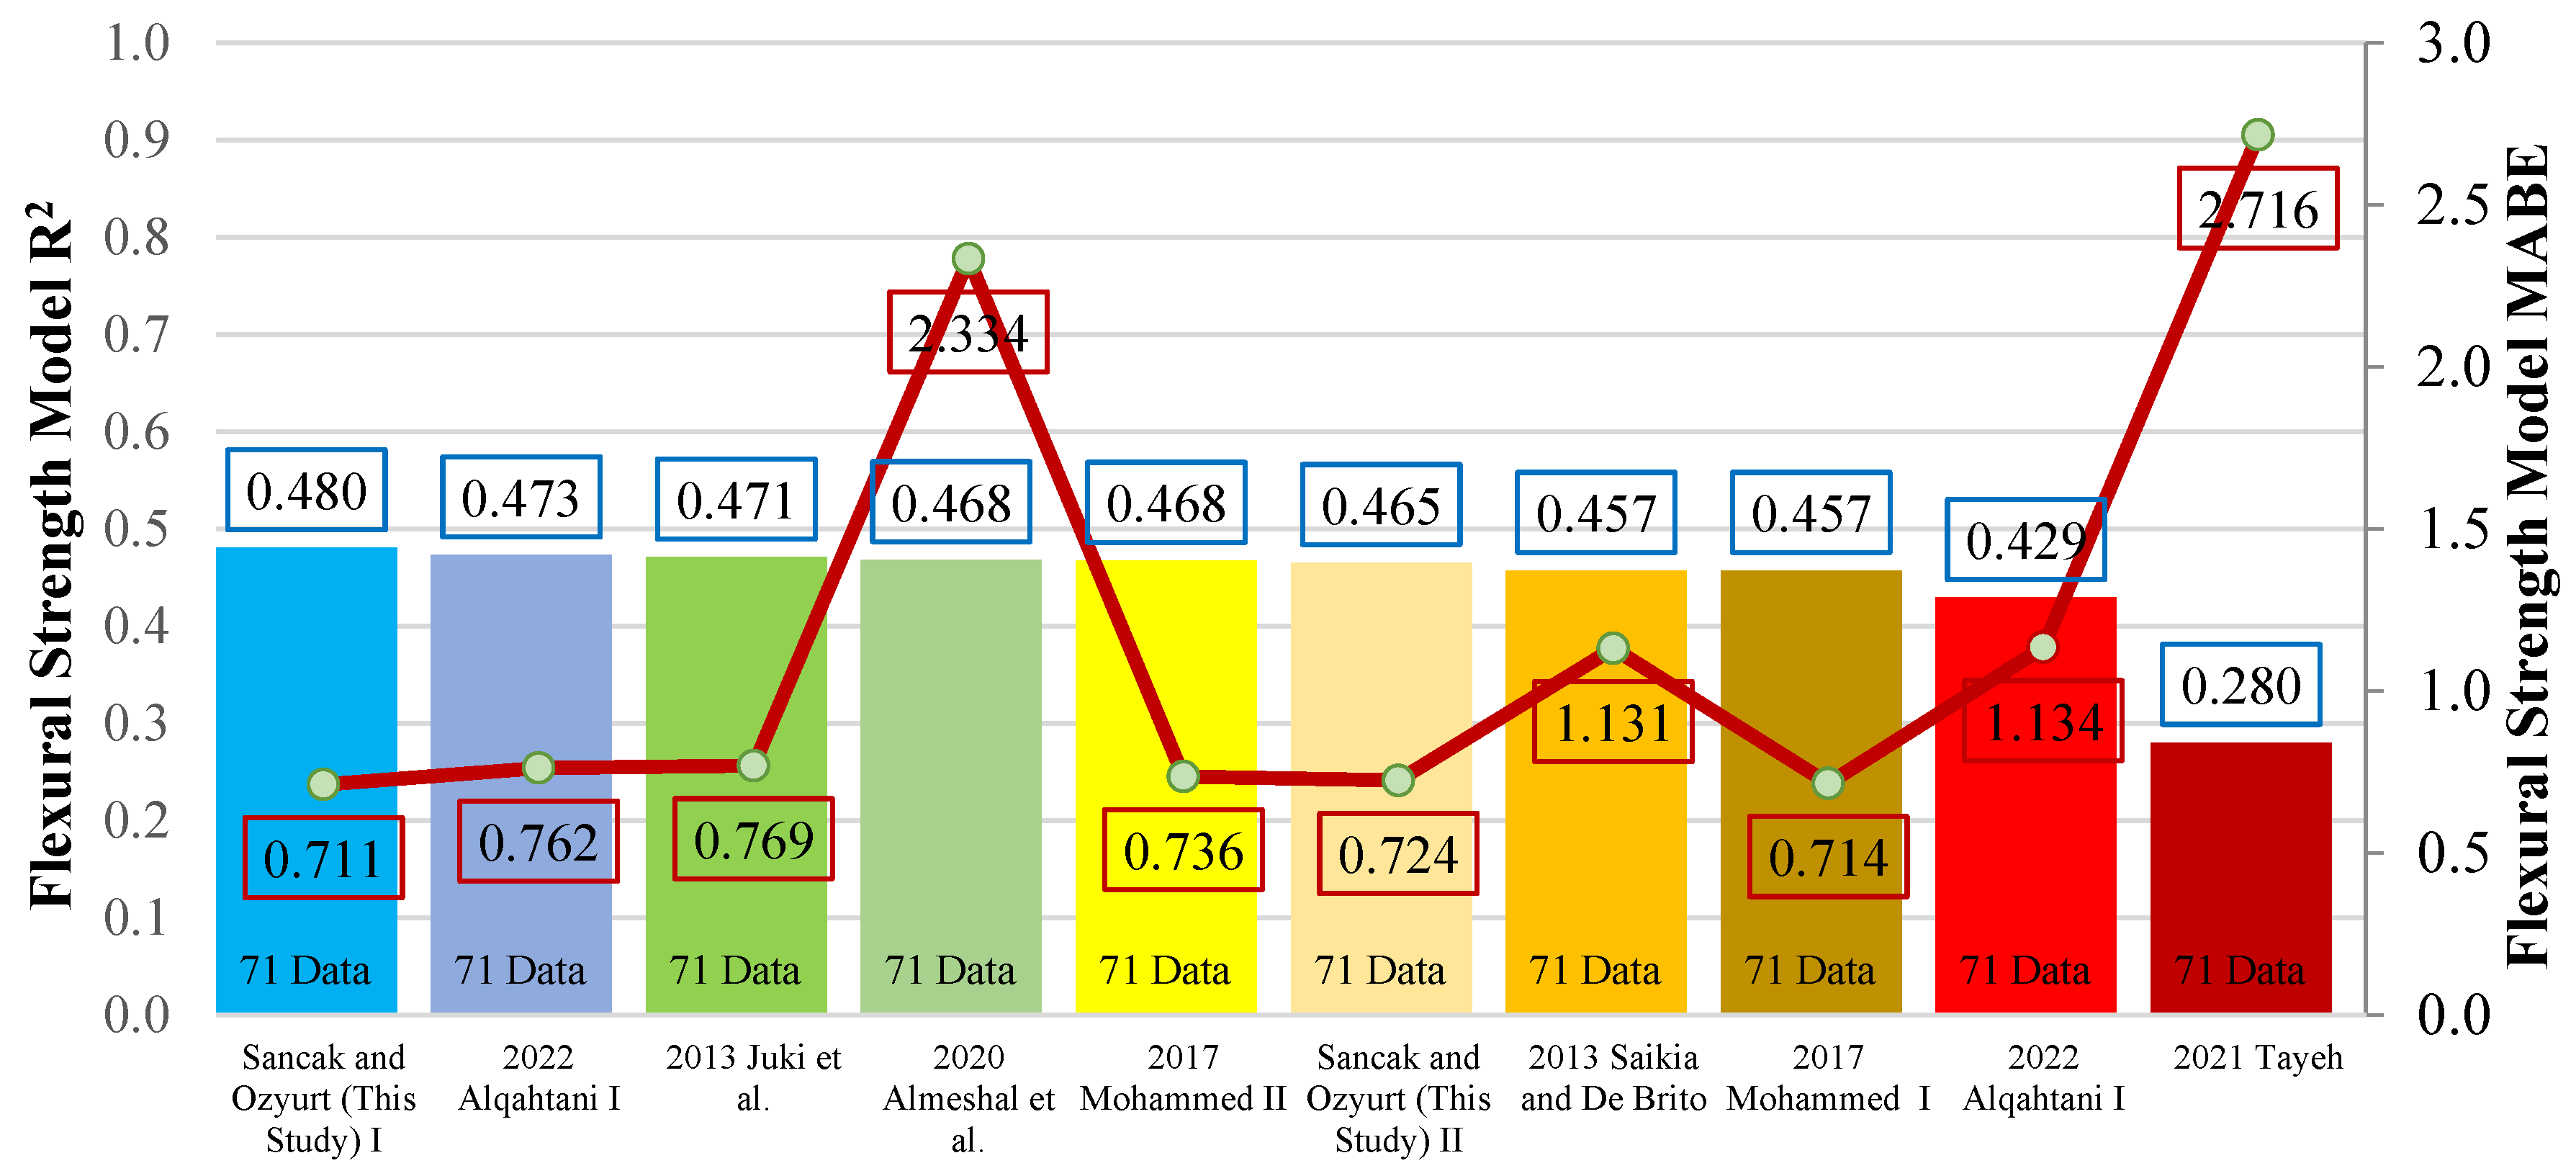
Figure 20.
Modulus of elasticity ratio-PET (%) graph.
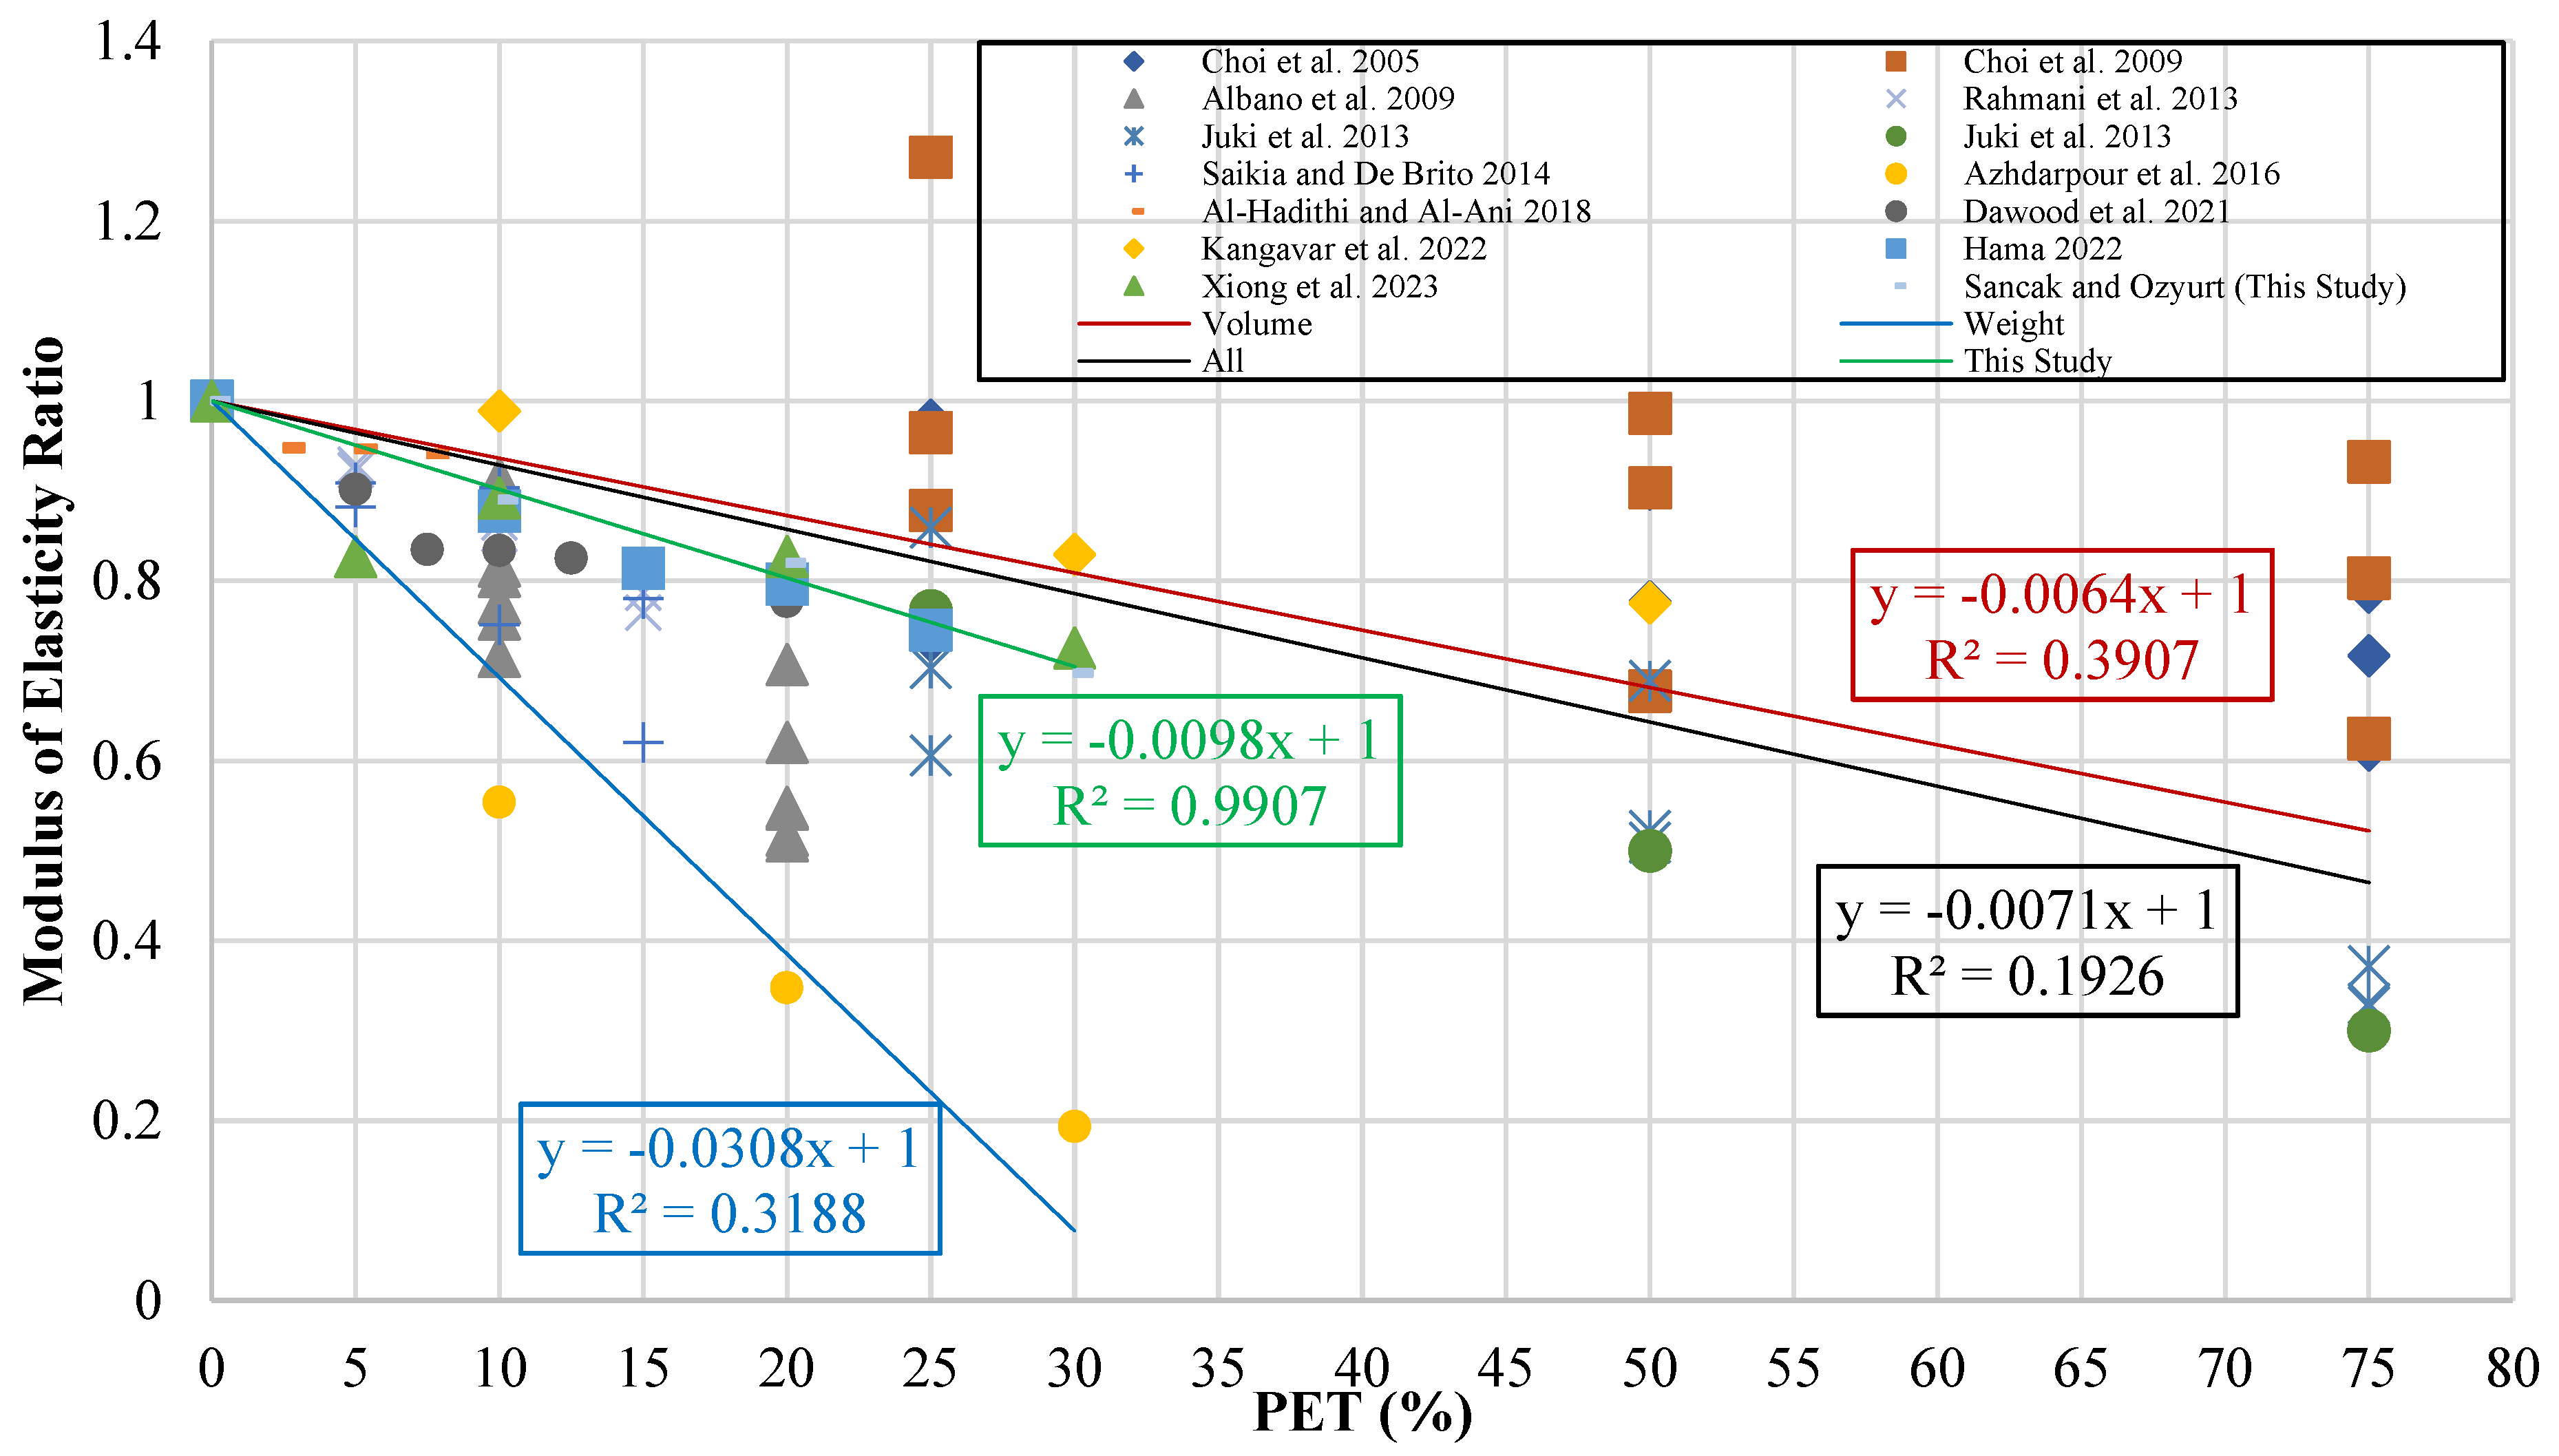
Figure 21.
Modulus of elasticity-compressive strength graph.
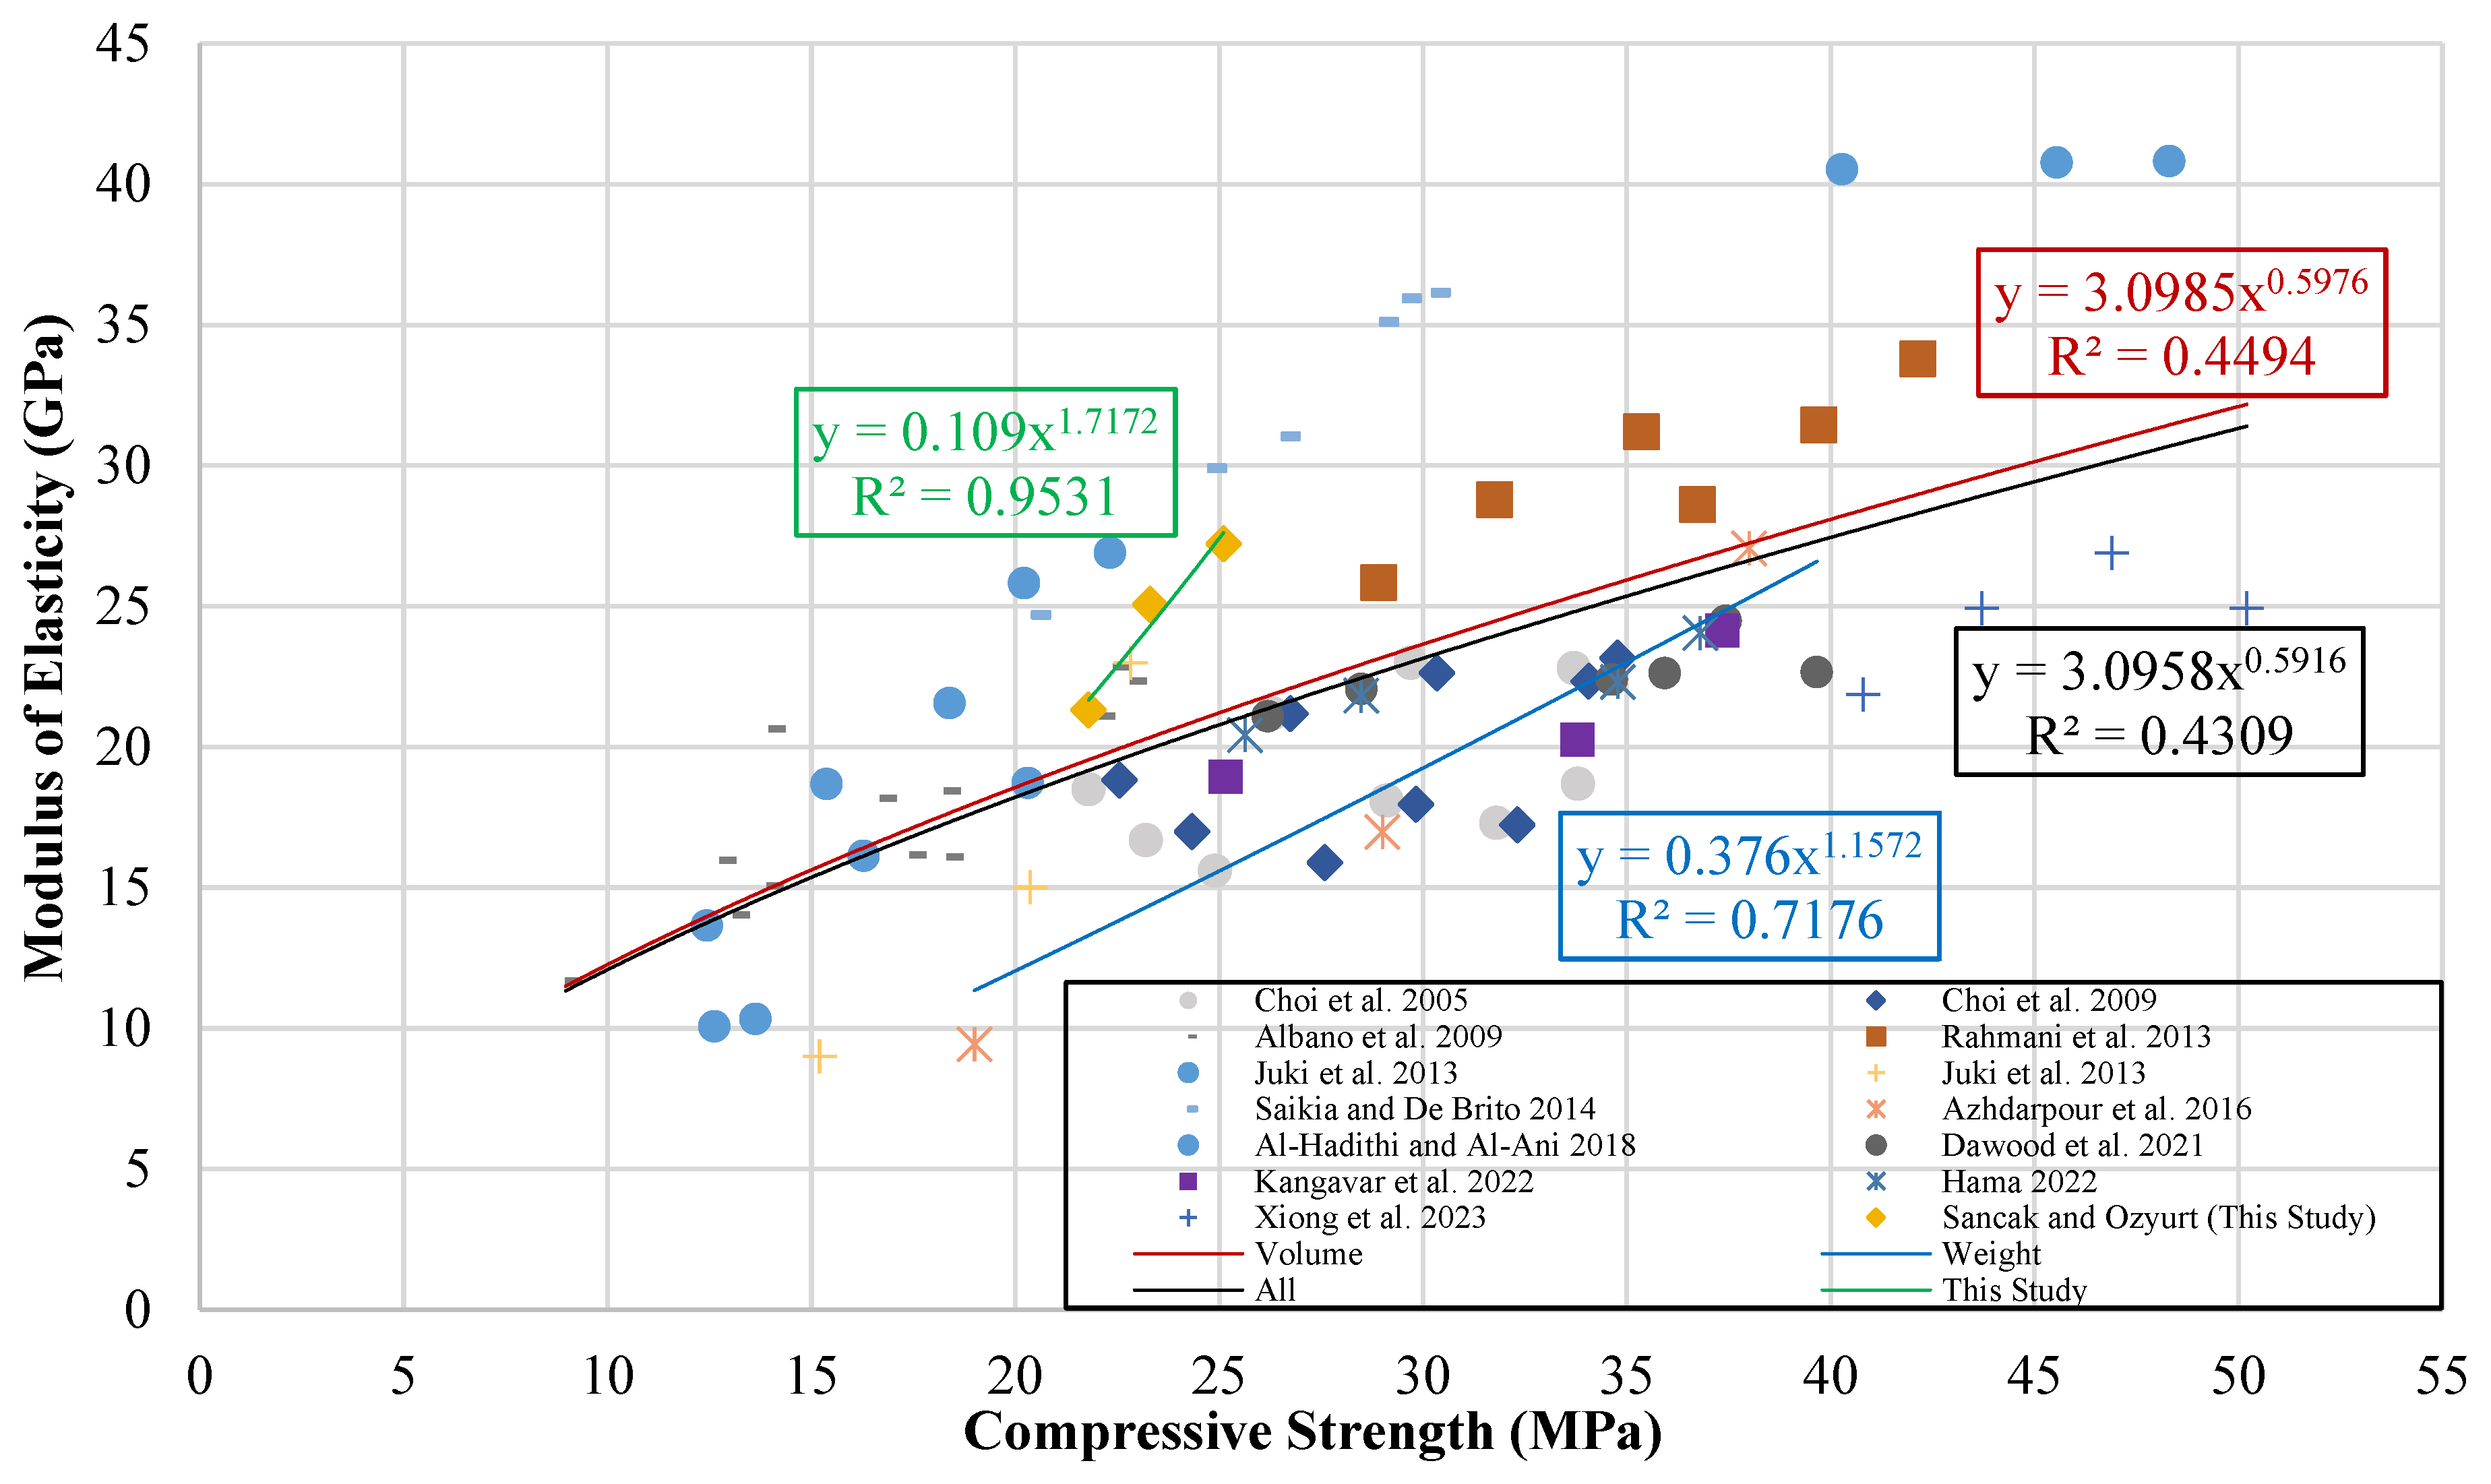
Figure 22.
Comparison of R2 and MABE for models of the connection between modules of elasticity and compressive strength.
Figure 22.
Comparison of R2 and MABE for models of the connection between modules of elasticity and compressive strength.
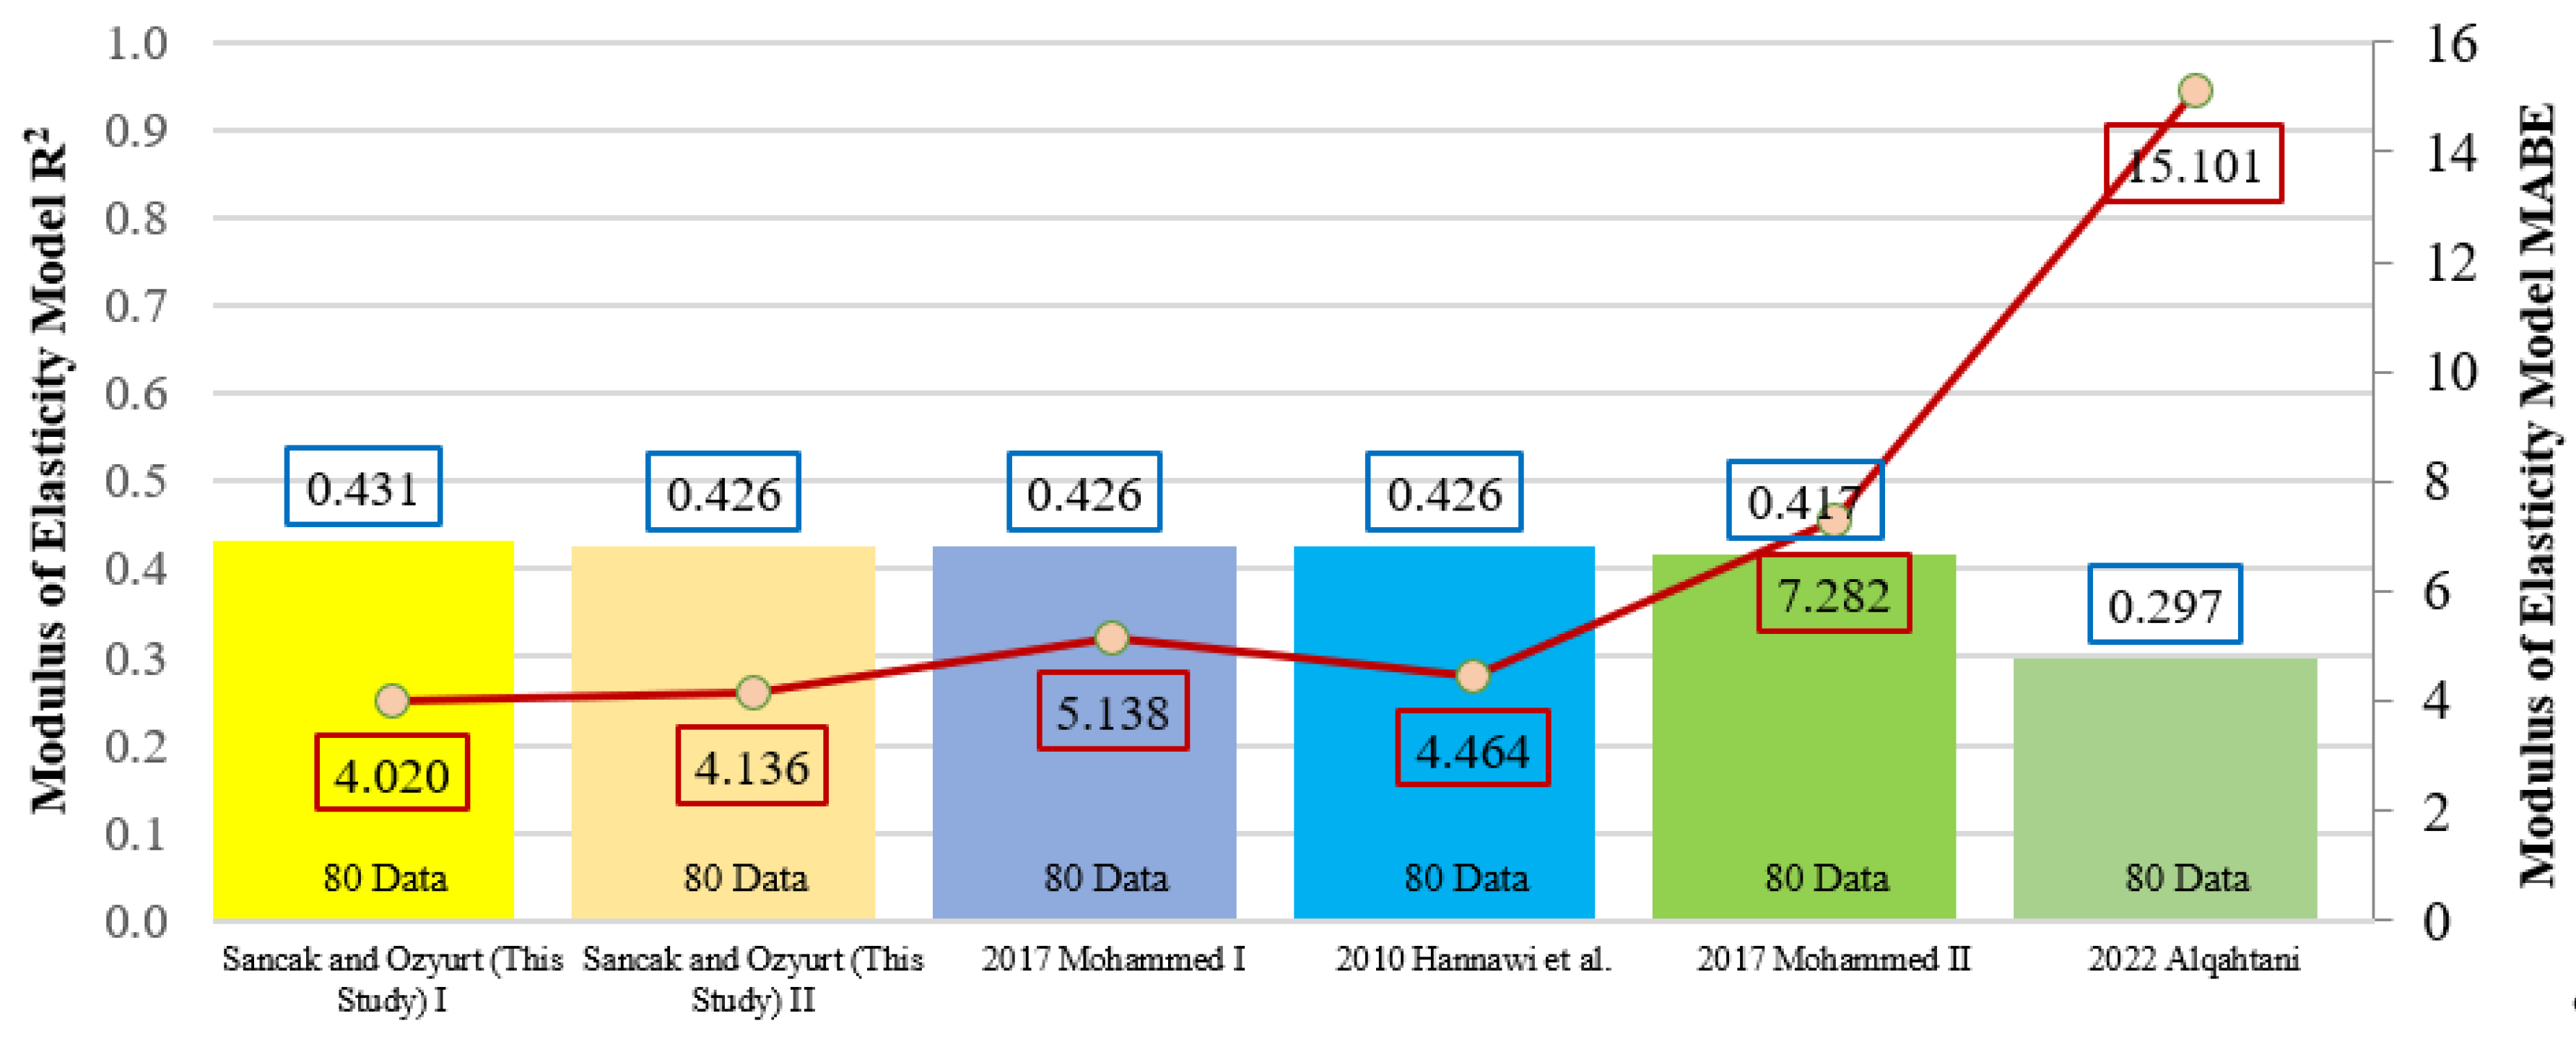
Figure 23.
Experimental data and model predictions for compressive strength under FRP wrapping effect.
Figure 23.
Experimental data and model predictions for compressive strength under FRP wrapping effect.
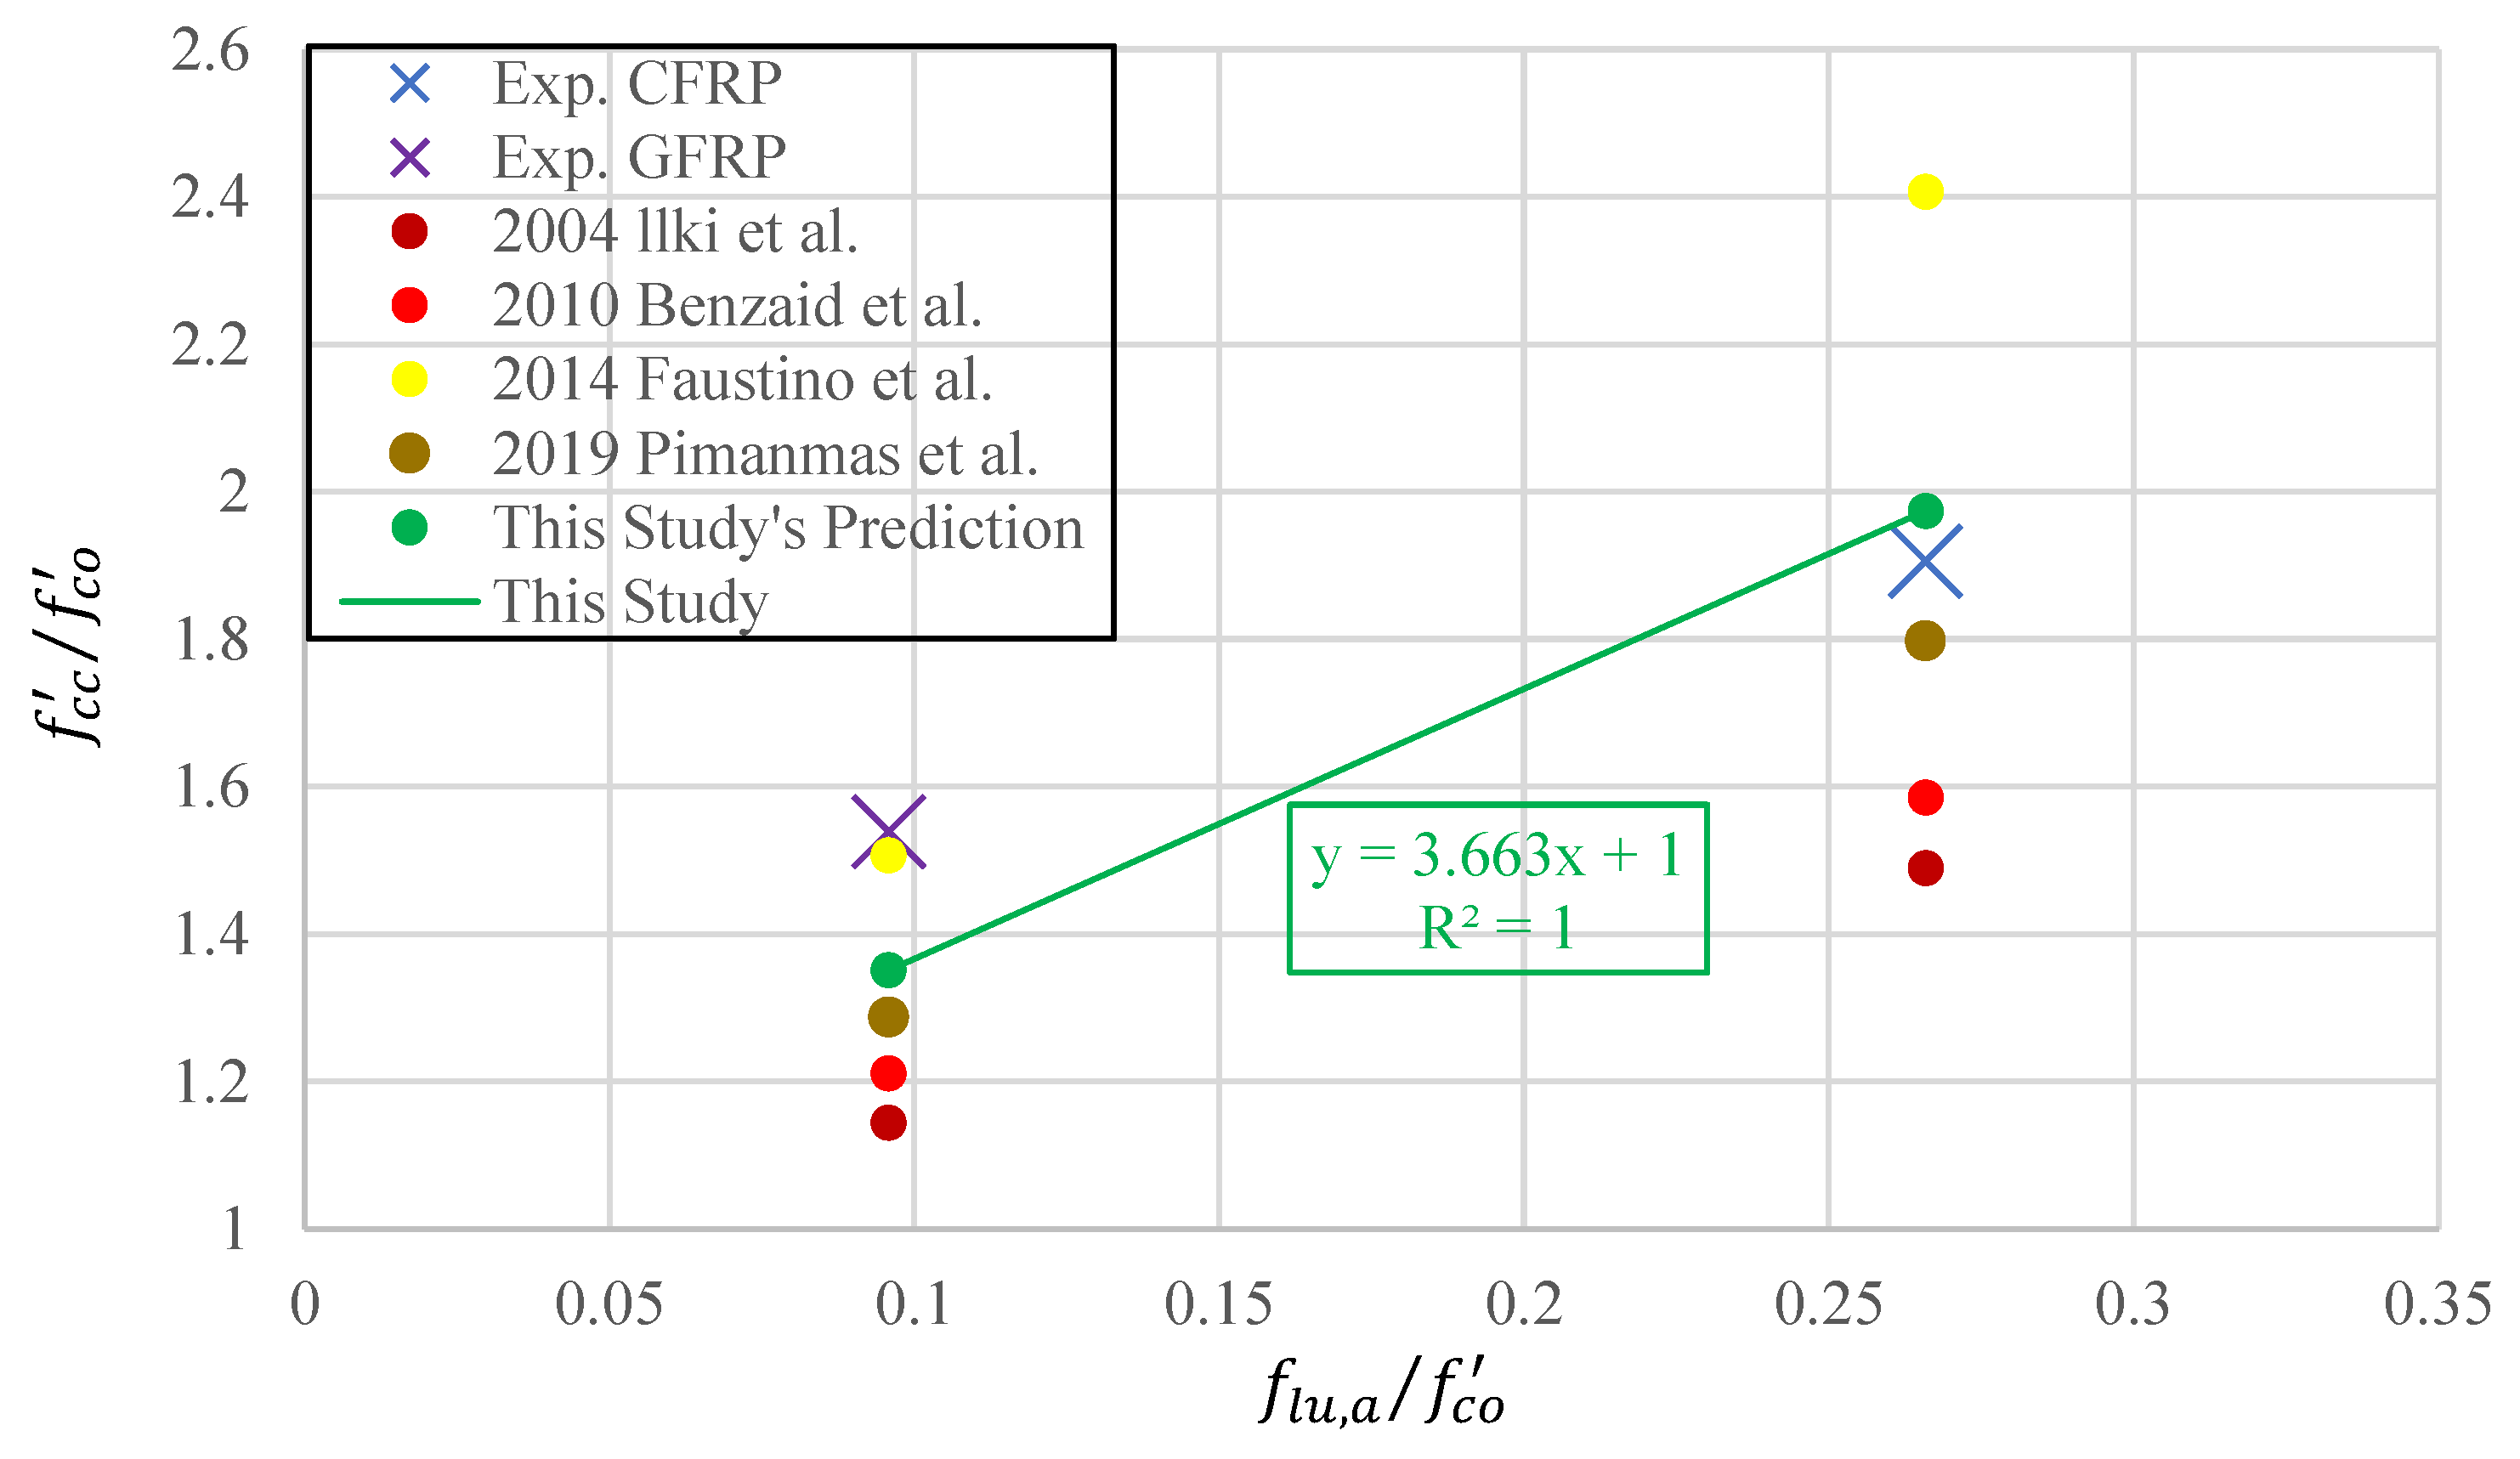
Figure 24.
Comparison of MABE and MAPE for compressive strength models under FRP wrapping effect.
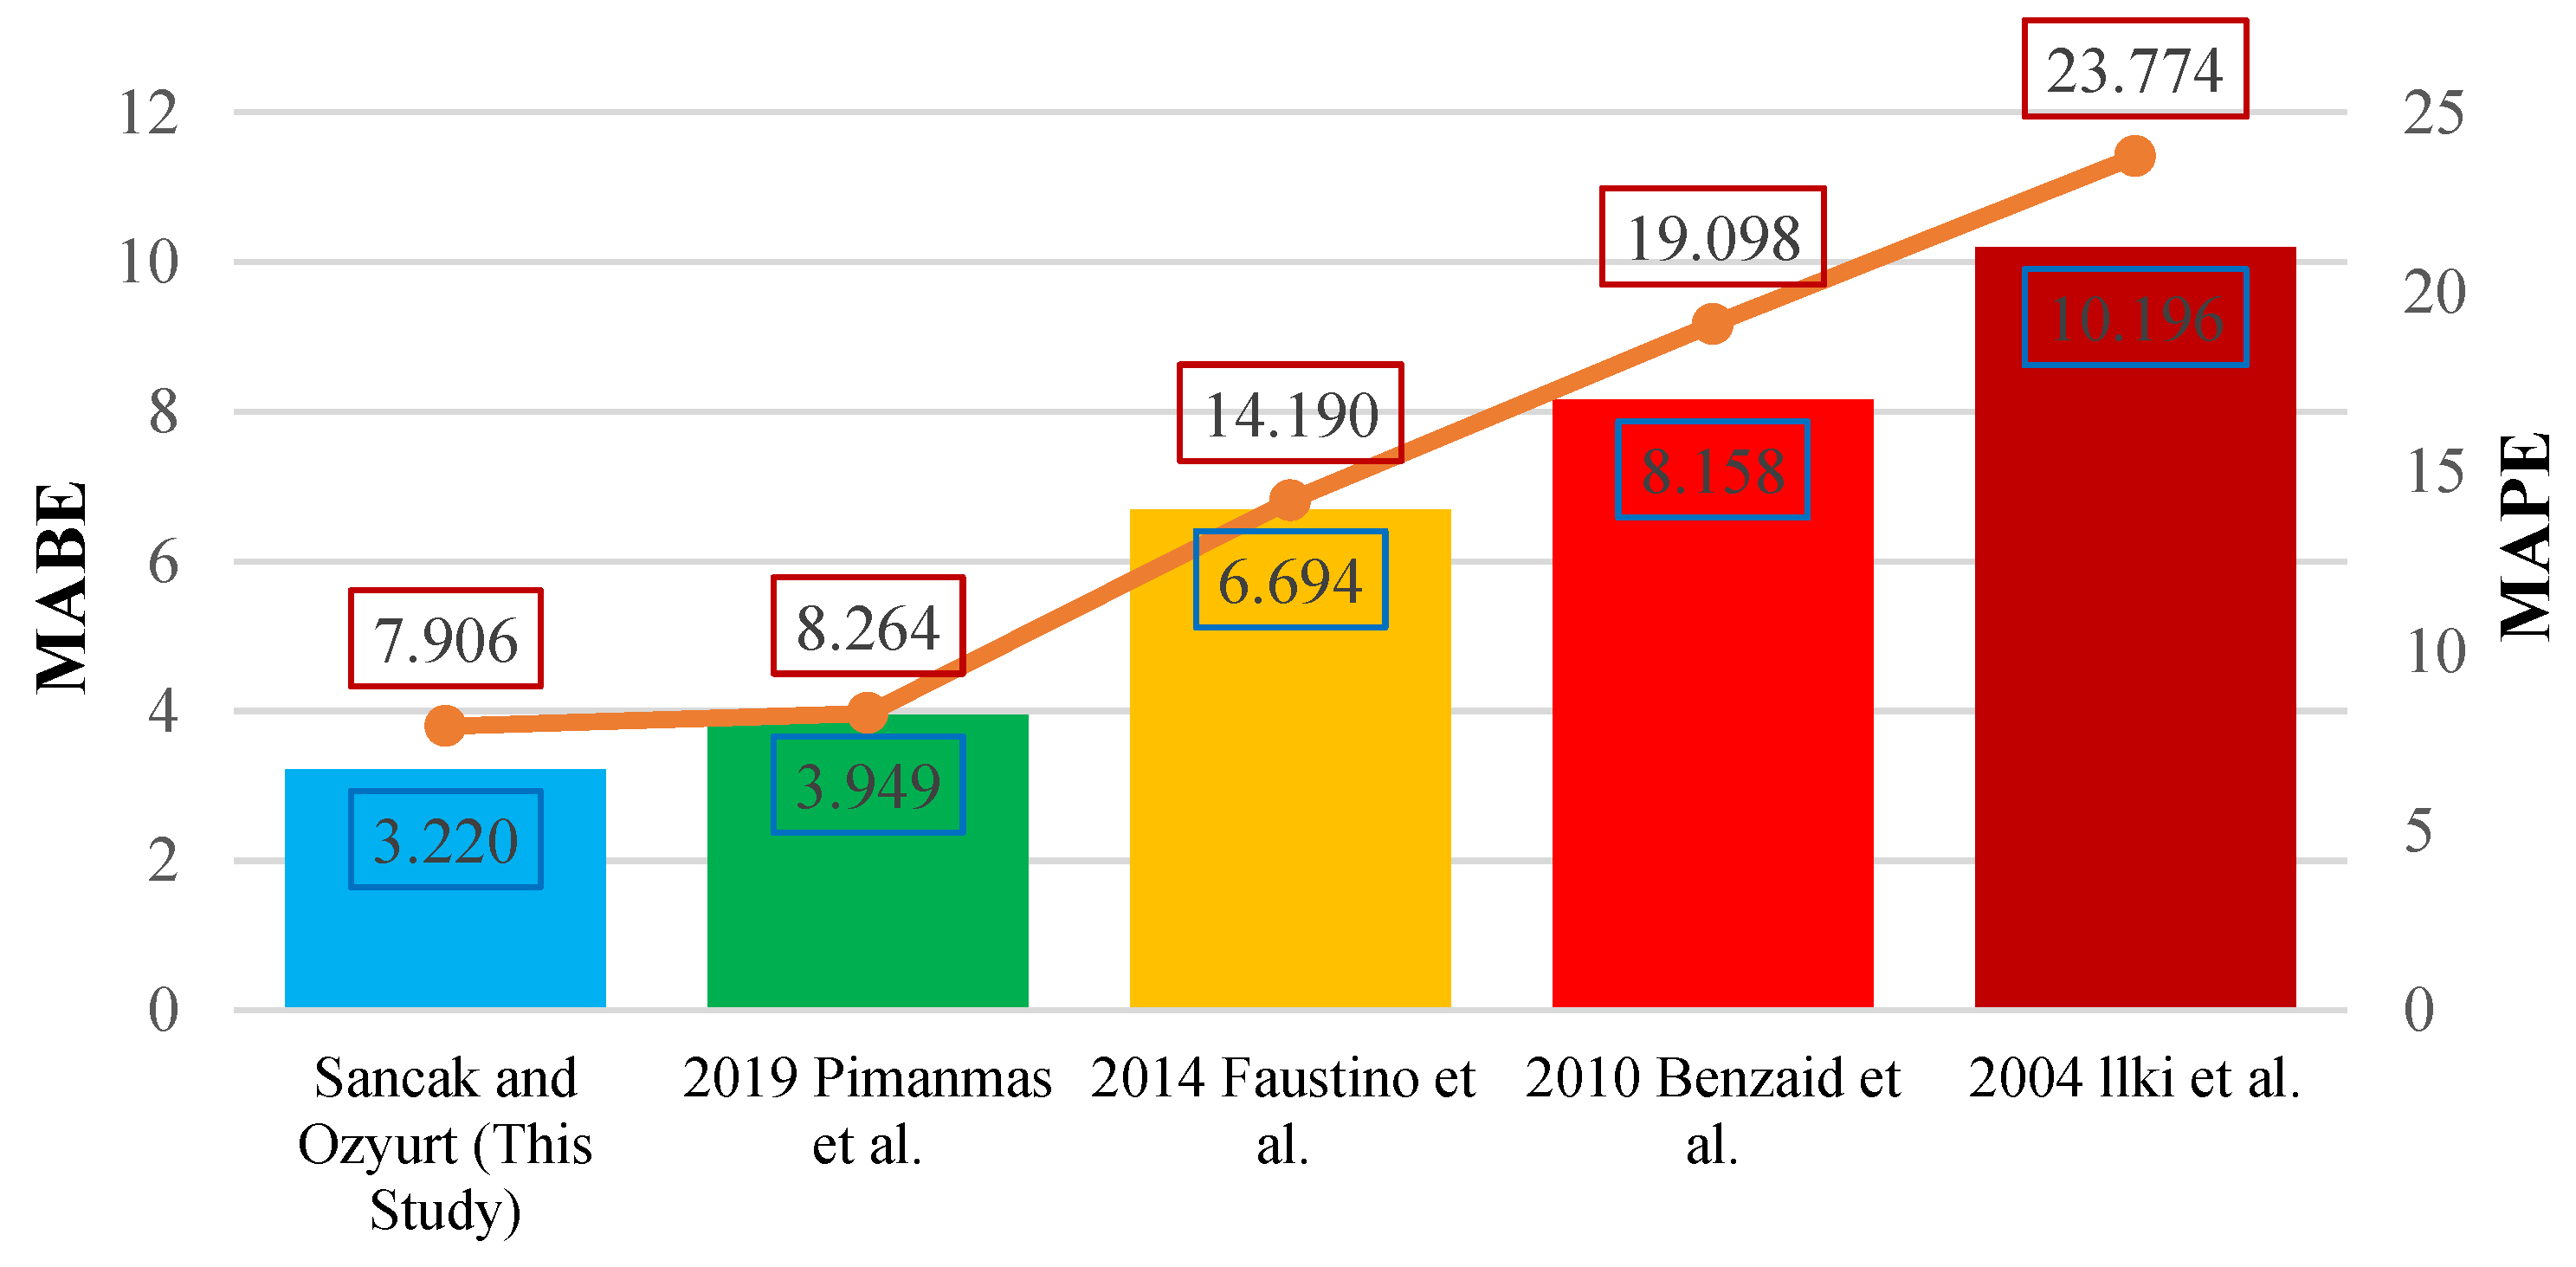
Figure 25.
Experimental data and model predictions for ultimate axial strain under FRP wrapping effect.
Figure 25.
Experimental data and model predictions for ultimate axial strain under FRP wrapping effect.
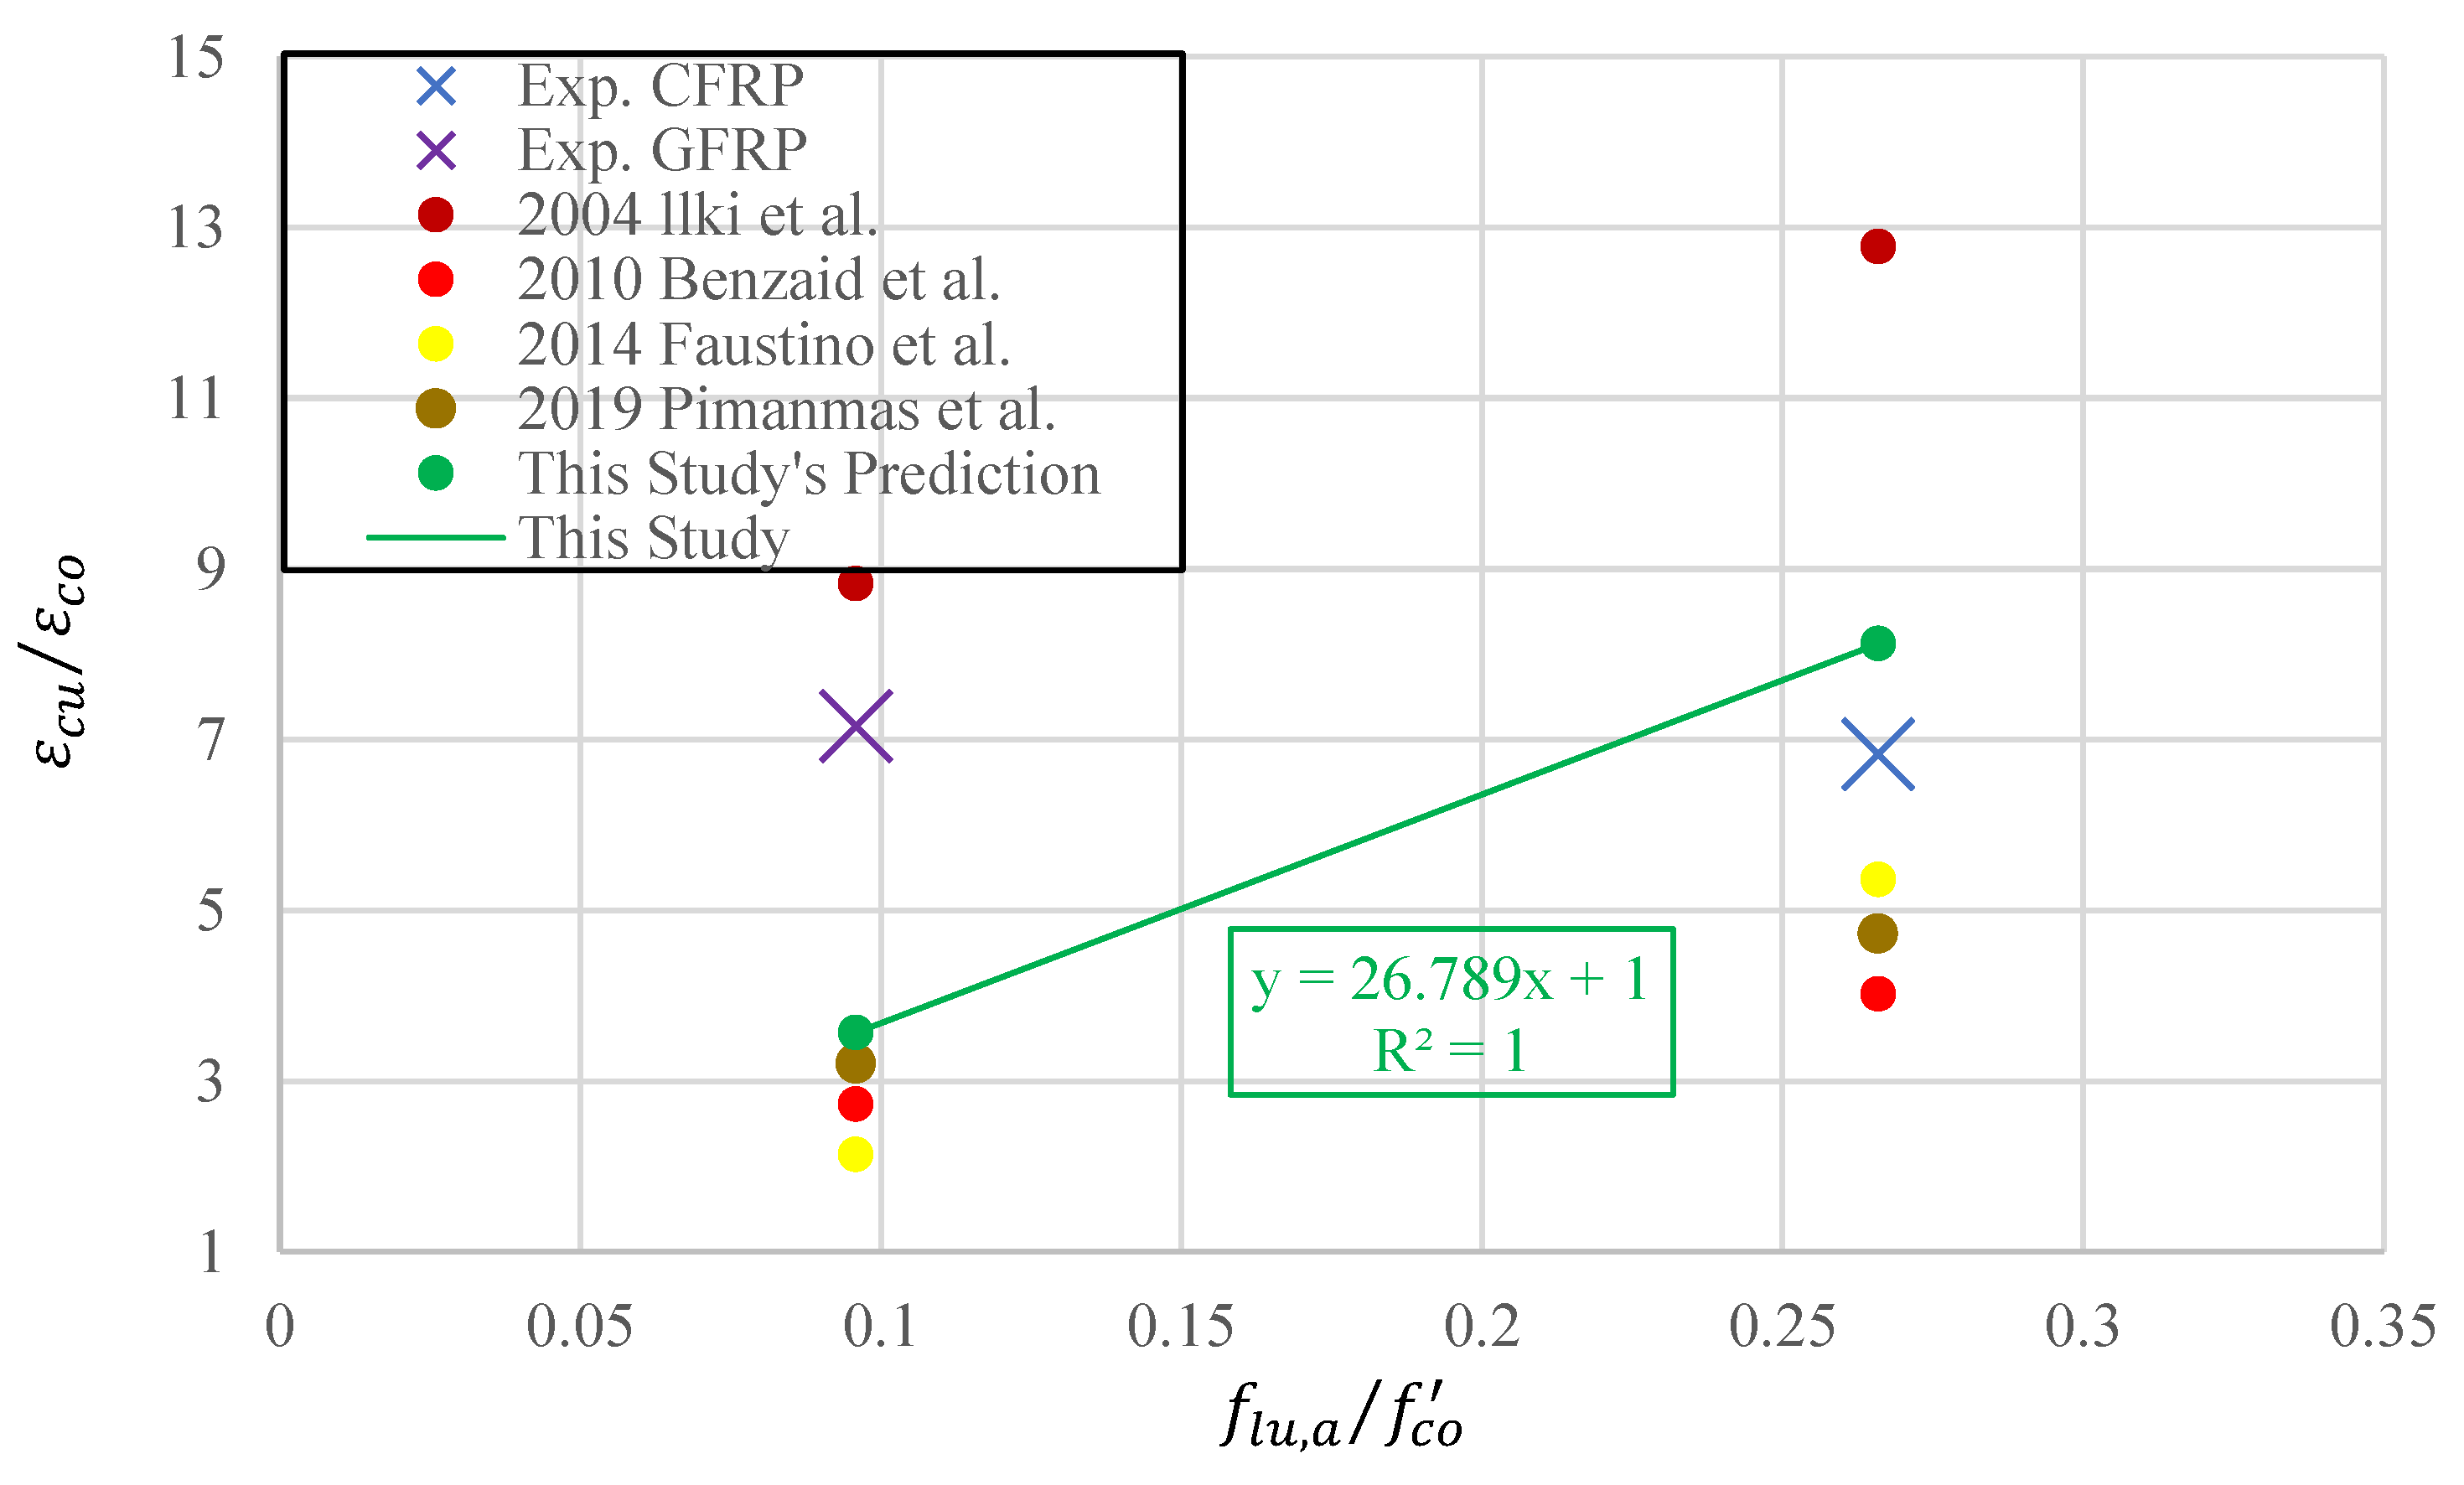
Figure 26.
Comparison of MABE and MAPE for ultimate axial strain models under FRP wrapping effect.
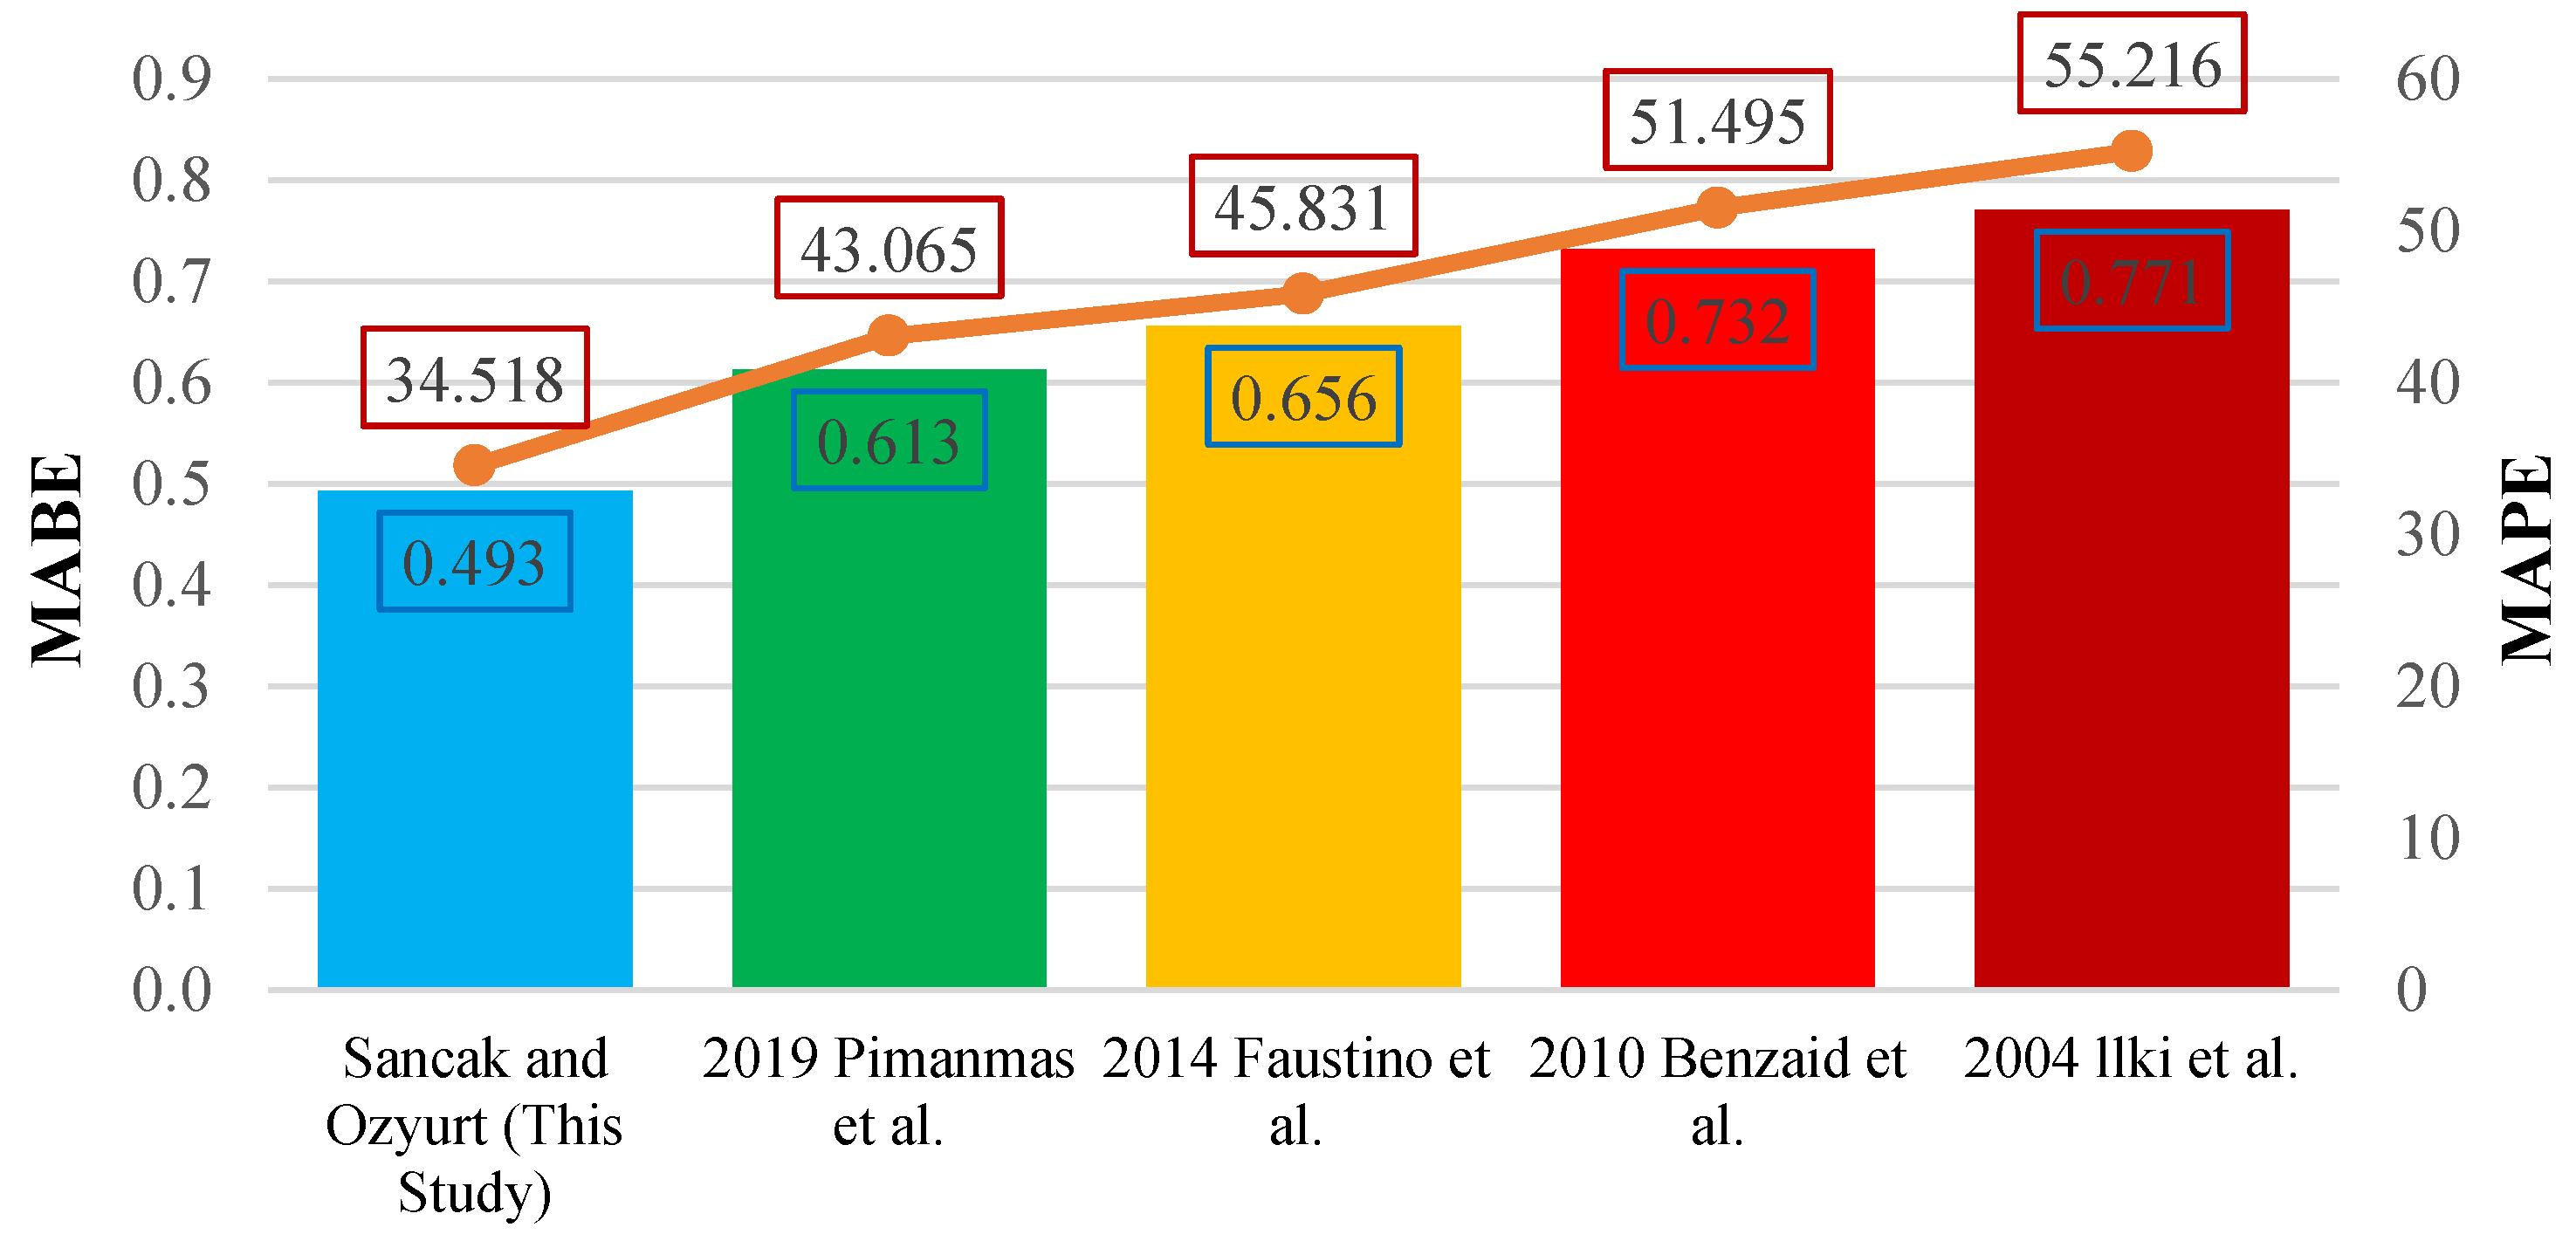

Table 1.
Cement Properties.
| Chemical Properties | Analysis Result | EN 197-1 Standard Limit Values | |
|---|---|---|---|
| Lower Limit | Upper Limit | ||
| SO3 (%) | 2.97 | - | 4.0 |
| Cl (%) | 0.0081 | - | 0.1000 |
| Na2O (%) | 0.67 | - | - |
| K2O (%) | 0.28 | - | - |
| Loss on Ignition (Fire Loss) (%) | 3.48 | - | 5.0 |
| Insoluble Residue (%) | 0.77 | - | 5.0 |
| Physical Properties | Analysis Result | EN 197-1 Standard Limit Values | |
| Lower Limit | Upper Limit | ||
| Specific Gravity | 3.13 | - | - |
| Specific Surface (Blaine) (cm2/g) | 3600 | - | - |
| Soundness (Le Chatelier) (mm) | 2.0 | - | 10 |
| Initial Setting Time (min) | 160 | 60 | - |
| 2 Days Compressive Strength (MPa) | 31.0 | 20 | - |
| 7 Days Compressive Strength (MPa) | 44.5 | - | - |
| 28 Days Compressive Strength (MPa) | 55.6 | 42.5 | 62.5 |
Table 2.
Aggregates and PET granules properties.
| Coarse | Fine | PET | |
|---|---|---|---|
| Specific Gravity | 2.7 | 2.6 | 1.38 |
| Unit Weight (kg/m3) | 1950 | 1800 | 1280 |
| Size (mm) | 2-22.4 | 0-8 | 2 |
Table 3.
CFRP and GFRP properties.
| CFRP | GFRP | |
|---|---|---|
| Weaving Type | Unidirectional | Plain |
| Weight | 300 g/m2 | 200 g/m2 |
| Tensile strength (MPa) | 3000 | 1500 |
| Modulus of Elasticity (GPa) | 230 | 80 |
| Ultimate strain (%) | 1.3 | 1.9 |
| Thickness (mm) | 0.17 | 0.15 |
Table 4.
Epoxy properties.
| Concrete Adhesion |
Compressive Strength | Tensile Strength | Flexural Strength | Time to Reach Full Strength | |
|---|---|---|---|---|---|
| Teknobond 300 Tix | (Rupture from Concrete) | 7 days |
Table 5.
Concrete samples.
| Sample Name | Water (kg/m3) | Cement (kg/m3) | Gravel (kg/m3) | Sand (kg/m3) | PET (kg/m3) | PET content vol (%) | Strength Test | FRP type |
|---|---|---|---|---|---|---|---|---|
| CS-R-0 | 195 | 390 | 1060 | 730 | - | - | Compressive | - |
| CS-PET-10 | 195 | 390 | 1060 | 657 | 51.91 | 10 | Compressive | - |
| CS-PET-20 | 195 | 390 | 1060 | 584 | 103.82 | 20 | Compressive | - |
| CS-PET-30 | 195 | 390 | 1060 | 511 | 155.73 | 30 | Compressive | - |
| STS-R-0 | 195 | 390 | 1060 | 730 | - | - | Splitting tensile | - |
| STS-PET-10 | 195 | 390 | 1060 | 657 | 51.91 | 10 | Splitting tensile | - |
| STS-PET-20 | 195 | 390 | 1060 | 584 | 103.82 | 20 | Splitting tensile | - |
| STS-PET-30 | 195 | 390 | 1060 | 511 | 155.73 | 30 | Splitting tensile | - |
| FS-R-0 | 195 | 390 | 1060 | 730 | - | - | Flexural | - |
| FS-PET-10 | 195 | 390 | 1060 | 657 | 51.91 | 10 | Flexural | - |
| FS-PET-20 | 195 | 390 | 1060 | 584 | 103.82 | 20 | Flexural | - |
| FS-PET-30 | 195 | 390 | 1060 | 511 | 155.73 | 30 | Flexural | - |
| CS-PET-CFRP-10 | 195 | 390 | 1060 | 657 | 51.91 | 10 | Compressive | Carbon |
| CS-PET-GFRP-10 | 195 | 390 | 1060 | 657 | 51.91 | 10 | Compressive | Glass |
| STS-PET-CFRP-10 | 195 | 390 | 1060 | 657 | 51.91 | 10 | Splitting tensile | Carbon |
| STS-PET-GFRP-10 | 195 | 390 | 1060 | 657 | 51.91 | 10 | Splitting tensile | Glass |
| FS-PET-CFRP-10 | 195 | 390 | 1060 | 657 | 51.91 | 10 | Flexural | Carbon |
| FS-PET-GFRP-10 | 195 | 390 | 1060 | 657 | 51.91 | 10 | Flexural | Glass |
*Unit weight was considered when performing volumetric substitution.
Table 6.
Compressive strength test results of samples without FRP.
| Sample Name | ) | ) at Maximum Stress | ) at Maximum Stress |
|---|---|---|---|
| CS-R-0 | 26.91 | 0.001967 | 0.000747 |
| CS-PET-10 | 25.11 | 0.002023 | 0.000769 |
| CS-PET-20 | 23.31 | 0.002116 | 0.000857 |
| CS-PET-30 | 21.80 | 0.002123 | 0.000908 |
Table 7.
Compressive strength test results of samples with FRP.
| Sample Name | (MPa) | (MPa) | ||||
|---|---|---|---|---|---|---|
| CS-PET-CFRP-10 | 25.11 | 47.86 | 0.002023 | 0.013819 | 0.000769 | 0.008538 |
| CS-PET-GFRP-10 | 25.11 | 38.66 | 0.002023 | 0.014469 | 0.000769 | 0.010028 |
Table 8.
Splitting tensile strength test results.
| Sample Name | Split Tensile Strength (MPa) |
|---|---|
| CS-R-0 | 2.46 |
| CS-PET-10 | 2.35 |
| CS-PET-20 | 2.24 |
| CS-PET-30 | 2.16 |
| CS-PET-CFRP-10 | 3.45 |
| CS-PET-GFRP-10 | 3.04 |
Table 9.
Flexural strength test results of samples without FRP.
| Sample Name | Maximum Flexural Stress (MPa) | Maximum Flexural Strain |
|---|---|---|
| CS-R-0 | 3.37 | 0.010467 |
| CS-PET-10 | 3.23 | 0.011447 |
| CS-PET-20 | 3.10 | 0.012158 |
| CS-PET-30 | 3.00 | 0.012759 |
Table 10.
Flexural strength test results of samples with FRP.
| Sample Name | Maximum Flexural Stress (MPa) | Maximum Flexural Strain |
|---|---|---|
| CS-PET-CFRP-10 | 4.59 | 0.061819 |
| CS-PET-GFRP-10 | 4.09 | 0.066795 |
Table 11.
Elasticity modules of the samples.
| Sample Name | ) | ) |
|---|---|---|
| CS-R-0 | 30574.17 | - |
| CS-PET-10 | 27221.85 | - |
| CS-PET-20 | 25061.49 | - |
| CS-PET-30 | 21320.87 | - |
| CS-PET-CFRP-10 | 27512.26 | 1704.56 |
| CS-PET-GFRP-10 | 27465.83 | 988.90 |
Table 12.
Statistical metrics.
| Metrics | Equation | Information |
|---|---|---|
| R2 | This method shows how well a model predicts measured data, with an R² value between 0 and 1. A value closer to 1 indicates better performance [40,41]. | |
| MABE | MABE represents the absolute bias error and reflects the quality of the correlation. A value close to zero is preferred. It gives insight into the long-term performance of the prediction models [40]. | |
| MAPE | MAPE measures the average percentage of absolute prediction errors relative to the actual data values. A lower MAPE indicates better model performance [40,41]. |
Table 13.
PET substituted concrete experimental database.
| Type of substitution | Year | Reference | 28 day CS Test (mm) | 28 day TS Test (mm) | 28 day FS Test (mm) | PET Specific Gravity | PET Bulk Density (kg/m3) | PET Size (mm) | PET (%) | Concrete Density (kg/m3) | W/C Ratio | 28 day CS (MPa) | 28 day Cylindrical CS (MPa) | 28 day TS (MPa) | 28 day Cylindrical TS (MPa) | 28 day FS (MPa) | MoE (GPa) | Slump (mm) |
|---|---|---|---|---|---|---|---|---|---|---|---|---|---|---|---|---|---|---|
| Vol | 2005 | Choi et al. [10] | 100x200 cylinders | 100x200 cylinders | 0 | 2300 | 0.53 | 31.5 | 3.27 | 23.5 | 100 | |||||||
| 100x200 cylinders | 100x200 cylinders | 1.39 | 844 | 5-15 | 25 | 2220 | 0.53 | 29.7 | 2.65 | 23 | 153 | |||||||
| 100x200 cylinders | 100x200 cylinders | 1.39 | 844 | 5-15 | 50 | 2130 | 0.53 | 26.3 | 2.25 | 21.2 | 199 | |||||||
| 100x200 cylinders | 100x200 cylinders | 1.39 | 844 | 5-15 | 75 | 2010 | 0.53 | 21.8 | 2.04 | 18.5 | 223 | |||||||
| 100x200 cylinders | 100x200 cylinders | 0 | 2300 | 0.49 | 34.6 | 3.27 | 23.3 | 105 | ||||||||||
| 100x200 cylinders | 100x200 cylinders | 1.39 | 844 | 5-15 | 25 | 2230 | 0.49 | 33.7 | 2.76 | 22.8 | 154 | |||||||
| 100x200 cylinders | 100x200 cylinders | 1.39 | 844 | 5-15 | 50 | 2120 | 0.49 | 29.1 | 2.35 | 18.1 | 180 | |||||||
| 100x200 cylinders | 100x200 cylinders | 1.39 | 844 | 5-15 | 75 | 2000 | 0.49 | 23.2 | 1.94 | 16.7 | 214 | |||||||
| 100x200 cylinders | 100x200 cylinders | 0 | 2300 | 0.45 | 37.2 | 3.32 | 25.5 | 135 | ||||||||||
| 100x200 cylinders | 100x200 cylinders | 1.39 | 844 | 5-15 | 25 | 2260 | 0.45 | 33.8 | 2.8 | 18.7 | 169 | |||||||
| 100x200 cylinders | 100x200 cylinders | 1.39 | 844 | 5-15 | 50 | 2160 | 0.45 | 31.8 | 2.55 | 17.3 | 184 | |||||||
| 100x200 cylinders | 100x200 cylinders | 1.39 | 844 | 5-15 | 75 | 1940 | 0.45 | 24.9 | 2.04 | 15.6 | 205 | |||||||
| Vol | 2009 | Choi et al. [11] | 100x200 cylinders | 100x200 cylinders | 0 | 2300 | 0.53 | 32.05 | 3.26 | 23.45 | 100 | |||||||
| 100x200 cylinders | 100x200 cylinders | 1.39 | 844 | 5-15 | 25 | 2218.29 | 0.53 | 30.34 | 2.62 | 22.63 | 153 | |||||||
| 100x200 cylinders | 100x200 cylinders | 1.39 | 844 | 5-15 | 50 | 2130.59 | 0.53 | 26.75 | 2.24 | 21.19 | 199 | |||||||
| 100x200 cylinders | 100x200 cylinders | 1.39 | 844 | 5-15 | 75 | 2011.55 | 0.53 | 22.56 | 2.07 | 18.83 | 223 | |||||||
| 100x200 cylinders | 100x200 cylinders | 0 | 2300 | 0.49 | 36.1 | 3.26 | 18.22 | 105 | ||||||||||
| 100x200 cylinders | 100x200 cylinders | 1.39 | 844 | 5-15 | 25 | 2228.19 | 0.49 | 34.77 | 2.76 | 23.16 | 154 | |||||||
| 100x200 cylinders | 100x200 cylinders | 1.39 | 844 | 5-15 | 50 | 2117.39 | 0.49 | 29.82 | 2.34 | 17.97 | 180 | |||||||
| 100x200 cylinders | 100x200 cylinders | 1.39 | 844 | 5-15 | 75 | 1997.53 | 0.49 | 24.33 | 1.97 | 16.99 | 214 | |||||||
| 100x200 cylinders | 100x200 cylinders | 0 | 2300 | 0.45 | 37.81 | 3.31 | 25.43 | 135 | ||||||||||
| 100x200 cylinders | 100x200 cylinders | 1.39 | 844 | 5-15 | 25 | 2260.35 | 0.45 | 34.06 | 2.72 | 22.34 | 169 | |||||||
| 100x200 cylinders | 100x200 cylinders | 1.39 | 844 | 5-15 | 50 | 2160.28 | 0.45 | 32.31 | 2.53 | 17.23 | 184 | |||||||
| 100x200 cylinders | 100x200 cylinders | 1.39 | 844 | 5-15 | 75 | 1941.45 | 0.45 | 27.59 | 2.08 | 15.89 | 205 | |||||||
| Vol | 2009 | Albano et al. [12] | 150x300 cylinders | 150x300 cylinders | ASTM C 78 | 0 | 0.5 | 27.86 | 2.79 | 4.25 | 29.48 | 86.9 | ||||||
| 150x300 cylinders | 150x300 cylinders | ASTM C 78 | 2.6 | 10 | 0.5 | 22.81 | 2.45 | 4.58 | 22.33 | 64.7 | ||||||||
| 150x300 cylinders | 150x300 cylinders | ASTM C 78 | 2.6-11.4 | 10 | 0.5 | 22.4 | 2.51 | 4.64 | 22.85 | 74.5 | ||||||||
| 150x300 cylinders | 150x300 cylinders | ASTM C 78 | 11.4 | 10 | 0.5 | 22.04 | 2.37 | 3.68 | 21.1 | 69.4 | ||||||||
| 150x300 cylinders | 150x300 cylinders | ASTM C 78 | 2.6 | 20 | 0.5 | 17.4 | 1.89 | 3.51 | 16.16 | 42.1 | ||||||||
| 150x300 cylinders | 150x300 cylinders | ASTM C 78 | 2.6-11.4 | 20 | 0.5 | 18.31 | 2.19 | 4.11 | 16.1 | 49.5 | ||||||||
| 150x300 cylinders | 150x300 cylinders | ASTM C 78 | 11.4 | 20 | 0.5 | 13.9 | 1.91 | 1.65 | 15.06 | 0.01 | ||||||||
| 150x300 cylinders | 150x300 cylinders | ASTM C 78 | 0 | 0.6 | 21.26 | 2.33 | 3.83 | 22.59 | 79.3 | |||||||||
| 150x300 cylinders | 150x300 cylinders | ASTM C 78 | 2.6 | 10 | 0.6 | 16.68 | 1.69 | 4.04 | 18.18 | 40 | ||||||||
| 150x300 cylinders | 150x300 cylinders | ASTM C 78 | 2.6-11.4 | 10 | 0.6 | 18.25 | 2.17 | 3.51 | 18.44 | 52.6 | ||||||||
| 150x300 cylinders | 150x300 cylinders | ASTM C 78 | 11.4 | 10 | 0.6 | 13.95 | 2.25 | 3.44 | 20.64 | 30.3 | ||||||||
| 150x300 cylinders | 150x300 cylinders | ASTM C 78 | 2.6 | 20 | 0.6 | 13.07 | 1.45 | 2.95 | 14.02 | 23 | ||||||||
| 150x300 cylinders | 150x300 cylinders | ASTM C 78 | 2.6-11.4 | 20 | 0.6 | 12.75 | 1.74 | 2.79 | 15.97 | 20 | ||||||||
| 150x300 cylinders | 150x300 cylinders | ASTM C 78 | 11.4 | 20 | 0.6 | 8.97 | 1.49 | 2.32 | 11.68 | 0.01 | ||||||||
| Vol | 2013 | Rahmani et al. [13] | 100x200 cylinders | 0 | 0.42 | 42.12 | ||||||||||||
| 100x200 cylinders | 1.11 | 464 | <7 | 5 | 0.42 | 44.27 | ||||||||||||
| 100x200 cylinders | 1.11 | 464 | <7 | 10 | 0.42 | 41.94 | ||||||||||||
| 100x200 cylinders | 1.11 | 464 | <7 | 15 | 0.42 | 38.75 | ||||||||||||
| 100x200 cylinders | 0 | 0.54 | 33.39 | |||||||||||||||
| 100x200 cylinders | 1.11 | 464 | <7 | 5 | 0.54 | 37.55 | ||||||||||||
| 100x200 cylinders | 1.11 | 464 | <7 | 10 | 0.54 | 33.68 | ||||||||||||
| 100x200 cylinders | 1.11 | 464 | <7 | 15 | 0.54 | 29.57 | ||||||||||||
| 150x300 cylinders | 150x300 cylinders | 100x100x500 | 0 | 2281.58 | 0.42 | 38.71 | 3.98 | 6.27 | 36.38 | 70 | ||||||||
| 150x300 cylinders | 150x300 cylinders | 100x100x500 | 1.11 | 464 | <7 | 5 | 2258.6 | 0.42 | 42.14 | 3.89 | 6.55 | 33.8 | 60 | |||||
| 150x300 cylinders | 150x300 cylinders | 100x100x500 | 1.11 | 464 | <7 | 10 | 2238.85 | 0.42 | 39.71 | 3.66 | 5.92 | 31.45 | 50 | |||||
| 150x300 cylinders | 150x300 cylinders | 100x100x500 | 1.11 | 464 | <7 | 15 | 2209.43 | 0.42 | 36.73 | 3.35 | 5.4 | 28.61 | 40 | |||||
| 150x300 cylinders | 150x300 cylinders | 100x100x500 | 0 | 2221.83 | 0.54 | 31.58 | 3.76 | 5.64 | 33.81 | 80 | ||||||||
| 150x300 cylinders | 150x300 cylinders | 100x100x500 | 1.11 | 464 | <7 | 5 | 2207.28 | 0.54 | 35.36 | 3.55 | 6.03 | 31.2 | 65 | |||||
| 150x300 cylinders | 150x300 cylinders | 100x100x500 | 1.11 | 464 | <7 | 10 | 2175.87 | 0.54 | 31.76 | 3.25 | 5.49 | 28.79 | 50 | |||||
| 150x300 cylinders | 150x300 cylinders | 100x100x500 | 1.11 | 464 | <7 | 15 | 2147.68 | 0.54 | 28.91 | 2.98 | 5.2 | 25.85 | 35 | |||||
| 50 cubes | 0 | 0.42 | 55.4 | 44.32 | ||||||||||||||
| 50 cubes | 1.11 | 464 | <7 | 5 | 0.42 | 59.51 | 47.61 | |||||||||||
| 50 cubes | 1.11 | 464 | <7 | 10 | 0.42 | 55.5 | 44.40 | |||||||||||
| 50 cubes | 1.11 | 464 | <7 | 15 | 0.42 | 52.07 | 41.66 | |||||||||||
| 50 cubes | 0 | 0.54 | 46.17 | 36.94 | ||||||||||||||
| 50 cubes | 1.11 | 464 | <7 | 5 | 0.54 | 49.8 | 39.84 | |||||||||||
| 50 cubes | 1.11 | 464 | <7 | 10 | 0.54 | 45.88 | 36.70 | |||||||||||
| 50 cubes | 1.11 | 464 | <7 | 15 | 0.54 | 42.09 | 33.67 | |||||||||||
| 100 cubes | 0 | 0.42 | 54.49 | 43.59 | ||||||||||||||
| 100 cubes | 1.11 | 464 | <7 | 5 | 0.42 | 55.56 | 44.45 | |||||||||||
| 100 cubes | 1.11 | 464 | <7 | 10 | 0.42 | 52.55 | 42.04 | |||||||||||
| 100 cubes | 1.11 | 464 | <7 | 15 | 0.42 | 50.46 | 40.37 | |||||||||||
| 100 cubes | 0 | 0.54 | 41.85 | 33.48 | ||||||||||||||
| 100 cubes | 1.11 | 464 | <7 | 5 | 0.54 | 48.01 | 38.41 | |||||||||||
| 100 cubes | 1.11 | 464 | <7 | 10 | 0.54 | 43.09 | 34.47 | |||||||||||
| 100 cubes | 1.11 | 464 | <7 | 15 | 0.54 | 41.57 | 33.26 | |||||||||||
| 150 cubes | 0 | 0.42 | 52.2 | 41.76 | ||||||||||||||
| 150 cubes | 1.11 | 464 | <7 | 5 | 0.42 | 53.24 | 42.59 | |||||||||||
| 150 cubes | 1.11 | 464 | <7 | 10 | 0.42 | 50.52 | 40.42 | |||||||||||
| 150 cubes | 1.11 | 464 | <7 | 15 | 0.42 | 46.59 | 37.27 | |||||||||||
| 150 cubes | 0 | 0.54 | 41.1 | 32.88 | ||||||||||||||
| 150 cubes | 1.11 | 464 | <7 | 5 | 0.54 | 44.76 | 35.81 | |||||||||||
| 150 cubes | 1.11 | 464 | <7 | 10 | 0.54 | 39.94 | 31.95 | |||||||||||
| 150 cubes | 1.11 | 464 | <7 | 15 | 0.54 | 38.52 | 30.82 | |||||||||||
| Vol | 2013 | Saikia and De Brito [14] | NP EN 12390-3 | NP EN 12390-6 | NP EN 12390-5 | 0 | 2409.41 | 0.53 | 43.07 | 34.46 | 3.49 | 4.74 | ||||||
| NP EN 12390-3 | NP EN 12390-6 | NP EN 12390-5 | 1.34 | 555 | 0.5-4 | 5 | 2347.61 | 0.57 | 36.11 | 28.89 | 3.07 | 4.26 | ||||||
| NP EN 12390-3 | NP EN 12390-6 | NP EN 12390-5 | 1.34 | 555 | 0.5-4 | 10 | 2304.07 | 0.6 | 30.79 | 24.63 | 2.83 | 3.76 | ||||||
| NP EN 12390-3 | NP EN 12390-6 | NP EN 12390-5 | 1.34 | 555 | 0.5-4 | 15 | 2231.04 | 0.64 | 25.33 | 20.26 | 2.28 | 2.99 | ||||||
| NP EN 12390-3 | NP EN 12390-6 | NP EN 12390-5 | 1.34 | 827 | 0.5-4 | 5 | 2364.47 | 0.53 | 37.82 | 30.26 | 3.21 | 4.54 | ||||||
| NP EN 12390-3 | NP EN 12390-6 | NP EN 12390-5 | 1.34 | 827 | 0.5-4 | 10 | 2339.89 | 0.52 | 36.86 | 29.49 | 3.13 | 4.24 | ||||||
| NP EN 12390-3 | NP EN 12390-6 | NP EN 12390-5 | 1.34 | 827 | 0.5-4 | 15 | 2304.07 | 0.52 | 33.41 | 26.73 | 2.87 | 3.98 | ||||||
| Vol | 2013 | Juki et al. [15] | BS 1881-Part 116-83 | BS 1881: Part 117 | 0 | 2386.18 | 0.45 | 31.34 | 25.07 | 3.21 | 31.29 | |||||||
| BS 1881-Part 116-83 | BS 1881: Part 117 | <5 | 25 | 2290.85 | 0.45 | 27.91 | 22.33 | 2.7 | 26.89 | |||||||||
| BS 1881-Part 116-83 | BS 1881: Part 117 | <5 | 50 | 2209.76 | 0.45 | 22.99 | 18.39 | 2.02 | 21.55 | |||||||||
| BS 1881-Part 116-83 | BS 1881: Part 117 | <5 | 75 | 2041.87 | 0.45 | 17.04 | 13.63 | 1.57 | 10.33 | |||||||||
| BS 1881-Part 116-83 | BS 1881: Part 117 | 0 | 2371.95 | 0.55 | 26.76 | 21.41 | 3.52 | 30.87 | ||||||||||
| BS 1881-Part 116-83 | BS 1881: Part 117 | <5 | 25 | 2315.04 | 0.55 | 25.39 | 20.31 | 2.98 | 18.71 | |||||||||
| BS 1881-Part 116-83 | BS 1881: Part 117 | <5 | 50 | 2249.59 | 0.55 | 20.36 | 16.29 | 2.38 | 16.12 | |||||||||
| BS 1881-Part 116-83 | BS 1881: Part 117 | <5 | 75 | 2232.52 | 0.55 | 15.78 | 12.62 | 2.02 | 10.07 | |||||||||
| BS 1881-Part 116-83 | BS 1881: Part 117 | 0 | 2380.49 | 0.65 | 25.39 | 20.31 | 2.97 | 36.73 | ||||||||||
| BS 1881-Part 116-83 | BS 1881: Part 117 | <5 | 25 | 2286.59 | 0.65 | 25.28 | 20.22 | 2.21 | 25.82 | |||||||||
| BS 1881-Part 116-83 | BS 1881: Part 117 | <5 | 50 | 2262.4 | 0.65 | 19.22 | 15.38 | 1.42 | 18.68 | |||||||||
| BS 1881-Part 116-83 | BS 1881: Part 117 | <5 | 75 | 2185.57 | 0.65 | 15.56 | 12.45 | 1.19 | 13.65 | |||||||||
| Vol | 2013 | Juki et al. [16] | 100x200 cylinders | 100x200 cylinders | 100x100x500 | 0 | 2372.59 | 0.55 | 26.69 | 3.52 | 4.99 | 30 | ||||||
| 100x200 cylinders | 100x200 cylinders | 100x100x500 | <5 | 25 | 2343.22 | 0.55 | 22.83 | 2.99 | 4.75 | 23 | ||||||||
| 100x200 cylinders | 100x200 cylinders | 100x100x500 | <5 | 50 | 2322.79 | 0.55 | 20.37 | 2.38 | 3.8 | 15 | ||||||||
| 100x200 cylinders | 100x200 cylinders | 100x100x500 | <5 | 75 | 2231.94 | 0.55 | 15.2 | 2.02 | 2.61 | 9 | ||||||||
| Vol | 2014 | Saikia and De Brito [17] | 150 cubes | 100x150 cylinders | 150x150x600 | 0 | 2387 | 0.53 | 42.96 | 34.37 | 3.45 | 4.72 | 39.79 | 127 | ||||
| 150 cubes | 100x150 cylinders | 150x150x600 | 1.32 | 555 | 0.5-4 | 5 | 2336 | 0.57 | 36.2 | 28.96 | 3.12 | 4.36 | 35.1 | 122 | ||||
| 150 cubes | 100x150 cylinders | 150x150x600 | 1.32 | 555 | 0.5-4 | 10 | 2290 | 0.6 | 30.92 | 24.74 | 2.66 | 3.75 | 29.9 | 122 | ||||
| 150 cubes | 100x150 cylinders | 150x150x600 | 1.32 | 555 | 0.5-4 | 15 | 2243 | 0.64 | 25.53 | 20.42 | 2.22 | 2.98 | 24.69 | 120 | ||||
| 150 cubes | 100x150 cylinders | 150x150x600 | 1.36 | 827 | 0.5-4 | 5 | 2347 | 0.53 | 37.78 | 30.22 | 3.29 | 4.51 | 36.15 | 122 | ||||
| 150 cubes | 100x150 cylinders | 150x150x600 | 1.36 | 827 | 0.5-4 | 10 | 2297 | 0.52 | 36.9 | 29.52 | 3.16 | 4.24 | 35.94 | 122 | ||||
| 150 cubes | 100x150 cylinders | 150x150x600 | 1.36 | 827 | 0.5-4 | 15 | 2254 | 0.52 | 33.19 | 26.55 | 2.81 | 3.97 | 31.04 | 132 | ||||
| Vol | 2017 | Mohammed [18] | 100x200 cylinders | 0 | 2375 | 0.5 | 33.07 | |||||||||||
| 100x200 cylinders | 353 | 3-12 | 5 | 2362 | 0.5 | 27.05 | ||||||||||||
| 100x200 cylinders | 353 | 3-12 | 10 | 2407 | 0.5 | 31.82 | ||||||||||||
| 100x200 cylinders | 353 | 3-12 | 15 | 2348 | 0.5 | 32.57 | ||||||||||||
| 100x200 cylinders | 0 | 2350 | 0.5 | 31.36 | ||||||||||||||
| 100x200 cylinders | 353 | 3-12 | 5 | 2303 | 0.5 | 23.81 | ||||||||||||
| 100x200 cylinders | 353 | 3-12 | 10 | 2317 | 0.5 | 24.92 | ||||||||||||
| 100x200 cylinders | 353 | 3-12 | 15 | 2314 | 0.5 | 23.66 | ||||||||||||
| Vol | 2018 | Al-Hadithi and Al-Ani [19] | 0 | 2350.51 | 0.29 | 69 | 55.20 | 43.06 | ||||||||||
| 1.29 | 447 | <4.75 | 2.5 | 2339.36 | 0.29 | 60.38 | 48.30 | 40.81 | ||||||||||
| 1.29 | 447 | <4.75 | 5 | 2331.92 | 0.29 | 56.93 | 45.54 | 40.76 | ||||||||||
| 1.29 | 447 | <4.75 | 7.5 | 2313.35 | 0.29 | 50.35 | 40.28 | 40.52 | ||||||||||
| Vol | 2022 | Kangavar et al. [20] | 100x200 cylinders | 100x200 cylinders | 150x150x700 | 0 | 2417 | 0.45 | 34.23 | 3.96 | 3.96 | 24.41 | 98 | |||||
| 100x200 cylinders | 100x200 cylinders | 150x150x700 | 1.34 | 1380 | <4.75 | 10 | 2340 | 0.45 | 37.34 | 4.3 | 4.33 | 24.13 | 98 | |||||
| 100x200 cylinders | 100x200 cylinders | 150x150x700 | 1.34 | 1380 | <4.75 | 30 | 2125 | 0.45 | 33.78 | 3.81 | 3.99 | 20.25 | 94 | |||||
| 100x200 cylinders | 100x200 cylinders | 150x150x700 | 1.34 | 1380 | <4.75 | 50 | 1845 | 0.45 | 25.16 | 3.31 | 3.47 | 18.93 | 90 | |||||
| Vol | 2022 | Babafemi et al. [21] | 100 cubes | 100 cubes | 0 | 0.5 | 36.37 | 29.10 | 4.01 | 3.21 | 100 | |||||||
| 100 cubes | 100 cubes | 1.47 | <3 | 5 | 0.5 | 37.37 | 29.90 | 3.81 | 3.05 | 100 | ||||||||
| 100 cubes | 100 cubes | 1.47 | <3 | 10 | 0.5 | 37.27 | 29.82 | 3.63 | 2.90 | 124 | ||||||||
| 100 cubes | 100 cubes | 1.47 | <3 | 15 | 0.5 | 35 | 28.00 | 3.57 | 2.86 | 135 | ||||||||
| Vol | 2022 | Hama [22] | 150x300 cylinders | 0 | 2428 | 0.42 | 35.76 | 27.4 | 96 | |||||||||
| 150x300 cylinders | 1.36 | <4.75 | 10 | 2392 | 0.42 | 36.8 | 24.05 | 94 | ||||||||||
| 150x300 cylinders | 1.36 | <4.75 | 15 | 2374 | 0.42 | 34.78 | 22.31 | 92 | ||||||||||
| 150x300 cylinders | 1.36 | <4.75 | 20 | 2358 | 0.42 | 28.48 | 21.82 | 86 | ||||||||||
| 150x300 cylinders | 1.36 | <4.75 | 25 | 2340 | 0.42 | 25.63 | 20.42 | 80 | ||||||||||
| Vol | 2023 | Xiong et al. [23] | 150x300 cylinders | 0 | 2454 | 0.44 | 53.2 | 30.15 | 235 | |||||||||
| 150x300 cylinders | ≤1.6 | 5 | 2424 | 0.44 | 50.2 | 24.93 | 215 | |||||||||||
| 150x300 cylinders | ≤1.6 | 10 | 2420 | 0.44 | 46.9 | 26.9 | 200 | |||||||||||
| 150x300 cylinders | ≤1.6 | 20 | 2412 | 0.44 | 43.7 | 24.94 | 205 | |||||||||||
| 150x300 cylinders | ≤1.6 | 30 | 2389 | 0.44 | 40.8 | 21.87 | 180 | |||||||||||
| Vol | This Year | Sancak and Ozyurt | 100x200 cylinders | 100x200 cylinders | 100x100x400 | 0 | 2307.88 | 0.5 | 26.91 | 2.46 | 3.37 | 30.57 | 48 | |||||
| 100x200 cylinders | 100x200 cylinders | 100x100x400 | 1.39 | 1280 | 2 | 10 | 2271.66 | 0.5 | 25.11 | 2.35 | 3.23 | 27.22 | 45 | |||||
| 100x200 cylinders | 100x200 cylinders | 100x100x400 | 1.39 | 1280 | 2 | 20 | 2234.49 | 0.5 | 23.31 | 2.24 | 3.1 | 25.06 | 40 | |||||
| 100x200 cylinders | 100x200 cylinders | 100x100x400 | 1.39 | 1280 | 2 | 30 | 2177.94 | 0.5 | 21.8 | 2.16 | 2.3 | 21.32 | 38 | |||||
| Wei | 2008 | Ismail and AL-Hashmi [24] | 150 cubes | ASTM C293 | 0 | 2399.02 | 0.53 | 44 | 35.20 | 5.88 | 75 | |||||||
| 150 cubes | ASTM C293 | 368.7 | 0.5-12 | 10 | 2307.11 | 0.53 | 33.23 | 26.58 | 4.59 | 24 | ||||||||
| 150 cubes | ASTM C293 | 368.7 | 0.5-12 | 15 | 2244.68 | 0.53 | 29.64 | 23.71 | 4.26 | 9 | ||||||||
| 150 cubes | ASTM C293 | 368.7 | 0.5-12 | 20 | 2223.87 | 0.53 | 29.63 | 23.70 | 4.06 | 3 | ||||||||
| Wei | 2010 | Frigione et al. [25] | 150 cubes | 150x300 cylinders | 0 | 0.45 | 68 | 54.40 | 6.1 | |||||||||
| 150 cubes | 150x300 cylinders | 1.32 | 660 | <2.36 | 5 | 0.45 | 67.5 | 54.00 | 6 | |||||||||
| 150 cubes | 150x300 cylinders | 1.32 | 660 | <2.36 | 0 | 0.55 | 41.5 | 33.20 | 4.2 | |||||||||
| 150 cubes | 150x300 cylinders | 1.32 | 660 | <2.36 | 5 | 0.55 | 40.7 | 32.56 | 4.1 | |||||||||
| 150 cubes | 150x300 cylinders | 0 | 0.45 | 70 | 56.00 | 6.3 | ||||||||||||
| 150 cubes | 150x300 cylinders | 1.32 | 660 | <2.36 | 5 | 0.45 | 69.7 | 55.76 | 6.3 | |||||||||
| 150 cubes | 150x300 cylinders | 1.32 | 660 | <2.36 | 0 | 0.55 | 44 | 35.20 | 4.7 | |||||||||
| 150 cubes | 150x300 cylinders | 1.32 | 660 | <2.36 | 5 | 0.55 | 43.2 | 34.56 | 4.6 | |||||||||
| Wei | 2011 | Galvao et al. [26] | NBR 5739/07 | NBR 7222/94 | 0 | 0.45 | 34.13 | 3.35 | ||||||||||
| NBR 5739/07 | NBR 7222/94 | 1.32 | 1.2-12.5 | 0.5 | 0.45 | 37.67 | 3.75 | |||||||||||
| NBR 5739/07 | NBR 7222/94 | 1.32 | 1.2-12.5 | 1 | 0.45 | 39.52 | 3.6 | |||||||||||
| NBR 5739/07 | NBR 7222/94 | 1.32 | 1.2-12.5 | 2.5 | 0.45 | 35.98 | 3.69 | |||||||||||
| NBR 5739/07 | NBR 7222/94 | 1.32 | 1.2-12.5 | 5 | 0.45 | 34.13 | 3.3 | |||||||||||
| NBR 5739/07 | NBR 7222/94 | 1.32 | 1.2-12.5 | 7.5 | 0.45 | 28.9 | 3.49 | |||||||||||
| Wei | 2016 | Azhdarpour et al. [27] | 150x300 cylinders | 150x300 cylinders | 130x150x450 | 0 | 2158.05 | 0.5 | 35 | 2.5 | 4.4 | 48.87 | ||||||
| 150x300 cylinders | 150x300 cylinders | 130x150x450 | 1.38 | 0.05-4.9 | 5 | 2119.02 | 0.5 | 51 | 3.1 | 6.1 | ||||||||
| 150x300 cylinders | 150x300 cylinders | 130x150x450 | 1.38 | 0.05-4.9 | 10 | 2087.93 | 0.5 | 38 | 3.3 | 4.9 | 27.06 | |||||||
| 150x300 cylinders | 150x300 cylinders | 130x150x450 | 1.38 | 0.05-4.9 | 15 | 2050.12 | 0.5 | 31 | 2.9 | 4.8 | ||||||||
| 150x300 cylinders | 150x300 cylinders | 130x150x450 | 1.38 | 0.05-4.9 | 20 | 2014.15 | 0.5 | 29 | 2.8 | 4.3 | 16.98 | |||||||
| 150x300 cylinders | 150x300 cylinders | 130x150x450 | 1.38 | 0.05-4.9 | 25 | 1979.39 | 0.5 | 22 | 2.2 | 4.1 | ||||||||
| 150x300 cylinders | 150x300 cylinders | 130x150x450 | 1.38 | 0.05-4.9 | 30 | 1935.49 | 0.5 | 19 | 1.6 | 3 | 9.44 | |||||||
| Wei | 2016 | Norhana et al. [28] | 100 cubes | 100x100x500 | 0 | 0.5 | 44 | 35.20 | 5.6 | |||||||||
| 100 cubes | 100x100x500 | <5 | 10 | 0.5 | 35 | 28.00 | 4.7 | |||||||||||
| 100 cubes | 100x100x500 | <5 | 20 | 0.5 | 30 | 24.00 | 4.5 | |||||||||||
| 100 cubes | 100x100x500 | <5 | 30 | 0.5 | 24 | 19.20 | 4.3 | |||||||||||
| Wei | 2018 | Saxena et al. [29] | 100 cubes | 0 | 0.45 | 26.7 | 21.36 | |||||||||||
| 100 cubes | <4.75 | 5 | 0.45 | 26.11 | 20.89 | |||||||||||||
| 100 cubes | <4.75 | 10 | 0.45 | 25.61 | 20.49 | |||||||||||||
| 100 cubes | <4.75 | 15 | 0.45 | 13.89 | 11.11 | |||||||||||||
| 100 cubes | <4.75 | 20 | 0.45 | 5.4 | 4.32 | |||||||||||||
| Wei | 2020 | Almeshal et al. [30] | BS 1881 | ASTM C 496 | ASTM C 293 | 0 | 2394.91 | 0.54 | 35.6 | 28.48 | 3.11 | 7.64 | 89 | |||||
| BS 1881 | ASTM C 496 | ASTM C 293 | 1410 | 0.075-4 | 10 | 2369.21 | 0.54 | 35.2 | 28.16 | 2.78 | 7.46 | 78 | ||||||
| BS 1881 | ASTM C 496 | ASTM C 293 | 1410 | 0.075-4 | 20 | 2297.42 | 0.54 | 34.11 | 27.29 | 2.51 | 6.83 | 62 | ||||||
| BS 1881 | ASTM C 496 | ASTM C 293 | 1410 | 0.075-4 | 30 | 2211.46 | 0.54 | 24.58 | 19.66 | 2.01 | 5.92 | 44 | ||||||
| BS 1881 | ASTM C 496 | ASTM C 293 | 1410 | 0.075-4 | 40 | 1992.73 | 0.54 | 14.25 | 11.40 | 1.74 | 3.21 | 23 | ||||||
| BS 1881 | ASTM C 496 | ASTM C 293 | 1410 | 0.075-4 | 50 | 1806.12 | 0.54 | 3.36 | 2.69 | 0.45 | 1.21 | 10 | ||||||
| Wei | 2021 | Bamigboye et al. [31] | ASTM. C39/C39M-20 | 100x200 cylinders | 0 | 0.55 | 31 | 3.2 | 30 | |||||||||
| ASTM. C39/C39M-20 | 100x200 cylinders | 0.075-5 | 10 | 0.55 | 22.3 | 2.81 | 45 | |||||||||||
| ASTM. C39/C39M-20 | 100x200 cylinders | 0.075-5 | 20 | 0.55 | 22 | 2.57 | 60 | |||||||||||
| ASTM. C39/C39M-20 | 100x200 cylinders | 0.075-5 | 30 | 0.55 | 21.7 | 2.45 | 100 | |||||||||||
| ASTM. C39/C39M-20 | 100x200 cylinders | 0.075-5 | 40 | 0.55 | 20.7 | 2.41 | 105 | |||||||||||
| ASTM. C39/C39M-20 | 100x200 cylinders | 0.075-5 | 100 | 0.55 | 16.3 | 2.02 | 40 | |||||||||||
| Wei | 2021 | Dawood et al. [32] | 150 cubes | 100x200 cylinders | 100x100x500 | 1.38 | 0.6-3 | 0 | 2361.39 | 0.41 | 34.79 | 27.83 | 2.41 | 4.54 | 27.14 | 160 | ||
| 150 cubes | 100x200 cylinders | 100x100x500 | 1.38 | 0.6-3 | 5 | 2355.57 | 0.41 | 46.79 | 37.43 | 2.6 | 5.76 | 24.47 | 140 | |||||
| 150 cubes | 100x200 cylinders | 100x100x500 | 1.38 | 0.6-3 | 7.5 | 2303.61 | 0.41 | 49.58 | 39.66 | 3.06 | 5.88 | 22.65 | 130 | |||||
| 150 cubes | 100x200 cylinders | 100x100x500 | 1.38 | 0.6-3 | 10 | 2296.58 | 0.41 | 44.92 | 35.94 | 2.86 | 5.71 | 22.62 | 120 | |||||
| 150 cubes | 100x200 cylinders | 100x100x500 | 1.38 | 0.6-3 | 12.5 | 2278.16 | 0.41 | 43.3 | 34.64 | 2.86 | 5.33 | 22.39 | 100 | |||||
| 150 cubes | 100x200 cylinders | 100x100x500 | 1.38 | 0.6-3 | 15 | 2223.04 | 0.41 | 35.62 | 28.50 | 2.43 | 4.53 | 22.06 | 80 | |||||
| 150 cubes | 100x200 cylinders | 100x100x500 | 1.38 | 0.6-3 | 20 | 2193.79 | 0.41 | 32.75 | 26.20 | 2.32 | 4.33 | 21.08 | 60 | |||||
| Wei | 2021 | Tayeh et al. [33] | 100 cubes | 150x300 cylinders | 100x100x500 | 0.9-0.96 | 0.075-2 | 0 | 2448.34 | 0.51 | 39.76 | 31.81 | 5.56 | 7.96 | 103 | |||
| 100 cubes | 150x300 cylinders | 100x100x500 | 0.9-0.96 | 0.075-2 | 10 | 2442.22 | 0.51 | 39.01 | 31.21 | 5.25 | 7.65 | 138 | ||||||
| 100 cubes | 150x300 cylinders | 100x100x500 | 0.9-0.96 | 0.075-2 | 20 | 2400.41 | 0.51 | 33.59 | 26.87 | 5.13 | 7.43 | 175 | ||||||
| 100 cubes | 150x300 cylinders | 100x100x500 | 0.9-0.96 | 0.075-2 | 30 | 2396.33 | 0.51 | 33.21 | 26.57 | 4.25 | 7.33 | 233 | ||||||
| 100 cubes | 150x300 cylinders | 100x100x500 | 0.9-0.96 | 0.075-2 | 40 | 2343.31 | 0.51 | 31.15 | 24.92 | 4.17 | 6.77 | 299 | ||||||
| Wei | 2022 | Harihanandh and Karthik [34] | 150 cubes | 100x100x500 | 0 | 0.45 | 37.8 | 30.24 | 4.27 | 3.75 | 120 | |||||||
| 150 cubes | 100x100x500 | 1-2 | 5 | 0.45 | 39.99 | 31.99 | 4.46 | 3.94 | 110 | |||||||||
| 150 cubes | 100x100x500 | 1-2 | 10 | 0.45 | 38.25 | 30.60 | 4.33 | 3.78 | 70 | |||||||||
| 150 cubes | 100x100x500 | 1-2 | 15 | 0.45 | 24.225 | 19.38 | 3.63 | 2.51 | 20 | |||||||||
| 150 cubes | 100x100x500 | 1-2 | 20 | 0.45 | 19.55 | 15.64 | 2.92 | 2.08 | 0 | |||||||||
| 150 cubes | 100x100x500 | 1-2 | 25 | 0.45 | 14.02 | 11.22 | 2.56 | 1.58 | 0 |
Table 14.
Derived equations for compressive strength and proposed developed models.
| Type of Data | Type of Curve | Proposed Model | Data Point | R2 | MABE | MAPE |
|---|---|---|---|---|---|---|
| Experimental Data of This Study | Exponential | 3 | 0.999 | 0.045 | 0.194 | |
| Linear | 3 | 0.997 | 0.097 | 0.423 | ||
| Volume Substitution Data | Exponential | 110 | 0.805 | 3.314 | 13.396 | |
| Linear | 110 | 0.802 | 3.318 | 13.519 | ||
| Weight Substitution Data | Exponential | 50 | 0.682 | 5.277 | 32.116 | |
| Linear | 50 | 0.619 | 5.274 | 35.261 | ||
| All Data | Exponential | 160 | 0.741 | 4.795 | 22.352 | |
| Linear | 160 | 0.733 | 4.728 | 22.814 |
Table 15.
Suggested models and performances for compressive strength.
| Year | Reference | Data Point | R2 | MABE | MAPE |
|---|---|---|---|---|---|
| 2013 | Nibudey et al. [42]* | ||||
| 160 | 0.310 | 12.850 | 64.509 | ||
| 2013 | Saikia and De Brito [14] | ||||
| 95 | 0.256 | 11.515 | 47.258 | ||
| 2017 | Mohammed [18] | ||||
| 160 | 0.716 | 5.762 | 24.549 | ||
| 95 | 0.613 | 5.509 | 24.018 | ||
| 2021 | Bamigboye et al. [31] | ||||
| 160 | 0.257 | 13.785 | 41.693 | ||
| 2022 | Bamigboye et al. [43]** | ||||
| 160 | 0.257 | 15.724 | 46.976 | ||
| 160 | 0.326 | 15.359 | 46.312 | ||
| 2022 | Meena and Ramana [44] | ||||
| 95 | 0.612 | 5.558 | 16.651 | ||
| 2023 | Aocharoen and Chotickai [45]** | ||||
| 160 | 0.269 | 24.541 | 108.874 | ||
| This Year | Sancak and Ozyurt (This Study) | ||||
| 160 | 0.741 | 4.795 | 22.352 | ||
| 160 | 0.733 | 4.728 | 22.814 |
*In the study, fiber was used, not granule. **In the study, coarse aggregate was used, not fine.
Table 16.
Derived equations and proposed developed models for the connection between tensile strength and PET substitution percentage.
Table 16.
Derived equations and proposed developed models for the connection between tensile strength and PET substitution percentage.
| Type of Data | Type of Curve | Proposed Model | Data Point | R2 | MABE | MAPE |
|---|---|---|---|---|---|---|
| Experimental Data of This Study | Exponential | 3 | 0.994 | 0.007 | 0.312 | |
| Linear | 3 | 0.992 | 0.010 | 0.447 | ||
| Volume Substitution Data | Exponential | 69 | 0.776 | 0.222 | 9.968 | |
| Linear | 69 | 0.765 | 0.239 | 10.771 | ||
| Weight Substitution Data | Exponential | 40 | 0.840 | 0.407 | 20.755 | |
| Linear | 40 | 0.812 | 0.396 | 21.893 | ||
| All Data | Exponential | 109 | 0.823 | 0.290 | 14.275 | |
| Linear | 109 | 0.811 | 0.296 | 14.901 |
Table 17.
Suggested models and their performances for the connection between tensile strength and PET substitution percentage.
Table 17.
Suggested models and their performances for the connection between tensile strength and PET substitution percentage.
| Year | Reference | Data Point | R2 | MABE | MAPE |
|---|---|---|---|---|---|
| 2013 | Nibudey et al. [42]* | ||||
| 109 | 0.293 | 1.092 | 52.831 | ||
| 2021 | Bamigboye et al. [31] | ||||
| 109 | 0.255 | 0.842 | 28.760 | ||
| 2022 | Bamigboye et al. [43]** | ||||
| 109 | 0.255 | 1.084 | 36.799 | ||
| 109 | 0.301 | 1.051 | 35.657 | ||
| 2022 | Meena and Ramana [44] | ||||
| 52 | 0.809 | 0.568 | 17.698 | ||
| This Year | Sancak and Ozyurt (This Study) | ||||
| 109 | 0.823 | 0.290 | 14.275 | ||
| 109 | 0.811 | 0.296 | 14.901 |
*In the study, fiber was used, not granule. **In the study, coarse aggregate was used, not fine.
Table 18.
Derived equations and proposed developed models for the connection between tensile strength and compressive strength.
Table 18.
Derived equations and proposed developed models for the connection between tensile strength and compressive strength.
| Type of Data | Type of Curve | Proposed Model | Data Point | R2 | MABE | MAPE |
|---|---|---|---|---|---|---|
| Experimental Data of This Study | Power | 3 | 0.998 | 0.004 | 0.162 | |
| Linear | 3 | 0.998 | 0.003 | 0.138 | ||
| Volume Substitution Data | Power | 69 | 0.665 | 0.303 | 12.327 | |
| Linear | 69 | 0.672 | 0.295 | 12.120 | ||
| Weight Substitution Data | Power | 40 | 0.463 | 0.704 | 21.796 | |
| Linear | 40 | 0.317 | 1.559 | 60.953 | ||
| All Data | Power | 109 | 0.540 | 0.441 | 15.297 | |
| Linear | 109 | 0.545 | 0.444 | 16.333 |
Table 19.
Suggested models and their performances for the connection between tensile strength and compressive strength.
Table 19.
Suggested models and their performances for the connection between tensile strength and compressive strength.
| Year | Reference | Data Point | R2 | MABE | MAPE |
|---|---|---|---|---|---|
| 2013 | Nibudey et al. [42]* | ||||
| 109 | 0.535 | 0.839 | 32.306 | ||
| 2013 | Juki et al. [16] | ||||
| 109 | 0.522 | 0.670 | 27.486 | ||
| 2013 | Saikia and De Brito [14] | ||||
| 109 | 0.535 | 0.665 | 23.161 | ||
| 2017 | Mohammed [46] | ||||
| 109 | 0.535 | 0.471 | 17.639 | ||
| 109 | 0.532 | 0.458 | 16.554 | ||
| 2020 | Almeshal et al. [30] | ||||
| 109 | 0.532 | 0.446 | 16.472 | ||
| 2021 | Tayeh [33] | ||||
| 109 | 0.038 | 5.678 | 326.375 | ||
| 2021 | Bamigboye et al. [31] | ||||
| 109 | 0.535 | 0.478 | 16.737 | ||
| 2022 | Bamigboye et al. [43]** | ||||
| 109 | 0.535 | 0.488 | 16.892 | ||
| This Year | Sancak and Ozyurt (This Study) | ||||
| 109 | 0.540 | 0.441 | 15.297 | ||
| 109 | 0.545 | 0.444 | 16.333 |
*In the study, fiber was used, not granule. **In the study, coarse aggregate was used, not fine.
Table 20.
Derived equations and proposed developed models for the connection between flexural strength and PET substitution percentage.
Table 20.
Derived equations and proposed developed models for the connection between flexural strength and PET substitution percentage.
| Type of Data | Type of Curve | Proposed Model | Data Point | R2 | MABE | MAPE |
|---|---|---|---|---|---|---|
| Experimental Data of This Study | Exponential | 3 | 0.996 | 0.010 | 0.321 | |
| Linear | 3 | 0.994 | 0.013 | 0.430 | ||
| Volume Substitution Data | Exponential | 39 | 0.656 | 0.451 | 13.933 | |
| Linear | 39 | 0.650 | 0.457 | 14.289 | ||
| Weight Substitution Data | Exponential | 32 | 0.607 | 1.058 | 27.280 | |
| Linear | 32 | 0.578 | 0.936 | 27.362 | ||
| All Data | Exponential | 71 | 0.607 | 0.700 | 20.542 | |
| Linear | 71 | 0.593 | 0.670 | 20.980 |
Table 21.
Derived equations and proposed developed models for the connection between flexural strength and compressive strength.
Table 21.
Derived equations and proposed developed models for the connection between flexural strength and compressive strength.
| Type of Data | Type of Curve | Proposed Model | Data Point | R2 | MABE | MAPE |
|---|---|---|---|---|---|---|
| Experimental Data of This Study | Power | 3 | 0.999 | 0.003 | 0.099 | |
| Linear | 3 | 0.999 | 0.002 | 0.064 | ||
| Volume Substitution Data | Power | 39 | 0.660 | 0.500 | 13.507 | |
| Linear | 39 | 0.671 | 0.484 | 13.195 | ||
| Weight Substitution Data | Power | 32 | 0.411 | 0.958 | 20.972 | |
| Linear | 32 | 0.376 | 1.025 | 24.735 | ||
| All Data | Power | 71 | 0.480 | 0.711 | 16.913 | |
| Linear | 71 | 0.465 | 0.724 | 17.889 |
Table 22.
Suggested models and their performances for the connection between flexural strength and compressive strength.
Table 22.
Suggested models and their performances for the connection between flexural strength and compressive strength.
| Year | Reference | Data Point | R2 | MABE | MAPE |
|---|---|---|---|---|---|
| 2013 | Juki et al. [16] | ||||
| 71 | 0.471 | 0.769 | 18.906 | ||
| 2013 | Saikia and De Brito [14] | ||||
| 71 | 0.457 | 1.131 | 23.352 | ||
| 2017 | Mohammed [46] | ||||
| 71 | 0.457 | 0.714 | 16.832 | ||
| 71 | 0.468 | 0.736 | 17.165 | ||
| 2020 | Almeshal et al. [30] | ||||
| 71 | 0.468 | 2.334 | 59.287 | ||
| 2021 | Tayeh [33] | ||||
| 71 | 0.280 | 2.716 | 89.538 | ||
| 2022 | Alqahtani [47]* | ||||
| 71 | 0.473 | 0.762 | 16.857 | ||
| 71 | 0.429 | 1.134 | 26.352 | ||
| This Year | Sancak and Ozyurt (This Study) | ||||
| 71 | 0.480 | 0.711 | 16.913 | ||
| 71 | 0.465 | 0.724 | 17.889 |
*In the study, coarse aggregate was used, not fine.
Table 23.
Derived equations and proposed developed models for the connection between modulus of elasticity and PET substitution percentage.
Table 23.
Derived equations and proposed developed models for the connection between modulus of elasticity and PET substitution percentage.
| Type of Data | Type of Curve | Proposed Model | Data Point | R2 | MABE | MAPE |
|---|---|---|---|---|---|---|
| Experimental Data of This Study | Linear | 3 | 0.977 | 0.367 | 1.488 | |
| Volume Substitution Data | Linear | 71 | 0.710 | 3.871 | 21.014 | |
| Weight Substitution Data | Linear | 9 | 0.654 | 5.024 | 26.330 | |
| All Data | Linear | 80 | 0.506 | 4.440 | 25.313 |
Table 24.
Suggested models and their performances for the connection between modulus of elasticity and PET substitution percentage.
Table 24.
Suggested models and their performances for the connection between modulus of elasticity and PET substitution percentage.
| Year | Reference | Data Point | R2 | MABE | MAPE |
|---|---|---|---|---|---|
| 2023 | Aocharoen and Chotickai [45]* | ||||
| 80 | 0.449 | 14.167 | 82.097 | ||
| This Year | Sancak and Ozyurt (This Study) | ||||
| 80 | 0.506 | 4.440 | 25.313 |
*In the study, coarse aggregate was used, not fine.
Table 25.
Derived equations and proposed developed models for the connection between modulus of elasticity and compressive strength.
Table 25.
Derived equations and proposed developed models for the connection between modulus of elasticity and compressive strength.
| Type of Data | Type of Curve | Proposed Model | Data Point | R2 | MABE | MAPE |
|---|---|---|---|---|---|---|
| Experimental Data of This Study | Power | 3 | 0.953 | 0.500 | 2.033 | |
| Linear | 3 | 0.959 | 0.465 | 1.909 | ||
| Volume Substitution Data | Power | 71 | 0.449 | 4.188 | 18.611 | |
| Linear | 71 | 0.442 | 4.295 | 19.761 | ||
| Weight Substitution Data | Power | 9 | 0.718 | 2.171 | 11.215 | |
| Linear | 9 | 0.727 | 2.118 | 11.901 | ||
| All Data | Power | 80 | 0.431 | 4.020 | 18.289 | |
| Linear | 80 | 0.426 | 4.136 | 19.424 |
Table 26.
Suggested models and their performances for the connection between modulus of elasticity and compressive strength.
Table 26.
Suggested models and their performances for the connection between modulus of elasticity and compressive strength.
| Year | Reference | Data Point | R2 | MABE | MAPE |
|---|---|---|---|---|---|
| 2010 | Hannawi et al. [48] | ||||
| 80 | 0.426 | 4.464 | 20.814 | ||
| 2017 | Mohammed [46] | ||||
| 80 | 0.426 | 5.138 | 24.434 | ||
| 80 | 0.417 | 7.282 | 33.516 | ||
| 2022 | Alqahtani [47]* | ||||
| 80 | 0.297 | 15.101 | 69.878 | ||
| This Year | Sancak and Ozyurt (This Study) | ||||
| 80 | 0.431 | 4.020 | 18.289 | ||
| 80 | 0.426 | 4.136 | 19.424 |
*In the study, coarse aggregate was used, not fine.
Table 27.
FRP-confined concrete sample results and FRP properties.
| Sample Name | D (cm) | H (cm) | (MPa) |
(%) |
(MPa) | (GPa) |
(%) |
(mm) | (MPa) |
(%) |
(%) | |
| CS-PET-CFRP-10 | 10 | 20 | 25.11 | 0.2023 | 3000 | 230 | 1.3043 | 0.17 | 47.86 | 1.3819 | 0.8538 | 0.655 |
| CS-PET-GFRP-10 | 10 | 20 | 25.11 | 0.2023 | 1500 | 80 | 1.8750 | 0.15 | 38.66 | 1.4469 | 1.0028 | 0.535 |
Table 28.
Performance of FRP-confined concrete models for compressive strength.
| Year | Reference | Data Point | MABE | MAPE |
|---|---|---|---|---|
| 2004 | Ilki et al. [49] | |||
| 2 | 10.196 | 23.774 | ||
| 2010 | Benzaid et al. [50] | |||
| 2 | 8.158 | 19.098 | ||
| 2014 | Faustino et al. [51] | |||
| 2 | 6.694 | 14.190 | ||
| 2019 | Pimanmas et al. [52] | |||
| 2 | 3.949 | 8.264 | ||
| This Year | Sancak and Ozyurt (This Study) | |||
| 2 | 3.220 | 7.906 |
Table 29.
Performance of FRP-confined concrete models for ultimate axial strain.
| Year | Reference | Data Point | MABE | MAPE |
|---|---|---|---|---|
| 2004 | Ilki et al. [49] | |||
| 2 | 0.771 | 55.216 | ||
| 2010 | Benzaid et al. [50] | |||
| 2 | 0.732 | 51.495 | ||
| 2014 | Faustino et al. [51] | |||
| 2 | 0.656 | 45.831 | ||
| 2019 | Pimanmas et al. [52] | |||
| 2 | 0.613 | 43.065 | ||
| This Year | Sancak and Ozyurt (This Study) | |||
| 2 | 0.493 | 34.518 |
Disclaimer/Publisher’s Note: The statements, opinions and data contained in all publications are solely those of the individual author(s) and contributor(s) and not of MDPI and/or the editor(s). MDPI and/or the editor(s) disclaim responsibility for any injury to people or property resulting from any ideas, methods, instructions or products referred to in the content. |
© 2024 by the authors. Licensee MDPI, Basel, Switzerland. This article is an open access article distributed under the terms and conditions of the Creative Commons Attribution (CC BY) license (http://creativecommons.org/licenses/by/4.0/).
Copyright: This open access article is published under a Creative Commons CC BY 4.0 license, which permit the free download, distribution, and reuse, provided that the author and preprint are cited in any reuse.


