
Submitted:
30 November 2024
Posted:
02 December 2024
You are already at the latest version
Abstract
This study investigates the behavior of heavy oil reservoirs under varying oil saturation conditions through laboratory-scale in-situ combustion (ISC) physical simulation experiments. The research focuses on the propagation stability of the combustion front and key parameters influencing the fire flooding process, with a systematic examination of crude oil composition changes and upgrading mechanisms during ISC. By employing gas chromatography (GC) and infrared spectroscopy (IR) analyses, the study evaluates the transformation of saturated hydrocarbons, aromatic hydrocarbons, resins, and asphaltenes in the produced oil before and after ISC.The results demonstrate that oil saturation plays a critical role in determining combustion efficiency, cracking dynamics, and upgrading performance. At high oil saturation (65%), combustion reactions are vigorous, yielding enhanced cracking efficiency, a significant increase in light hydrocarbon content, and effective conversion of heavy components, achieving optimal upgrading outcomes. Conversely, at low oil saturation (30%), cracking efficiency is reduced, light hydrocarbons are lost, and heavy components, including asphaltenes and polycyclic aromatic hydrocarbons, accumulate, resulting in less effective upgrading. Nonetheless, ignition and stable combustion are achievable even at low oil saturation levels.This study offers strategies to optimize ISC operations tailored to different oil saturation conditions, providing valuable insights for improving combustion efficiency and enhancing the quality of produced oil in heavy oil reservoirs.
Keywords:
In-situ combustion (ISC)
; Oil saturation
; Heavy oil
; Combustion reaction
; Pyrolysis process
Introduction
Heavy oil is a significant component of global petroleum resources, accounting for approximately 70% of the world's total oil reserves, and holds a strategic position in the global energy supply [1]. Compared to light crude oil, heavy oil is characterized by high viscosity, high density, and high asphaltenes content, which result in poor mobility and increased difficulty in recovery. Conventional extraction methods struggle to effectively enhance the recovery rate of heavy oil. Against the backdrop of the global energy transition toward low-carbon and high-efficiency solutions, the efficient development of heavy oil resources has become a key challenge for the petroleum industry.
As a thermal recovery technique, in-situ combustion (ISC) involves the injection of air and ignition within the reservoir, utilizing the heat and high temperatures generated by crude oil combustion to reduce reservoir viscosity and improve the mobility and recoverability of heavy oil. ISC not only achieves energy self-circulation but also reduces the demand for external energy input, providing superior economic and energy utilization efficiency [2]. Consequently, ISC is widely regarded as an important method for heavy oil recovery, especially in low-permeability and deep heavy oil reservoirs, where it demonstrates immense application potential [3,4].
Oil saturation is a critical parameter for characterizing reservoir properties, directly reflecting the proportion and distribution of oil phases in the reservoir. It determines the reservoir's energy storage capacity and permeability while profoundly influencing the dynamics of heat transfer, oxidation reactions, and production performance during ISC [5]. Previous studies have shown significant differences in temperature distribution, oxidation reaction rates, and gas-liquid production characteristics in reservoirs under different oil saturation conditions [6]. However, quantitative and systematic studies on the impact of oil saturation on ISC processes remain limited, particularly regarding the coupling mechanisms of multiphase flow and thermodynamic properties in reservoirs [7].
A comprehensive investigation into the dynamic behavior of ISC under varying oil saturation conditions is crucial for optimizing ISC development strategies and improving heavy oil recovery rates. Furthermore, understanding the relationship between heavy oil oxidation characteristics and ISC efficiency can provide theoretical insights and technical guidance for selecting and optimizing thermal recovery techniques under complex reservoir conditions [8]. Therefore, this study aims to systematically analyze the dynamic changes in thermal fluid behavior, oxidation reactions, and production performance during ISC under different oil saturation conditions, providing a scientific foundation for the efficient development of heavy oil reservoirs.
The research and application of ISC began in the mid-20th century, with extensive exploration by the international academic and industrial communities. In terms of ISC mechanisms, Prats and colleagues first systematically elucidated the fundamental reaction mechanisms of heavy oil oxidation and proposed two primary oxidation modes during ISC: low-temperature oxidation (LTO) and high-temperature oxidation (HTO) [9]. LTO primarily occurs at the combustion front, generating heat and light hydrocarbons that promote oil and gas flow, while HTO involves complete hydrocarbon combustion, producing significant thermal energy to sustain the combustion process [10]. In recent years, advances in numerical simulation and experimental techniques have provided strong support for in-depth studies of ISC behavior. For instance, Coats’ multiphase flow and chemical reaction models have significantly enhanced the accuracy of ISC simulations [11].
In China, the growing demand for heavy oil resource development has driven extensive research into ISC techniques by academic and industrial institutions. Research groups such as China University of Petroleum have utilized laboratory experiments and numerical simulations to identify key influencing factors in the ISC process and proposed optimized ISC strategies tailored to Chinese reservoir conditions [12]. Additionally, field applications in projects like the Liaohe Oilfield have demonstrated the significant effectiveness of ISC in enhancing heavy oil recovery [13,14,15]. However, the specific impact of oil saturation on ISC efficiency and production characteristics, particularly under complex reservoir conditions, remains an area requiring further exploration.
1. Experimental Section
1.1. Experimental Instruments and Apparatus
The experimental instruments included the HAAKE RS6000 rheometer (HAAKE, Germany), which operates within a temperature range of -60°C to 200°C and a rotational speed range of 0–1500 r/min, capable of measuring the viscosity of low-viscosity fluids to thickened samples. Other instruments included the iS10 Fourier transform infrared (FTIR) spectrometer (PerkinElmer, USA), 7890A gas chromatograph (Agilent, USA), KNAUER K-7000 gel permeation molecular weight analyzer (KNAUER, Germany), and the 7890A-5975C gas chromatograph-mass spectrometer (GC-MS) (Agilent, USA). Additionally, a flue gas analyzer (Wuhan Tianyu Zhikong Technology Co., Ltd., China) and an elemental analyzer (Elementar, Germany) were employed. The compositional analysis of crude oil fractions was performed following the Chinese standard SY/T5119-1995 using silica gel and alumina as adsorbents [16].
The experimental apparatus consisted of a one-dimensional (1D) combustion tube experimental setup, developed by Northeast Petroleum University. The combustion tube physical simulation system primarily included an air injection system, ignition system, model body, data acquisition system, and a liquid-gas separation and recovery system. A schematic of the 1D combustion tube experimental apparatus is shown in Figure 1.
The dimensions of the model body were 100 cm × 6.4 cm, with a maximum operating pressure of 20 MPa and a maximum operating temperature of 1000°C. The model was equipped with 16 axial thermocouples to monitor temperature changes under various experimental conditions. Additionally, five pressure sensors were symmetrically positioned relative to the temperature measurement points to measure pressure changes during the combustion process.
The data acquisition and control system included the following components: Temperature sensors for real-time monitoring and recording of the temperature field during combustion. Pressure sensors to measure pressure variations across different sections of the combustion tube in real time. Gas flow meters for recording the injected air volume and the produced flue gas volume. Data receivers, where experimental data were collected in real time by specialized software.
1.2. Experimental Materials
The sample used in the experiment was degassed and dehydrated heavy oil sourced from a specific block in the Daqing Oilfield. The basic parameters of the sample are shown in Table 1.
To simulate the characteristics of the reservoir rock, quartz sand with grain sizes matching the particle distribution of reservoir core samples was used. The selected grain sizes were 40–70 mesh, 70–140 mesh, and 140–200 mesh.
For preparing simulated formation water, the following procedure was followed:Weighed 35.0 g of calcium chloride (CaCl2), 25.0 g of magnesium chloride (MgCl2), and 190.0 g of sodium chloride (NaCl).
Transferred the salts into a 500 mL beaker and dissolved them using distilled water.The solution was then transferred to a volumetric flask and diluted with distilled water to a final volume of 1000 mL.
1.3. Experimental Procedure
- (1)
- Preparation of the Sand Pack and Core Tube
Quartz sand with grain sizes similar to reservoir characteristics and capable of reflecting the physical properties of underground reservoir cores was used. Sands of different mesh sizes (40–70, 70–140, and 140–200 mesh) were mixed in specific volume ratios to ensure uniformity.The mixed sand was packed into the core tube, compacted, and sealed.The permeability of the model tube was measured using a gas permeability meter.
The core tube was vacuumed and connected to pre-weighed water. After a set time, the mass of the water was re-measured to calculate the pore volume of the model tube.
Using an ISCO pump, experimental crude oil was injected at a low speed to saturate the core tube. The volume of displaced water was measured to determine the saturated oil volume and calculate the oil saturation of the core tube. For water flooding experiments, the oil saturation of the core tube was adjusted to the target value, and a small amount of crude oil was injected at the ignition point to assist ignition, completing the experimental preparation.
The core tube was sealed and tested for air tightness.An air compressor was started, and 0.1 MPa of air was injected into the pressure vessel continuously for 10 minutes to verify the airtightness of the buffer tank.
- (2)
- Seal and Air Tightness Testing
- (3)
- Temperature System Calibration
- (4)
- Ignition and Air Injection
- (5)
- Cooling
The temperature acquisition system was adjusted, and the initial temperature field of the model was established.
The ignition system and air injection system were activated.
The ignition temperature was set to 500°C, and the in-situ combustion physical simulation experiment was conducted.
After combustion ended, ventilation continued to cool the model to room temperature.
1.4. Analytical Testing Methods
- (1)
- Group Composition Analysis of Crude Oil
The group composition of crude oil was analyzed following the Chinese standard SY/T5119-1995: Column Chromatography Analysis Methods for Rock Soluble Organic Matter and Crude Oil Group Components. Silica gel and alumina were used as adsorbents. Different polarity solvents were employed to successively elute the saturated hydrocarbons, aromatics, and non-hydrocarbon fractions. Solvents were then evaporated, and the residues were weighed to determine the content of each component in the sample.
- (2)
- Gas Chromatography Analysis
Once the instrument was stabilized, 0.2–1.0 μL of the sample (heated to no more than 50°C if necessary and diluted with an equal volume of CS₂ solvent) was drawn using a microsyringe and injected into the gas chromatograph. The program was started to initiate temperature programming and chromatographic analysis. Chromatograms and raw data were recorded.
- (3)
- Fourier Transform Infrared (FTIR) Analysis
Approximately 1 mg of crude oil sample was mixed thoroughly with 100 mg of spectrally pure KBr powder under dry conditions. The mixture was ground uniformly using an agate mortar and transferred to a mold. It was compressed under a pressure of 10 t/cm² for 5 minutes using a hydraulic press to form a transparent thin film, which was then used for infrared analysis.
- (4)
- Gas Chromatography-Mass Spectrometry (GC-MS) Analysis
GC-MS analysis of crude oil was performed according to GB/T 18606-2017: Determination of Biomarkers in Sediments and Crude Oil by Gas Chromatography-Mass Spectrometry (GC-MS). Saturated hydrocarbon and aromatic hydrocarbon fractions prepared from crude oil were separated by gas chromatography and analyzed by mass spectrometry. The data processing system generated the required total ion chromatogram (TIC), mass chromatogram, and mass spectrum for quantitative analysis.
2. Experimental Results and Analysis
2.1. Evaluation of Combustion Stability Before and After In-Situ Combustion
2.1.1. Determination of Threshold Temperature
The threshold temperature is defined as the minimum ignition temperature that enables oil sands to ignite within 1 hour under continuous and constant air injection conditions. It is a critical parameter for designing the heater power and heating time during the ignition phase of field in-situ combustion (ISC) trials.
In this study, a series of temperature points in the middle section of the model were selected for data analysis. The relationship between temperature and time was plotted, along with the corresponding relationship between the rate of temperature change and time. Figure 2 presents the threshold temperature determination curve for crude oil in the ISC process.
This threshold temperature provides vital information for understanding the ignition behavior of the oil sands and optimizing the design of field combustion operations.
As shown in Figure 2, prior to the ignition of the oil sands, heat transfer primarily occurs through thermal conduction, resulting in relatively stable and slow temperature changes in the oil sands. Once the oil sands ignite, the combustion process generates a significant amount of heat, with the combustion front releasing large amounts of thermal energy. This leads to a rapid rise in temperature, with the rate of temperature increase accelerating sharply. As the combustion front advances, the temperature begins to decrease.
The moment of ignition is characterized by a peak in the rate of temperature change. On the corresponding temperature-time curve, this peak is used to determine the threshold temperature. For crude oil in the in-situ combustion process, the threshold temperature was determined to be 438°C.
2.1.2. Temperature Field Characteristics Under Different Oil Saturation Levels
Sixteen thermocouples were evenly distributed along the one-dimensional combustion tube model, and the temperature acquisition system recorded the temperature at each monitoring point along the combustion tube from ignition to the end of combustion. The temperature field distribution is shown in Figure 3 - Figure 5.
Ignition began near the igniter, with air continuously injected to maintain heating. The combustion front gradually advanced toward the production well at a slow pace. These temperature distributions provide insights into the thermal behavior and progression of the combustion front under varying oil saturation levels.
From Figure 3-Figure 5, it can be observed that as the oil saturation increases, the local advancement rate of the combustion front initially decreases and then increases. On one hand, the presence of a high-saturation oil wall can affect the combustion front's progression speed. On the other hand, higher oil saturation means more fuel deposition, which can promote the forward movement of the combustion front. Overall, the higher the oil saturation, the slower the combustion front advances. Specifically, the combustion front advancement speed was 0.56 cm/min at an oil saturation of 30%, 0.48 cm/min at 50%, and 0.19 cm/min at 65%. High oil saturation results in a longer combustion duration, with the combustion front advancing faster in the later stages of the process, exhibiting stable combustion effects and thorough reactions.
The temperature gradient maps reveal that the instability of the combustion front advancement increases as oil saturation decreases. With lower oil saturation, the time taken for the combustion front to reach high-temperature regions is significantly delayed. In the maps, the red high-temperature zone marking the combustion front shifts noticeably backward under low oil saturation conditions. This indicates a slower advancement of the combustion front and reduced combustion reaction intensity, leading to a decline in fire flooding efficiency.
The transition between high-temperature and low-temperature regions becomes increasingly uneven. At higher oil saturation levels, the temperature distribution before and after the combustion front is more continuous, and the combustion reaction is more stable. Conversely, at lower saturation levels, the temperature distribution around the combustion front becomes more scattered. This could be attributed to insufficient fuel supply and incomplete localized combustion reactions, which reduce the efficiency of heat transfer.
Under low oil saturation conditions, the temperature field exhibits significant asymmetry in its expansion, indicating diminished combustion uniformity and more localized advancement of the combustion front. This asymmetry may result from the uneven distribution of combustible material after the reduction in oil content.
2.1.3. Composition of Flue Gas in the One-Dimensional Combustion Tube
During the experiment, a flue gas analyzer was used to monitor the concentrations of CO, CO2, and O2 in the produced flue gas in real time, generating curves of flue gas composition versus time, as shown in Figure 6. When the combustion front formed, the O2 concentration dropped from 21% to approximately 5%, while CO and CO2 concentrations increased rapidly to around 8% and 13%, respectively.
From Figure 6, it can be observed that as the experiment progresses and the combustion front advances, oxygen is consumed while CO2 and CO are produced. When oxygen consumption is at its peak, a large amount of CO2 is generated along with a smaller amount of CO.
By comparing the temperature field distribution, it can be seen that when the combustion front reaches a specific temperature monitoring point, peaks in oxygen consumption and CO2 concentration occur simultaneously. This indicates the most intense phase of the combustion reaction.
Both the temperature data and gas composition analysis confirm that crude oil combustion is taking place at this stage. These observations validate the correlation between the combustion front progression and the reaction dynamics.

Table 3.
Basic parameters of fireflood for different oil saturations.
| Serial number | Basic parameters of fireflood experiment | Value | ||
| Oil saturation 65% |
Oil saturation 50% |
Oil saturation 30% |
||
| 1 | H/C atomic ratio | 1.34 | 1.36 | 1.39 |
| 2 | Fuel Consumption/(kg·m-3) | 18.07 | 2120 | 39.80 |
| 3 | Air Consumption/L | 268.71 | 228.20 | 527.20 |
| 4 | Fuel Consumption Rate/% | 10.84 | 12.01 | 17.26 |
| 5 | Stage air-to-oil ratio AORs(m3·t-1) | 1809.07 | 1468.81 | 2763.87 |
| 6 | Fire Front Propagation Speed (cm/min) | 0.19 | 0.48 | 0.56 |
| 7 | Oxygen Utilization Efficiency(%) | 69.26 | 95.54 | 95.54 |
| 8 | Oil Displacement Efficiency/% | 89.16 | 87.99 | 82.74 |
When the oil saturation of the reservoir is 65%, the apparent H/C atomic ratio reaches its minimum, the combustion front advances slowly, and the oil recovery efficiency is at its highest. As the oil saturation decreases, the temperature gradient maps reveal increased instability in the combustion front's progression. At an oil saturation of 30%, ignition can still be successfully achieved, and the combustion front propagates smoothly through the combustion tube, ultimately achieving a Oil displacement efficiency of 82.74%.
At high oil saturation levels (65%), fire flooding exhibits high combustion efficiency, with lower fuel and air consumption, and higher oil recovery efficiency. When the oil saturation decreases to 30%, the combustion process requires higher fuel and air inputs, and the advancement rate of the combustion front slows significantly. The notable increase in the air-oil ratio (AOR) and the slowdown in the combustion front reflect the increased difficulty in maintaining a stable combustion front under low oil saturation conditions, which can result in unstable combustion reactions. The decline in oil recovery efficiency suggests reduced mobilization of crude oil in low-saturation reservoirs. Although oxygen utilization improves at lower oil saturation levels, the reduced recovery efficiency indicates that the combustion reactions do not fully convert into effective reservoir displacement.
As oil saturation decreases, the amount of fuel available for fire flooding is reduced, directly affecting the heat supply required for the combustion front to advance, thereby slowing its progression. Under low saturation conditions, gas-liquid contact efficiency decreases, and oxygen cannot fully react with the available fuel, resulting in incomplete combustion. Additionally, the diminished heat source under low oil saturation conditions can lead to heat losses through conduction or convection, reducing the thermal stability of the combustion front. These factors collectively contribute to less efficient and less stable fire flooding performance in low oil saturation reservoirs.
2.2. Analysis of Crude Oil Properties Before and After Fire Flooding
2.2.1. Analysis of Density, Molecular Weight, and Group Composition
The density, molecular weight, and group composition of the original crude oil sample and the fire flooding-produced oil were analyzed. The results are presented in Table 4.
From Table 4, it is evident that the density of crude oil slightly increases after fire flooding as oil saturation decreases. This is due to the more significant volatilization and cracking of light components under low saturation conditions during the fire flooding process, leading to an increase in the relative density of the residual oil. As oil saturation decreases, combustion conditions favor cracking reactions, resulting in the generation of more light hydrocarbons. The fire flooding process induces cracking of heavy components, producing a greater quantity of low-molecular-weight compounds.
The asphaltenes content increases significantly with decreasing oil saturation, rising from 22.76% to 25.47%. At lower saturations, the reduction in combustible light components in the crude oil causes an increased proportion of asphaltenes in the residual oil. Saturates are prone to cracking and combustion during fire flooding, especially under low saturation conditions, where their content in residual oil decreases significantly. Part of the cracked saturates generates aromatics, and due to the high thermal stability of aromatics, more of them remain post-fire flooding. The proportion of aromatics in the cracking products increases, leading to a higher content of aromatics in the produced oil. Additionally, the cracking of some heavy components (such as asphaltenes and macromolecular compounds) produces more resins.
The cracking reactions during fire flooding reduce molecular weight and saturate content while generating more light aromatic hydrocarbons, indicating effective lightening of the crude oil. However, under low oil saturation conditions, while light components are generated, the relative proportions of asphaltenes and resins increase, making the overall produced oil heavier. At high oil saturation, more saturates and light components participate in combustion, resulting in produced oil with lower density and higher quality. Under low saturation conditions, the relative concentration of heavy components leads to increased crude oil density and proportions of heavy components (asphaltenes and resins). While fire flooding effectively promotes the cracking of saturates and the generation of aromatics, enhancing crude oil fluidity and the proportion of light components, the enrichment of heavy components at low saturation is unfavorable for further extraction and processing.
2.2.2. Viscosity Analysis
The viscosity-temperature performance of the original crude oil sample and the produced oil under different oil saturations after fire flooding was tested using the HAARKE RS6000 rheometer. The results are shown in Figure 7.
From Figure 7, it can be observed that the viscosity of the produced oil at 30% oil saturation is 1435 mPa·s(50°C), at 50% oil saturation is 2227 mPa·s(50°C), and at 65% oil saturation is 106.9 mPa·s(50°C). The viscosity of the produced oil at 30% oil saturation exceeds that of crude oil after 45°C, while the viscosity of the produced oil at 50% oil saturation surpasses crude oil after 50°C. For produced oil at 65% oil saturation, fire flooding significantly reduces viscosity, improving crude oil fluidity.
Lower oil saturation leads to stronger sensitivity of viscosity to temperature, as indicated by the steeper curves. This is due to the higher proportion of heavy components, which are more sensitive to temperature changes.
2.2.3. Total Hydrocarbon Analysis
The total hydrocarbon chromatographic analysis is an important method widely used for characterizing the composition of crude oil. Through a comparative analysis of total hydrocarbon chromatograms, it is possible to reveal the compositional changes and alteration effects on the produced oil during the fire-flooding process, especially in terms of the variations in light and heavy hydrocarbons before and after fire flooding under different oil saturation conditions. This analysis provides valuable insights for optimizing the fire-flooding process. Figure 8 shows the comparison of total hydrocarbon chromatograms of crude oil before and after fire flooding under different oil saturation conditions.
Total hydrocarbon chromatography is a widely used method for characterizing crude oil composition. By comparing total hydrocarbon chromatograms, the effects of the fire flooding process on crude oil composition can be elucidated, particularly the changes in light and heavy hydrocarbons before and after fire flooding under different oil saturation conditions. This provides critical insights for optimizing fire flooding techniques.
From Figure 8, it can be observed that the main carbon peak of the crude oil shifts forward after fire flooding. Specifically, the main carbon peak of the crude oil, originally at C30, shifts to C20, C13, and C9, respectively, under different oil saturation conditions. The proportion of light components increases significantly. The light-to-heavy hydrocarbon ratio of the original crude oil was 0.22, which increased after high-temperature oxidation during fire flooding to 25.75, 15.44, and 4.01, respectively.
From Figure 9, the comparison of hydrocarbon carbon number distribution before and after fire flooding reveals that hydrocarbons with carbon numbers below 20 significantly increase after fire flooding. The main carbon peak shifts forward, and for oil saturations between 30% and 65%, the light-to-heavy hydrocarbon ratios are 25.75, 15.44, and 4.01, respectively.
At an oil saturation of 30%, the main carbon peak shifts forward the most, indicating the greatest increase in light components and the highest light-to-heavy ratio, resulting in the best crude oil upgrading effect.
The fire flooding reaction, driven by thermal cracking and partial oxidation, converts heavy hydrocarbons into intermediate and light hydrocarbons. This upgrading effect is more pronounced at higher oil saturations. Conversely, at low oil saturation levels, insufficient cracking and losses of light hydrocarbons lead to a less effective upgrading process. While high oil saturation favors the generation and retention of light hydrocarbons, low oil saturation intensifies light hydrocarbon losses (via volatilization and combustion), causing heavy components such as asphaltenes and resins to accumulate due to incomplete cracking. The lack of light hydrocarbons reduces the efficiency of cracking reactions, limiting the production of additional light hydrocarbons.
2.2.4. Infrared Spectroscopy Analysis
The infrared spectrum of different frequencies and intensities can reflect the structure and relative content of different molecular functional groups. The iS10 infrared spectrometer was used to analyze the infrared spectra of both the raw oil sample and the produced oil. Since it is difficult to maintain consistent sample film concentrations during actual measurements, the method of comparing the intensity ratio of functional group absorptions—specifically the oxygen content index (A1700/A1600)—was adopted to describe the degree of oxidation of crude oil during the fire-flooding process. The absorption peak at 1600 cm⁻¹ corresponds to the vibration of the C=C double bond in the aromatic ring, representing the skeletal vibrations of aromatic hydrocarbons. The absorption peak at 1700 cm⁻¹ is associated with the stretching vibration of the carbonyl group (-C=O), which is characteristic of functional groups such as esters, ketones, and carboxylic acids. Figure 10 illustrate the infrared spectra of crude oil before and after fire flooding under different oil saturation conditions and the impact of oil saturation on the infrared absorbance of crude oil before and after fire flooding. Figure 11 Comparison of A1700 / A1600 characteristics of fire-flooded produced oil under different oil saturation conditions and crude oil.
From Figure 11, The infrared spectra of the fire-flooded produced oil under different oil saturation conditions are compared with the original crude oil before the fire-flooding process. The A1700 / A1600 value is used to quantify the extent of oxidation that has occurred. An increase in this ratio indicates a higher degree of oxidation, which may result from the high-temperature conditions during the fire-flooding process, leading to the formation of carbonyl-containing functional groups (e.g., aldehydes, ketones, and acids). Conversely, a lower ratio suggests less oxidation. A comparison of absorbance indicates that at an oil saturation of 65%, the oxygen content parameters of crude oil increase after fire flooding, with a notable rise in oxides and peroxides. This implies that crude oil contains the highest concentration of carbonyl-containing functional groups under these conditions.
2.2.5. GC-MS Analysis
To further elucidate the upgrading effects of fire flooding on crude oil under different oil saturation conditions and describe the combustion state of crude oil during the process, GC-MS analysis was performed on the saturated and aromatic hydrocarbons in the produced oil. The results before and after fire flooding are shown in Figure 12.
It can be seen from Figure 12 that the alkane content significantly decreases after fire flooding, while the content of cycloalkanes increases. Aromatic hydrocarbon content increases only at an oil saturation of 65%, with both mono- and di-aromatic hydrocarbons showing higher concentrations. This indicates that fire flooding transforms crude oil composition from alkanes to cycloalkanes and low-ring aromatics. At an oil saturation of 30%, the total amount of alkanes in the produced oil is the highest.
In the high-temperature combustion environment, saturated hydrocarbons are prone to thermal cracking and oxidation, producing gaseous products (e.g., CO2, CO, H2O) or converting into aromatic hydrocarbons. Under low oil saturation conditions, the lower proportion of light hydrocarbons leads to more significant cracking and loss of saturated hydrocarbons.
The proportion of aromatic hydrocarbons increases after fire flooding, with the increase being more pronounced as oil saturation decreases. Saturated hydrocarbons crack to form aromatic hydrocarbons, which have higher thermal stability and are less likely to participate in combustion reactions, leading to their enrichment after fire flooding. The proportions of mono-aromatic hydrocarbons (e.g., benzene derivatives) and low-carbon polycyclic aromatic hydrocarbons increase, indicating that saturated hydrocarbons have been converted into more stable aromatic hydrocarbons.
At low oil saturation, the lightening process through cracking is limited, resulting in a significant increase in the relative proportion of aromatic hydrocarbons. After fire flooding, the proportions of polycyclic aromatic hydrocarbons (e.g., phenanthrene, pyrene, and other high-carbon aromatics) increase. This suggests that light aromatic hydrocarbons are partially consumed in combustion or cracking, while heavy aromatic hydrocarbons, due to their high thermal stability, are retained.
3. Combustion Mechanisms Under Different Oil Saturation Conditions During In-Situ Combustion (ISC)
3.1. High Oil Saturation (65%)
(1) At high oil saturation, the crude oil contains a significant proportion of light hydrocarbons (<C10) and intermediate hydrocarbons (C11-C20).The combustion reaction at the combustion front is intense, with light hydrocarbons and some saturated hydrocarbons actively participating in the reaction, releasing significant heat. This heat further induces the cracking of heavy components.
(2) The high-temperature zone at the combustion front triggers the cracking of medium and heavy hydrocarbons (C21+), forming lighter components such as saturated hydrocarbons and monocyclic aromatics.Heavy components such as asphaltenes and resins are effectively degraded through thermal cracking, reducing the proportion of heavy fractions in the residual oil.
(3) A well-balanced interaction between cracking and combustion reactions is achieved under high saturation conditions.Produced oil shows an increased proportion of light hydrocarbons (<C10) and monocyclic aromatics (C11-C15), enhancing crude oil mobility and quality.Heavy component concentration is minimal, resulting in optimal upgrading performance.
3.2. Medium Oil Saturation (50%)
(1) At medium oil saturation, the proportion of light hydrocarbons decreases, leading to a relatively stable combustion reaction.Some light hydrocarbons participate in combustion to provide heat, but combustion efficiency is slightly lower than under high saturation.The generated heat is sufficient to sustain the propagation of the combustion front, although the high-temperature zone is less uniformly distributed.
(2) Cracking efficiency declines, with lower production of light hydrocarbons (<C10).A higher proportion of intermediate hydrocarbons (C16-C20) and bicyclic aromatics is observed.The ability to degrade heavy components such as asphaltenes and resins weakens, leaving some heavy components in the residual oil.
(3) The upgrading effect is less pronounced compared to high oil saturation.Produced oil has a reduced proportion of light hydrocarbons, with an increased fraction of aromatic compounds (especially bicyclic and tricyclic aromatics).Heavy component concentration begins to emerge, reducing oil mobility and processing performance.
3.3. Low Oil Saturation (30%)
(1) Under low oil saturation, the proportion of light hydrocarbons is significantly reduced, resulting in weaker combustion reactions.
The generated heat is insufficient to sustain high-temperature cracking, slowing the advance of the combustion front.
Light hydrocarbons are nearly depleted, and the thermal effect in the high-temperature zone relies primarily on limited intermediate hydrocarbons.
(2) Cracking reactions are severely restricted, and heavy components (e.g., asphaltenes and resins) are not fully degraded. The proportion of intermediate hydrocarbons is low, and the loss of light components further exacerbates the issue. Residual oil exhibits a significant increase in polycyclic aromatic hydrocarbons (e.g., phenanthrene and pyrene), indicating insufficient cracking of heavy components [18,19].
(3) Upgrading performance is at its worst under low saturation conditions. Inadequate cracking and combustion lead to a minimal proportion of light hydrocarbons in the produced oil.Residual oil shows a concentration of heavy components (>C35), characterized by poor mobility and increased processing challenges.
Figure 13 Distribution of reservoir zones during the high temperature combustion oil displacement process.
It can be seen from Figure 13 that the distribution of reservoir zones and key parameters during the high-temperature in-situ combustion (ISC) oil displacement process, including the burnt zone, combustion front, coke zone, oil bank, and remaining oil zone. It also shows the variation of critical parameters such as oxygen saturation, oil and water saturation, pressure, temperature, and pressure gradient across these zones. Decreases significantly in the burnt zone and coke zone as the oil is consumed or transformed. Peaks in the oil bank and then gradually decreases in the remaining oil zone. It captures the complex mechanisms of oil combustion, thermal cracking, and displacement, illustrating how heat and pressure are utilized to mobilize and recover oil efficiently.
4. Conclusions
Conclusions from 1D Combustion Tube Experiments under Different Oil Saturation Conditions in Heavy Oil Reservoirs:
(1) By analyzing the temperature profiles at the combustion front, flue gas composition, and produced oil composition, the study determined the fundamental parameters of combustion under various oil saturations. It was found that ignition and stable combustion can still be achieved when the oil saturation is as low as 30%.
(2) At high oil saturation (65%), combustion is intense, with high cracking efficiency. Heavy components (resins and asphaltenes) are effectively converted into light hydrocarbons and aromatic compounds, resulting in significant lightening of the produced oil and optimal upgrading performance. At medium oil saturation (50%), cracking efficiency decreases. Some light hydrocarbons are lost due to combustion, and the proportion of intermediate components increases. Heavy components begin to concentrate. At low oil saturation (30%), combustion is insufficient, cracking efficiency is low, and heavy components accumulate in the residual oil. The content of polycyclic aromatic hydrocarbons and asphaltenes significantly increases, leading to poorer upgrading performance.
(3) The saturated hydrocarbon content decreases significantly after combustion, as light hydrocarbons primarily participate in combustion or volatilization. Aromatic hydrocarbon proportions increase, particularly with polycyclic aromatics under low oil saturation conditions. The content of resins and asphaltenes increases significantly as oil saturation decreases.
(4) Under high oil saturation, it is necessary to optimize the air injection rate to prevent excessive combustion of light components and enhance the proportion of light hydrocarbons in the produced oil. Under low oil saturation, measures such as increasing combustion intensity, introducing catalysts, or combining techniques like steam flooding or solvent injection can improve cracking efficiency and reduce the proportion of heavy components.
Data Availability Statement
The original contributions presented in this study are included in the article. Further inquiries can be directed to the corresponding author.
Acknowledgments
This work was supported by the Heilongjiang Provincial Natural Science Foundation of Joint Guidance Project (Grant No. LH2022E022).
References
- Liu, Z.; Wang, H.; Blackbourn, G.; Ma, F.; He, Z.; Wen, Z.; Wang, Z.; Yang, Z.; Luan, T.; Wu, Z. Heavy Oils and Oil Sands: Global Distribution and Resource Assessment. Acta Geol. Sin. - Engl. Ed. 2019, 93, 199–212. [Google Scholar] [CrossRef]
- Greaves, M. , Wilson, A., Al-Honi, M., & Lockett, A. D. (1996). Improved recovery of light/medium heavy oils in heterogeneous reservoirs using air injection insitu combustion (ISC). In SPE Western Regional Meeting ( SPE-35693).
- Liu, D.Z.; Wu, X.M. Research and Application for Fire Flood New Technologies in Liaohe Oilfield. Appl. Mech. Mater. 2015, 737, 878–881. [Google Scholar] [CrossRef]
- Cheih, C. State-of-the-Art Review of Fireflood Field Projects (includes associated papers 10901 and 10918 ). J. Pet. Technol. 1982, 34, 19–36. [Google Scholar] [CrossRef]
- Zhao,Q.H.,Liu,Q.C.,Cheng,H.Q.(2019). Experimental Study on Influence of Oil Saturation on Development Effect of In-situ Combustion. Journal of Xi’an Shiyou University(Natural Science Edition), 34(5):69-72.
- Yang, Y. , Peng, X. Q., Zhang, J. Z., & Hao, H. Y. (2021). Experimental research on the effect of residual oil saturation on fire flooding development in the late stage of steam injection. In Proceedings of the International Field Exploration and Development Conference 2020 (pp. 649-658). Springer Singapore. [Google Scholar]
- He, P.; Ghoniem, A.F. A sharp interface method for coupling multiphase flow, heat transfer and multicomponent mass transfer with interphase diffusion. J. Comput. Phys. 2017, 332, 316–332. [Google Scholar] [CrossRef]
- Li,Q., Yi, L.H., Tang, J.S., Guan, W.L., Jiang, Jiang, Y.W., Zheng, H.R., Zhou,J.N.,Wang, X.C., (2018). Mechanisms and influencing factors of the oil bank in fire flooding. Petroleum Exploration and Development, 45(3):491-498.
- Chen, Z. Y. , Niu, B. L., Tang, L. Z., Zhang, L., Huang, H. D., Ren, S. R. (2013). Experimental study of low temperature oxidation mechanism and activity of oil components. Journal of Fuel Chemistry and Technology. 41(11):1336-1342.
- Zhao, S.; Pu, W.; Varfolomeev, M.A.; Yuan, C.; Zhang, J.; Han, X.; Yang, Y.; Peng, X.; Wu, J. Comprehensive investigations into low temperature oxidation of heavy crude oil. J. Pet. Sci. Eng. 2018, 171, 835–842. [Google Scholar] [CrossRef]
- Shi,L., Xu, Q.,H. (2022). Fundamental studies of air injection for heavy crude oil recovery and its applications.Journal of Tsinghua University (Science and Technology), 62(4): 722-734.
- Yan, H.X. , Yang, J.Y., Jiang, W.R., J. I. A. N. G., Zhang, Y.F., Li., P.X. (2022). Function of aromatic compounds as indicators in laboratory experiments of heavy oil with fire flooding. Petroleum Geology & Experiment, 44(5):914-921.
- Cheng, H. Q. (2018). High-Temperature oxidation identification in fire-flooding. Special Oil & Gas Reservoirs, 25(128):135-139.
- Cheng, H. Q. , Zhao, Q. H., Liu, B. L., Wu, T., Peng, X. (2012). Physical simulation research on basic parameters of in- situ combustion for super heavy oil reservoirs. Special Oil & Gas Reservoirs,19(4):107-110.
- Wang,Y.J., He,J.C.,Liao,G.Z.,Wang,Z.M. (2012). Overview on the development history of combustion drive and its application prospect in China. Acta Petrolei Sinica, 33(5):909-914.
- SY/T5119-1995, The column chromatographic analysis method for soluble organic matter in rocks and crude oil fractions [S]. Beijing: China National Petroleum and Chemical Corporation, 1995.
- Zhao, F.; Zhu, G.; Li, G.; Jiang, Y.; Liu, L. Feasibility study on further enhanced oil recovery by ISC of remaining oil after polymer flooding. RSC Adv. 2022, 12, 18646–18653. [Google Scholar] [CrossRef] [PubMed]
- Wang, J. X. , Xu, G. R., & Fu, Z. J. (2008). LTO laboratory experiments and reservoir selection criteria of air injection. Pet. Geol. Recovery Effic, 15(1): 69-71.
- Li J,Mehta S A,Moore R G,etal.New insights into oxidation behaviours of crude oils[J].Journal of Canadian Petroleum Technology,2009,48(9):12-15.
- Xi, C.; Guan, W.; Jiang, Y.; Liang, J.; Zhou, Y.; Wu, J.; Wang, X.; Cheng, H.; Huang, J.; Wang, B. Numerical simulation of fire flooding for heavy oil reservoirs after steam injection: A case study on Block H1 of Xinjiang Oilfield, NW China. Pet. Explor. Dev. 2013, 40, 766–773. [Google Scholar] [CrossRef]
Figure 1.
Illustration of one-dimensional physical simulation experiment device for in situ combustion [17].
Figure 1.
Illustration of one-dimensional physical simulation experiment device for in situ combustion [17].
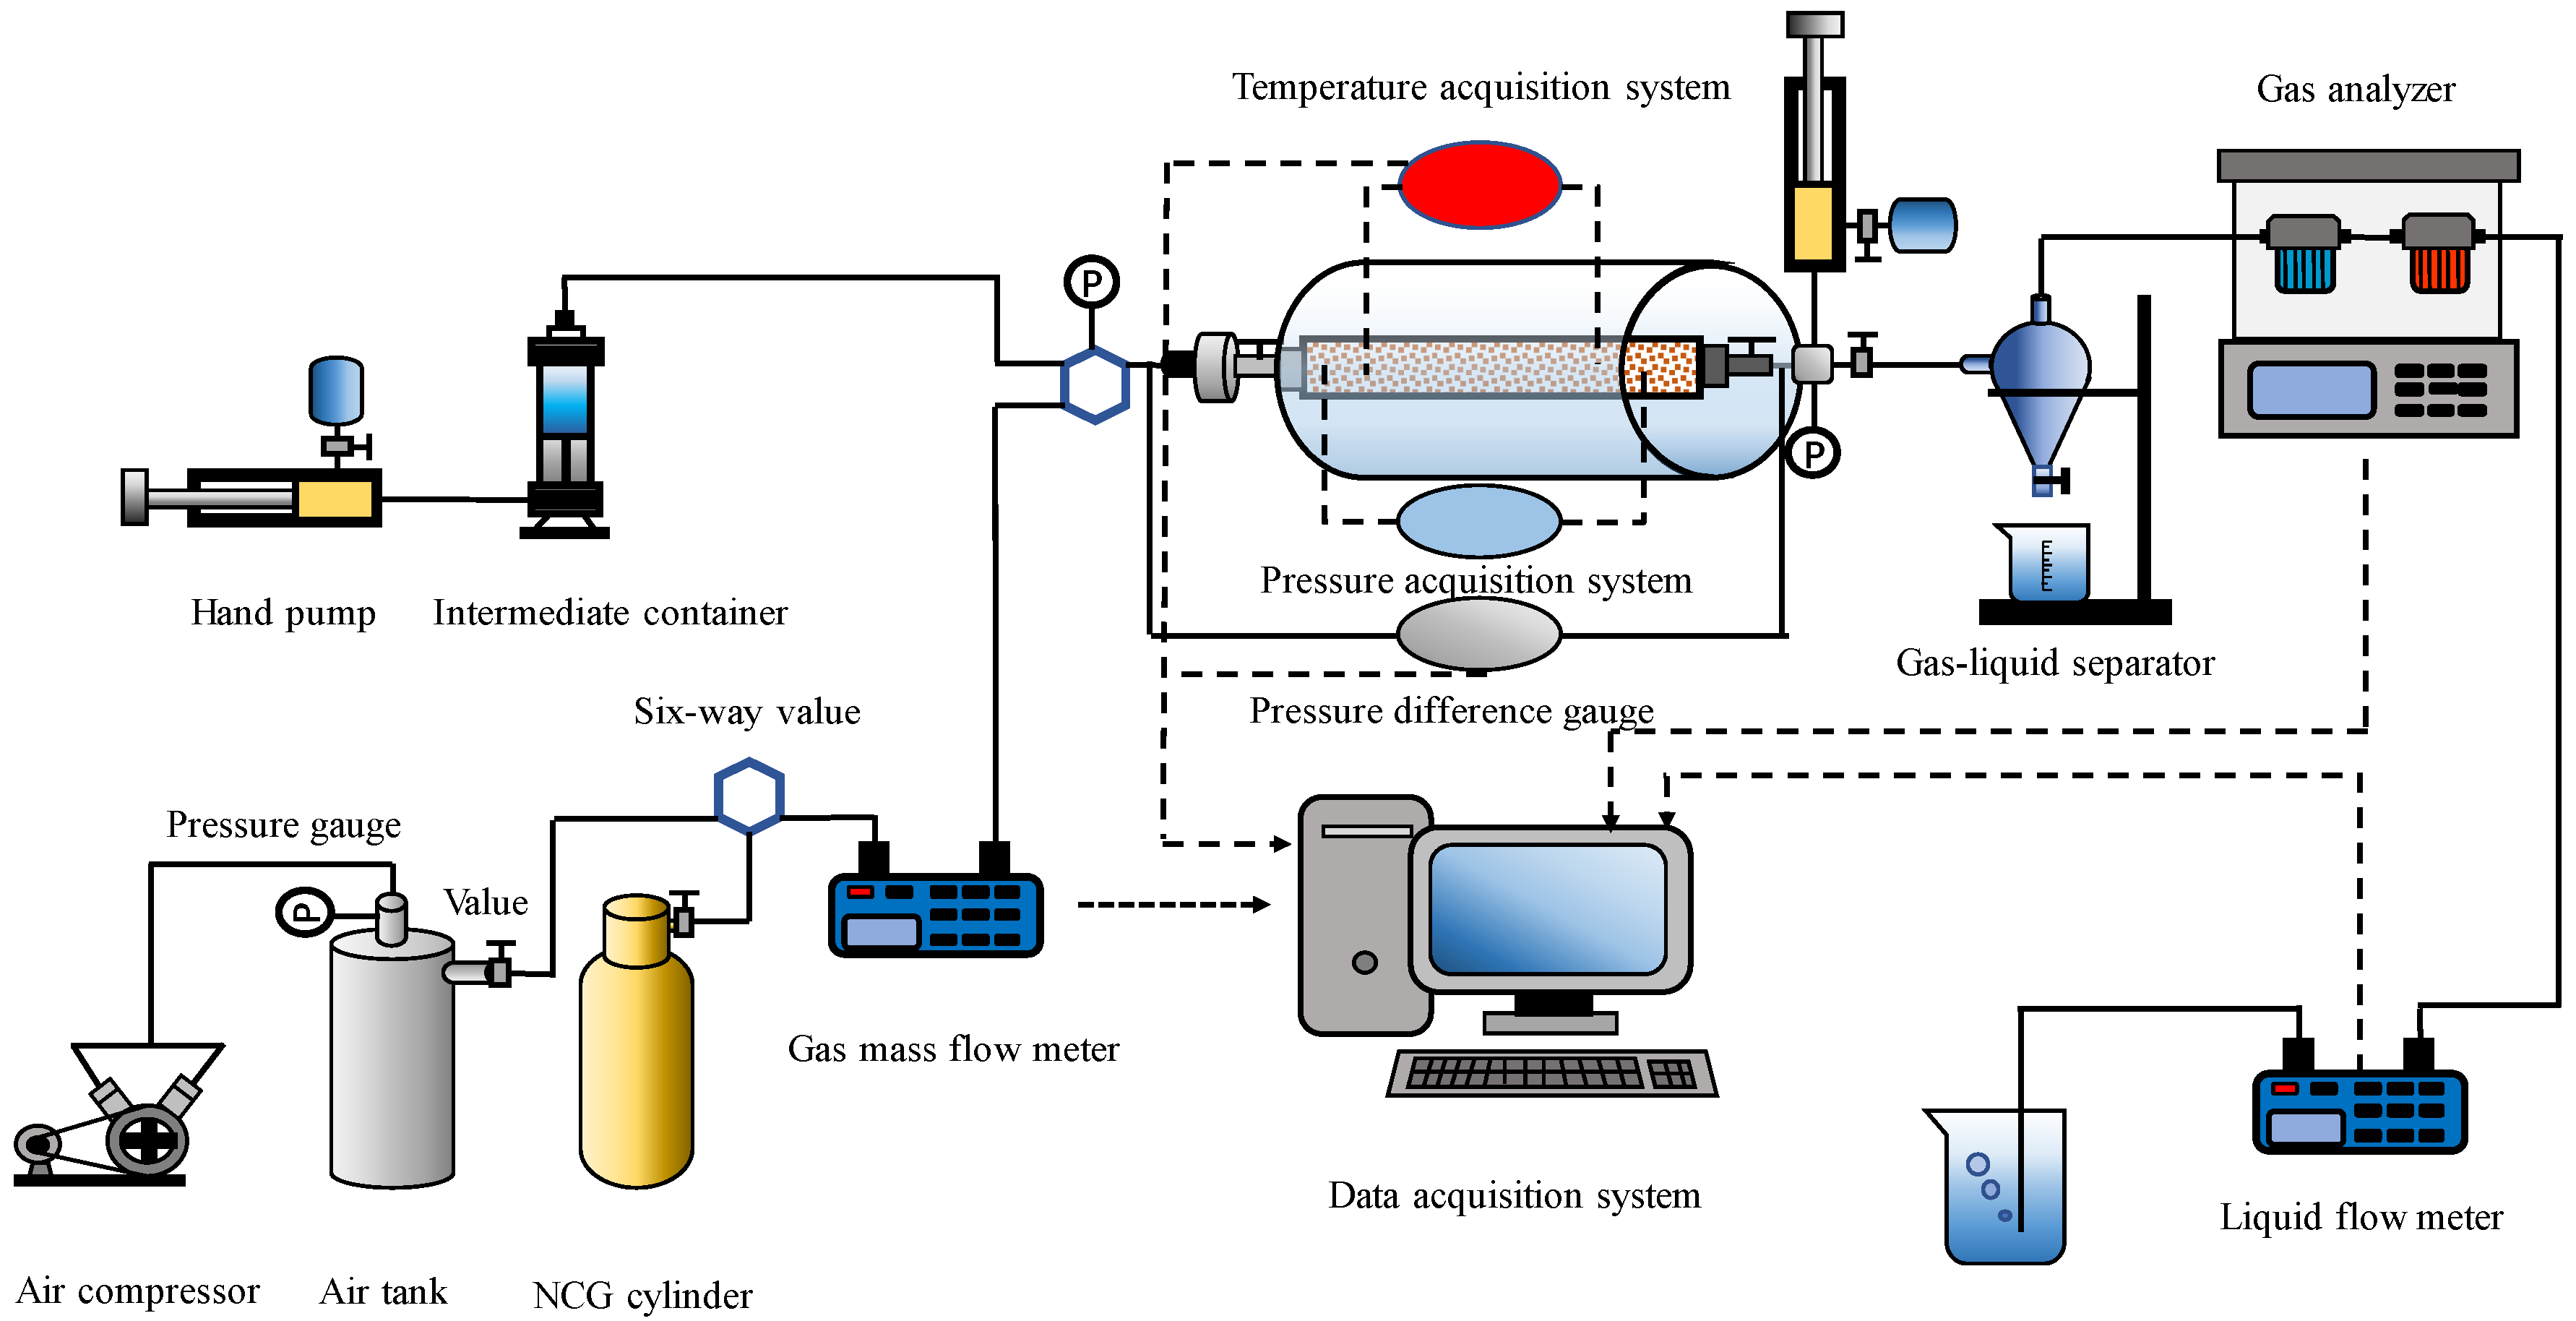
Figure 2.
Determination of threshold temperature for in-situ combustion of oil reservoirs.
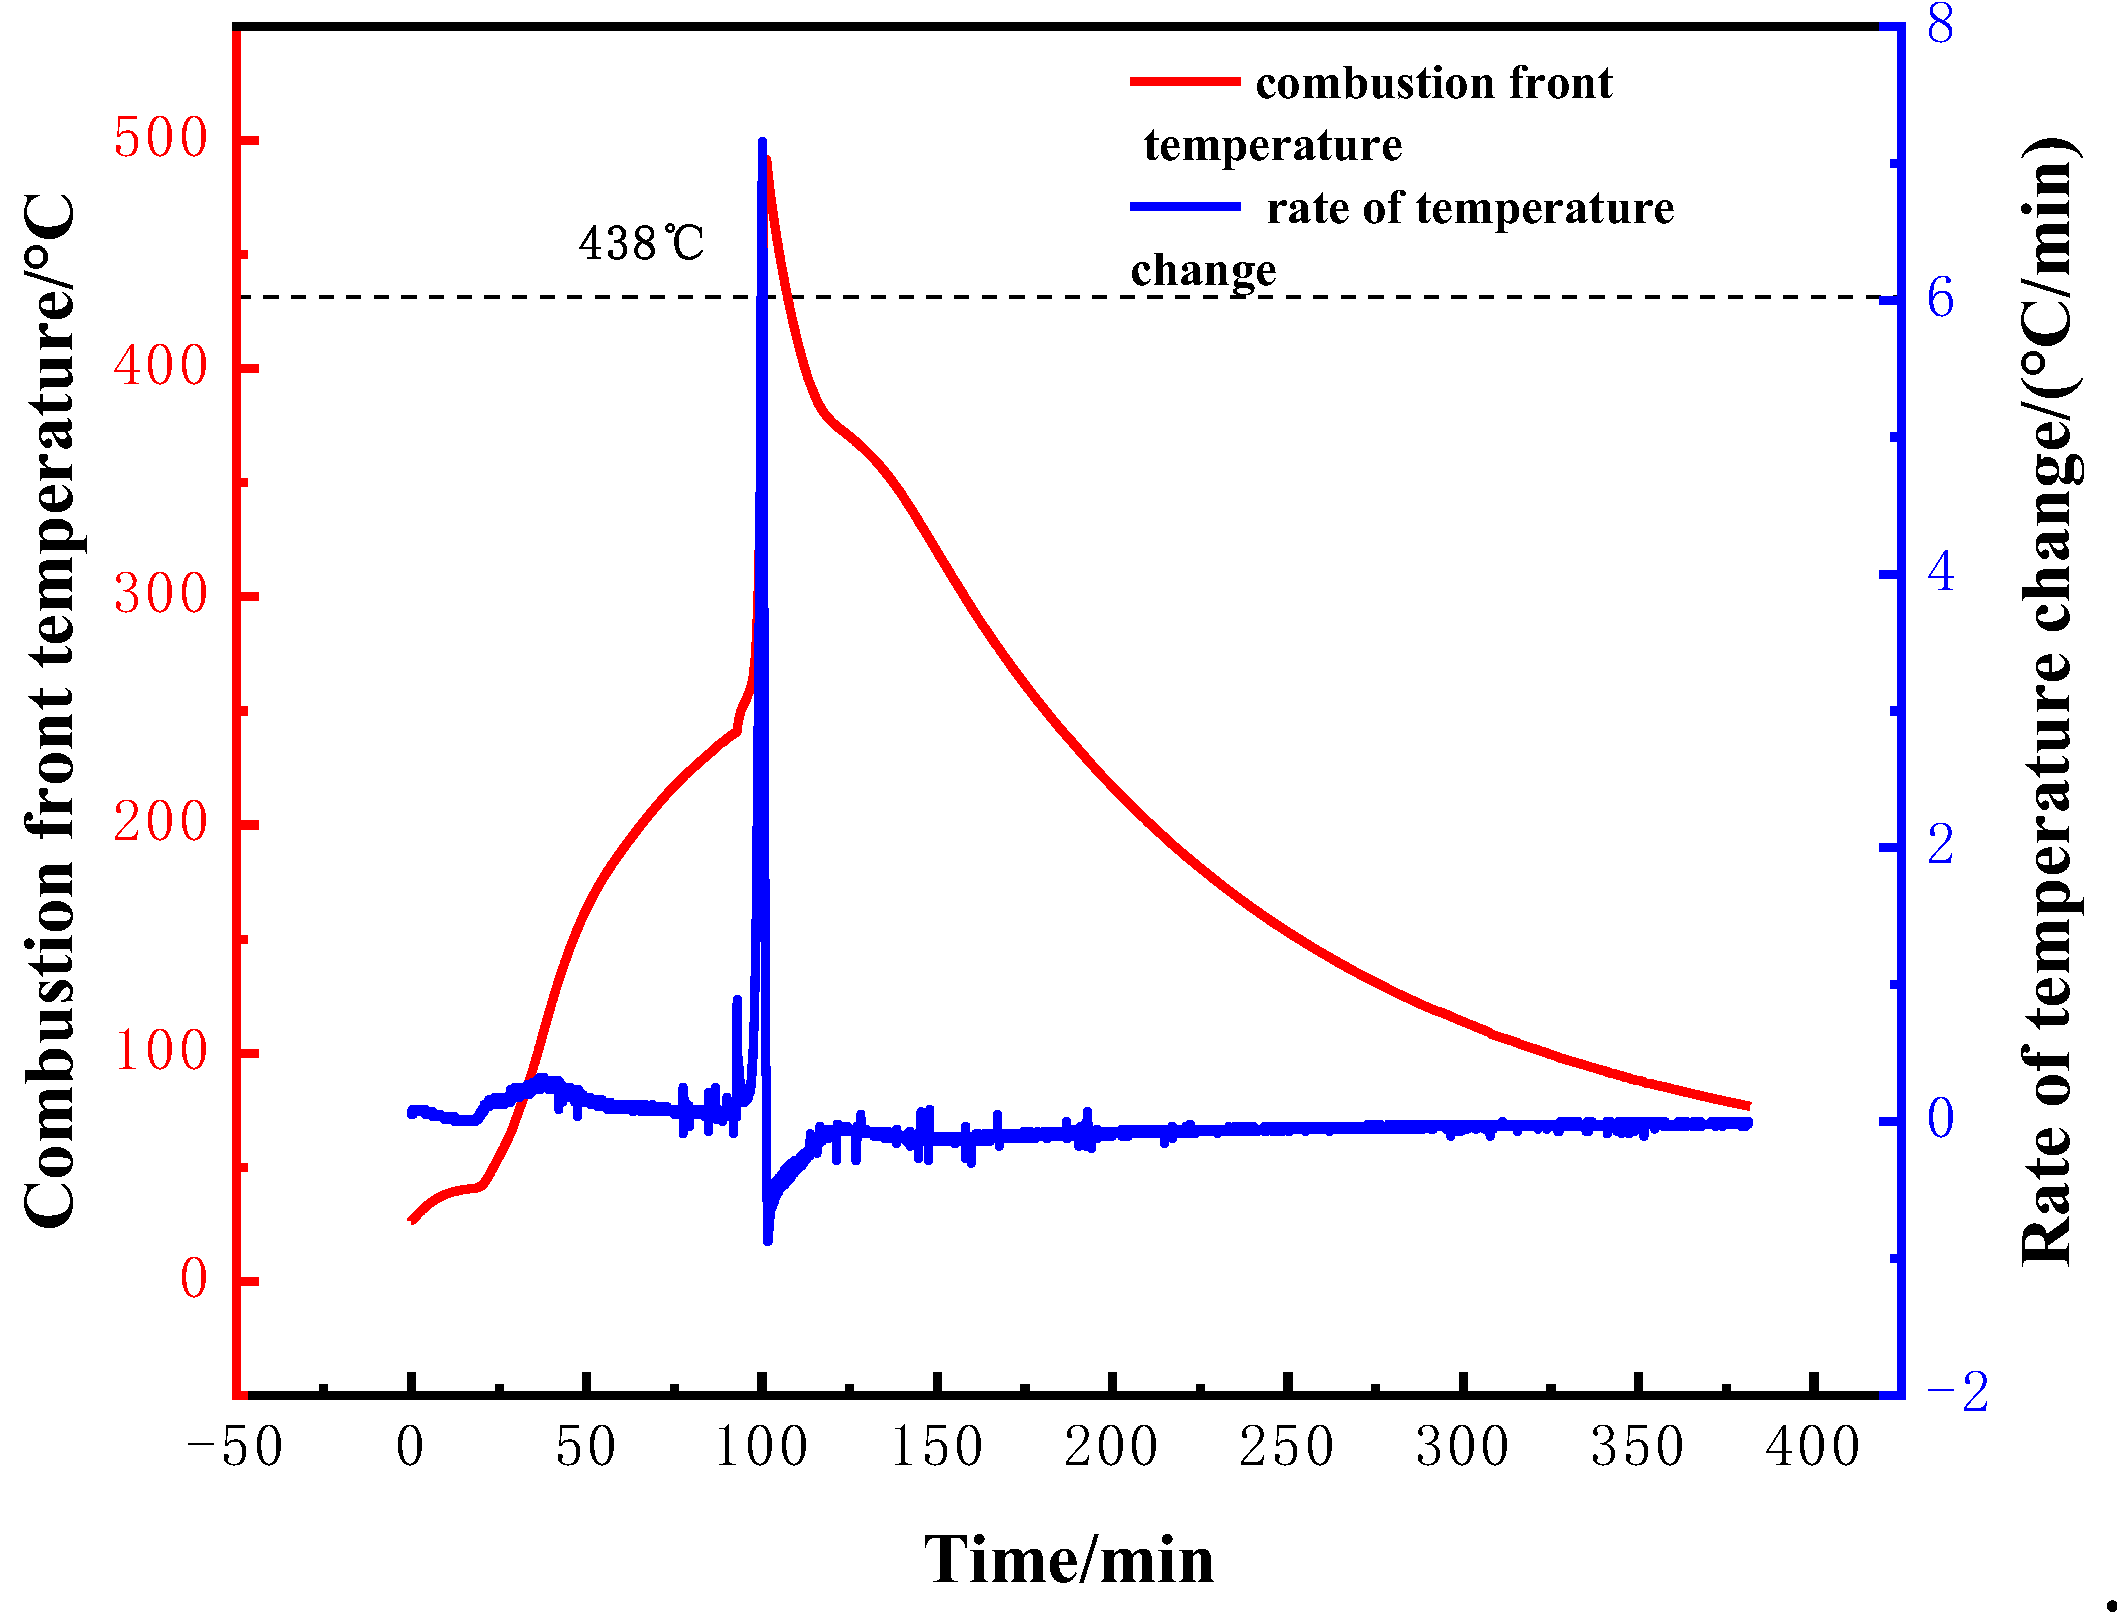
Figure 3.
The relationship between the temperature field and time under fire flooding conditions with an oil saturation of 65%.
Figure 3.
The relationship between the temperature field and time under fire flooding conditions with an oil saturation of 65%.
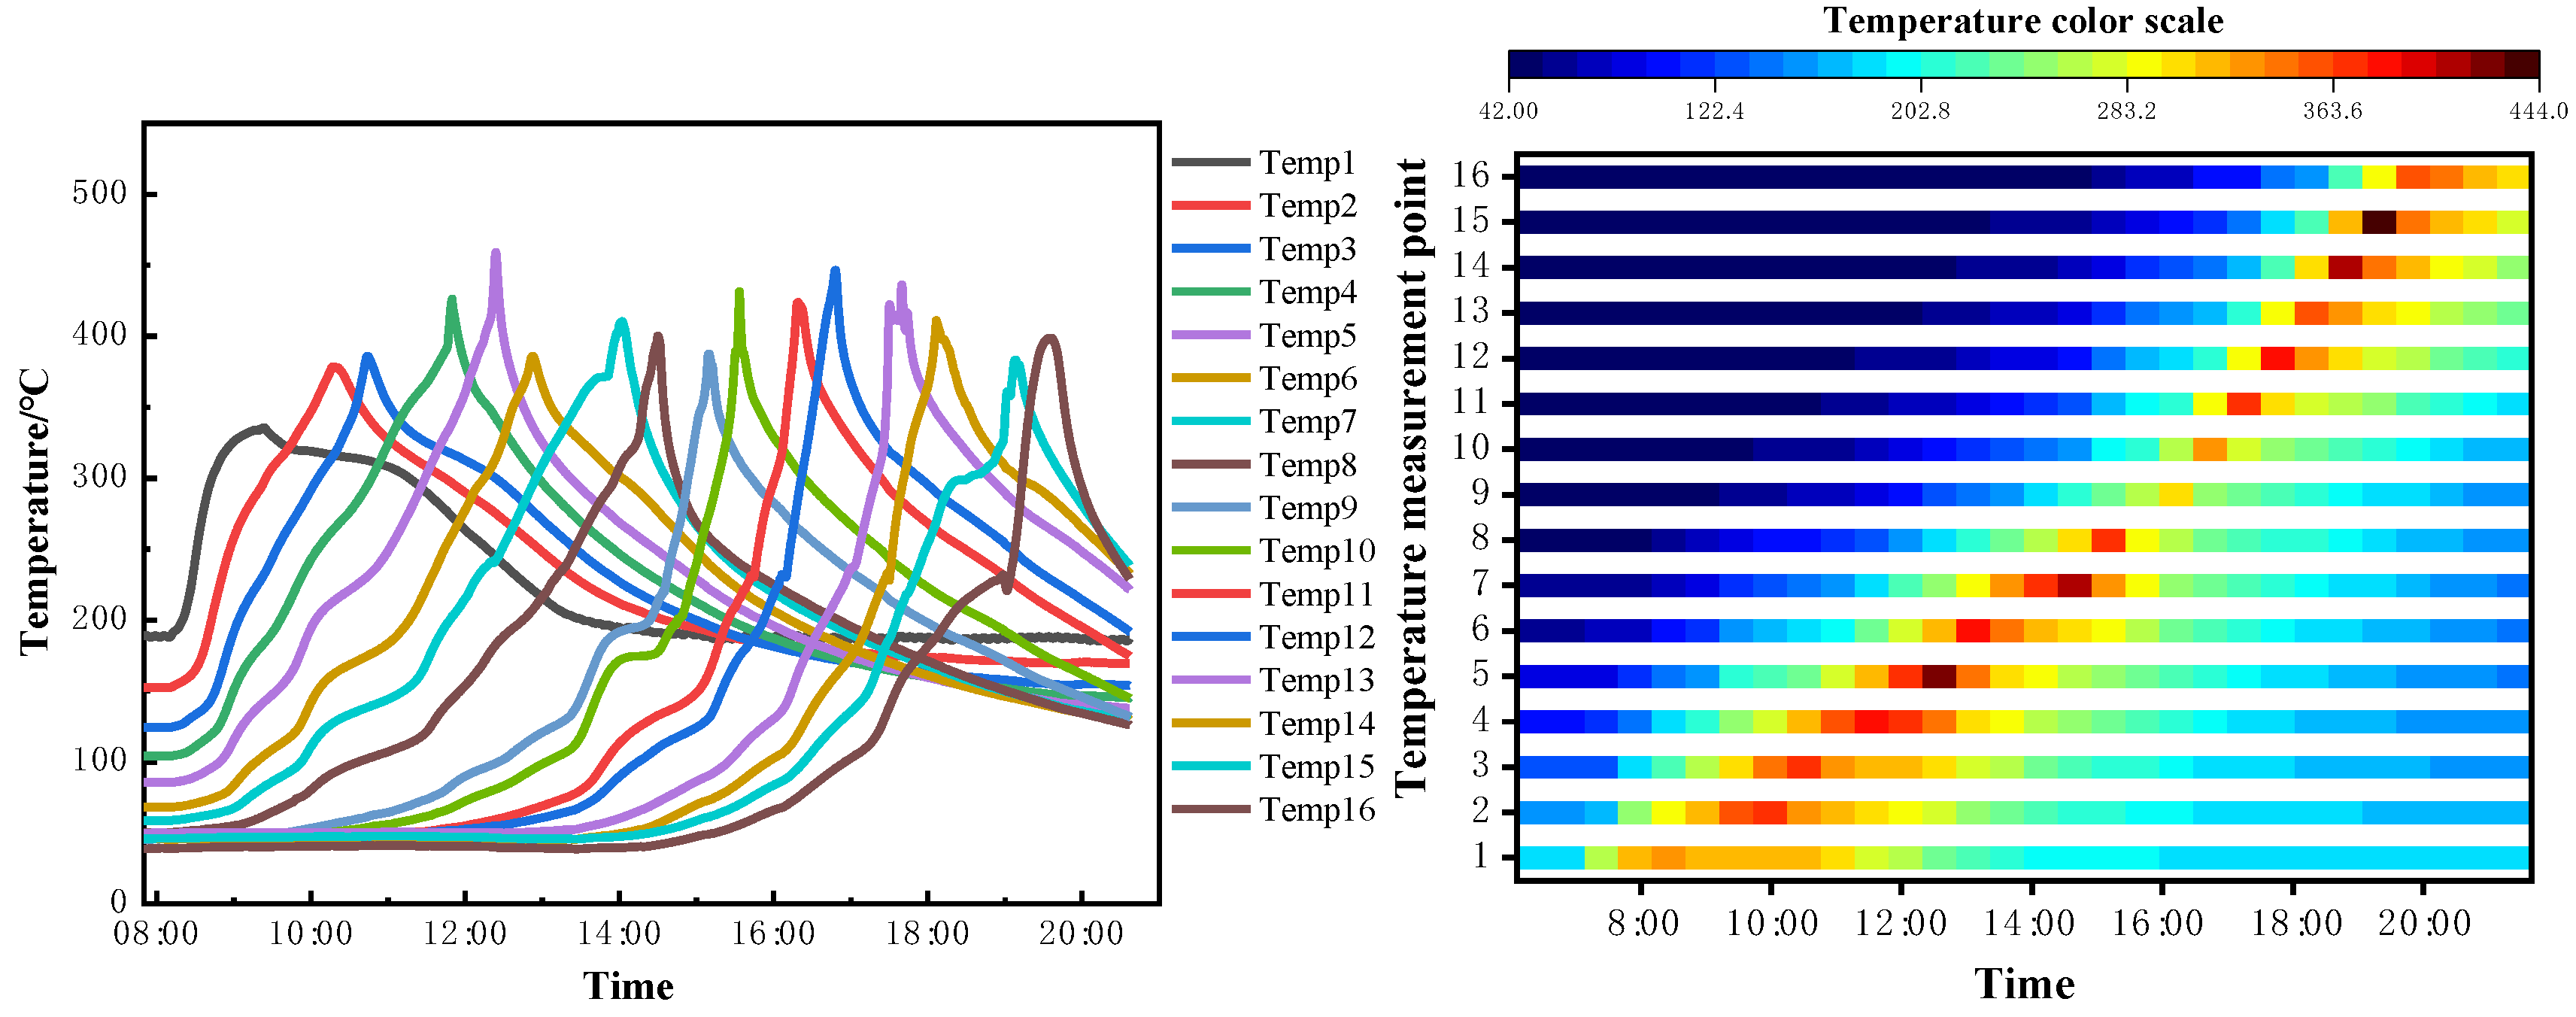
Figure 4.
The relationship between the temperature field and time under fire flooding conditions with an oil saturation of 50%.
Figure 4.
The relationship between the temperature field and time under fire flooding conditions with an oil saturation of 50%.
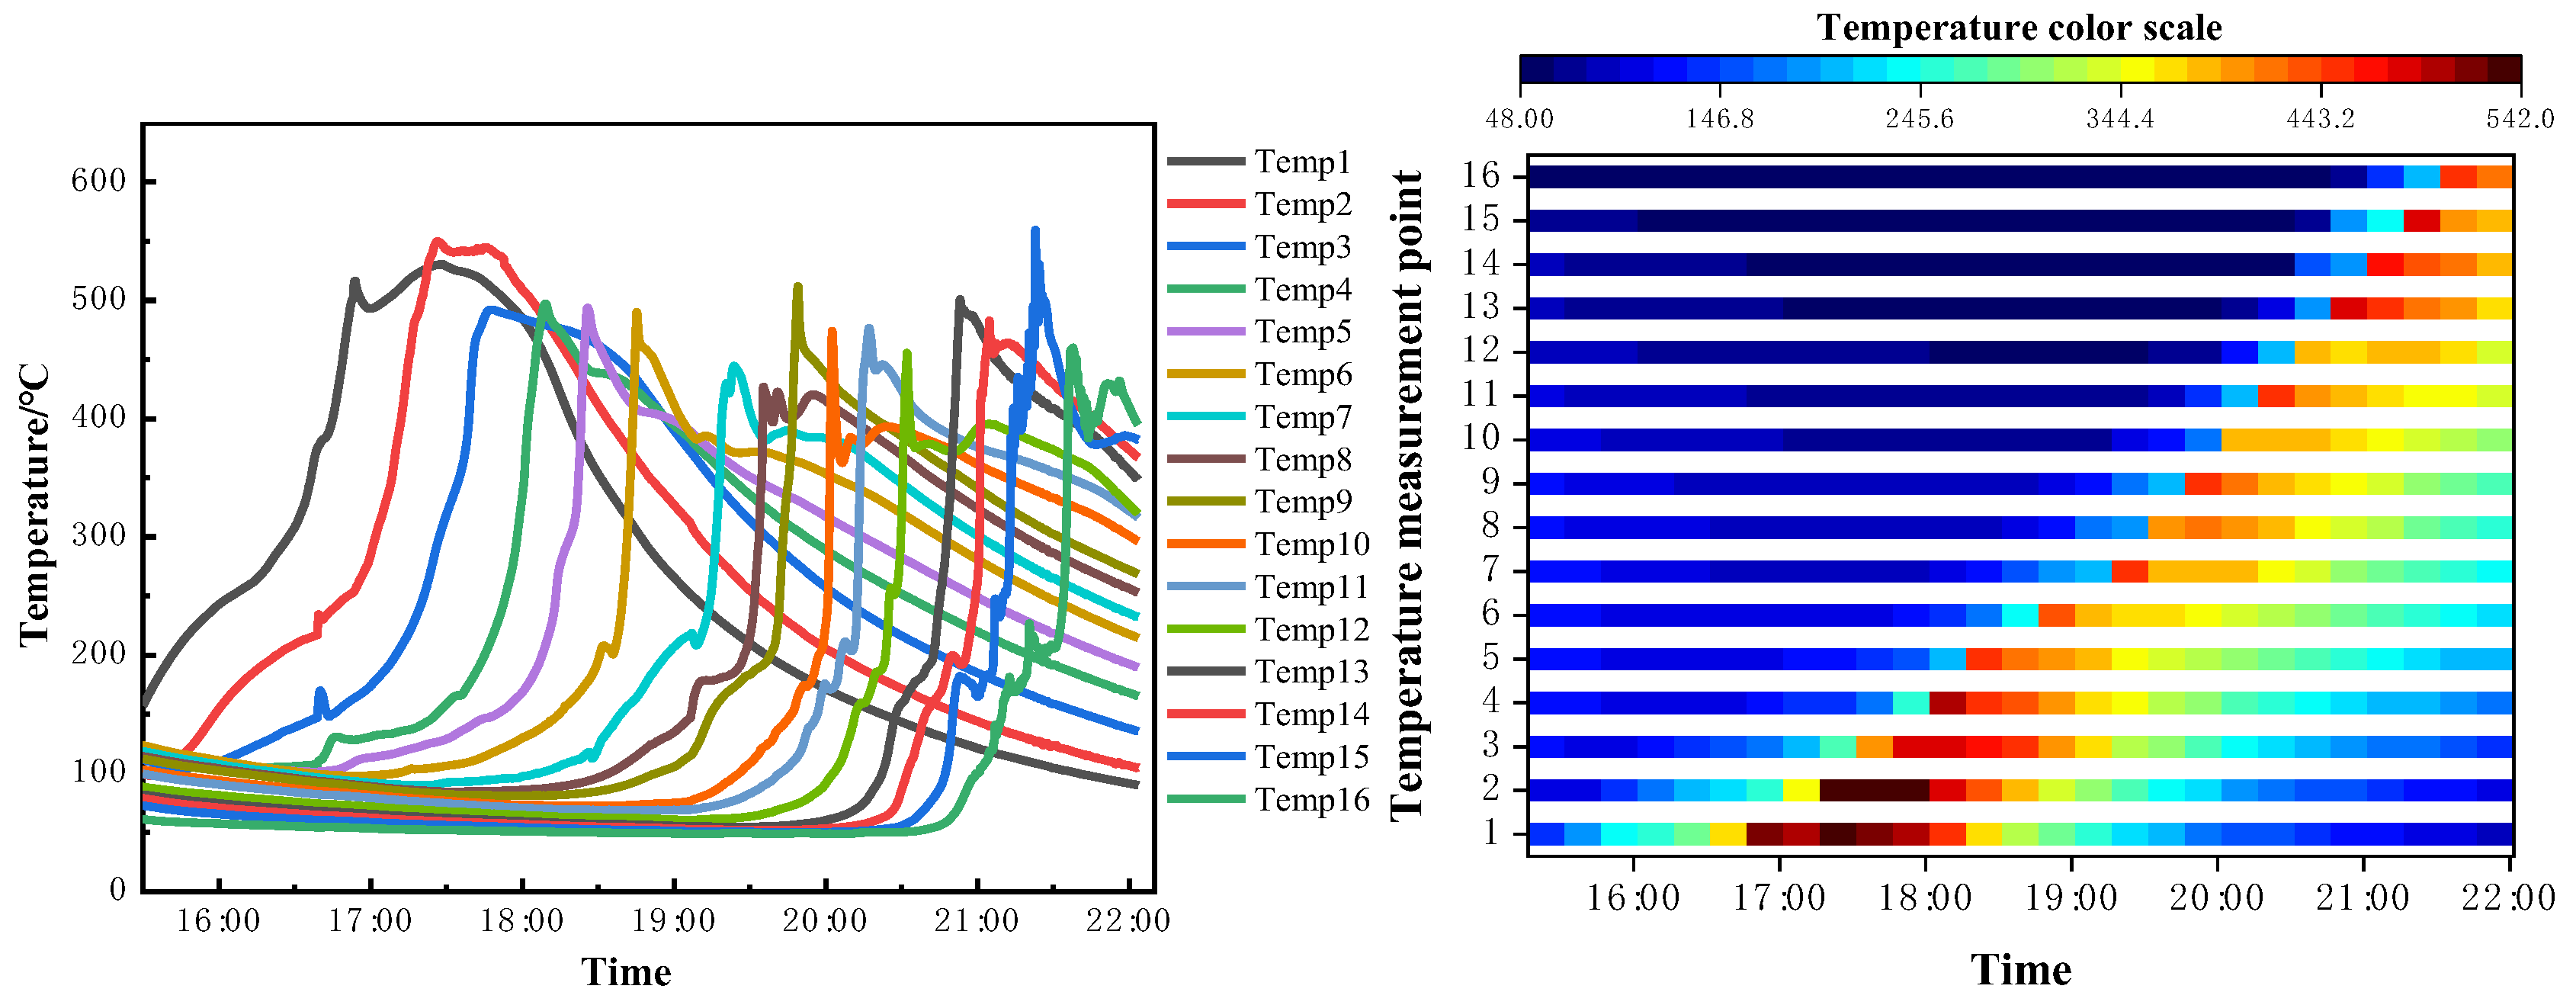
Figure 5.
The relationship between the temperature field and time under fire flooding conditions with an oil saturation of 30%.
Figure 5.
The relationship between the temperature field and time under fire flooding conditions with an oil saturation of 30%.
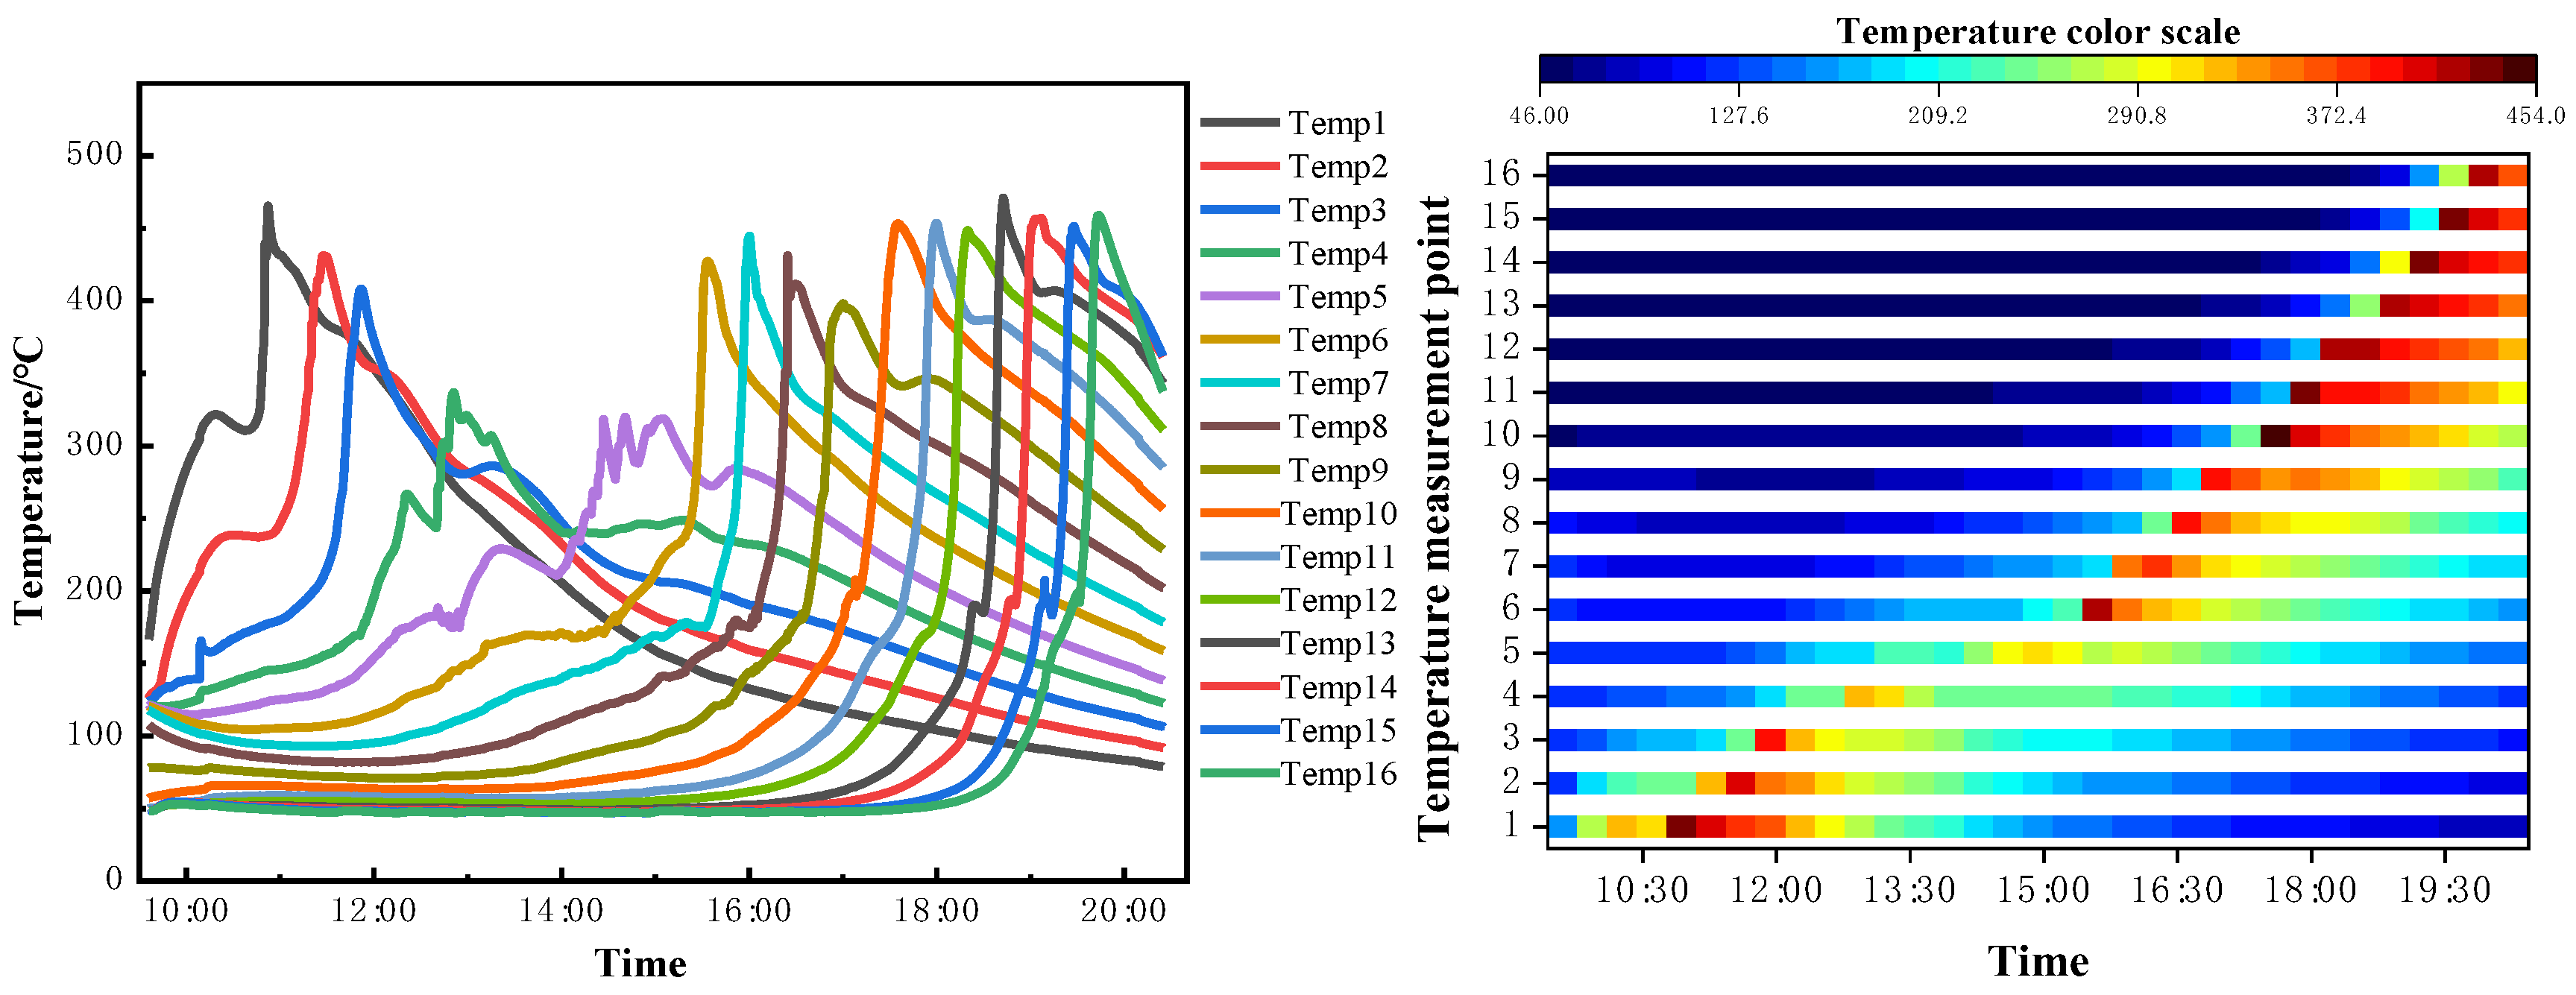
Figure 6.
The variation curve of effluent gas in fire flooding under different oil saturations.
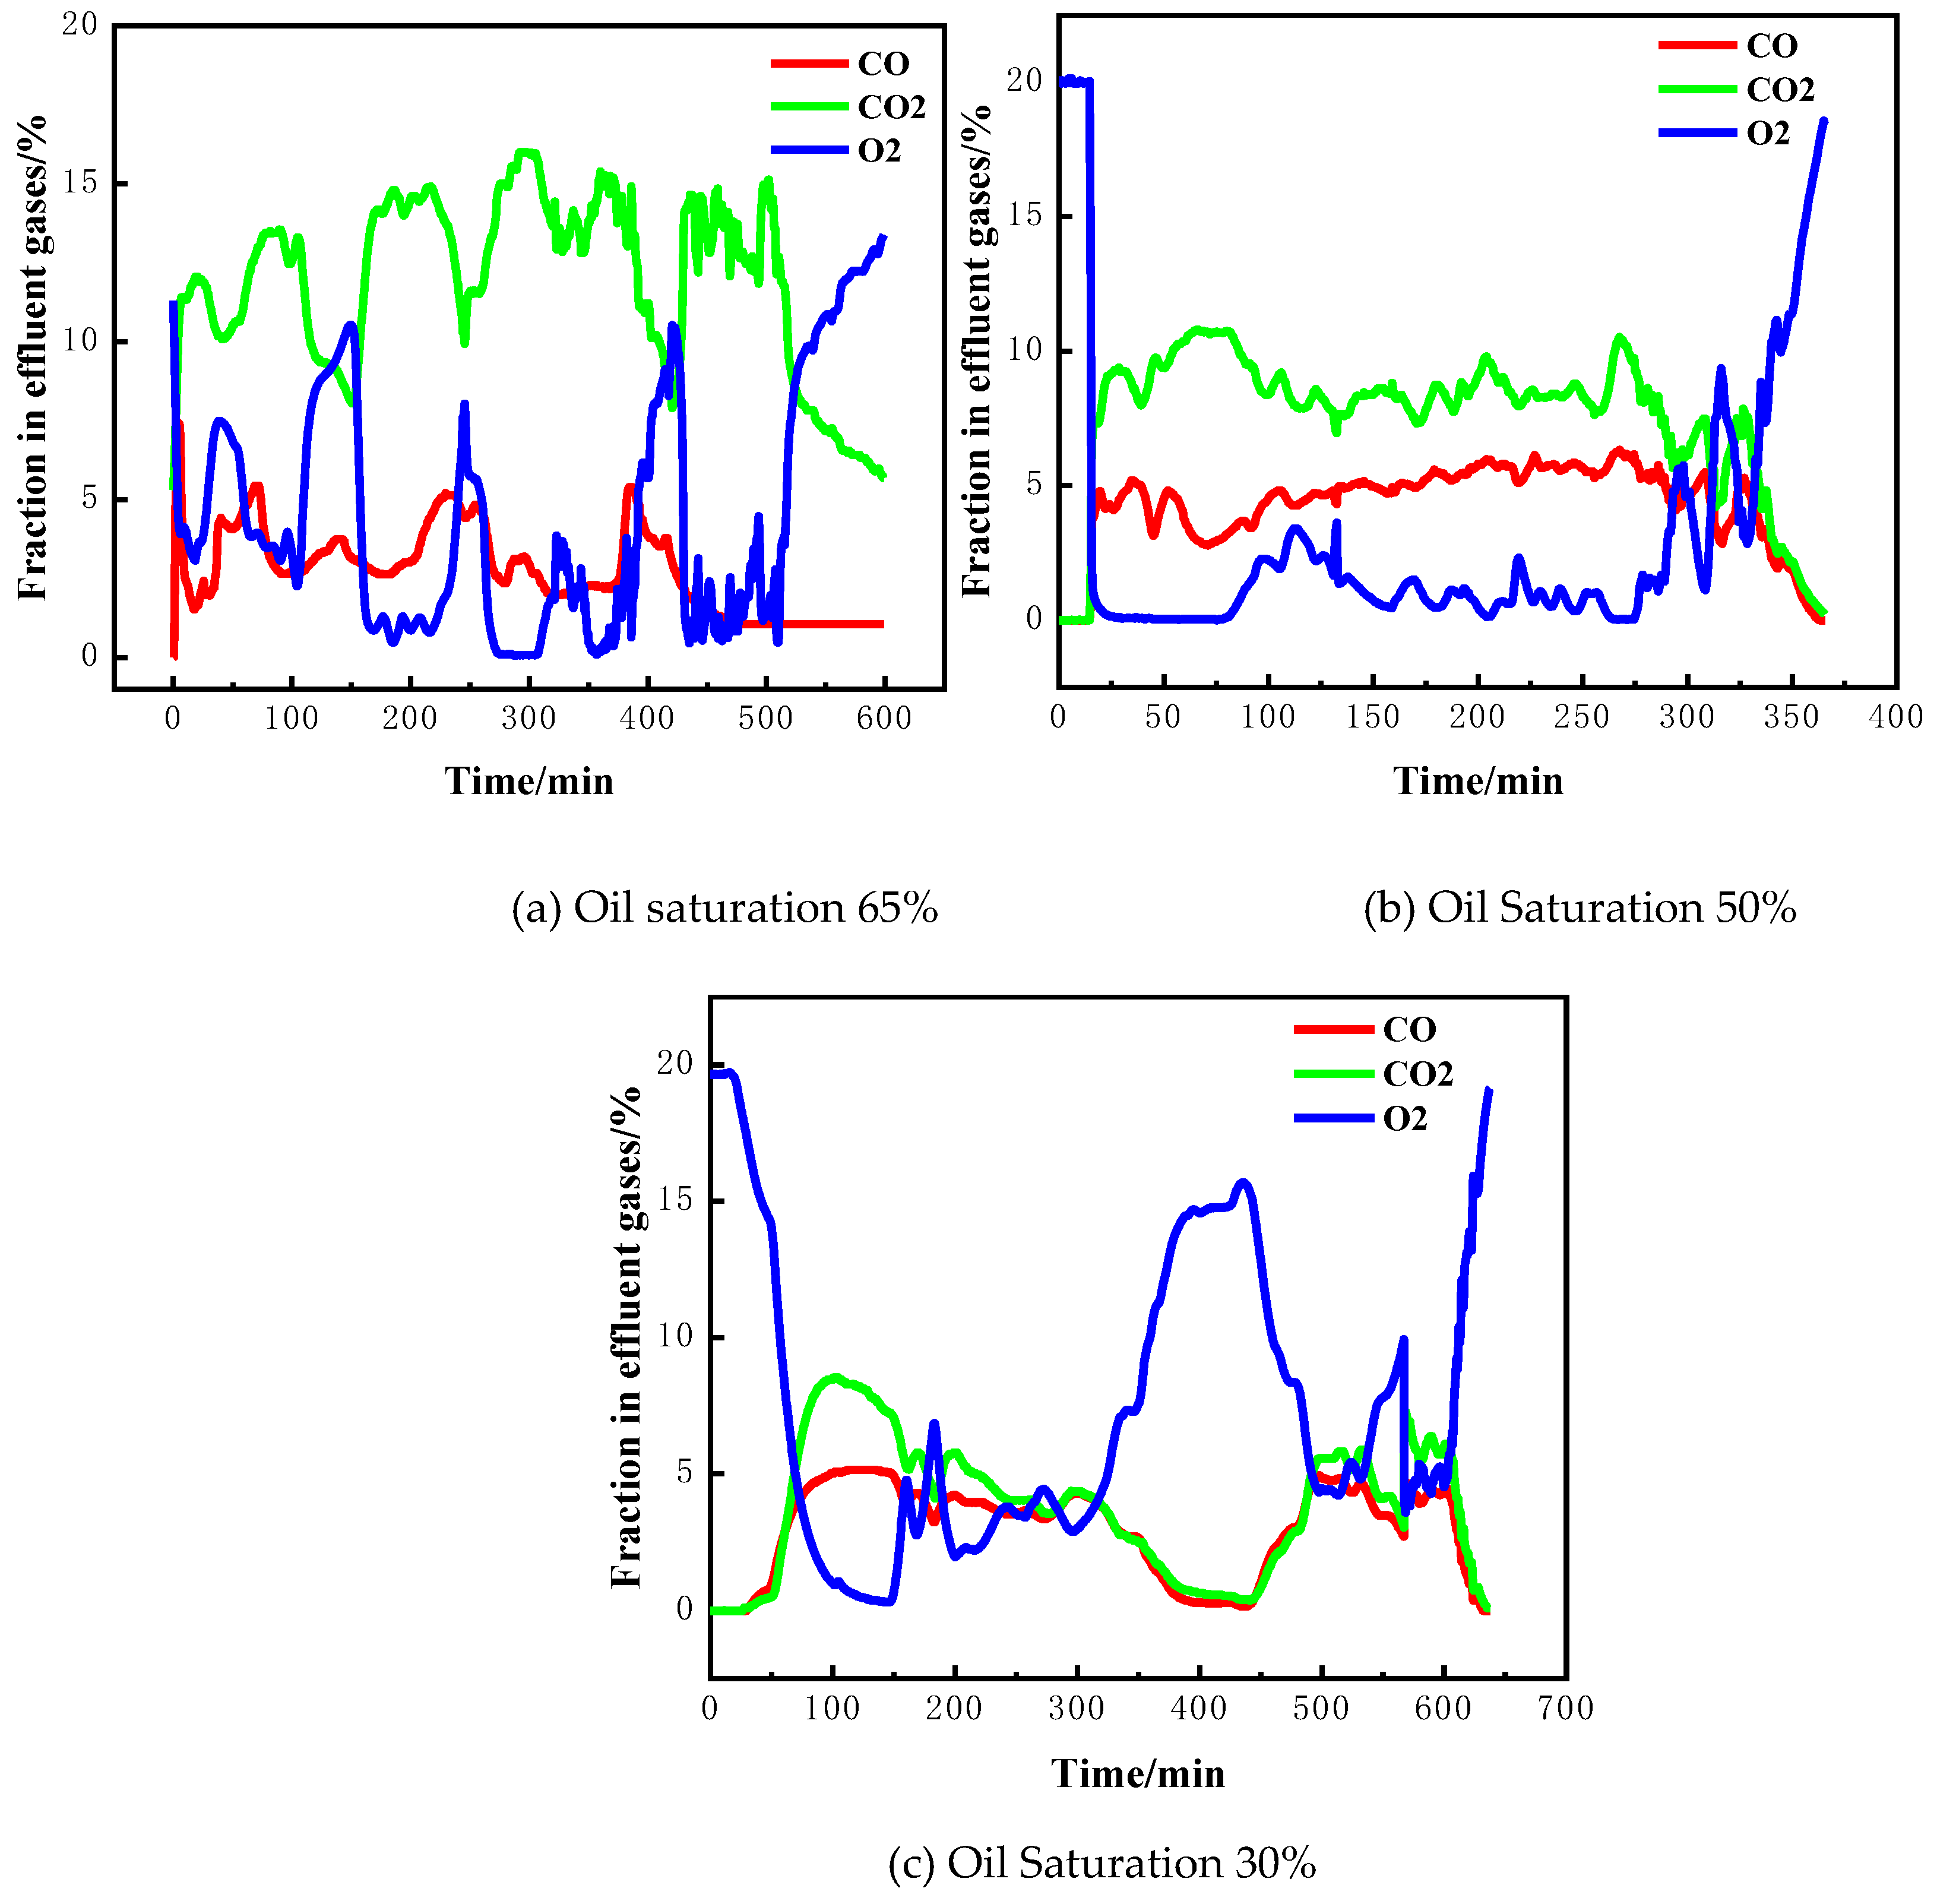
Figure 7.
The variation curve of produced oil and crude oil viscosity-temperature relationship under different oil saturations during fire flooding.
Figure 7.
The variation curve of produced oil and crude oil viscosity-temperature relationship under different oil saturations during fire flooding.
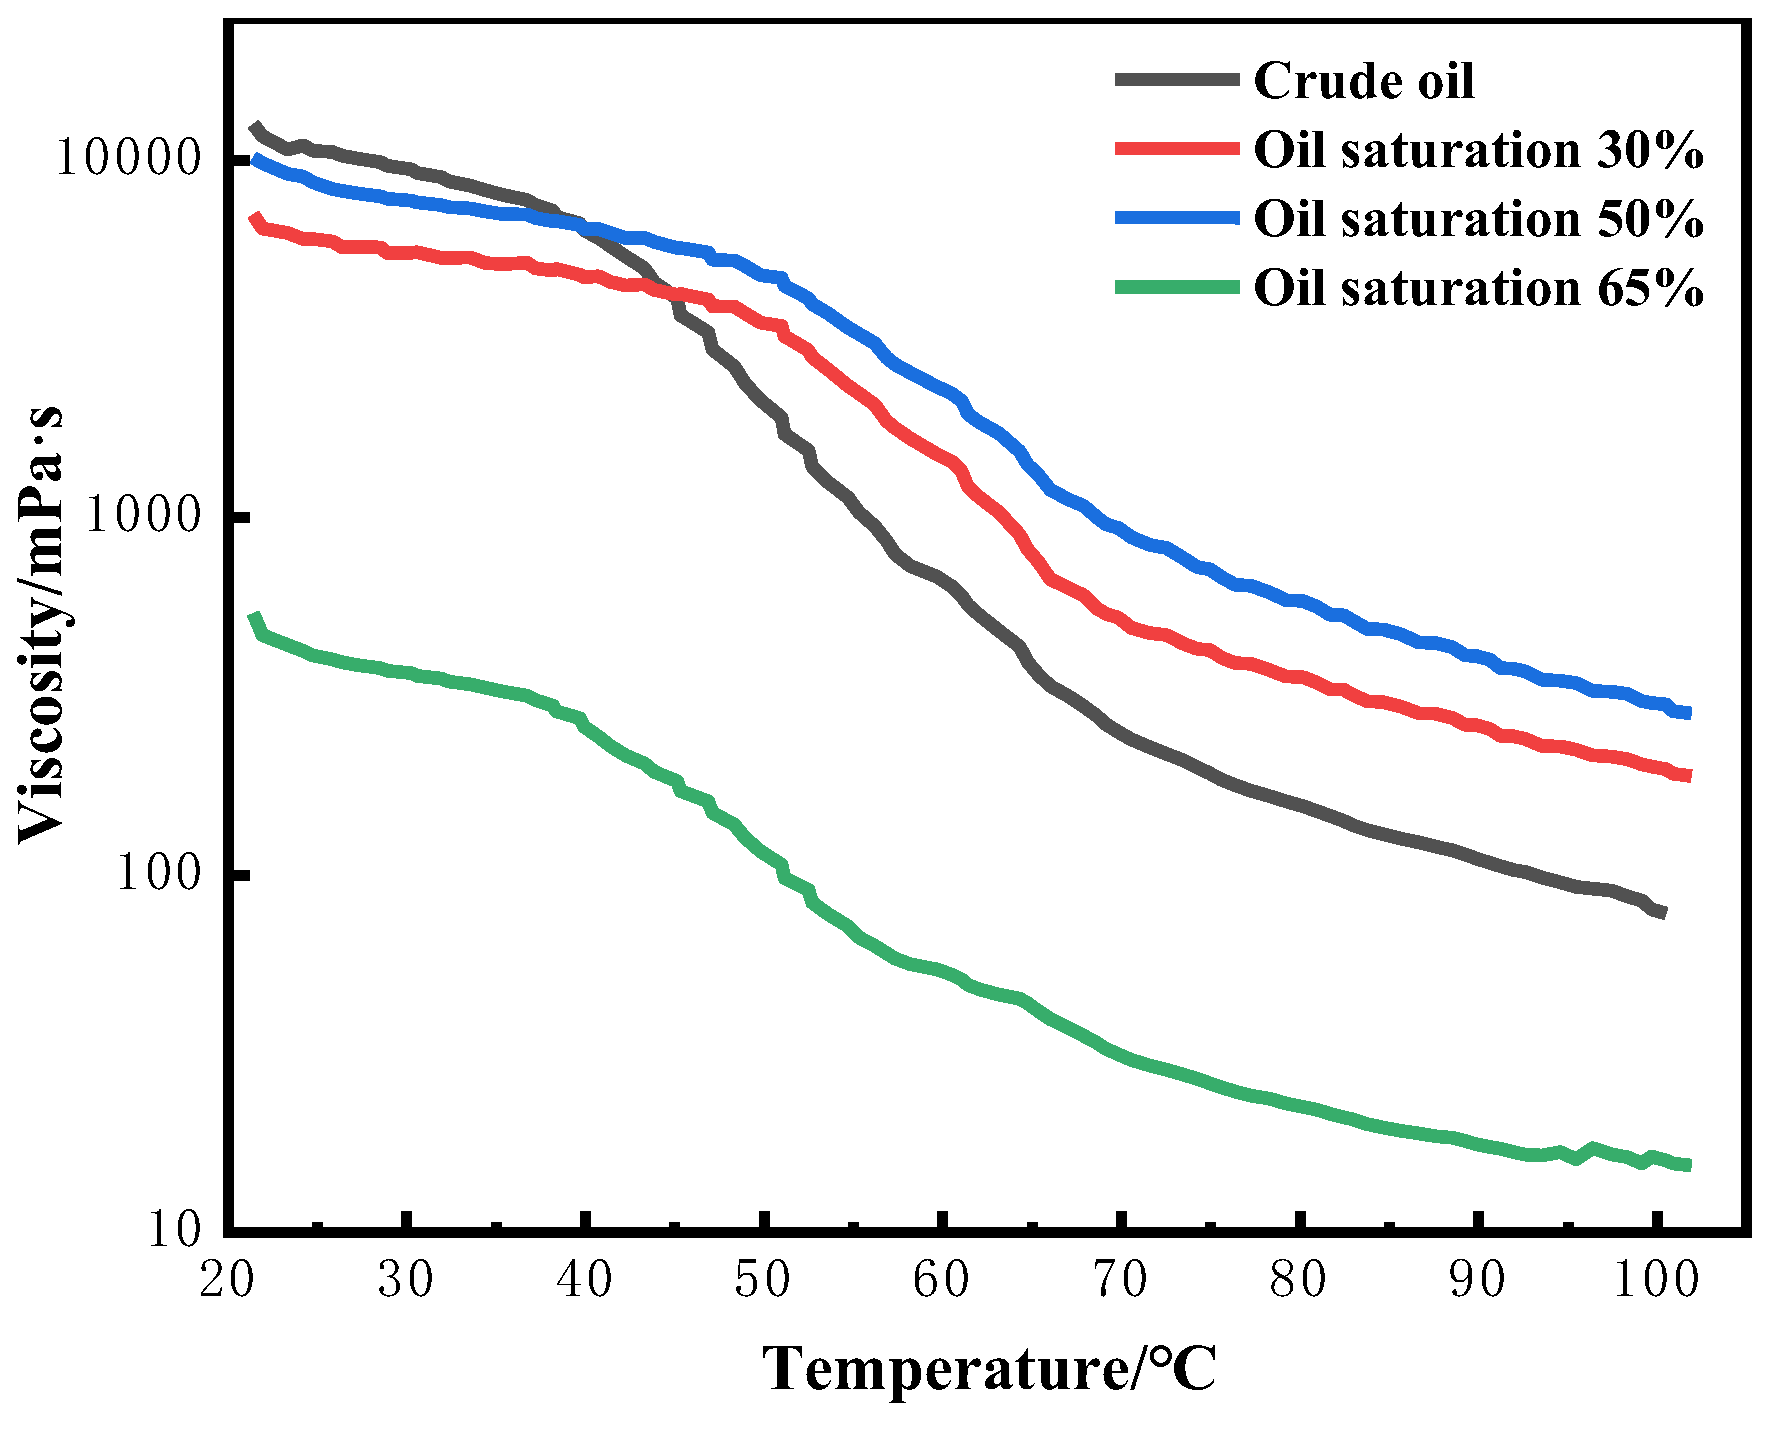
Figure 8.
The comparison of total hydrocarbon chromatograms of before and after fire flooding.
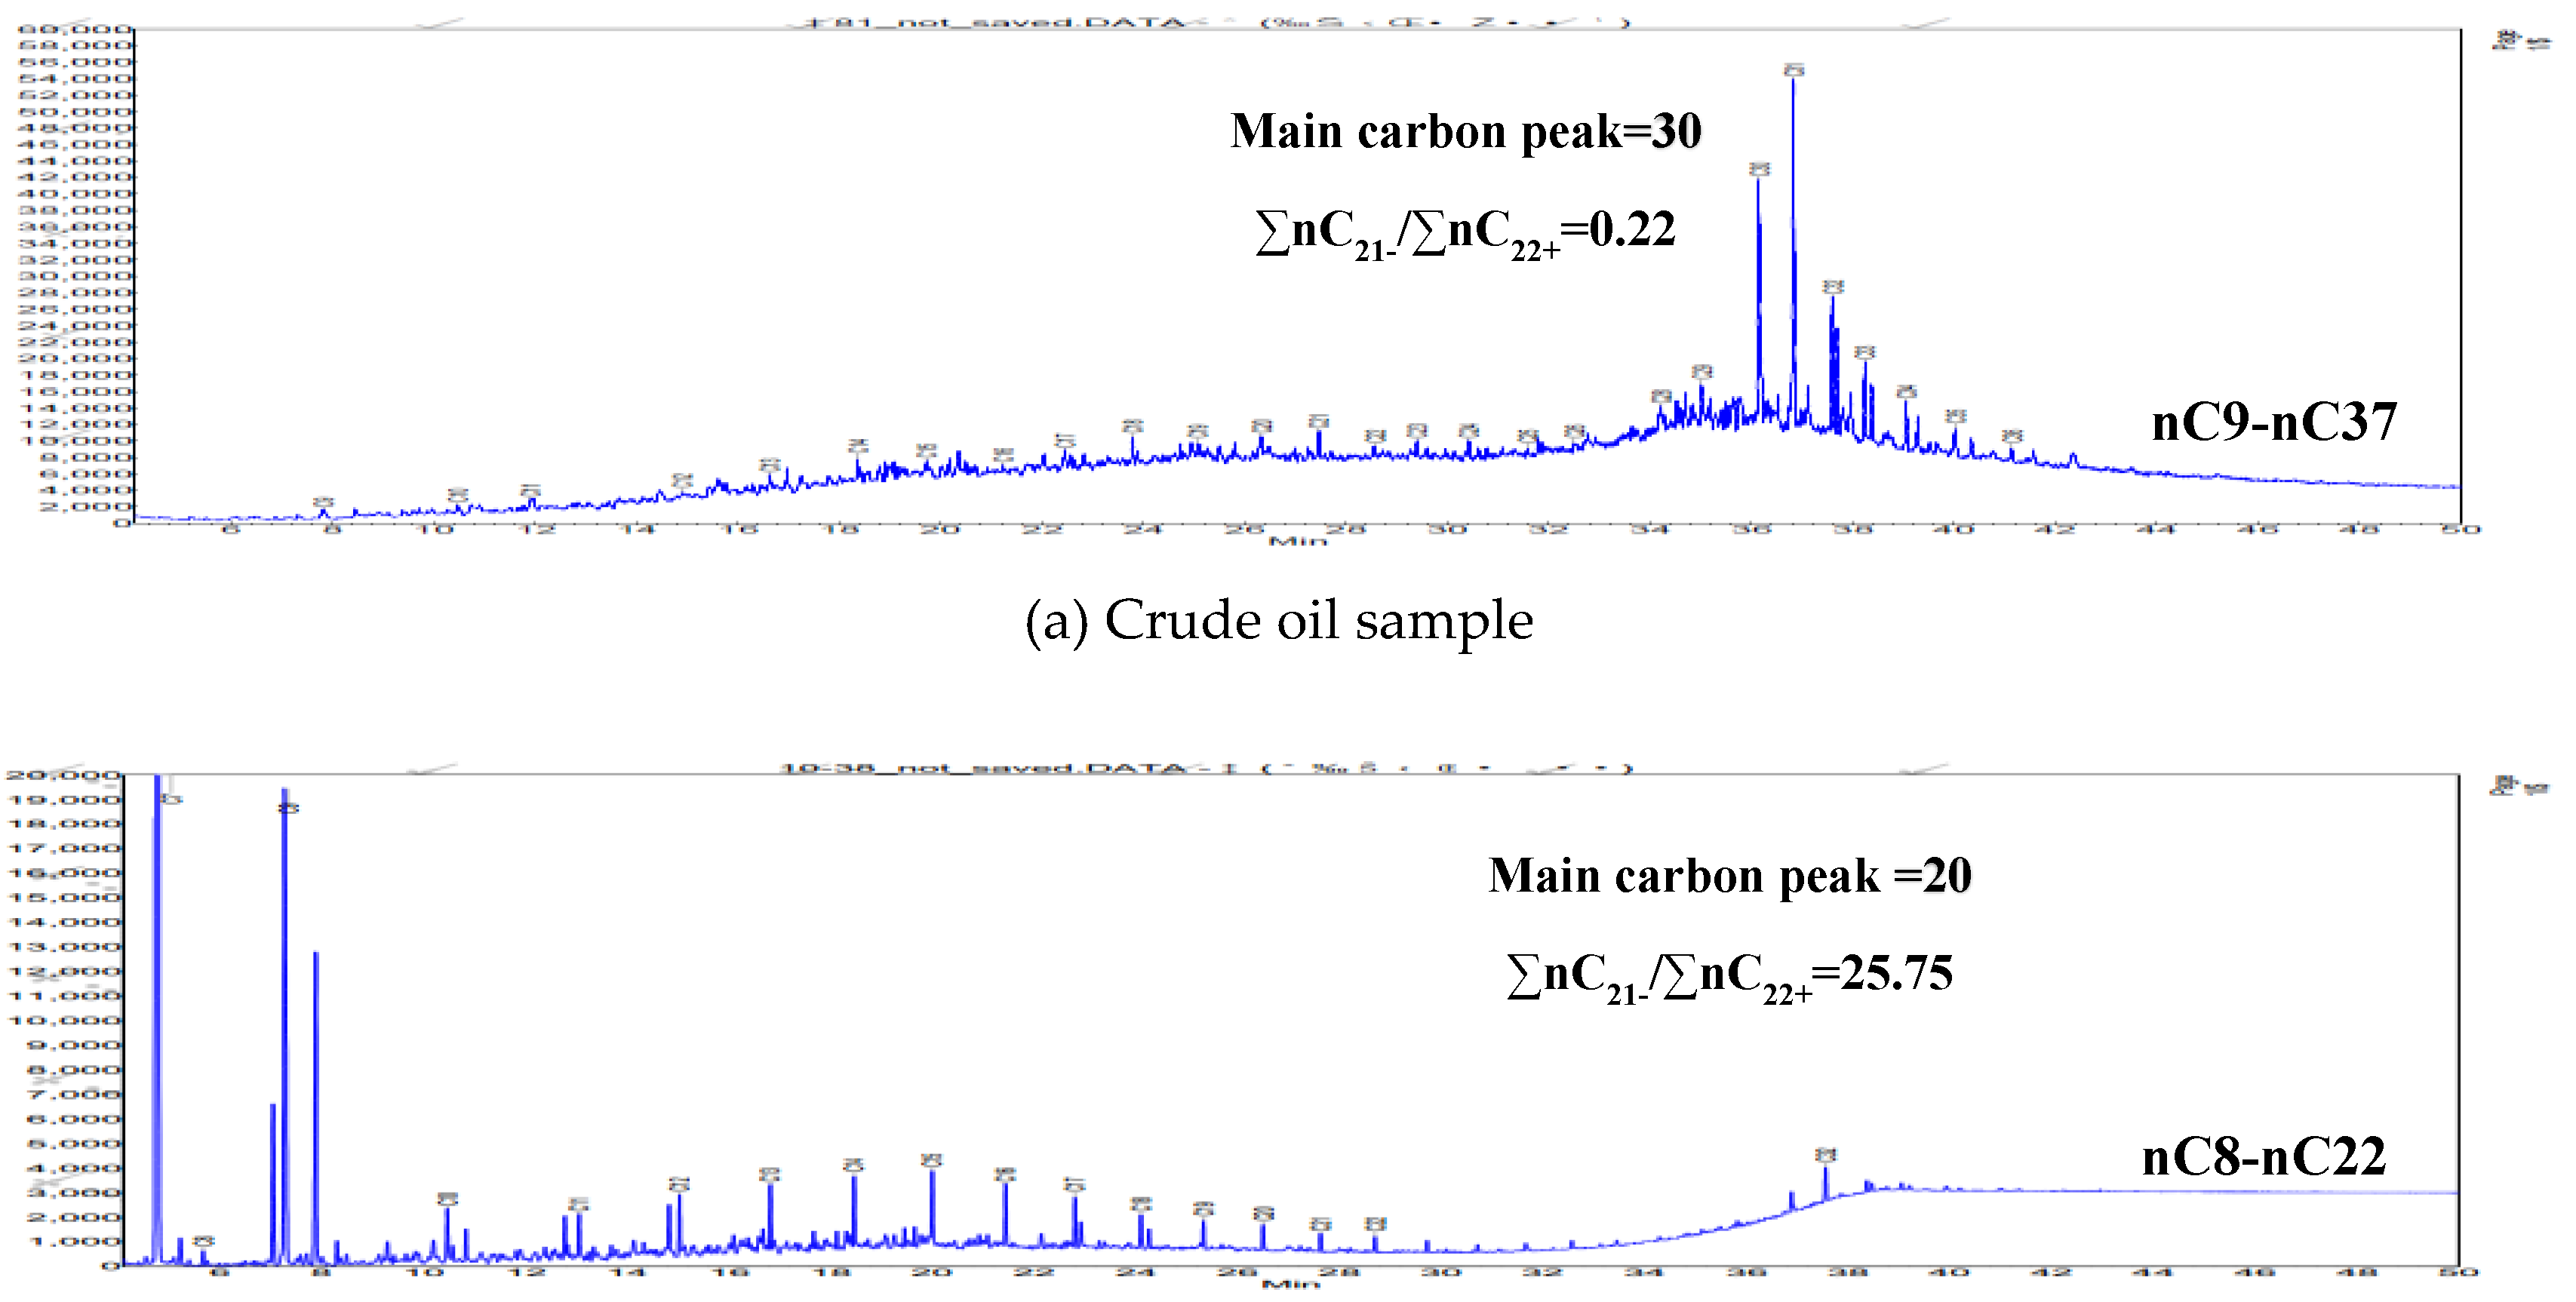
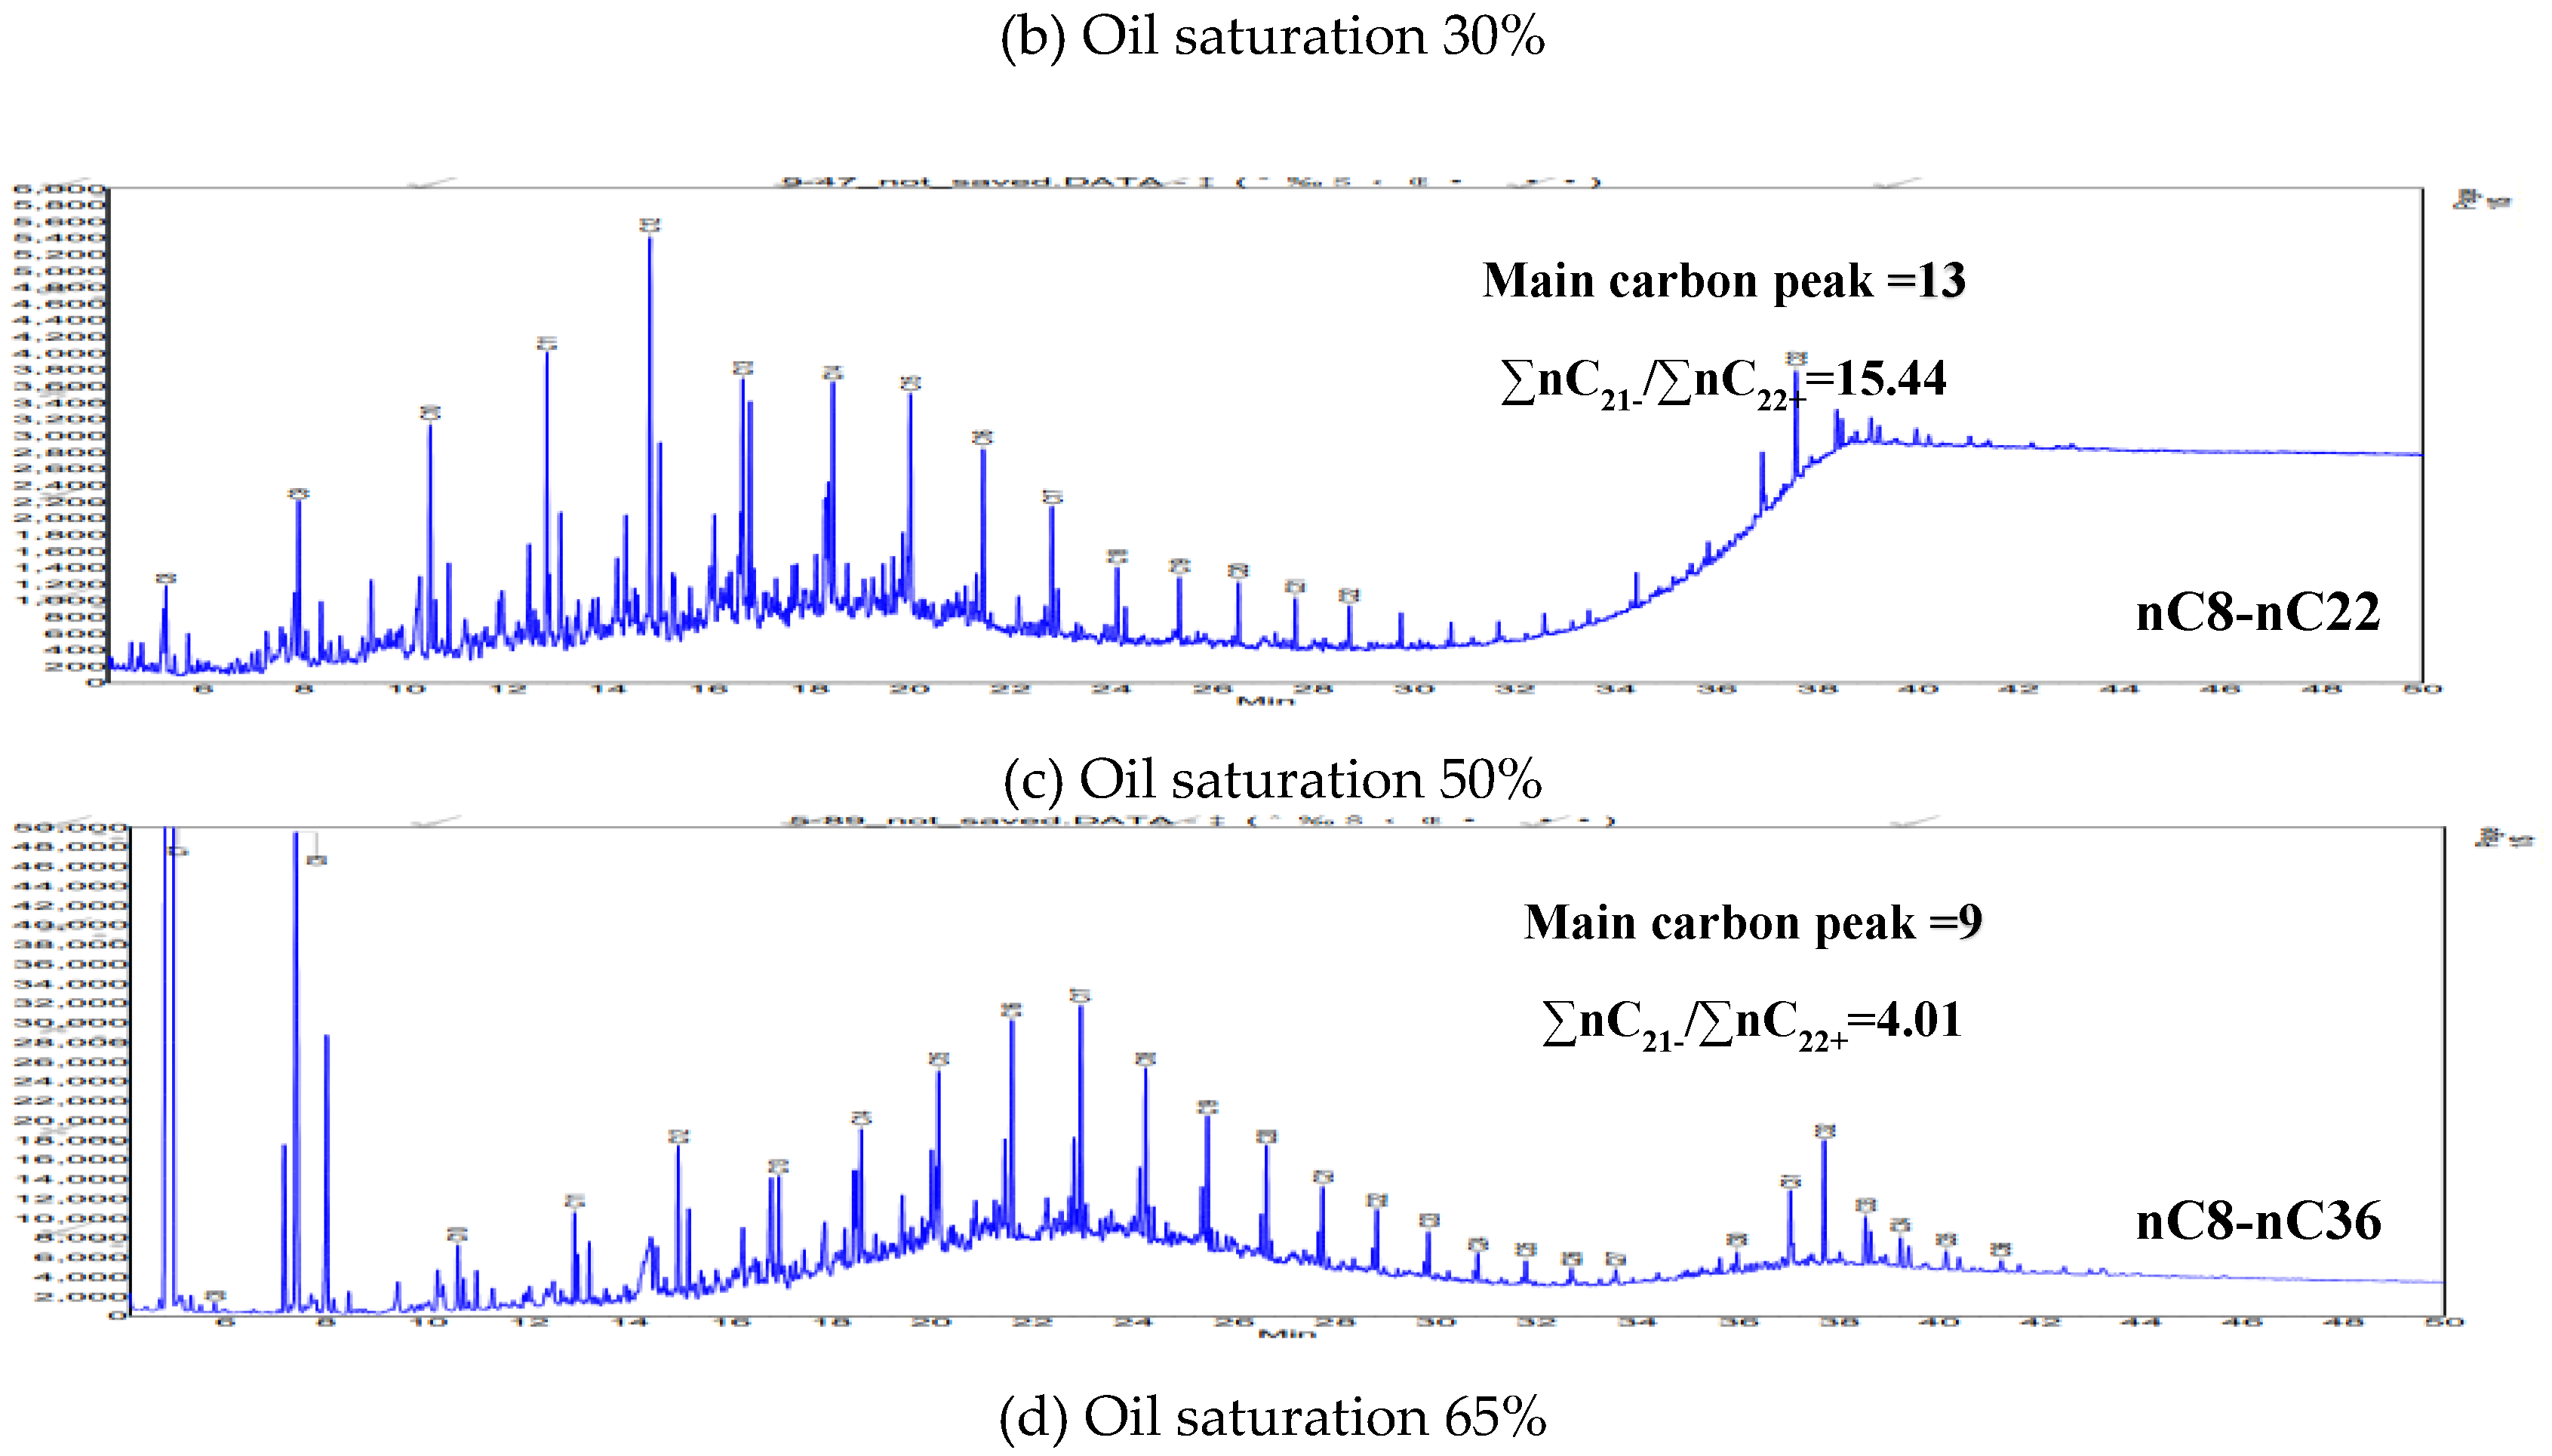
Figure 9.
The total hydrocarbon distribution of fire-flooded produced oil under different oil saturation conditions and crude oil.
Figure 9.
The total hydrocarbon distribution of fire-flooded produced oil under different oil saturation conditions and crude oil.
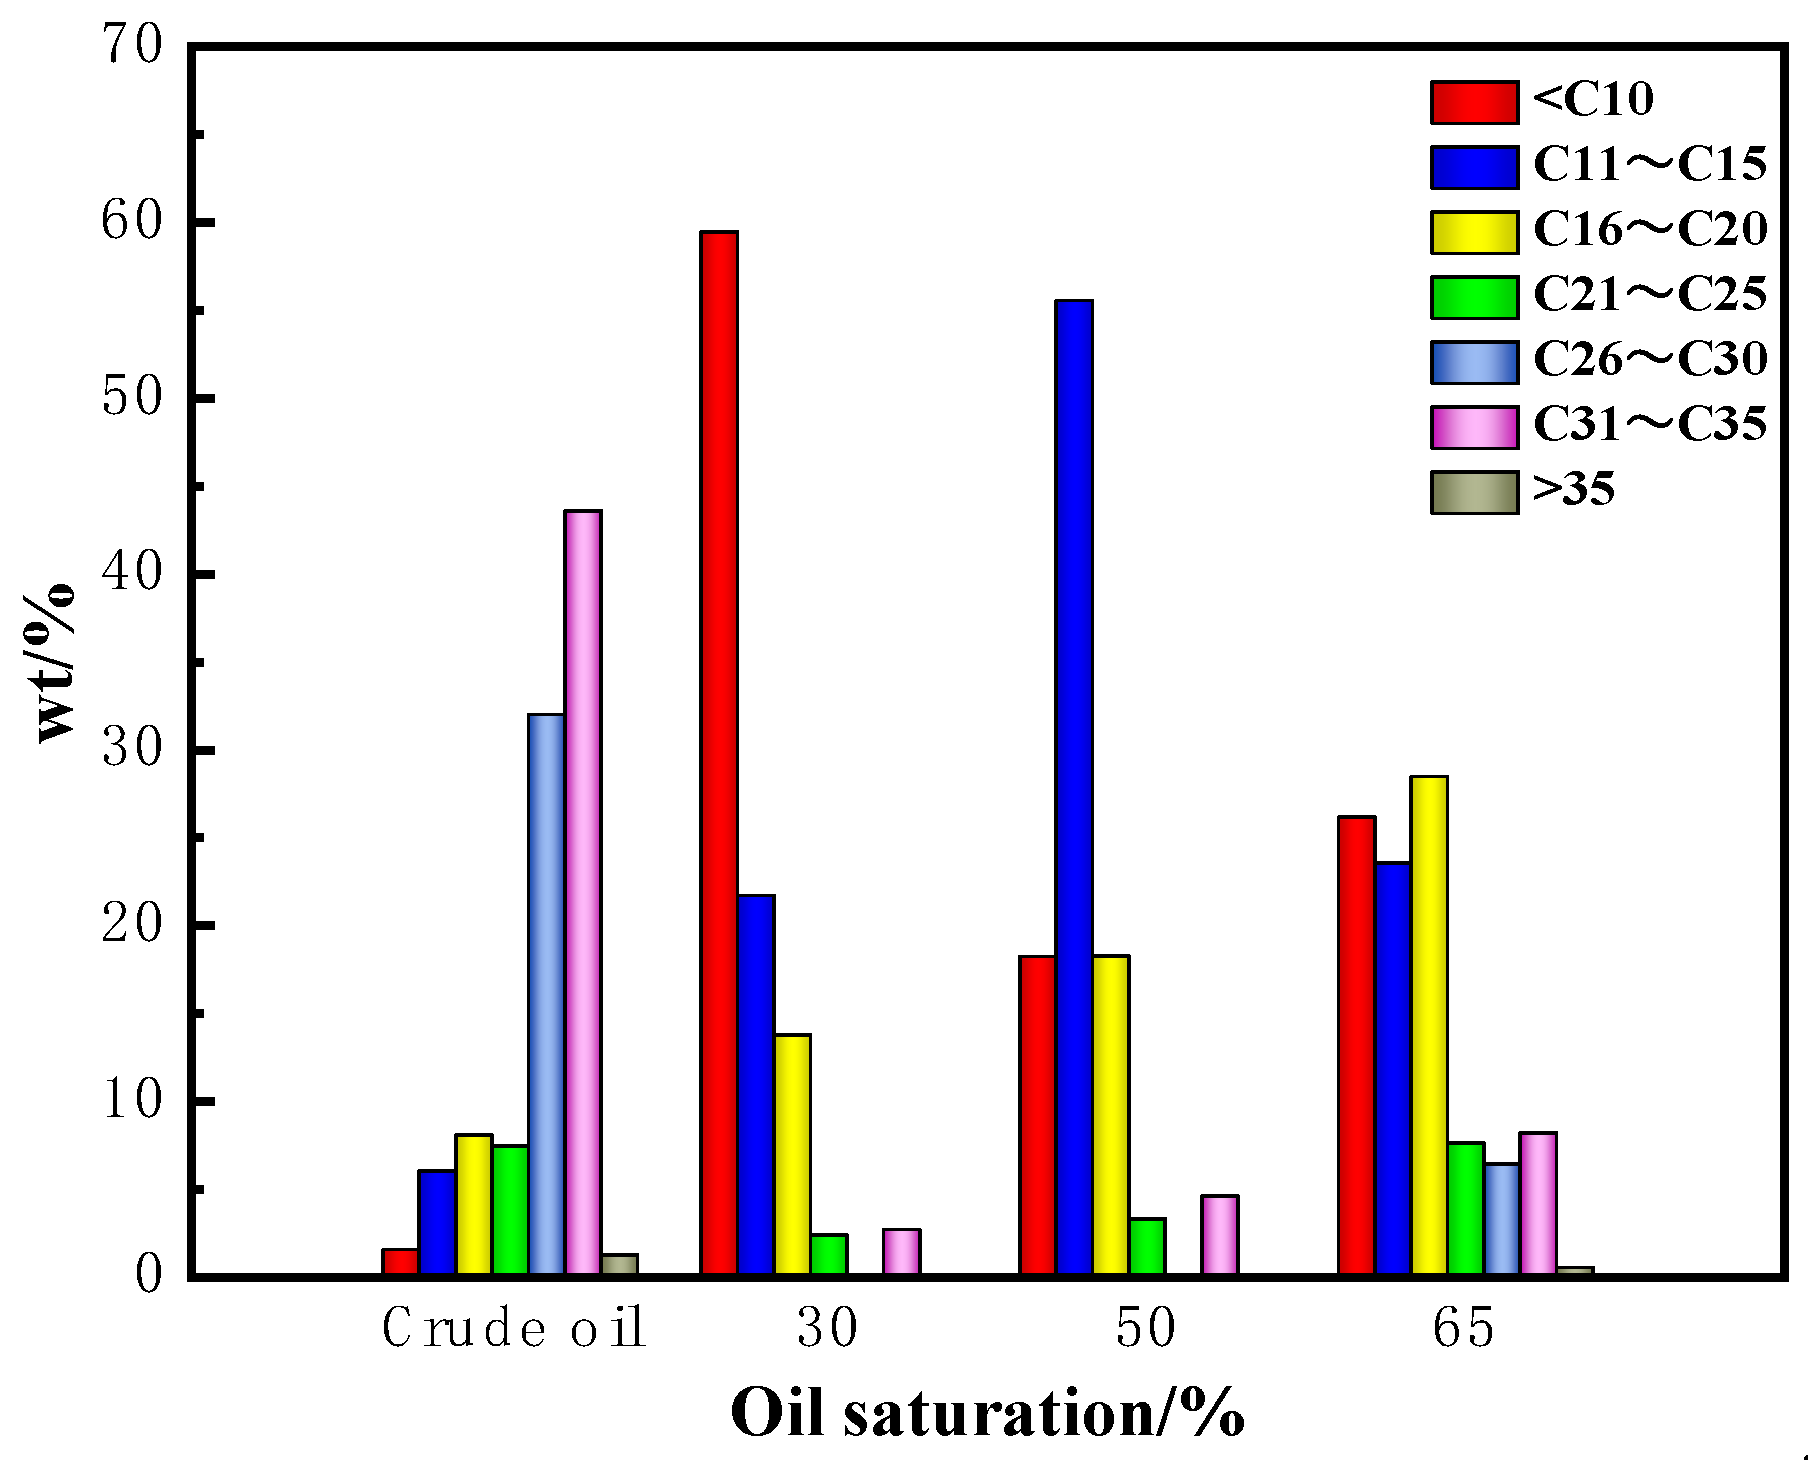
Figure 10.
The infrared spectra of fire-flooded produced oil under different oil saturation conditions and crude oil.
Figure 10.
The infrared spectra of fire-flooded produced oil under different oil saturation conditions and crude oil.
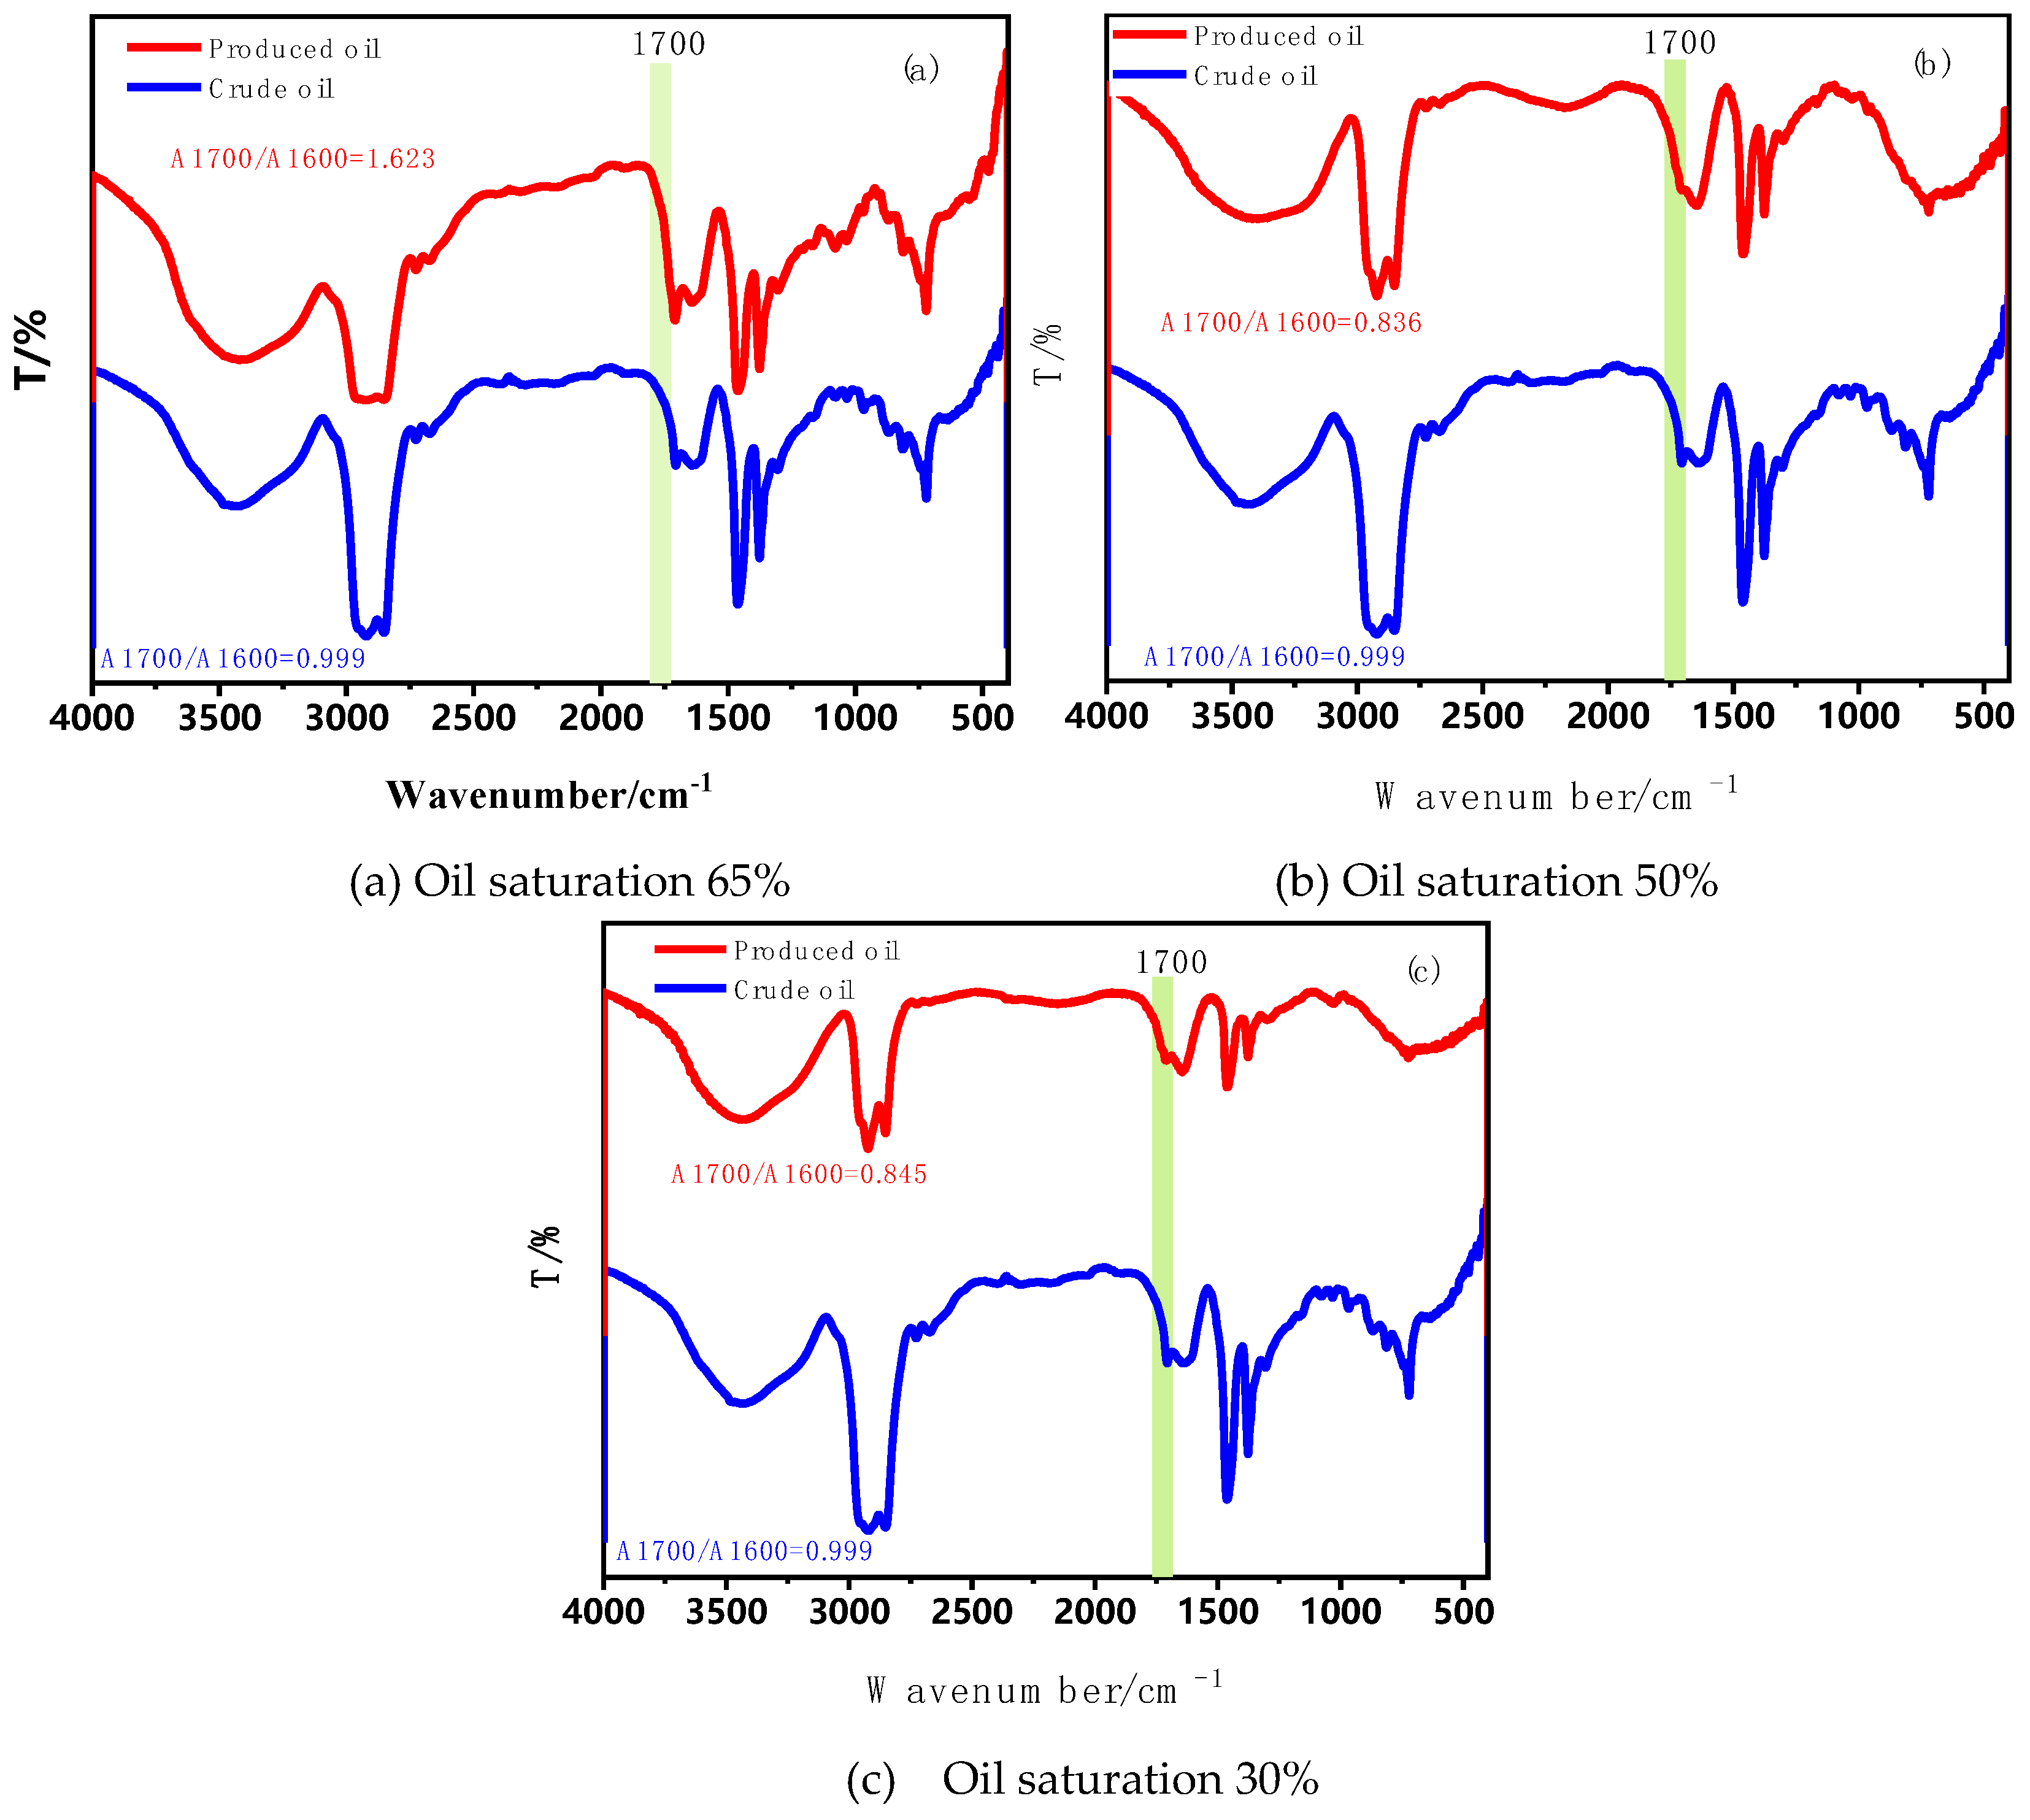
Figure 11.
Comparison of A1700 / A1600 characteristics of fire-flooded produced oil under different oil saturation conditions and crude oil.
Figure 11.
Comparison of A1700 / A1600 characteristics of fire-flooded produced oil under different oil saturation conditions and crude oil.
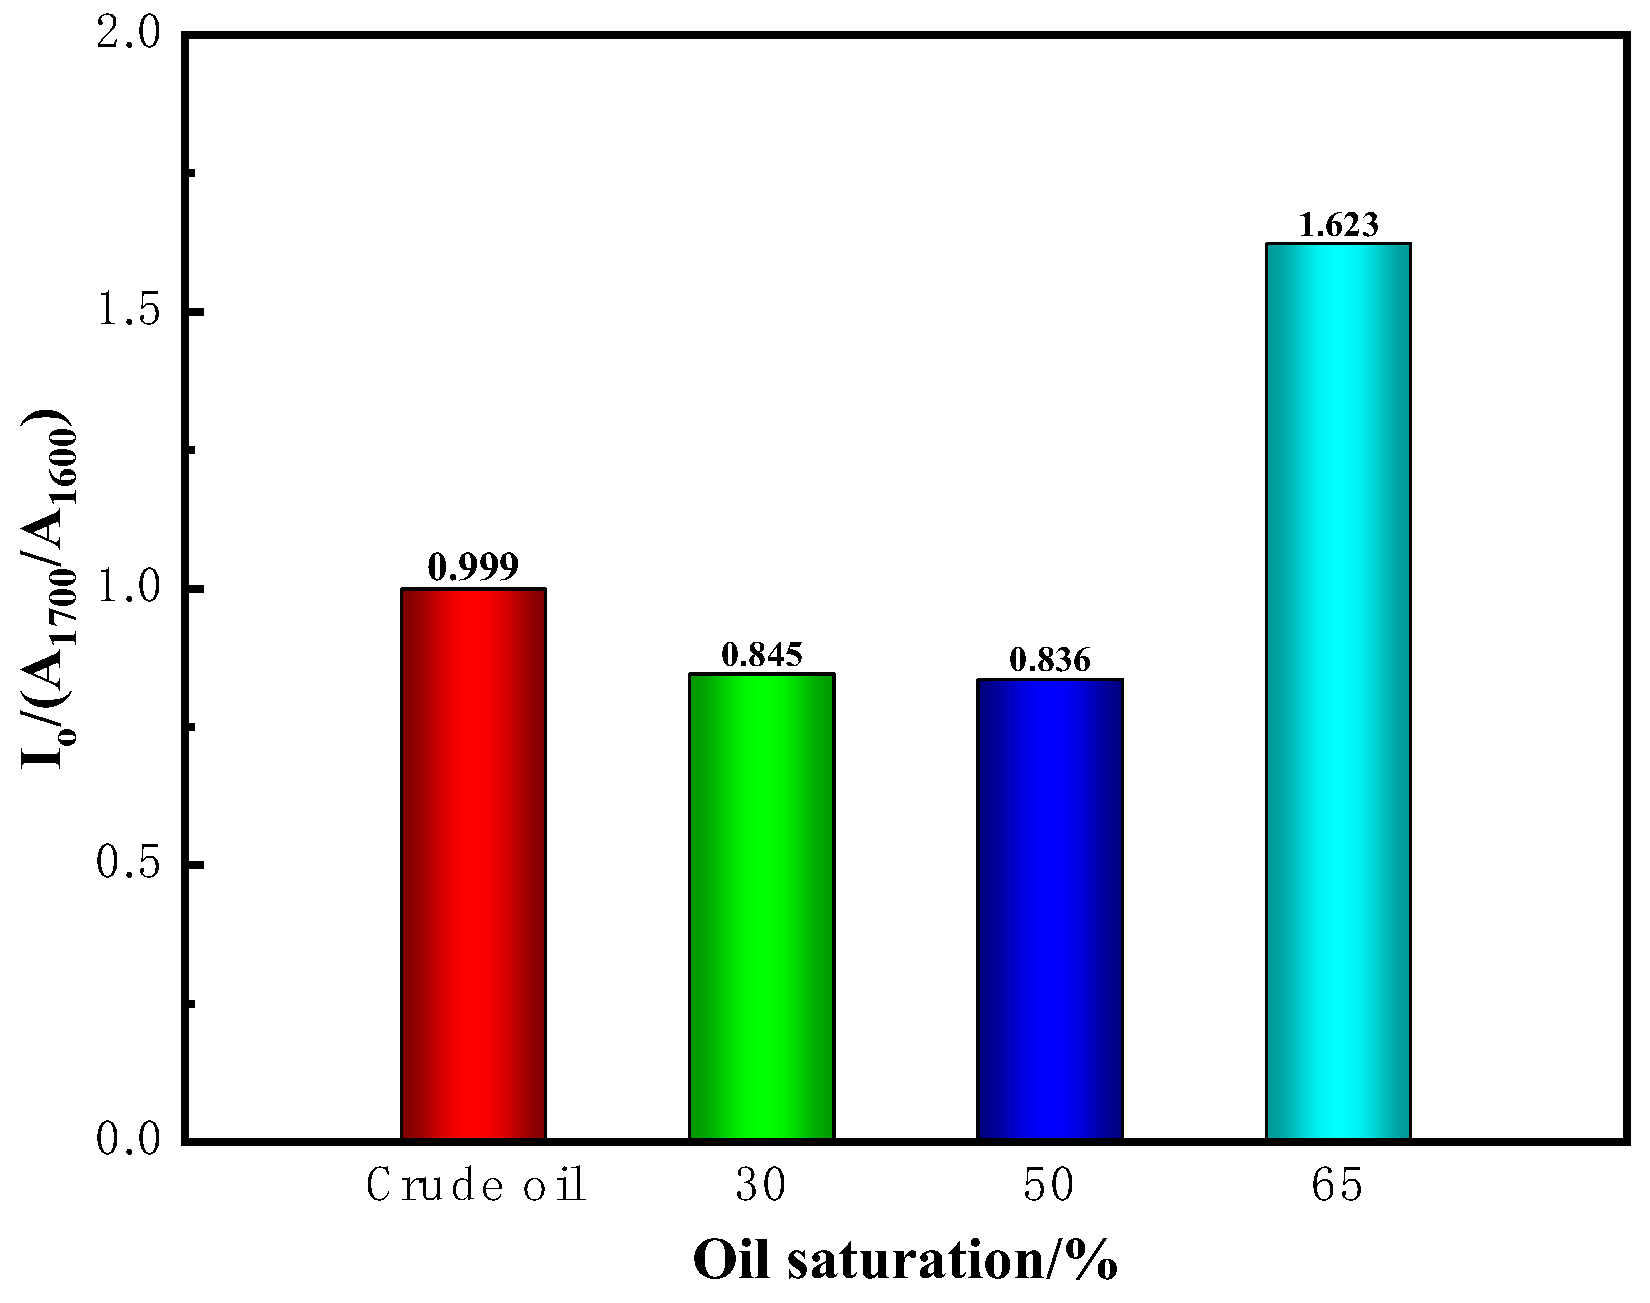
Figure 12.
Analysis of the content of each component in crude oil and produced oil before and after fire flooding using GC-MS.
Figure 12.
Analysis of the content of each component in crude oil and produced oil before and after fire flooding using GC-MS.
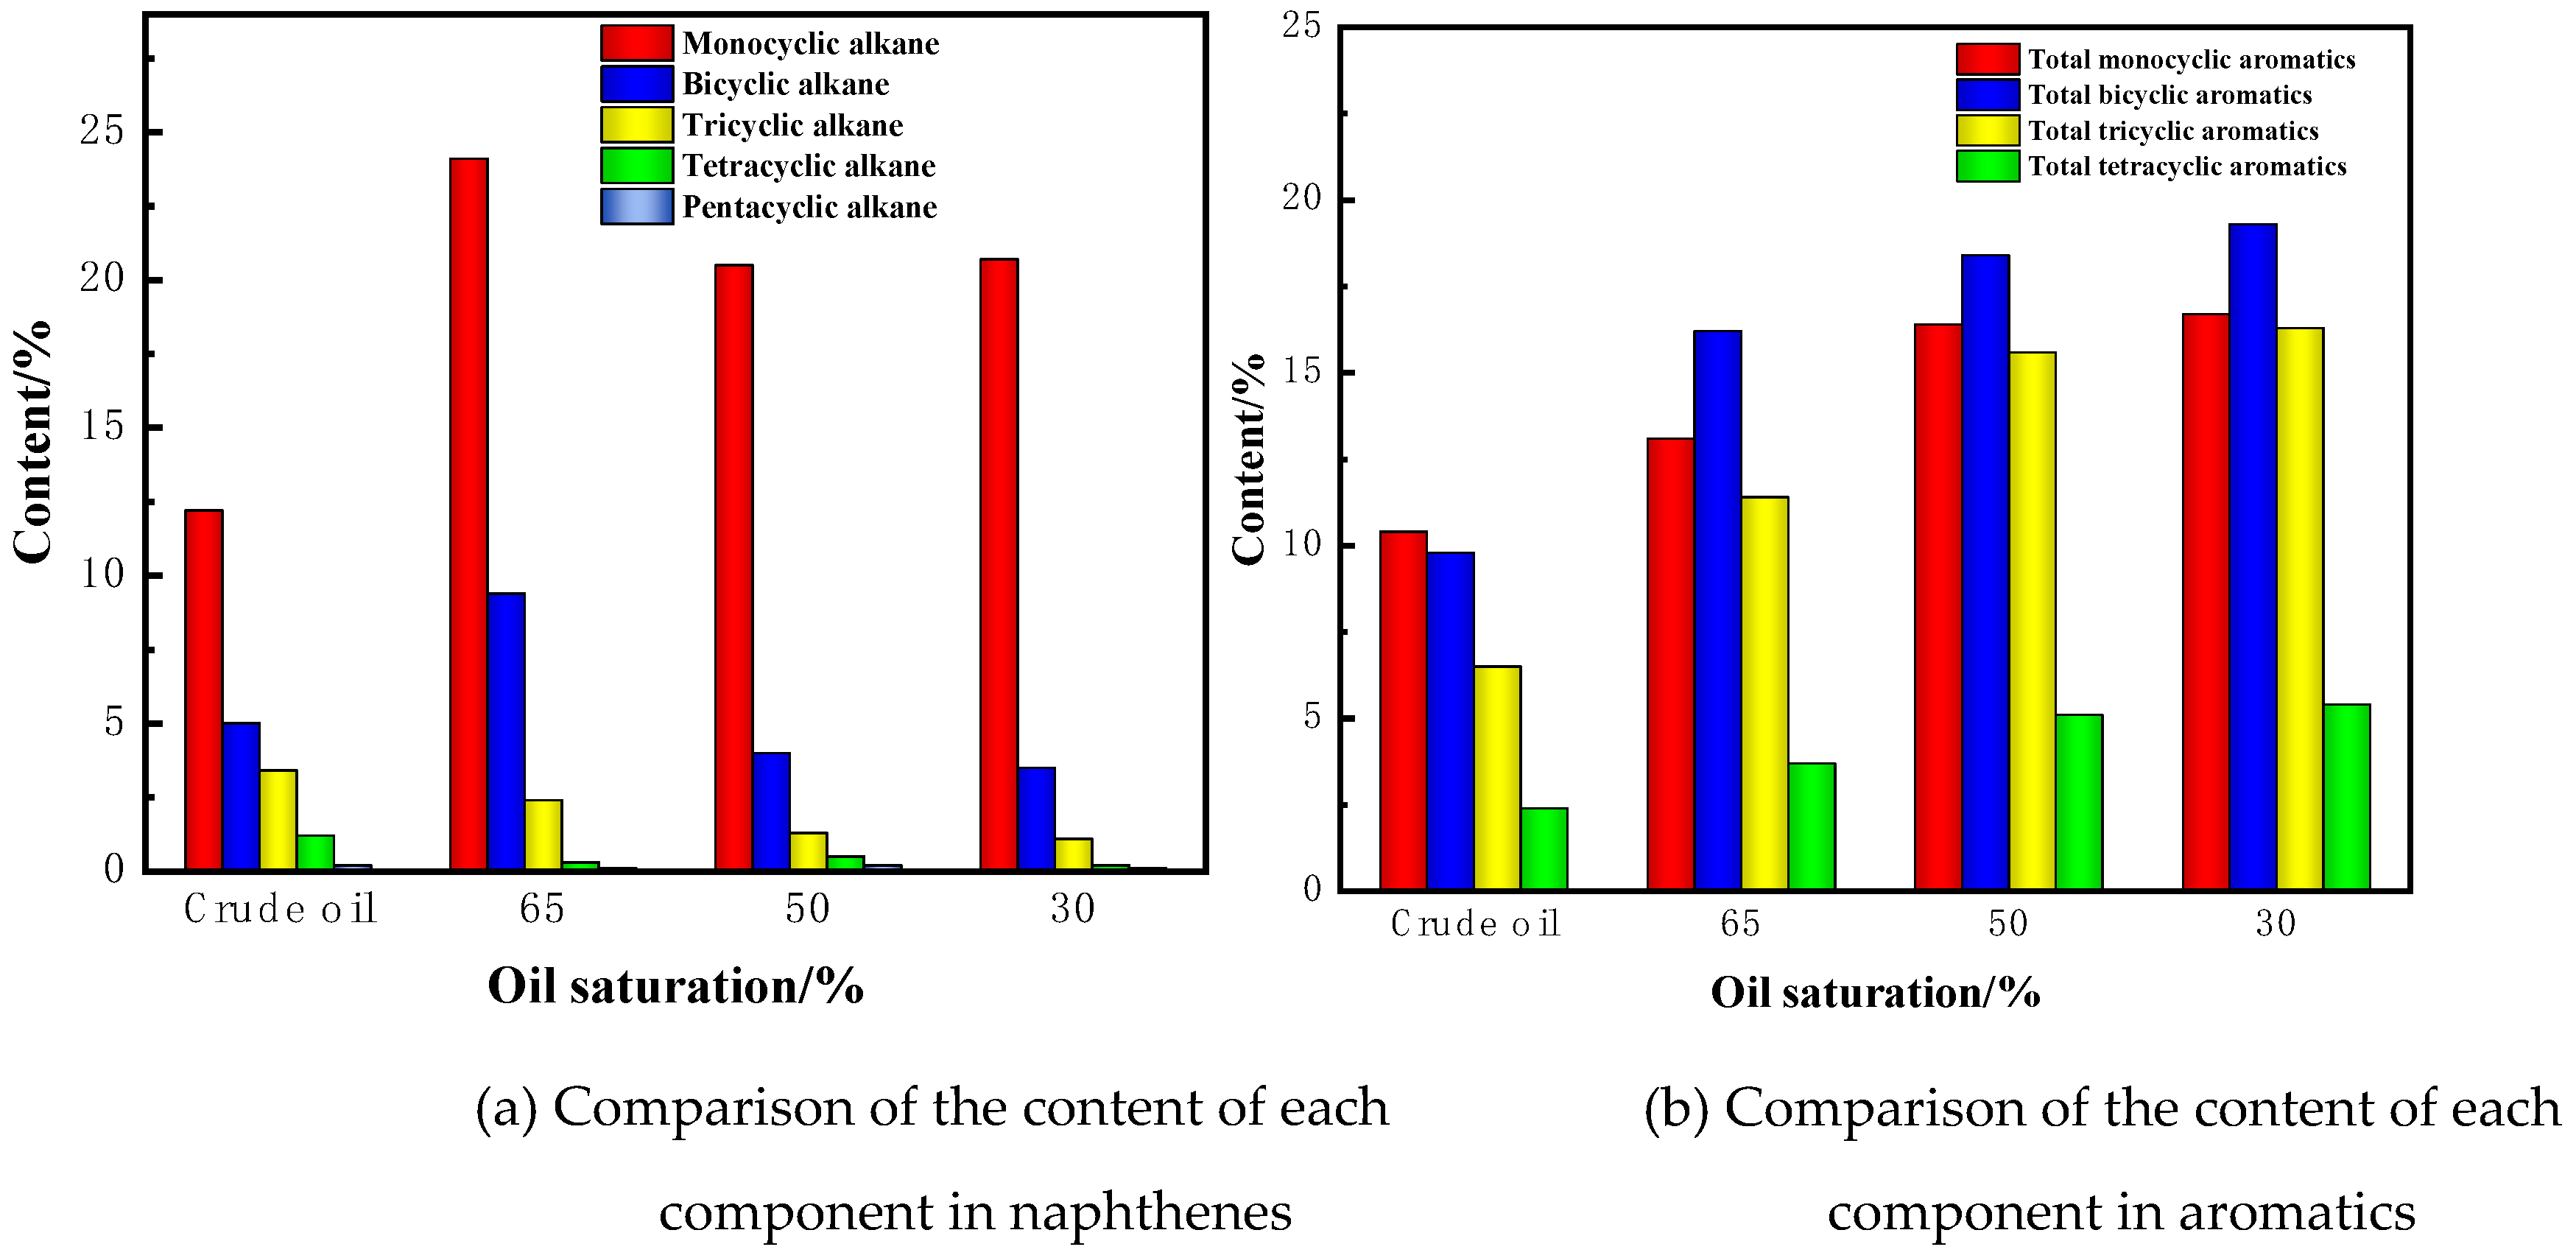
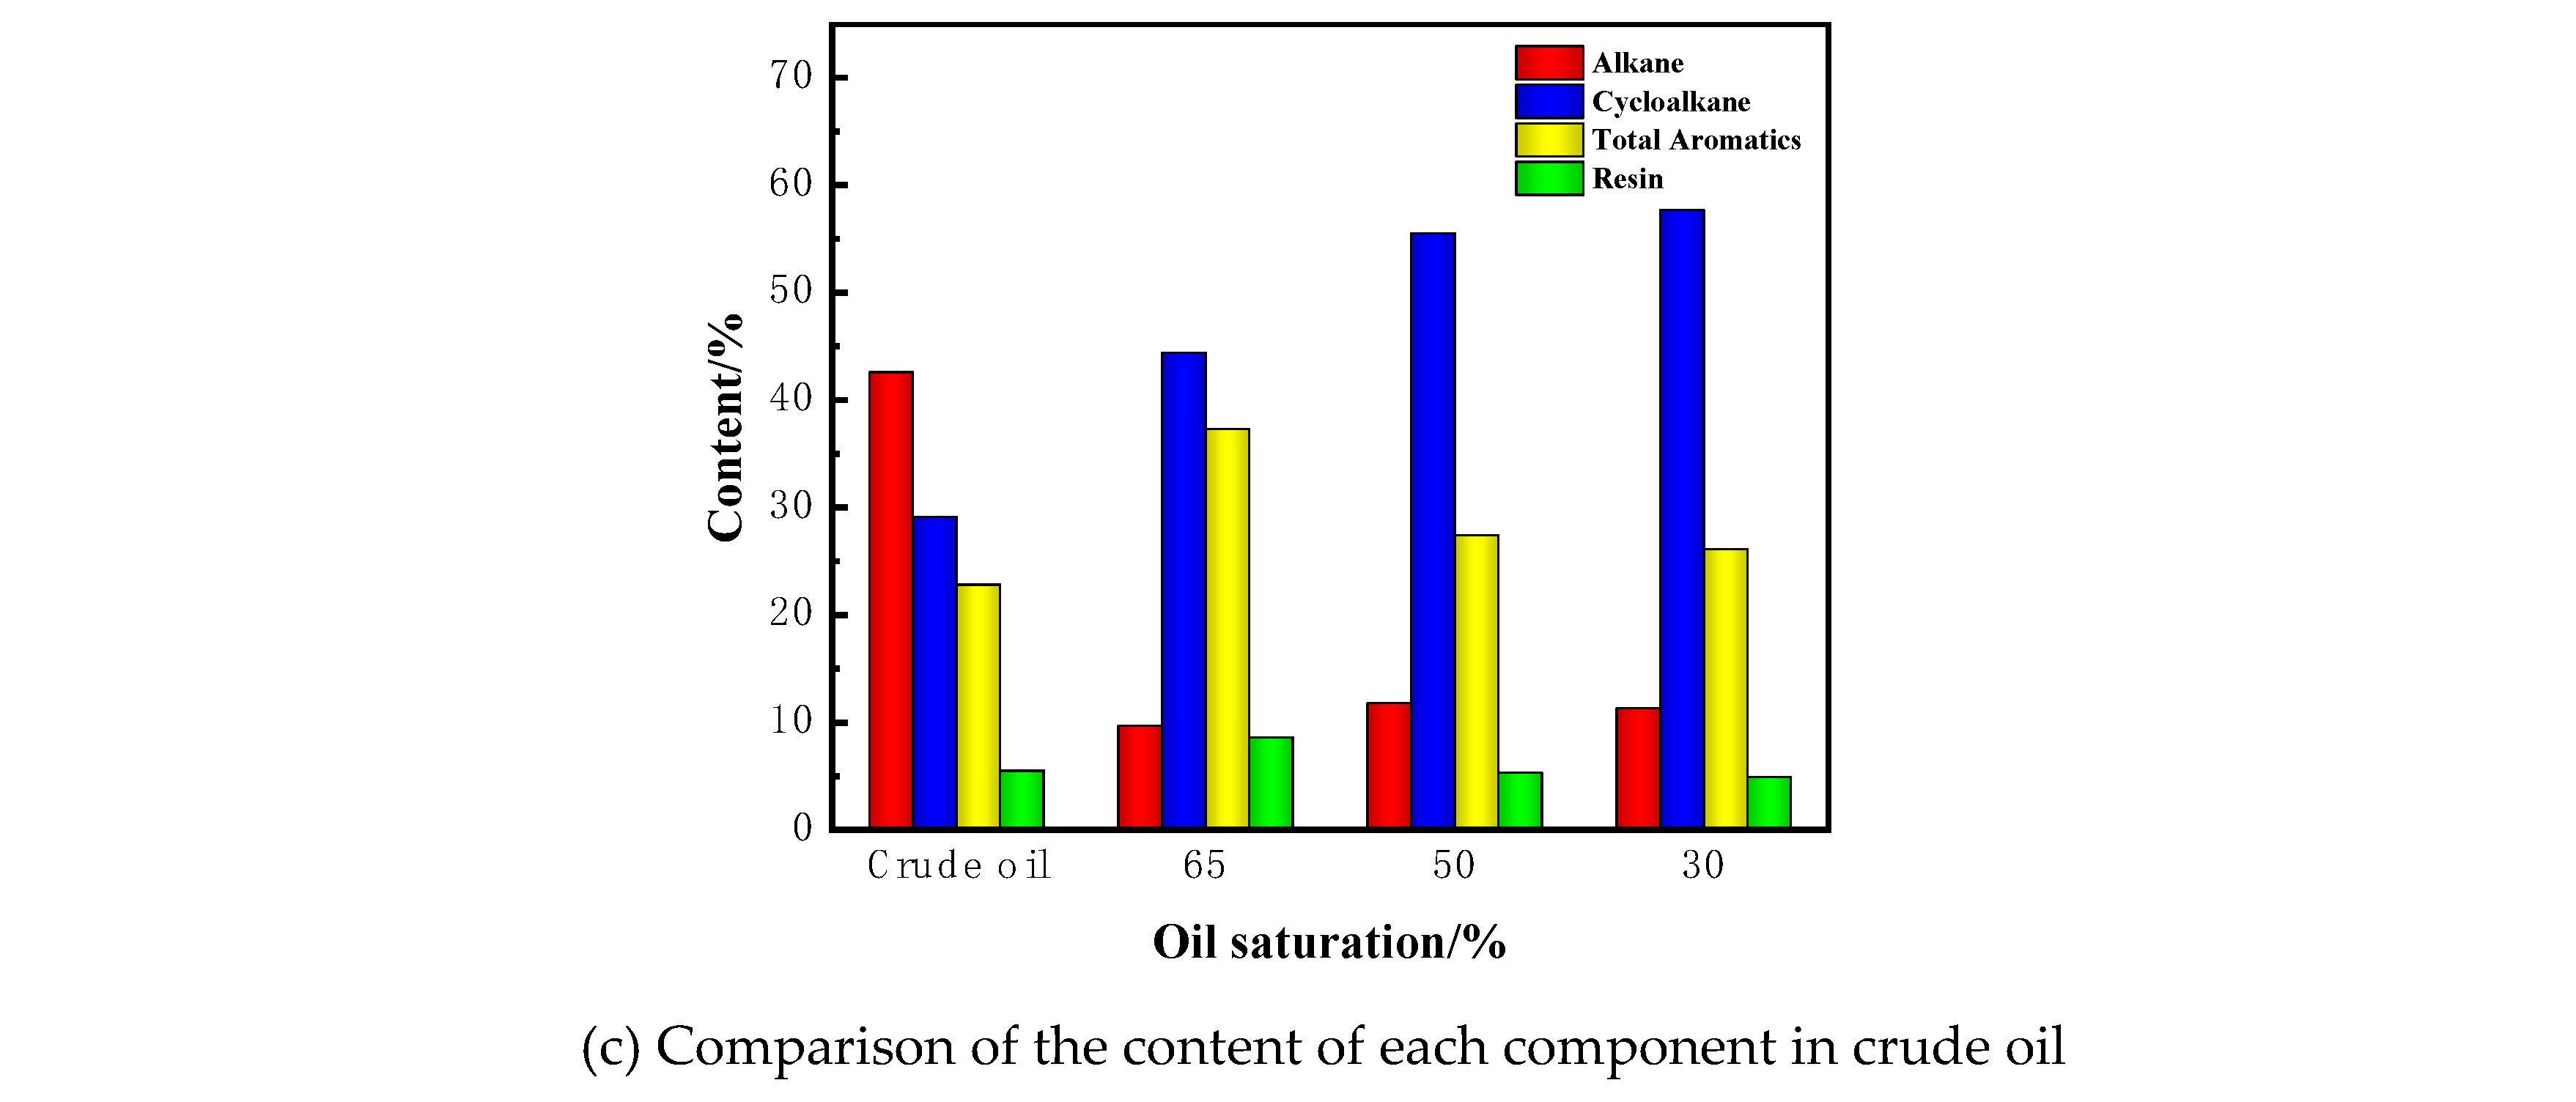
Figure 13.
Distribution of reservoir zones during the high temperature combustion oil displacement process [20].
Figure 13.
Distribution of reservoir zones during the high temperature combustion oil displacement process [20].
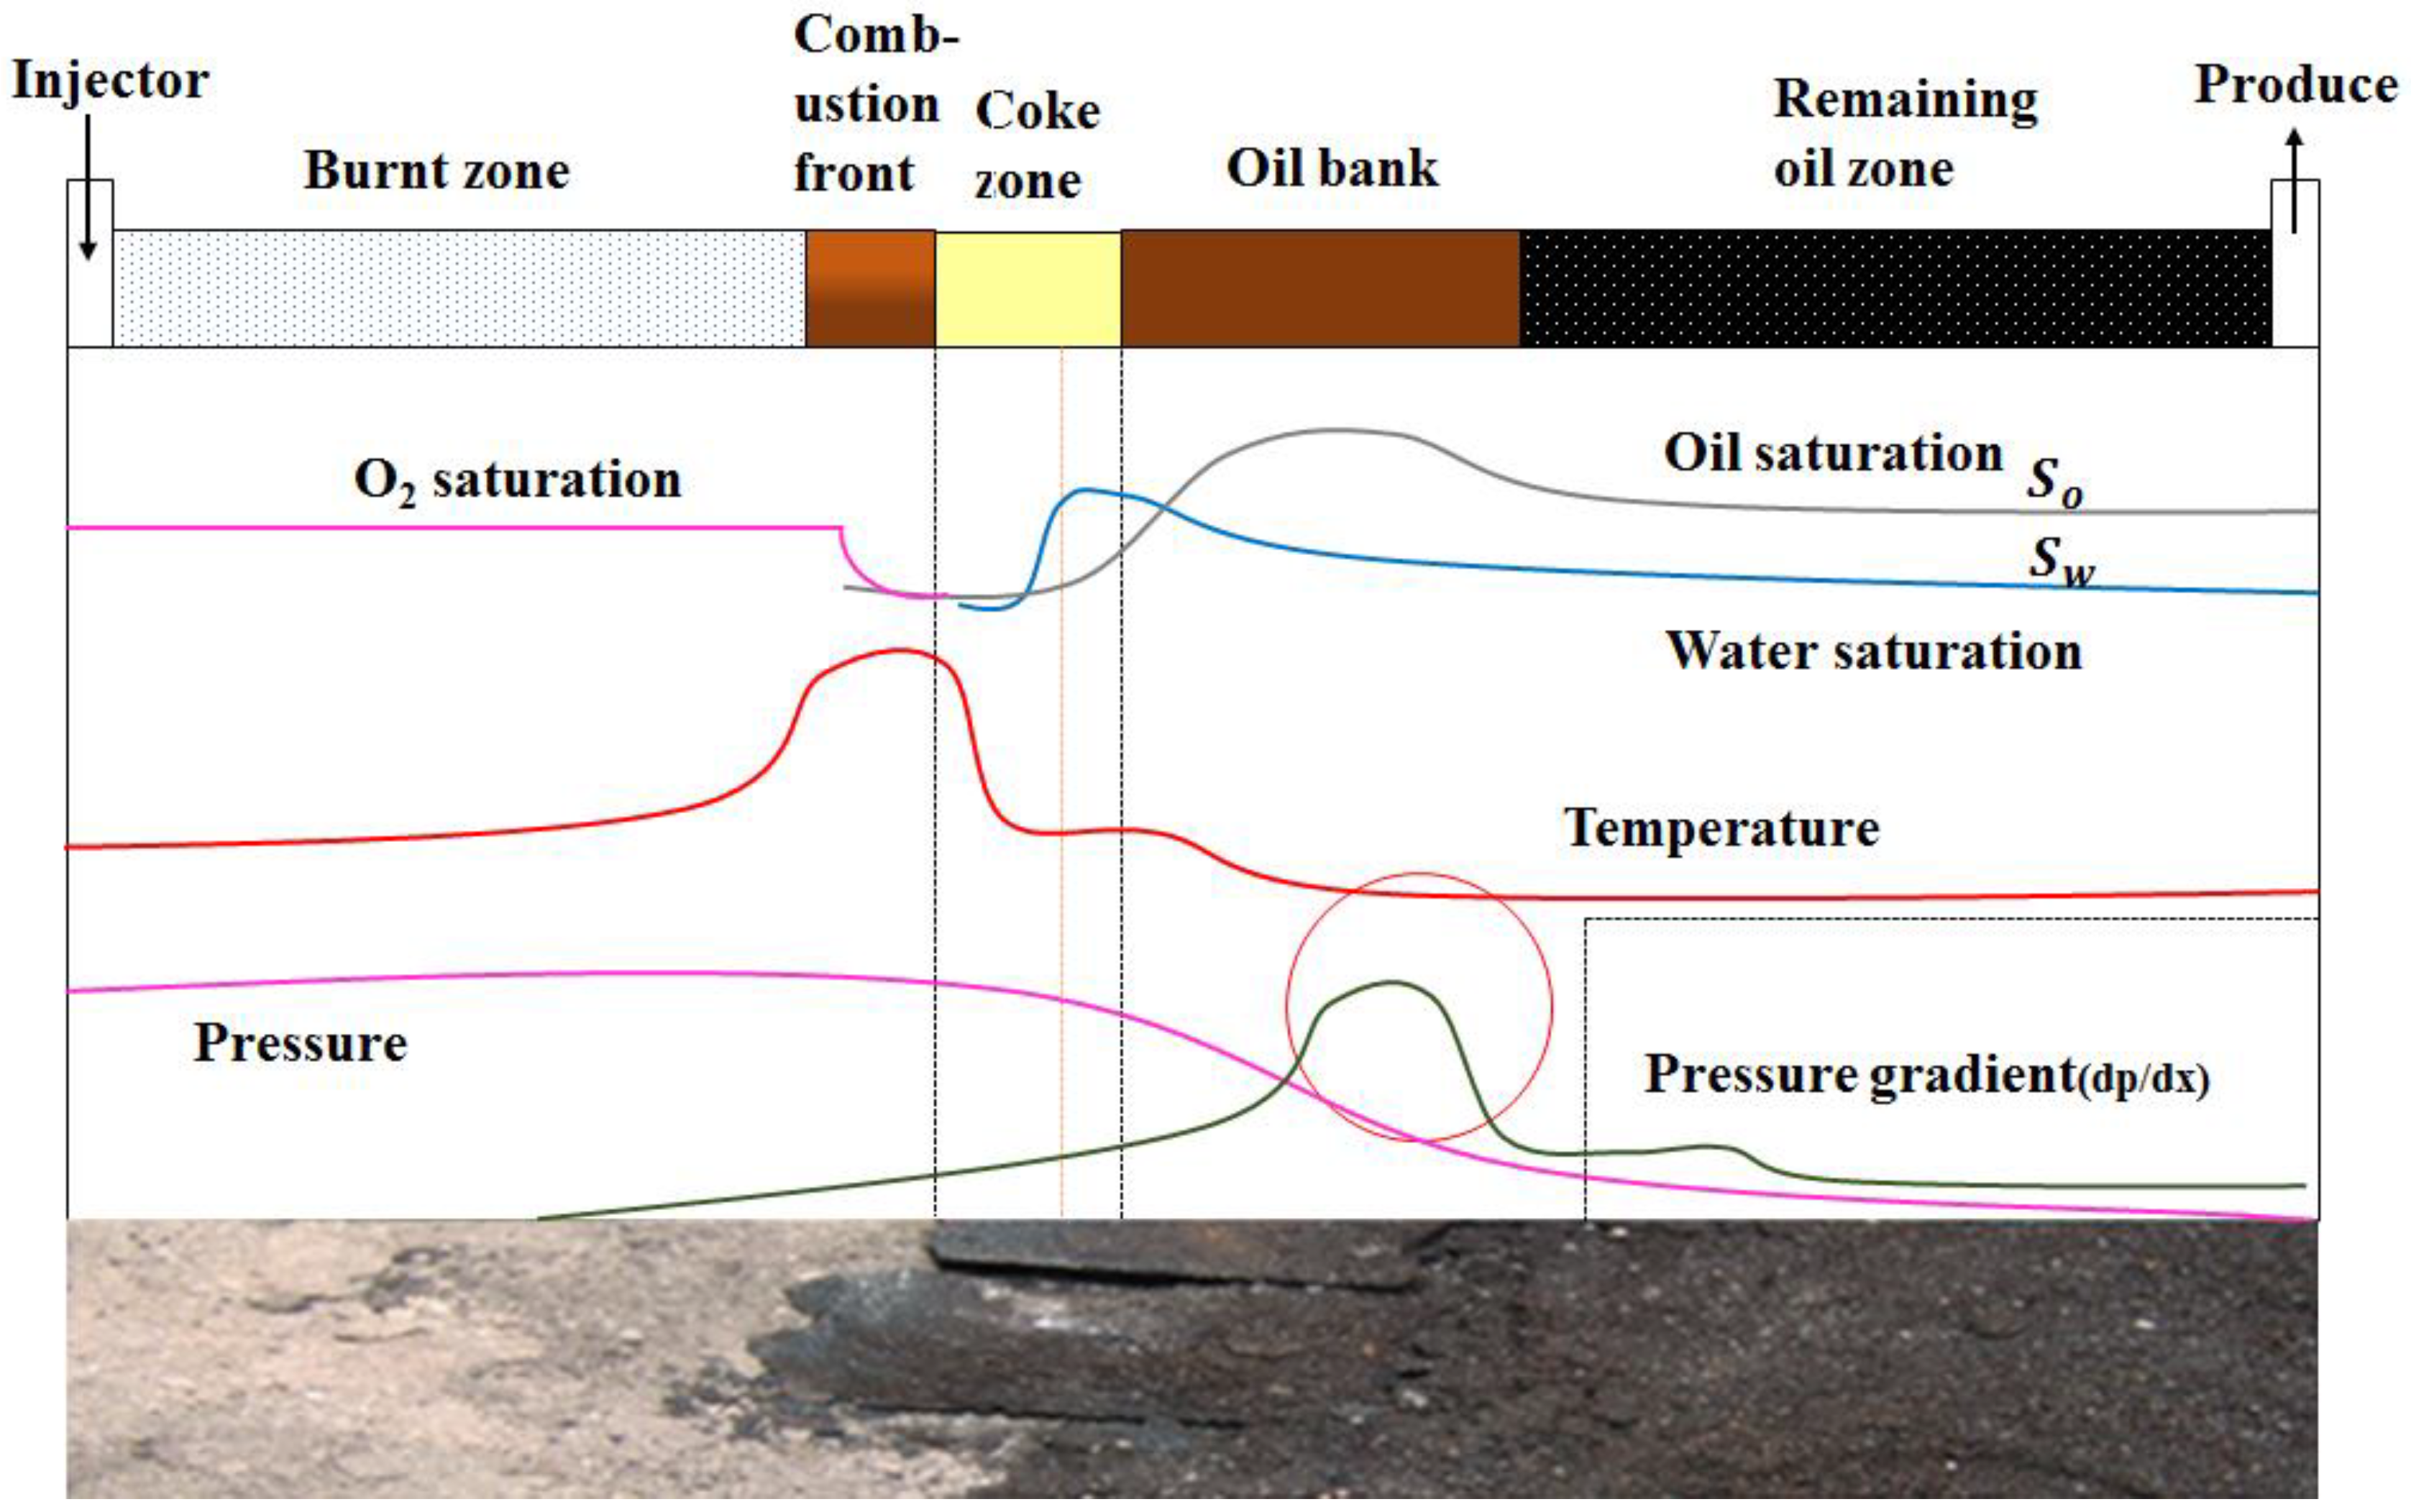
Table 1.
Basic Parameters of Heavy Oil.
| Crude Oil Group Composition(wt%) | |||
|---|---|---|---|
| Saturates | Aromatics | Resins | Asphaltenes |
| 51.75 | 15.18 | 22.76 | 10.31 |
| Density/g/cm3(20°C) | Viscosity/mPa·s(50°C) | Average Molecular Weight | |
| 0.9208 | 1908 | 532.6 | |
Table 2.
Experimental condition.
| Number | Experimental parameters | Oil Saturation(%) | ||
| 65 | 50 | 30 | ||
| 1 | Ventilation intensity Nm3/(m2·h) | 60 | 60 | 60 |
| 2 | Permeability /μm2 | 1.68 | 1.69 | 1.69 |
| 3 | Porosity /% | 41.06 | 40.87 | 39.43 |
| 4 | Water content saturation /% | 35 | 50 | 70 |
| 5 | Ignition temperature /°C | 500 | 500 | 500 |
| 6 | Pressure /MPa | 6 | 6 | 6 |
Table 4.
Oil Density, Molecular Weight, and Group Composition of Produced Oil under Different Oil Saturation Conditions During Fire Flooding.
Table 4.
Oil Density, Molecular Weight, and Group Composition of Produced Oil under Different Oil Saturation Conditions During Fire Flooding.
| Sample | 20°C Density(g/cm3) | Molecular Weight | Group Composition (wt%) | |||
| Asphaltenes | Saturates | Aromatics | Resins | |||
| Crude oil | 0.9223 | 532 | 10.31 | 51.75 | 15.18 | 22.76 |
| Oil saturation 65% | 0.9213 | 294 | 1.66 | 62.56 | 17.54 | 18.25 |
| Oil saturation 50% | 0.9442 | 264 | 3.61 | 54.84 | 19.35 | 22.20 |
| Oil saturation 30% | 0.9341 | 226 | 1.99 | 53.48 | 23.06 | 21.47 |
Disclaimer/Publisher’s Note: The statements, opinions and data contained in all publications are solely those of the individual author(s) and contributor(s) and not of MDPI and/or the editor(s). MDPI and/or the editor(s) disclaim responsibility for any injury to people or property resulting from any ideas, methods, instructions or products referred to in the content. |
© 2024 by the authors. Licensee MDPI, Basel, Switzerland. This article is an open access article distributed under the terms and conditions of the Creative Commons Attribution (CC BY) license (http://creativecommons.org/licenses/by/4.0/).
Copyright: This open access article is published under a Creative Commons CC BY 4.0 license, which permit the free download, distribution, and reuse, provided that the author and preprint are cited in any reuse.


