
Submitted:
27 November 2024
Posted:
28 November 2024
You are already at the latest version
Abstract
With the rapid global growth of digital devices and electric vehicles, solid polymer electrolytes (SPEs) have emerged as promising candidates for all-solid-state batteries. They are expected to resolve safety concerns and overcome the limitations of energy density and charging speed found in traditional Li-ion batteries with liquid electrolytes. However, a limited understanding of the ionic conduction mechanisms remains a significant barrier to their further development and practical application. In this study, we employed molecular dynamics simulations to investigate the static and dynamic properties of poly(ethylene carbonate) (PEC) electrolytes at various salt concentrations. Key analyses included the radial distribution function, solvation free energy, and mean-square displacement (MSD) of individual Li cations. Based on their MSD data, Li cations were categorized into "faster" or "slower" groups, corresponding to conductivity levels above or below the average in each model. Our findings reveal that, at higher concentrations, a smaller fraction of faster Li cations contributes disproportionately more than slower Li cations to the overall mobility, indicating that the faster ions dominate ion transport more significantly in concentrated electrolytes. Additionally, changes in coordination number and solvation free energy for both faster and slower Li cations suggest the existence of three different solvation patterns as salt concentration increases. These insights provide a deeper understanding of ionic transport and solvation structures in PEC electrolytes, with potential implications for the design of more efficient all-solid-state batteries.
Keywords:
solid polymer electrolyte
; poly(ethylene carbonate)
; lithium battery
; molecular dynamics
; solvation free energy
1. Introduction
With the continuous development of digital technologies, the demand for energy storage devices such as lithium-ion secondary batteries is increasing. However, commercial liquid electrolytes pose safety risks due to their flammability and potential leakage [1]. Solid polymer electrolytes (SPEs) offer an inherently safer alternative and hold promise for addressing these safety concerns in Li-ion batteries [2]. SPEs are stable with metallic Li anodes and can potentially prevent the formation of Li dendrites. As a result of such advantages, they enable higher energy density in all-solid-state lithium batteries [3]. Compared to inorganic solid electrolytes, polymer-based electrolytes offer advantages such as simpler production, cost-effectiveness, higher workability, and enhanced mechanical toughness [4]. Therefore, SPEs are considered a strong candidate for all-solid-state battery [5]. Nonetheless, despite significant advances, polymers like poly(ethylene oxide) (PEO) still have comparatively lower ionic conductivity compared to liquid or inorganic solid electrolytes [6].
PEO is known to be the first polymer matrix for SPE where ionic conductivity was experimentally measured [7], and earlier research on polymer electrolytes demonstrated a close relationship between polymer structure and ionic conductivity, highlighting how polymer-specific properties like glass transition temperature (Tg) and segmental mobility relate to ion transport. Many experiments and molecular simulation studies have been conducted to shed light on the mechanisms behind ionic conduction in polymer electrolytes [8]. For example, Guo et al. used electrochemical methods and Monte Carlo simulations to investigate ionic conduction in composite polymer electrolytes, showing that ionic conduction is predominantly influenced by space-charge regions at the interfaces between different phases [9]. Some studies focused on temperature’s role in conductivity, from which they developed and applied the dynamic bond percolation (DBP) theory in molecular dynamics (MD) simulations [10,11]. Borodin et al. conducted MD and Monte Carlo simulations on PEO-based electrolytes, explaining charge migration within the system through the renewal of hopping probabilities [12]. Ganesan et al. examined the influence of SiO2 nanoparticles on the ion transport within PEO/LiBF4/SiO2 composite polymer electrolytes using MD simulations, showing that adding nanoparticles reduced the overall ionic conductivity of electrolyte as the result of the decrease of segmental motion in polymer chains [13].
Understanding the mechanisms of fast ionic conduction and accurately predicting ionic conductivity are essential for the design and development of SPEs. This captures the unique features of polymers, such as glass transition and segmental motions, and connects them to ionic mobility. In our present studies, novel poly(alkylene carbonate) electrolytes, particularly poly(ethylene carbonate) (PEC), which are promising candidates have been investigated due to their excellent salt solvation capabilities and unusual Tg behavior, which plays a key role in their unique ionic conduction performance [14,15]. Moreover, PEC can be synthesized through the polymerization of carbon dioxide and epoxides, offering potential environmental benefits by utilizing carbon dioxide [16,17].
Achieving high ionic conductivity is critical for solid electrolytes, and ongoing efforts aim to enhance this property while maintaining other important characteristics [18]. A key challenge in studying ion-transport in SPE, or especially in concentrated electrolyte systems, is understanding how solvation of ions impacts transport properties at higher concentrations. This challenge has become even more critical with recent advances in computational capabilities, which now allow for more accurate analysis of transport properties [19,20,21]. In our previous simulation studies, we calculated the free volume and Li-ion coordination numbers of PEC and lithium bis(trifluoromethanesulfonyl) imide (LiTFSI) at various concentration ratios using radial distribution functions (RDF) [22]. With the changes of coordination numbers, we found that the interactions between Li cations and polymer chains weakened as the concentration of Li salt increased. However, these interactions were still sufficient to promote the dissociation of ion pairs, maintaining a high concentration of free ions in the electrolyte while preventing the formation of overly stable coordination structures similar to those observed in PEO-based electrolytes [23]. Comparing these results with FT-IR data [24], we also observed a consistent increase in free volume, in line with FT-IR findings on aggregated ion groups, indicating that the formation of aggregated ions ultimately leads to an increase in free volume, improving both Li cation and polymer segment mobility, and thus enhancing ionic conductivity.
In this paper, the distribution of diffusivity for each Li cation in PEC/LiTFSI electrolyte models was investigated with different Li salt concentrations, classifying Li cations into “faster” and “slower” groups. The coordination numbers and solvation free energies (SFE) of these two groups were examined for various electrolyte concentrations to gain a comprehensive understanding of how coordination chemistry and solvation effects influencing on ion-transport properties in the electrolyte.
2. Computational Details
2.1. Modeling and Structure Optimization
The construction of the electrolyte models followed a stepwise procedure as established in our previous study [22]. First, an ethylene carbonate (EC) monomer model was created, along with individual models for the lithium cation (Li+) and the bis(trifluoromethanesulfonyl) imide anion (TFSI-). Each of these models was then individually optimized for both energy and structure using the B3LYP/6-31++G** quantum calculation method based on Gaussian basis functions. Afterward, an EC unit was generated from the optimized EC monomer, and poly(ethylene carbonate) (PEC) polymer chains, each composed of 20 EC units, were formed. In the next step, 10 chains of PEC were filled with LiTFSI salt ions. All the LiTFSI ions were added as separate Li+ or TFSI- ions, in quantities corresponding to specific concentrations of x mol% (x = 5, 10, 20, 40, 60, 80, 100, and 120), and were placed into a single simulation box using the Amorphous Cell module (600 carbon atoms, 804 hydrogen atoms, and 602 oxygen atoms were contained in each model, and organized into 10 polymer chains). The Amorphous Cell module, which employs a Monte-Carlo-based method, was used to generate amorphous models with periodic boundary conditions. Finally, two successive molecular dynamics (MD) simulations were performed for each amorphous model: the first under NPT (conserved number of atoms, pressure, and temperature) ensemble and the second under NVT (conserved number of atoms, volume, and temperature) ensemble, both at 298 K, to ensure equilibrium within each system.
Figure 1.
Chemical Structures and molecular models of (a) PEC chain and (b) TFSI- ion.

2.2. Computational Methods
The simulations in this study, including the modeling steps mentioned earlier, were performed using the Materials Studio (MS) 7.0 package and its built-in modules [25]. Specifically, all molecular dynamics simulations were carried out using the Forcite module with the COMPASS II molecular force field, which also provided the forcefield-assigned charges. COMPASS II is a widely used force field that relies on empirical parameters and is scaled from ab initio HF/6-31G* calculations. It is particularly effective for atomistic simulations of organic compounds, inorganic molecules, and polymers. Considering the balance between accuracy and computational cost required for different aspects of this study, we have carefully selected the appropriate functionals and methods for each technique, as detailed below. Electrostatic interactions were calculated using the Ewald summation method with an accuracy of 0.001 kcal/mol. For van der Waals interactions, the Atom based method was employed with a cutoff distance of 12.5 Å. The pressure for all NPT simulations was maintained at 0.0001 GPa (approximately 1 atm) using the Berendsen barostat, with a relaxation time constant of 0.1 ps. During the NPT and NVT simulations, the temperature was kept at around 298 K using a Nosé-Hoover thermostat, also with a 0.1 ps relaxation time. Each MD process continued from the final structure of the preceding simulation, ensuring a smooth transition between NPT/NVT/NVE simulations. To guarantee that the models reached equilibrium, a simulation time of 2000 ps was used for each MD process, with an integration time step of 1 fs. To better analyze the mean-square displacement (MSD) of Li cations and distinguish between faster and slower Li cations, a snapshot of the model was saved every 1 ps throughout the simulations.
2.3. Mean-Square Displacement
Ionic conductivity (σ) is one of the most critical properties for assessing the conductive performance of polymer electrolytes. When discussing the behavior of Li cations, the conductivity is directly proportional to the self-diffusion coefficient (D), which represents the diffusion capability of the ions, as shown in Equation (1). Furthermore, the self-diffusion coefficient D is related to the mean-square displacement according to Equation (2). Thus, for simplicity, by calculating the ΔMSD of Li cations, we can effectively compare the conductive capacities of individual Li cations within the same model. In line with our recent studies, we computed the ΔMSD of Li cations using NVE (conserved number of atoms, volume, and energy) MD simulations with a duration of 1000 ps and a sampling step of 1 ps.
where, q is the charge of an ion, ρ is the number density of ions in the system (here ρ is defined as the ratio of the total number of Li cations to the cell volume in the simulation system), kB is the Boltzmann constant, T is the absolute temperature, N is the total number of such ions, t is the simulation time, rm(0) is the initial position of ion m, and rm(t) is the recent position of ion m at simulation time t.
Finally, for each Li cation m, its transport number t+(m) is calculated based on the conductive distribution of Li cations and anions in the system, as shown below:
This equation describes the fraction of the total conductivity attributed to Li cations in the system. We will use it to analyze the differences between the faster and slower Li cations.
2.4. Coordination Number
The radial distribution function (RDF) is an important measure for polymer electrolytes, as it provides insight into the local environment and coordination structure around each atom or ion. In this study, the RDF was utilized to examine the ionic solvation structure in PEC/LiTFSI electrolytes, especially in concentrated models. In MS, the RDF is represented as a function g(r), which was computed using data from the last 100 ps of the NPT simulations described in Subsection 2.1. Modeling and Structure Optimization. The RDF for any given atom can be defined using the following equation:
where n(r) is the total number of surrounding atoms within a shell at a distance between r and r+dr, and 4πr2 is the solvation area of the shell; here ρ is the number density of Li-ion’s surrounding atoms as previously defined in Equation (2). It is evident that in this study, by specifying a cutoff distance that satisfies the coordination distance, the coordination number (CN) of a Li cation can be defined as the integral of its n(r) over r.
2.5. Solvation Free Energy
The solvation free energy (SFE) task of the Forcite module calculates the reversible work needed to transfer a solute from the gas phase into the solvation system. This solvation process is determined through three distinct steps: first, the solute molecule in the gas phase is discharged, and the associated free energy change is calculated. Next, the neutralized solute molecule is introduced to the fully charged solvent, and the free energy change for this interaction is determined. Finally, the solvated but uncharged solute molecule is recharged in the solvent environment, and the associated free energy is computed. Each of these three steps involves a series of molecular dynamics calculations, with the Helmholtz free energy changes obtained representing the ideal contribution, van der Waals contribution, and electrostatic contribution to the total solvation free energy of the system [25]. The total solvation free energy is the sum of the free energies from these three processes.
In these calculations, the force field is modified using coupling parameters, which are set to 0 at the start and gradually increased to 1 by the end, with a total of 10 steps to simulate the complete solvation process. Additionally, there are two algorithms that can be employed to compute free energy: thermodynamic integration and the acceptance ratio method. In the case of thermodynamic integration, the free energy derivative is computed during each MD simulation run and integrated after completing the steps of the coupling parameter. On the other hand, the acceptance ratio method assesses the likelihood of accepting changes to nearby coupling parameter values, from which the free energy is extracted. The thermodynamic integration method was used and specified the NVT ensemble for the MD simulation to obtain the Helmholtz free energy. The equilibration and production phases were set to 1000 steps and 5000 steps, respectively, to ensure accurate integration of the derivative. Additionally, to mitigate the impact of scale differences across different models on the SFE, we computed the Helmholtz free energy between solid-state Li cations and gas-phase Li cations for each model as a correction factor, as shown in Figure 2. Therefore, this comprehensive thermodynamic process pertains to the solvation effect of solid-state Li cations rather than their gas-phase counterparts, as the ΔASFE shown in Equation (5).
3. Results and Discussion
3.1. Mobility of Li Cations
The MSD data for all Li cations, each Li cation individually, and their averages were obtained in the PEC/LiTFSI electrolyte models ranging from 5 mol% to 120 mol% through MD simulations. Figure 3 illustrates the distribution of ΔMSD for Li ions in the SPE models at these three concentrations. Meanwhile, for ease of observation, the MSD data for three specific concentrations (20 mol%, 80 mol%, and 120 mol%) are shown in Figure S1. We found that for most of the Li cations, their ΔMSD values fall below the overall average of all Li cations. Furthermore, the proportion of such Li cations increases with increasing salt concentration. This suggests that the mobility differences between Li cations within the model also become more pronounced as the salt concentration increases, and it also implies that the variance in the energy levels of Li cations increases with concentration. In other words, the solvation environments of the Li cations within the model begin to show greater disparities as the concentration rises. With this in mind, we categorized the Li cations in the model into two groups based on whether their ΔMSD exceeds the mean value: those exceeding the average were classified as “Faster” (or “F” for short), while those below it were classified as “Slower” (or “S”). “Overall” (or “O”) represents all Li cations collectively. This allows us to conduct further analysis of the data for each group.
3.2. Contribution of Faster Group
After distinguishing between the faster and slower Li cations, we proceeded to calculate the changes in the number of ions in each group using the previously obtained MSD data. The results of this calculation are presented in Figure 4. Furthermore, as mentioned earlier, the contribution of each group to the transport numbers, denoted as t+(F) for faster ions and t+ (S) for slower ions, and these results were calculated in Figure 5. As a comparison to the decreasing relative proportion of the faster group, its contribution to ion transport is also shown in Figure 4. It is evident that despite the decrease of relative (and even absolute in some models) number of faster Li cations, their contribution to ion transport consistently remains around 70%. This demonstrates that, at high concentrations, the ion-transport efficiency of faster Li cations is significantly higher than that of slower Li cations. This result aligns with the relative conductivity shown in Figure 5, where the ratio of D(F) to D(S) is approximately 10:1 at high salt concentrations.
Similar to highly concentrated ionic liquids, highly concentrated SPEs contain a certain number of tight ion pairs and aggregated ions [26,27], which do not directly contribute to the conductivity. Therefore, actual conductivity is primarily provided by free ions [28]. This suggests that the proportion of free ions among the faster Li cations is significantly higher in high-concentration SPEs. Consequently, by studying the faster group of Li cations, we can further investigate the solvation structure of both free and non-free Li ions within the PEC/LiTFSI electrolyte. For example, we can calculate the coordination number (CN) between various Li cations and the carbonyl oxygen atoms on the PEC polymer backbone, as well as with the oxygen atoms in the TFSI anion (denoted as O(PEC) and O(TFSI), respectively), using the radial distribution function (RDF) method. This allows us to further investigate their coordination environments in the solvation state. The results of the coordination number calculations are presented in Figure 6 and Figure 7. For reference, the specific data for these figures are listed in Tables S1 to S3. For the faster group, the CN with O(PEC) are lower than those of the slower group at nearly all concentrations, except for 40 mol%. In our previous study, we mentioned that the presence of O(TFSI) creates a competitive relationship for coordination with O(PEC) [22]. This factor results in the coordination effects of Li cations being less pronounced, regardless of whether they coordinate with O(PEC) or O(TFSI), thus preventing the formation of stable solvation structures similar to those in PEO. The data in Figure 6 and Figure 7 indicate that this factor is more pronounced for faster Li cations, as they exhibit lower CN values for both O(PEC) and O(TFSI), with this trend becoming more significant at higher concentrations. We think that this competitive effect contributes to the noticeable increase in the proportion of free ions among faster Li cations in high salt concentration electrolytes.
3.3. Solvation Structures
The solvation free energy (SFE) of Li cations in the PEC/LiTFSI electrolyte system was calculated using the capabilities of the Forcite module, and the results are presented in Figure 8. In total, the value of SFE of Li cations increases with rising salt concentration, indicating that the solvation effect is gradually weakening. Notably, the SFE for faster Li cations is significantly higher than that of slower Li cations, suggesting that slower cations are more likely to form solvation structures, which aligns with the earlier observations of changes in coordination numbers. Additionally, we observed a decline in changes in SFE between 40 mol% and 60 mol%, which may be related to the enhanced coordination effect of O(TFSI) as aggregated ions form. According to our previous study, the aggregation of ions begins to saturate around 80 mol% (indicating that, at this concentration, the vast majority of TFSI anions exists in the form of aggregated ions) [22,26]. The bond rotation of TFSI anions within aggregated ions is somewhat restricted, limiting its ability to freely change conformation. Consequently, some TFSI anions may adopt conformations that are almost incapable of coordinating with Li cations [29]. Therefore, TFSI anions added beyond this concentration are less likely to coordinate with Li cations, further diminishing the coordination effect [30].
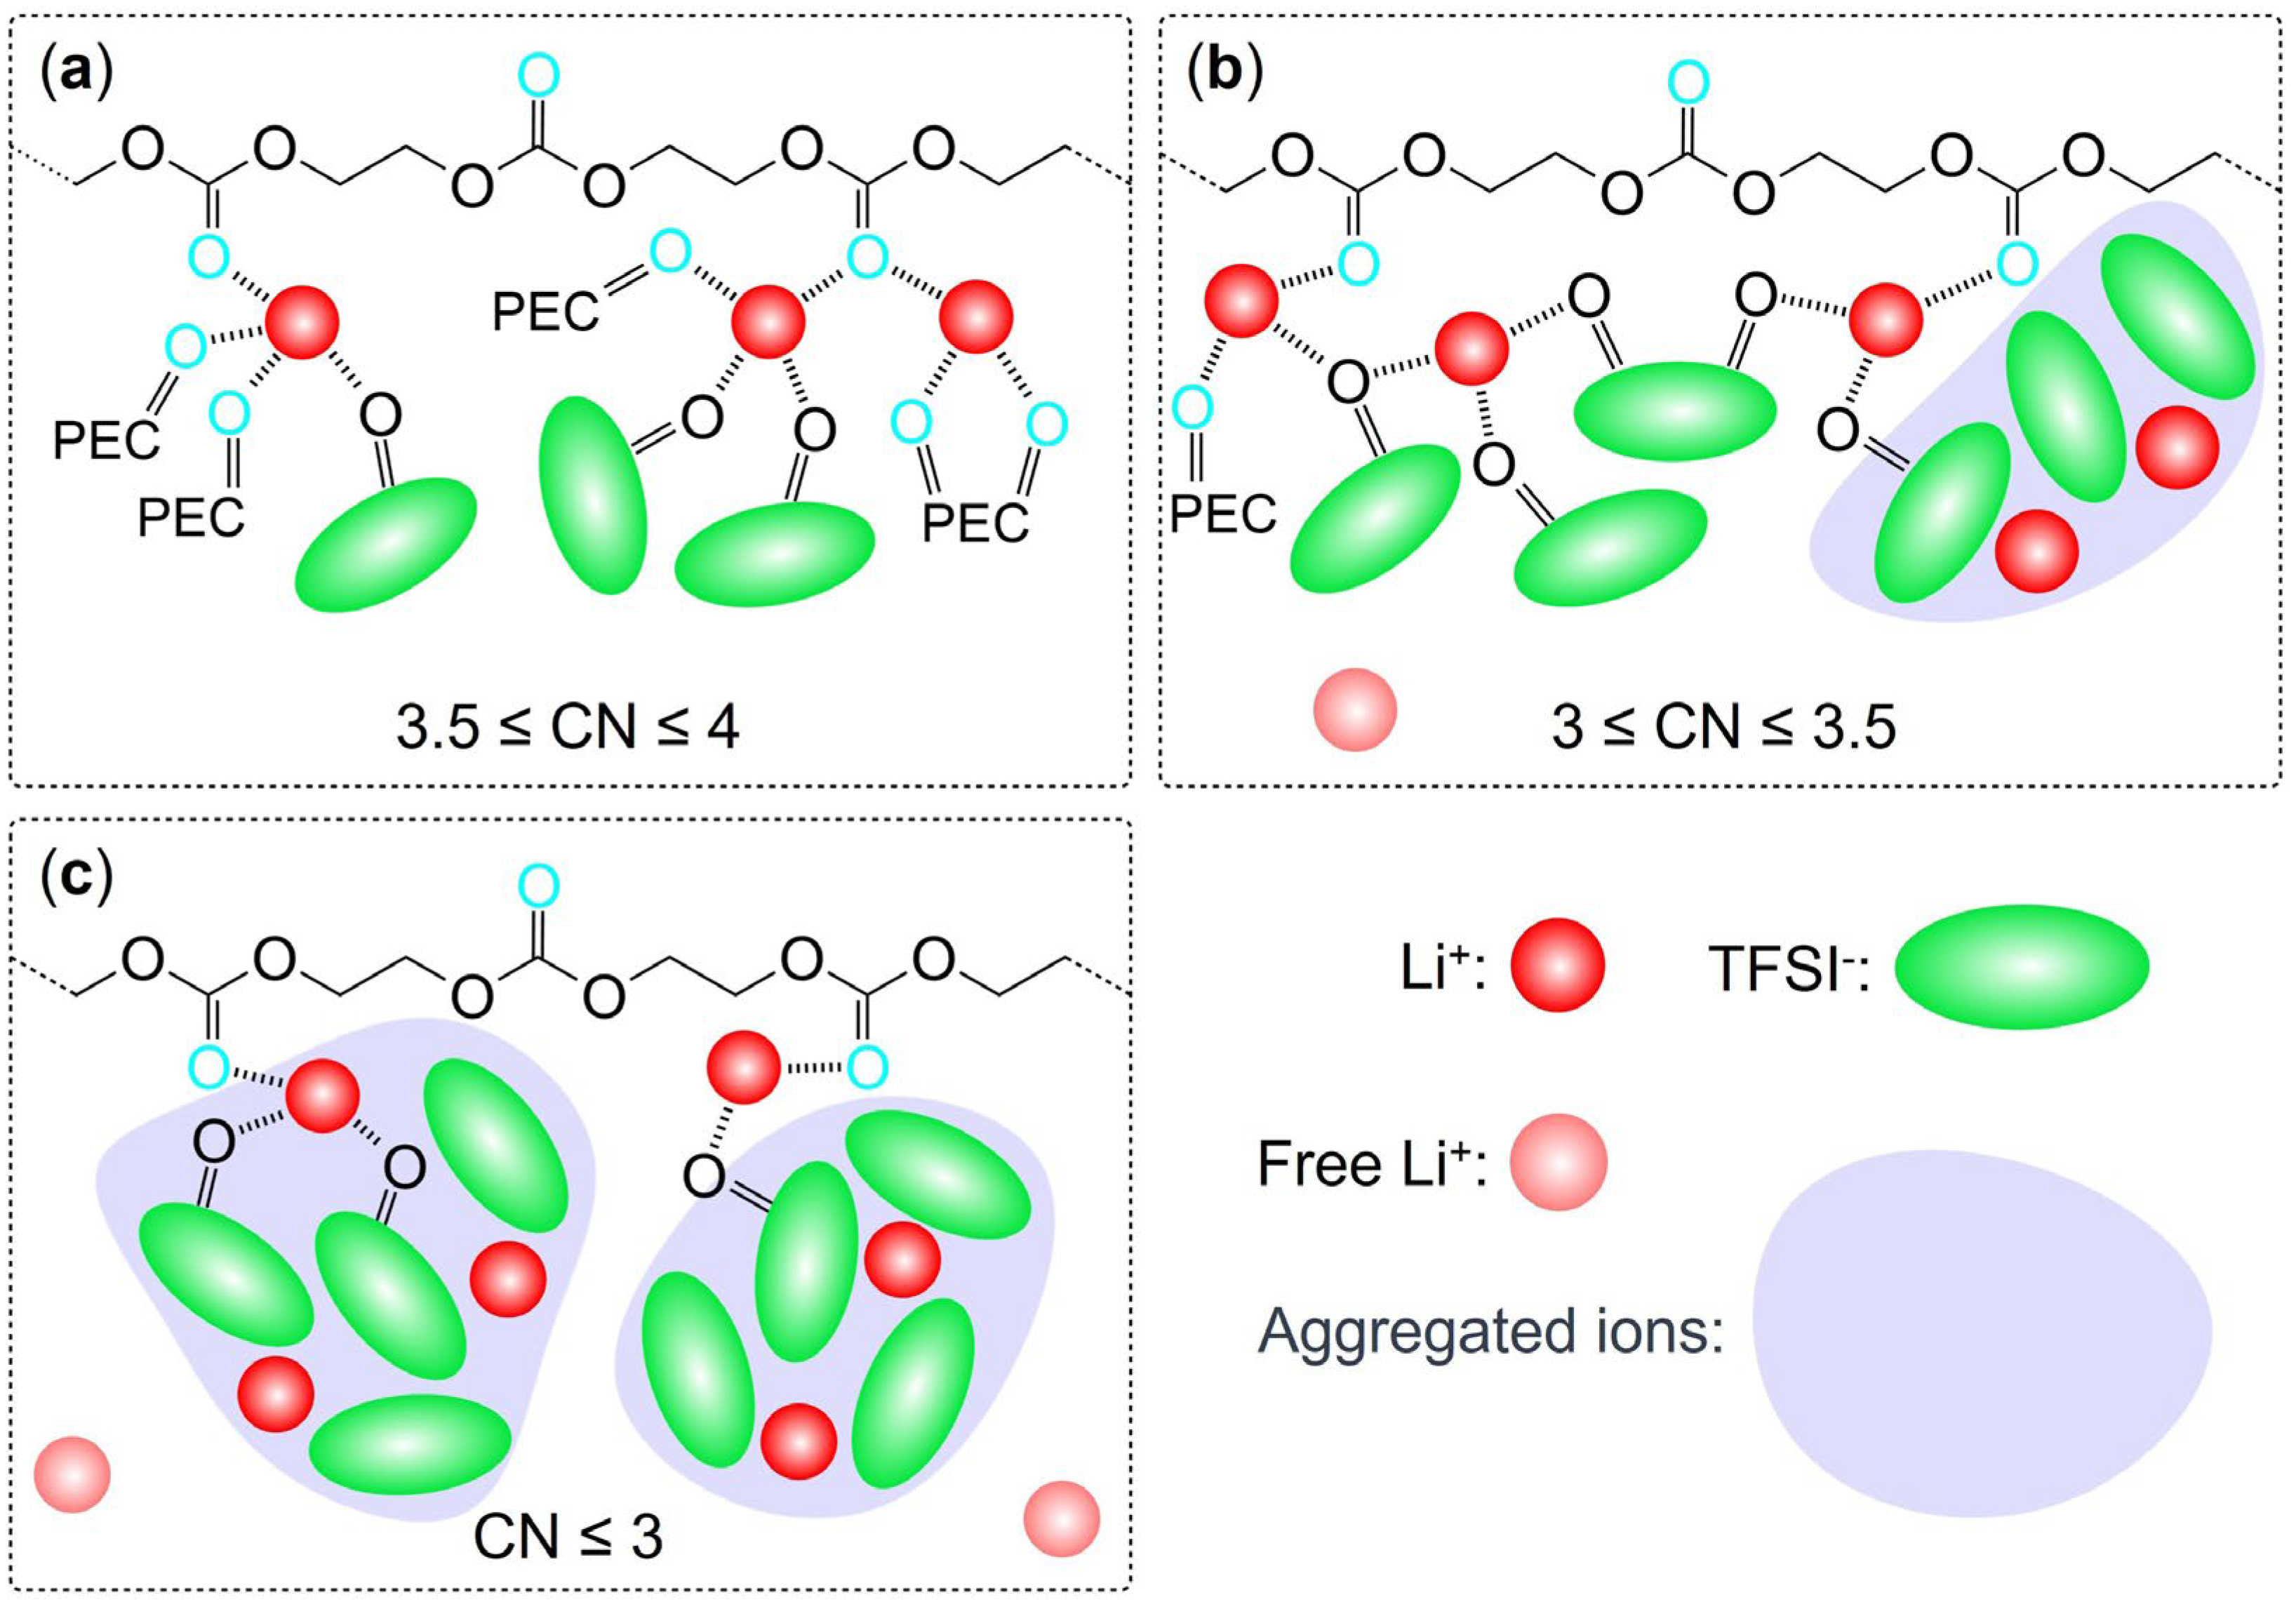
Upon understanding the changes in coordination effect of TFSI as the salt concentration increases, we can revisit Figure 7 and observe that the coordination number changes of Li-O(TFSI) exhibit a trend nearly opposite to that of SFE. In contrast, the coordination number changes of Li-O(PEC) in Figure 6 display a monotonic and smooth decrease, almost independent of SFE variations. Given that SFE changes are closely related to the solvation effect of Li cations, a clear conclusion can be drawn: the SFE of Li cations, as salt concentration changes, is primarily influenced by the coordination environment of Li cations with TFSI anions. Especially at high salt concentrations, the coordination number between faster Li cations and O(TFSI) decreases significantly, while slower Li cations become more inclined to coordinate with aggregated TFSI anions, occupying the limited coordination sites that remain due to the aggregation effect. Faster Li cations are indeed the primary contributors to ionic conduction in high salt concentration PEC/LiTFSI electrolytes. Considering all the data and observations mentioned above, we can make certain inferences about the solvation environment of faster Li cations in this system: At lower salt concentrations (until 40 mol%), the system predominantly features four-coordination structures with O(PEC) as the main coordinating species. As the salt concentration rises to 40 or 60 mol%, the introduction of TFSI anions and the formation of aggregated ions limit the coordination capacity of O(PEC). Consequently, faster Li cations predominantly adopt three-coordination structures, with O(TFSI) gradually becoming the dominant coordinating species. When the salt concentration exceeds 80 mol%, the absence of isolated TFSI anions leads to a general decline in the coordination abilities of both O(PEC) and O(TFSI) towards Li cations, resulting in a significant presence of two-coordination or even lesser-coordination structures (free ions). Based on the three-step changes in the solvation environment, we propose that the faster group of Li ions in the PEC/LiTFSI electrolyte system exhibits three relatively typical solvation structures, as illustrated in Figure 9. These structures undergo mutual transformations as the salt concentration changes.
4. Conclusions
In this study, we employed molecular dynamics-based simulations to calculate intricate experimental data, such as radial distribution functions and solvation free energy, in the PEC/LiTFSI electrolyte system. Our main findings can be summarized as follows:
- After categorizing Li cations into faster and slower groups based on the mean-square displacement data, their ionic mobility and related characteristics were further analyzed. The results indicated that the faster group has approximately 10-times higher conductivity than the slower group. Consequently, even though the relative quantity of faster Li-ions decreased with increasing salt concentration, they still contributed around 70% of the cation transport. This suggests that free ions are prevalent among the faster Li cations.
- Through the study of coordination numbers and solvation free energy for the two groups of Li cations, we found that slower Li cations tend to form more coordination structures with oxygen atoms in their environment, while faster Li cations experience less coordination influence. This effect is particularly pronounced at high salt concentrations, where the coordinating effects from both PEC and TFSI anions weaken due to the formation of aggregated ions, ultimately leading to the emergence of more free ions.
- Although we are not yet able to establish an exact standard for determining whether a specific Li-ion is acting as a free ion during ion-transport, the findings of this study have successfully narrowed down the search range, which Li cations are likely to be free ions. Furthermore, three possible solvation structures for faster Li cations across different salt concentration ranges were proposed, all of which align with the behaviors observed in this study.
These insights will facilitate further research into the mechanism of Li-ion conduction and provide valuable guidance for the future development and improvement of electrolyte systems.
Supplementary Materials
The following supporting information can be downloaded at the website of this paper posted on Preprints.org. Figure S1. MSDs of each Li cations and average (marked as dashed lines) calculated in PEC/LiTFSI models, with different salt concentrations of (a) 20 mol%, (b) 80 mol% and (c) 120 mol%; Table S1. Coordination number of Li-O(PEC); Table S2. Coordination number of Li-O(TFSI).; Table S3. Coordination number of Li-O(All).
Author Contributions
Methodology, W.T.; Software, W.T.; Formal analysis, W.T.; Writing—original draft, W.T.; Writing—review & editing, K.K. and Y.T.; Funding acquisition, Y.T. All authors have read and agreed to the published version of the manuscript.
Funding
This work was supported financially by a Grant-in-Aid for Scientific Research (B) (23K23057) of JSPS KAKENHI and Data Creation and Utilization-Type Material Research and Development Project (JPMXP1122712807) of MEXT, Japan.
Data Availability Statement
The original contributions presented in this study are included in the article/supplementary material.
Conflicts of Interest
The authors declare no conflict of interest.
References
- J.M. Tarascon, M. Armand. Issues and challenges facing rechargeable lithium batteries. Mater. Sustainable Energy 2011, 171. [CrossRef]
- M. Jim. Technology: A solid future. Nature 2015, 526, S96-S97.
- S. Xia, X. Wu, Z. Zhang, Y. Cui, W. Liu. Practical challenges and future perspectives of all-solid-state lithium-metal batteries. Chem 2019, 5.4, 753-785. [CrossRef]
- Q. Zhao, S. Stalin, C.Z. Zhao, L.A. Archer. Designing solid-state electrolytes for safe, energy-dense batteries. Nature Rev. Mater. 2020, 5, 229-252. [CrossRef]
- J.W. Fergus. Ceramic and polymeric solid electrolytes for lithium-ion batteries. J. Power Sources 2010, 195.15, 4554-4569. [CrossRef]
- D. Zhou, D. Shanmukaraj, A. Tkacheva, M. Armand, G.X. Wang. Polymer electrolytes for lithium-based batteries: advances and prospects. Chem 2019, 5.9, 2326-2352. [CrossRef]
- P.V. Wright. Electrical conductivity in ionic complexes of poly (ethylene oxide). Br. Polym. J. 1975, 7.5, 319. [CrossRef]
- Y.Q. Shao, H. Gudla, J. Mindemark, D. Brandell, C. Zhang. Ion transport in polymer electrolytes: building new bridges between experiment and molecular simulation. Acc. Chem. Res. 2024, 57.8, 1123-1134. [CrossRef]
- Z. Li, H.M. Huang, J.K. Zhu, J.F. Wu, H. Yang, L. Wei, X. Guo. Ionic conduction in composite polymer electrolytes: case of PEO: Ga-LLZO composites. ACS Appl. Mater. Interfaces 2018, 11.1, 784-791. [CrossRef]
- A. Nitzan, M.A. Ratner. Conduction in polymers: dynamic disorder transport. J. Phys. Chem. 1994, 98.7, 1765-1775. [CrossRef]
- Maitra, A. Heuer. Cation transport in polymer electrolytes: a microscopic approach. Phys. Rev. Lett. 2007, 98, 227802. [CrossRef]
- J. Chen, J.W. Wu, X.D. Wang, A.A. Zhou, Z.L. Yang. Research progress and application prospect of solid-state electrolytes in commercial lithium-ion power batteries. Energy Storage Mater. 2021, 35, 70-87. [CrossRef]
- Z. Li, J.L. Fu, X.Y. Zhou, S.W. Gui, L. Wei, H. Yang, H. Li, X. Guo. Ionic conduction in polymer-based solid electrolytes. Macromolecules 2015, 48.8, 2773-2786. [CrossRef]
- L. Yue, J. Ma, J. Zhang, J. Zhao, S. Dong, Z. Liu, G. Cui, L. Chen. All Solid-State Polymer Electrolytes for High-Performance Lithium Ion Batteries. Energy Storage Mater. 2016, 5, 139. [CrossRef]
- K. Kimura, Y. Tominaga. Understanding electrochemical stability and lithium ion-dominant transport in concentrated poly (ethylene carbonate) electrolyte. ChemElectroChem 2018, 5.24, 4008. [CrossRef]
- H. Sugimoto, S. Inoue. Recent Progress in the Synthesis of Polymers Based on Carbon Dioxide. Pure Appl. Chem. 2006, 78.10, 1823. [CrossRef]
- S. Klaus, M.W. Lehenmeier, C.E. Anderson, B. Rieger. Recent advances in CO2/epoxide copolymerization—New strategies and cooperative mechanisms. Coord. Chem. Rev. 2011, 255.13, 1460.
- H. Duan, Y.X. Yin, X.X. Zeng, J.Y. Li, J.L. Shi, Y. Shi, R. Wen, Y.G. Guo, L.J. Wan. In-situ plasticized polymer electrolyte with double-network for flexible solid-state lithium-metal batteries. Energy Storage Mater. 2018, 10, 85-91. [CrossRef]
- K.D. Fong, J. Self, B.D. McCloskey, K.A. Persson. Ion correlations and their impact on transport in polymer-based electrolytes. Macromolecules 2021, 54.6, 2575-2591. [CrossRef]
- N.M. Vargas-Barbosa, B. Roling. Dynamic ion correlations in solid and liquid electrolytes: how do they affect charge and mass transport? ChemElectroChem 2020, 7.2, 367-385. [CrossRef]
- Z.D. Zhang, B.K. Wheatle, J. Krajniak, J.R. Keith, V. Ganesan. Ion mobilities, transference numbers, and inverse Haven ratios of polymeric ionic liquids. ACS Macro Lett. 2020, 9.1 84-89. [CrossRef]
- W. Tan, Y. Tominaga. Modeling analysis of ionic solvation structure in concentrated poly (ethylene carbonate) electrolytes. Electrochim. Acta 2023, 464, 142875. [CrossRef]
- R. Andersson, G. Hernández, J. Mindemark. Quantifying the ion coordination strength in polymer electrolytes. Phys. Chem. Chem. Phys. 2022, 24.26, 16343. [CrossRef]
- J. Motomatsu, H. Kodama, T. Furukawa, Y. Tominaga. Dielectric Relaxation Behavior of a Poly (ethylene carbonate)-Lithium Bis-(trifluoromethanesulfonyl) Imide Electrolyte. Macromol. Chem. Phys. 2015, 216.15, 1660. [CrossRef]
- BIOVIA Materials Studio 7.0, San Diego: Dassault Systèmes 2014. Available online: https://www.3ds.com/products/biovia/materials-studio (accessed on 19th Nov. 2024).
- K. Kimura, J. Motomatsu, Y. Tominaga. Correlation between solvation structure and ion-conductive behavior of concentrated poly (ethylene carbonate)-based electrolytes. J. Phys. Chem. C 2016, 120.23, 12385. [CrossRef]
- T. Li, X.Q. Zhang, N. Yao, Y.X. Yao, L.P. Hou, X. Chen, M.Y. Zhou, J.Q. Huang, Q. Zhang. Stable anion-derived solid electrolyte interphase in lithium metal batteries. Angew. Chem. Int. Ed. 2021, 60.42, 22683-22687. [CrossRef]
- G. Feng, M. Chen, S. Bi, Z.A.H. Goodwin, E.B. Postnikov, N. Brilliantov, M. Urbakh, A.A. Kornyshev. Free and bound states of ions in ionic liquids, conductivity, and underscreening paradox. Phys. Rev. X 2019, 9.2, 021024. [CrossRef]
- S. Li, Z. Cao, Y.X. Peng, L. Liu, Y.L. Wang, S. Wang, J.Q. Wang, T.Y. Yan, X.P. Gao, D.Y. Song, P.W. Shen. Molecular dynamics simulation of LiTFSI-acetamide electrolytes: structural properties. J. Phys. Chem. B 2008, 112.20, 6398-6410.
- J.C. Lassègues, J. Grondin, C. Aupetit, P. Johansson. Spectroscopic identification of the lithium ion transporting species in LiTFSI-doped ionic liquids. J. Phys. Chem. A 2009, 113.1, 305-314.
Figure 2.
Thermodynamic process for calculating solvation free energy.
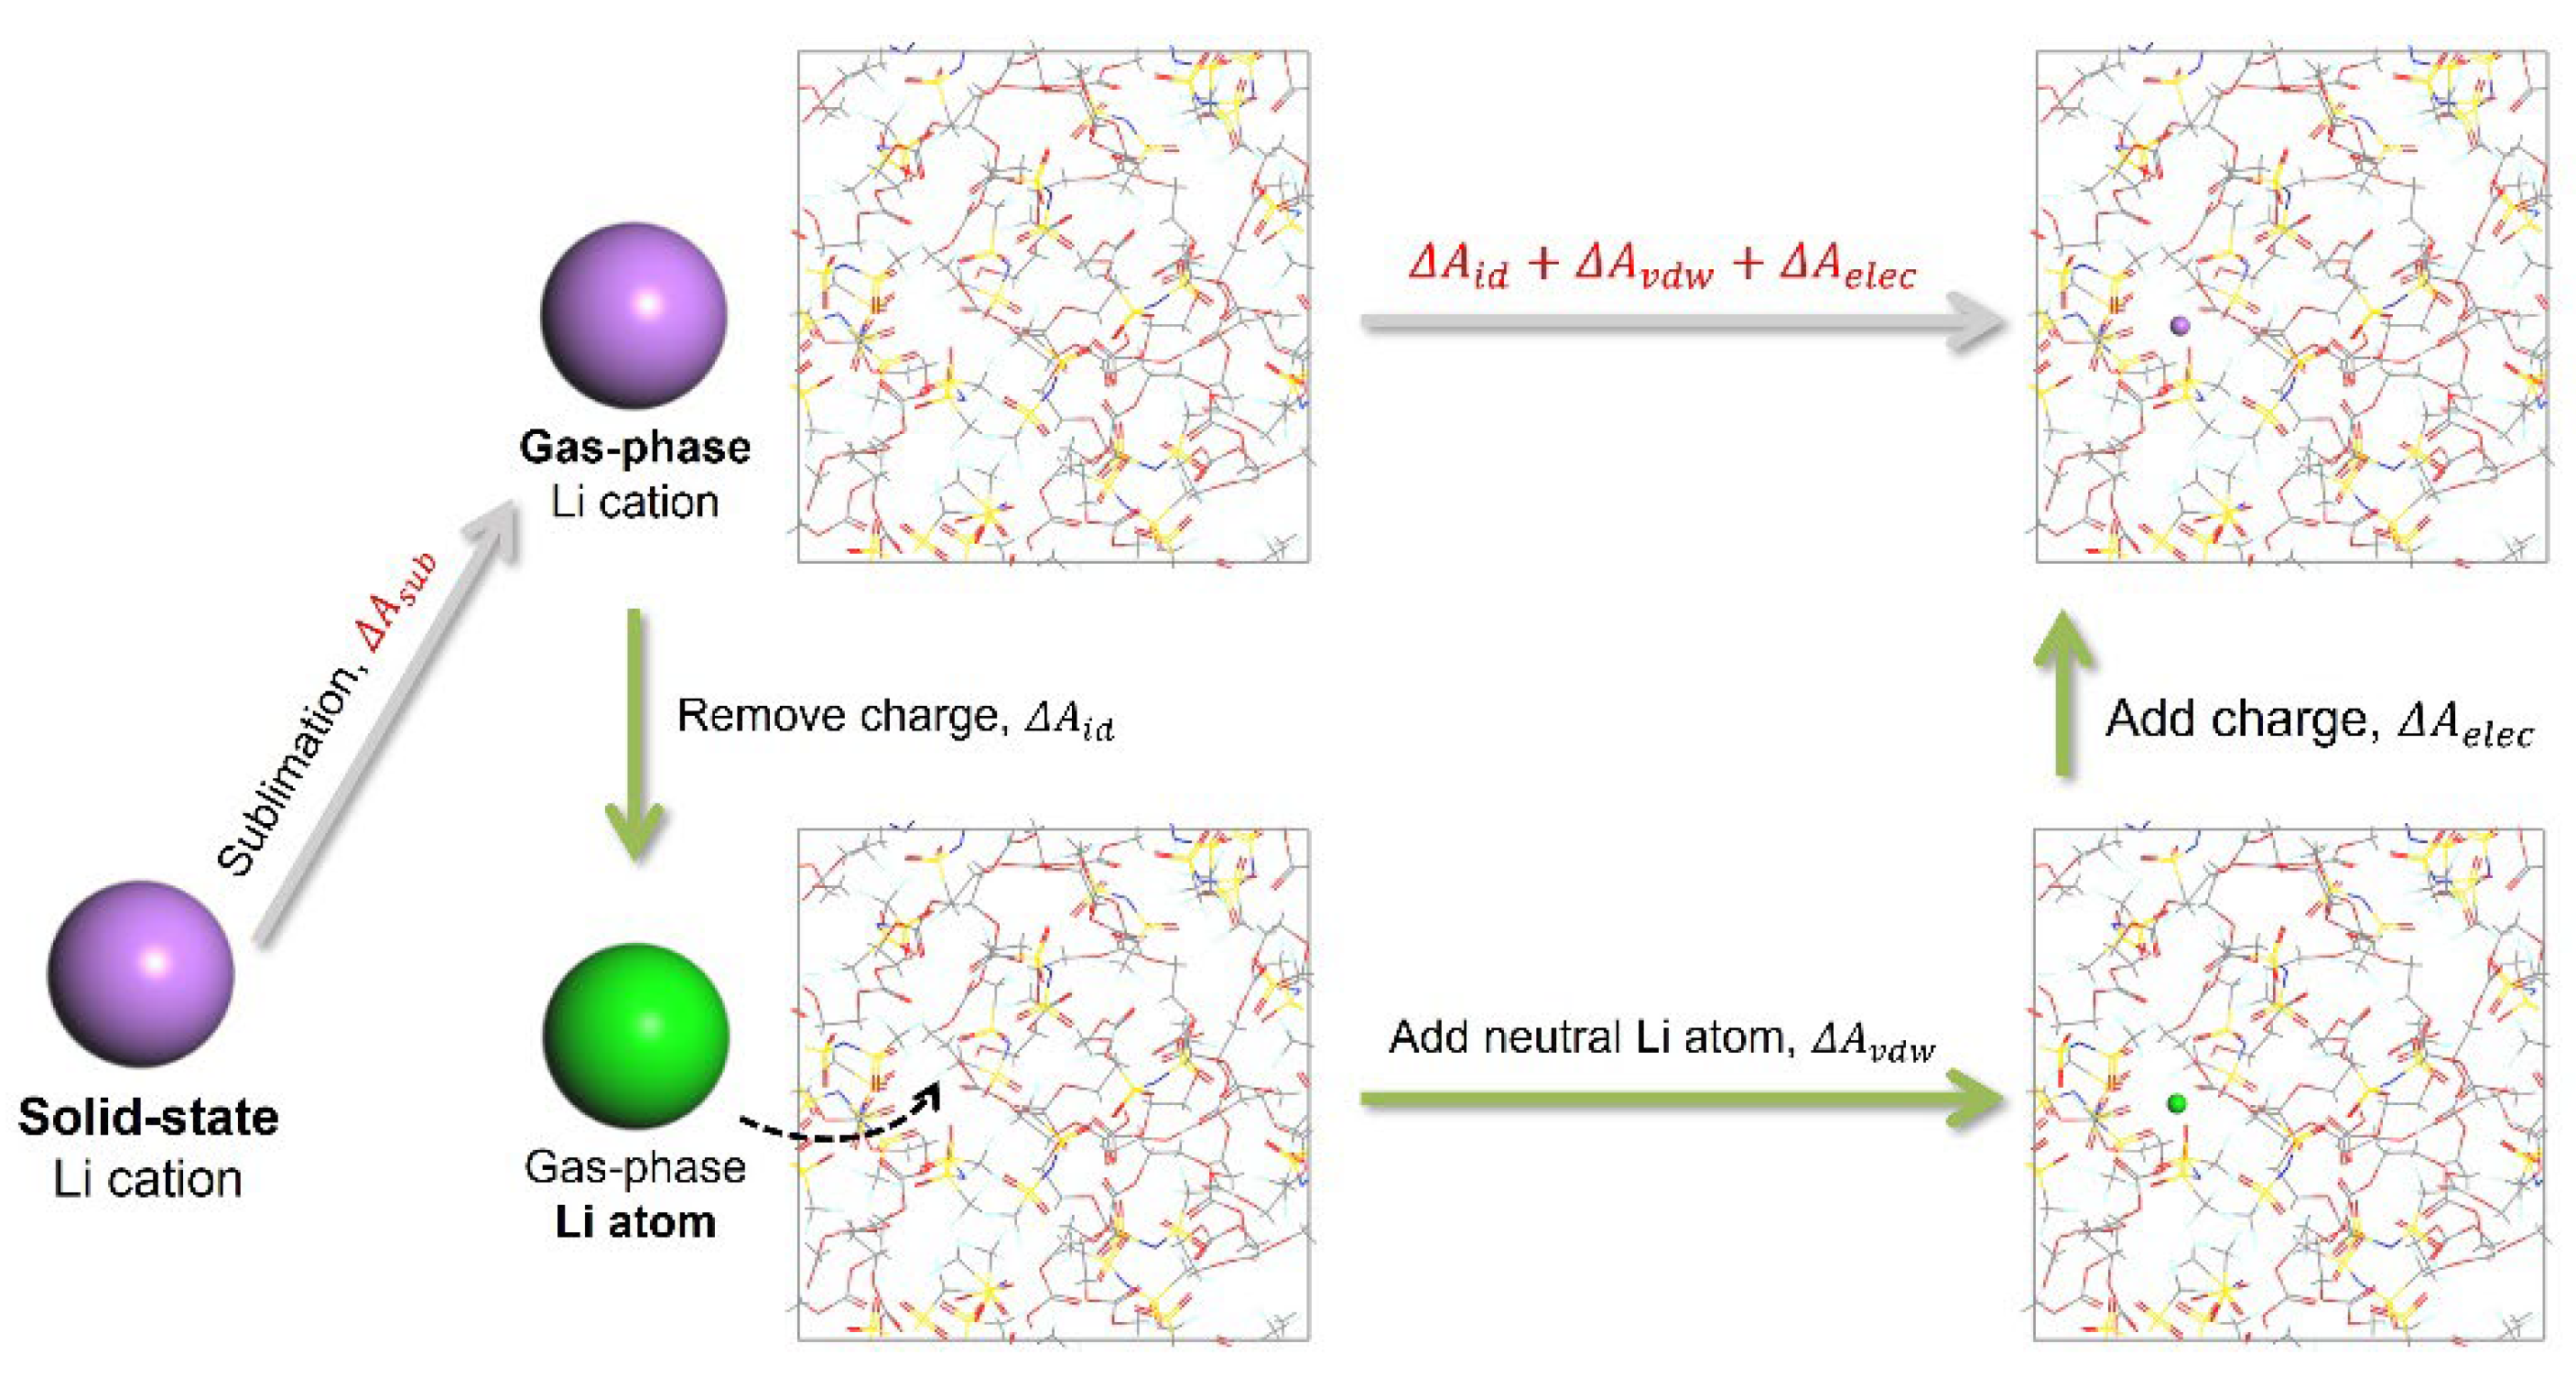
Figure 3.
Distribution of ΔMSD for each Li cations calculated in PEC/LiTFSI models, with different salt concentrations of 20 mol%, 80 mol%, and 120 mol%.
Figure 3.
Distribution of ΔMSD for each Li cations calculated in PEC/LiTFSI models, with different salt concentrations of 20 mol%, 80 mol%, and 120 mol%.
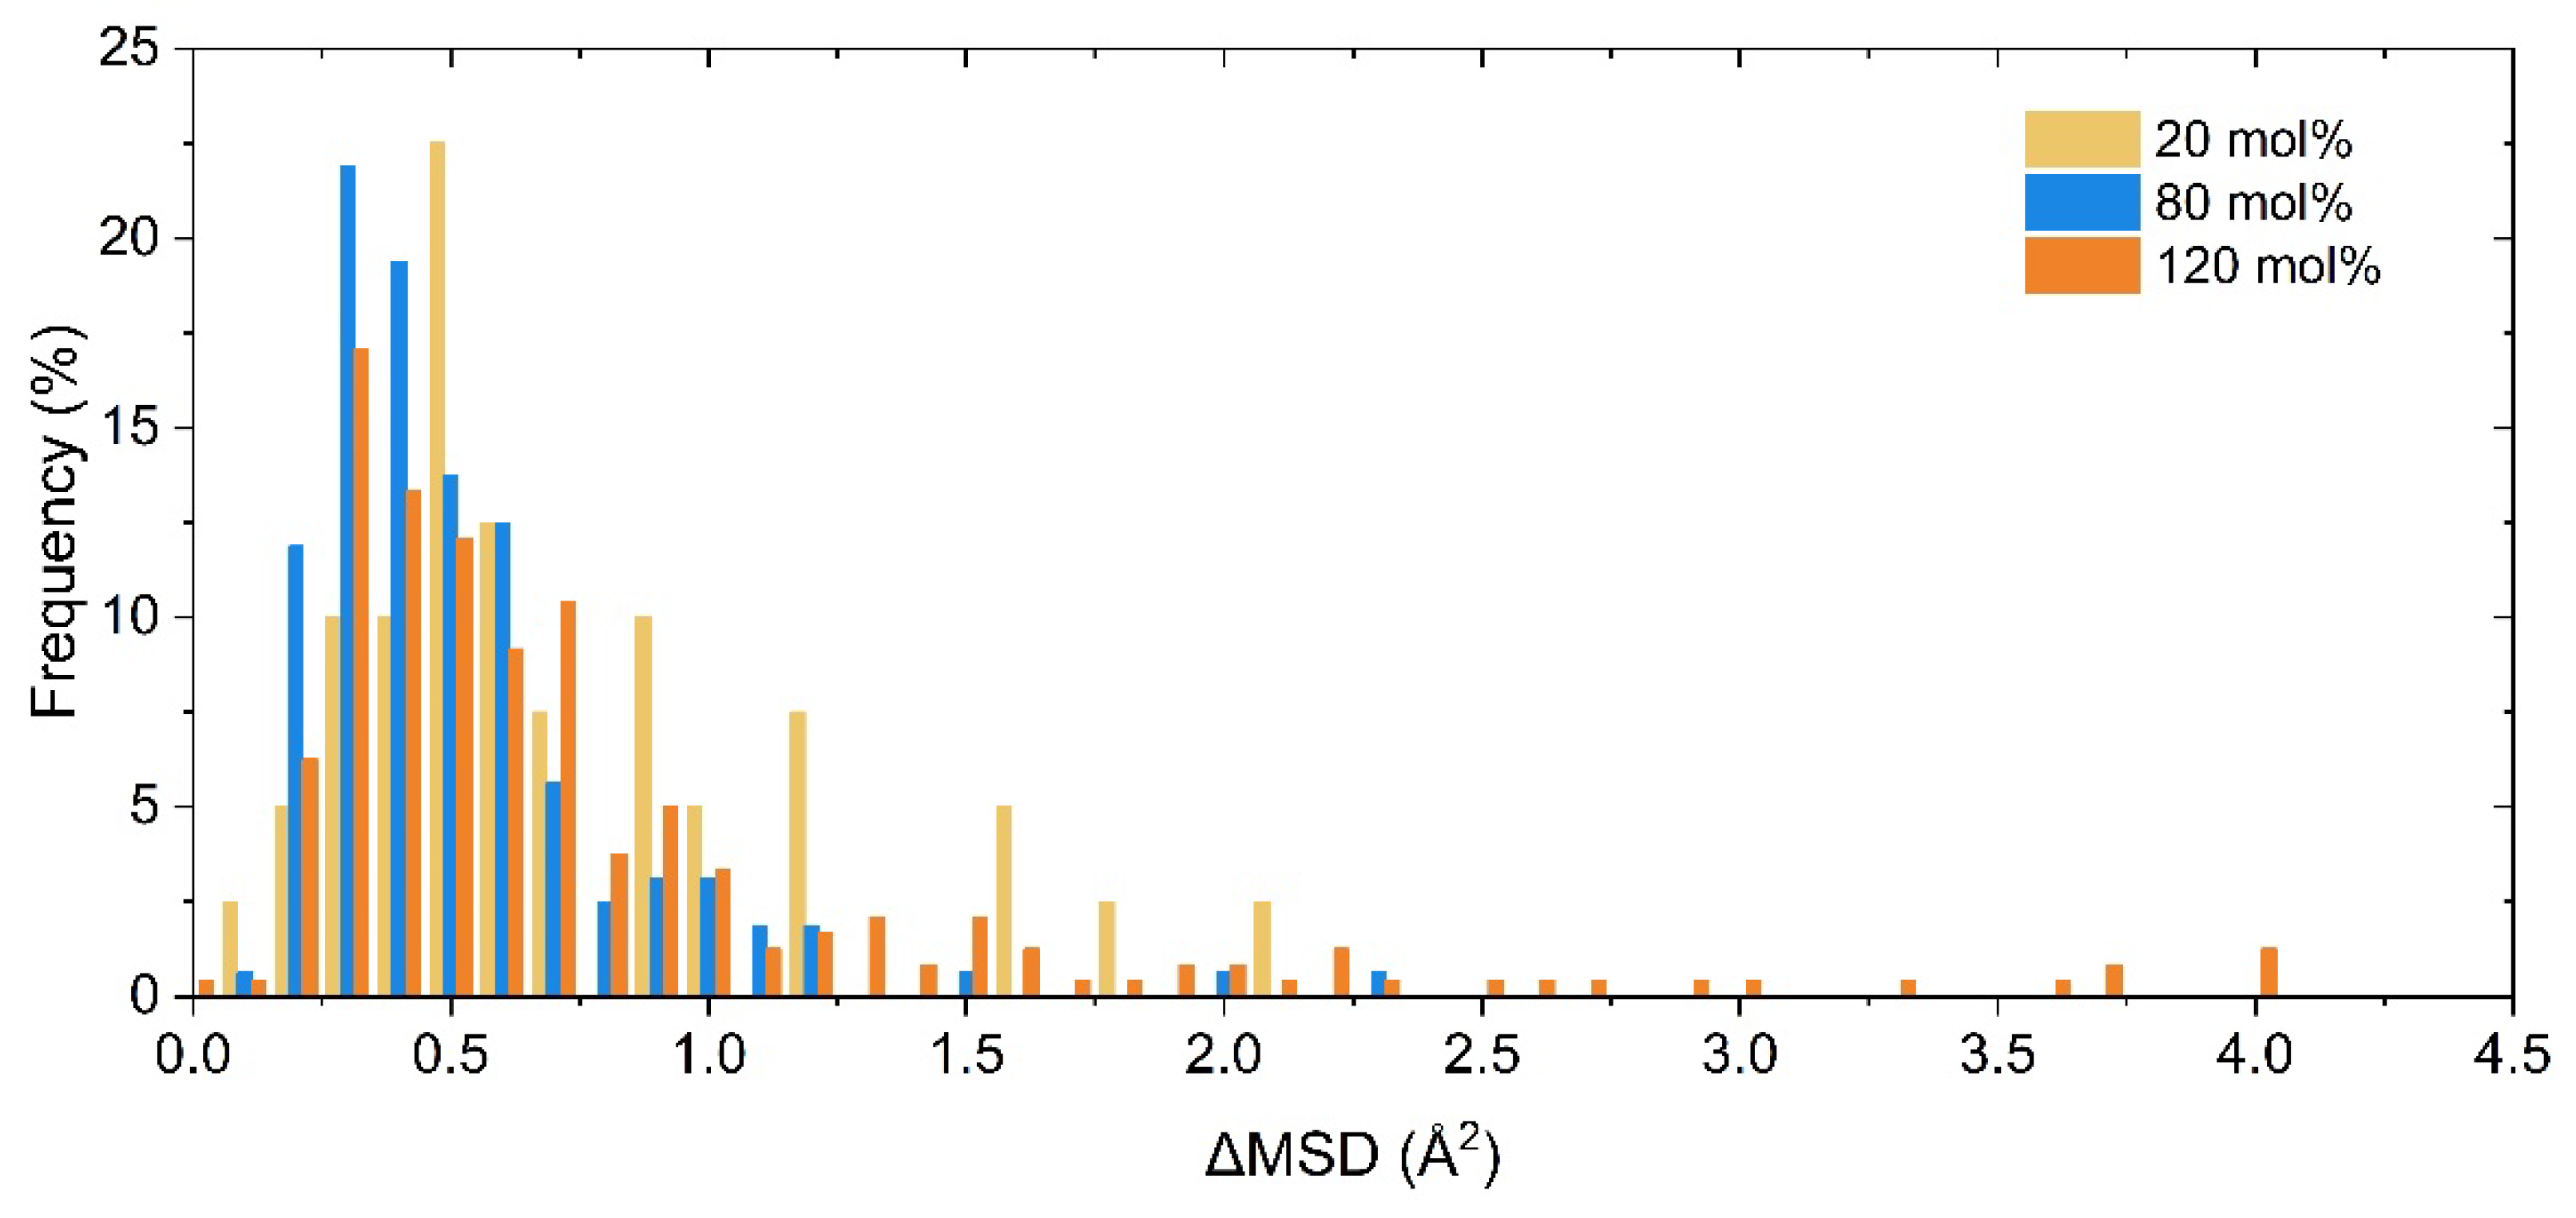
Figure 4.
Changes in number proportion and contribution to ion transport of faster Li cations with different salt concentrations.
Figure 4.
Changes in number proportion and contribution to ion transport of faster Li cations with different salt concentrations.
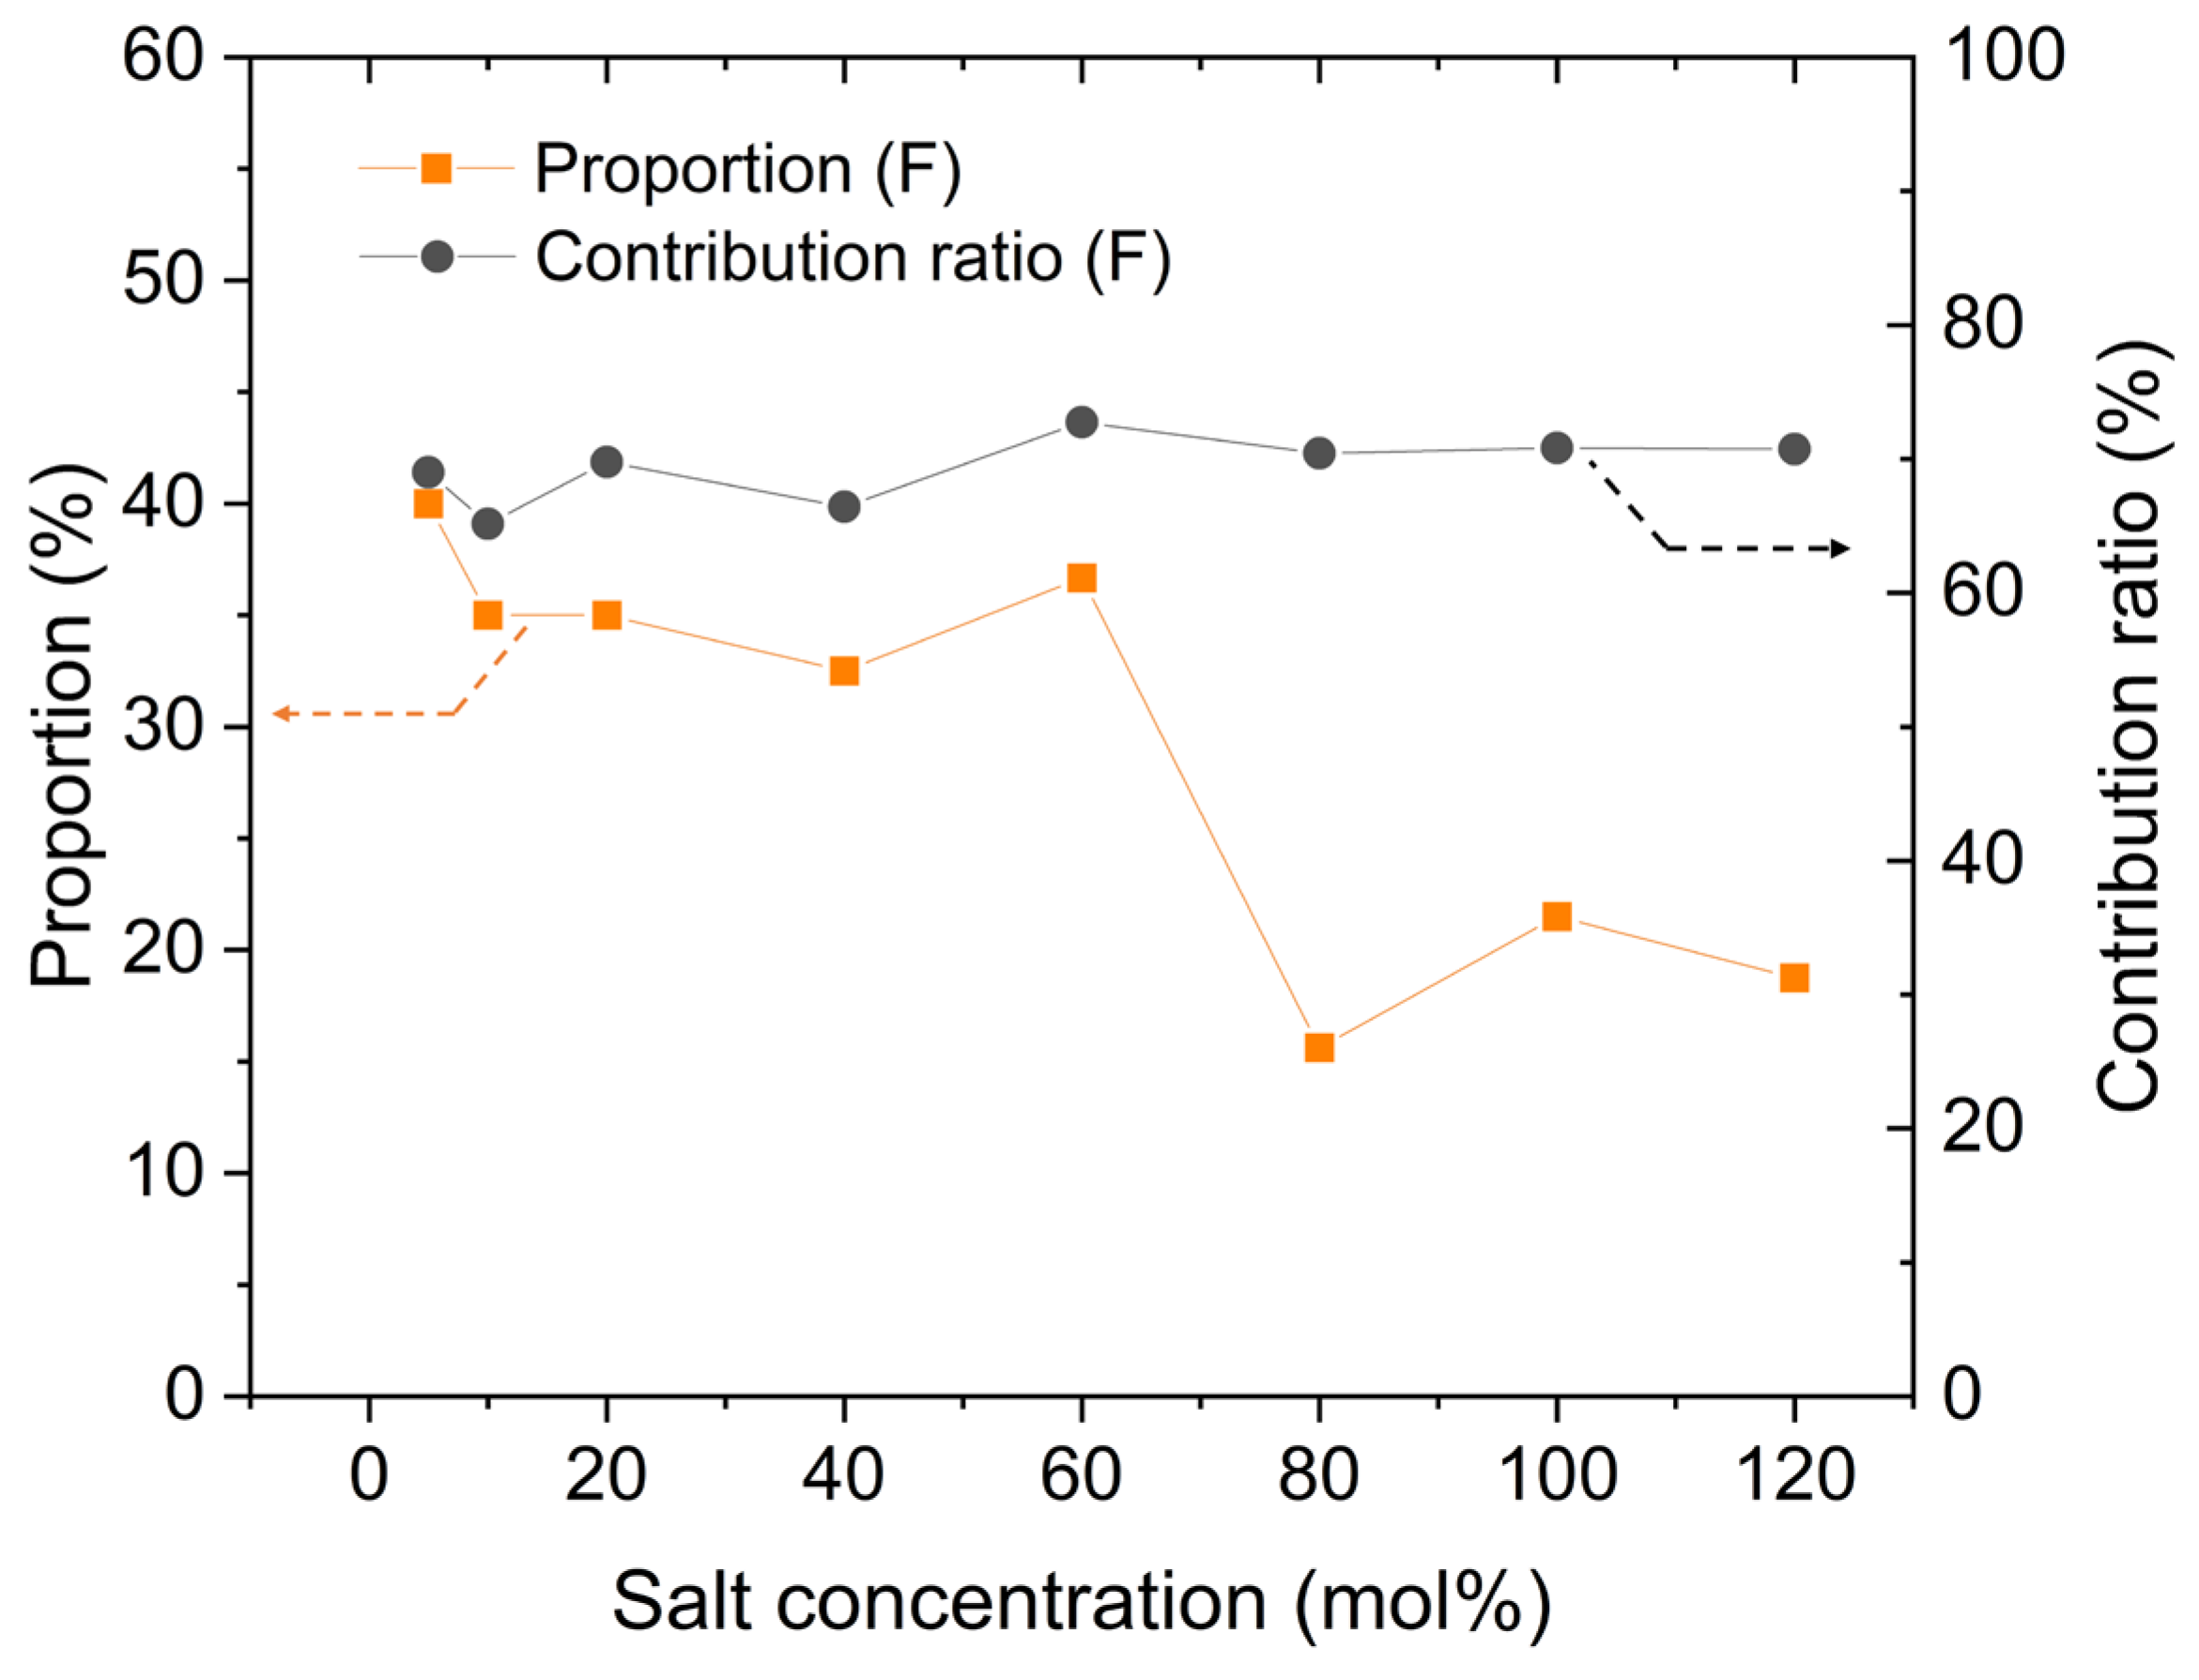
Figure 5.
Changes in (a) the transport number of Li cations with different salt concentrations, marked by colors with t+(F) in red and t+(S) in blue, and (b) the ratio of D(F) to D(S).
Figure 5.
Changes in (a) the transport number of Li cations with different salt concentrations, marked by colors with t+(F) in red and t+(S) in blue, and (b) the ratio of D(F) to D(S).
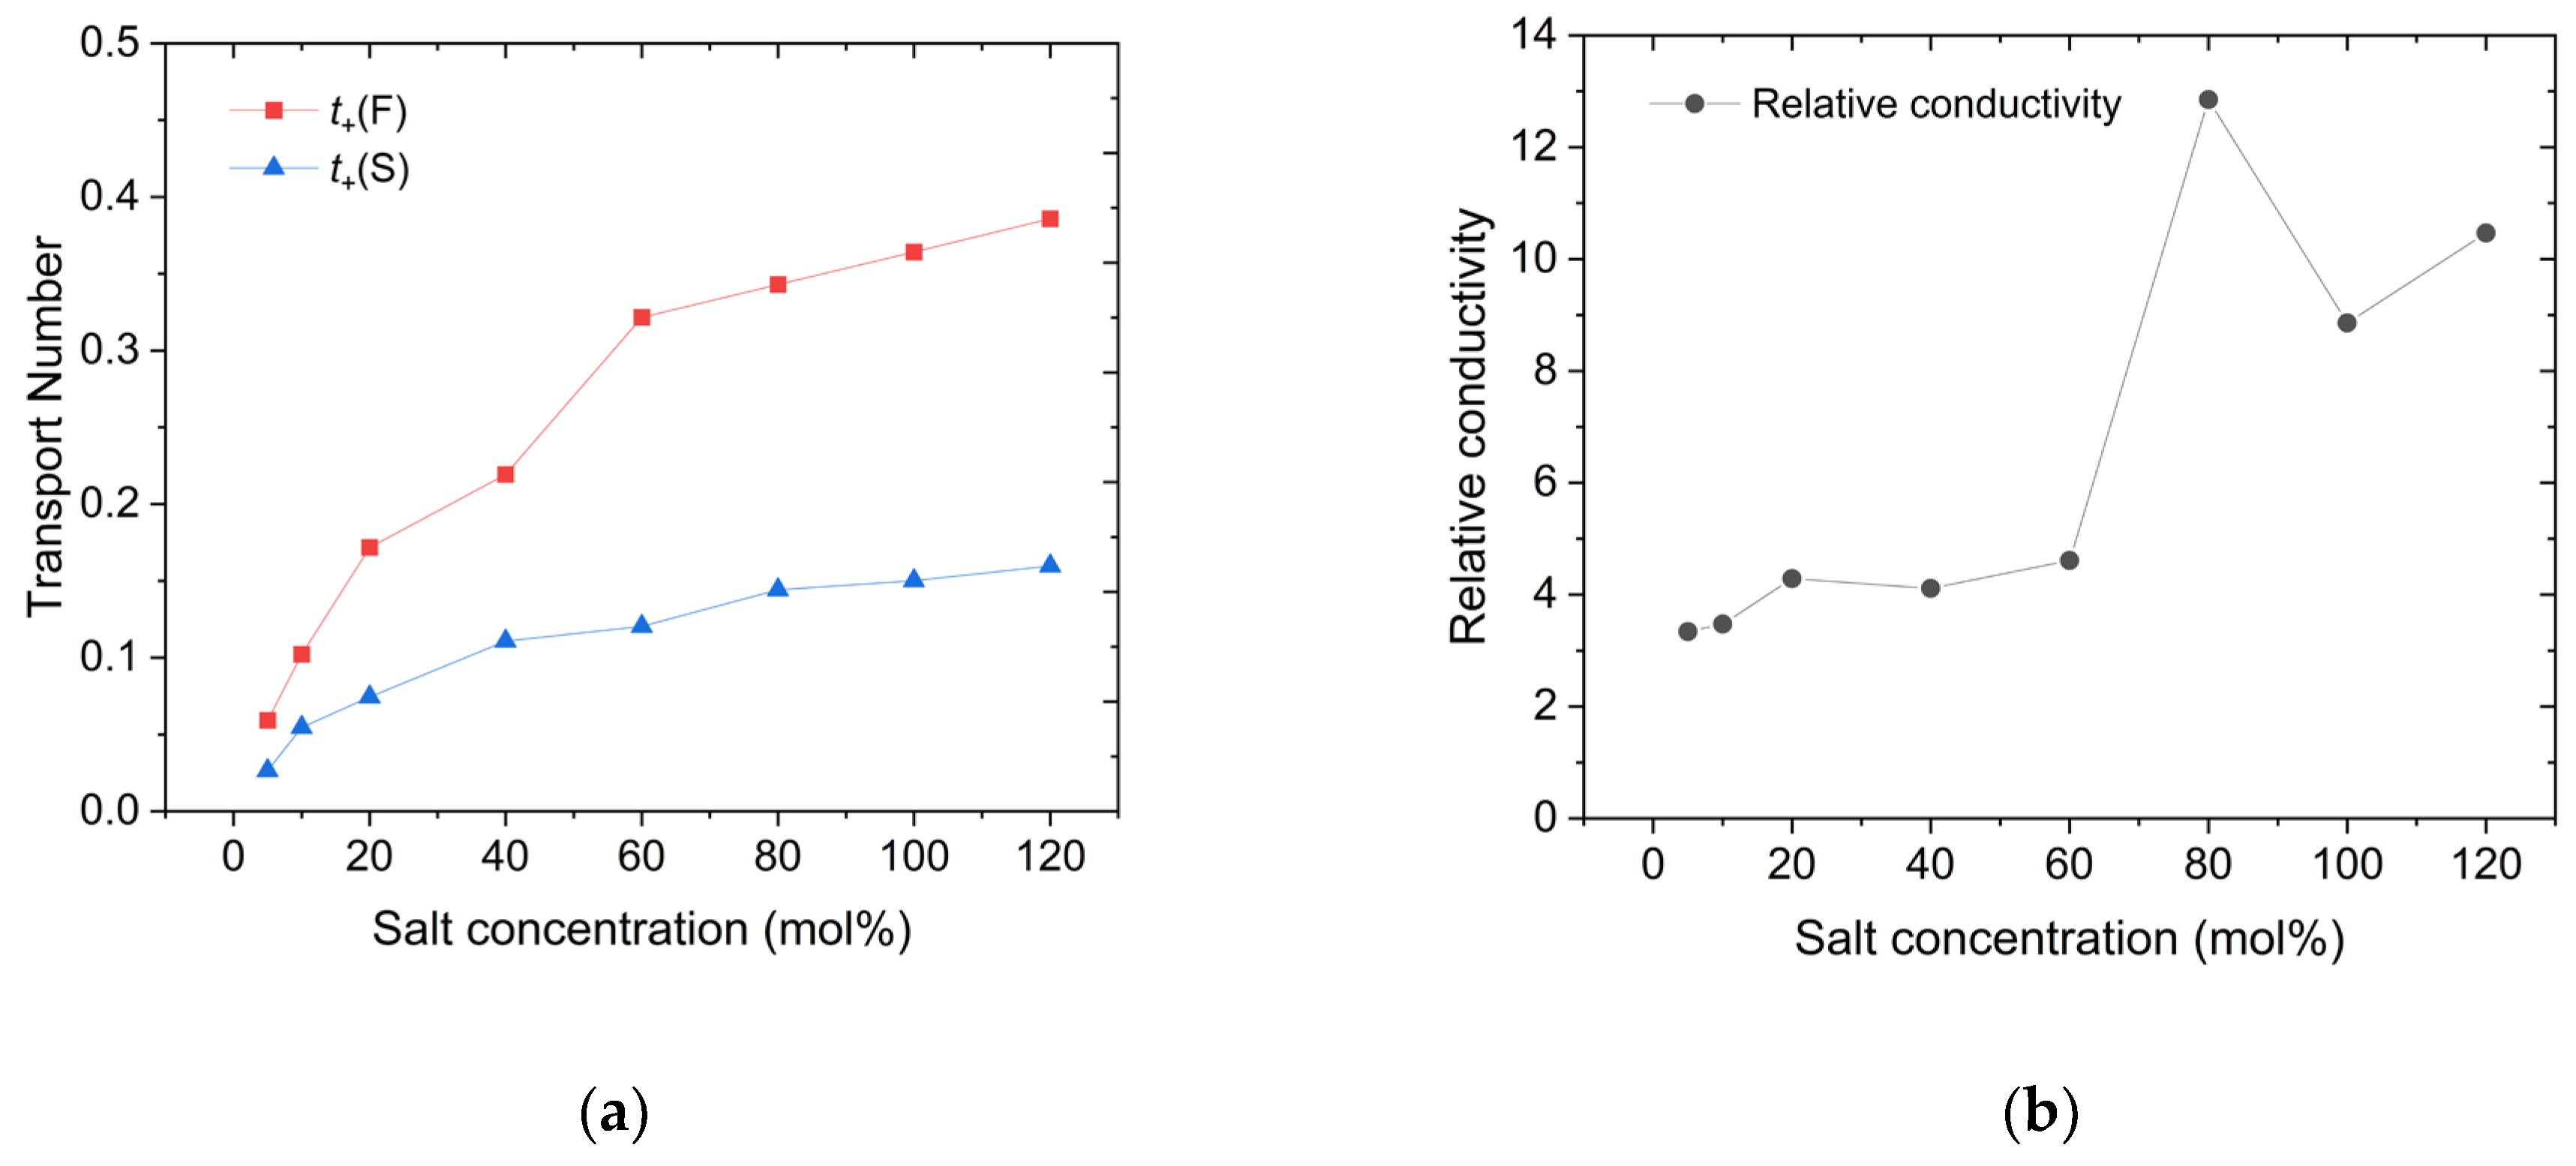
Figure 6.
Changes in coordination number between O(PEC) and Li cations with different salt concentrations, marked by colors with the faster group in red, the slower group in blue, and the overall Li cations in black.
Figure 6.
Changes in coordination number between O(PEC) and Li cations with different salt concentrations, marked by colors with the faster group in red, the slower group in blue, and the overall Li cations in black.
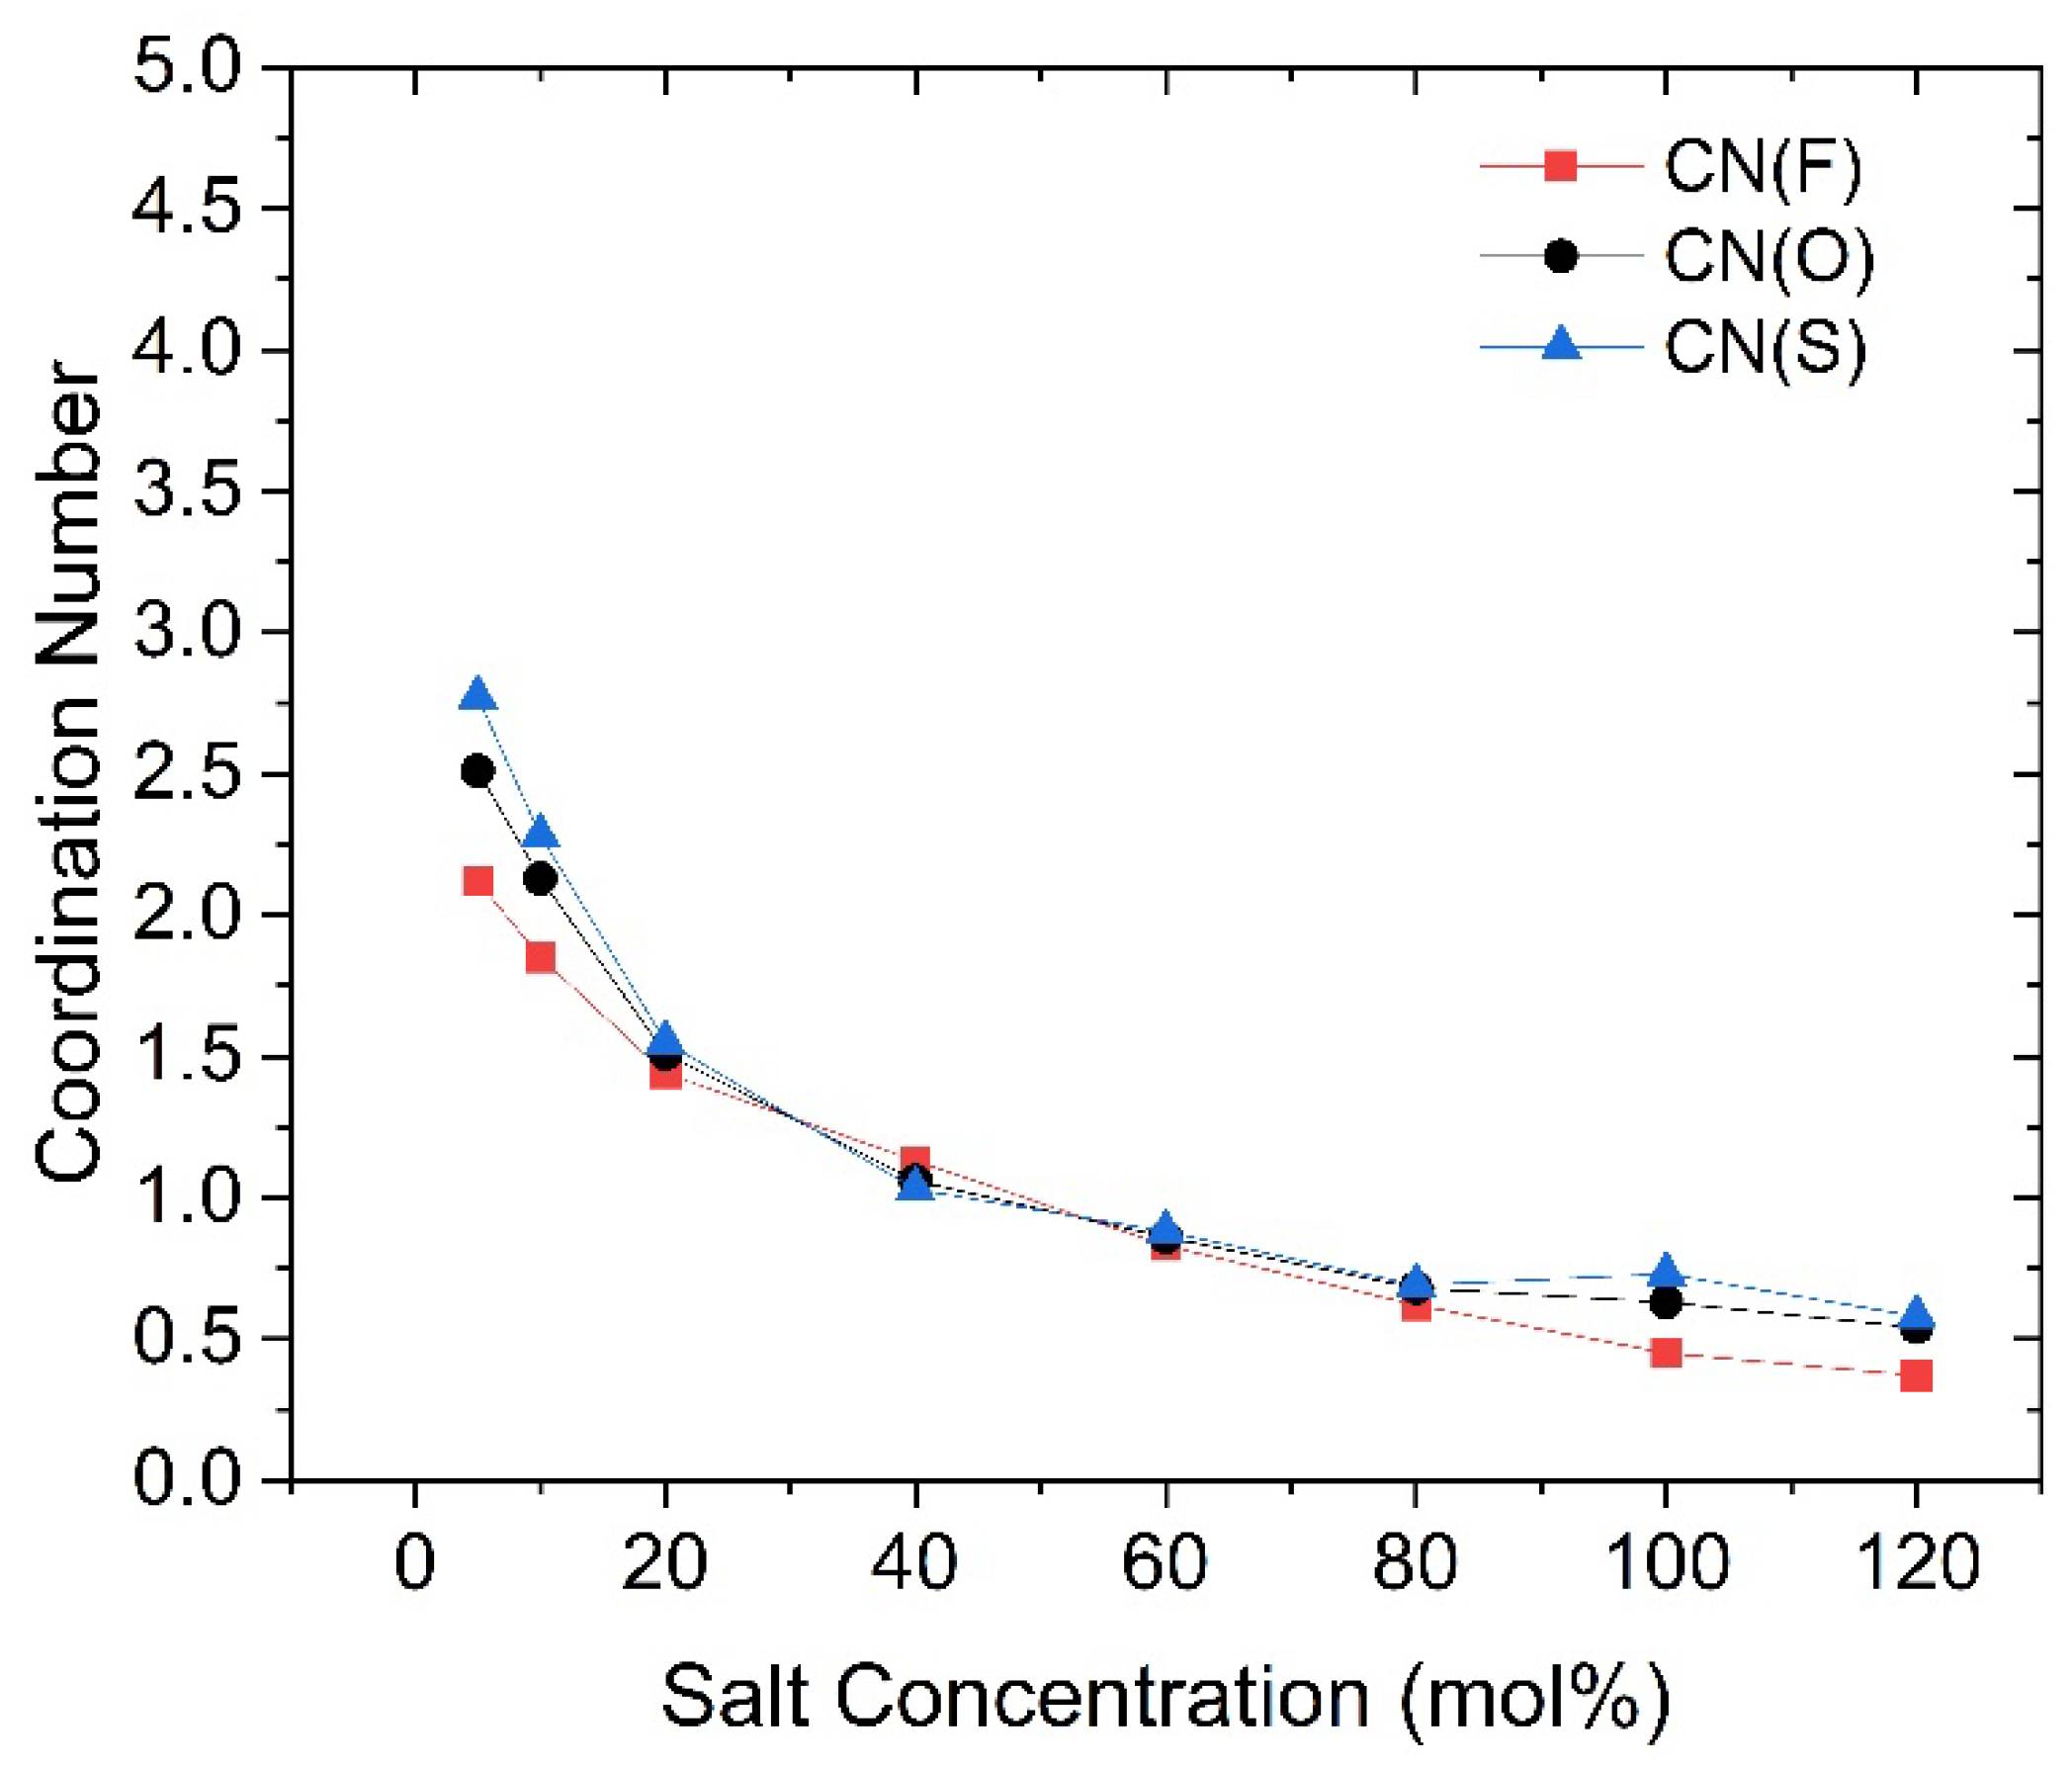
Figure 7.
Changes in coordination number between O(TFSI) and Li cations with different salt concentrations, marked by colors with the faster group in red, the slower group in blue, and the overall Li cations in black.
Figure 7.
Changes in coordination number between O(TFSI) and Li cations with different salt concentrations, marked by colors with the faster group in red, the slower group in blue, and the overall Li cations in black.
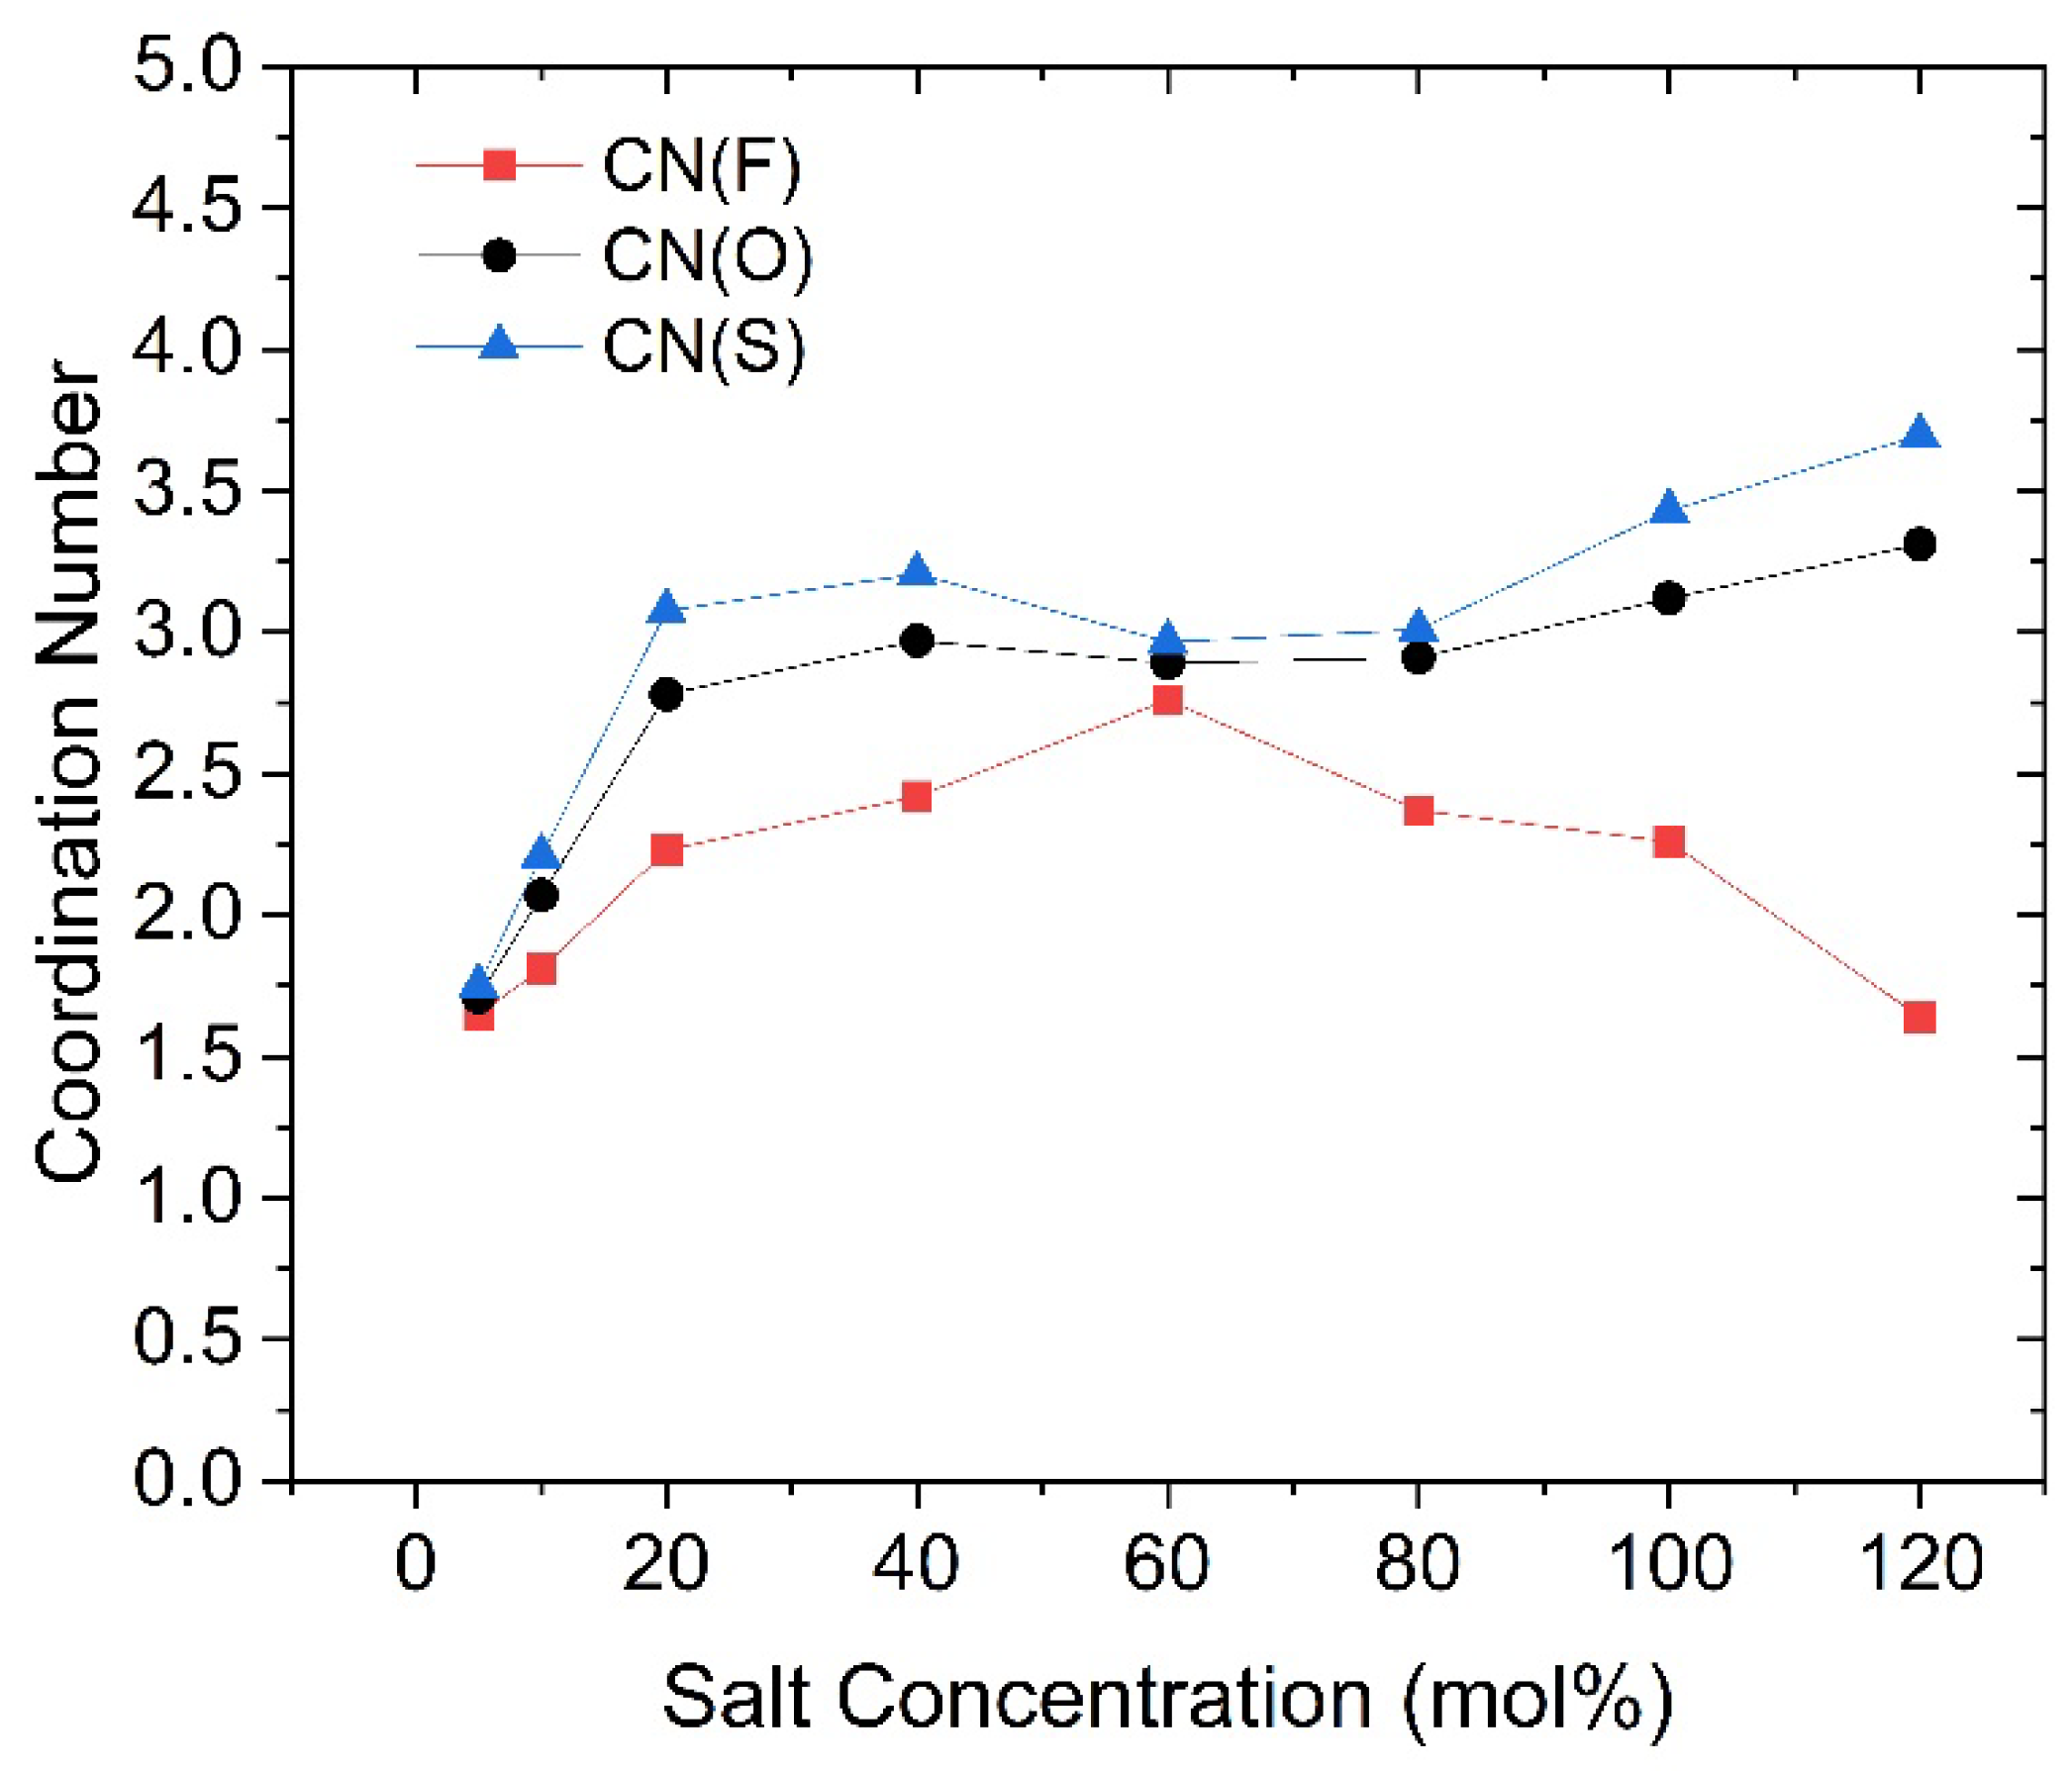
Figure 8.
Changes in solvation free energy of Li cations with different salt concentrations, marked by colors with the faster group in red, the slower group in blue, and the overall Li cations in black.
Figure 8.
Changes in solvation free energy of Li cations with different salt concentrations, marked by colors with the faster group in red, the slower group in blue, and the overall Li cations in black.
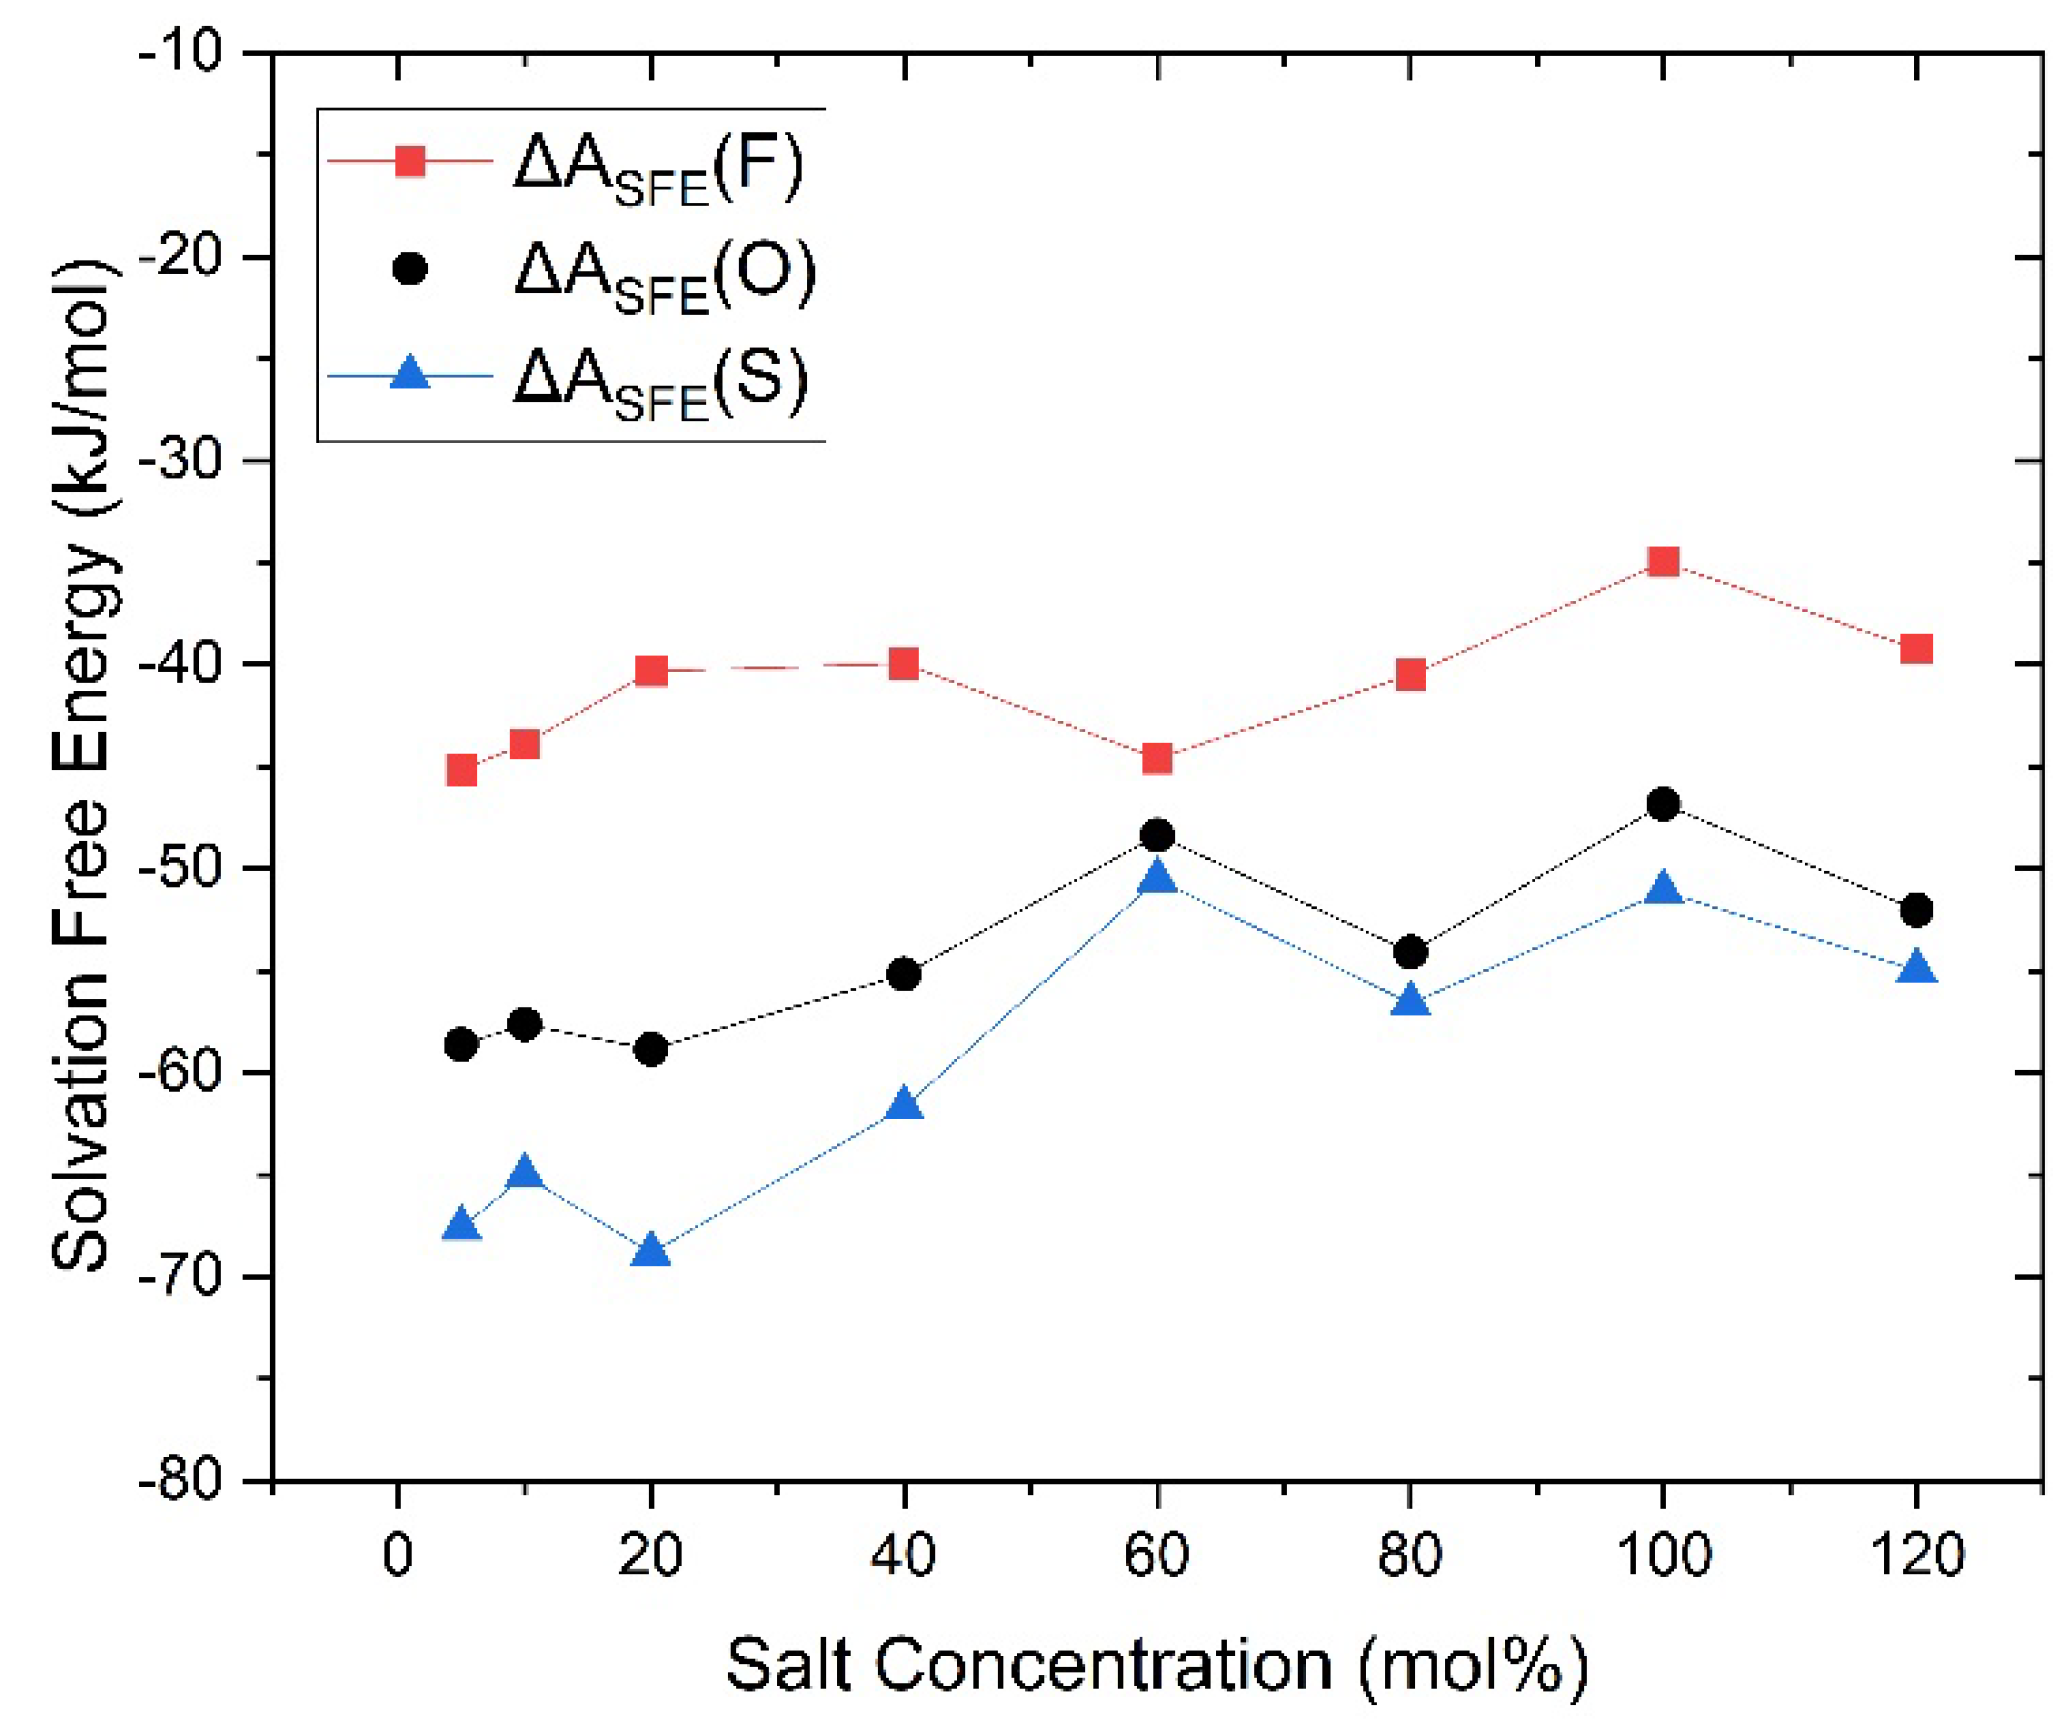
Figure 9.
Three typical solvation structures of faster Li cations with different salt concentrations of (a) below 60 mol%, (b) from 60 mol% to 100 mol%, and (c) over 100 mol%.
Figure 9.
Three typical solvation structures of faster Li cations with different salt concentrations of (a) below 60 mol%, (b) from 60 mol% to 100 mol%, and (c) over 100 mol%.
Disclaimer/Publisher’s Note: The statements, opinions and data contained in all publications are solely those of the individual author(s) and contributor(s) and not of MDPI and/or the editor(s). MDPI and/or the editor(s) disclaim responsibility for any injury to people or property resulting from any ideas, methods, instructions or products referred to in the content. |
© 2024 by the authors. Licensee MDPI, Basel, Switzerland. This article is an open access article distributed under the terms and conditions of the Creative Commons Attribution (CC BY) license (https://creativecommons.org/licenses/by/4.0/).
Copyright: This open access article is published under a Creative Commons CC BY 4.0 license, which permit the free download, distribution, and reuse, provided that the author and preprint are cited in any reuse.


