Submitted:
27 November 2024
Posted:
28 November 2024
You are already at the latest version
Abstract
Morphometric measurements of the toe serve as a reference for the objective assessment of the presence of a pathological condition and as a guide for the correct trimming of the hooves. Therefore, the anatomical differences between horses and donkeys oblige an autonomous database with reference values for the donkey. This study is the first to provide readings of the distal hind limb on radiographs of donkeys. Radiographs of the distal hind limb in two projections of 41 generally sound donkeys without lameness in walk were taken after previous hoof trimming and preparation according to a standardized radiographic procedure. A total of 16 lengths and 9 angles were measured and statistically analyzed in each hoof. The dorsal hoof wall is on average 70 to 80 mm long and angled at 55°; the coffin bone runs parallel to the hoof wall. The average founder distance is 17 mm, the mean sole thickness is 14 mm. The heel angle averages 52°, which is slightly flatter than the hoof wall angle. In conclusion, the morphometric measurements confirm the difference in normal anatomy between horses and donkeys and correlations with weight and height are observed.
Keywords:
donkey
; hindlimb
; radiograph
; X-ray
; measurement
; hoof
; toe
; physiology
; equid
; database
1. Introduction
The hoof condition has been shown to have a significant impact on the welfare and health of donkeys [1,2,3]. In a British donkey population studied over a seven-year period, 44.8% of euthanized cases were diagnosed with foot disorders at necropsy which are therefore of high clinical relevance in this equid species [4]. Links between neglected hoof care and poor nutritional status and lameness in donkeys have also been demonstrated, therefore the importance of a healthy hoof is undeniable [1,5]. The veterinarian and farrier can have a significant influence on hoof health, gait and general condition in a prophylactic, metaphylactic and therapeutic manner [6,7]. However, this requires an adequate assessment of the hoof capsule and the bony and soft tissue structures it contains to assess which condition is considered normal or desirable and from which deviations a pathological condition can be deduced and must therefore be optimized. For the correct assessment of such conditions, many horse studies have resulted in reference values based on different length and angular measurements on projections of the toe. These findings serve as a guideline in daily work in which pathological change can be derived from deviation from the morphometric measured values. It has also been shown that the measured values significantly depend on factors including horse breed, hoof preparation, and within an individual between the right and left side and forelimb to hind limb. [8,9,10,11]. As there are anatomical differences between donkeys and horses that cannot be ignored, especially in the hoof area [3,12,13,14,15,16], it can be assumed that the reference values determined for the horse cannot be transferred to the donkey without restriction [17]. A few authors have already determined measured values by radiologically examining front hooves of clinically sound donkeys and donkeys with specific hoof diseases or conformational abnormalities [18,19,20,21,22,23,24]. While the existing pool of corresponding data on the hindlimb is already considerably smaller in horses [25], to the author’s current knowledge there is no published study that has carried out morphometric measurements on the toe of the hindlimb of donkeys on radiographs.
The aim of this study is therefore to generate mean values and standard deviations using length and angular measurements on the lateromedial and dorsoplantar radiographs of the right and left toe of the hind limb of donkeys. These should serve as a reference in practical work with donkeys in order to maintain hoof health and to objectify and simplify the detection of pathological conditions. In addition, 1. the influence of the projection-related magnification factor on the measurements should be investigated, 2. significant differences in the measurements between the right and left hind limb should be analyzed and 3. correlations with various factors such as age, weight and size should be determined.
2. Materials and Methods
2.1. Participating Subjects
46 donkeys were included in the prospective observational study between July 2022 and February 2024 that had to meet the following criteria: generally sound, no obvious lameness in walk as well as no history of lameness according to the owners, no influence of analgesic/antiphlogistic medication. In addition, hoof preparation had to be necessary due to the current condition of the hooves. At the beginning, available information on the medical history, usage, husbandry and routine hoof management was collected after the owners had been informed and had given their consent. Due to the indication of optimizing routine hoof treatment, an ethical review and approval by the responsible animal welfare authority was not mandatory. The study was approved by the doctoral office of the Department of Veterinary Medicine at Justus Liebig University Giessen.
2.2. Procedure
The hooves were then trimmed and cleaned by approved farriers from the farriery of the Clinic for Equine Surgery and Orthopedics. Afterwards, radiopaque markers were applied to the hind hooves to highlight relevant measurement points on the radiographs. The distal limbs were imaged in the lateromedial and dorsoplantar projections according to a standardized X-ray procedure [26]. For the 90° image, the dorsal hoof wall was fitted with a wire, the proximal end of which was intended to mark the coronet band at the border to the hairy skin and ran to the ground directly along the dorsal hoof wall. The coronet band at the most plantar point was marked with a metal ball measuring 0.5 x 0.5 x 0.5 cm in the imaginary extension of the bale furrow to the plantar side at the transition to the hairy skin. A paper clip aligned vertically to the weight-bearing border was attached to the tip of the frog to mark the sole. For the 0° projection, the paper clip was left in position and the metal ball was removed, as was the wire on the dorsal hoof wall. Instead, 2 wires were fixed to the lateral and medial hoof wall at the widest point with the proximal end at the level of the coronet band at the transition to the hairy skin, which were orientated parallel to the course of the hoof horn in the direction of the weight-bearing border.
Both hind limbs were positioned on customized wooden blocks measuring 23 cm x 18 cm x 18 cm, with equal weight bearing. A metal ball measuring 0.5 x 0.5 x 0.5 cm was drilled into the center of the blocks and a 2 cm deep edge was milled into each of the outer edges, into which an 80 cm long wooden slat was inserted to ensure correct alignment of the central beam and a repeatable equal distance between the X-ray unit and the cassette (Figure 1). As the X-ray images were generated with different portable X-ray systems due to the circumstances, the exposure settings (kV and mAS) were adapted individually for optimal imaging but were generally based on the settings recommended for the system, the animal species and the anatomical localization.
The orientation of the central beam was chosen according to the standardized procedure described by Kummer et al. [26]. In detail, the central beam for the lateromedial image was focused on the middle between the dorsal hoof wall and the most plantar point of the coronary band approx. 2 cm distal to the coronary band, parallel to the ground and orthogonal to the toe alignment and cassette. The cassette was positioned as close as possible to the limb at the medial edge of the block in accordance with the alignment of the central beam and the limb. In the dorsoplantar projection, the beam was centered on the dorsal hoof wall between the lateral and medial hoof wall and approx. 2 cm distal to the coronary band. The placement of the cassette was analogue to the criteria used for the lateromedial radiograph.
2.3. Measurements
The radiographs were transferred as DICOM formats to the data processing software EasyVET®. The measurements were taken using the image processing tool contained in the software (EasyImage).
Seven angular measurements and calculations as well as seven length measurements were carried out on the right and left sides of the lateromedial image (Figure 2; Table 1 & Table 2).
Nine distances and two angles were obtained on the dorsoplantar projection. Abbreviations and definitions of the respective variables are listed in Table 3 and Table 4. The application of the various measurements is shown in Figure 3.
For the length measurements, the magnification effect caused by the X-ray was determined using the metal balls, which have the same known dimensions of 0.5 cm x 0.5 cm x 0.5 cm in each projection, and the absolute measured values were calculated as normalized values taking into account the respective individual magnification factor (formula: actual length = length measured radiographically x actual length of the marker / length of the marker measured radiographically [10]).
2.4. Statistical Analysis
For the statistical analysis using the SAS© software, the donkeys were divided into different groups according to the factors investigated. For age, a distinction was made between juvenile (0-4 years) and adult (> 4 years). The size was categorized into small (≤ 105 cm height at the withers), medium (105 – 135 cm height at the withers) and large (≥ 135 cm height at the withers) mainly according to breed and weight [27]. Descriptive statistics with mean values, standard deviation, median, minimum, maximum and 95% confidence interval limits were calculated for the distribution of breed, age, weight, sex and size, as well as for the individual variables. Due to the sometimes-wide range of the measured values of the entire donkey population studied, the data of a more homogeneous donkey population from the test population, the adult medium-sized donkeys, were also analyzed for each question in the further evaluations. Due to individual uncooperativeness of some subjects in some X-ray projections, the sample numbers for the affected variables are reduced accordingly.
A Spearman rank correlation was calculated for the question of whether the absolute measured values differ from the normalized values, and a Passing-Bablok regression was calculated after checking the linearity required for this using the CUSUM test. In order to analyze the variables for significant differences between the right and left hind limb, a paired t-test was carried out after the differences in the values were checked for normal distribution using the Shapiro-Wilk test. The distribution was also visualized graphically. To determine correlations between the hoof parameters and the variables of age, weight and height of the test subjects, a Spearman rank correlation was calculated and a graphical representation using a scatterplot was selected. When calculating the correlation regarding age and size, only the data from the entire donkey population was analyzed, as the specific donkey group only consists of adult, medium-sized individuals. The significance level for all calculations was set at p= 0.05.
3. Results
3.1. Descriptive Analysis
Of the 46 donkeys kept in Germany that were included in the study during the period, lateromedial radiographs of the hind limbs were successfully obtained in a maximum of 41 donkeys due to individual lack of cooperation. Of these, 92.68 % were adults (n=38). The donkeys were categorized into three different groups, in which more than half (56.10%, n= 23) fell into the ‘medium’ category. 5 donkeys (12.20%), mainly the poitous (n=4), were categorized as ‘large’ and the remaining 13 donkeys, mainly represented by the dwarf donkeys, were categorized as ‘small’ (31.71%). The average age in this population was 12.58 years, with the youngest animal being one year old and the eldest 40 years old. The donkeys weighed on average 191 kg with a range of 90 kg (min.) to 409 kg (max.). There were 18 (43.90%) males and 23 (56.10%) females included.
In 37 right and 35 left hind limbs, a radiograph was successfully generated in the dorsoplantar projection. Also, in this population the domestic donkeys are the main breed represented with 86.49% (n= 32). The average age (12.78 y.) and the average weight (193.86 kg) are roughly comparable to the data of the population in which lateromedial radiographs could be taken, as is the gender distribution with 21 mares and 16 males.
In the group of adult medium sized domestic donkeys (GAMD), the sample size of the maximum X-ray images taken per hind limb is reduced to 21 right and 21 left feet in the lateromedial (l.m.) projection, and 17 (left) and 19 (right) hooves in the dorsoplantar (d.p.) projection. The average age shifts by approximately one year to 14.19 years (l.m.) and 14.83 years (d.p.) compared to the total population, while the average weight of 189 kg (l.m.) and 193.86 kg (d.p.) is not subject to any relevant changes, but the range is noticeably narrower at 151 kg (min.) to 266 kg (max.). Regarding gender distribution, a clear shift in the male to female ratio of approx. 37 % to 64 % can be observed.
Both age and weight are not normally distributed in the populations analyzed.
The descriptive distributions mentioned above refer exclusively to the maximum available data on the two X-ray projections, which were calculated using the variables DWL for the l.m. projection and CW for the d.p. projection as examples. In individual cases, measurements for specific parameters are missing, so that the analyzed sample size and consequently the distribution of the analyzed factors (age, weight, etc.) shifts individually for each variable. The specific sample size for each variable in the respective analyses is shown as ‘n’ in the tables below
3.2. Differences Between Measured Values and Normalized Values
In a comparison of the absolute length measurements of the variables determined on the lateromedial radiographs with the normalized values (DWL, ST, DCH, HL, PCH, FD), all variables show a significant, very strong positive correlation and a linear interrelationship, both in the overall population and in the group of adult medium-sized domestic donkeys (GAMD). No systematic and/or proportional differences were found (Table A1 & Table A2). As a result, the following analyses focused primarily on the absolute measurements.
3.3. Differences Between the Right and Left Hind Limb
All analyzed length and angular measurements on both the lateromedial and dorsoplantar X-ray projections are listed separately for the right and left toe of the hind limb in Table A3 & Table A5 (total population) and A4 & A6 (GAMD). As shown in Table 5, the variables HL (p=0.0051/0.002), PCH (p=0.0084/0.009) and CW (p=0.0361/0.03) show significant differences between the right and left hind limb in both the total population and in the GAMD. Compared to the left side, the right hind hoof of the total population of donkeys has on average 1.91 mm longer heels and correspondingly an average 1.42 mm longer plantar coronet band height. Right hooves on the dorsoplantar radiograph tend to have a narrower coronary band width compared to the left hind hoof with an average difference of 0.77 mm (all).
3.4. Correlations
3.4.1. Age
Regarding the age of the test subjects, no or only weak, non-significant dependencies of the variables can be proven. The only exceptions in the total population are the coffin bone angle (CBA) with rs = 0.28 and p = 0.02 and the axial deviation in the proximal interphalangeal joint (HPA1) with rs = -0.33 and p = 0.003.
3.4.2. Weight
Overall, almost all length measurements in the total population show moderate to strong positive correlations with height and weight, whereas stronger correlations between the variables and weight can be observed (Table 6). With correlation coefficients of 0.54 (all)/0.59 (GAMD), 0.5 (all)/0.53 (GAMD) and 0.55 (all)/0.50 (GAMD), the dorsal coronet height (DCH), sole length (SL) and foot width (FW) show strong, significant (p < 0.05 in each case) dependence on weight in both populations studied. Further significant correlations were found between weight and the variables DWL, FD, CBA and CW in both populations, with the dependency in the GAMD appearing to be moderate, while the latter variable showed a strong correlation in the total population. Sole thickness (ST) is the length measurement with the weakest correlation to the three factors analyzed.
3.4.3. Height
The variables correlating with height show a milder degree of dependency compared to weight. Moderate correlations can be found for the same variables that are also dependent on weight (Table 6).
3.4.4. Angular Measurements
Overall, rather weak to moderate correlations can be found in the angular measurements compared to the length measurements. However, the strongest correlations are also found with weight, followed by height and finally age. The angular parameters CR, HA, MWA and LWA show no dependence on the analyzed factors age, weight and height. The axial deviations in the proximal and distal interphalangeal joint (HPA1 & 2) are the only variables analyzed to show significant, negative correlations with weight and height (Table 6).
4. Discussion
The aim of this study was to describe the physiological radiographic anatomy of the distal hind limb of domesticated, generally sound and lameness-free European donkeys using morphometric measurements. As shown in Table A3, Table A4, Table A5, Table A6, A7 and A8, the descriptive data of the entire donkey population (n max. =41) of all ages, sizes, breeds and weights show approximately two to three times wider standard deviations of the mean values for some length measurements when compared with those of the group of adult domestic donkeys of medium size (GAMD). The mean values, on the other hand, show noticeably smaller differences between the entire donkey population and the GAMD, although the values are generally slightly smaller in the GAMD. In contrast, the angular measurements are almost identical between the two populations. The variables describing the distance from the coffin bone to the ground (ST, SST, LST, MST) are the length measurements with the smallest divergence between the values of the total population and the selected donkey group. The smaller dispersion of the standard deviation in the GAMD reflects the smaller variation in size within this population and, conversely, also explains why the distribution in the population, which includes all breeds and sizes, is significantly wider. As angles are independent of length measurements, it is not surprising that these are also very similar between the two populations and can therefore be used to objectively assess hoof conditions, regardless of breed or size. This is also confirmed by the correlation calculations of the variables for age, size and weight, which are shown in Table 6. Here, too, the angular measurements show only rather weak to moderate and little significant correlations with age, weight and height. It is also noticeable here that the sole thickness parameters show the weakest correlations between length measurements and height, age and weight.
Consequently, it can be deduced for daily use that the sole thickness and angular measurements are particularly suitable for comparing the measured values collected in individual cases with the data published here, as these appear to be more independent of age, weight and height. Furthermore, no relevant influence of age on the data can be determined here, so that this can be regarded as negligible for the evaluation of radiographs of the distal toe of hind limbs of donkeys anyway. Wacker et al. came to comparable results when they investigated radiographic coffin bone changes in a donkey population regarding the influence of age [17]. In 2006, Kummer et al. were also unsuccessful in establishing a correlation between the parameters measured on radiographs of warmbloods and age [9]. Only in the first year of life a significant correlation of age with the change in morphometric measurements of the toe of horses was proven [28]. In addition, a significant correlation between the severity of lameness and increasing age was found in highly prevalent lame draft donkeys in Pakistan [5], as well as a significant correlation between the presence of lameness and increasing age in another Pakistani working donkey population [29]. Due to the inclusion criteria, which require general soundness and absence of lameness in walk, lame, presumably older donkeys were not examined radiographically. Lameness can be an indirect indication of a morphometric deviation, so that it can be presumed that a correlation of morphometric parameters with age is potentially considered possible if lame and therefore very likely older donkeys are included in the study population. Consequently, a correlation cannot be proven based on the data available here, but it should nevertheless be taken into consideration. Further studies are required to determine more precisely the influence of age on the measurement variables and a potential causal relationship with a pathological condition.
In contrast, almost all remaining length measurements show moderate to strong, significant correlations with weight and size in the overall population; the strongest correlations are observed for dorsal coronet height (DCH), sole length (SL) and foot width (FW). In particular, foot width (FW) is also reported in the related literature to be strongly and positively correlated with height and weight in both donkeys and horses [10,30,31]. Additionally, similar conclusions as in the present study can be found that primarily the length measurements correlate with weight and height [9,11], while the angular measurements and the parameters related to sole thickness (ST, SST, MST and LST) show rather weak and partially non-significant correlations [11]. In other studies in horses, no significant changes in founder distance (FD) could be determined in connection with height or weight [10,26], while the data available here for the total population and GAMD (*) suggest a moderate, significant correlation with weight (rs = 0.47/0.41*, p < 0.0001/ = 0.008*) and height (rs= 0.35, p= 0.002), as was also observed in a conformation study in ponies [11]. An influence of the factors on the measured sinking of the coffin bone within the hoof capsule can therefore not be excluded.
Furthermore, as a result of comparative studies of morphometric measurements intra vitam and postmortem in both donkeys and horses, it is assumed that the load on the limb also has a relevant influence on the measurement of the founder distance [26,32]. Multiple studies prove that the founder distance should not be compared between donkeys and horses in general due to the different hoof anatomy, especially the more distal coffin bone in donkeys [2,3,14,18,33,34]. Considering this, the author agrees with other authors in the opinion that the founder distance and the subsequent deduction of a pathological condition of the hoof in the form of laminitis should be interpreted with the highest degree of caution, as the differentiation between normal and deviation from normal findings is very sensitive to error due to the inevitable dependence on factors such as species, breed, weight, size, load and forelimb to hind limb, particularly in the case of mild changes. In addition, the author agrees that a multi-parameter approach in combination with anamnestic indications and clinical findings is the most reliable method of verifying a pathological condition in the hoof [11,18,19,20,26,35,36]. As the results presented here also suggest, Lesniak et al. demonstrated a stronger influence of weight on hoof conformation in horses compared to size in their study [30]. Wacker et al. also identified a significant, positive correlation between the weight of the donkeys and the coffin bone changes [17].
In the studies dealing with the morphometric normal anatomy of the donkey’s toe, it was deduced and hypothesized from the data that the measured parameters are subject to a strong breed-related influence and that it is therefore advisable to generate and provide specific, validated morphometric reference values for each breed [18,19,31,37]. This has already been proven in the horse population by multiple conformation studies of different horse breeds [9,10,11,25,38,39]. The strong divergence of the standard deviations between the total population and the population of medium-sized adult domestic donkeys in the current study, as well as evidence of some strong dependencies on weight and size, which are also linked to a specific breed exterior, support this recommendation in order to differentiate normal findings from pathological findings as accurately as possible. Consequently, the influence of weight, size and breed should be considered when evaluating for pathological changes, particularly in the case of linear measurement variables.
The influence of the projection-related magnification of the measured values on the X-ray images must also be considered. A very strong, positive, significant correlation with a linear relationship between the absolute measured values and the normalized, corrected values was proven here, so that the magnification factor can be considered negligible. From a scientific point of view, it is unquestionable that the use of the standardized values is more correct and precise, as they reflect the real measured distance and can also guarantee the most reliable comparability in repeat examinations. Since the realization in field conditions is rather impractical, the authors consider the conversion to be non-mandatory based on slight deviations. If the differentiation between pathological and normal findings based on the measurements is unclear in a questionable case, the calculation of the artificial magnification can nevertheless prove helpful.
In this study, only three variables (HL, PCH and CW) showed significant differences between the right and left hind limb. A significant difference was also calculated for sole length (SL) in the total population, but this significance is not permissible due to the non-normally distributed values and is also not confirmed in the normally distributed GAMD, so that this statistical anomaly is to be considered irrelevant. Compared to the left side, the right hind hoof tended to have longer heels and a correspondingly higher plantar coronet band height. Due to the slight difference in the average width of the coronet band between the right and left side, the discrepancy between the two hind limbs is considered negligible despite the calculated statistical significance. Comparably, right-left asymmetries were found in morphometric examinations of working donkeys in Pakistan, in which the right front hoof also showed statistically significant (p = 0.02) longer heels with a difference of 0.28 cm compared to the left, in addition to a longer medial hoof wall (MWL) and a longer sole[29]. Kummer et al. showed in morphometric studies on the hooves of warmbloods that the right front hoof had a longer dorsal hoof wall (DWL) in 70% of cases, while the bony structures were larger on the left side on both the LM and DP projections [9]. A side preference of horses has been discussed as an explanation, as has already been investigated in Thoroughbreds, for example [40]. Thieme et al. found rather minor differences between the right and left limbs of the pony population studied, but they also noted an asymmetry on the LM image, in which both the front and hind limbs had significantly larger left hooves (FL) and the left hooves tended to be flatter, while the right, smaller hooves were more steeply angled and also deduced side preferences of the horses from this [11]. Lesniak et al. also observed an increasing asymmetry between the right and left forelimb with growing mass and size; the left forelimb tended to have a more acute angle, i.e., to become flatter, while the right forelimb appeared steep and cubic [30]. In the population studied by Cripps and Eustace, no significant differences between the right and left forelimb could be detected [10], nor in the hind limbs of the horses studied by Kalka et al. [25] and in the front hooves of the Amiata donkeys [19]. Although no significant divergence of the DWL or DWA and thus no evidence of massive hoof asymmetry between the right and left limb, as described in horses, can be found in the data presented here, there is accumulating evidence that a longer heel on the right hoof is a more frequently observed morphometric hoof asymmetry in horses and donkeys. Presumably this is also due to individual laterality and the resulting load and growth asymmetries, but otherwise no relevant differences between the left and right hind limb were found in this study, so that the existence as well as the relevance of a possible laterality regarding morphometric measurements on the hind limbs of donkeys should be viewed critically and require further investigation.
As only the measurements of the hind limb were evaluated in this study, no statistical analysis of the comparison of the data between the forelimb and hind limb is available. Table 7 and Table 8 compare the measured absolute mean values and standard deviations of the entire donkey population (all), the selected group of adult domestic donkeys of medium size (GAMD) and analogously collected parameters in other studies of horses and donkeys on the front and hind toes, so that the values are compared and discussed below.
Basically, there is only one other publication that provides morphometric measurement data on the hind hooves of donkeys [31], so that the comparison is otherwise made with the also rare baseline data collected on hind limbs of different horse breeds [10,11,25,38,39,41,42]. For the front hooves, there is significantly more published data for donkeys of different breeds, use and origin [18,19,20,21,24,29,31], so that the comparison here focuses on the donkeys and the horses are excluded.

Table 7.
Comparison with literature, compared with other hindlimbs.
| v | Schaus et al. | Mostafa et al. 2020 [31] | other authors | ||||||
| all | GAMD | donkeys** | horses & ponies | ||||||
| right hind | left hind | right hind | left hind | right hind | left hind | right hind | left hind | publication | |
| DWL1 | 83.93 ± 21.51 | 83.56 ± 20.62 | 79.25 ± 10.00 | 77.82 ± 7.67 | 68.4 ± 3.60 | 80.38 ± 11.15 | 80.53 ± 10.94 | [11] | |
| 78.00 ±11.00 | [42] | ||||||||
| 86.00 ± 6.00 | [38] | ||||||||
| ST1 | 15.57 ± 4,30 | 15.16 ± 4.09 | 15.78 ± 3.60 | 14.12 ± 3.23 | 10.37 ± 2.40 | 10.31 ± 2.14 | [11] | ||
| 20.00 (˜x) | [39] | ||||||||
| DCH1 | 70.80 ± 18.65 | 70.04 ± 18.45 | 67.90 ± 9.59 | 65.99 ± 8.24 | 69.00 ± 4.00 | [38] | |||
| HL1 | 17.96 ± 5.72 | 16.05 ± 4.07 | 18.39 ± 6.04 | 15.58 ± 4.06 | 33.90 ± 3.30* | 34.10 ±3.60’ | 43.00 ± 12.00 * | 43.00 ± 10.00’ | [42] |
| PCH1 | 14.38 ± 4.87 | 12.96 ± 3.61 | 14.41 ± 5.19 | 12.32 ± 3.81 | |||||
| FD1 | 18.77 ± 7.31 | 18.02 ± 7.73 | 17.46 ± 3.73 | 17.19 ± 3.65 | 8.77 ± 2.35 | 8.72 ± 2.45 | [11] | ||
| 11.90 (˜x) | [39] | ||||||||
| 5.22 ± 2.79 | [10] | ||||||||
| SL1 | 114.36 ± 32.20 | 117.47 ± 30.85 | 106.36 ± 14.33 | 108.38 ± 13.43 | 121.51 ± 18.97 | 124.54 ± 19.52 | [11] | ||
| 117 .00 ± 17.00 | [42] | ||||||||
| 114.00 ± 8.00 | [38] | ||||||||
| HWA2 | 55,72 ± 4.31 | 55.39 ± 4.19 | 56.77 ± 4.82 | 56.46 ± 3.68 | 59.61 ± 3.48 | 121.51 ± 18.97 | 124.54 ± 19.52 | [11] | |
| 53.70 ± 5.70 | [42] | ||||||||
| 48.32 (˜x) | [39] | ||||||||
| 50.90 ± 3.70 | 50.90 ± 3.60 | [25] | |||||||
| 52.00 ± 4.00 | [38] | ||||||||
| 49.08 ± 3.18 | [10] | ||||||||
| CBA2 | 56.67 ± 4.70 | 55.80 ± 4.43 | 58.15 ± 4.62 | 56.95 ± 4.13 | 49.5 (˜x) | 50.4 (˜x) | 50.86 ± 3.54 | 50.95 ± 3.24 | [11] |
| 49.09 (˜x) | [39] | ||||||||
| 48.94 ± 3.06 | [10] | ||||||||
| CR_c2 | 0.95 ± 3.29 | 0.42 ± 3.01 | 1.38 ± 3.58 | 0.49 ± 2.90 | 49.75 ± 3.85 | 49.98 ± 3.49 | [11] | ||
| -0,14 ± 1.59 | [10] | ||||||||
| CR_m2 | 1.26 ± 3.27 | 1.32 ± 2.92 | 1.70 ± 3.39 | 0.87 ± 3.01 | -1.1 ± 1.41 | -0.97 ± 1.46 | [11] | ||
| PA2 | 6.21 ± 4.02 | 5.24 ± 4.09 | 6.80 ± 3.00 | 5.64 ± 3.80 | -2.75 ± 2.80 | -4.00 ± 2.30 | [41] | ||
| 2.81 (˜x) | [39] | ||||||||
| 4.00 ± 7.00 | [38] | ||||||||
| HA2 | 52.81 ± 5.81 | 53.01 ± 6.04 | 52.17 ± 5.89 | 52.27 ± 6.95 | 56.89 ± 3.64 | 70.40 ± 6.10* | 75.10 ± 6.00’ | [42] | |
| 36.60 ± 9.70 | 36.30 ± 9.40 | [25] | |||||||
| HPA12 | 5.4 ± 8.82 | 4.34 ± 9.47 | 3.62 ± 8.84 | 2.04 ± 10.48 | -10.50 ± 3.10 | -9.90 ± 2.70 | [41] | ||
| HPA22 | -0,67 ± 11.08 | -3.14 ± 10.11 | -4.34± 12.69 | -6.14 ± 8.70 | -13.10 ± 9.86 | -13.90 ± 4.50 | -16.5 ± 5.60 | [41] | |
| 6.64 ± 25.64 | [10] | ||||||||
| LWA2 | 88.23 ± 4.55 | 87.22 ± 4.41 | 87.24 ± 4.50 | 86.63 ± 4.35 | 76.00 ± 4.00 | [38] | |||
| MWA2 | 88.84± 4.54 | 88.64± 4.10 | 87.72 ± 3.76 | 88.04 ± 3.58 | 81.00 ± 4.00 | [38] | |||
| CW1 | 80.33 ± 24.95 | 81.10 ± 26.03 | 73.93 ± 11.39 | 73.77 ± 8.68 | |||||
| FW1 | 83.37 ± 23.04 | 83.65 ± 23.67 | 78.23 ± 11.35 | 78.07 ± 9.40 | 63.30 ± 3.70 | 100 ± 18.00 | [42] | ||
| 108.00 ± 6.00 | [38] | ||||||||
| LWL1 | 61.39 ± 17.67 | 62.26 ± 16.53 | 58.38 ± 5.63 | 58.67 ± 6.58 | |||||
| MWL1 | 59.52 ± 16.87 | 61.02 ± 19.19 | 57.37 ± 6.52 | 56.21 ± 7.65 | |||||
| LCH1 | 60.93 ± 17.55 | 61.94 ± 17.12 | 58.02 ± 5.42 | 57.84 ± 6.63 | |||||
| MCH1 | 59.56 ± 17.18 | 59.85 ± 18.64 | 57.92 ± 9.05 | 54.91 ± 7.26 | |||||
| SST1 | 16.71 ± 6.00 | 16.53 ± 4.61 | 16.29 ± 4.20 | 16.10 ± 3.13 | |||||
| LST1 | 20.36 ± 7.22 | 19.53 ± 5.88 | 19.73 ± 4.53 | 18.88 ± 3.57 | |||||
| MST1 | 19.80 ± 6. 12 | 20.02 ± 9.83 | 19.58 ± 4.02 | 21.40 ± 12.19 | |||||
1= in mm, 2= in °, ˜x = median, * = lateral, ‘ = medial, v = variable, ** = working donkeys from Egypt, GAMD = group of adult medium sized donkeys, [11] = Thieme 2015, [42] = Mellish 2023, [38] = Herbrecht 2020, [39] = Cardona 2021, [10] = Cripps & Eustace 1999, [25] = Kalka 2021, [41] = Sharp 2022, Data for right/left is shown in the specified column. In cases where no specification was made the data is centered between both columns.
Table 8.
Comparison with literature, compared with front limbs of donkeys.
| v | Schaus et al. | Wacker (submitted) [24] | other authors | ||||||
| all | GAMD | all | donkeys | ||||||
| right hind | left hind | right hind | left hind | right front | left front | right front | left front | publication | |
| DWL1 | 83.93 ± 21.51 | 83.56 ± 20.62 | 79.25 ± 10.00 | 77.82 ± 7.67 | 81.41 ±23.00 | 80.41 ± 22.07 | 78.33 ± 8.60 | [21] | |
| 66.60 ± 9.20 | 65,70 ± 10.10 | [29] | |||||||
| 80.00 ± 2.70 | [19] | ||||||||
| 77.40 ± 0.2 | [20] | ||||||||
| ST1 | 15.57 ± 4,30 | 15.16 ± 4.09 | 15.78 ± 3.60 | 14.12 ± 3.23 | 16.66 ±5.83 | 15.82 ± 4.50 | 23.00 ± 4.34 | [21] | |
| 18.70 ± 1.10 | [19] | ||||||||
| 24.30 ± 0.2 | [20] | ||||||||
| DCH1 | 70.80 ± 18.65 | 70.04 ± 18.45 | 67.90 ± 9.59 | 65.99 ± 8.24 | 70.03 ± 19.82 | 69.16 ±19.11 | 68 .47 ±8.96 | [21] | |
| HL1 | 17.96 ± 5.72 | 16.05 ± 4.07 | 18.39 ± 6.04 | 15.58 ± 4.06 | 18.48 ± 5.65 | 20.29 ±5.95 | 47.13 ± 10.24 | [21] | |
| 34.90 ± 9.10 | 32.20 ± 7.40 | [29] | |||||||
| PCH1 | 14.38 ± 4.87 | 12.96 ± 3.61 | 14.41 ± 5.19 | 12.32 ± 3.81 | 14.92 ± 4.89 | 16.28 ± 5.81 | 31.70 ± 6.08 | [21] | |
| FD1 | 18.77 ± 7.31 | 18.02 ± 7.73 | 17.46 ± 3.73 | 17.19 ± 3.65 | 18.39 ±7.52 | 18.50 ± 7.31 | 19.0 ± 0.80 | [19] | |
| 25.20 ± 31.80 | [20] | ||||||||
| 10.40 ± 3.66 | [18] | ||||||||
| SL1 | 114.36 ± 32.20 | 117.47 ± 30.85 | 106.36 ± 14.33 | 108.38 ± 13.43 | 86.57 ± 9.47 | [21] | |||
| 89.60 ± 13.10 | 87.50 ± 11.50 | [29] | |||||||
| 127.50 ± 3.40 | [19] | ||||||||
| 95.40 ± 0.20 | [20] | ||||||||
| HWA2 | 55,72 ± 4.31 | 55.39 ± 4.19 | 56.77 ± 4.82 | 56.46 ± 3.68 | 58.28 ± 4.63 | 57.97 ± 4.68 | 58.60 ± 4.39 | [21] | |
| 62.52 ± 8.29 | 61.48 ± 8.17 | [29] | |||||||
| 57.30 ± 0.7 | [19] | ||||||||
| 70.2 ± 88.5 | [20] | ||||||||
| 61.61 ± 5.24 | [18] | ||||||||
| CBA2 | 56.67 ± 4.70 | 55.80 ± 4.43 | 58.15 ± 4.62 | 56.95 ± 4.13 | 59.57 ± 4.62 | 59.14 ±4.47 | 57.00 ± 4.30 | [21] | |
| 58.00 ± 1.00 | [19] | ||||||||
| 70.2 ± 95.4 | [20] | ||||||||
| 64.11 ± 4.70 | [18] | ||||||||
| CR_c2 | 0.95 ± 3.29 | 0.42 ± 3.01 | 1.38 ± 3.58 | 0.49 ± 2.90 | 1.29 ± 3.65 | 1.17 ± 3.50 | 1.40 ± 0.80 | [19] | |
| 2.50 ± 3.07 | [18] | ||||||||
| CR_m2 | 1.26 ± 3.27 | 1.32 ± 2.92 | 1.70 ± 3.39 | 0.87 ± 3.01 | 1.45 ± 3.73 | 1.27 ± 3.73 | |||
| PA2 | 6.21 ± 4.02 | 5.24 ± 4.09 | 6.80 ± 3.00 | 5.64 ± 3.80 | 6.37 ± 3.98 | 6.09 ± 3.23 | 4.80 ± 1.64 | [21] | |
| 25.0 ± 31.6 | [20] | ||||||||
| 8.26 ± 4.75 | [18] | ||||||||
| HA2 | 52.81 ± 5.81 | 53.01 ± 6.04 | 52.17 ± 5.89 | 52.27 ± 6.95 | 50.58 ± 8.82 | 51.59 ± 8.82 | 53.20 ± 7.98 | [21] | |
| 54.89 ± 8.33 | 56.39 ± 9.34 | [29] | |||||||
| HPA12 | 5.4 ± 8.82 | 4.34 ± 9.47 | 3.62 ± 8.84 | 2.04 ± 10.48 | 9.27 ± 4.64 | 9.77 ± 4.01 | 9.0 ± 0.9 | [19] | |
| 5.11 ± 5.20 | [18] | ||||||||
| HPA22 | -0,67 ± 11.08 | -3.14 ± 10.11 | -4.34± 12.69 | -6.14 ± 8.70 | -9.71 ± 10.26 | -8.96 ± 8.71 | 2.50 ± 12.24 | [21] | |
| -13.48 ± 10.48 | -11.52 ± 8.51 | [29] | |||||||
| 8.1 ± 1.1 * | [19] | ||||||||
| -4.30 ± 10.40 | [18] | ||||||||
| LWA2 | 88.23 ± 4.55 | 87.22 ± 4.41 | 87.24 ± 4.50 | 86.63 ± 4.35 | 87.47 ±4.68 | 86.87 ± 4.77 | 87.80 ± 2.05 | [21] | |
| 43.80 ± 44.70 | [20] | ||||||||
| MWA2 | 88.84± 4.54 | 88.64± 4.10 | 87.72 ± 3.76 | 88.04 ± 3.58 | 88.63 ± 4.88 | 89.61 ±5.72 | 89.4 ± 4.45 | [21] | |
| 20.20 ± 0.10 | [20] | ||||||||
| CW1 | 80.33 ± 24.95 | 81.10 ± 26.03 | 73.93 ± 11.39 | 73.77 ± 8.68 | 84.62 ±23.87 | 83.84 ± 24.82 | |||
| FW1 | 83.37 ± 23.04 | 83.65 ± 23.67 | 78.23 ± 11.35 | 78.07 ± 9.40 | 87.39 ± 22.36 | 86.43 ± 23.20 | 63.80 ± 8.40 | 62.20 ± 8.40 | [29] |
| 100 ± 1.30 mm | [19] | ||||||||
| 68.60 ± 0.4 | [20] | ||||||||
| LWL1 | 61.39 ± 17.67 | 62.26 ± 16.53 | 58.38 ± 5.63 | 58.67 ± 6.58 | 62.96 ± 16.37 | 63.20 ±15.50 | 57.60 ± 15.94 | [21] | |
| 54.90 ± 8.10 | 55.80 ± 9.00 | [29] | |||||||
| 72.50 ± 1.10 | [19] | ||||||||
| 49.50 ± 0.40 | [20] | ||||||||
| MWL1 | 59.52 ± 16.87 | 61.02 ± 19.19 | 57.37 ± 6.52 | 56.21 ± 7.65 | 61.76 ± 16.94 | 62.03 ± 15.61 | 60.47 ± 18.07 | [21] | |
| 59.90 ± 9.70 | 57.20 ± 8.50 | [29] | |||||||
| 65.00 ± 1.20 | [19] | ||||||||
| 55.30 ± 0.20 | [20] | ||||||||
| LCH1 | 60.93 ± 17.55 | 61.94 ± 17.12 | 58.02 ± 5.42 | 57.84 ± 6.63 | 62.42 ± 16.22 | 62.36 ± 15.45 | 57.47 ± 15.71 | [21] | |
| MCH1 | 59.56 ± 17.18 | 59.85 ± 18.64 | 57.92 ± 9.05 | 54.91 ± 7.26 | 61.19 ± 16.96 | 61.57 ± 15.25 | 60.27 ± 17.97 | [21] | |
| SST1 | 16.71 ± 6.00 | 16.53 ± 4.61 | 16.29 ± 4.20 | 16.10 ± 3.13 | 17.60 ±5.30 | 17.24 ± 4.99 | |||
| LST1 | 20.36 ± 7.22 | 19.53 ± 5.88 | 19.73 ± 4.53 | 18.88 ± 3.57 | 19.75 ± 5.73 | 19.39 ± 5.59 | 27.73 ± 5.95 | [21] | |
| MST1 | 19.80 ± 6. 12 | 20.02 ± 9.83 | 19.58 ± 4.02 | 21.40 ± 12.19 | 18.23 ± 5.60 | 17.93 ± 4.89 | 27.00 ± 8.70 | [21] | |
1 = in mm, 2 = in °, v = variable, GAMD = group of adult medium sized donkeys, [21] = El-Marakby 2024, [29] = Khan 2024, [19] = Nocera 2020, [20] = El-Shafaey 2017, [18] = Collins 2011, Data for right/left is shown in the specified column. In cases where no specification was made the data is centered between both columns.
Distance Measurements on the LM View
The distance measurements taken on the lateromedial radiograph (DWL, ST, DCH, HL, PCH, FD, SL) already show some differences. Our data suggests that the average dorsal hoof wall length of the hind limb in European donkeys is approximately between 70 and 75 mm (normalized), or approximately 80 mm without correction for artificial magnification. The Egyptian donkeys showed an average dorsal hoof wall length of 68.4 mm, which compared to the data available here was only subject to a significantly smaller variance [31]and thus showed slightly shorter dorsal hoof walls overall compared to the population studied here. In retrospect, the average measurements of the various smaller-framed horse breeds are close to the mean values found here. It is noteworthy that the Icelandic horses had approximately 10 mm longer dorsal hoof walls on the examined left hind hooves, despite their relatively similar stature [38]. In their study, Herbrecht et al. also demonstrated positive correlations between tölt performance and the length of the dorsal hoof wall, so that it can be concluded that dorsal hoof walls are traditionally maintained longer in Icelandic horses during routine hoof trimming, regardless of the critical biomechanical additional load on the hoof postulated by the authors [38]. The data of the front hooves of the different donkey populations are in line with the average values of the dorsal hoof wall length found here. The only exception is the Pakistani draft donkeys studied by Khan et al. [29], which in turn show comparable average values to the Egyptian donkeys of Mostafa et al. [31]. It is remarkable that in these two studies measurements were made based on digitalized photographs, whereas in the other studies they were made derived from X-ray images. This observation may suggest an influence of the respective imaging method on the measurements, but comparative measurement accuracy studies between digitalized photographs and X-ray images show the equality and comparability of both techniques [43]. On the other hand, morphometric studies using photographs and radiographs have found differences in individual variables (e.g., DWA, HA), albeit minor but present [21,44,45]. Consequently, although slight differences can be expected when comparing the measured values of two different imaging methods, the detection of a pathological condition, taking into account influencing factors such as weight or size, should nevertheless be guaranteed based on massive deviations. Due to the proven influences of hoof trimming on morphometric measurements [8,9], this aspect should also be considered when comparing the published data. In Mostafa et al. for example, the donkey hooves were gently rasped for better comparability, but no complete routine hoof trimming was carried out [31], as was the case in this study.
The donkey population studied here has a quite homogeneous average sole thickness of approximately 13 to 15 mm, while ponies tended to have a distance of around 10 mm between the tip of the coffin bone and the sole surface [11]. The sole thickness of the hind hooves of Colombian Paso horses examined by Cardona et al. is similar to the values measured radiologically on the front hooves of donkeys and, at 18.7 mm to 24.3 mm, are considerably higher than the sole thicknesses measured here [39]. In connection with the laminitis-associated radiological changes in the form of lowering and rotation of the coffin bone, which also occur in donkeys [18,37], a reduced sole thickness may also be noticeable on the radiograph. However, the values measured here should not automatically be assumed to indicate laminitis just because they are lower than the data previously published for donkeys, as the classification for thin soles defines values < 10 mm as suspicious and < 5 mm as very thin [46]. Rather, despite the apparently low dependence on external factors and the narrow standard deviation, this value should be understood as individual and should only be considered as a reason to suspect a pathological condition of the hoof if it falls below the critical limit values. It is possible that the time of the last hoof trimming and the individual style of the respective farrier in the various publications contributed to the divergences, as these factors have been shown to have a considerable influence on the measurements on hooves [8,26].
In the present donkey population, average heel lengths between 15 and 18 mm were measured, whereas other comparable literature found significantly longer heels in horses and donkeys with average values approximately twice as large or larger at both front and hind. Due to the sometimes irregular shape of the soft tissue shadow on radiographs, the measurement of heel length is not easy to perform in a standardized manner based on the author’s personal experience, so this is a potential source of measurement inaccuracy. Likewise, as with the individual assessment of each measurement variable, all potential influences should be considered, such as the last hoof trimming for example. Although Kummer et al. [8,26] did not analyze the HL, it cannot be ruled out that the length of the heel is also affected due to the findings that hoof preparation has a considerable influence on the measured conformation. In studies on feral horses, long heels were found in the majority of cases, as well as correlations with the distances traveled and the ground conditions, resulting that environmental factors can also influence this variable [42,47].
The founder distance was first described by Cripps and Eustace in 1999 and validated as a laminitis parameter; from their analyses they concluded that FD on the hind limbs of healthy horses should not be > 7 mm [10]. In 2011, Collins et al. investigated this variable in healthy European donkeys and donkeys with laminitis in a similar way and concluded from the data that a coffin bone sinking is suspected in donkeys from a founder distance > 13 mm [18]. In this studied population of generally sound, lameness-free European donkeys, an average FD of around 16 to 18 mm was measured. The fact that this variable shows significantly larger measured values compared to the horses confirms the known lower position of the coffin bone in the hoof capsule [2,3,14,34,46]. Compared to the other donkey populations studied, the FD of the European donkeys studied here is greater than that determined by Collins et al. [18] for healthy donkey hooves, but smaller than in the donkeys studied from Italy and Egypt [19,20]. A re-evaluation of the critical threshold at which a donkey’s coffin bone sinking can be diagnosed based on the founder distance should therefore be considered based on further investigations. Furthermore, as other authors have already emphasized, the founder distance should be interpreted with caution, as there are indications that it is influenced by factors such as weight and size [11], the load on the limb [26,32], the inadequate adjustment of the central beam [10] and is subject to intra- and inter-individual variations even in a healthy hoof condition [35].
In the donkey populations studied here, an average sole length (SL) of approximately 100 to 110 mm was measured, which shows a wide variation that can be plausibly explained by the strong positive correlation with weight and size that has been proven here as well as for warmbloods [9]. Due to the steeper hoof wall compared to horses [3,12,13,16,34], the sole length is generally shorter in donkeys than in horses. However, Table 7 shows that the average values for Canadian feral horses [42] and Icelandic horses [38] are similar to those presented here. These can be explained by the massive deformation of the hooves in the former case and the steeper hoof wall angles in the latter. In comparison to the examined front hooves of donkeys, the Pakistani and Egyptian working donkey populations show shorter sole and foot lengths of approx. 80 to 90 mm with significantly less spread [20,21,29], while the Amiata donkeys show significantly greater values with an average of approx. 130 mm [19]. Khan et al. were also able to prove significant differences in sole length between the right and left front toe with an average 0.22 cm longer right sole [29], while in a pony population studied, the left hind hooves of 66.7% had 3 mm longer soles on average, which are statistically significant [11]. In the current study, no relevant difference in this parameter between the right and left hind limb can be proven. In addition, conformational deviations in the form of long toes and underrun heels have a reducing influence on sole length [21]. Another factor that decreases sole length is hoof trimming, which shortens the sole length by an average of 5-6 mm in warmbloods [9]. When comparing this variable between different publications it is important to consider discrepancies occurring in the definition of the measuring points of sole length, which is often referred to synonymously as foot length (FL) [35]. The hoof balance can be calculated based on the sole length and the perpendicular from the center of rotation of the coffin joint [35]; this parameter was not examined in the present study.
Angular Measurements on the Lateromedial View
As the average measurements of the hoof wall angle (HWA) and the coffin bone angle (CBA) of 55° to 56° and 56° to 58° respectively, as well as the low measured and calculated coffin bone rotation (CR_m/c = CBA - HWA) of 0.4° to 1.7° show, the values confirm the parallelism of the dorsal hoof wall to the dorsal surface of the coffin bone postulated in both healthy horse and donkey toes [2,18,35], as well as the 5°to 10° steeper dorsal hoof wall in donkeys compared to horses, as described by multiple authors [3,12,13,16,34]. Referring to Table 7, horses have an average hoof angle of around 50° on the hind limb, while donkeys have an angle of between 56° and up to around 60°[18,19,21,24,29,31] in both, hind and front hooves. One study even measured average hoof angles of 70°[20]. A statistically validated comparison with the forelimb is not possible as only the hind hooves were analyzed in this database. However, a comparison of the literature on the front hooves of the donkeys studied does indicate that the hind hooves may be slightly flatter than the front hooves, as has also been shown in studies on horses [10,11,25]. This is contradicted by the fact that Cardona et al. in Paso horses and Mostafa et al. in Egyptian donkeys found no significant differences in the hoof wall angle between the forelimb and hind limb [31,39] as well as by reports of no significant differences between hind and front limbs in donkeys and mules[13]
In the measurement data available here, the plantar angle is around 5 to 6° and is therefore similar to the basic data determined for the hind limbs of various horse breeds. Since, to the author’s knowledge, no reference values have been defined for the donkey and all values available for comparison are also at least 5° or more, a desirable positive plantar angle can be assumed, analogous to the horse. Studies in horses have shown that negative plantar angles are significantly associated with hindlimb lameness and altered posture of the hind limbs [41,48].
Based on the assumption for the horse that the heel angle should correspond to the hoof wall angle and consequently also to the coffin bone angle on the healthy hoof[35], the angles of 52° to 53° measured here show that the heels are not completely parallel to the hoof wall but are slightly flatter. This corresponds to the findings of comparable work on horses and donkeys, both on forelimbs and hind limbs [21,24,25,29,31,45]. In their studies on donkeys with normal hooves and donkeys with conformational deviations in the form of long toes and underrun heels, El-Marakby et al. observed a partial approximation of the heel angle to the hoof angle with the aforementioned conformational deviation [21], as well as demonstrating a positive correlation between the hoof wall angle and the heel angle [23]. Table 7 and Table 8 show that the HA is between 50 and 56° in all donkey populations studied to date and is significantly smaller in horses than in donkeys (36° to 37°) comparable to the hoof wall angle, as expected. Additionally, HA is slightly flatter than the corresponding hoof angle in most of the cases. The only exception are the feral horses from Sable Island, where the heel angle is about 20° greater than the hoof angle [42]. Furthermore, these animals showed long heels in 85% of cases and 100% conformational deviations [42], so that the normal condition of the hooves should not be deduced from this individual case due to influences such as conformational deviations affecting the dorsal hoof wall as well as the effect of the substrate and lack of trimming on hoof growth.
Some authors consider a mildly broken-forward hoof pastern axis to be a normal finding in donkeys [2,3,18] and is similarly observed in the donkey population studied here in the form of the axis deviation in the coffin joint (HPA2) as a negative value of -1° to -6°, as well as in most other data published on donkeys. The considerable variance of this measurement emphasized by Collins et al. [18] is also evident in the standard deviation values presented here and in the literature comparison. Broken toe axes are also found in the hind limbs of horses, where a greater deviation was also measured in the coffin joint than in the proximal interphalangeal joint. Furthermore, a correlation with the correction of a negative plantar angle by hoof trimming and the resulting change in posture was found [41]. Another pathological condition of the equine hoof associated with a broken-forward hoof pastern axis is the clubfoot. As Wacker et al. and Bartmann and Pietta concluded after transferring the criteria used to define a clubfoot for the horse to the donkey, hyperextension in the coffin joint in combination with an obtuse hoof angulation of at least 70° is not to be considered a physiological finding in the donkey either [13,16,17]. This argument is also supported by the findings that the hoof pastern axis in obviously lame donkeys is broken significantly more anteriorly than in lameness-free donkeys [29], and that donkeys more frequently show severe lameness in the hind limbs, where there is also a high prevalence of broken-forward hoof axes in combination with painful reactions on palpation [5]. Although the average of the donkeys examined in this publication suggests that many animals have a hoof pastern axis that is broken forward to a minor degree, there are also individuals that have a physiological, stretched toe axis. Hoof trimming should be based on the toe axis and, if necessary, the heels should be shortened to avoid a toe axis that is broken forward [3,13,34].
Measurements on the Dorsoplantar Projection
Few hind limbs in equids have generally been analyzed morphometrically and even fewer conformational studies of the hind hooves have been carried out on X-ray images in the dorsoplantar projection. The literature comparison will therefore mainly deal with the analogously determined measured values on the front hooves of donkeys.
Regarding the rather steeper and cubic appearance of the donkey hoof [2,3] compared to the horse hoof, the lateral and medial hoof wall angles (L/MWA) are expected to approach a right angle, as is a slight divergence of the coronet width (CW) compared to the foot width (FW). Respectively, the values measured in this population completely fulfill the expectations with average LWA and MWA between 87° and 88°, CW of 73 mm to 80 mm and FW of 77 mm to 83 mm length. El-Marakby et al. found almost identical lateral and medial hoof wall angles in the donkey population they studied, while significantly more acute angles were measured in El-Shafaey et al. [20,21]. Due to the conspicuous frequency of outlier values in this publication compared to other sources with consistent results, it can be assumed that the lateral hoof wall angles on the healthy donkey toe should be between 80 and 90°. The causes of which can only be speculated by influences such as previous shoeing and lack of previous hoof trimming for example. When comparing the FW to examined horse hind hooves, there is a difference of about 20 to 30 mm, which suggests the more trapezoidal appearance of horse hooves compared to donkeys but cannot be proven without a corresponding measured width of the coronet band.
The lateral hoof wall length (LWL) was measured here at an average of 58 mm to 62 mm, the MWL at 57 mm to 61 mm; no relevant differences were found between medial and lateral, or between left and right. The donkey populations studied by El-Marakby et al. and Wacker et al. showed comparable values [21,24], while Nocera et al. [19]measured slightly longer wall distances and El-Shafaey et al. [20] shorter wall distances. Except for Nocera et al. [19], the donkey hooves analyzed in the literature show an MWL that is on average a few millimeters longer. This observation was also made in ponies and warmbloods, although the differences between lateral and medial hoof wall length and coronet band height were only significant in the right forelimb of the pony population studied [9,11]. Overall, significant differences between lateral and medial measurements on the DP radiograph were rarely tested explicitly, thus, no reliable statement can be made on this issue. Based on the small differences in the data, however, the influence can be considered negligible and minor asymmetries can be considered normal, provided they do not show extreme divergences that are relevant in the overall context in connection with a clinically occurring problem.
The measured lateral and medial coronet band height corresponds with the values provided for comparison at average dimensions of 57 to 61 mm and is almost identical to the variables LWL and MWL according to the angular orthogonal approximation of the lateral hoof walls [21].
As can be expected from the silhouette of the coffin bone, assuming a lateromedially balanced orientation in the hoof capsule, the lateral and medial sole thickness (LST, MST) show almost identical measured values of approximately 20 mm on average, while the sagittally measured sole is slightly thinner at 16 mm on average. Based on comparable results in another donkey population, while significantly shorter MST compared to LST were found in a pony population studied, it can be assumed that hoof-healthy donkeys tend to have a horizontally balanced orientation of the coffin bone and a strongly developed sole [11,21].
In the examined population of generally sound, lameness-free domesticated European donkeys, 10 cases of a coffin bone rotation (CR) more than 5° and 27 cases with a founder distance (FD) measured more than 20 mm on the hind limbs (right and left pooled) were detected. Minor deviations from the norm, which has not been sufficiently defined for the hind hooves of donkeys, do not automatically indicate a pathology like laminitis for example. Such a condition should nevertheless be suspected and serve as a reason for the examiner to be able to better narrow down the probability of the presence of a disease with the help of a multi-parametric approach [18,36] in combination with the clinical examination. An important part of the clinical examination is the adspection, which is problematic in donkeys, as the detection of painful conditions is often unsuccessful due to their stoic nature, or only successful in advanced pathological conditions [13]. In Great Britain, the prevalence of laminitis is reported to be around 13% of donkeys euthanized in one year [2]. Consequently, although no lameness in walk could be detected and general soundness, defined as showing physiological posture, behavior, nutritional and training condition, plus absent signs of an infectious disease and abnormal deviations in vital parameters [49,50], was confirmed, a pathological condition within the hoof cannot be excluded. It must therefore be considered that the inclusion of unrecognized donkeys suffering from chronic laminitis [3] in the study cannot be ruled out when evaluating the available measurement data. Collins et al. and Wacker et al. also came to similar conclusions [17,18,24]. In future studies and in everyday life, pain scores specially developed and successfully tested for donkeys can significantly simplify the detection of painful conditions for owners as well as for the treating veterinarians and farriers. It should be noted that although the EQUUS-DONKEY-COMPASS is better suited for the detection of orthopedic problems, painful conditions in the head area are better detected by the EQUUS_DONKEY-FAP. However, both systems were evaluated for acute pain of different localization and genesis, so the benefit of using them for chronic conditions is unclear [51].
Limitations
This study was mainly limited, despite the solid number of subjects, by a statistically relatively small sample size and the great presence of variation in the phenotype of the donkeys studied. Furthermore, measurement inaccuracies cannot be ruled out, as the interobserver agreement was not statistically analyzed. However, since the measurements were performed exclusively by two trained examiners, this influence is nevertheless considered to be low. In addition, mean values formed from repeated measurements would have increased the validity of the data. Kummer et al. used a software program in their study to evaluate a standardized X-ray procedure on the horse’s hoof and thus achieved excellent repeatability and low variance in the values determined [26]Due to the frequent similarity of the measured values in the literature comparison and the frequently low standard deviation of the average measured values, it can nevertheless be assumed that the measurements tend to exhibit minor inaccuracies. Although a standardized procedure analogous to Kummer et al. [26] was used, minor projection-related inaccuracies in the measurements are also to be expected, but these cannot be avoided while dealing with living non-sedated animals - especially donkeys. The measurements are also subject to the fundamental influence of the temporal relationship to the last hoof trimming and the influence of the farrier’s individual working method [8,9]. The trimming-associated error sources were reduced to a minimum in this case thanks to the clinic’s team of farriers, who are all trained equally and work according to the same method. Adding the senile age category to the juvenile and adult groups could provide better information on the possible correlation between the measured parameters and age. To calculate the influence of size, individual measured height at the withers would be more precise instead of the rough classification into size classes. In addition, a graduation based on the body condition score as a supplement to the weight allows a differentiation between a weight corresponding to the respective breed standard and an overweight animal. This differentiation can be used to gain further insights into the respective influence on the morphometric parameters, although all of the donkeys included in this study had a body condition score between two and four [52].
5. Conclusions
This study is the first to provide basic data on the radiographic normal conformation of the distal hindlimb in generally sound, lameness-free donkeys in two projections. The dorsal hoof wall has an absolute length of approximately 70 to 80 mm and an angulation of 55° on the lateromedial projection; the coffin bone is approximately parallel to the hoof wall. The average founder distance is about 17 mm, the sole is on average 14 mm thick. The heel angle averages 52°, which is somewhat flatter than the hoof wall angle. A broken-forward hoof pastern axis is often observed, but this can only be considered physiological if it is mild. A positive plantar angle is assumed to be desirable. In the dorsoplantar projection, the measurements are characterized by the cubic appearance of the hoof. The sole is very prominent with an average of 16 mm (SST) and 20 mm (LST, MST). The absolute measured values show strong, significant correlations with the normalized values, so that the use of the absolute measured values is justifiable for reasons of practicability. Except for heel length and plantar coronet height, there are no relevant differences between the right and left hind limbs. No relevant correlations between the investigated variables and age can be demonstrated. In almost all cases, a positive correlation between the parameters and weight can be determined, with stronger dependencies in the length measurements. In the future, further studies of this type with larger sample numbers and evenly distributed groups regarding age, breed, height at the withers and weight or BCS are required to determine and validate the factors influencing the measured values and the measurements per se more accurately.
Author Contributions
Conceptualization, C.P.B. and M.R.; methodology, C.P.B. and K.S. and J.W.; formal analysis, K.B.; investigation, C.P.B. and A.J. and K.S. and J.W.; resources, A.J. and M.R.; writing—original draft preparation, K.S.; writing—review and editing, C.P.B. and K.S.; supervision, C.P.B. and M.R.; project administration, C.P.B. and K.S. and J.W. All authors have read and agreed to the published version of the manuscript.
Funding
This research received no external funding.
Institutional Review Board Statement
Ethical review and approval were waived for this study due to the indication of optimizing routine hoof treatment. The study was approved by the doctoral office of the Department of Veterinary Medicine at Justus Liebig University Giessen.
Informed Consent Statement
Informed consent was obtained from all subjects involved in the study.
Data Availability Statement
The raw data supporting the conclusions of this article will be made available by the authors on request.
Acknowledgments
The authors would like to express their warmest thanks to our farriers, most notably J. Palancares, K. Wörtge and M. Striebinger, for their great effort. We would also like to acknowledge Opel-Zoo, Tiergarten Nürnberg, Zoo Heidelberg, the German Donkey Breeding Association (Deutscher Zuchtverband für Esel e.V.) and all other private owners who entrusted us with their animals. My very personal thanks go to A.T. Hoglund, S.Z. Butron Jr. and S. Kühn for their great linguistic and technical advice, as well as to all my other friends and my family for their priceless time, patience and support.
Conflicts of Interest
The authors declare no conflicts of interest.
Appendix A
Table A1.
Normalized vs. absolute measurements in the total population.
| variable | n | correlation with N (rs) | p | systematic difference | proportional difference | linear correlation | p (CUSUM) |
|---|---|---|---|---|---|---|---|
| DWL | 53 | +++ (0.96) | <0.0001 | x | x | ✓ | 0.92 |
| ST | 52 | +++ (0.98) | <0.0001 | x | x | ✓ | 0.92 |
| DCH | 52 | +++ (0.97) | <0.0001 | x | x | ✓ | 0.49 |
| HL | 49 | +++ (0.99) | <0.0001 | x | x | ✓ | 0.68 |
| PCH | 49 | +++ (0.99) | <0.0001 | x | x | ✓ | 0.89 |
| FD | 53 | +++ (0.99) | <0.0001 | x | x | ✓ | 0.92 |
n = sample size, N = normalized data, rs = Spearman rank correlation coefficient, +++ = very strong correlation, x = no, ✓ = yes.
Table A2.
Normalized vs. absolute measurements in GAMD.
| variable | n | correlation with N (rs) | p | systematic difference | proportional difference | linear correlation | p (CUSUM) |
|---|---|---|---|---|---|---|---|
| DWL | 32 | +++ (0.93) | <0.0001 | x | x | ✓ | 0.94 |
| ST | 31 | +++ (0.98) | <0.0001 | x | x | ✓ | 0.93 |
| DCH | 31 | +++ (0.96) | <0.0001 | x | x | ✓ | 0.93 |
| HL | 31 | +++ (0.99) | <0.0001 | x | x | ✓ | 0.18 |
| PCH | 31 | +++ (0.99) | <0.0001 | x | x | ✓ | 0.95 |
| FD | 32 | +++ (0.96) | <0.0001 | x | x | ✓ | 0.99 |
n = sample size, N = normalized data, rs = Spearman rank correlation coefficient, +++ = very strong correlation, x = no, ✓ = yes, GAMD = group of adult medium-sized donkeys.
Table A3.
Absolute measurements right/left hindlimb, lateromedial 90°, total population.
| v | side | n | n miss | Mean | Std Dev | Min | Max | Median | LCL 95% for Mean | UCL 95% for mean | ||
|---|---|---|---|---|---|---|---|---|---|---|---|---|
| lm 90° | l | DWL | R | 40 | 6 | 83.93 | 21.51 | 59.41 | 169.21 | 77.27 | 77.05 | 90.81 |
| L | 40 | 6 | 83.56 | 20.63 | 60.82 | 158.96 | 77.80 | 76.96 | 90.16 | |||
| ST | R | 39 | 7 | 15.57 | 4.30 | 7.68 | 28.22 | 15.13 | 14.17 | 16.96 | ||
| L | 38 | 7 | 15.16 | 4.09 | 7.70 | 24.71 | 14.44 | 13.84 | 16.49 | |||
| DCH | R | 39 | 7 | 70.80 | 18.65 | 47.30 | 144.42 | 65.80 | 64.76 | 76.85 | ||
| L | 39 | 7 | 70.04 | 18.45 | 44.06 | 140.96 | 64.62 | 64.05 | 76.02 | |||
| HL | R | 36 | 10 | 17.96 | 5.72 | 8.46 | 30.31 | 17.22 | 16.03 | 19.90 | ||
| L | 38 | 8 | 16.05 | 4.07 | 9.26 | 24.59 | 16.43 | 14.72 | 17.39 | |||
| PCH | R | 36 | 10 | 14.38 | 4.87 | 5.57 | 24.40 | 12.91 | 12.73 | 16.02 | ||
| L | 38 | 8 | 12.96 | 3.61 | 7.69 | 19.57 | 13.08 | 11.78 | 14.15 | |||
| FD | R | 40 | 6 | 18.77 | 7.31 | 3.77 | 44.64 | 17.53 | 16.43 | 21.10 | ||
| L | 40 | 6 | 18.02 | 7.73 | 2.87 | 46.13 | 17.17 | 15.55 | 20.49 | |||
| SL | R | 40 | 6 | 114.36 | 32.20 | 80.98 | 254.43 | 103.75 | 104.06 | 124.66 | ||
| L | 40 | 6 | 117.47 | 30.85 | 80.66 | 235.41 | 106.18 | 107.60 | 127.33 | |||
| a | HWA | R | 40 | 6 | 55,72 | 4.31 | 46.95 | 69.65 | 55.34 | 54.34 | 57.10 | |
| L | 40 | 6 | 55.39 | 4.19 | 45.47 | 64.76 | 55.43 | 54.04 | 56.73 | |||
| CBA | R | 40 | 6 | 56.67 | 4.70 | 47.24 | 66.78 | 57.16 | 55.16 | 58.17 | ||
| L | 40 | 6 | 55.80 | 4.43 | 45.71 | 65.68 | 54.88 | 54.39 | 57.22 | |||
| CR-c | R | 40 | 6 | 0.95 | 3.29 | -7.15 | 7.84 | 0.43 | -0.10 | 2.00 | ||
| L | 40 | 6 | 0.42 | 3.01 | -5.09 | 6.45 | 0.55 | -0.54 | 1.38 | |||
| CR-m | R | 40 | 6 | 1.26 | 3.27 | -6.13 | 10.52 | 1.16 | 0.22 | 2.31 | ||
| L | 40 | 6 | 1.32 | 2.92 | -4.26 | 7.89 | 1.17 | 0.39 | 2.25 | |||
| PA | R | 40 | 6 | 6.21 | 4.02 | -5.15 | 13.76 | 6.17 | 4.92 | 7.49 | ||
| L | 40 | 6 | 5.24 | 4.09 | -4.38 | 14.65 | 4.96 | 3.93 | 6.55 | |||
| HA | R | 40 | 6 | 52.81 | 5.81 | 35.10 | 61.68 | 52.73 | 50.32 | 54.04 | ||
| L | 40 | 6 | 53.01 | 6.04 | 40.03 | 68.76 | 53.28 | 51.08 | 54.94 | |||
| HPA1 | R | 40 | 6 | 5.4 | 8.82 | -17.98 | 23.99 | 6.00 | 2.58 | 8.22 | ||
| L | 40 | 6 | 4.34 | 9.47 | -26.50 | 18.33 | 6-98 | 1.31 | 7.37 | |||
| HPA2 | R | 40 | 6 | -0,67 | 11.08 | -38.50 | 18.75 | -0,58 | -4.21 | 2.88 | ||
| L | 40 | 6 | -3.14 | 10.11 | -23.92 | 15.80 | -2.54 | -6.37 | 0.10 |
l = length in mm, a = angle in °, v = variable, n = sample size, n miss = missing samples, Std Dev = standard deviation, LCL = lower confidence interval limit, UCL = upper confidence interval limit.
Table A4.
Absolute measurements right/left hindlimb, lateromedial 90°, GAMD.
| v | Side | n | n miss | Mean | Std Dev | Min | Max | Median | LCL 95% for Mean | UCL 95% for mean | ||
|---|---|---|---|---|---|---|---|---|---|---|---|---|
| lm (90°) | l | DWL | R | 21 | 3 | 79.25 | 10.00 | 61.51 | 107.65 | 77.40 | 74.70 | 83.80 |
| L | 21 | 3 | 77.82 | 7.67 | 61.94 | 94.63 | 75.86 | 74.33 | 81.31 | |||
| ST | R | 20 | 4 | 15.78 | 3.60 | 10.08 | 23.95 | 14.60 | 14.09 | 17.46 | ||
| L | 20 | 4 | 14.12 | 3.23 | 7.70 | 20.87 | 13.88 | 12.61 | 15.63 | |||
| DCH | R | 20 | 4 | 67.90 | 9.59 | 51.34 | 92.86 | 66.57 | 63.41 | 72.39 | ||
| L | 20 | 4 | 65.99 | 8.24 | 53.25 | 82.67 | 64.68 | 62.14 | 69.85 | |||
| HL | R | 20 | 4 | 18.39 | 6.04 | 9.79 | 29.73 | 19.07 | 15.56 | 21.22 | ||
| L | 21 | 3 | 15.58 | 4.06 | 10.10 | 23.96 | 14.58 | 13.73 | 17.42 | |||
| PCH | R | 20 | 4 | 14.41 | 5.19 | 7.70 | 24.40 | 15.31 | 11.99 | 16.84 | ||
| L | 21 | 3 | 12.32 | 3.81 | 7.69 | 19.57 | 11.48 | 10.58 | 14.05 | |||
| FD | R | 21 | 3 | 17.46 | 3.73 | 10.16 | 27.30 | 16.75 | 15.76 | 19.16 | ||
| L | 21 | 3 | 17.19 | 3.65 | 10.41 | 24.11 | 16.70 | 15.53 | 18.85 | |||
| SL | R | 21 | 3 | 106.36 | 14.33 | 88.62 | 140.32 | 101.92 | 99.83 | 112.88 | ||
| L | 21 | 3 | 108.38 | 13.43 | 86.43 | 133.48 | 105.58 | 102.27 | 114.49 | |||
| a | HWA | R | 21 | 3 | 56.77 | 4.82 | 46.95 | 69.65 | 56.81 | 54.58 | 58.97 | |
| L | 21 | 3 | 56.46 | 3.68 | 51.12 | 64.51 | 56.41 | 54.79 | 58.13 | |||
| CBA | R | 21 | 3 | 58.15 | 4.62 | 50.32 | 66.78 | 58.05 | 56.05 | 60.26 | ||
| L | 21 | 3 | 56.95 | 4.13 | 52.13 | 65.68 | 55.83 | 55.07 | 58.83 | |||
| CR_c | R | 21 | 3 | 1.38 | 3.58 | -4.83 | 7.84 | 0.77 | -0.25 | 3.01 | ||
| L | 21 | 3 | 0.49 | 2.90 | -3.74 | 6.45 | 0.46 | -0.83 | 1.81 | |||
| CR_m | R | 21 | 3 | 1.70 | 3.39 | -6.13 | 10.52 | 0.94 | 0.16 | 3.24 | ||
| L | 21 | 3 | 0.87 | 3.01 | -4.26 | 7.89 | 1.16 | -0.50 | 2.24 | |||
| PA | R | 21 | 3 | 6.80 | 3.00 | 1.16 | 11.62 | 7.03 | 5.44 | 8.17 | ||
| L | 21 | 3 | 5.64 | 3.80 | 0.93 | 14.65 | 5.51 | 3.91 | 7.37 | |||
| HA | R | 21 | 3 | 52.17 | 5.89 | 35.10 | 61.68 | 52.17 | 49.49 | 54.86 | ||
| L | 21 | 3 | 52.27 | 6.95 | 40.03 | 68.76 | 52.61 | 49.10 | 55.43 | |||
| HPA1 | R | 21 | 3 | 3.62 | 8.84 | -17.98 | 16.89 | 4.20 | -0.40 | 7.65 | ||
| L | 21 | 3 | 2.04 | 10.48 | -26.50 | 14.93 | 5.60 | -2.73 | 6.81 | |||
| HPA2 | R | 21 | 3 | -4.34 | 12.69 | -38.50 | 17.67 | -2.71 | -10.12 | 1.43 | ||
| L | 21 | 3 | -6.14 | 8.70 | -22.56 | 8.09 | -5.34 | -10.10 | -2.18 |
4 l = length in mm, a = angle in °, v = variable, n = sample size, n miss = missing samples, Std Dev = standard deviation, LCL = lower confidence interval limit, UCL = upper confidence interval limit, GAMD = group of adult medium sized donkey.
Table A5.
Absolute measurements right/left hindlimb, dorsoplantar (0°), total population.
| v | side | n | n miss | Mean | Std Dev | Min | Max | Median | LCL 95% for Mean | UCL 95% for mean | ||
|---|---|---|---|---|---|---|---|---|---|---|---|---|
| dp 0° | a | LWA | R | 37 | 9 | 88.23 | 4.55 | 77.70 | 100.66 | 87.57 | 86.71 | 89.75 |
| L | 35 | 11 | 87.22 | 4.41 | 80.02 | 97.74 | 86.45 | 85.71 | 88.74 | |||
| MWA | R | 37 | 9 | 88.84 | 4.54 | 79.90 | 99.59 | 88.21 | 87.32 | 90.35 | ||
| L | 35 | 11 | 88.64 | 4.10 | 80.43 | 96.96 | 88.48 | 87.23 | 90.04 | |||
| l | CW | R | 37 | 9 | 80.33 | 24.95 | 53.63 | 182.56 | 72.05 | 72.01 | 88.64 | |
| L | 35 | 11 | 81.10 | 26.03 | 55.07 | 192.18 | 74.31 | 72.16 | 90.04 | |||
| FW | R | 37 | 9 | 83.37 | 23.04 | 56.25 | 160.31 | 77.48 | 75.69 | 91.05 | ||
| L | 35 | 11 | 83.65 | 23.67 | 56.29 | 176.04 | 76.94 | 75.52 | 91.78 | |||
| LWL | R | 37 | 9 | 61.39 | 17.67 | 34.22 | 132.59 | 57.81 | 55.50 | 67.29 | ||
| L | 35 | 11 | 62.26 | 16.53 | 39.17 | 130.21 | 59.08 | 56.58 | 67.94 | |||
| MWL | R | 37 | 9 | 59.52 | 16.87 | 37.17 | 118.69 | 56.56 | 53.89 | 65.14 | ||
| L | 35 | 11 | 61.02 | 19.19 | 34.26 | 139.66 | 57.81 | 54.43 | 67.61 | |||
| LCH | R | 37 | 9 | 60.93 | 17.55 | 32.02 | 130.80 | 57.81 | 55.08 | 66.78 | ||
| L | 35 | 11 | 61.94 | 17.12 | 38.27 | 129.42 | 58.86 | 56.05 | 67.82 | |||
| MCH | R | 37 | 9 | 59.56 | 17.18 | 36.57 | 117.29 | 56.46 | 53.83 | 65.29 | ||
| L | 35 | 11 | 59.85 | 18.64 | 33.77 | 138.95 | 57.30 | 53.45 | 66.26 | |||
| SST | R | 37 | 9 | 16.71 | 6.00 | 7.95 | 34.61 | 15.51 | 14.71 | 18.71 | ||
| L | 34 | 12 | 16.53 | 4.61 | 9.01 | 27.93 | 15.25 | 14.93 | 18.14 | |||
| LST | R | 37 | 9 | 20.36 | 7.22 | 11.94 | 42.96 | 19.36 | 17.96 | 22.77 | ||
| L | 34 | 12 | 19.53 | 5.88 | 10.54 | 38.83 | 18.65 | 17.48 | 21.58 | |||
| MST | R | 37 | 9 | 19.80 | 6.12 | 9.55 | 35.61 | 18.83 | 17.76 | 21.84 | ||
| L | 34 | 12 | 20.02 | 9.83 | 9.84 | 65.85 | 18.46 | 16.59 | 23.45 |
4 l = length in mm, a = angle in °, v = variable, n = sample size, n miss = missing samples, Std Dev = standard deviation, LCL = lower confidence interval limit, UCL = upper confidence interval limit.
Table A6.
Absolute measurements right/left hindlimb,dorsoplantar (0°), GAMD.
| v | Side | N | N miss | Mean | Std Dev | Min | Max | Median | LCL 95% for Mean | UCL 95% for mean | ||
|---|---|---|---|---|---|---|---|---|---|---|---|---|
| dp (0°) | a | LWA | R | 19 | 5 | 87.24 | 4.50 | 77.70 | 100.66 | 87.21 | 85.07 | 89.41 |
| L | 17 | 7 | 86.63 | 4.35 | 81.28 | 97.74 | 86.33 | 84.39 | 88.87 | |||
| MWA | R | 19 | 5 | 87.72 | 3.76 | 82.42 | 95.44 | 87.23 | 85.90 | 89.53 | ||
| L | 17 | 7 | 88.04 | 3.58 | 83.37 | 96.31 | 87.37 | 86.20 | 89.88 | |||
| l | CW | R | 19 | 5 | 73.93 | 11.39 | 53.63 | 104.36 | 72.05 | 68.44 | 79.42 | |
| L | 17 | 7 | 73.77 | 8.68 | 55.07 | 90.19 | 74.31 | 69.31 | 78.23 | |||
| FW | R | 19 | 5 | 78.23 | 11.35 | 57.22 | 105.58 | 77.48 | 72.76 | 83.70 | ||
| L | 17 | 7 | 78.07 | 9.40 | 59.65 | 95.92 | 76.94 | 73.24 | 82.91 | |||
| LWL | R | 19 | 5 | 58.38 | 5.63 | 45.07 | 68.55 | 57.81 | 55.67 | 61.10 | ||
| L | 17 | 7 | 58.67 | 6.58 | 39.17 | 67.00 | 59.21 | 55.28 | 62.05 | |||
| MWL | R | 19 | 5 | 57.37 | 6.52 | 42.99 | 67.93 | 57.30 | 54.23 | 60.51 | ||
| L | 17 | 7 | 56.21 | 7.65 | 34.26 | 66.34 | 57.11 | 52.27 | 60.14 | |||
| LCH | R | 19 | 5 | 58.02 | 5.42 | 44.70 | 67.79 | 57.81 | 55.41 | 60.64 | ||
| L | 17 | 7 | 57.84 | 6.63 | 38.27 | 65.72 | 59.16 | 54.43 | 61.25 | |||
| MCH | R | 19 | 5 | 57.92 | 9.05 | 42.67 | 85.85 | 56.76 | 53.56 | 62.29 | ||
| L | 17 | 7 | 54.91 | 7.26 | 33.77 | 65.85 | 55.93 | 51.17 | 58.64 | |||
| SST | R | 19 | 5 | 16.29 | 4.20 | 10.97 | 25.49 | 15.23 | 14.27 | 18.31 | ||
| L | 16 | 8 | 16.10 | 3.13 | 11.39 | 22.71 | 15.25 | 14.43 | 17.77 | |||
| LST | R | 19 | 5 | 19.73 | 4.53 | 13.44 | 30.08 | 19.61 | 17.55 | 21.92 | ||
| L | 16 | 8 | 18.88 | 3.57 | 12.73 | 26.89 | 18.65 | 16.97 | 20.78 | |||
| MST | R | 19 | 5 | 19.58 | 4.02 | 15.13 | 29.09 | 18.65 | 17.64 | 21.51 | ||
| L | 18 | 8 | 21.40 | 12.19 | 13.27 | 65.85 | 19.04 | 14.90 | 27.90 |
4 l = length in mm, a = angle in °, v = variable, N = sample size, N miss = missing samples, Std Dev = standard deviation, LCL = lower confidence interval limit, UCL = upper confidence interval limit, GAMD = group of adult medium sized donkeys.
References
- Dai, F.; Segati, G.; Brscic, M.; Chincarini, M.; Costa, E.D.; Ferrari, L.; Burden, F.; Judge, A.; Minero, M. Effects of Management Practices on the Welfare of Dairy Donkeys and Risk Factors Associated with Signs of Hoof Neglect. J. Dairy Res. 2018, 85, 30–38. [Google Scholar] [CrossRef]
- Thiemann, A.; Rickards, K. Donkey Hoof Disorders and Their Treatment. In Pract. 2013, 35, 134–140. [Google Scholar] [CrossRef]
- The Foot. In The clinical companion of the donkey, 2nd ed.; Evans, L., Crane, M., Preston, E., Eds.; The Donkey Sanctuary, Sidmouth, UK, 2021; pp. 131–146 ISBN 978-1-3999-0893-1.
- Morrow, L.D.; Smith, K.C.; Piercy, R.J.; du Toit, N.; Burden, F.A.; Olmos, G.; Gregory, N.G.; Verheyen, K.L.P. Retrospective Analysis of Post-Mortem Findings in 1,444 Aged Donkeys. J. Comp. Pathol. 2011, 144, 145–156. [Google Scholar] [CrossRef] [PubMed]
- Reix Nèe Broster, C.E.; Burn, C.C.; Pritchard, J.C.; Barr, A.R.S.; Whay, H.R. The Range and Prevalence of Clinical Signs and Conformation Associated with Lameness in Working Draught Donkeys in Pakistan. Equine Vet. J. 2014, 46, 771–777. [Google Scholar] [CrossRef] [PubMed]
- Hassanpour, A.; Dehghani, S.N. Hoof Morphometry before and after Trimming in Donkeys. Res. Opin. Anim. Vet. Sci. 2012, 2(6), 381–383. [Google Scholar]
- O’Grady, S.E. Basic Farriery for the Performance Horse. Vet. Clin. North Am. Equine Pract. 2008, 24, 203–218. [Google Scholar] [CrossRef] [PubMed]
- Kummer, M.; Gygax, D.; Lischer, C.; Auer, J. Comparison of the Trimming Procedure of Six Different Farriers by Quantitative Evaluation of Hoof Radiographs. Vet. J. 2009, 179, 401–406. [Google Scholar] [CrossRef]
- Kummer, M.; Geyer, H.; Imboden, I.; Auer, J.; Lischer, C. The Effect of Hoof Trimming on Radiographic Measurements of the Front Feet of Normal Warmblood Horses. Vet. J. 2006, 172, 58–66. [Google Scholar] [CrossRef]
- Cripps, P.J.; Eustace, R.A. Radiological Measurements from the Feet of Normal Horses with Relevance to Laminitis. Equine Vet. J. 1999, 31, 427–432. [Google Scholar] [CrossRef] [PubMed]
- Thieme, K.; Ehrle, A.; Lischer, C. Radiographic Measurements of the Hooves of Normal Ponies. Vet. J. 2015, 206, 332–337. [Google Scholar] [CrossRef]
- Vilsmeier, A. Untersuchungen zur Hufform und zum Hornwachstum beim Esel (Equus asinus), Inaugural Dissertation, Veterinärmedizinische Fakultät der Universität Leipzig, Leipzig, Germany, 14/09/2004.
- Bartmann, C.P.; Pietta, D. Hufpflege und Hufbeschlag bei Esel und Maultier. In Der Huf. Lehrbuch des Hufbe- schlags, 3rd ed.; Litzke, L.F., Ed.; Georg-Thieme-Verlag, Stuttgart, Germany, 2020; pp. 358–365.
- Burden F, T.A. Donkeys Are Different. J. Equine Vet. Sci. 2015, 35(5), 376–382. [Google Scholar] [CrossRef]
- Burnham, S. Anatomical Differences of the Donkey and Mule. Proc. Am. Ass. Equine Practnrs 2002, 48. [Google Scholar]
- Kapitel 6 Gliedmaßen. In Unterschiede in der Anatomie von Esel/Muli und Pferd, 2nd ed.; Wissdorf, H., Jerbi, H., Fürst, A., Eds.; utzverlag GmbH, München, Germany, 2024, pp. 98 – 144.
- Wacker, J.; Schaus, K.; Büttner, K.; Röcken, M.; Bartmann, C.P. Incidence of Radiological Changes of the Coffin Bone in Donkeys in Consideration of the Age. Pferdeheilkunde 2024, 40, 375–386. [Google Scholar]
- Collins, S.N.; Dyson, S.J.; Murray, R.C.; Burden, F.; Trawford, A. Radiological Anatomy of the Donkey’s Foot: Objective Characterisation of the Normal and Laminitic Donkey Foot. Equine Vet. J. 2011, 43, 478–486. [Google Scholar] [CrossRef]
- Nocera, I.; Aliboni, B.; Puccinelli, C.; Pietrini, G.; Sgorbini, M.; Citi, S.; Ricardi, G. Radiographic Parameters of the Digit in a Cohort Population of Amiata Donkeys. Open Vet. J. 2020, 10, 354–362. [Google Scholar] [CrossRef] [PubMed]
- El-Shafaey, E.A.; Salem, M.G.; Mosbah, E.; Zaghloul, A.E. Morphometric Evaluation of Relevant Radiographic Parameters of the Forefeet of Clinically Normal Donkeys (Equus Asinus). J. Hell. Vet. Med. Soc. 2017, 68, 467–478. [Google Scholar] [CrossRef]
- El-Marakby, A.I.; Abdelgalil, A.I.; Metwally, A.A.; Mostafa, M.B.; Soliman, A.S. Photometric and Radiometric Hoof Capsule Evaluation in Normal and Long Toeunderrun Heel in Donkeys. J. Hell. Vet. Med. Soc. 2024, 75, 1–9. [Google Scholar]
- El-Marakby, A.I.; Mostafa, M.B.; Metwally, A.A.; Soliman, A.S.; Abdelgalil, A.I. Distal Phalanx Radiographic Grading Features in Long-Toe, Underrun Heel in Egypt Baladi Donkeys (Equus Asinus). Equine Vet. Educ. 2024. [Google Scholar] [CrossRef]
- El-Marakby, A.; Abdelgalil, A.; Mostafa, M.; Soliman, A. Relationships between the Shape of the Hoof Capsule and Orientation of the Distal Phalanx in Long Toe Underrun Heels in Donkeys. Equine Vet. Educ. 2023, 35, 321–326. [Google Scholar] [CrossRef]
- Wacker, J.; Schaus, K.; Jandowsky, A.; Büttner, K.; Röcken, M.; Bartmann, C.P. Radiographic Measurements of the Hoof in Generally Sound Donkeys with Emphasis on the Front Limbs. Front. Vet. Sci. (submitted).
- Kalka, K.; Pollard, D.; Dyson, S.J. An Investigation of the Shape of the Hoof Capsule in Hindlimbs, Its Relationship with the Orientation of the Distal Phalanx and Comparison with Forelimb Hoof Capsule Conformation. Equine Vet. Educ. 2021, 33, 422–429. [Google Scholar] [CrossRef]
- Kummer, M.; Lischer, C.; Ohlerth, S.; Vargas, J.; Auer, J. Evaluation of a Standardised Radiographic Technique of the Equine Hoof. Schweiz Arch. Tierheilkd. 2004, 146, 507–514. [Google Scholar] [CrossRef]
- Kapitel 1 Rassen, Größen, Gewichtsermittlung, Altersschätzung Und Verhalten. In Unterschiede in der Anatomie von Esel/Muli und Pferd, 2nd ed.; Wissdorf, H., Jerbi, H., Fürst, A., Eds.; utzverlag GmbH: München, Germany, 2024; pp. 21–32 ISBN 978-3-8316-4937-2.
- Kotoyori, Y.; Endo, Y.; Murase, H.; Sato, F.; Korosue, K. Changes in Aspects of Hoof and Distal Limb Conformation in Foals by Radiographic Evaluation. J. Vet. Medical Sci. 2024, 86, 421–427. [Google Scholar] [CrossRef]
- Khan, R.Z.U.; Rosanowski, S.M.; Parkes, R.S.V. Hoof Morphometry in a Population of Lame and Nonlame Working Donkeys in Pakistan. Equine Vet. J. 2023, 55, 435–445. [Google Scholar] [CrossRef]
- Leśniak, K.; Whittington, L.; Mapletoft, S.; Mitchell, J.; Hancox, K.; Draper, S.; Williams, J. The Influence of Body Mass and Height on Equine Hoof Conformation and Symmetry. J. Equine Vet. Sci. 2019, 77, 43–49. [Google Scholar] [CrossRef]
- Mostafa, M.B.; Abdelgalil, A.I.; Farhat, S.F.; Raw, Z.; Kubasiewicz, L.M. Morphometric Measurements of the Feet of Working Donkeys Equus Asinus in Egypt. J. Equine Sci. 2020, 31, 17–22. [Google Scholar] [CrossRef]
- Sefton, A.; Haseler, C.J.; Jarvis, G.E.; Scott, V.H.L.; Mcgovern, K.F. Laminitis in Donkeys: A Pilot Study Investigating Radiographic versus Post-Mortem Measurements. Equine Vet. J. 2019, 51. [Google Scholar] [CrossRef]
- Misk, N.A.; Hifny, A. Anatomy of the Hoof in Donkeys. Assiut Vet. Med. J. 1983, 10. [Google Scholar]
- Thiemann, A.K.; Poore, L.A. Hoof Disorders and Farriery in the Donkey. Vet. Clin. North Am. Equine Prac. 2019, 35, 643–658. [Google Scholar] [CrossRef] [PubMed]
- Thieme, K.; Ehrle, A.; Lischer, C. Morphometrische Messungen Am Pferdehuf-Eine Literaturübersicht. Pferdeheilkunde 2015, 31, 108–118. [Google Scholar] [CrossRef]
- Collins, S.N.; Dyson, S.J.; Murray, R.C.; Newton, J.R.; Burden, F.; Trawford, A.F. Development of a Quantitative Multivariable Radiographic Method to Evaluate Anatomic Changes Associated with Laminitis in the Forefeet of Donkeys. Am. J. Vet. Res. 2012, 73, 1207–1218. [Google Scholar] [CrossRef] [PubMed]
- Walker, M.; Taylor, T.; Slater, M.; Hood, D.; Weir, V.; Elslander, J. Radiographic Appearance of the Feet of Mammoth Donkeys and the Finding of Subclinical Laminitis. Vet. Radiol. Ultrasound 1995, 36, 32–37. [Google Scholar] [CrossRef]
- Herbrecht, V.; Waldern, N.M.; Mikkelsen, S.E.; Kjaer, M.; Dittmann, M.T.; Wiestner, T.; Weishaupt, M.A. Hoof Conformation in Icelandic Competition Horses and Its Interrelationship with Hoof Pathologies and Tölt Performance. Vet. J. 2020, 259–260, 259–260. [Google Scholar] [CrossRef] [PubMed]
- Cardona, G.A.; Uribe, A.; Ortved, K. Determination of Positional Parameters of the Distal Phalanx Within the Hoof Capsule in Sound Colombian Paso Horses. J. Equine Vet. Sci. 2021, 101. [Google Scholar] [CrossRef] [PubMed]
- McGreevy, P.D.; Rogers, L.J. Motor and Sensory Laterality in Thoroughbred Horses. Appl. Anim. Behav. Sci. 2005, 92, 337–352. [Google Scholar] [CrossRef]
- Sharp, Y.; Tabor, G. An Investigation into the Effects of Changing Dorso-Plantar Hoof Balance on Equine Hind Limb Posture. Animals 2022, 12. [Google Scholar] [CrossRef]
- Mellish, M.; Lucas, Z.; Lancaster, L.; Stull, J.; Floyd, A. Visual and Morphometric Description of Feral Horse Hooves from Sable Island National Park Reserve. Can. Vet. J. 2023, 64, 1028–1034. [Google Scholar]
- White, J.; Mellor, D.; Duz, M.; Lischer, C.; Voute, L. Diagnostic Accuracy of Digital Photography for the Measurement of Foot Conformation in the Horse. Equine. Vet. J. 2008, 40, 623–628. [Google Scholar] [CrossRef] [PubMed]
- Sellke, L.; Patan-Zugaj, B.; Ludewig, E.; Cimrman, R.; Witter, K. Comparison of Six Different Methods for Measuring the Equine Hoof and Recording of Its Three-Dimensional Conformation. J. Equine Vet. Sci. 2023, 121. [Google Scholar] [CrossRef]
- Dyson, S.J.; Tranquille, C.A.; Collins, S.N.; Parkin, T.D.H.; Murray, R.C. An Investigation of the Relationships between Angles and Shapes of the Hoof Capsule and the Distal Phalanx. Equine Vet. J. 2011, 43, 295–301. [Google Scholar] [CrossRef]
- Thiemann, A.K.; Buil, J.; Rickards, K.; Sullivan, R.J. A Review of Laminitis in the Donkey. Equine Vet. Educ. 2022, 34, 553–560. [Google Scholar] [CrossRef]
- Hampson, B.A.; de Laat, M.A.; Mills, P.C.; Walsh, D.M.; Pollitt, C.C. The Feral Horse Foot. Part B: Radiographic, Gross Visual and Histopathological Parameters of Foot Health in 100 Australian Feral Horses. Aust. Vet. J. 2013, 91, 23–30. [Google Scholar] [CrossRef] [PubMed]
- Pezzanite, L.; Bass, L.; Kawcak, C.; Goodrich, L.; Moorman, V. The Relationship between Sagittal Hoof Conformation and Hindlimb Lameness in the Horse. Equine Vet. J. 2019, 51, 464–469. [Google Scholar] [CrossRef] [PubMed]
- Glitz, F.; Deegen, E. Allgemeine Untersuchung. In Praxisorientierte Anatomie und Propädeutik des Pferdes, 3rd ed.; Wissdorf, H., Gerhards, H., Huskamp, B., Deegen, E., Eds.; Verlag M.& H. Schaper GmbH, Bischofsholer Damm 24: Hannover, Germany, 2010; pp. 856–860 ISBN 978-3-7944-0216-8.
- Bartmann, C.P.; Gehlen, H. Klinische Untersuchung. In Handbuch Pferdepraxis, 4th ed.; Brehm, W., Gehlen, H., Ohnesorge, B., Wehrend, A., Eds.; Enke Verlag, Stuttgart, Germany, 2016; pp. 16–24.
- van Dierendonck, M.C.; van Loon, J.P.A.M.; Burden, F.A.; Rickards, K. Monitoring Acute Pain in Donkeys with the Equine Utrecht University Scale for Donkeys Composite Pain Assessment (Equus-Donkey-Compass) and the Equine Utrecht University Scale for Donkey Facial Assessment of Pain (Equus-Donkey-Fap). Animals 2020, 10. [Google Scholar] [CrossRef] [PubMed]
- Appendix 3: Body Condition Score. In The clinical companion of the donkey, 2nd ed.; Evans, L., Crane, M., Preston, E., Eds.; The Donkey Sanctuary, Sidmouth, UK, 2021; p. 278.
Figure 1.
a) The photo shows an example of a d.p. X-ray of the hoof on the right limb of a donkey. Both limbs are positioned on wooden blocks with equal weight-bearing. Using the inserted 80 cm long wooden slat, the central beam is positioned on the middle of the dorsal hoof wall orthogonally to the limb axis and the cassette. b) The slat is inserted into the milled edge in the wooden block.
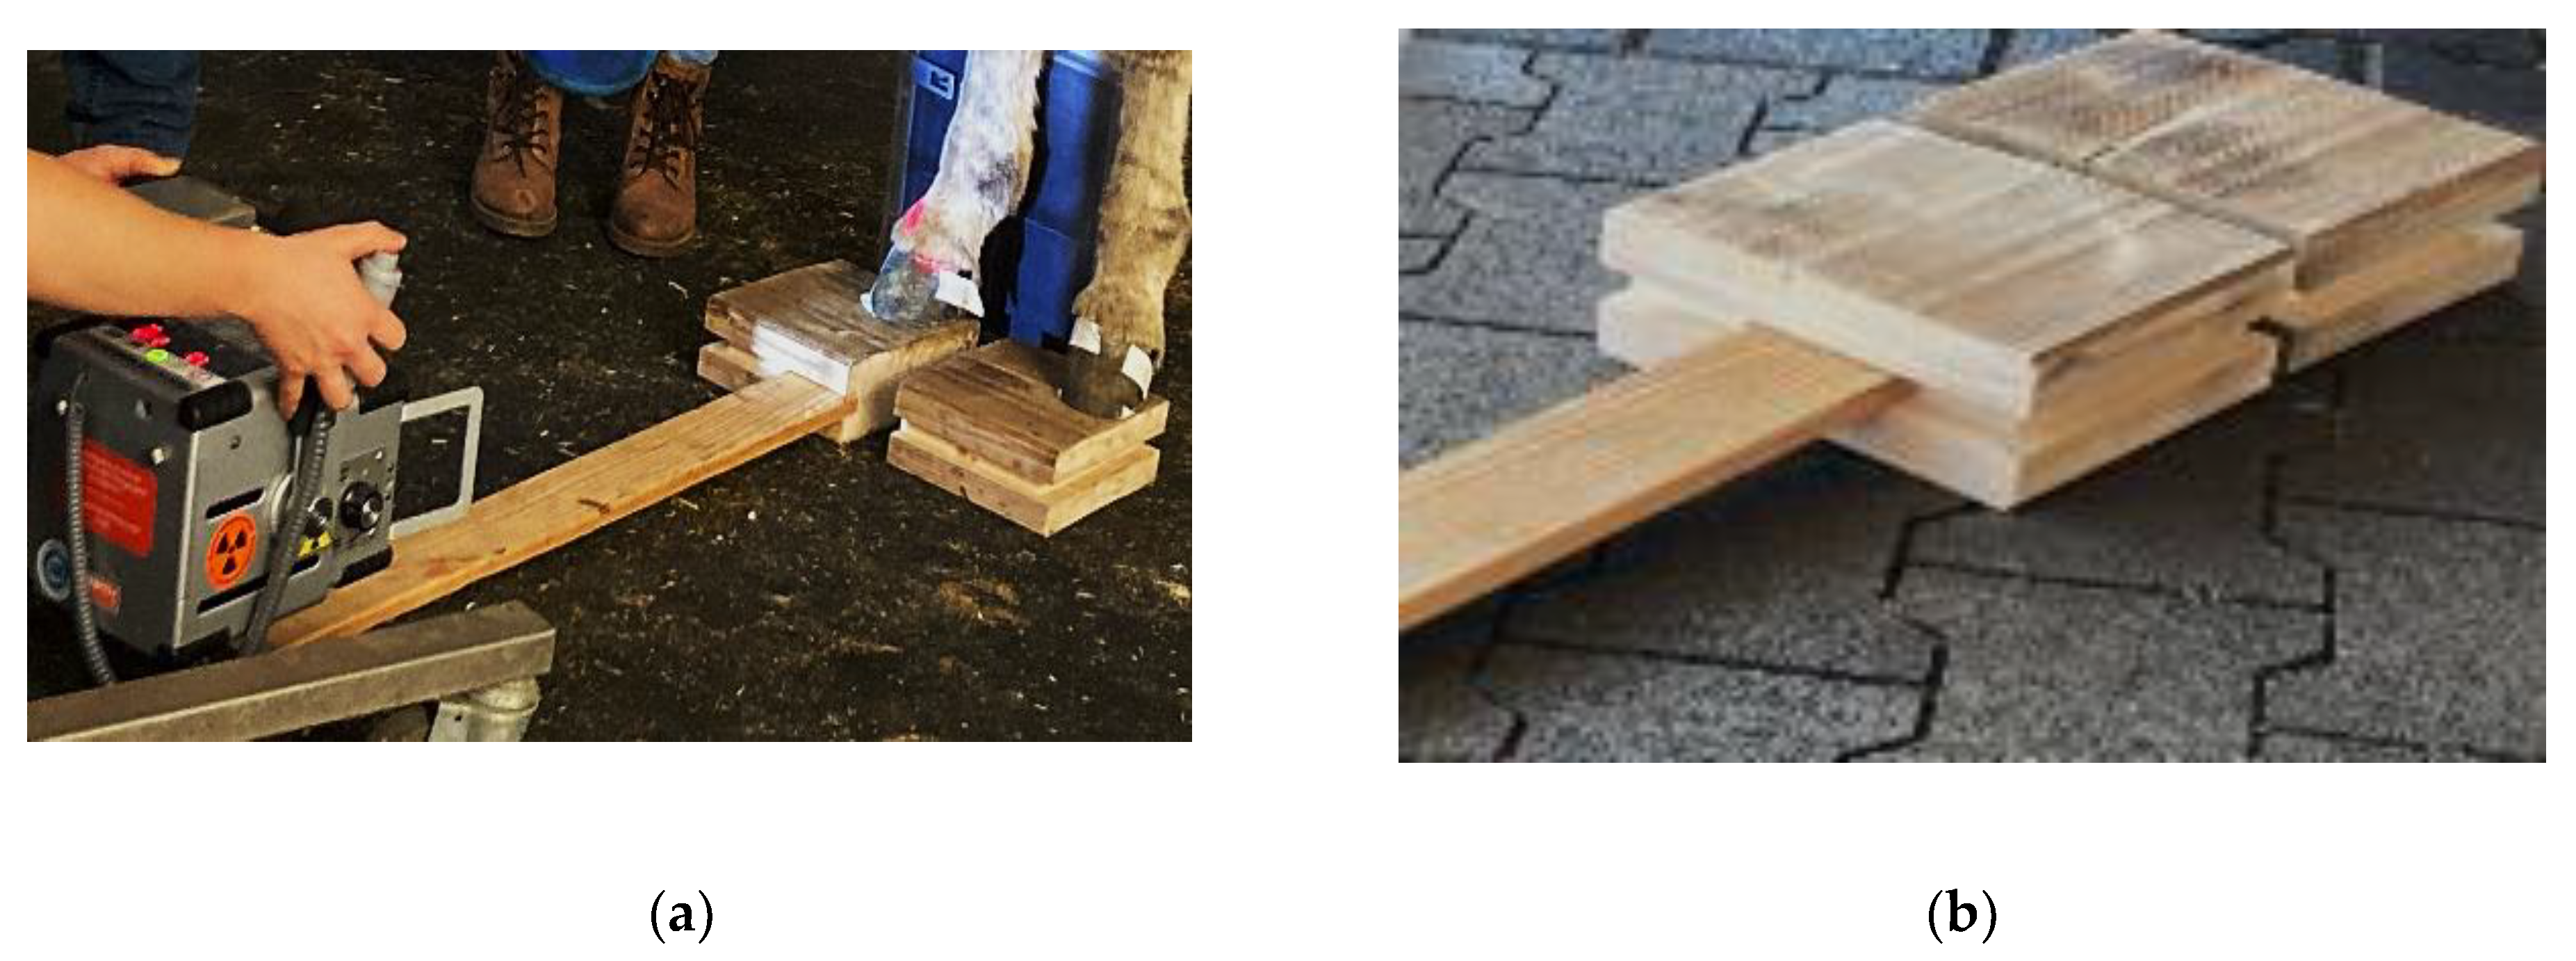
Figure 2.
Length (a) and angular (b) measurements on the lateromedial radiograph.

Figure 3.
Length (a) and angular (b) measurements on the dorsoplantar radiograph.
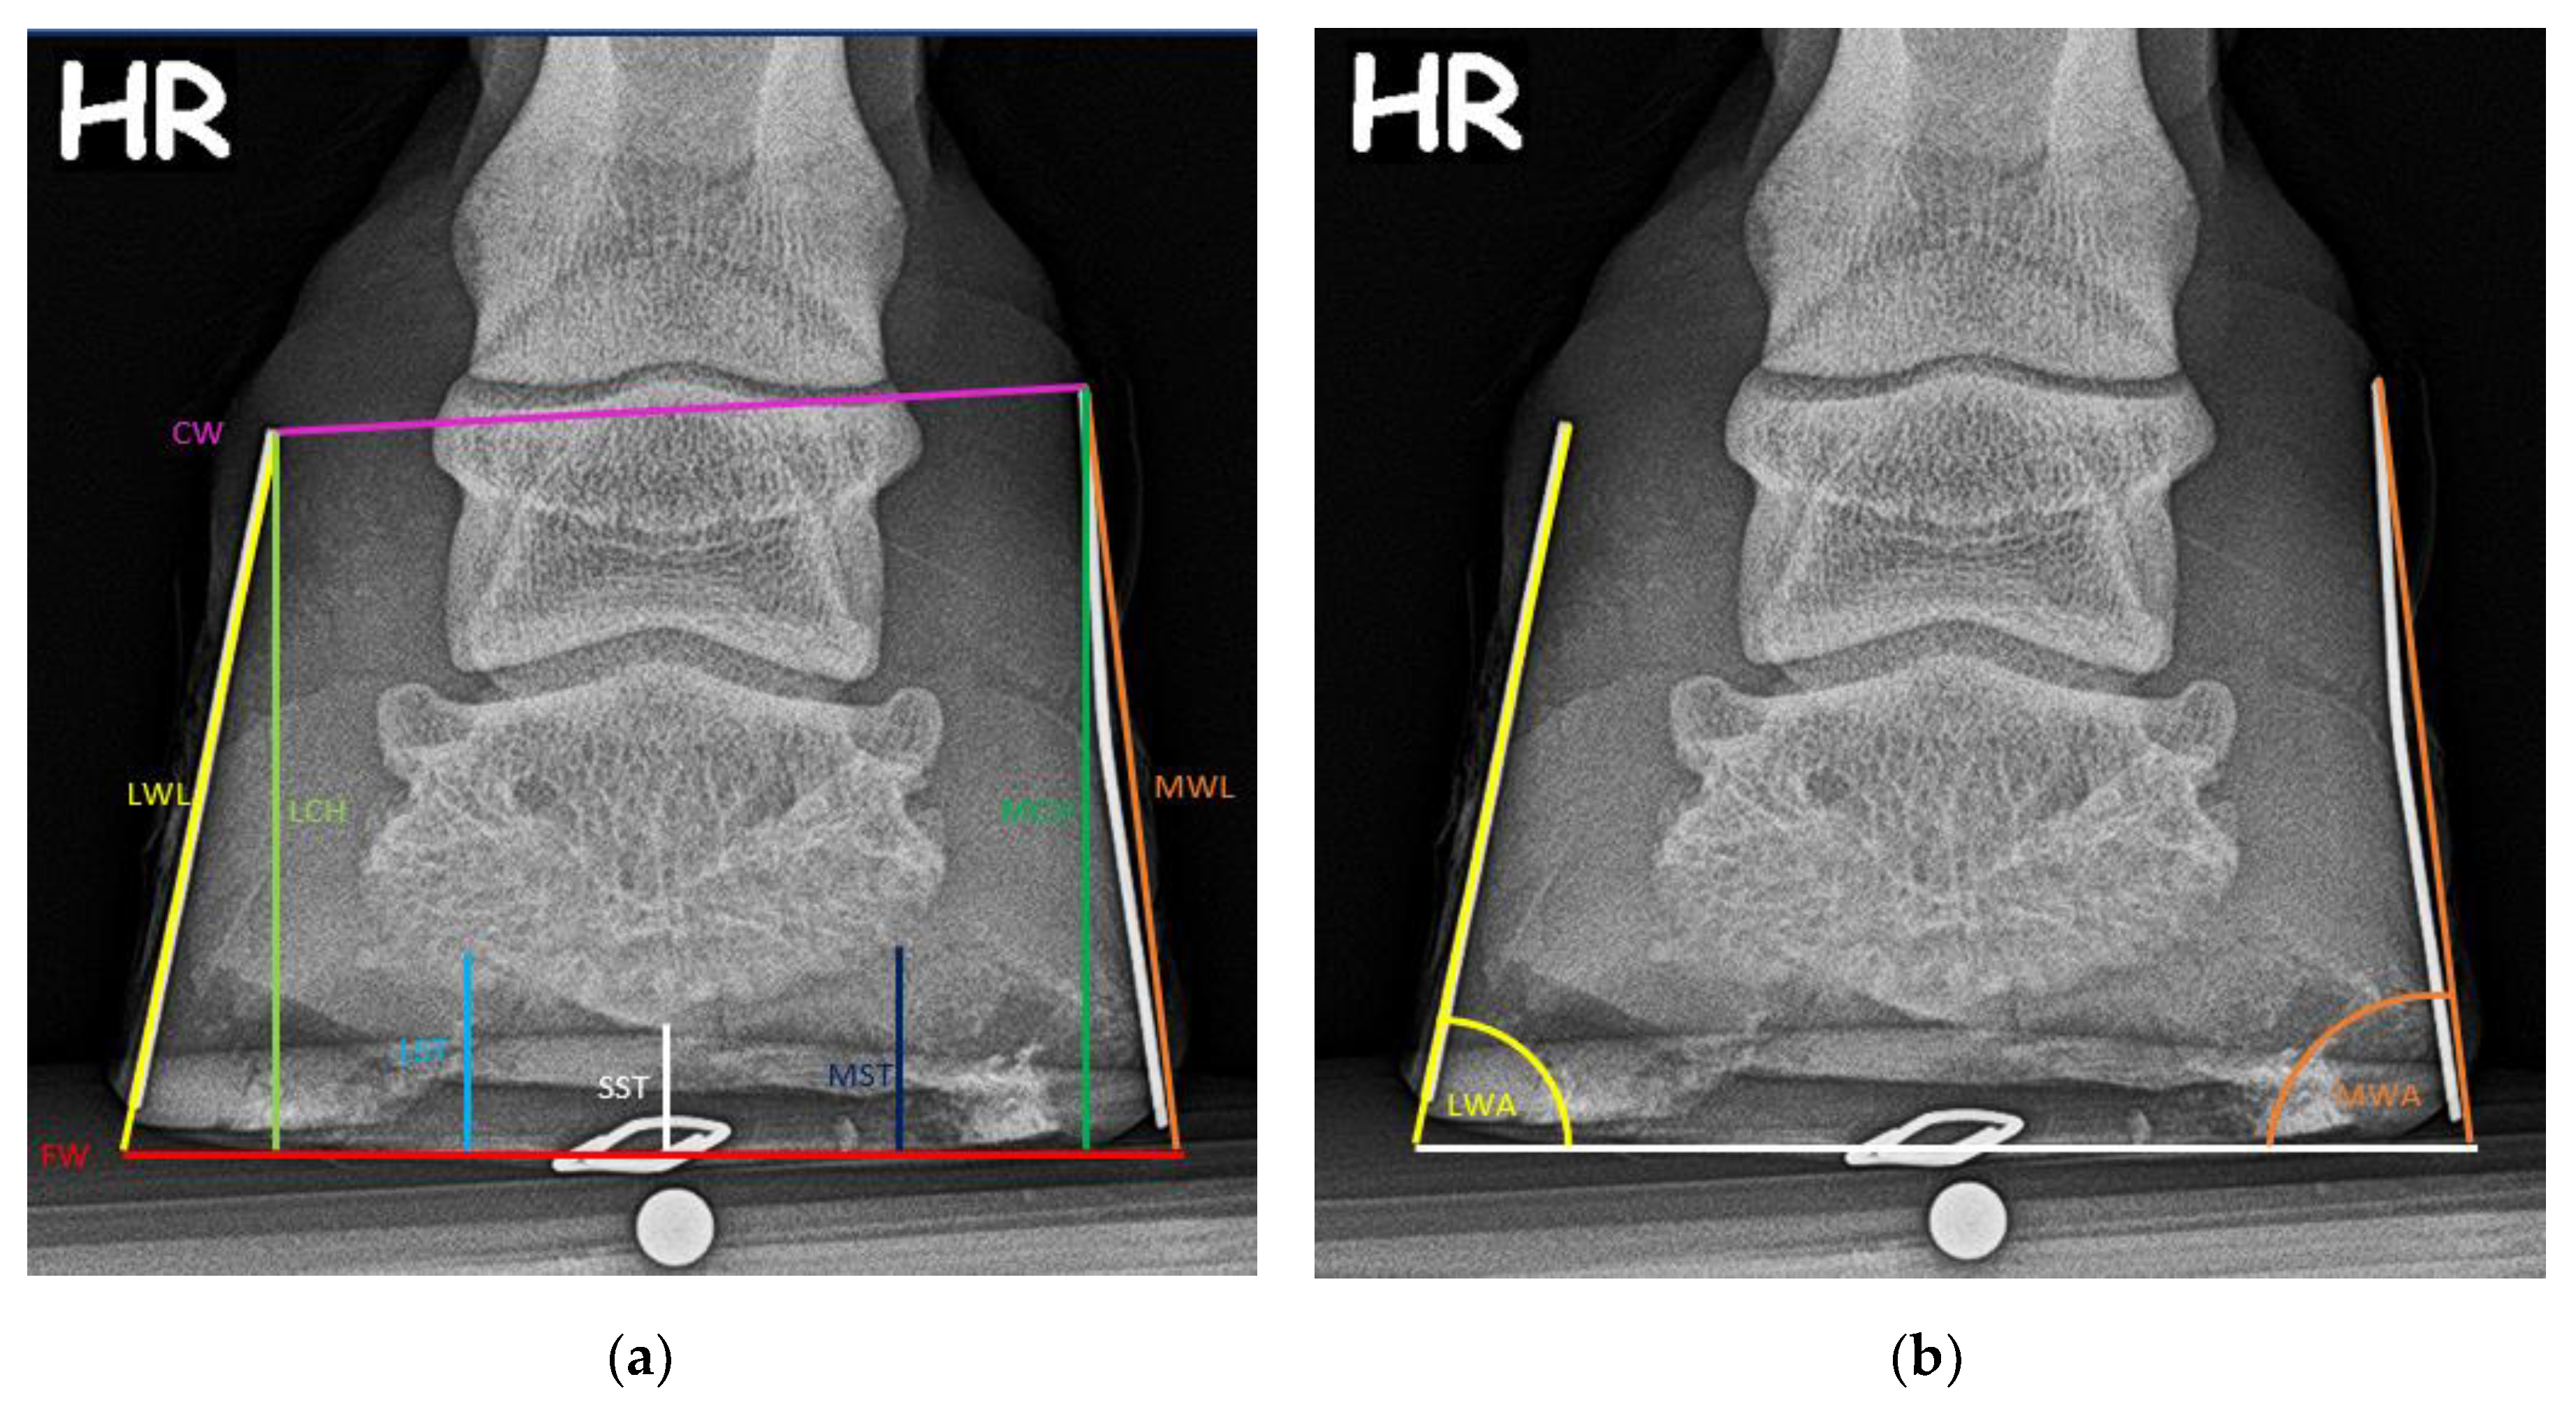
Table 1.
Abbreviations for length measurements on the lateromedial radiograph.
| abbr. | parameter | color | definition | ||
|---|---|---|---|---|---|
| lm (90°) | l | DWL | dorsal wall length | pink | distance of the hoof wall at the most dorsal point between the coronet band and the ground surface |
| ST | sole thickness | white | vertical distance between the tip of the coffin bone and the sole | ||
| DCH | dorsal coronet height | yellow | vertical distance between the most dorsal point of the coronet to the ground surface | ||
| HL | heel length | green | distance of the heel between the most plantar point of the coronet and the ground surface | ||
| PCH | plantar coronet height | orange | vertical distance between the most plantar point of the coronet to the ground surface | ||
| FD | founder distance | red | vertical distance between the horizontal extension at the level of the dorsal coronet to the extensor process of the coffin bone | ||
| SL | sole length | light blue | distance between the intercept point of the dorsal hoof wall and of the heel at the ground surface |
1l= length in mm, abbr. = abbreviation.
Table 2.
Abbreviations for angular measurements on the lateromedial radiograph.
| abbr. | parameter | color | definition | ||
|---|---|---|---|---|---|
| lm (90°) | a | HWA | hoof wall angle | pink | angle of the dorsal hoof wall to the ground surface |
| CBA | coffin bone angle | red | angle of the dorsal facies of the coffin bone to the ground surface | ||
| CR_c | coffin bone rotation calc. | calculated angular deviation HWA and CBA | |||
| CR_m | coffin bone rotation meas. | angle between the dorsal hoof wall and the dorsal facies of the coffin bone | |||
| PA | plantar angle | light blue | angle between the facies plantaris of the coffin bone and the ground surface | ||
| HA | heel angle | green | angle between HL and ground surface | ||
| HPA1 | hoof pastern axis 1 | orange | axial deviation in the proximal interphalangeal joint | ||
| HPA2 | hoof pastern axis 2 | yellow | axial deviation in the coffin joint |
a= angle in °, abbr. = abbreviation, calc. = calculated, meas. = measured.
Table 3.
Abbreviations for length measurements on the dorsoplantar radiograph.
| abbr. | parameter | color | definition | ||
|---|---|---|---|---|---|
| d.p. (0°) | l | CW | coronet width | pink | distance between lateral and medial coronet at widest point |
| FW | foot width | red | distance between distal end points of LWL and MWL | ||
| LWL | lateral wall length | yellow | distance between lateral coronet and ground surface in line with the lateral hoof wall | ||
| MWL | medial wall length | orange | distance between the medial coronet and the ground surface in line with the medial hoof wall | ||
| LCH | lateral coronet height | light green | vertical distance from the lateral coronet to the ground surface | ||
| MCH | medial coronet height | dark green | vertical distance from the medial coronet to the ground surface | ||
| SST | sagittal sole thickness | white | vertical distance from sagittal coffin bone to the sole | ||
| LST | lateral sole thickness | light blue | vertical distance from lateral coffin bone to the sole | ||
| MST | medial sole thickness | dark blue | vertical distance from medial coffin bone to the sole |
l= length in mm, abbr. = abbreviation.
Table 4.
Abbreviations for angular measurements on the dorsoplantar radiograph.
| abbr. | parameter | color | definition | ||
|---|---|---|---|---|---|
| d.p. (0°) | a | LWA | lateral wall angle | yellow | angle between lateral hoof wall and ground surface |
| MWA | medial wall angle | orange | angle between medial hoof wall and ground surface |
1 a= angle in °, abbr. = abbreviation.
Table 5.
Differences between right and left hind limb.
| v | n | normally distributed | p<0,05 R vs. L | |||||
|---|---|---|---|---|---|---|---|---|
| all | GAMD | all | GAMD | all | GAMD | |||
| lm (90°) | l | DWL | 39 | 20 | ✓ | ✓ | x | x |
| DCH | 38 | 19 | ✓ | ✓ | x | x | ||
| HL | 34 | 19 | ✓ | ✓ | p=0.005 | p=0.002 | ||
| PCH | 34 | 19 | ✓ | ✓ | p=0.008 | p=0.009 | ||
| FD | 39 | 20 | (✓) | ✓ | x | x | ||
| a | HWA | 39 | 20 | ✓ | ✓ | x | x | |
| CBA | 39 | 20 | ✓ | ✓ | x | x | ||
| CR_c | 39 | 20 | ✓ | x | x | x | ||
| CR_m | 39 | 20 | (✓) | (✓) | x | x | ||
| SA | 39 | 20 | ✓ | ✓ | x | x | ||
| PA | 39 | 20 | ✓ | ✓ | x | x | ||
| HA | 39 | 20 | ✓ | ✓ | x | x | ||
| HPA2 | 39 | 20 | (✓) | ✓ | x | x | ||
| dp (0°) | a | MWA | 35 | 17 | ✓ | ✓ | x | x |
| l | CW | 35 | 17 | ✓ | ✓ | p=0.04 | p=0.03 | |
| FW | 35 | 17 | ✓ | ✓ | x | x | ||
| LWL | 35 | 17 | ✓ | ✓ | x | x | ||
| MWL | 35 | 17 | (✓) | (✓) | x | x | ||
| LCH | 35 | 17 | ✓ | ✓ | x | x | ||
| SST | 34 | 16 | / | ✓ | x | x | ||
| LST | 34 | 16 | / | ✓ | x | x | ||
l = length in mm, a = angle in °, v = variable, all = total population, ✓ = normally distributed in Shapiro-Wilk, Kolmogorov-Smirnov, Cramer-von Mises and Anderson-Darling test, (✓) = normally distributed in majority of Shapiro-Wilk, Kolmogorov-Smirnov, Cramer-von Mises and Anderson-Darling tests, / = not normally distributed, x = p > 0,05, GAMD = Group of adult medium sized donkeys.
Table 6.
Correlation summary table weight and height.
| Correlation coefficient rs | all | GAMD | |
|---|---|---|---|
| weight | +++ (0.7 -1.0) | / | |
| ++ (0.5 - 0.7) | DCH, SL, CW, FW, LWL, MWL, LCH, MCH | DCH, SL, FW | |
| + (0.3 -0.5) | DWL, FD, HWA, CBA, MST | DWL, FD, CBA, CW | |
| (+) (0.1-0.3) | ST, HL, PA, LST, SST | / | |
| (-) (-0.1 - -0.3) | HPA 2 | / | |
| - (-0.3 - -0.5) | / | HPA2 | |
| height | +++ (0.7 - 1.0) | / | not analyzed |
| ++ (0.5 -0.7) | / | ||
| + (0.3- 0.5) | DWL, DCH, FD, SL HWA, CBA, CW, FW, LWL, MWL, LCH, MCH | ||
| (+) (0.1-0.3) | PA, MST | ||
| (-) (-0.1 - -0.3) | HPA1 |
rs= Spearman rank correlation coefficient, GAMD = Group of adult medium sized donkeys, abbreviations are listed in Table 1, Table 2, Table 3, Table 4, +++ = very strong correlation, ++ = strong correlation, + = moderate strong correlation, (+) = weak correlation, (-) = weak negative correlation, - = moderate negative correlation.
Disclaimer/Publisher’s Note: The statements, opinions and data contained in all publications are solely those of the individual author(s) and contributor(s) and not of MDPI and/or the editor(s). MDPI and/or the editor(s) disclaim responsibility for any injury to people or property resulting from any ideas, methods, instructions or products referred to in the content. |
© 2024 by the authors. Licensee MDPI, Basel, Switzerland. This article is an open access article distributed under the terms and conditions of the Creative Commons Attribution (CC BY) license (http://creativecommons.org/licenses/by/4.0/).
Copyright: This open access article is published under a Creative Commons CC BY 4.0 license, which permit the free download, distribution, and reuse, provided that the author and preprint are cited in any reuse.


