
Submitted:
25 November 2024
Posted:
26 November 2024
You are already at the latest version
Abstract
The results of observations of the object Th4-4 in 1970 -2024 showed that during this period the object went through the several stages, when its characteristics corresponded to different classes of objects: Be star, symbiotic star and planetary nebula. Currently the object appears to be a low-excitation planetary nebula.
Keywords:
symbiotic stars
; planetary nebulae
; Be stars
; emission spectra
; light curve
; profiles of emission line
1. Introduction
Many emission objects of different origin have similar spectra. This creates confusion in their classification. Options for misclassification are discussed below. By definition, symbiotic object consists of a hot star (white dwarf or Main Sequence star) and a late-type giant. Accordingly, the criterion of symbiotic nature is a spectrum that combines the characteristics of both components. In practice, many stars are for a long time considered to be ordinary red giants until ultraviolet observations reveal the presence of a “hot” continuum and high ionized emission lines. Sometimes only a sudden flash of an object reveals its true symbiotic nature (CH Cyg).
The classification of planetary nebulae (PN) is also imperfect, and many members of the Catalogue of planetary nebulae (PN) turned out to be the other type objects. A distinctive feature of a planetary nebula is its origin. These objects are formed after separation of the outer layers of the atmosphere from a star on the asymptotic red giant branch. The interaction between a high density slow wind and a low density fast wind forms observable shapes of PN. The stellar remnant turns into a central source of ionization of an envelope. Spectra of planetary nebulae of different excitation degree depend on the temperature of a central star. But similar spectra are found sometimes in symbiotic stars, compact HII regions, emission-line galaxies and diffuse nebulae. All of these objects can be classified as PN, although they are not one. As a result, among 1563 planetary nebulae, discovered by 1986, more than 200 turned out to be misclassified objects [1]. We encountered the problem of classifying emission objects during the analysis of observational results of Th4-4.
2. Equipment and Methods of Observation
Program of spectral observations of emission objects (Seyfert galaxies, PN and symbiotic stars) began at the Fesenkov Astrophysical Institute of Republic Kazakhstan (FAI) in 1969. It was stimulated by the put in operation of a new diffraction spectrograph. It was designed and manufactured at the FAI and equipped with the three-cascade image-tube UM-92. The new spectrograph had a set of diffraction gratings and camera lenses for observations in different wavelength regions. The total available spectral range was 3700-7500 Å. Spectrograms were obtained with a linear dispersion of 30 - 150 A/mm, depending on the solved problem. The image from the output window of the image-tube was recorded on a Kodak-type photographic emulsion, the resolution of which was 100–140 line pairs/mm. A lamp with Ar- He-Ne lines was used for wavelength calibration. Detailed description of the spectrograph and methods of observations are given in [2]. New device made it possible to obtain spectra of faint objects up to 18m on the telescope AZT-8 (D=70cm). The main disadvantage of using an image-tube is the lengthy and labor-intensive procedure for processing negatives. .Beside that, in the region of underexposure of the characteristic curve, the errors in the intensity values of weak lines could reach 50%. Processing spectrograms obtained with an image-tube is described in [2].
Spectrograph was upgraded in 2001, the image–tube was replaced by CCD camera ST-8 (1530x1020), and then after 2017- by CCD camera STT-3200 (2184 x1472). The modern spectrograms are obtained in two wavelength ranges: 4400Å -5200 Å and 6300Å - 7300Å with a dispersion of 1.0 Å /pixel. For the entrance slit of the spectrograph 7”-10”, the resolution is 1200 - 900 in two spectral ranges, correspondingly. Spectra of standard stars from [3], obtained just before or after the target, were used for the flux calibration. Obtained data were reduced in the standard way: dark subtraction, flat fielding. All results were corrected for atmospheric extinction. Last years three spectrograms were obtained at the 1.5 meter telescope AZT-20 of FAI. Its innovative spectrograph was equipped with the Volume Phase Holographic Gratings and CCD camera EMCCD.
Photometric observations were initially conducted at the telescope AZT-8 with the same spectrograph. In the photometric mode, the special device was installed instead of the entrance slit. It projected a section of the sky with a target onto the photocathode of image-tube [2]. Processing of images obtained with the image-tube, is described in [4].
Since 2016 optical photometry was carried out at the 1-meter telescope Carl Zeiss-Jena, located at Tien-Shan observatory (TShAO) of FAI. It is equipped with the CCD camera Alta F16M (4096x4096. 9μm) and a set of BVRc filters. The field of view (FOV) is 20′ ×20′ and the pixel scale is 0′′.38 pix−1. Nearby field stars with the known BVRc magnitudes are used as standards for differential photometry. All images are bias and dark subtracted and flat field corrected. Additional observations of 40 standard stars from [5] have been carried out to obtain the equations for converting instrumental values of the stellar magnitudes to the standard Johnson system.
3. Results
The object Th4-4 = V*4141Sgr = PK 008+3.2 with coordinates RA(2000.0)=17h50m.4; DA(2000.0)=-19o54’ was discovered as a planetary nebula in 1964 [6] and was include in Catalogue [7] as a possible PN. On the O-print of Palomar Sky Survey (1950), the object’s brightness was mpg=15m.3±0.5. That time its integral magnitude in the R filter was 13m.7 [7]. Our first spectroscopic observations of the object began in 1970. The spectrum showed the broad emission lines of HI and weak emission FeI and FeII lines, superimposed on a strong continuum [4]. After correction for the instrumental profile [8], the FWHM of the line Hα was 5.5±0.2 Å and wings were extended up to ±14Å. The effective temperature of the central star obtained by Zanstra (HI) method was T*=22000±500K. Thus, in 1970-1973 the effective temperature of Th4-4 and its spectrum, corresponded to the parameters of peculiar Be stars [9]. At that moment, the nature of the object was clear, and it was forgotten for about 10 years.
Later, in 1984, emission lines HeII and [OIII] were discovered in the spectrum of Th4-4 [10], and it received a new status. The object was included in the list of “symbiotic” or “possible symbiotic” stars [11, 12], because the authors found a late-type continuum and molecular bands combined with a set of high-excitation emission lines in the spectrum of Th4-4. Estimates of physical parameters: T(HI)=35000; T(OIII)=55000 were obtained in [12]. The review by Belckzynski [13] provided classification of the object: S-type symbiotic with the cold component of the mid M class.
The next series of our observations began in 1988. It turned out that the brightness of the object decreased by almost 2m in comparing with data of 1970s (Figure 1 and Table 1).
Spectrum of the object showed emissions of HI, HeI, 5876, 6678, 7065 Å, [OIII], 4959,5007 Å and faint line of [NII],6583 Å. The level of continuum was very low. The spectrum of the object was similar to that of a low-excitation planetary nebula [14, 15]. Further observations showed that the emission lines of HI, [OIII] and HeI are gradually weakened. (Table 2, Figure 2,3), and [NII], 6583 Å line has disappeared.
Table 2 contained the fluxes of Hβ and the relative intensities of the other emission lines, normalized to I(Hβ)=100. If observations were carried out only in the “red” wavelength range, the line intensities were normalized to I(Hα)=300. All values in Table 2 are dereddened with C(Hβ)=2.0. . No features appropriate to a late M component are detected in our spectrograms. In other words, the spectrum of the object is still similar to the spectrum of a low-excitation nebula.
4. Discussion
So the object Th4-4 was observed in three different states. At the first stage (Be star), the spectrum contained the broad HI emissions superimposed on a powerful continuum. At the second stage (1984-2002) (a symbiotic object), signs of a late star and high excitation lines [NeIII], NIII, HeII, [OIII] appeared in the spectrum. Finally, after a long break in observations, the object appeared as a low-excitation planetary nebula.
Over 20 years (1971-1991), the brightness of the object Th4-4 in the V filter weakened by 3m and dropped down to ~16m.5. This low level generally remains to this day. The light curve (Figure 1) shows two small increases in brightness, in 2000 and 2018 by ~0m.5 each.. At the beginning of observations, in 1970 – 1973, only the broad emission lines of HI and FeII were present in the spectrum of the object, the temperature of the star T(HI) was 22000K. By 1984, the emission lines of HeII, HeI and [OIII] appeared in the spectrum and, accordingly, the evaluations of the stellar temperature increased: T(HI)=35000K and T(OIII)=55000K[12]. It can be assumed that between the 1970s and 1984 the separation of the gaseous-dusty shell occurred. As a result, the luminosity of the object decreased, and the exposed star, which had a fairly high effective temperature, became able to ionize the resulting nebula. However, in a few years, ionization degree of gas began to decrease. (Figure 2, Figure 3). After another 13-year period (2002 – 2014) without observations, a synchronous weakening of emission fluxes in all lines was recorded in the spectrum of Th4-4 (Table 2). The brightness of the object corresponded to the minimum level. It is possible that by this time the ionization source was partially or completely surrounded by a new shell. The observed emission spectrum is the result of the gradual recombination of previously ionized gas. This is especially noticeable in the last 5 years. The rapid decrease in brightness after 2020 (Figure 1) was accompanied by an accelerated decrease of the fluxes in all emission lines (Figure 2 and Figure 3). (Although the intensities of the HeI and [OIII] lines in Figure 3 practically do not change, they are “tied” to the hydrogen lines and, accordingly, weaken along with them).
5. Conclusions
Beginning from 1984, the spectrum of Th4-4 has been similar to that of a low-excitation planetary nebula. However, the rapid changes in brightness and spectrum observed in the object are not typical for planetary nebulae. Its behavior, especially in recent years, is more consistent with symbiotic objects, possibly recurrent.
Let’s try to explain the results, obtained for Th4-4, in terms of its symbiotic nature. An analogue of the spectra, recorded in 1970 – 1973, was observed in a symbiotic star PU Vul [17] at one of the stages of its evolution. We assume that the broad emission lines in the spectrum of Th4-4 were formed due to electron scattering in the dense shell surrounding the star. Later, between 1975 – 1984, this shell left the star. It is unknown whether this process was explosive or slow. The second, a red component of the late spectral class, was observed only once [12]. This fact was not confirmed in [15]. Our spectrograms also showed no trace of the red star. Perhaps it is also inside the shell. At the same time, existence of the second component would be very useful for explaining the formation of dense shells around the star. At the last stage, at a low brightness level, the emission lines in the Th4-4 spectrum continue to weaken synchronously with the Hβ flux. A similar situation is observed, for example, in the spectrum of the symbiotic star BX Mon after its last outburst.
So, it can be assumed, with some reservations and stretches, that Th4-4 is still a symbiotic object. It is a pity that we were unable to observe the transition between the first and second stages of the Th4-4, but maybe this process will be repeated in the near future?
Author Contributions
Conceptualization, methodology, L.N. and E.K.; spectral observations, L.K. E.D. and M.K.; photometric observations, I.R.; processing of observational data, E.D., L.K., A.S., G.A.; analysis of results, L.K., E.D., writing—review and editing, L.K. and E.D.; supervision, L.K. All authors have read and agreed to the published version of the manuscript.
Funding
This research is funded by the Science Committee of the Ministry of Education and Science of the Republic of Kazakhstan (Grant No. АР19676713) and (Grant No BR20280974).
Data Availability Statement
The presented observational data, as well as the original spectrograms, can be found in the archives of the Fesenkov Astrophysical Institute or on its website.
Conflicts of Interest
The authors declare that they no conflicts of interest.
References
- Acker A. Planetary nebula: phenomenon or object? Some classuficatiion probles. CRJS, 1986, 8, 1-23.
- Denissyuk E.K. Spectrograph for Faint Objects: the Device and the Main Results of Observations. A&ATr, 2003, 22,175-189. [CrossRef]
- Kharitonov A., Tereschenko V., Knyzeva L. Spectrophotometric catalog of stars (Almaty, Kazakh University, 2011).
- Kondratjeva L. Spectroscopic and photometric variability of the planetary nebula Th 4-4. Soviet Astron. Lett. 1989, 15, 29-32.
- Landolt A. UBVRI Photometric Standard Stars around the Sky at +50 deg Declination. AJ, 2013,146, 131.
- The, P. S. Eleven new planetary nebulae//Contr. from the Bosscha Observ. Lembang., 1964, 28.
- Perek L., Kohoutek L Catalogue of galactic planetary nebulae. (Prague, 1967).
- Bracewell R. Simple Graphical Method of Correcting for Instrumental Broadening. JOSA, 1955, 45, 873. [CrossRef]
- Allen D., Swings J. the spectra of peculiar Be stars with infrared excesses. A&A, 1976, 47, 293-302.
- Acker A., Raytchev B., Koeppen J., et al. An extensive study of planetary nebulae in the galactic bulge. I. Spectrophotometric data. A&AS, 1991, 89, 237.
- Allen D. A Catalogue of symbiotic stars. Proc. Astron Soc. Australia, 1984, 5,369-384.
- Mikolajewska J, Acker A., Stenholm B. Spectrophotoetric study of southern symbiotic stars. A&A, 1997, 327, 191-198.
- Belckzy`nski, K., Mikolajewska, J., Munari, U., Ivison, R. J., & Friedjung, M. Catalogue of symbiotic stars. A&AS, 2000, 146, 407. [CrossRef]
- Kondrat’eva L. Rapid evolutionary changes in the spectrum of Th4-4. AstL., 1993, 39, 330.
- Gutierrez-Moreno A., Moreno H., Corrtes G., Observations of Five Suspected Symbiotic stars. PASP, 1992, 104, 1187-1992. [CrossRef]
- Luna G., Costa R. L. Nebular abundances of southern symbiotic stars. A&A, 2005, 435, 1087-1097. [CrossRef]
- Vogel M., Nussbaumer H. PU Vulpeculae : the outburst of a symbiotic nova. A&A, 1992, 259, 525.
Figure 1.
The light curve of Th4-4 in the V filter.
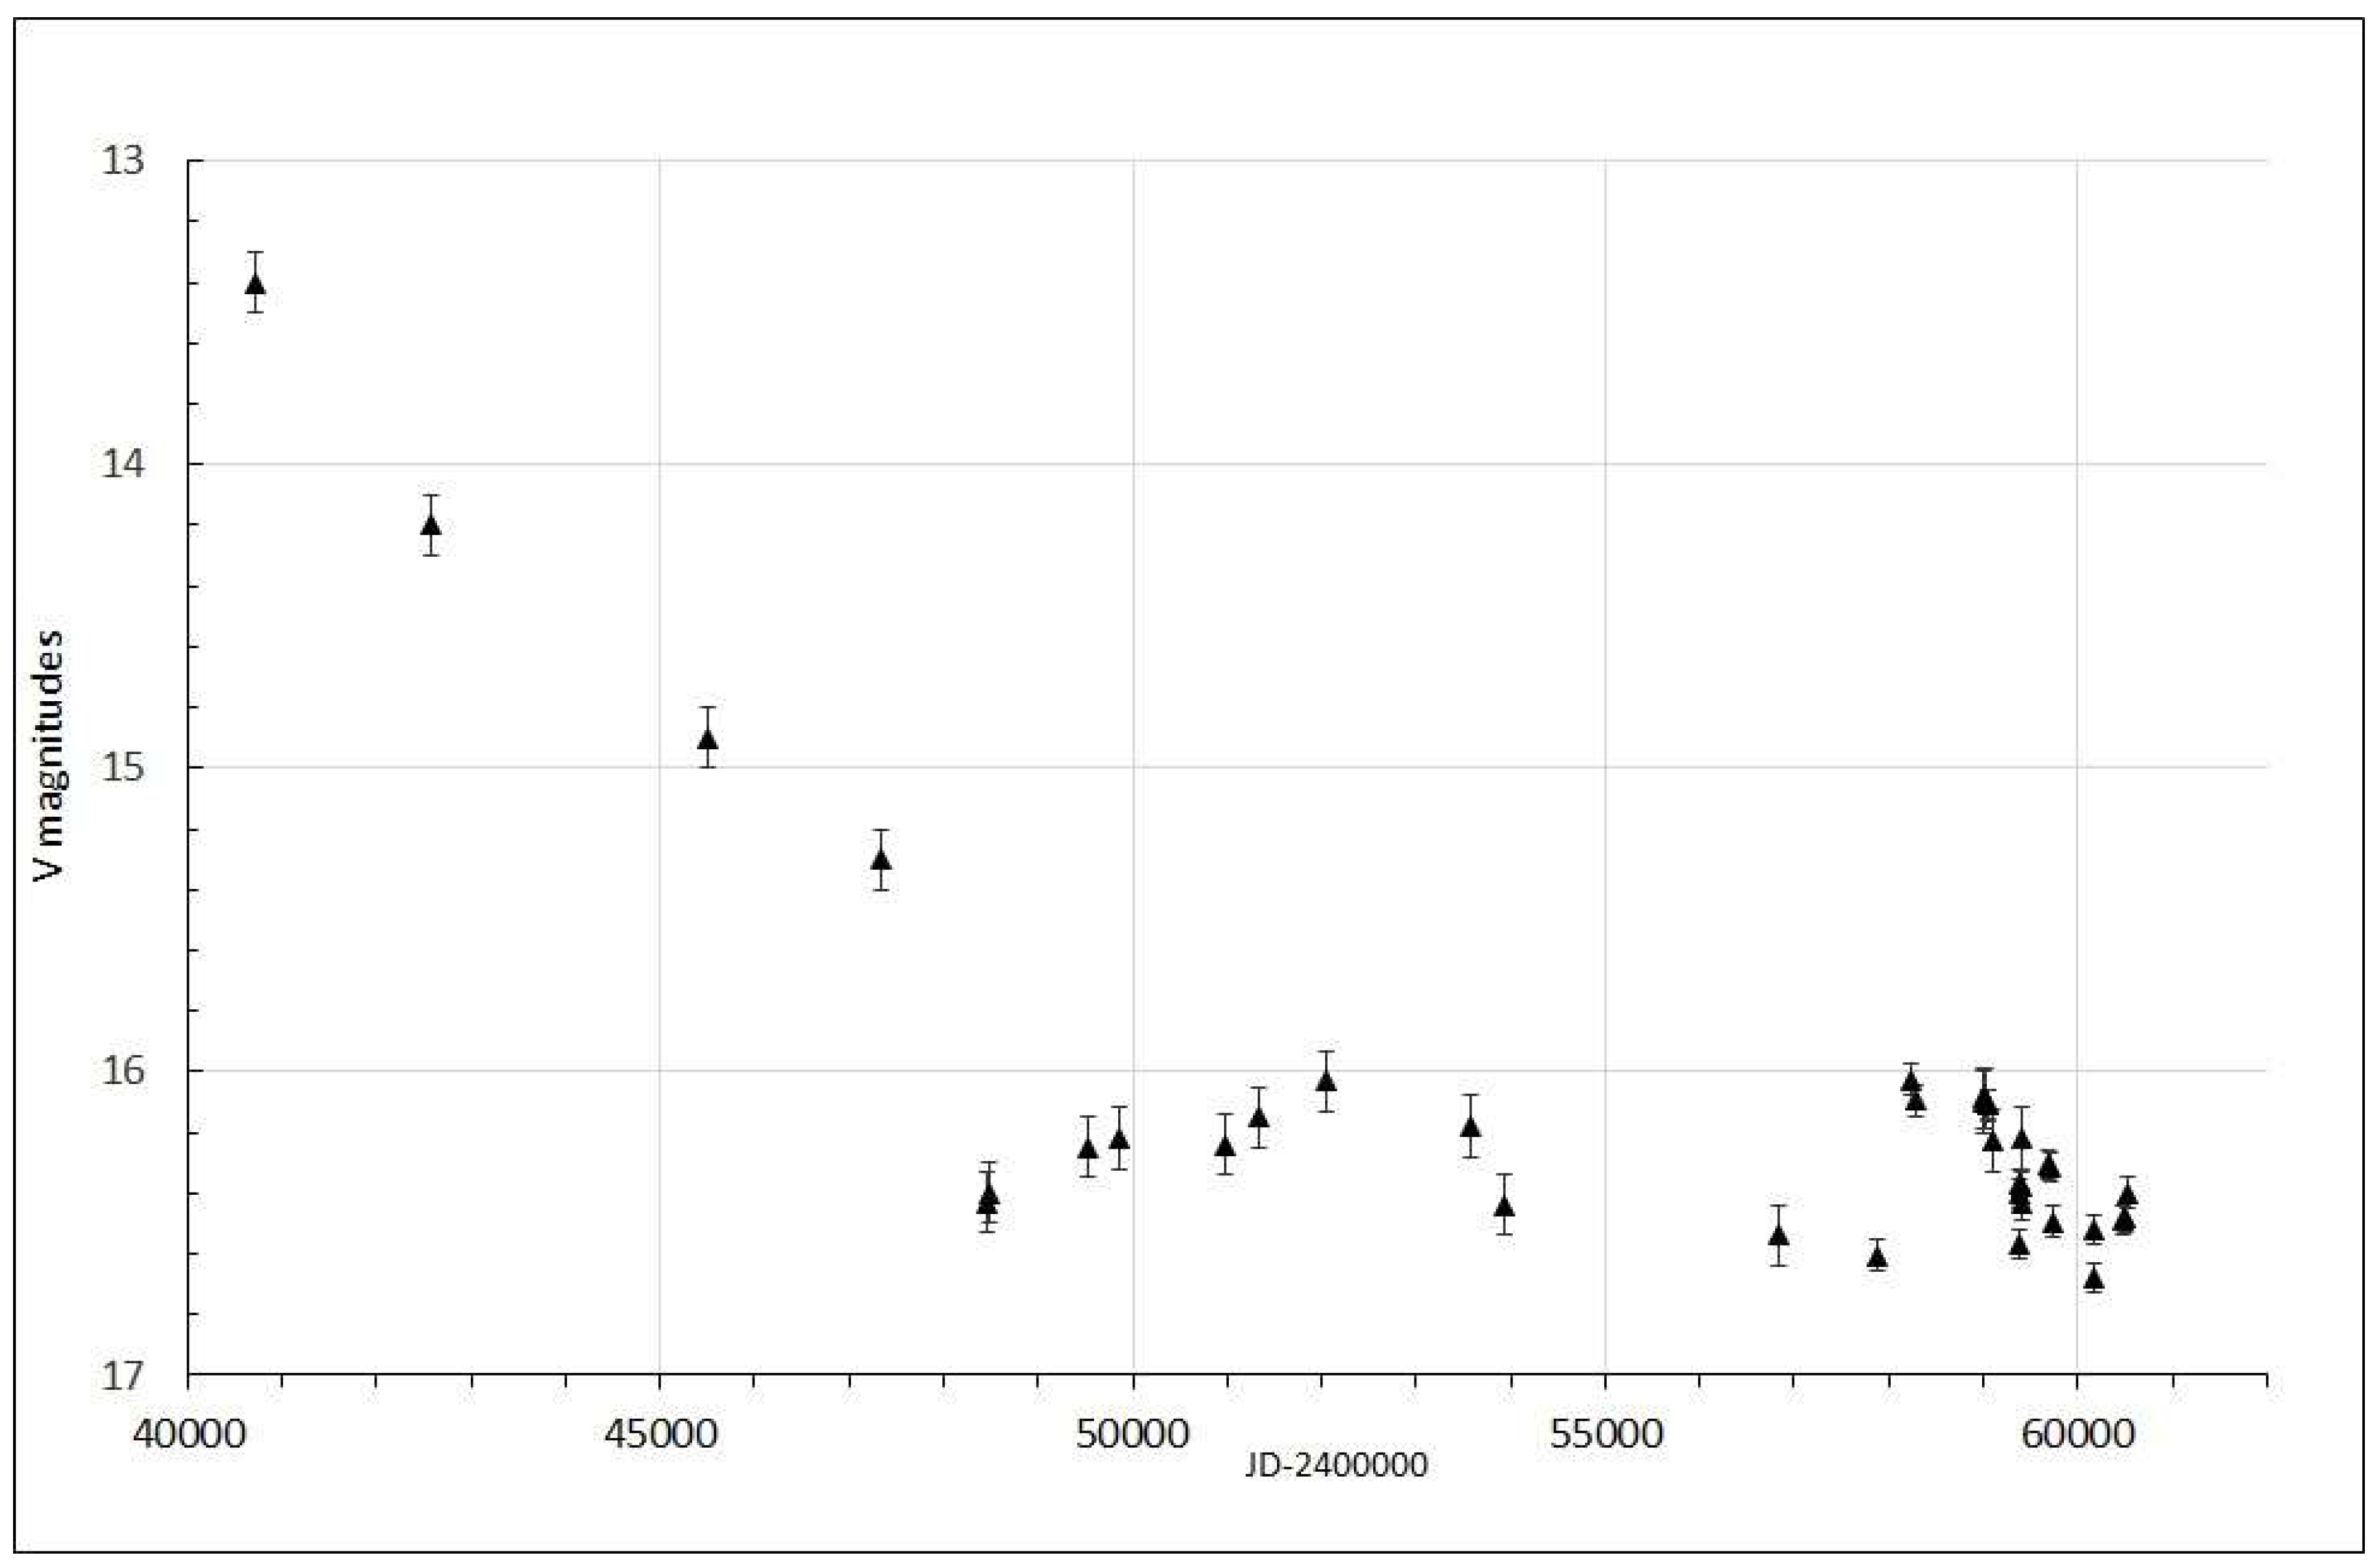
Figure 2.
Fluxes in the Hβ line on a scale of 10-14erg/cm2sec.
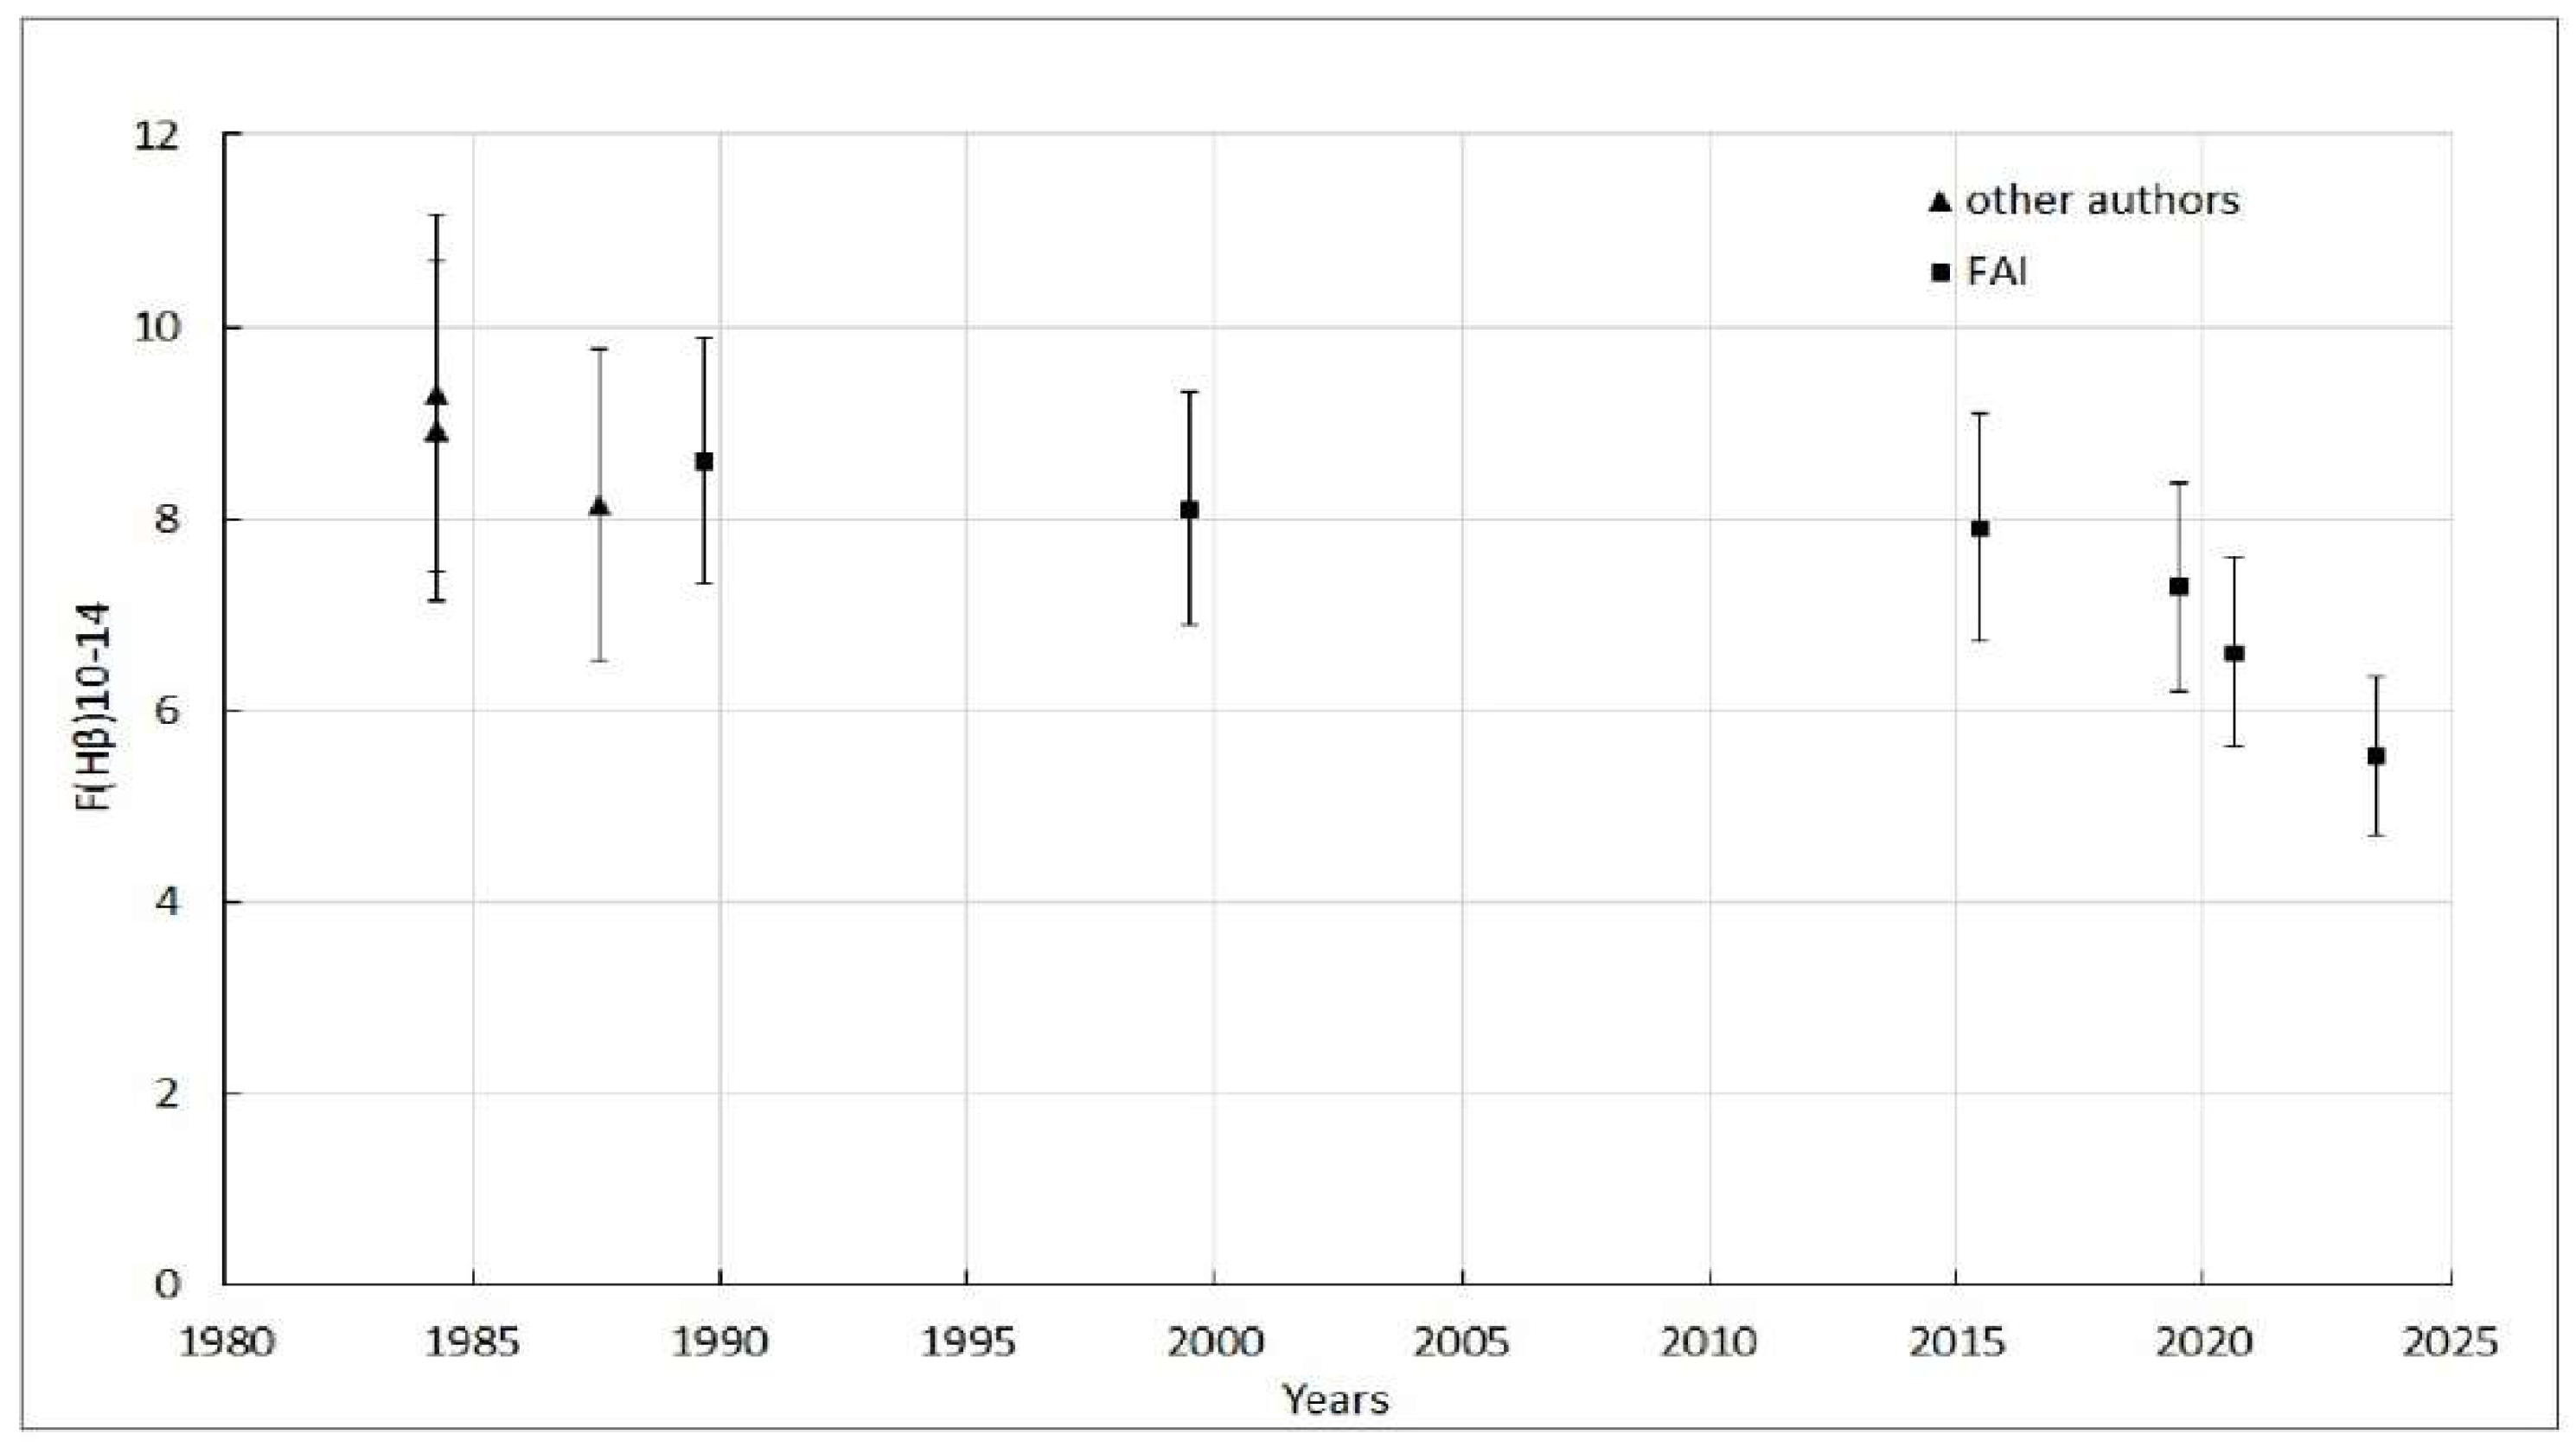
Figure 3.
Relative intensities of emission lines [OIII], 5007Å normalized to the scale I(Hβ)=100 and I(HeI),6678Å, normalized to the scale I(Hα)=300.
Figure 3.
Relative intensities of emission lines [OIII], 5007Å normalized to the scale I(Hβ)=100 and I(HeI),6678Å, normalized to the scale I(Hα)=300.
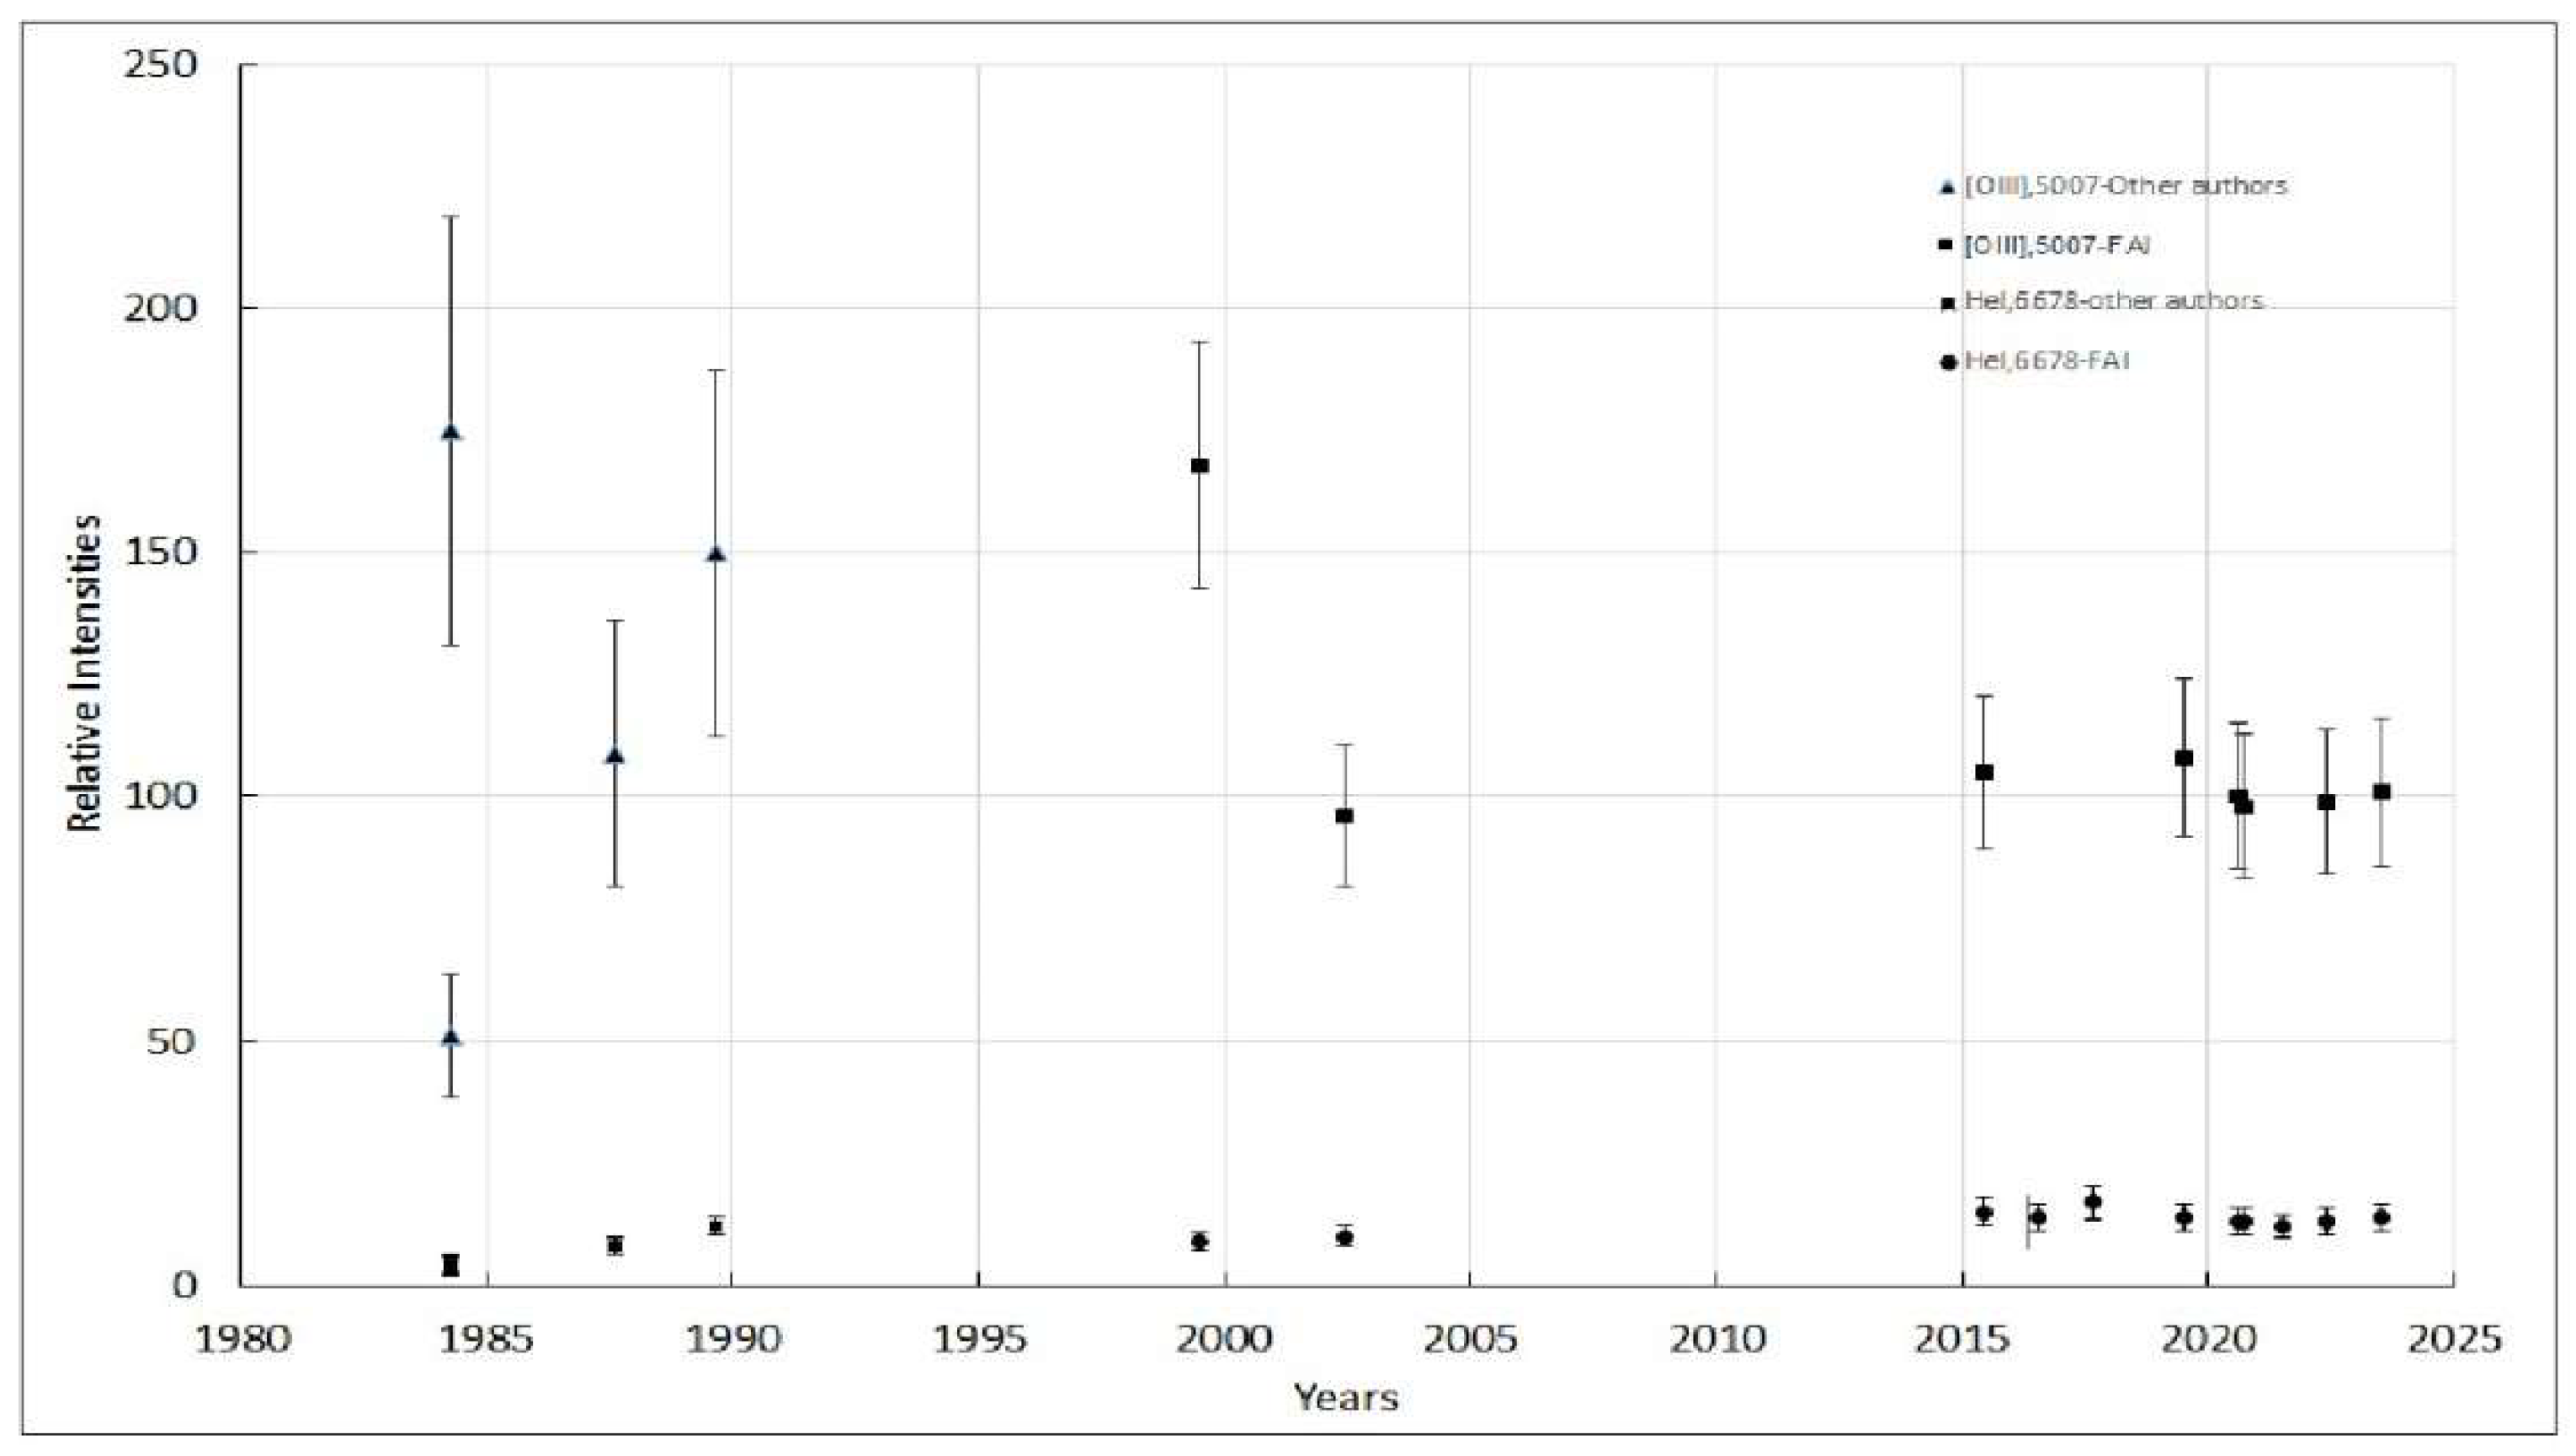

Table 1.
Results of photometry of Th4-4.
| Date | JD-2400000 | B | V | R |
| 1964[6] | 13.7 | |||
| 1970 May | 40721.00 | 13.40±0.10 | ||
| 1975 Jun | 42578.00 | 14.20±0.10 | ||
| 1983 Jun | 45500.00 | 14.90±0.10 | ||
| 1984 [10] | 17.5±0.05 | 15.63±0.0.05 | ||
| 1988 Jul | 47327.00 | 15.30±0.10 | ||
| 1991 Jul | 48452.00 | 16.43±0.10 | ||
| 1991 Aug | 48483.00 | 16.40±0.10 | ||
| 1994 Jul | 49518.00 | 16.25±0.10 | ||
| 1995 May | 49852.00 | 16.22±0.10 | ||
| 1998 Jul | 50979.00 | 16.24±0.10 | ||
| 1999 Jun | 51344.00 | 16.15±0.10 | ||
| 2001 May | 52045.42 | 16.03±0.10 | ||
| 2005 Jun | 53567.42 | 16.18±0.10 | ||
| 2006 29, Jun | 53946.25 | 16.44±0.10 | ||
| 2014 25, Jun | 56834.22 | 16.54±0.10 | ||
| 2017 24, Apr | 57868.43 | 17.72±0.04 | 16.60±0.06 | 15.42±0.11 |
| 2018 07, May | 58246.45 | 16.91±0.05 | 16.02±0.07 | 15.35±0.11 |
| 2018 05 Jul | 58275.37 | 16.75±0.10 | 16.09±0.04 | 15.43±0.06 |
| 2020 22, May | 58992.33 | 16.70±0.14 | 16.10±0.10 | 15.48±0.14 |
| 2020 27,Jul | 59058.21 | 16.85±0.03 | 16.11±0.03 | 15.29±0.10 |
| 2020 07, Sep | 59100.13 | 16.95±0.10 | 16.23±0.10 | 15.48±0.19 |
| 2021 14, Jun | 59380.26 | 16.98±0.06 | 16.37±0.05 | 15.57±0.08 |
| 2021 27, Jun | 59393.21 | 17.38±0.07 | 16.57±0.02 | |
| 2021 29, Jun | 59395.25 | 17.27±0.04 | 16.40±0.04 | 15.85±0.04 |
| 2021 30, Jun | 59396.22 | 17.09±0.05 | 16.38±0.04 | 15.55±0.07 |
| 2021 08, Jul | 59402.22 | 17.23±0.04 | 16.44±0.04 | 15.46±0.08 |
| 2021 24, Jul | 59420.21 | 17.30±0.05 | 16.40±0.08 | 15.56±0.08 |
| 2022 15, Apr | 59685.43 | 17.31±0.06 | 16.30±0.03 | 15.49±0.08 |
| 2022 08, May | 59708.36 | 17.24±0.06 | 16.32±0.04 | 15.79±0.03 |
| 2022 24, Aug | 59735.29 | 17.48±0.01 | 16.49±0.03 | 15.74±0.04 |
| 2023 03, Aug | 60160.24 | 17.54±0.04 | 16.68±0.05 | 15.08±0.09 |
| 2023 16, Aug | 60173.16 | 17.55±0.05 | 16.52±0.03 | 15.27±0.10 |
| 2024 27, Jun | 60489.34 | 17.50±0.02 | 16.42±0.03 | |
| 2024 12, Jul | 60504.19 | 17.42±0.05 | 16.46±0.04 | |
| 2024 07, Aug | 60530.16 | 17.19±0.06 | 16.36±0.03 |
Table 2.
Fluxes and dereddened intensities of emission lines in the spectrum of Th4-4.
| Date of observations | F(Hβ)erg/cm2sec | Relative intensities of emission lines | References | |||
| I(5007) | I(Hα) | I(6678) | I(7065) | |||
| Apr 30, 1984 | (8.91±0.6)E-14 | 175±20 | 292±30 | 4.5±0.6 | 12±1.5 | [11] |
| Jul, 1984 | (9.30±2.0) E-14 | 51±20 | 291±50 | 4.0±0.8 | 20±3.0 | [12] |
| Jul, 1987 | (8.13±2.70) E-14 | 109±15 | 310±40 | 7.9±1.0 | 12±1.5 | [15] |
| Aug 8,1989 | (8.63±2.70) E-14 | 150±20 | 300±35 | 12±1.5 | 16±2.0 | AZT-8 FAI |
| Apr 15, 1999 | (8,11±2.70) E-14 | 168±20 | 295±35 | 9.2±1.3 | 13±2.0 | AZT-8 FAI |
| Jun 16, 2002 | - | 96±12 | 476±55 | 10±1.5 | 16±2.0 | [16] |
| Jun 17, 2015 | (7.84±1.30) E-14 | 105±15 | - | 15±1.8 | - | AZT-8 FAI |
| Jun 29,2016 | - | - | 300±30 | 15±1.7 | - | AZT-8 FAI |
| Jul 13,2016 | - | - | 300±30 | 14±1.4 | - | AZT-8 FAI |
| Aug18, 2017 | - | - | 300±32 | 17±2.5 | 20±3.5 | AZT-8 FAI |
| Jul 11, 2019 | (7,28±1.10) E-14 | 108±14 | 298±32 | 14±2.0 | 18±2.5 | AZT-8 FAI |
| Jul 27, 2020 | - | 100±16 | 298±34 | 13±1.8 | 22±3.0 | AZT-20 FAI |
| Sep13, 2020 | (6.64±1.1) E-14 | 100±15 | 298±32 | 13±1.8 | - | AZT-20 FAI |
| Jun 29,2021 | - | - | 300±33 | 12±2.0 | 20±3.0 | AZT-8 FAI |
| May 08,2022 | - | - | 300±32 | 13±2.0 | 21±1.8 | AZT-8 FAI |
| Jun 29,2022 | (6.10±1.2) E-14 | 99±15 | 298±32 | 12±1.8 | 18±2.2 | AZT-8 FAI |
| Jul 11, 2023 | (5.51±1.0) E-14 | 101±15 | 300±32 | 13±2.0 | 18±2.6 | AZT-20 FAI |
| Aug 07,2024 | - | - | 300±35 | 14±2.2 | 20±3.0 | AZT-8 FAI |
Disclaimer/Publisher’s Note: The statements, opinions and data contained in all publications are solely those of the individual author(s) and contributor(s) and not of MDPI and/or the editor(s). MDPI and/or the editor(s) disclaim responsibility for any injury to people or property resulting from any ideas, methods, instructions or products referred to in the content. |
© 2024 by the authors. Licensee MDPI, Basel, Switzerland. This article is an open access article distributed under the terms and conditions of the Creative Commons Attribution (CC BY) license (http://creativecommons.org/licenses/by/4.0/).
Copyright: This open access article is published under a Creative Commons CC BY 4.0 license, which permit the free download, distribution, and reuse, provided that the author and preprint are cited in any reuse.


