
Submitted:
22 November 2024
Posted:
22 November 2024
You are already at the latest version
Abstract
In agriculture, the relationship between economic growth and environmental pressures is complex and difficult to measure and compare between countries. This study had two objectives: the first one was to build a new green growth accounting framework for agriculture in relation to natural capital and air pollution, and the second one was to assess the long-term green growth of agriculture in the EU countries. Data for the EU27 for 2005-2021 were collected and used in the empirical analysis of green growth in agriculture. Findings show a positive real growth in agriculture from both economic growth and green growth perspectives in most EU countries over the long term. Slow changes in air pollution (expressed in net GHG emissions from agriculture) and in natural capital (expressed in quality-adjusted agricultural land) do not have a significant impact on green growth in agriculture. The empirical analysis also reveals that most EU countries increasingly relied on technological progress to promote agricultural growth, and half of them relied on investments in produced capital. The labour input has a positive contribution to agricultural growth only in Ireland and Malta. This study will significantly contribute to improving the measure of green growth in agriculture and the results of the empirical analysis will be used by policymakers and economists.
Keywords:
agriculture
; green growth
; EAMFP
; pollution-adjusted GVA
; quality-adjusted agricultural land
1. Introduction
The relationship between economic growth and environmental pressure in agriculture is complex [1]. Agriculture plays an important role in ensuring food and nutritional security and serves as the major source of rural employment [2]. However, agriculture is also a significant contributor to climate change due to the amount of pollutant emissions from livestock, managed agricultural soils, land use and land use change. The dilemma between environmental pressure and economic growth obtained wide attention at national and global levels. The relevant question is how to maintain economic growth while improving the quality of the environment [3,4]. In this case, the concept of green growth is developed. Green growth is a complex concept that emphasizes the quality of development.
Over the past decade, green growth is one of the most actual issues on the political agenda. More and more discussions are arising on green growth policy [5,6]. In the Rio+ 20 Conference on Sustainable Development in 2012, green growth emerged as a fundamental theme, and the “green economy” and “sustained economic growth” ensured success in the new way of sustainable development [7]. Green growth in the European Union (EU) is also emerging in various national policy measures. This is especially true for agriculture as a polluting sector [8]. To promote green growth, the EU has created the “European Green Deal” Communication that promotes reducing to zero net emissions of greenhouse gases (GHG) in 2050 and decoupling economic growth from resource use [9].
More and more scholars are engaged in the green growth discourse or empirical research [10]. There are several similar concepts of green growth [1,2,3,4,5,6,7,8,9,10,11,12,13,14,15] like environmentally sustainable economic growth [16,17,18,19], ecologically sustainable growth [20,21], inclusive green growth [22,23,24], genuine green growth [25,26], green economy [15], low-carbon growth [27,28,29], zero carbon growth [30], etc. In academic literature, the above-mentioned terms are used as synonyms, and others used as separate terms.
Previous studies have focused on development of the concept of green growth in agriculture [5,11,31,32,33,34] and measuring green growth by such systems of indicators as dashboards and headline indicators [19,23,34,35]. However, according to Kasztelan et al. [36], the agricultural evaluation of green growth is less well understood due to the complexity of the sector and the change of its negative or positive environmental impact. In performing green growth measurement in agriculture, two approaches can be distinguished: a framework for measuring green growth by including its key elements, like production, environment, consumption, and its corresponding indicators; and the development of measures in terms of productivity, like environmentally adjusted or green multifactor productivity (EAMFP) [37,38] or environmentally adjusted or green total factor productivity (EATFP) [39,40,41,42,43] as the most commonly used indicators in recent years. Two method such as Data envelopment analysis (DEA) and stochastic frontier analysis (SFA) have become the most popular techniques in measuring of EATFP [39,41,42,43] or EAMFP [38] in agriculture. This study had two objectives: the first one was to build a new green growth accounting framework for agriculture in relation to natural capital and air pollution, and the second one was to assess the long-term green growth of agriculture in the EU countries.
This study is structured as follows. After the theoretical framework, we present data selection, and empirical analysis for the green growth in agriculture. Then, we have a series of discussions on the green growth in agriculture in the context of factor inputs, undesirable output and EAMFP contribution in the EU countries. The last section presents conclusions from the analyses.
2. Methodology
2.1. Conceptual Framework of Green Growth Accounting for Agriculture
This paper develops a green growth accounting framework for agriculture using the functional form of the relationship between production factors inputs and production outputs (i.e. the transformation function) taking into account labour, produced capital and natural capital as inputs, gross value added as desirable output and air pollution as undesirable output. The OECD defines green growth as "fostering economic growth and development while ensuring that the natural assets continue to provide the resources and environmental services on which our well-being relies" [44] (p. 9), which means the "aligning economic growth and environmental objectives" [45] (p. 22).
A starting point in our approach to build the green growth accounting framework for agriculture is the environmentally adjusted multifactor productivity (EAMFP) measurement at the macroeconomic (country) level established by Brandt et al. [46,47] and developed by Rodríguez et al. [13,48]. The EAMFP extends the traditional MFP measurement framework which is based on conventional production factors (labour and produced capital) and outputs (gross output or value added) to take account of environmentally related inputs and outputs such as natural capital and air pollution, respectively. The EAMFP can reveal natural contributions and assess the potential for sustainable growth [13]. It is used as the OECD green growth headline indicator [34].
The EAMFP is derived from the following transformation function [13]: H (Y, R, L, K, N, t) ≥ 1, where Y represents the desirable output of the economy and R is the undesirable output (air pollution). L, K, and N represent vectors of multiple types of inputs such as labour, produced capital, and natural capital, respectively. H represents the increase in each input mentioned above and in both desirable and undesirable outputs as well. The logarithmic derivative of the transformation function H concerning time provides a measure of growth in environmentally adjusted multifactor productivity (EAMFP) which is equal to the sum of weighted outputs change less the sum of weighted inputs changes over the same time.
In the case of the agriculture industry, the logarithmic derivative of the transformation function H with respect to time t can be expressed as:
where ∂lnEAMFP/∂t – denotes the real growth of the environmentally adjusted multifactor productivity which can be interpreted as technological progress; ∂lnGVA represents the real growth of gross value added as a desirable output in agriculture; ∂lnGHGnet represents the change of net GHG emission in agriculture as an undesirable output; ∂lnL denotes the change in the agricultural labour force in terms of annual work units; ∂lnK denotes the real change in produced capital in terms of agricultural capital stock; ∂lnN denotes the change in natural capital in terms of quality-adjusted utilised agricultural land. Outputs and inputs are weighted with their elasticity concerning the transformation function: εYGHGnet denotes the elasticity of undesirable output; εYL, εYK, and εYN denote elasticities of labour, produced capital and natural capital, respectively. The methodology to obtain elasticities is described in detail in Section 2.4 and Section 2.5 below.
∂lnEAMFP/∂t = ∂lnGVA/∂t − εYGHGnet × (∂lnGHGnet/∂t) − εYL × (∂lnL/∂t) − εYK × (∂lnK/∂t) − εYN ×(∂lnN/∂t);
The rearranged Equation (1) provides a green growth accounting equation that decomposes pollution-adjusted GVA growth into growth in factor inputs (such as labour, produced capital and natural capital) and EAMFP growth:
∂lnGVA/∂t − εYGHGnet × (∂lnGHGnet/∂t) = εYL × (∂lnL/∂t) + εYK × (∂lnK/∂t) + εYN ×(∂lnN/∂t) + ∂lnEAMFP/∂t;
The left side of Equation (2), i.e. ∂lnGVA/∂t − εYGHGnet × (∂lnGHGnet/∂t) refers to pollution-adjusted GVA growth, that can measure the green growth in agriculture and could be useful in the analysis of sustainable development of this agriculture industry. This indicator provides valuable information on economic growth of agriculture industry taking into consideration the contribution of natural capital and negative impact of pollutants.
2.2. Output Variables and Data
The joint production in agriculture produces both desirable and undesirable outputs - the desirable or good output is defined as the preferred or planned product of the production process usually expressed as gross domestic product [13,49,50]. In the case of the agriculture industry, the desirable output can be measured by gross agricultural output [51,52,53], or specific output in a narrow analysis like crop output [2]. In this study, the GVA is used as a metric of desirable agricultural output, calculated in 2005 fixed prices in order to determine its real growth.
According to Rodríguez et al. [48], the undesirable or bad output is defined as negative by-products of the production process such as air pollution, water waste, etc. In the case of agriculture, the undesirable output is environmental pollution from agricultural production, what can easily identify like total GHG associated with livestock breeding, managed agricultural soils, etc. or comes from sources that do not have a single point of origin [13,37,52,54,55].
According to Lewis [56], the non-point source pollution is a diffuse source of water quality degradation that is difficult to measure. The non-point source pollution includes urban runoff, storm sewers, drainage from waste disposal sites and landfills, and airborne pollutants that settle in the water. In case of agriculture, the non-point source pollution specifies emissions into water like the emissions of total nitrogen, and total phosphorus, nutrient runoff to water from agricultural production, rainwater carries agricultural sediment like soil particles from agricultural fields into nearby lakes or streams [52,57]. The coverage of non-point source pollution is constrained by data limitations. The agricultural pollution data used in this analysis contained variables that are clearly identified (Figure 1).
In terms of GHG, net agricultural pollution is affected by both GHG emission and removals [54,58,59,60,61,62]. We considered net GHG emission in agriculture (GHGnet) as the balance between the GHG emission from production (cultivation of crops and livestock) and the carbon sequestration in grassland and pastures. The GHGnet can be described by the following [63]:
where GHG denotes greenhouse gas emissions in CO2 equivalent and ±CO2 denotes positive or negative carbon dioxide per annum in terms of emission/removals from agriculture.
GHGnet = GHG +(±CO2)
In this study, environmental pollution from agriculture is expressed in terms of net GHG emissions, taking into account both the GHG emissions in CO2-equivalent from agricultural activities and the CO2 uptake by grassland and pastures. Eurostat statistics on the agricultural environment were used for the analysis.
2.3. Input Variables and Data
Produced (or physical) capital, labour and land are fundamental production factors in agriculture (Figure 2).
2.3.1. Labour
According to Fuglie [64], farm labour is the total number of adults (salaried and non-salaried) who are economically active in agriculture. Labour input is expressed in Annual work unit (AWUs) with measured as the ratio between total hours worked and the average annual number of hours worked full-time jobs in the country. The number of hours effectively worked [65] is called the annual work unit (AWU). In this study, both the salaried and non-salaried labour in AWU is used as agricultural labour input. The labour input is calculated based on the data obtained from the Economic Accounts for Agriculture dataset of the Eurostat Agriculture database.
2.3.2. Produced Capital
Produced capital (physical) is a fundamental input in the production process [66] and is used as the agricultural input variable in EAMFP analysis. Produced capital is expressed as agricultural capital stock using the perpetual inventory method. According to Vander Donckt & Chan [67], the capital stock equation is derived as follows:
where Ki,t denotes agricultural capital stock for country i at time t, Ki,t0 denotes initial agricultural capital stock, δi is a country-specific depreciation rate and Ii,t denotes gross fixed capital formation for country i at time t.
Ki,t = (1-δi) K(i,t0) + (1-δi) Ii,t
Despite increased interest in the estimation of agricultural capital stock, comparable datasets between countries are still scarce [66]. Relevant data on agricultural capital stock were available in the FAOSTAT Capital Stock Database with country details from 1995. The FAOSTAT reports on aggregate capital stock in agriculture, forestry and fishing [68]. The gross fixed capital formation data are obtained from the Economic Accounts for Agriculture dataset of the Eurostat Agriculture database. The country-specific depreciation rate expressed as a 5-year average was calculated using annual farms data obtained from the FADN Public Database of the European Commission.
2.3.3. Natural Capital
According to Ascui & Cojoianu [69] and Barbier [70], natural capital is defined as natural resources used in the economy such as land, forest, fossil, fuels and other natural resources. The natural capital also consists of ecosystems that provide flows of environmental goods and services, which underpin the global economy and human well-being.
One of the main natural capital resources in agriculture is agricultural land [71]. The quality-adjusted agricultural land area is used to build aggregate EAMFP [64,71]. In this case, the quality-adjusted agricultural land is classified as cropland and grassland. Cropland, i.e. permanent and annual crops, can be affected by rain (rainfed areas) and irrigation (area equipped for irrigation). Agricultural land is a heterogeneous input, with some cropland being capable of multiple harvests per year while some permanent pasture yields very little at all. The various agricultural areas (rainfed cropland, irrigated area and permanent pasture) are aggregated into a quality-adjusted measure with different land quality weights (Table 1). For example, the increase in irrigated land will have a larger effect on output growth than an increase in grassland.
Following Fuglie [64], the quality-adjusted agricultural land equation is derived as follows:
where Crain denotes a rainfed area for country i, R denotes specific country i, P denotes permanent pasture, Cirr denotes irrigated cropland and α, β, ρ represent land quality weights for country i as listed in Table 1.
N = ∑(i=1)^27αi (Crain × Ri ) + ∑iβ_i(P × Ri ) + ∑iρi(Cirr × Ri)
Agricultural land data collected from the Land use dataset from the FAOSTAT Land, Inputs and Sustainability database are used for empirical analysis. The natural capital used in agriculture is the equivalent of the quality-adjusted utilised agricultural land. This way, the areas of crops (rainfed and irrigated only), meadows and pastures are evaluated according to their quality, with more weight given to irrigated crops and less to permanent meadows and pastures. The equivalent of the quality-adjusted utilised agricultural land has been calculated using FAOSTAT Land Use statistics.
2.4. Elasticities with Respects to Output
The EAMFP measurement (Equation 1) requires information on the elasticity with respect to undesirable outputs and their price [46]. According to Rodríguez et al. [13], the elasticity with respects to air pollution as undesirable output is defined as the change in output associated with an increase of pollution when input use remains constant. Net greenhouse gas emissions from agriculture as air pollutant output are included in the green growth accounting framework for agriculture.
The elasticities with respect to inputs, which are traded on markets and have clear prices, can be determined using the profit maximisation method used in green growth accounting framework for agriculture. The calculation of the monetary value of the net GHG emissions based on carbon emissions prices obtained from the EU Emissions Trading System (EU ETS). An elasticity with respects to net GHG emission can be expressed as: [13]:
where GHGnet denotes net GHG emission in agriculture (in monetary value), and GVA denotes agricultural gross value added.
εYGHGnet = GHGnet /(GVA+GHGnet)
2.5. Elasticities with Respects to Inputs
The EAMFP growth accounting requires information on the elasticity with respect to inputs of labour, produced capital and natural capital expressed in quality-adjusted utilised agricultural land area as given in Formula (1). The elasticities with respect to markets traded inputs can be computed using a profit-maximisation approach usually used in traditional multifactor productivity analyses. Under this approach, the elasticities of the transformation function are equal to the shares of labour, produced capital and natural capital in these input mix [13,48]. The main specificity of the profit-maximisation approach in the case of the EAMFP accounting framework for agriculture is that the calculation of the elasticities must rely not only on the implicit prices of purchased labour, produced capital and agricultural land but also on the opportunity costs of the same factors of production owned by the farm. Opportunity costs (otherwise implicit costs) of own production factors is the income or other benefit that the farm could obtain for the next best use of these factors instead of using them in agricultural production on the farm.
The elasticities measurement using both explicit and implicit costs of labour, produced capital, and natural capital (expressed in terms of the used agricultural land) and can be calculated as
where wL denotes the costs of paid and unpaid labour input; D denotes deprecation of fixed capital; C denotes intermediate consumption of working capital; i denotes the value of interest rate for rented and owned capital; uN denotes the costs of leased land and owned land; γ denotes total inputs costs.
εYL = wL / γ, εYK = (D+C+i) / γ, and εYN = uN / γ
The elasticities with respect to each input have been calculated using aggregated performance indicators of farms included in the FARM system. The data obtained from the FADN Public Database of the European Commission. are used to calculate elasticities with respect to each input.
3. Results
3.1. The Growth of GVA and Pollution-Adjusted GVA in Agriculture
Over the long term (2005-2021), most EU countries (twenty-two) have achieved positive real growth in agriculture from both economic growth and green growth perspectives, i.e. in terms of GVA growth and pollution-adjusted GVA growth respectively as indicated in Figure 3(a). The remaining five countries of the EU recorded negative trend of both indicators in the long term. However, the values of both indicators were close to zero in Greece and Cyprus, that means that GVA and net GHG emissions in agriculture have remained stable over time. The gap in agricultural growth between EU countries is narrower when growth is measured in terms of pollution-adjusted growth rather than real economic growth.
The adjustment of production output growth for pollution abatement measures the extent to which an economic growth is influenced by emission reduction efforts. A positive abatement adjustment indicates a decrease in pollution over the period, while a negative one indicates an increase [73]. In this study, the adjustment of GVA growth for pollution abatement measures the extent to which economic growth in agriculture industry is affected by efforts to reduce net GHG emissions from agricultural activities including efforts to increase CO2 absorption in grassland and pastures (Figure 3(b)). The agricultural GVA growth adjustment for pollution abatement is measured using the elasticity of GVA with respect to net GHG emissions from agriculture and the change in net GHG emissions. The elasticity value calculated for each country are presented in Appendix A1.
In fourteen EU countries that have reduced their net agricultural GHG emissions over time, the adjustment in GVA growth (i.e. the adjustment is positive) shows that efforts to reduce net GHG emissions have reduced the growth of agricultural gross value added, i.e. slowed down economic growth in this industry. For instance, in Slovakian, Romanian and Portuguese, agriculture industry, GVA grew at an average annual rate of 0.88%, 0.35% and 0.09%, respectively over the period analysed, while the pollution-adjusted GVA grew by 1.09%, 0.58% and 0.19% and respectively over the same period (Fig. 3(b), considering the efforts made by these countries in reducing their net GHG emissions. These adjustments have been influenced by technological changes in agricultural production (e.g. the shift to soil-friendly tillage methods, automated fertigation systems, etc.), by structural changes in farming (e.g. the shift to less GHG-intensive farming), and by the implementation of CAP agri-environment measures in EU countries as well. In the other eleven EU countries where efforts to reduce agricultural GHG emissions were relatively weak, the GVA adjustment was close to zero.
In contrast, in thirteen EU countries that have increased their GHG emissions from agriculture over the long term the adjustment of GVA growth, i.e., the adjustment is negative provides insights on the extent to which national income is generated at the expense of environmental quality. For instance, Bulgaria, Estonia, Slovenia and Latvia have seen their GHG emissions from agriculture increasing the most over the analysed period reducing pollution-adjusted GVA growth (i.e. green growth) by 0.21%, 0.40%, 0.12% and 0.10% points respectively (Fig. 3(b)). In countries where net GHG emissions from agriculture grew slowly over time, the GVA adjustment was close to zero, with indicates that economic growth in agriculture is decoupled from GHG emissions. An economic system that invests heavily in reducing pollution naturally faces the prospect of relatively less pollution-intensive long-term growth. Overall, as Rodríguez et al. [73] note, the economies that invest heavily in reduction of pollution naturally face the prospect of relatively less pollution-intensive long-term growth.
3.2. Contribution of Production Factors and EAMFP to Agricultural Green Growth
Table 2 presents data from an empirical analysis of green growth in agriculture over the long term (2005-2021), where pollution-adjusted GVA growth is decomposed into the contribution of individual production factors (labour, produced capital, and natural capital) and pollution-adjusted multifactor productivity. The results show significant differences between the EU countries.
During the analysed period, the contribution of EAMFP is particularly sizeable in two-thirds of the EU countries. Many of them relied more on technological progress than on traditional production factors (labour and produce capital) to promote green growth in agriculture. For instance, analysing the contribution of EAMFP to agricultural growth compared to the other growth components (see Table 2), it was found that productivity growth has more than compensated for the declining contribution of all three production factors (labour force, produced capital and nature capital) in the EU countries such as Slovakia, Italy, Denmark, Croatia, and Cyprus, and in almost a third of the EU countries (like Latvia, Czech Republic, Sweden, Lithuania, Romania, Austria, Poland, Germany) the EAMFP accounts for more than 50% of pollution-adjusted GVA growth on average.
Meanwhile, in the rest of the EU countries, produced capital is an important source of gross value-added growth in the agriculture industry. It plays a bigger role than labour or natural capital. During the analysed long period, fixed capital formation was the main source of agricultural growth and more than compensated for the declining contribution of other factors of production (labour and natural capital) to pollution-adjusted GVA growth in Finland, the Netherlands, Belgium, and Slovenia. It was also found that produced capital fuels a significant share of pollution-adjusted GDP growth in some other EU countries. For instance, more than 50% of agricultural green growth can be directly attributed to capital investment in Portugal, France, Malta, Netherlands, Greece, and Spain, while in Estonia and Luxembourg, this represents more than 80%.
In most EU countries, excluding Ireland and Malta, the gradually decreased labour input over the long period under consideration had a negative contribution to economic growth in agriculture and therefore needed to turn to other factors to fuel their economic growth. In the countries (e.g. Bulgaria, Slovakia, Romania, Estonia, and Latvia) where the agricultural labour force has shrunk the most over time (on average by -4.5% to -8.0% p.a.), the decline in labour input has had a significant negative impact on pollution-adjusted GDP growth (between -0.25% and -0.32% points). To offset the negative impact on agricultural growth due to reduced labour input, Slovakia and Latvia relied on EAMFP growth and technological progress, Bulgaria and Romania relied on both EAMFP growth and produce capital investment, while Estonia relied mainly on increasing investment in produce capital.
In contrast, Ireland and Malta increased labour use in agriculture over time. The slow growth in labour input did not significantly contribute to green agricultural growth in Ireland (i.e. increasing pollution-adjusted GVA growth by 0.01% point). Meanwhile, efforts to increase the use of labour force in agriculture played a significant role in stimulating economic growth in Maltese agriculture (i.e. increasing pollution-adjusted GDP growth by 0.36% points).
The natural capital, expressed in terms of quality-adjusted utilised agricultural land, has played a low-significance role in the agriculture growth in all EU countries. The contribution of natural capital to pollution-adjusted GVA growth is low compared to the contribution of produce capital and labour (see Table 2). This can be explained by the fact that EU countries have reached a stage where it is no longer possible to substantially increase the amount of land used for agriculture production due to natural constraints of land area, on the other hands, the land is being taken out of agricultural production due to the expansion of infrastructure and cities, afforestation, etc. Results show that in most EU countries, the average annual change of natural capital over the long term has been less than 1% either downwards or upwards, as countries increase or reduce their agricultural area. In Cyprus and Greece, the annual decrease in agricultural area was 1.9% and 1.3% respectively, while in Latvia the average increase was 1.3%. As a result, the contribution of natural capital to pollution-adjusted GVA growth in the agriculture industry was close to zero in all EU countries.
3.3. Comparison of EAMFP and MFP in Agriculture
The EAMFP estimates a country’s ability to generate production output from a given set of inputs including environment-related inputs and pollution as undesirable environment-related outputs [48]. Unlike the MFP measurement framework where the production output (produced goods and services) compares to combined production inputs (labour and produced capital), the EAMFP measurement framework clarifies the contribution of environmental pollution and natural capital to production output, i.e. adjustment from pollution abatement and natural capital use, respectively, and also clarifies the decreases contribution of traditional inputs (labour and produce capital) to production output [74].
Figure 4 presents MFP and EAMFP indicators in agriculture for each country in the EU. The value of the average annual growth rate of traditionally calculated MFP over a long period is higher than the value of the same EAMFP indicator in two-fifths of the EU countries. Meanwhile, the inverse difference between both indicators was found in one-quarter of the EU countries. The same values of both indicators MFP and EAMFP was found only in Ireland. The biggest positive value gap (0.09% point and more) between both MFP and EAMFP indicators was found in Estonia, Latvia, Bulgaria, and Slovenia while the biggest negative value gap (-0.09% point and more) between MFP and EAMFP was found in Romania.
Depending on the contribution of natural capital and the adjustment for air pollution emissions reduction, the traditional MFP could be overvalued or undervalued concerning the EAMFP [74], i.e. when MFP > EAMFP – the MFP growth was probably overestimated, and conversely, when MFP < EAMFP – the MFP growth was perhaps underestimated.
In this study, the traditionally calculated MFP indicator was likely to be overestimated in Estonian, Latvian, Bulgarian, and Slovenian agriculture due to unconsidered net GHG emissions. Conversely, the MFP indicator was likely to be underestimated in Romania, Slovakia, Luxembourg, and Portugal due to GHG emissions from agricultural reduction efforts, including efforts to increase CO2 absorption in grassland and pastures.
4. Discussion
Green growth is a complex issue and difficult to measure and compare [36]. In this study, the pollution-adjusted GVA accounting framework was developed to empirically measure and compare agricultural green growth across EU countries. The results of the empirical analysis revealed that most EU countries have achieved positive real green growth in the agriculture industry from both economic growth and green growth perspectives in the 2005–2021 period. Only three countries, namely Slovenia, Finland, and Malta, recorded a negative trend of both GVA growth and pollution-adjusted GVA growth, while the values of both indicators were close to zero in Greece and Cyprus. The gap in agricultural growth between EU countries is narrower when growth is measured in terms of pollution-adjusted growth rather than real economic growth. Kasztelan et al. [36] conducted an empirical analysis of green growth in agriculture in twenty-five EU countries five years ago and found significant differences between them. Unlike this study, the authors used an aggregate index calculated from a set of selected agricultural indicators in the agricultural green growth analysis.
The empirical results of this study show that slow changes in environmental pollution in the long term expressed in terms of net GHG emissions do not have a significant impact on pollution-adjusted GVA growth in the agriculture industry of all EU countries. In addition, the European Union's Common Agricultural Policy (CAP) aims at reducing environmental pollution from agricultural production to levels that are considered to be safe for human health and natural ecosystems [75]. The EU plays an important role in mitigating the impact of agriculture on climate change due to environmental standards in agriculture set by the EU, and since 2013, the fight against climate change has become one of the main objectives of the CAP. Although the European Commission attributed over €100 billion of CAP funds for the 2014-2020 period to tackle climate change [ibidem], as the results of this study show, net GHG emissions in almost half of the EU countries did not decrease over 2014-2021 period. One of the possible solutions to this problem is the involvement of the agricultural sector in the carbon trading system. Yu et al. [76] state that carbon trading has been widely recognized around the world as a core environmental management tool, to reduce the negative effects of various economies on the climate. The authors take the stance that the implementation of a carbon dioxide trading system in the agricultural sector can significantly promote the improvement of green total factor productivity in agriculture in China. In the near future, the EU will establish a Union certification framework for carbon removal, carbon farming, and permanent carbon storage in products, which aims at facilitation and acceleration of the carbon removal activity and reduction of GHG emissions from the soil in agriculture [77]. Once operational, this certification framework should encourage farmers to carbon capture in soil and reduce net GHG emissions from agriculture, thus contributing to the green growth of agriculture.
This study shows that the pollution-adjusted GVA growth in agriculture is based on technological progress in most of the EU countries. This conclusion is supported by other studies that have found that increasing technological innovation capacity has a statistically significant positive effect on changes in green growth in agriculture, with both direct and indirect positive effects [78]. Moreover, green growth in agriculture is improved by green technology innovation i.e. digital transformation of agriculture [79,80]. Huang et al. [81] state that energy conservation and emission reduction are the primary drivers of EAMFP, accounting for more than half of the agricultural green total factor productivity in China. The empirical results of this study show that the agricultural EAMFP growth has more than compensated for the declining contribution of the labour force, produced capital and nature capital in Slovakia, Italy, Denmark, Croatia, and Cyprus and accounts for more than 50% of pollution-adjusted GVA growth on average in almost a third of EU countries. This study revealed that the contribution of natural capital (expressed as quality-adjusted agricultural land in use), to agricultural green growth was close to zero in most EU countries due to the amount of utilised agricultural area has remained stable for a long time (bearing in mind very small annual changes rate either downwards or upwards). Hamilton et al. [82] hold the view that the natural capital contribution to productivity growth is particularly significant in resource-dependent countries.
Since the quantity of agricultural land is more or less constant in most of the EU countries, the contribution of natural capital to pollution-adjusted GVA growth would be increased in the way of extended area equipped for irrigation or investments in new more efficient irrigation technologies. This conclusion is supported by other studies [64,71], which argued that an increase in irrigated land area has a positive effect on output growth. Irrigation helps to protect crops from irregular rainfall and increase their vitality, yield and quality [75] and is or can be as an instrument to reduce drought risk in agriculture production in various EU regions (specially in arid and semi-arid areas of southern Europe, e.g. Spain, Portugal, Italy, Greece and southern France, in which irrigation allows crop production where water would otherwise be a limiting factor, and in more humid and temperate areas e.g. Denmark, Belgium, the Netherlands, Luxembourg, north and central France, Germany, southern Sweden, and eastern Austria), in which irrigation provides a way of regulating the seasonal availability of water to match agricultural needs [83]).
The contribution of labour to pollution-adjusted GVA growth suggests that all EU (except Malta and Ireland) countries have a labour input decrease during the period 2005–2021, therefore needed to turn to other factors to fuel their economic growth. For instance, some of EU countries relied on EAMFP growth and technological progress (e.g. Slovakia and Latvia) to offset the negative labour input impact on agricultural growth, other countries relied on EAMFP growth and produce capital investment (e.g. Bulgaria and Romania), rest of countries relied on increasing investment in produce capital (e.g. more than 80% in Estonia). These findings are supported by other studies [84,85,86], which point out that the decline in labour force growth over time has been accompanied by farmers’ ageing and workers’ migration at the same time by the growth of productivity.
5. Conclusions and Research Limitations
5.1. Conclusions
For the empirical analysis of agricultural green growth in each individual EU country, this study develops a pollution-adjusted GVA growth accounting framework for agriculture builds on the environmentally adjusted multifactor productivity (EAMFP) measure that used as the OECD green growth headline indicator at the macroeconomic, i.e. country level. The study sample is EU27 countries over 2005–2021. The framework allows accounting for the natural capital (quality-adjusted utilised agricultural land) and greenhouse gas emissions (positive or negative carbon dioxide per year in terms of emission/removals from agriculture). The findings indicate that long-run pollution-adjusted GVA growth rates differ between EU27 countries. The key difference in the overall growth performance is due to the extent to which they rely on increased productivity gains or better use of factor inputs.
We found that more than two thirds of the EU countries increasingly relied on technological progress (i.e. growth in EAMFP) rather than on traditional production factors (growth in labour and produce capital) to the aim to increase GVA in agriculture. Meanwhile, in the rest of the EU countries, the produced capital is an important source for gross value-added growth in the agriculture industry and plays a bigger role than labour or natural capital. Furthermore, Ireland and Malta are the countries where agricultural labour contributes to increase GVA growth in agriculture. On the contrary, in the remaining countries the contribution of labour reducing GVA growth in agriculture. The natural capital, expressed in terms of quality-adjusted utilised agricultural land, has played a low-significance role in the agriculture growth in all EU countries.
5.2. Research Limitations
The present study has some limitations, mainly related to the narrowed expression of the natural capital. Some research [13,46,47,48,82,87] limits the scope of natural capital to traded natural commodities or land because of the lack of necessary information on all natural capital assets (such as stock, flow and price information). Recent Rodríguez et al. [73] study involves the use of renewable natural capital, non-cultivated biological resources and ecosystem services at the macroeconomic level. In this study, natural capital is expressed in quality-adjusted land input. Second, the elasticities with respect to the inputs is based on the FADN data of commercial farms with an economic size of at least €4000 of standard output. Thirdly, the elasticity with respect to undesirable outputs is estimated by their carbon emissions prices obtained from the EU ETS. These prices reached up to €26 per CO2 -equivalent till 2020 and increased more than twice in later. Therefore, the factor of environmental pollution might have had greater impact on the agricultural green growth analysis in future. Despite the limitations mentioned above, this study will significantly contribute to improving the green growth accounting system in agriculture and the results of the empirical analysis will be used by policy makers and economists. In addition, based on the results of the empirical analysis, decision-makers will be able to identify the areas for improvement so that all EU countries can fully embark on the path of green agricultural growth.
Author Contributions
Conceptualization, V.V. and L.L.; methodology, V.V. and L.L; software, L.L.; validation, L.L.; formal analysis, V.V. and L.L; investigation, V.V. and L.L.; resources, V.V. and L.L, data curation, L.L.; writing—original draft preparation V.V. and L.L.; writing—review and editing, V.V.; visualization, V.V. and L.L; supervision, V.V. Both authors have read and agreed to the published version of the manuscript.
Funding
This research received no external funding.
Data Availability Statement
All data used in this paper were collected from the EUROSTAT Economic Accounts for Agriculture dataset and Statistics on the agricultural environment dataset, FADN Public Database of the European Commission, EU Emissions Trading System, FAOSTAT Land Use and Capital Stock Database. The original contributions presented in this study are included in the article, further inquiries can be directed to the corresponding author.
Conflicts of Interest
The authors declare no conflicts of interest.
Appendix A

Table A1.
Elasticities with respect to inputs and outputs, 2005-2021.
| Input | Output | |||
|---|---|---|---|---|
| Labour | Produced capital | Natural capital | GHGnet emission | |
| Belgium | 0.169 | 0.777 | 0.054 | 0.072 |
| Bulgaria | 0.197 | 0.677 | 0.126 | 0.038 |
| Czechia | 0.209 | 0.748 | 0.043 | 0.089 |
| Denmark | 0.144 | 0.738 | 0.119 | 0.103 |
| Germany | 0.188 | 0.728 | 0.084 | 0.096 |
| Estonia | 0.201 | 0.769 | 0.029 | 0.128 |
| Ireland | 0.205 | 0.692 | 0.103 | 0.174 |
| Greece | 0.277 | 0.662 | 0.061 | 0.018 |
| Spain | 0.303 | 0.628 | 0.069 | 0.020 |
| France | 0.207 | 0.723 | 0.070 | 0.044 |
| Croatia | 0.306 | 0.663 | 0.031 | 0.040 |
| Italy | 0.317 | 0.624 | 0.049 | 0.016 |
| Cyprus | 0.231 | 0.735 | 0.034 | 0.019 |
| Latvia | 0.214 | 0.760 | 0.026 | 0.218 |
| Lithuania | 0.246 | 0.709 | 0.045 | 0.084 |
| Luxembourg | 0.159 | 0.772 | 0.069 | 0.093 |
| Hungary | 0.178 | 0.758 | 0.064 | 0.033 |
| Malta | 0.309 | 0.686 | 0.005 | 0.024 |
| Netherlands | 0.172 | 0.763 | 0.065 | 0.040 |
| Austria | 0.247 | 0.684 | 0.069 | 0.044 |
| Poland | 0.261 | 0.707 | 0.032 | 0.057 |
| Portugal | 0.342 | 0.595 | 0.063 | 0.026 |
| Romania | 0.320 | 0.625 | 0.056 | 0.023 |
| Slovenia | 0.260 | 0.719 | 0.022 | 0.049 |
| Slovakia | 0.189 | 0.777 | 0.034 | 0.045 |
| Finland | 0.192 | 0.729 | 0.079 | 0.181 |
| Sweden | 0.208 | 0.714 | 0.024 | 0.087 |
Notes: for calculating elasticities with respect to inputs – Bulgaria, Romania (EU member since 2007) and Croatia (EU member since 2013) data is multiplied till 2005. Source: Own calculations based on FADN, Eurostat and Investing.com (2024) data (Investing.com. 2024. Carbon emissions future. https://www.investing.com/commodities/carbon-emissions-historical-data.)
References
- Ali, S.H.; Puppim de Oliveira, J.A. Pollution and economic development: an empirical research review. Environmental Research Letters 2018, 13, 123003. [Google Scholar] [CrossRef]
- Anik, A.R.; Rahman, S.; Sarker, J.R. Agricultural productivity growth and the role of capital in South Asia (1980–2013). Sustainability 2017, 9, 470. [Google Scholar] [CrossRef]
- Tubiello, F.N.; Rosenzweig, C.; Conchedda, G.; Karl, K.; Gütschow, J.; Xueyao, P. ... Sandalow, D. Greenhouse gas emissions from food systems: building the evidence base. Environmental Research Letters 2021, 16, 065007. [Google Scholar] [CrossRef]
- Tan, D.; Adedoyin, F.F.; Alvarado, R.; Ramzan, M.; Kayesh, M.S.; Shah, M.I. The effects of environmental degradation on agriculture: Evidence from European countries. Gondwana Research 2022, 106, 92–104. [Google Scholar] [CrossRef]
- Lv, X.; Lu, X.; Fu, G.; Wu, C. A spatial-temporal approach to evaluate the dynamic evolution of green growth in China. Sustainability 2018, 10, 2341. [Google Scholar] [CrossRef]
- Zhu, H.; Yang, L.; Xu, C.; Fu, T.; Lin, J. Exploring the nonlinear association between agri-environmental regulation and green growth: The mediating effect of agricultural production methods. Journal of Cleaner Production 2024, 141138. [Google Scholar] [CrossRef]
- Hickel, J.; Kallis, G. Is green growth possible? New political economy 2019, 25, 469–486. [Google Scholar] [CrossRef]
- Adamowicz, M. Green deal, green growth and green economy as a means of support for attaining the sustainable development goals. Sustainability 2022, 14, 5901. [Google Scholar] [CrossRef]
- European Commission. (2020). Communication from the Commission to the European Parliament, the Council, the European economic and social committee and the committee of the regions. Stepping up Europe’s 2030 climate ambition. Investing in a climate-neutral future for the benefit of our people. COM (2020) 562 final, Brussels, 17.9.2020. Available online: https://eur-lex.europa.eu/legal-content/EN/TXT/PDF/?uri=CELEX:52020DC0562 (accessed on 8 March 2022).
- Liu, L.; Yang, Y.; Liu, S.; Gong, X.; Zhao, Y.; Jin, R. ... Jiang, P. A comparative study of green growth efficiency in Yangtze River Economic Belt and Yellow River Basin between 2010 and 2020. Ecological Indicators 2023, 150, 110214. [Google Scholar] [CrossRef]
- Bowen, A.; Hepburn, C. Green growth: an assessment. Oxford Review of Economic Policy 2014, 30, 407–422. [Google Scholar] [CrossRef]
- Antal, M.; Van Den Bergh, J.C. Green growth and climate change: conceptual and empirical considerations. Climate policy 2016, 16, 165–177. [Google Scholar] [CrossRef]
- Rodríguez, M.C.; Haščič, I.; Souchier, M. Environmentally adjusted multifactor productivity: methodology and empirical results for OECD and G20 countries. Ecological economics 2018, 153, 147–160. [Google Scholar] [CrossRef]
- Capasso, M.; Hansen, T.; Heiberg, J.; Klitkou, A.; Steen, M. Green growth–A synthesis of scientific findings. Technological Forecasting and Social Change 2019, 146, 390–402. [Google Scholar] [CrossRef]
- Dogaru, L. Green economy and green growth—Opportunities for sustain-able development. In Proceedings 2021, Vol. 63, No. 1, p. 70. MDPI.
- Brad, S.; Mocan, B.; Brad, E.; Fulea, M. Environmentally sustainable economic growth. Amfiteatru Economic Journal 2016, 18, 446–460. [Google Scholar]
- Chung, R.K.; Lee, H.H. Towards environmentally sustainable economic growth (green growth) in Asia and the Pacific. Prepared for the State of the Environment in Asia and the Pacific 2005, 30. Available online: https://www.apeaweb.org/confer/hito05/papers/chung_lee.pdf (accessed on 8 March 2022).
- Saufi, N.A.A.; Daud, S.; Hassan, H. Green growth and corporate sustainability performance. Procedia Economics and Finance 2016, 35, 374–378. [Google Scholar] [CrossRef]
- Kim, S.E.; Kim, H.; Chae, Y. A new approach to measuring green growth: Application to the OECD and Korea. Futures 2014, 63, 37–48. [Google Scholar] [CrossRef]
- Rubio, S.J.; Aznar, J. Sustainable growth and environmental policies. Nota di Lavoro 2000. Available online: https://www.econstor.eu/handle/10419/155079 (accessed on 8 March 2022).
- Sawyer, M. Financialization, financial systems and sustainable development. In the Economic Crisis in Social and Institutional Context, 42-54. Routledge. 2015.
- Bouma, J.; Berkhout, E. Inclusive green growth. PBL Netherlands Environmental Assessment Agency. PBL publication 2015, 17, 8. [Google Scholar]
- Narloch, U.; Kozluk, T.; Lloyd, A. Measuring Inclusive Green Growth at the Country Level. Taking Stock of Measurement Approaches and Indicators. GGKP Research Committee on Measurement & Indicators, 87. www. Green-growth knowledge, 2016. Available online: Org/sites/default/files/downloads/resource/Measuring_Inclusive_Green_Growth_at_the_Country_Level.Pdf (accessed on 8 March 2022).
- Li, M.; Zhang, Y.; Fan, Z.; Chen, H. Evaluation and research on the level of inclusive green growth in Asia-Pacific region. Sustainability 2021, 13, 7482. [Google Scholar] [CrossRef]
- Tilsted, J.P.; Bjørn, A.; Majeau-Bettez, G.; Lund, J.F. Accounting matters: Revisiting claims of decoupling and genuine green growth in Nordic countries. Ecological Economics 2021, 187, 107101. [Google Scholar] [CrossRef]
- Bruckmeier, K.; Bruckmeier, K. Ecological Economics: Critical Perspectives. Economics and Sustainability: Social-Ecological Perspectives 2020, 239-292.
- Bowen, A.; Fankhauser, S.; Best, S. Low-carbon development for least developed countries. Oxfam Policy and Practice: Climate Change and Resilience 2011, 7, 33–56. [Google Scholar]
- Al-Amin, A.Q.; Filho, W.L. Towards long-term climate change mitigation: the role of low-carbon growth planning. International Journal of Global Warming 2012, 4, 81–90. [Google Scholar] [CrossRef]
- Zachmann, G. An approach to identify the sources of low-carbon growth for Europe (Vol. 16). Bruegel. 2016. Available online: https://www.jstor.org/stable/resrep28621 (accessed on 8 March 2022).
- Schapper, A.; Hoffmann, C.; Lee, P. Procedural rights for nature–a pathway to sustainable decarbonisation? Third World Quarterly 2022, 43, 1197–1216. [Google Scholar] [CrossRef]
- OECD. Food and Agriculture, OECD Green Growth Studies, OECD Publishing. 2012. [CrossRef]
- Kasztelan, A. Green growth, green economy and sustainable development: terminological and relational discourse. Prague Economic Papers 2017, 26, 487–499. [Google Scholar] [CrossRef]
- OECD. Policy Instruments to Support Green Growth in Agriculture, OECD Green Growth Studies, OECD Publishing. 2013. [CrossRef]
- OECD. Green Growth Indicators for Agriculture: A Preliminary Assessment, OECD Green Growth Studies, OECD Publishing. Paris. 2014. [CrossRef]
- Kasztelan, A.; Nowak, A. Green growth in agriculture―New measurement concept and its empirical verification. Sustainable Development 2024, 32, 325–335. [Google Scholar] [CrossRef]
- Kasztelan, A.; Nowak, A.; Hawlena, J. Green growth in agriculture in the European Union: myth or reality? European Research Studies Journal 2019, 22, 35–48. [Google Scholar] [CrossRef]
- Obst, C.; Eigenraam, M. Incorporating the environment in agricultural productivity: applying advances in international environmental accounting. In New Directions in Productivity Measurement and Efficiency Analysis (pp. 151-172), Edward Elgar Publishing, 2017. [Google Scholar] [CrossRef]
- Agarwala, M.; Martin, J. Environmentally-adjusted productivity measures for the UK. The Productivity Institute Working Paper No.028, November 2022. [CrossRef]
- Xu, X.; Huang, X.; Huang, J.; Gao, X.; Chen, L. Spatial-temporal characteristics of agriculture green total factor productivity in China, 1998–2016: based on more sophisticated calculations of carbon emissions. International journal of environmental research and public health 2019, 16, 3932. [Google Scholar] [CrossRef]
- Fang, L.; Hu, R.; Mao, H.; Chen, S. How crop insurance influences agricultural green total factor productivity: Evidence from Chinese farmers. Journal of Cleaner Production 2021, 321, 128977. [Google Scholar] [CrossRef]
- Zhong, S.; Li, Y.; Li, J.; Yang, H. Measurement of total factor productivity of green agriculture in China: Analysis of the regional differences based on China. PLoS One 2021, 16, e0257239. [Google Scholar] [CrossRef]
- Zhao, S.; Chancellor, W.; Jackson, T.; Boult, C. Productivity as a measure of performance: ABARES perspective. Farm Policy J 2021, 18, 4–14. [Google Scholar]
- Colucci, D.; Coli, A. Total Factor Productivity Growth in Agriculture, Adjusted for Greenhouse Gas Emissions: Trends in Developed and Developing Countries between 1992-2016. 2023. [CrossRef]
- OECD. Towards green growth: monitoring progress. OECD indicators. 2011. Available online: https://seea.un.org/sites/seea.un.org/files/11_17.pdf (accessed on 9 November 2024).
- OECD. Fostering Green Growth in Agriculture: The Role of Training, Advisory Services and Extension Initiatives, OECD Green Growth Studies, OECD. 2015. [CrossRef]
- Brandt, N.; Schreyer, P.; Zipperer, V. Brandt, N.; Schreyer, P.; Zipperer, V. Productivity measurement with natural capital and bad outputs. OECD Economics Department Working Papers 2014. No. 1154. OECD Publishing, Paris.
- Brandt, N.; Schreyer, P.; Zipperer, V. Productivity measurement with natural capital. OECD Economics Department Working Papers 2013, No. 1092. OECD Publishing, Paris. [Google Scholar] [CrossRef]
- Rodríguez, M.C.; Haščič, I.; Souchier, M. Environmentally Adjusted Multifactor Productivity: Methodology and Empirical Results for OECD and G20 Countries. OECD Green Growth Papers 2016, No. 2018/02, OECD Publishing, Paris.
- You, S.; Yan, H. A new approach in modelling undesirable output in DEA model. Journal of the Operational Research Society 2011, 62, 2146–2156. [Google Scholar] [CrossRef]
- Kao, C.; Hwang, S.N. Measuring the effects of undesirable outputs on the efficiency of production units. European journal of operational research 2021, 292, 996–1003. [Google Scholar] [CrossRef]
- Baráth, L.; Fertő, I. Accounting for TFP Growth in Global Agriculture-a Common-Factor-Approach-Based TFP Estimation. AGRIS on-line Papers in Economics and Informatics 2020, 10(665-2021-548), 3-13.
- Han, H.; Zhong, Z.; Wen, C.; Sun, H. Agricultural environmental total factor productivity in China under technological het-erogeneity: characteristics and determinants. Environmental Science and Pollution Research 2018, 25, 32096–32111. [Google Scholar] [CrossRef] [PubMed]
- Staniszewski, J. Attempting to measure sustainable intensification of agriculture in countries of the European Union. Journal of Environmental Protection and Ecology 2018, 19, 949–957. [Google Scholar]
- Wu, H.; Huang, H.; Tang, J.; Chen, W.; He, Y. Net greenhouse gas emissions from agriculture in China: Estimation, spatial correlation and convergence. Sustainability 2019, 11, 4817. [Google Scholar] [CrossRef]
- Dakpo, K.H.; Lansink, A.O. Dynamic pollution-adjusted inefficiency under the by-production of bad outputs. European Journal of Operational Research 2019, 276, 202–211. [Google Scholar] [CrossRef]
- Lewis, M.A. Non-Point Source Pollution. Presented at Urban Stormwater County Task Force Meeting, Pensacola Junior College Media Center 1999, Pensacola, FL. 319 Information and Education Project.
- Cason, T.N.; Gangadharan, L.; Duke, C. A laboratory study of auctions for reducing non-point source pollution. Journal of environmental economics and management 2003, 46, 446–471. [Google Scholar] [CrossRef]
- Meyer-Aurich, A.; Weersink, A.; Janovicek, K.; Deen, B. Cost efficient rotation and tillage options to sequester carbon and mitigate GHG emissions from agriculture in Eastern Canada. Agriculture, ecosystems & environment 2006, 117(2-3), 119 127.
- Wagner-Riddle, C.; Weersink, A. Net agricultural greenhouse gases: Mitigation strategies and implications. Sustaining soil productivity in response to global climate change: Science, policy, and ethics 2011, 169-182.
- Baah-Acheamfour, M.; Carlyle, C.N.; Lim, S.S.; Bork, E.W.; Chang, S.X. Forest and grassland cover types reduce net greenhouse gas emissions from agricultural soils. Science of the total Environment 2016, 571, 1115–1127. [Google Scholar] [CrossRef]
- Grewer, U.; Nash, J.; Gurwick, N.; Bockel, L.; Galford, G.; Richards, M.; ... Wollenberg, E. Analyzing the greenhouse gas impact potential of smallholder development actions across a global food security program. Environmental Research Letters 2018, 13, 044003. [CrossRef]
- Bai, Y.; Guo, C.; Li, S.; Degen, A.A.; Ahmad, A.A.; Wang, W.; ... Shang, Z. Instability of decoupling livestock greenhouse gas emissions from economic growth in livestock products in the Tibetan highland. Journal of Environmental Management 2021, 287, 112334. [CrossRef]
- Hasukawa, H.; Inoda, Y.; Toritsuka, S.; Sudo, S.; Oura, N.; Sano, T.; ... Yanai, J. Effect of paddy-upland rotation system on the net greenhouse gas balance as the sum of methane and nitrous oxide emissions and soil carbon storage: A case in western Japan. Agriculture 2021, 11, 52. [CrossRef]
- Fuglie, K. Accounting for growth in global agriculture. Bio-based and applied economics 2015, 4, 201–234. [Google Scholar]
- European Union. Regulation (EC) No 138/2004 of the European Parliament and of the Council of 5 December 2003 on the economic accounts for agriculture in the Community. 2004. Available online: https://eur-lex.europa.eu/legal-content/EN/TXT/PDF/ ?uri=CELEX:3 2004R0138&qid=1676970489643&from=EN (accessed on 29 October 2024).
- Vander Donckt, M.; Chan, P.; Silvestrini, A. A new global database on agriculture investment and capital stock. Food Policy 2021, 100, 101961. [Google Scholar] [CrossRef]
- Vander Donckt, M.; Chan, P. The new FAO global database on agriculture investment and capital stock. Food and Agriculture Organization of the United Nations. FAO Statistics Working Paper Series / 19-16. 2019. ISBN 978-92-5-5-131819-5.
- FAO. Agricultural investment and capital stock. FAOSTAT Analytical Brief Series No. 7, 2020, Rome.
- Ascui, F.; Cojoianu, T. Natural capital credit risk assessment in agricultural lending: an approach based on the natural capital protocol. Natural Capital Finance Alliance: Oxford, UK. 2019.
- Barbier, E.B. The concept of natural capital. Oxford Review of Economic Policy 2019, 35, 14–36. [Google Scholar] [CrossRef]
- USDA. International Agricultural Productivity: Documentation and Methods 2021. Available online: https://www.ers.usda.gov/data-products/international-agricultural-productivity/documentation-and-methods/ (accessed on 8 March 2022).
- Cheba, K.; Bąk, I. Environmental production efficiency in the European Union countries as a tool for the implementation of goal 7 of the 2030 agenda. Energies 2021, 14, 4593. [Google Scholar] [CrossRef]
- Rodríguez, C.M.; Mante, F.; Haščič, I.; Rojas Lleras, A. “Environmentally adjusted multifactor productivity: Accounting for renewable natural resources and ecosystem services”, OECD Green Growth Papers, 2023-01, OECD Publishing, Paris. Available online: https://www.oecd-ilibrary.org/content/paper/9096211d-en (accessed on 11 November 2024).
- Rodríguez, CM.; Haščič, I.; Souchier, M.; "Environmentally Adjusted Multifactor Productivity: Methodology and Empirical Results for OECD and G20 Countries", OECD Green Growth Papers, No. 2018/02, OECD Publishing, Paris. 2018. Available online: https://www.oecd-ilibrary.org/environment/environmentally-adjusted-multifac,tor-productivity_fdd40cbd-en (accessed on 11 November 2024).
- European Court of Auditors. Common Agricultural Policy and climate. Half of EU climate spending but farm emissions are not decreasing. Special Report, No 16. 2021. Available online: https://www.eca.europa.eu/Lists/ECADocuments/SR21_16/SR_CAP-and-Climate_EN.pdf (accessed on 9 November 2024).
- Yu, D.; Liu, L.; Gao, S.; Yuan, S.; Shen, Q.; Chen, H. Impact of carbon trading on agricultural green total factor productivity in China. Journal of Cleaner Production 2022, 367, 132789. [Google Scholar] [CrossRef]
- European Parliament and the Council of the European Union. Proposal for a Regulation of the European Parliament and of the Council establishing a Union certification framework for carbon removals. COM(2022) 672 final, Brussels, 30.11.2022. Available online: https://eur-lex.europa.eu/legal-content/EN/TXT/?uri=CELEX%3A52022PC0672 (accessed on 9 November 2024).
- Li, Z.; Jin, M.; Cheng, J. Economic growth of green agriculture and its influencing factors in China: Based on emergy theory and spatial econometric model. Environment, Development and Sustainability 2021, 23, 15494–15512. [Google Scholar] [CrossRef]
- Shen, Z.; Hong, T.; Blancard, S.; Bai, K. Digital financial inclusion and green growth: analysis of Chinese agriculture. Applied Economics 2024, 56, 5555–5573. [Google Scholar] [CrossRef]
- Ren, X.; He, J.; Huang, Z. Innovation, natural resources abundance, climate change and green growth in agriculture. Resources Policy 2023, 85, 103970. [Google Scholar] [CrossRef]
- Huang, X.; Feng, C.; Qin, J.; Wang, X.; Zhang, T. Measuring China’s agricultural green total factor productivity and its drivers during 1998–2019. Science of the Total Environment 2022, 829, 154477. [Google Scholar] [CrossRef]
- Hamilton, K.; Naikal, E.G.; Lange, G.M. Natural Resources and Total Factor Productivity Growth in Developing Countries: Testing A New Methodology. World Bank Policy Research Working Paper, (8704), 2019. Available online: https://ssrn.com/abstract=3317210 (accessed on 8 March 2024).
- Baldock, D.; Caraveli, H.; Dwyer, J.; Dwyer, J.; Einschütz, S.; Petersen, J.E.; Sumpsi-Vinas, J.; Varela-Ortega, C. The Environmental Impact of Irrigation in the European Union. A Report to the Environment Directorate of the European Commission. March, 2000. Available online: https://bisses-valais.ch/app/uploads/2020/06/Dwyer-Janet-The-environmental-impacts-of-irrigation-in-the-European-Union.pdf (accessed on 8 November 2024).
- Popescu, A.; Tindeche, C.; Marcuță, A.; Marcuță, L.; Honțuș, A.; Angelescu, C. Labor force in the European Union agriculture. Traits and tendencies. Economic analysis 2021, 20, 27, E-ISSN 2285-3952. [Google Scholar]
- Megyesiova, S. Production, employment and productivity of agricultural sector in the European Union. Bulgarian Journal of Agricultural Science 2021, 27, 846–858. [Google Scholar]
- Rodríguez-Pose, A.; Ganau, R. Institutions and the productivity challenge for European regions. Journal of Economic Geography 2022, 22, 1–25. [Google Scholar] [CrossRef]
- Bureau, J.C.; Antón, J. Agricultural Total Factor Productivity and the environment: A guide to emerging best practices in measurement. OECD Food, Agriculture and Fisheries Papers, 2022. No. 177. OECD Publishing. Paris.
Figure 1.
Agricultural pollution sources.
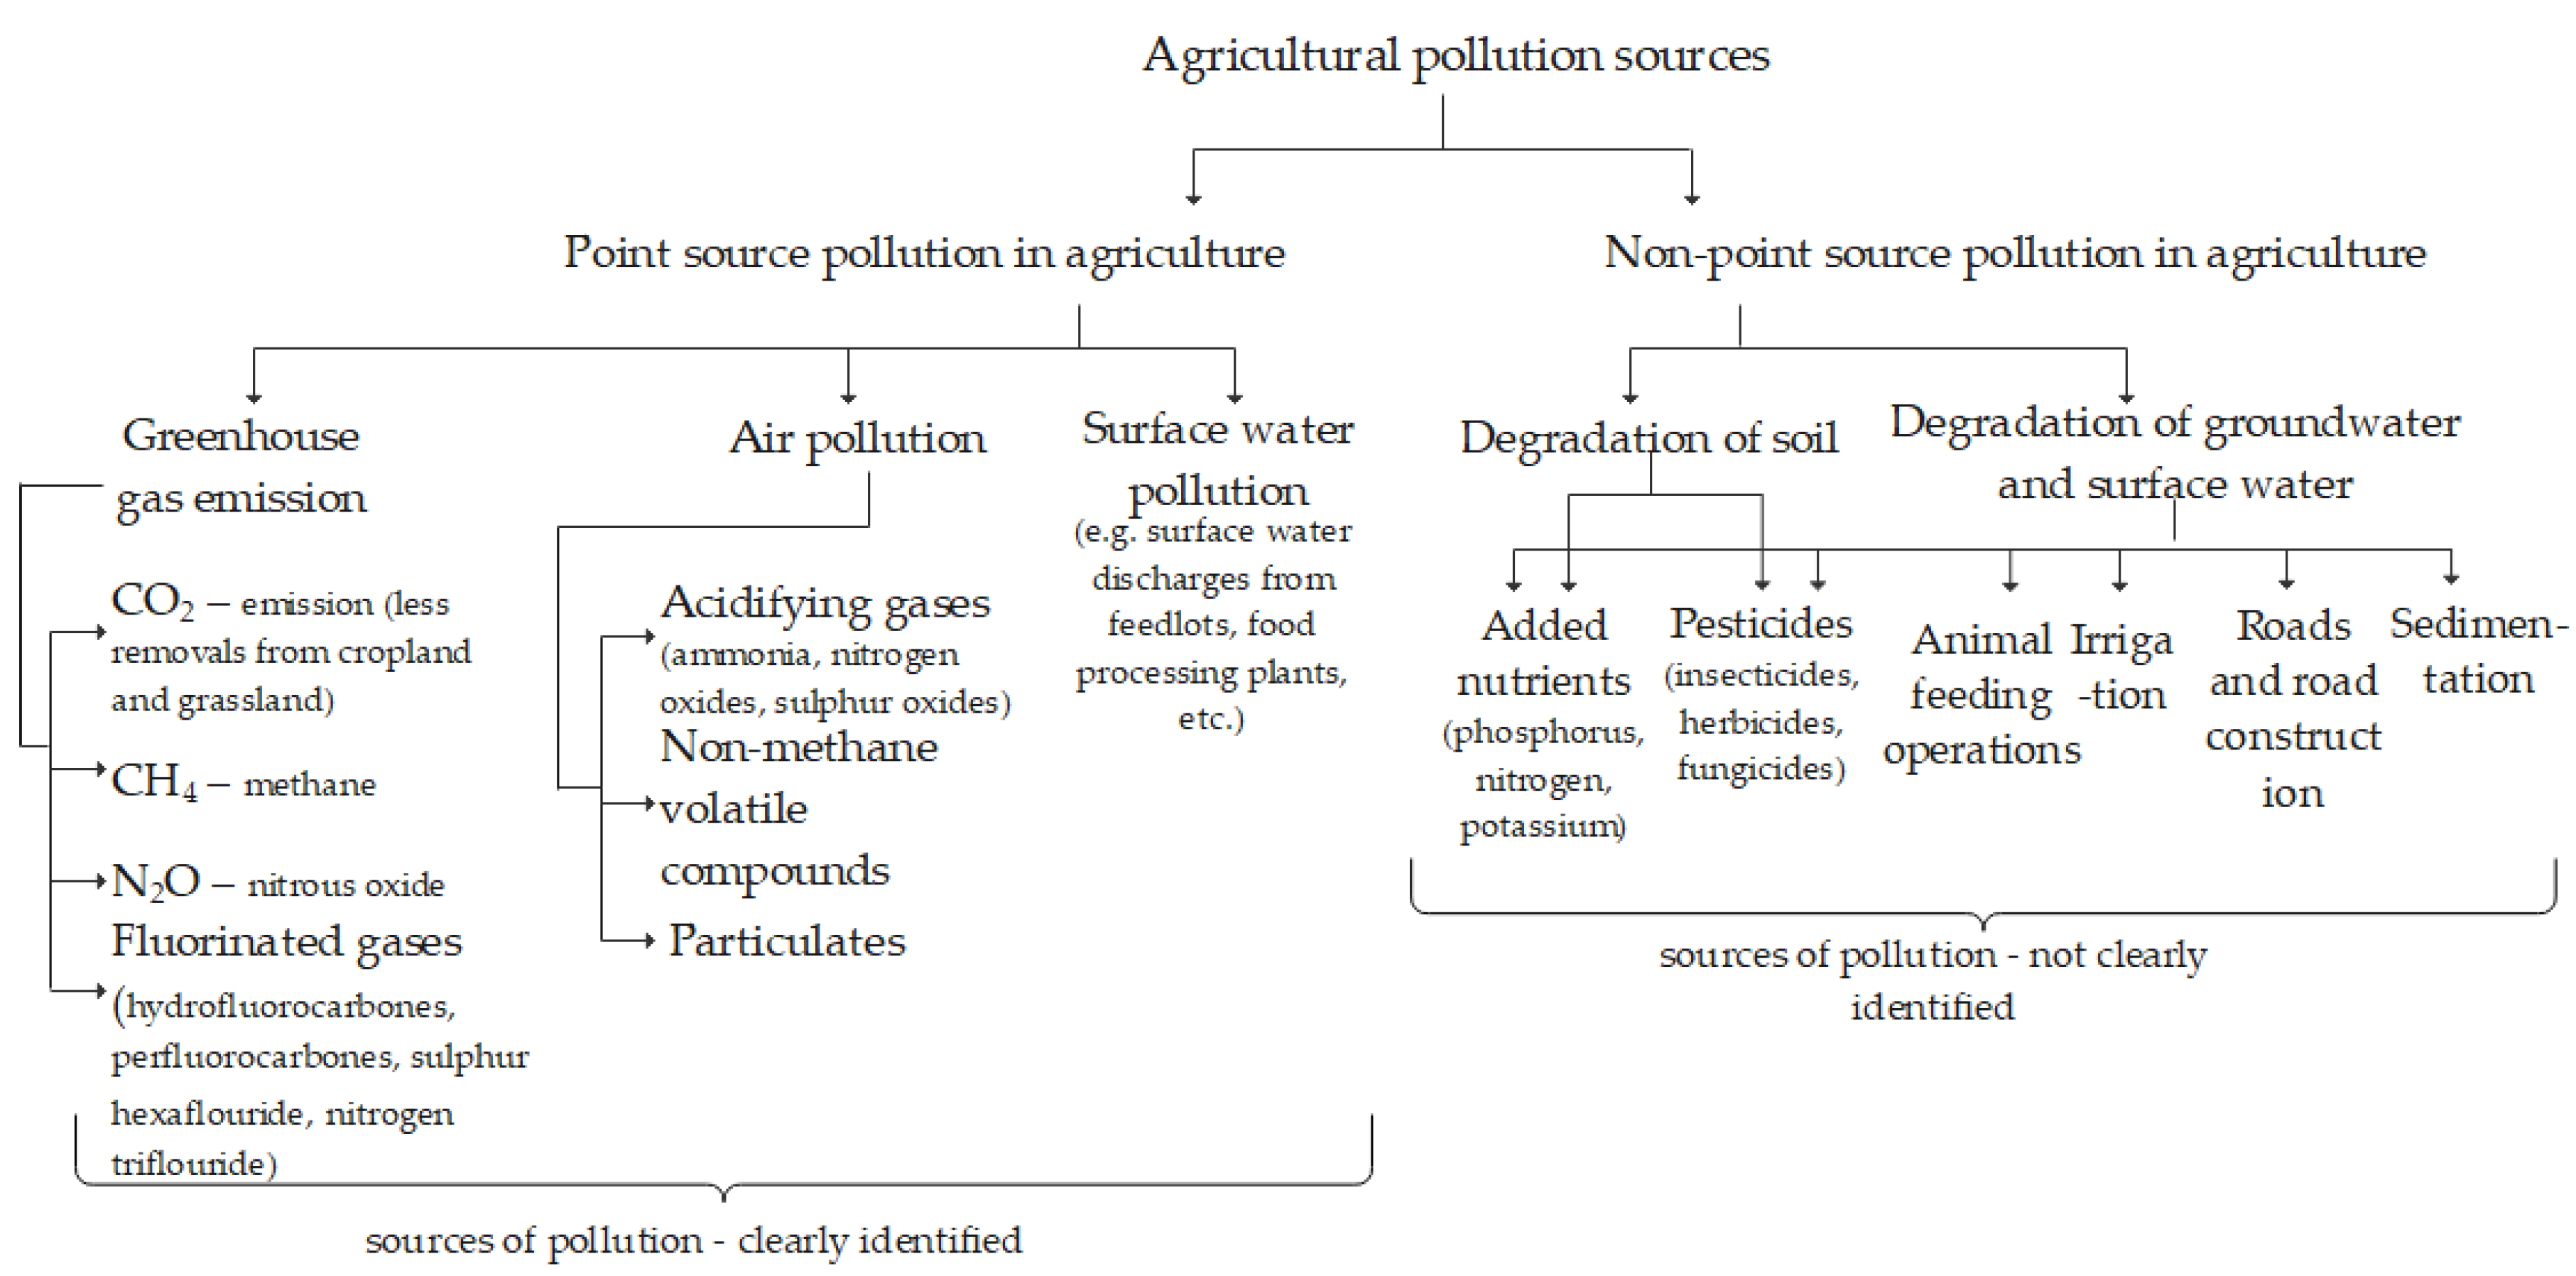
Figure 2.
The factors of production in agriculture.
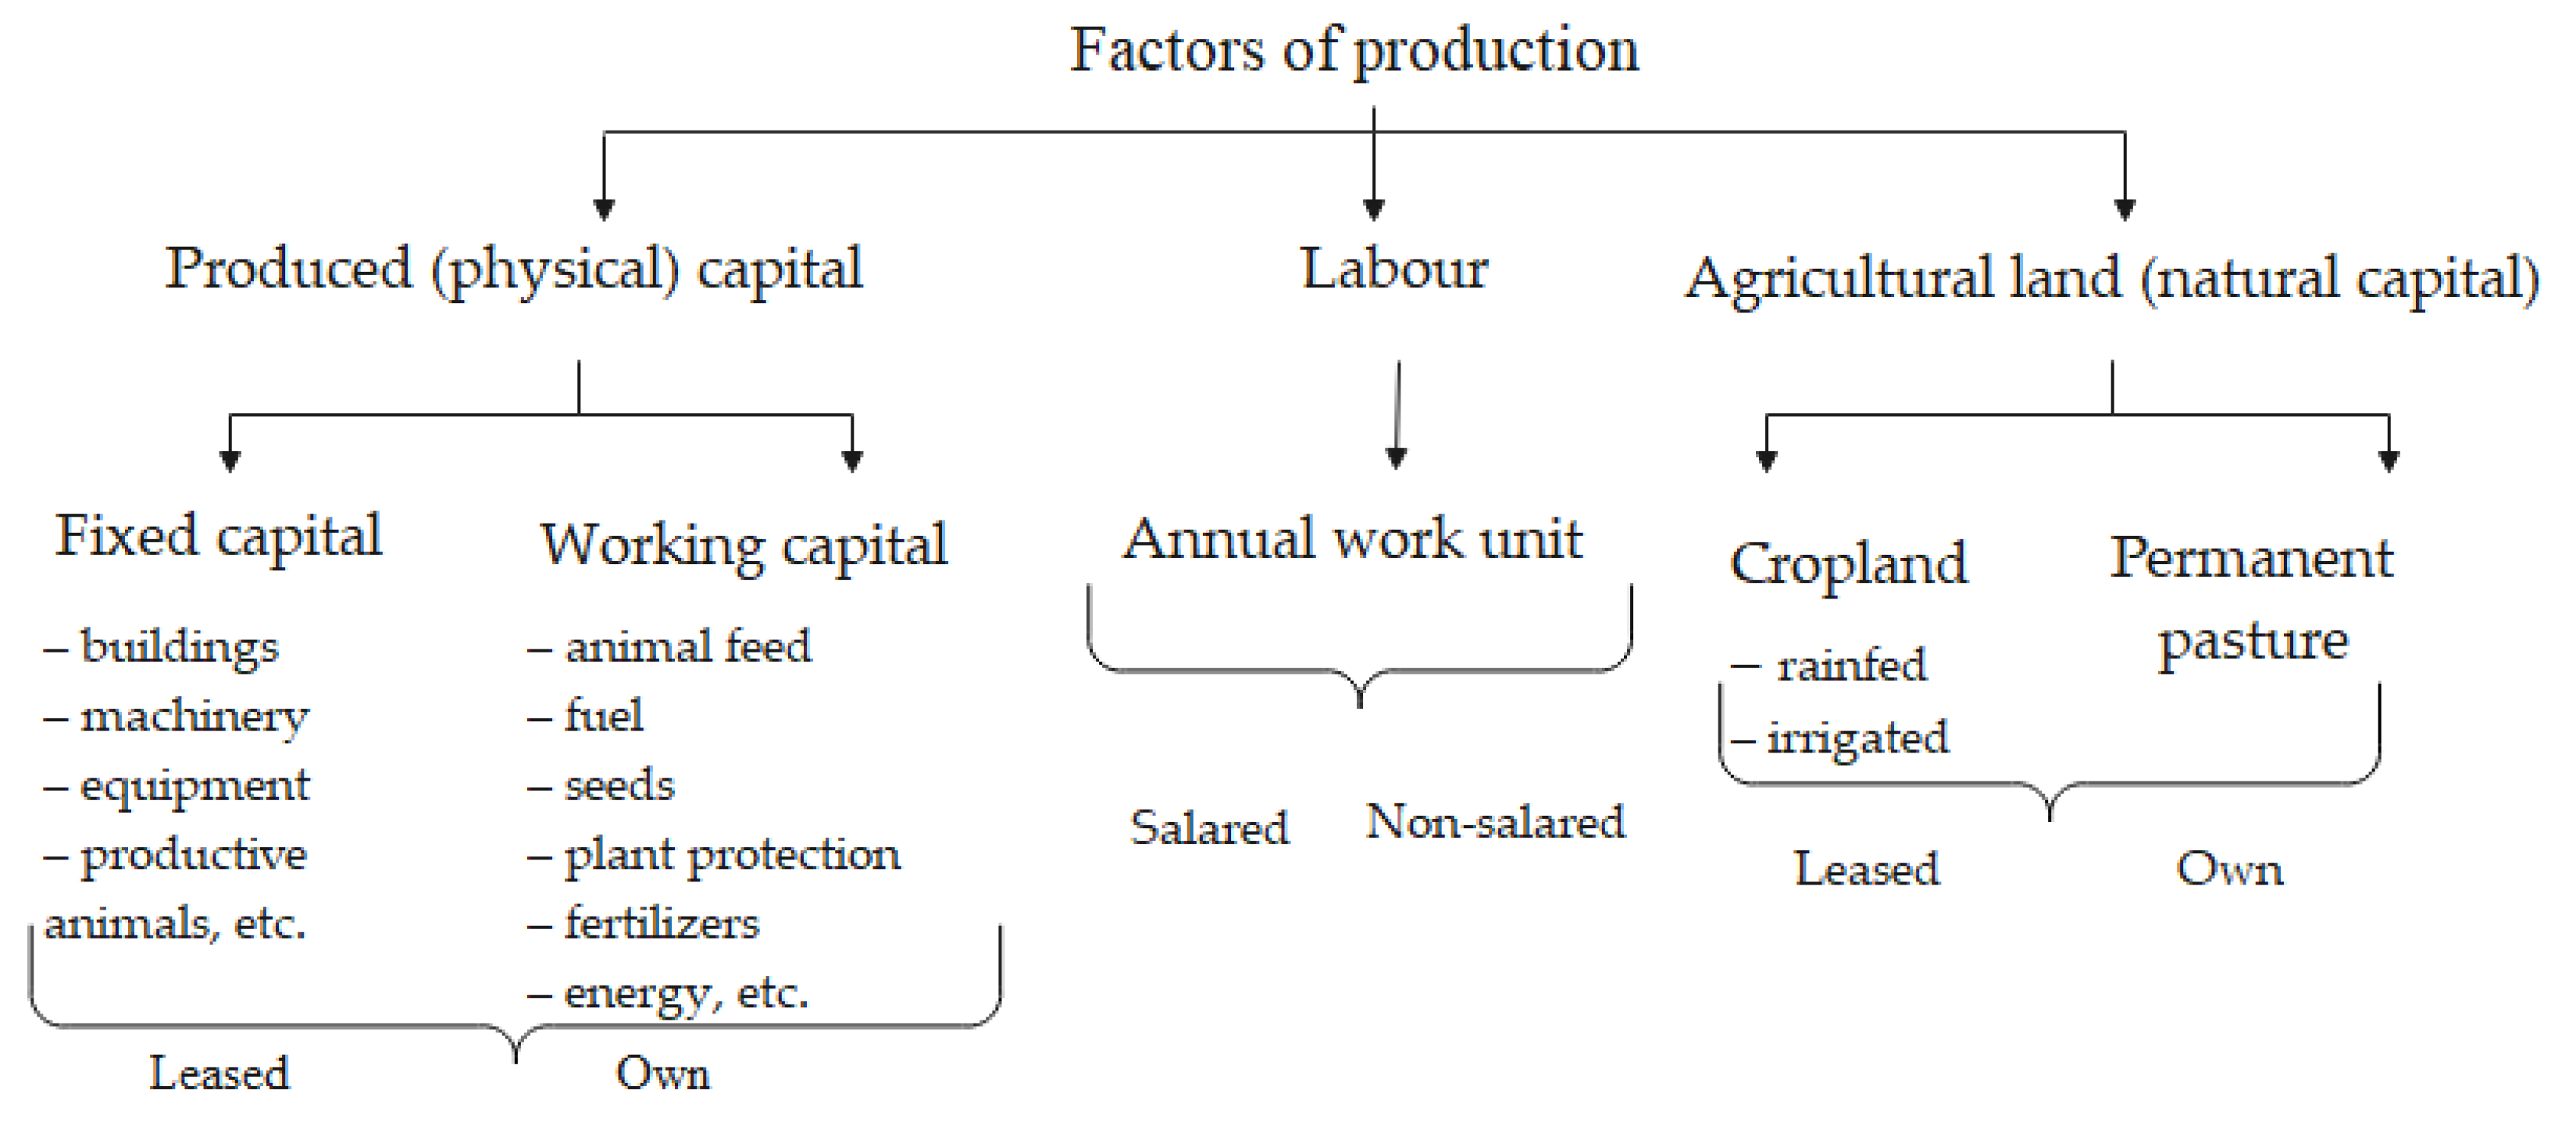
Figure 3.
The GVA growth and pollution-adjusted GVA growth in EU countries. (a) GVA growth and pollution-adjusted GVA growth; (b) Adjustment for pollution abatement.
Figure 3.
The GVA growth and pollution-adjusted GVA growth in EU countries. (a) GVA growth and pollution-adjusted GVA growth; (b) Adjustment for pollution abatement.
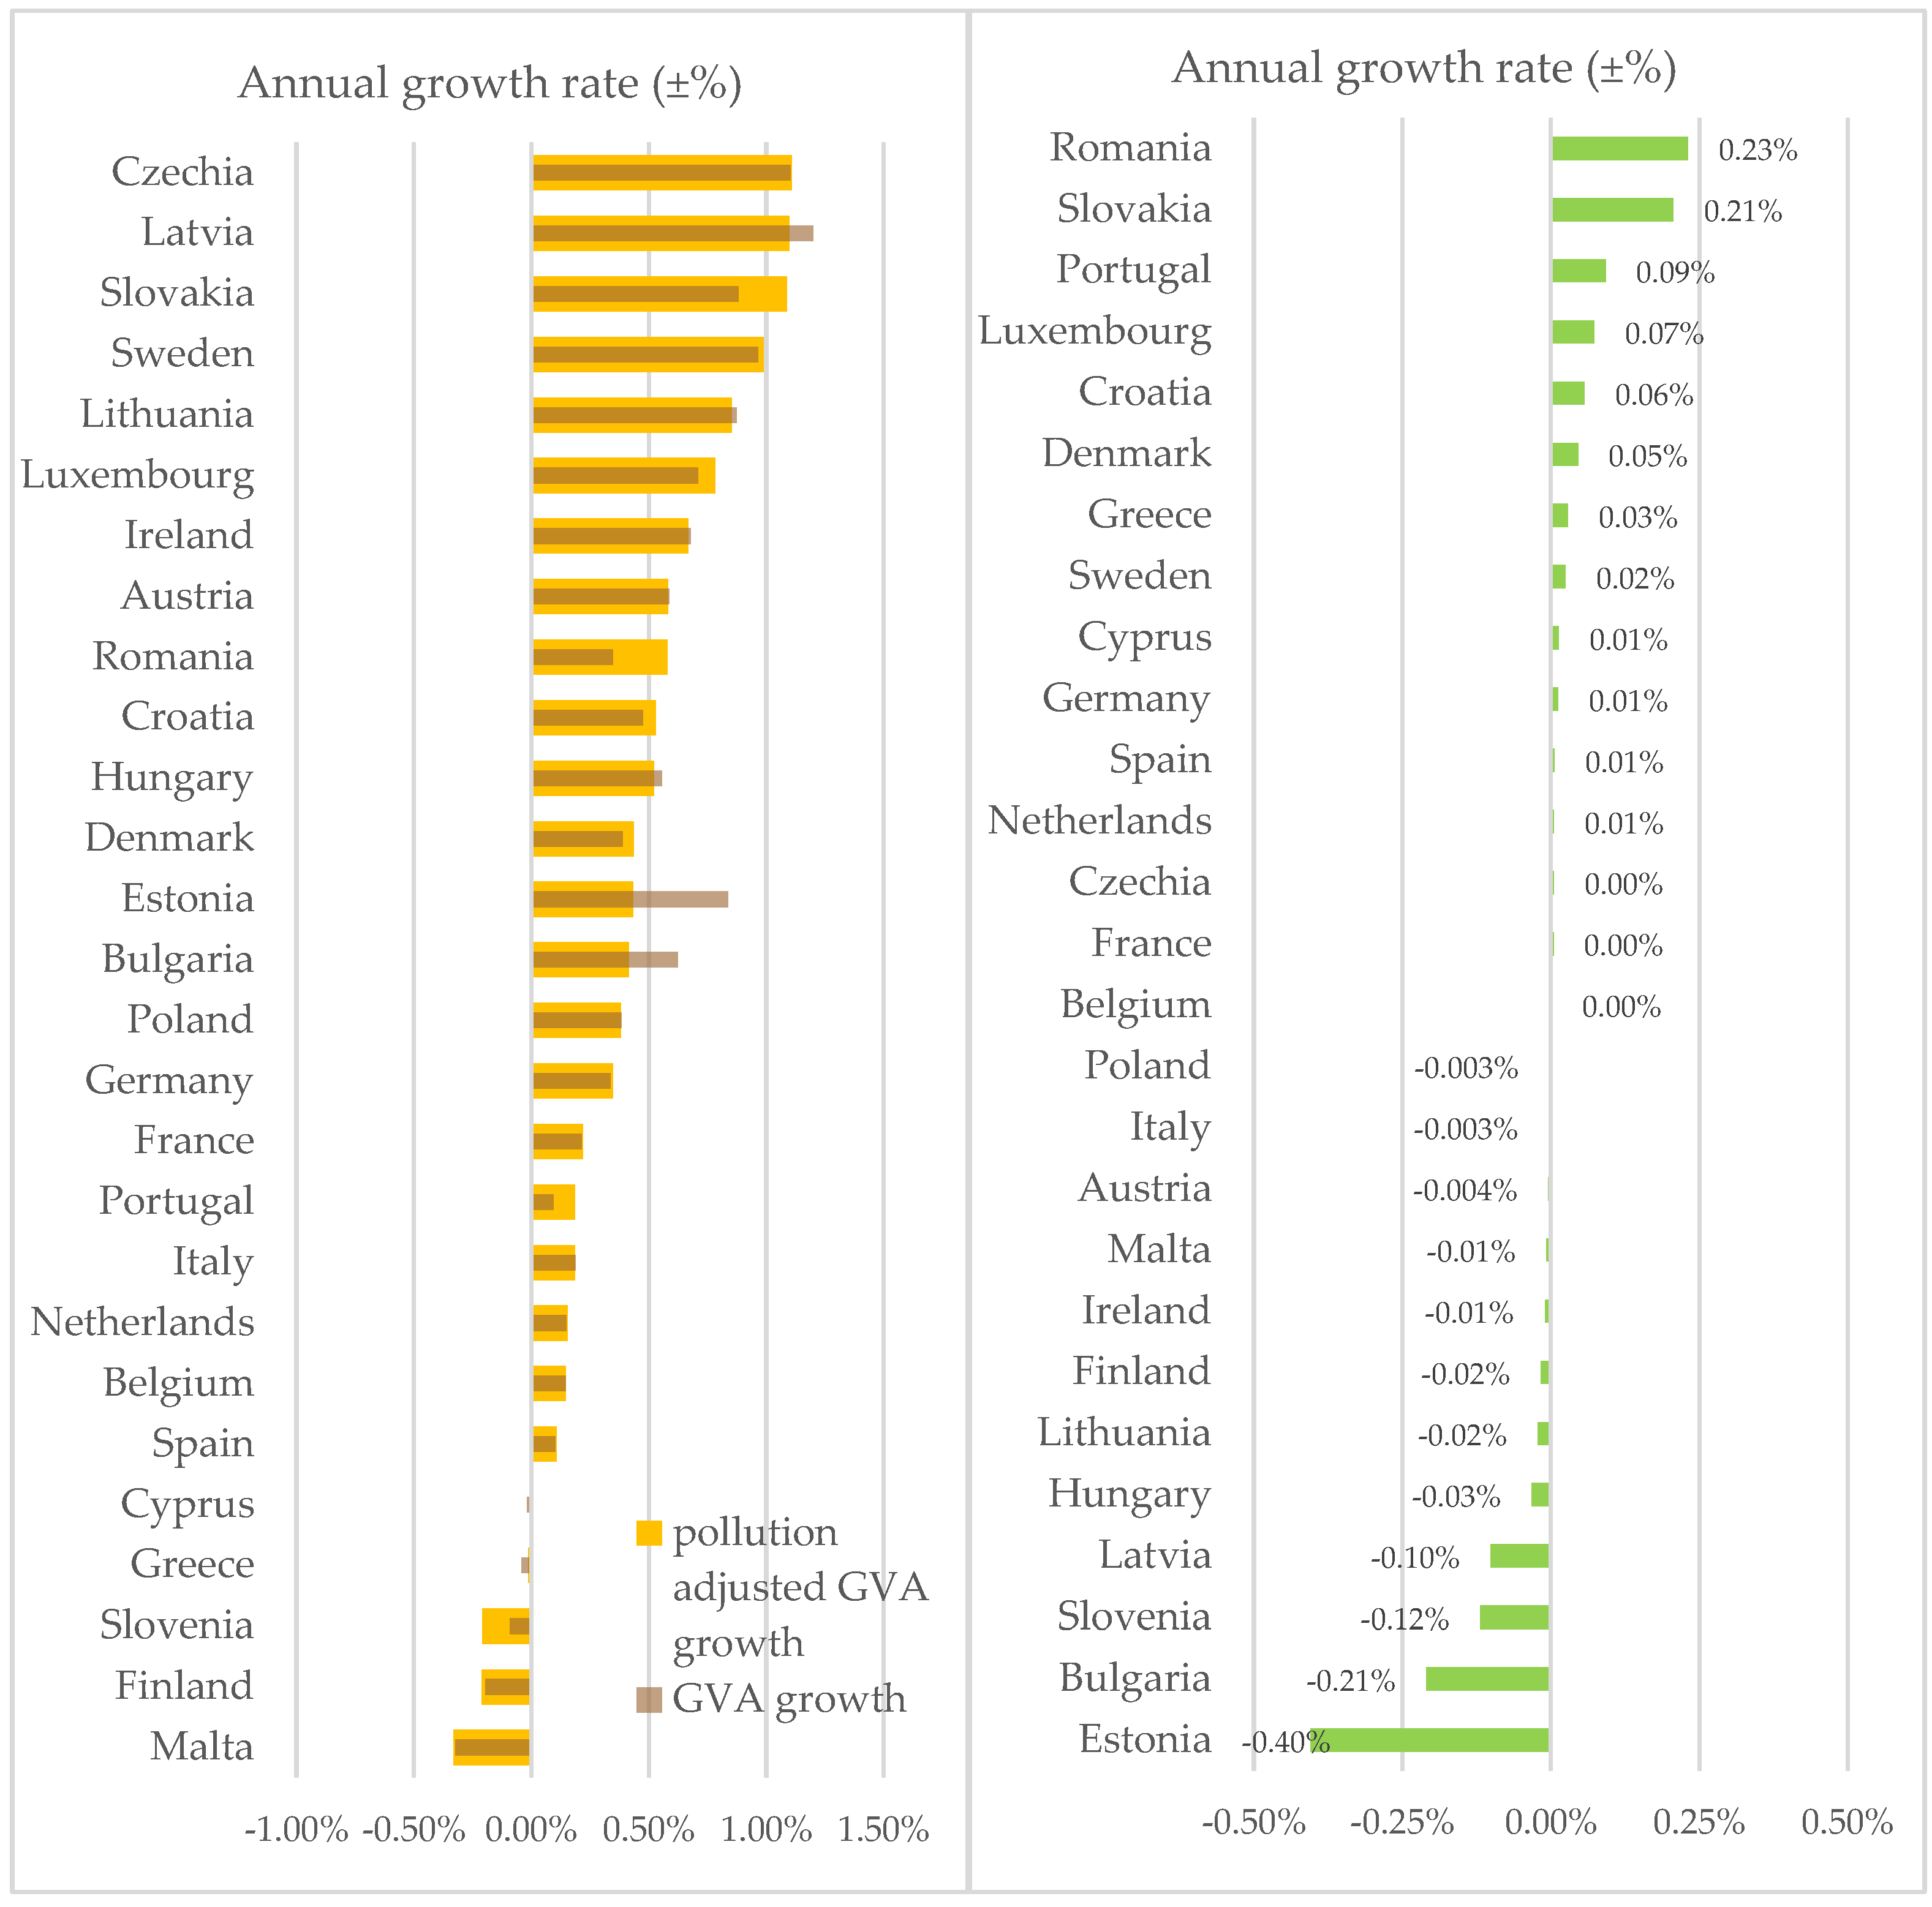
Figure 4.
Comparison of EAMFP growth and MFP growth of EU countries agriculture.
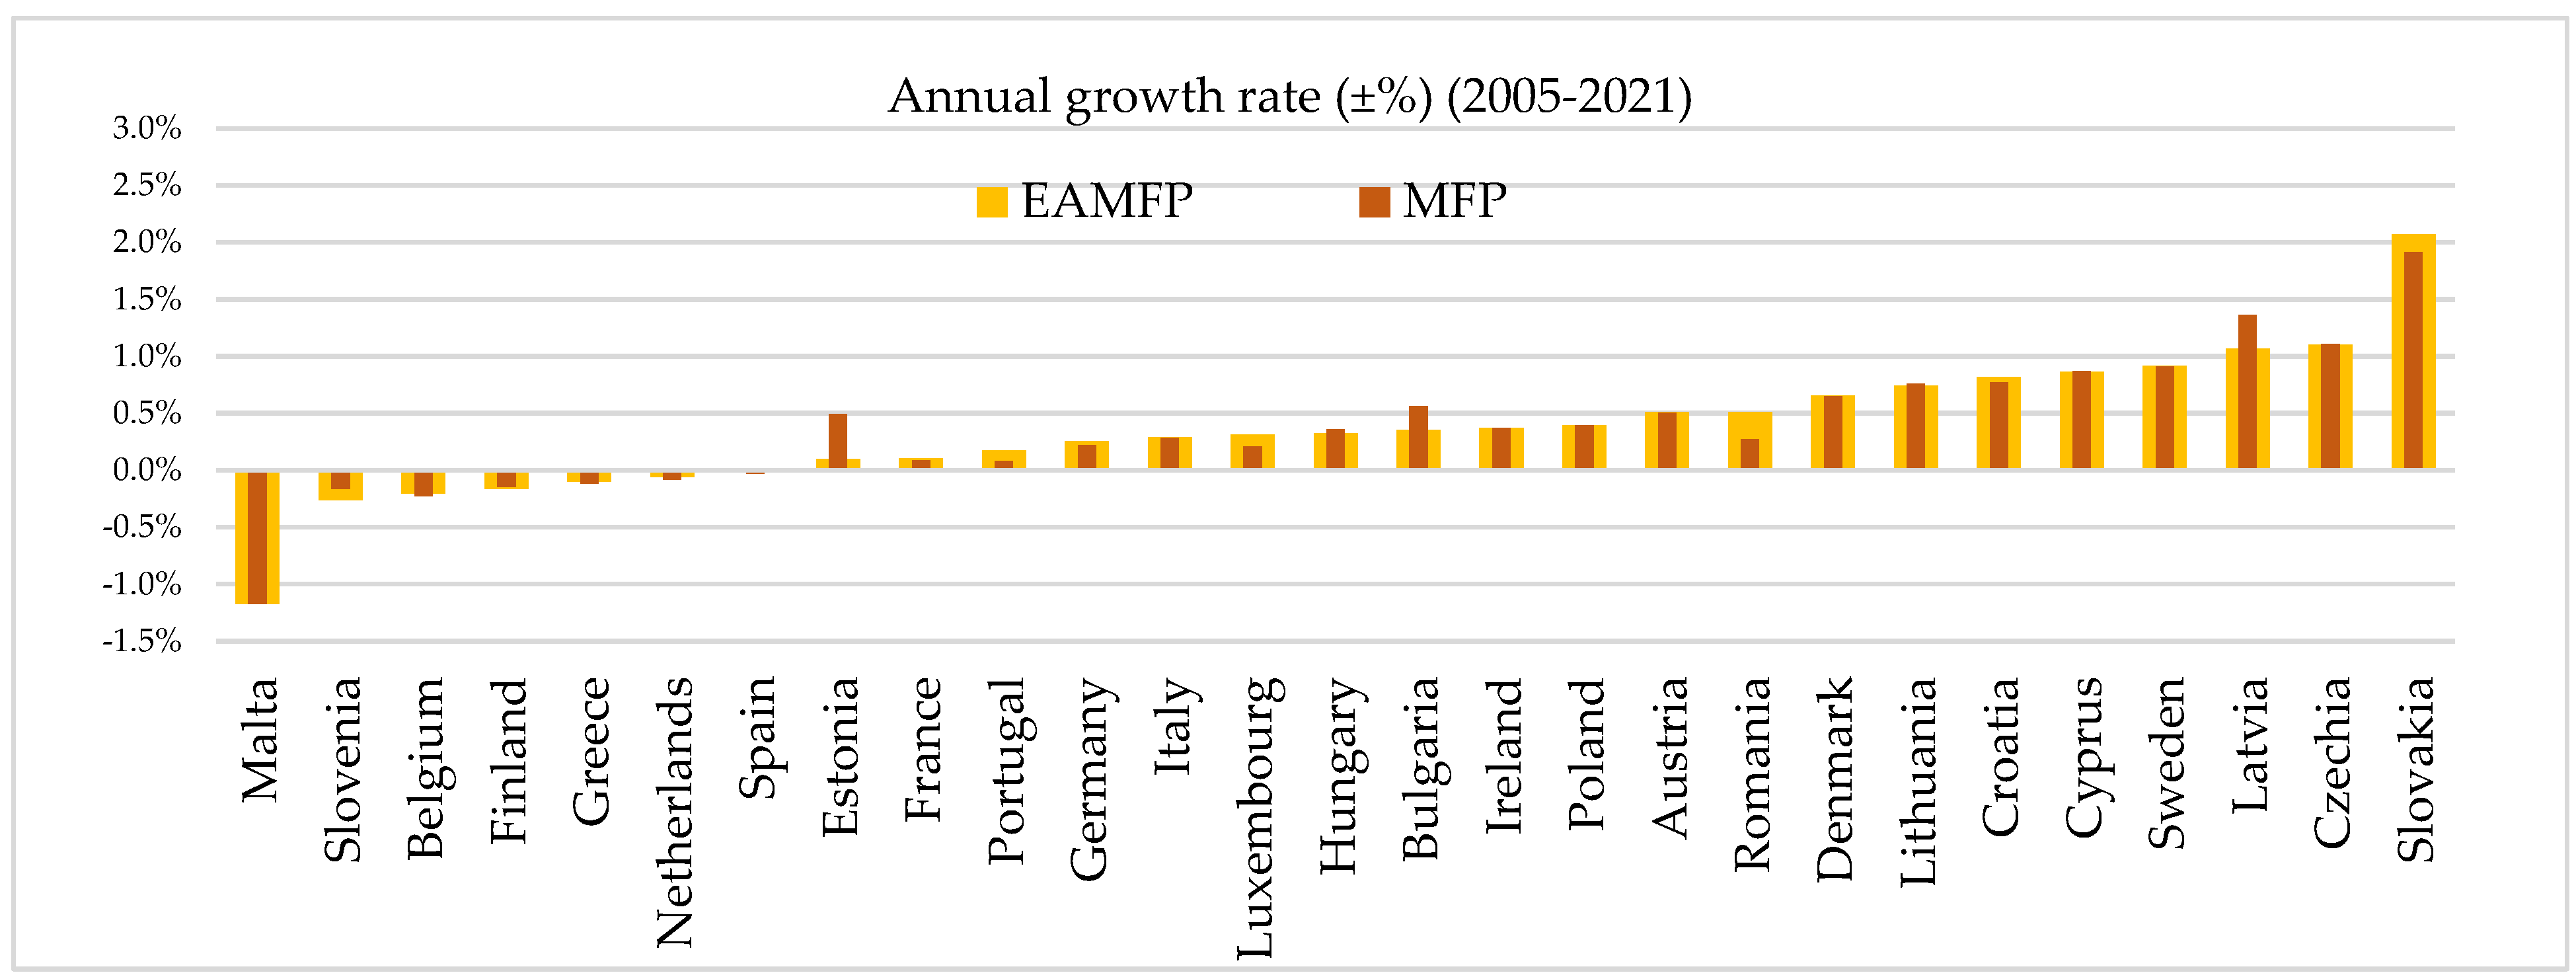
Table 1.
Land quality weights used to measure quality-adjusted agricultural land.
| Region | Permanent pasture | Rainfed cropland | Irrigated cropland |
|---|---|---|---|
| Eastern and Central Europe: Bulgaria, Czechia, Hungary, Poland, Romania, Slovakia | 0.094 | 1.000 | 1.570 |
| Northern Europe: Estonia, Latvia, Lithuania, Finland, Sweden, Ireland, Denmark | 0.094 | 1.000 | 1.001 |
| Southern Europe: Slovenia, Croatia, Greece, Italy, Malta, Portugal, Spain, Cyprus | 0.094 | 1.000 | 1.972 |
| Western Europe: Luxemburg, Belgium, France, Austria, Germany, Netherlands | 0.094 | 1.000 | 1.279 |
Table 2.
Contribution of inputs and EAMFP to pollution-adjusted GDP growth in agriculture of the EU countries.
Table 2.
Contribution of inputs and EAMFP to pollution-adjusted GDP growth in agriculture of the EU countries.
| Countries | Output growth | Input growth | Residual growth | ||||
|---|---|---|---|---|---|---|---|
| Pollution-adjusted GVA growth | GVA growth | Adjustment for pollution abatement | Contribution of labour | Contribution of produced capital | Contribution of natural capital | Growth of EAMFP | |
| Czechia | 1.108 | 1.103 | 0.005 | -0.106 | 0.111 | -0.003 | 1.105 |
| Latvia | 1.097 | 1.199 | -0.102 | -0.240 | 0.265 | 0.005 | 1.068 |
| Slovakia | 1.087 | 0.881 | 0.206 | -0.290 | -0.690 | -0.002 | 2.068 |
| Sweden | 0.989 | 0.964 | 0.025 | -0.087 | 0.158 | -0.001 | 0.918 |
| Lithuania | 0.852 | 0.874 | -0.022 | -0.122 | 0.228 | 0.006 | 0.740 |
| Luxembourg | 0.782 | 0.709 | 0.073 | -0.094 | 0.559 | 0.003 | 0.314 |
| Ireland | 0.668 | 0.678 | -0.010 | 0.014 | 0.282 | 0.002 | 0.370 |
| Austria | 0.582 | 0.586 | -0.004 | -0.057 | 0.132 | -0.003 | 0.510 |
| Romania | 0.579 | 0.347 | 0.231 | -0.242 | 0.311 | -0.002 | 0.511 |
| Croatia | 0.530 | 0.474 | 0.056 | -0.103 | -0.185 | 0.000 | 0.818 |
| Hungary | 0.523 | 0.555 | -0.033 | -0.091 | 0.297 | -0.005 | 0.322 |
| Denmark | 0.436 | 0.390 | 0.046 | -0.057 | -0.166 | 0.001 | 0.657 |
| Estonia | 0.433 | 0.837 | -0.405 | -0.314 | 0.641 | 0.004 | 0.101 |
| Bulgaria | 0.415 | 0.625 | -0.210 | -0.285 | 0.339 | 0.007 | 0.354 |
| Poland | 0.381 | 0.384 | -0.003 | -0.102 | 0.093 | -0.002 | 0.392 |
| Germany | 0.348 | 0.336 | 0.013 | -0.041 | 0.133 | -0.001 | 0.258 |
| France | 0.218 | 0.214 | 0.005 | -0.048 | 0.163 | -0.001 | 0.104 |
| Portugal | 0.186 | 0.094 | 0.092 | -0.185 | 0.197 | -0.002 | 0.176 |
| Italy | 0.185 | 0.188 | -0.003 | -0.055 | -0.050 | -0.003 | 0.292 |
| Netherlands | 0.154 | 0.148 | 0.005 | -0.009 | 0.222 | -0.002 | -0.057 |
| Belgium | 0.147 | 0.146 | 0.001 | -0.075 | 0.425 | 0.001 | -0.204 |
| Spain | 0.107 | 0.101 | 0.006 | -0.032 | 0.122 | -0.002 | 0.019 |
| Cyprus | -0.005 | -0.018 | 0.013 | -0.184 | -0.676 | -0.013 | 0.868 |
| Greece | -0.012 | -0.041 | 0.029 | -0.166 | 0.262 | -0.010 | -0.098 |
| Slovenia | -0.209 | -0.090 | -0.119 | -0.074 | 0.122 | 0.004 | -0.260 |
| Finland | -0.211 | -0.195 | -0.016 | -0.109 | 0.061 | 0.000 | -0.162 |
| Malta | -0.331 | -0.324 | -0.007 | 0.359 | 0.483 | 0.001 | -1.175 |
Disclaimer/Publisher’s Note: The statements, opinions and data contained in all publications are solely those of the individual author(s) and contributor(s) and not of MDPI and/or the editor(s). MDPI and/or the editor(s) disclaim responsibility for any injury to people or property resulting from any ideas, methods, instructions or products referred to in the content. |
© 2024 by the authors. Licensee MDPI, Basel, Switzerland. This article is an open access article distributed under the terms and conditions of the Creative Commons Attribution (CC BY) license (https://creativecommons.org/licenses/by/4.0/).
Copyright: This open access article is published under a Creative Commons CC BY 4.0 license, which permit the free download, distribution, and reuse, provided that the author and preprint are cited in any reuse.


